KFF designs, conducts and analyzes original public opinion and survey research on Americans’ attitudes, knowledge, and experiences with the health care system to help amplify the public’s voice in major national debates.
The latest Medicare projections from the Congressional Budget Office (CBO) show the extent to which the COVID-19 pandemic has hurt Medicare’s financial outlook, and foreshadow the tough choices facing the next President and Congress. According to CBO’s estimates, Medicare’s Hospital Insurance Trust Fund will have insufficient funds to cover all benefit costs beginning in 2024 – just four years from now, and sooner than last year’s projected depletion date of 2026. Addressing this shortfall will require lawmakers to make politically difficult policy choices, such as lowering payments to providers or plans, reducing benefits, or increasing revenues. (more…)
The latest Medicare projections from the Congressional Budget Office (CBO) show the extent to which the COVID-19 pandemic has hurt Medicare’s financial outlook, and foreshadow the tough choices facing the next President and Congress. According to CBO’s estimates, Medicare’s Hospital Insurance Trust Fund will have insufficient funds to cover all benefit costs beginning in 2024 – just four years from now, and sooner than last year’s projected depletion date of 2026. Addressing this shortfall will require lawmakers to make politically difficult policy choices, such as lowering payments to providers or plans, reducing benefits, or increasing revenues. (more…)
The latest Medicare projections from the Congressional Budget Office (CBO) show the extent to which the COVID-19 pandemic has hurt Medicare’s financial outlook, and foreshadow the tough choices facing the next President and Congress. According to CBO’s estimates, Medicare’s Hospital Insurance Trust Fund will have insufficient funds to cover all benefit costs beginning in 2024 – just four years from now, and sooner than last year’s projected depletion date of 2026. Addressing this shortfall will require lawmakers to make politically difficult policy choices, such as lowering payments to providers or plans, reducing benefits, or increasing revenues. (more…)
In this September 2020 post for The JAMA Health Forum, Larry Levitt highlights differences in the records and policy plans of President Donald Trump and former Vice President Joe Biden on key health care issues, including the response to the COVID-19 pandemic, the Affordable Care Act and Medicaid, prescription drug prices, reproductive health, and immigration and health care.
Other contributions to The JAMA Forum are also available.
The COVID-19 pandemic has led to dramatic decreases in health care spending, as patients and providers have delayed a wide range of health care services. The decrease in service use and spending resulted in a decline in revenue for many providers at the same time that some are facing increased costs due to the pandemic. Given the uncertain timing of a “return to normal” and potentially lingering effects of the current economic crisis, some providers may continue to experience sustained declines in revenue even with the federal assistance that has been made available.1
Depending on the severity and duration of revenue loss, some hospitals and physician practices may find it difficult to operate independently, which could increase the rate of consolidation among health care providers. Lower margins among some providers may create new opportunities for large chains to acquire smaller providers. The Coronavirus Aid, Relief, and Economic Security (CARES) Act and the Paycheck Protection Program and Health Care Enhancement Act allocated $175 billion for grants to providers that were partly intended to help make up for revenue lost due to coronavirus, but analysis shows that the first $50 billion in grants were not targeted to providers most vulnerable to revenue losses.2 Another $13 billion was subsequently targeted to safety net hospitals and $11 billion has been targeted to rural providers.3 However, it is not clear whether this infusion of funds plus other government loans—including those from the Paycheck Protection Program—will be sufficient to stabilize providers who are least equipped to weather this revenue decline. Even if sufficient government assistance is provided, the disruption of the COVID-19 pandemic may make operating independently seem less attractive and riskier to some smaller providers. Therefore, financial assistance to providers may not be sufficient to prevent an increase in the pace of consolidation.
This brief provides an overview of existing research that examines the impact of provider consolidation on health care costs and quality. There are two major types of consolidation among health care providers, both of which are discussed in this brief. The first is horizontal consolidation, which occurs when two providers performing similar functions join, such as when two hospitals merge or groups of physician practices merge to form larger group practices. The second type is vertical integration, which refers to one type of entity purchasing another in the supply chain such as hospitals acquiring physician practices.4
Provider consolidation leads to higher prices
A wide body of research has shown that provider consolidation leads to higher health care prices for private insurance; this is true for both horizontal and vertical consolidation. In Medicare, payment policies protect Medicare from increased prices due to horizontal consolidation but have led to higher Medicare costs in the case of vertical consolidation. However, recent administrative and legislative changes are bringing Medicare reimbursement at hospital outpatient departments in line with reimbursement at independent physicians’ offices.
Horizontal consolidation among hospitals
In 2020, the Medicare Payment Advisory Commission (MedPAC) reviewed the published research on hospital consolidation and concluded that the “preponderance of evidence suggests that hospital consolidation leads to higher prices.”5 For example, one analysis looking at 25 metropolitan areas with the highest rates of hospital consolidation from 2010 through 2013 found that the price private insurance paid for the average hospital stay increased in most areas between 11% and 54% in the subsequent years.6 A separate analysis of data from employer-sponsored coverage found that hospitals that do not have any competitors within a 15-mile radius have prices that are 12% higher than hospitals in markets with four or more competitors.7 Another analysis of all hospital mergers over a five year period found that mergers of two hospitals within five miles of one another resulted in an average price increase of 6.2% and that price increases continued in the two years after a merger.8 A similar study found that mergers of two hospitals in the same state led to price increases of 7% to 9% for the acquiring hospitals.9 Studies have found that these patterns hold even when looking specifically at non-profit hospitals.10 While health plans may try to keep hospital prices low, health plans’ ability to successfully hold down prices is limited in many parts of the country because they have less market power than hospitals.11
Even when a hospital merges with a hospital in a different geographic area, some studies suggest that the merger can impact competition and prices. One analysis found that prices at hospitals acquired by out‐of‐market hospital systems increase by about 17% more than unacquired, stand‐alone hospitals.12 This study also found that this type of merger has a spillover impact on market dynamics in the area where the acquired hospital is located— with prices of nearby competitors to acquired hospitals increasing by around 8%.13 One reason that prices rise when there are hospital mergers across markets is that they increase hospital bargaining positions with insurers, which seek to have strong provider networks across multiple areas in order to attract employers with employees in multiple locations.14 Additionally, large hospital systems can influence the dynamics of negotiations with insurers and shift volume to higher cost facilities. For example, hospital systems may require that insurers include all hospitals in their system in a provider network if the insurer wants any hospitals included. This can lead to higher cost hospitals being in a provider network even when there are lower cost hospitals nearby. In one recent anti-trust case, the Sutter Health system was accused of violating California’s antitrust laws by using its market power to illegally drive up prices.15 In a 2019 settlement, Sutter Health agreed to stop requiring that all of its hospitals be included in an insurer’s network and also agreed to pay damages and make other changes.16
Horizontal consolidation among physicians
Patterns of consolidation leading to higher prices also have been observed when physician practices merge. A national study found that physicians in the most concentrated markets charged fees that were 14% to 30% higher than the fees charged in the least concentrated markets.17 Another national study comparing physician prices in counties with highly concentrated physician markets to counties with the least concentrated physician markets found higher prices for physicians practicing in the most concentrated counties across specialty types.18 A study that examined the effects of a merger of six orthopedic groups in Pennsylvania found that the merger was associated with price increases ranging from 15% to 25% across payers.19
Vertical consolidation
Vertical consolidation also leads to higher prices, which can then lead to higher premiums. One study analyzing highly concentrated hospital markets in California found that an increase in the share of physicians in practices owned by a hospital was associated with a 12% increase in premiums for private plans sold in the state’s Marketplace.20 Another study that used private insurer data found that an increase in physician-hospital integration was associated with an average price increase of 14% for the same service.21 Those findings are consistent with another study that used private insurance data that found a large increase in physician-hospital vertical integration was associated with an increase in outpatient prices.22 A study looking at Medicare beneficiaries’ patterns of health care utilization found that “patients are more likely to choose a high-cost, low-quality hospital when their physician is owned by that hospital.”23
Insurance markets and consolidation
When insurance markets become more consolidated, there are two distinct impacts. As insurance companies consolidate and have more market power, evidence suggests that they are able to obtain lower prices from providers. For example, one study looking at the impact of health plan concentration on hospital prices found that hospital prices in the most concentrated health plan markets were approximately 12% lower than in more competitive health plan markets.24 Another study found a similar pattern for both hospitals and some types of specialists.25 However, these lower prices do not necessarily lead to lower premiums. A national study found that lower provider prices only translate into lower premiums if the insurance market is sufficiently competitive; where health insurance markets are more concentrated, premiums tend to be higher.26 The impact on premiums may be somewhat mitigated for fully insured plans by the minimum loss ratio requirement in the Affordable Care Act, which limits the amount of the premium that insurers can keep.
Consolidation and Medicare prices
Private insurance rates are the result of negotiations between providers and payers, which means providers with market power due to consolidation have greater leverage to raise prices in these negotiations. In contrast, Medicare prices are set by formulas and government policies. Horizontal consolidation does not impact Medicare prices for physicians or hospitals that are generally paid based on the prospective payment systems.27 However, once a physician’s office has been purchased by a hospital, that hospital had historically been able to obtain higher Medicare rates by billing as a hospital outpatient department for services at that physician’s location.
Both Congress and the Department of Health & Human Services (HHS) have made policy changes over the past several years to lower costs for off-campus hospital outpatient clinics to bring them in line with physicians’ offices, despite industry opposition. The Bipartisan Budget Act of 2015 (BBA) required that Medicare reimburse for services delivered at new, off-campus hospital outpatient departments using rates based on the physician fee schedule instead of the higher rates for outpatient hospital departments. However, this change grandfathers off-campus outpatient departments that billed for services, rendered services, or were being constructed before November 2, 2015. Beginning in 2019, the Centers for Medicare & Medicaid Services (CMS) lowered payment rates in grandfathered off-campus departments for a clinic visit—the single highest volume service provided by hospital outpatient departments—to 70% of the full hospital outpatient rate in 2019 and 40% of the full hospital outpatient rate in 2020. Several hospital associations challenged CMS’ authority for this policy. On September 17, 2019, the DC District Court vacated CMS’s regulation for being inconsistent with the statute. On July 17, 2020, the DC Circuit Court reversed the District Court’s decision, allowing the regulation to stay in place.
HHS’s regulatory change to lower payments at hospital outpatient departments is consistent with MedPAC’s recommendation to adjust Medicare payments so that those locations are reimbursed at the same rates as physician’s offices.28 While HHS’s change does not directly impact Medicare Advantage plans, there is some evidence that Medicare Advantage plans typically pay rates that are similar to payments under traditional Medicare.
Mergers have led to more consolidation, even before the financial pressures brought on by COVID-19
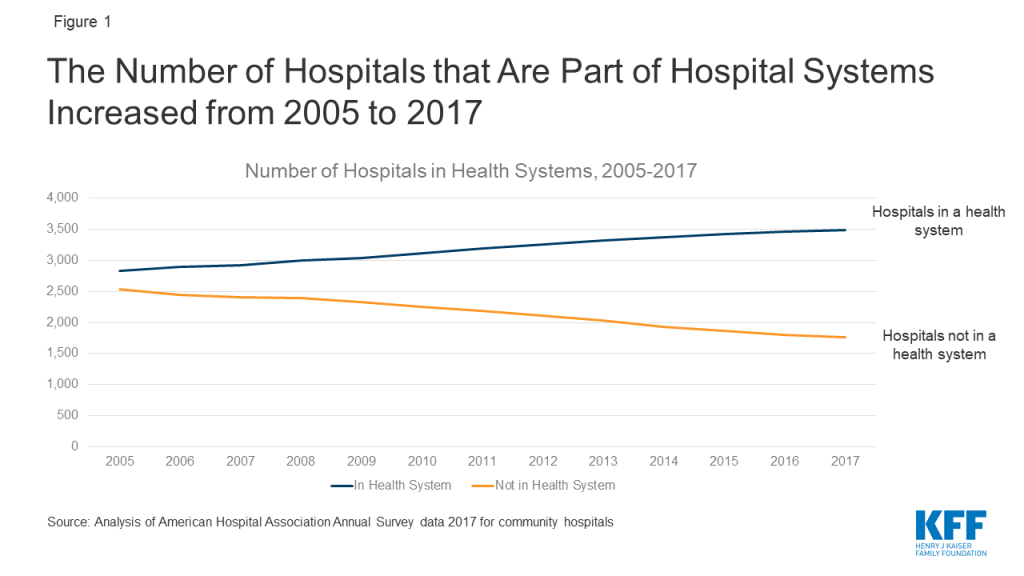
Between 2010 and 2017, there were 778 hospital mergers.29 Over time, the number of independent hospitals has declined as a result of these mergers, while the number of hospitals that are part of larger systems has risen (Figure 1). By 2017, two thirds (66%) of all hospitals were part of a larger system, as compared to 53% in 2005.30
Figure 1: The Number of Hospitals that Are Part of Hospital Systems Increased from 2005 to 2017
In 2010, most hospital markets were already dominated by a limited number of health systems: on average, the three largest health systems in a given area accounted for more than three-quarters of admissions.31 In the subsequent years, health care markets have continued to become more consolidated, as measured using the Herfindahl–Hirschman Index. This index is a commonly used measure of market concentration that is calculated for a given market based on the number of competing providers and each of these providers’ relative market share. From 2010 to 2016, the mean Herfindahl-Hirschman Index for metropolitan statistical areas in the United States for hospitals and specialist physician organizations each increased by about 5% on average.32 Over the same period, the Herfindahl-Hirschman Index for primary care practices increased by 29% on average in metropolitan statistical areas nationwide.33 Using this index, 90% of metropolitan statistical areas were highly concentrated for hospitals, 65% were highly concentrated for specialists and 39% were highly concentrated for primary care physicians by 2016.34
Much of the increase in consolidation among physician practices is due to acquisition by hospitals. The proportion of primary care physicians practicing in organizations owned by a hospital or health system grew from 28% in 2010 to 44% in 2016.35 By 2018, data from the American Medical Association shows that 35% of all practicing physicians worked either directly for a hospital or in a practice at least partly owned by a hospital in 2018.36
Among health insurance markets, 57% of metropolitan statistical areas were highly concentrated in 2016 for private insurance, and the average Herfindahl-Hirschman Index for insurers was relatively steady between 2010 and 2016.37 Meanwhile, the market for the private Medicare Advantage plans available to Medicare beneficiaries has become increasingly concentrated. Medicare Advantage plans are mainly health maintenance organizations (HMOs) and preferred provider organizations (PPOs) and receive payments from Medicare to cover Medicare enrollees. The total market share of the top four Medicare Advantage insurers increased from 48% in 2011 to 61% in 2015.38 As of 2020, the top four Medicare Advantage insurers controlled 70% of the market.39
The role of private equity
Private equity has started to play a role in this consolidation in recent years. These firms typically invest in businesses by taking a majority stake with the goal of increasing the value of the business and potentially selling it at a profit. One study found that private equity firms acquired 355 physician practices (1,426 sites and 5,714 physicians) from 2013 to 2016.40 The pace of these acquisitions increased over the study period, with 59 practices acquired in 2013 and 136 practices acquired in 2016.41 While these acquisitions represent a small share of the 18,000 unique group medical practices in the United States, the trend is worth monitoring given the unique business model of these firms.42 Private equity firms often sell their investments within three to seven years, so they may have a short time horizon for evaluating investments in improving medical providers.43 Acquisition by a private equity firm can lead to more consolidation later, as these firms often then acquire additional nearby practices as part of their business model.44 A study on the impact of private equity acquisitions of hospitals found that hospitals acquired by private equity firms reported larger increases in annual net income and hospital charges than similarly situated hospitals not acquired by private equity firms.45
Anti-trust enforcement challenges and opportunities
In health care, along with other sectors of the economy, enforcement of federal and state anti-trust laws is supposed to ensure competitive markets that benefit consumers. At the federal level, the Federal Trade Commission (FTC) is charged with reviewing mergers. In the past, the FTC has blocked some hospital and physician mergers,46 but the overall health care market has continued to become increasingly consolidated. FTC officials have cited several constraints on their ability to enforce anti-trust laws in the health care sector that may be contributing to the increases in consolidation in recent years.47 Specifically, the FTC and Department of Justice’s anti-trust division have seen their budgets remain flat from 2010 to 2016, even as the pace of health care mergers has increased.48 Vertical integration is particularly challenging for the FTC to monitor because it is often the result of hospitals acquiring many smaller practices and each of those transactions may fall under the threshold of having to notify FTC.49, 50
Once a merger has taken place, states and the federal government can still enforce anti-trust laws. This can include pursing actions to stop anti-competitive practices such as a health care provider with significant market power preventing insurers from giving incentives to enrollees to go to less expensive providers.51 However, there is an important limitation on the FTC’s enforcement ability. The FTC Commissioner, Rebecca Kelly Slaughter, has raised concerns that the FTC is not able to enforce anti-trust rules on non-profit hospitals, although it can review mergers that involve a non-profit hospital.52 Nationally, 57% of all hospitals are non-profit.53 In 2019, 66% of the total hospital and health system mergers and acquisitions involved a non-profit entity purchasing another non-profit entity.54
States can serve as another potential check on anti-competitive mergers and can sue under federal anti-trust law and enforce their own laws. A recent review of state anti-trust enforcement in health care identified several practices that support robust enforcement.55 These include adequate notice requirements for potential mergers and waiting periods for state reviews; established criteria for merger review and the ability to conduct a full analysis of economic and health care implications; and the ability to implement post-merger monitoring.56
There is no clear evidence that consolidation improves quality of care
While provider consolidation holds the promise of greater efficiencies and better care coordination, evidence of the benefits of improved quality after a merger are mixed at best, and some studies suggest that market consolidation—particularly for horizontal consolidation—can actually lead to lower quality care. It is difficult and takes time and resources to achieve true integration of care among newly merged health systems, while price increases often occur immediately after consolidation.57
Regarding vertical integration, many studies showing that quality does not improve (or gets worse) after vertical integration, while some analysis has shown modest improvements.58 One study of 15 integrated delivery networks finds no evidence that hospitals in these systems provide better clinical quality or safety scores than their competitors.59 Another study found that larger hospital-based provider groups had higher per beneficiary Medicare spending and higher readmission rates than smaller groups.60 However, one study looking at hospital quality measures from 2008 to 2015 found that vertical integration had a limited positive effect on a small subset of quality measures.61
Studies of markets where there has been horizontal consolidation largely have found that mergers do not improve quality, and that quality may actually be worse in highly concentrated markets than in markets with more competition. One study found that risk-adjusted one-year mortality for heart attacks in Medicare patients was 4.4% higher in more highly concentrated hospital markets compared to less concentrated markets.62 Another study that analyzed Medicare claims for patients treated for hypertension, a cardiac condition or an acute myocardial infarction found that patients in areas higher cardiology market concentration had worse health outcomes and higher health care expenditures.63
A study published in 2020 that followed hospitals for three years after a merger and compared those hospitals to a “control” group of hospitals that did not have a change in ownership found that the acquired hospitals’ outcome measures did not improve, when looking at scores for 30-day readmission and mortality rates among patients discharged from a hospital.64 That analysis also found that patient experience worsened slightly after a merger, as measured by patients’ responses to questions about whether they would recommend the hospital and whether doctors and nurses always communicated well. The one improvement noted in that study was in process measures, which improved in the years before the acquisition and so could not be conclusively attributed to a change in ownership. The American Hospital Association funded a study using a similar design to look at the impact of hospital mergers on inpatient quality that found “small improvements in quality for some quality measures.”65
Beyond health care quality, there have also been questions about the impact of hospital consolidation on the provision of charity care and other community benefits, and whether the impact differs depending on whether a hospital is for-profit or non-profit. A new study looking at this issue finds no evidence that non-profit hospitals provided more community benefits as their market share increased.66
The Coronavirus and Resulting Economic Crisis May Make More Providers Likely to Consolidate
The COVID-19 pandemic and the resulting economic crisis are leading to unprecedented financial pressure on health care providers. It is still unclear if this pressure will lead to more mergers or cause providers to close, but it is possible that the pace of consolidation will increase due to the economic impact of the pandemic. Health care spending dropped dramatically after the start of the coronavirus pandemic (Figure 2) due to delayed or forgone medical care.67 While spending started to pick up in May, it is not clear if that trend will continue given the record number of new COVID-19 cases in the subsequent months. This decrease in spending on health care services is leading to declines in provider revenue that could spur mergers, depending on the severity and duration of the revenue loss.
Figure 2
Compounding the impact of COVID-19, the current economic crisis could put additional financial pressure on some providers, particularly if the number of uninsured people rises. KFF has estimated that by early May 2020, nearly 27 million people were at risk of losing employer-sponsored coverage due to a job loss.68 About half of those individuals were estimated to be eligible for Medicaid and about 30% were estimated to be eligible for subsidized marketplace coverage.69 This shift from employer coverage to Medicaid alone will lead to lower revenues for providers, because employer-sponsored insurance tends to reimburse at much higher rates than Medicaid.70
The federal government has made different types of funding available to providers to help them weather the coronavirus pandemic. It is not yet clear if this infusion of funds is sufficient to help the providers most vulnerable to declines in revenue due to coronavirus and the ensuing economic fallout. If providers are not able to pay their bills, they may be financially motivated to merge with a larger system. Below we outline the three main sources of stimulus funding sources for providers.
$175B in provider relief grants: The Coronavirus Aid, Relief, and Economic Security (CARES) Act and the Paycheck Protection Program and Health Care Enhancement Act together allocated $175 billion for grants to providers to help cover expenses related to coronavirus and lost revenue due to the pandemic. About $118 billion in grants have already been allocated to providers, and a portion of the remaining money will be used to reimburse providers who treat uninsured COVID-19 patients.71 However, $50 billion of this fund was allocated to Medicare providers using a formula that gave more money to providers that tend to have higher margins.72 While these grants provide some assistance for providers, it is a small share of money compared to total hospital spending, which was $1.2 trillion in 2018.73
$100B in advanced payments to Medicare providers: The Centers for Medicare & Medicaid Services distributed about a $100 billion in advanced Medicare payments to providers.74 Most Medicare providers qualified for advanced payments representing three months of reimbursement from traditional Medicare in the period before coronavirus. About 80% of the advanced payments went to hospitals, with the remaining money going to physicians and other providers.75 Repayment for those advanced payments was scheduled to begin in August 2020, 120 days after payment was issued.76 However, providers are currently pushing for those loans to be forgiven, and Congress is also considering more favorable terms for repayment of the loans.77
Treasury department and Small Business Administration loans: Along with other businesses and employers, health care providers are also potentially eligible for some of the loans included in the CARES Act and the Paycheck Protection Program and Health Care Enhancement Act that the Treasury department, the Federal Reserve, and Small Business Administration are distributing. These loans include the Paycheck Protection Program (PPP) for small businesses, which forgives loans if employers do not lay off workers and meet other criteria. According to a Treasury Department analysis, health care providers received 13% of the $520 billion in PPP loans that have been distributed to small businesses.78 While the CARES Act also appropriated $454 billion79 for loans to qualifying larger businesses—including hospitals and other large health care entities—there have been delays in distributing those loans.80 However, the Federal Reserve announced it is making changes to some of these loans so that it would be easier for non-profit institutions such as hospitals to qualify.81
Providers that accept any of these federal funds are not barred from future mergers, and most of this aid was not targeted to health care providers that may be most vulnerable to financial shocks from the coronavirus pandemic. Given that health care markets were consolidating even before the COVID-19 pandemic, aid to providers is unlikely to prevent health care markets from continuing to become more concentrated. However, it is possible that for some providers, this assistance may help stabilize their finances and increases the likelihood they can operate independently if that is their goal.
Discussion
There is now a large body of research showing that health care provider consolidation tends to raise prices without clear indications of quality improvements. Even before the pandemic, the U.S. health care system was becoming increasingly consolidated. The financial strains of the pandemic could increase the pace of consolidation among hospitals and physicians, which threatens to increase health care costs and premiums, without compelling evidence of commensurate quality improvements. Remedial action from policymakers could come in the form of increasing anti-trust enforcement—including taking steps to address any potential anti-competitive behavior in markets that are already consolidated—or targeted assistance to struggling providers that are trying to remain independent.
This work was supported in part by Arnold Ventures. We value our funders. KFF maintains full editorial control over all of its policy analysis, polling, and journalism activities.
Health plans merging with health care providers is another form of vertical integration, but that type of merger does not impact prices in the same way and so is not the focus of this brief. ↩︎
MedPAC, “March 2020 Report to the Congress: Medicare Payment Policy,” March 13, 2020. ↩︎
Zack Cooper, Stuart V Craig, Martin Gaynor, and John Van Reenen. “The Price Ain’t Right? Hospital Prices and Health Spending on the Privately Insured.” Working Paper. National Bureau of Economic Research, December 2015. https://doi.org/10.3386/w21815↩︎
Leemore Dafny, Kate Ho, and Robin Lee. “The Price Effects of Cross-Market Hospital Mergers.” Cambridge, MA: National Bureau of Economic Research, March 2016. https://doi.org/10.3386/w22106↩︎
John Simpson, and Richard Shin. “Do Nonprofit Hospitals Exercise Market Power?” Federal Trade Commission, November 1, 1996. https://www.ftc.gov/reports/do-nonprofit-hospitals-exercise-market-power; Michael G. Vita and Seth Sacher. “The Competitive Effects of Not-for-Profit Hospital Mergers: A Case Study.” The Journal of Industrial Economics 49, no. 1 (2001): 63–84. https://doi.org/10.1111/1467-6451.00138; Steven Tenn. “The Price Effects of Hospital Mergers: A Case Study of the Sutter–Summit Transaction.” International Journal of the Economics of Business 18, no. 1 (February 1, 2011): 65–82. https://doi.org/10.1080/13571516.2011.542956↩︎
Lewis, Matthew S., and Kevin E. Pflum. “Hospital Systems and Bargaining Power: Evidence from out-of-Market Acquisitions.” The RAND Journal of Economics 48, no. 3 (2017): 579–610. https://doi.org/10.1111/1756-2171.12186↩︎
Laurence C. Baker, M. Kate Bundorf, Anne B. Royalty, and Zachary Levin. “Physician Practice Competition and Prices Paid by Private Insurers for Office Visits.” JAMA 312, no. 16 (October 22, 2014): 1653–62. https://doi.org/10.1001/jama.2014.10921↩︎
Thomas Koch and Shawn W. Ulrick. “Price Effects of a Merger: Evidence from a Physicians’ Market.” SSRN Scholarly Paper. Rochester, NY: Social Science Research Network, August 1, 2017. https://doi.org/10.2139/ssrn.3026344↩︎
Richard Scheffler, Arnold, Daniel and Whaley, Christopher. “Consolidation Trends In California’s Health Care System: Impacts On ACA Premiums And Outpatient Visit Prices.” Health Affairs 37, no. 9 (September 1, 2018): 1409–16. https://doi.org/10.1377/hlthaff.2018.0472↩︎
Cory Capps, David Dranove, and Christopher Ody. “The Effect of Hospital Acquisitions of Physician Practices on Prices and Spending.” Journal of Health Economics 59 (May 1, 2018): 139–52. https://doi.org/10.1016/j.jhealeco.2018.04.001↩︎
Hannah T. Neprash et al. “Association of Financial Integration Between Physicians and Hospitals With Commercial Health Care Prices.” JAMA Internal Medicine 2015;175(12):1932-1939.
↩︎
Laurence C. Baker, M. Kate Bundorf, and Daniel P. Kessler. “The Effect of Hospital/Physician Integration on Hospital Choice.” Journal of Health Economics 50 (December 1, 2016): 1–8. https://doi.org/10.1016/j.jhealeco.2016.08.006↩︎
Richard M. Scheffler and Daniel R. Arnold. “Insurer Market Power Lowers Prices in Numerous Concentrated Provider Markets.” Health Affairs. 2017 36:9, 1539-1546.
↩︎
Erin E. Trish and Bradley J. Herring. “How Do Health Insurer Market Concentration and Bargaining Power with Hospitals Affect Health Insurance Premiums?.” Journal of Health Economics. Vol. 42 (July 2015). ↩︎
Unlike hospitals paid on the prospective payment system, Critical Access Hospitals are paid based on a percent of their costs.
↩︎
MedPAC, “March 2020 Report to the Congress: Medicare Payment Policy,” March 13, 2020.
↩︎
David M. Cutler and Fiona Scott Morton. “Hospitals, Market Share, and Consolidation.” JAMA vol. 310 no. 18 (November 13, 2013). ↩︎
Brent D. Fulton. “Health Care Market Concentration Trends In The United States: Evidence And Policy Responses.” Health Affairs 36, no. 9 (September 1, 2017): 1530–38. https://doi.org/10.1377/hlthaff.2017.0556↩︎
Meredith Freed, Anthony Damico and Tricia Neuman. “A Dozen Facts About Medicare Advantage in 2020.” Kaiser Family Foundation. Apr 22, 2020.
↩︎
Jane M. Zhu, Lynn M. Hua, and Daniel Polsky. “Private Equity Acquisitions of Physician Medical Groups Across Specialties, 2013-2016.” JAMA 323, no. 7 (February 18, 2020): 663–65. https://doi.org/10.1001/jama.2019.21844↩︎
Jack S. Resneck. “Dermatology Practice Consolidation Fueled by Private Equity Investment: Potential Consequences for the Specialty and Patients.” JAMA Dermatology 154, no. 1 (01 2018): 13–14. https://doi.org/10.1001/jamadermatol.2017.5558↩︎
Suhas Gondi and Zirui Song. “Potential Implications of Private Equity Investments in Health Care Delivery.” JAMA 321, no. 11 (March 19, 2019): 1047–48. https://doi.org/10.1001/jama.2019.1077↩︎
Joseph D. Bruch, Suhas Gondi and Zirui Song. “Changes in Hospital Income, Use, and Quality Associated with Private Equity Acquisition.” JAMA Internal Medicine (August 24, 2020).
↩︎
Christine S. Wilson. “The FTC’s Ongoing Efforts to Promote Competition and Choice in Our Health Care System.” Keynote Remarks at the Council for Affordable Health Coverage: The Price of Good Health – 2020 and Beyond, January 16, 2020. ↩︎
Rebecca Slaughter. “Antitrust and Health Care Providers Policies to Promote Competition and Protect Patients Center for American Progress.” Washington, DC: Federal Trade Commission, May 14, 2019. ↩︎
J. Michael McWilliams, Michael E. Chernew, Alan M. Zaslavsky, Pasha Hamed, and Bruce E. Landon. “Delivery System Integration and Health Care Spending and Quality for Medicare Beneficiaries.” JAMA Internal Medicine 173, no. 15 (August 12, 2013): 1447–56. https://doi.org/10.1001/jamainternmed.2013.6886. ↩︎
Marah Noel Short and Vivian Ho. “Weighing the Effects of Vertical Integration Versus Market Concentration on Hospital Quality.” Medical Care Research and Review: MCRR, February 9, 2019, 1077558719828938. https://doi.org/10.1177/1077558719828938. ↩︎
Daniel P Kessler and Mark B McClellan. “Is Hospital Competition Socially Wasteful?” NBER Working Paper, July 1999. ↩︎
Thomas Koch, Brett Wendling, and Nathan E. Wilson. “Physician Market Structure, Patient Outcomes, and Spending: An Examination of Medicare Beneficiaries.” Health Services Research 53, no. 5 (2018): 3549–68. https://doi.org/10.1111/1475-6773.12825. ↩︎
Nancy D. Beaulieu, Leemore S. Dafny, Bruce E. Landon, Jesse B. Dalton, Ifedayo Kuye, and J. Michael McWilliams. “Changes in Quality of Care after Hospital Mergers and Acquisitions.” The New England Journal of Medicine 382, no. 1 (02 2020): 51–59. https://doi.org/10.1056/NEJMsa1901383. ↩︎
Cory Capps, Dennis W. Carlton, and Guy David, “Antitrust Treatment of Nonprofits: Should Hospitals Receive Special Care?.” Econ Inquiry, 58: 1183-1199. (2020) doi:10.1111/ecin.12881↩︎
Gary Claxton, Matthew Rae, Larry Levitt, and Cynthia Cox. “How have healthcare prices grown in the U.S. over time?” Peterson-KFF Health System Tracker. May 8, 2018.
↩︎
Karyn Schwartz and Jennifer Tolbert. “Limitations of the Program for Uninsured COVID-19 Patients Raise Concerns.” Kaiser Family Foundation. August 24, 2020. ↩︎
Juliette Cubanski, Karyn Schwartz, Jeannie Fuglesten Biniek, and Tricia Neuman. “Medicare Accelerated and Advance Payments for COVID-19 Revenue Loss: Time to Repay?” Kaiser Family Foundation. August 07, 2020.
↩︎
This total excludes the $46 billion appropriated for loans for the aviation industry and businesses “critical to maintaining national security.”
↩︎
Glenn Hubbard and Hal Scott. “‘Main Street’ Program Is Too Stingy to Banks and Borrowers.” Wall Street Journal. July 20, 2020.
↩︎
Federal Reserve Board, “Federal Reserve Board modifies Main Street Lending Program to provide greater access to credit for nonprofit organizations such as educational institutions, hospitals, and social service organizations,” July 17, 2020. Available at: https://www.federalreserve.gov/newsevents/pressreleases/monetary20200717a.htm.
↩︎
The Affordable Care Act’s (ACA) future continues to be uncertain as the law’s constitutionality will once again be considered by the U.S. Supreme Court in California v. Texas1 (known as Texas v. U.S. in the lower courts). Oral argument is scheduled for Tuesday, November 10, 2020. This ongoing litigation challenges the ACA’s minimum essential coverage provision (known as the individual mandate) and raises questions about the entire law’s survival. The individual mandate provides that most people must maintain a minimum level of health insurance coverage; those who do not do so must pay a financial penalty (known as the shared responsibility payment) to the IRS. The individual mandate was upheld as a constitutional exercise of Congress’ taxing power by a five member majority of the Supreme Court in NFIB v. Sebelius in 2012.
In the 2017 Tax Cuts and Jobs Act (TCJA), Congress set the shared responsibility payment at zero dollars as of January 1, 2019, leading to the current litigation. In December 2019, the U.S. Court of Appeals for the 5th Circuit affirmed the trial court’s decision that the individual mandate is no longer constitutional because the associated financial penalty no longer “produces at least some revenue” for the federal government.2 But, instead of deciding whether the rest of the ACA must be struck down, the 5th Circuit sent the case back to the trial court for additional analysis. However, the Supreme Court has now agreed to review the case.
The ACA remains in effect while the litigation is pending. However, if all or most of the law ultimately is struck down, it will have complex and far-reaching consequences for the nation’s health care system, affecting nearly everyone in some way. A host of ACA provisions could be eliminated, including protections for people with pre-existing conditions, subsidies to make individual health insurance more affordable, expanded eligibility for Medicaid, coverage of young adults up to age 26 under their parents’ insurance policies, coverage of preventive care with no patient cost-sharing, closing of the doughnut hole under Medicare’s drug benefit, and a series of tax increases to fund these initiatives.
This issue brief answers key questions about the litigation as we await a decision from the Supreme Court about the ACA’s survival.
1. Who Is Challenging the ACA?
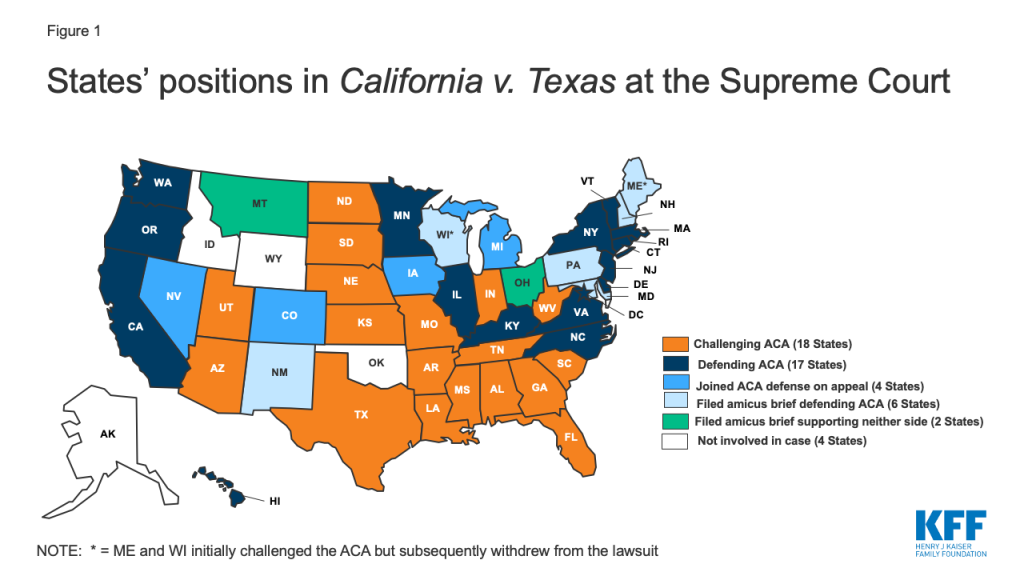
A group of 20 states, led by Texas, sued the federal government in February 2018, seeking to have the entire ACA struck down (the “state plaintiffs”).3 These states are represented by 18 Republican attorneys general and 2 Republican governors. After Democratic victories in the 2018 mid-term elections, two of these states, Wisconsin and Maine, withdrew from the case in early 2019, leaving 18 states challenging the ACA on appeal (Figure 1).4
Figure 1: States’ positions in California v. Texas at the Supreme Court
Two individuals joined the lawsuit in the trial court in April 2018, as plaintiffs challenging the ACA.5 These plaintiffs are self-employed residents of Texas who claim that the individual mandate requires them to purchase health insurance that they otherwise would not buy, although there is no penalty if they fail to buy coverage.
2. What Is the Federal Government’s Position in the Case, and How Has It Changed Over Time?
Throughout the litigation, the federal government has not defended the constitutionality of the ACA’s individual mandate. Instead, the federal government agrees with the state and individual plaintiffs that the individual mandate is no longer constitutional under Congress’s taxing power as a result of the TCJA provision that set the financial penalty at zero.6 It is unusual for the federal government to take a position that does not seek to uphold a federal law.
Unlike the plaintiffs, the federal government argued at the trial court that only the ACA’s protections for people with pre-existing conditions, including guaranteed issue and community rating, should be struck down along with the individual mandate. The federal government took the position that these provisions cannot function effectively without the individual mandate but the rest of the ACA should be allowed to survive.
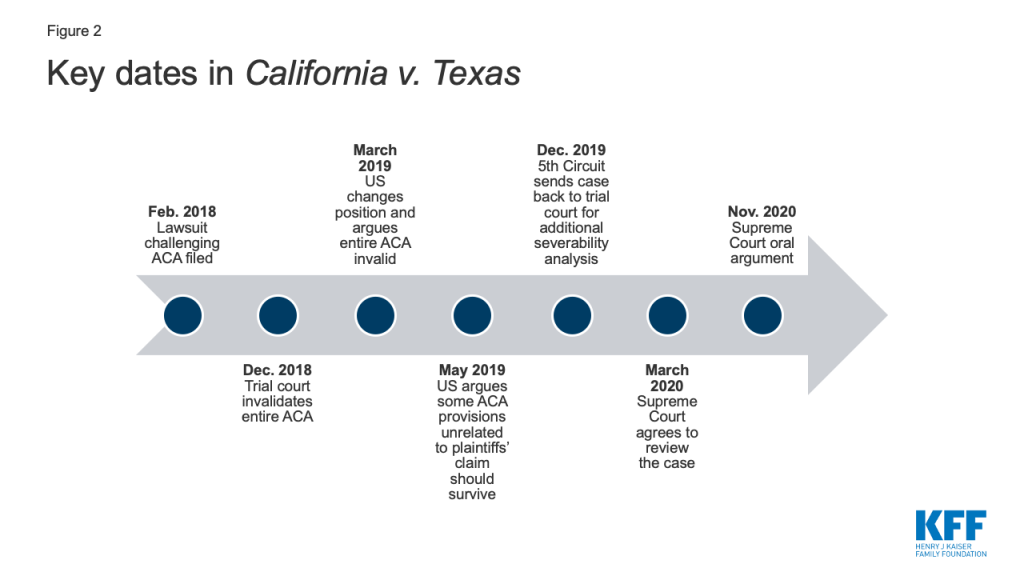
Notably, the federal government changed its position while the case was on appeal at the 5th Circuit (Figure 2). First, the federal government took what the 5th Circuit called a “significant change in litigation position”7 by deciding to support the trial court’s decision that the individual mandate is inseverable from the entire ACA.8 This change came after the federal government had appealed, asking the 5th Circuit to review the trial court’s decision. Next, the federal government raised new arguments about the scope of relief that the court should grant, asserting that the federal government should be enjoined from enforcing only the ACA provisions that injure the plaintiffs. For example, the federal government identified “several criminal statutes used to prosecute individuals who defraud our healthcare system” that are part of the ACA that it believes should survive.9 The federal government also argued for the first time in the 5th Circuit that any injunction prohibiting enforcement of the ACA should apply only in the plaintiff states.10
The federal government is asking the Supreme Court to prohibit it from enforcing only the ACA provisions that are found to harm the individual plaintiffs. Even though the federal government is arguing that the entire ACA should be found invalid (because the individual mandate is no longer constitutional and cannot be severed from the rest of the law), the federal government does not want the Court to necessarily prevent it from still enforcing parts of the law. Instead, the federal government is seeking a more limited remedy: it contends that “relief should reach only the enforcement of the ACA provisions that injure the individual plaintiffs.”11 The federal government has not clearly identified which specific ACA provisions fall into this category and is asking the Supreme Court to send the case back to the lower courts to determine this issue.12
Figure 2: Key dates in California v. Texas
3. Who is Defending the ACA?
Another 17 states, led by California, were permitted by the trial court to intervene in the case and defend the ACA (the “state intervener-defendants”). Subsequently, the 5th Circuit allowed four more states to intervene in the case on appeal, bringing the total number of states defending the ACA in the case to 21 .13 In addition, six states filed an amicus brief in the Supreme Court in support of the ACA (Figure 1).
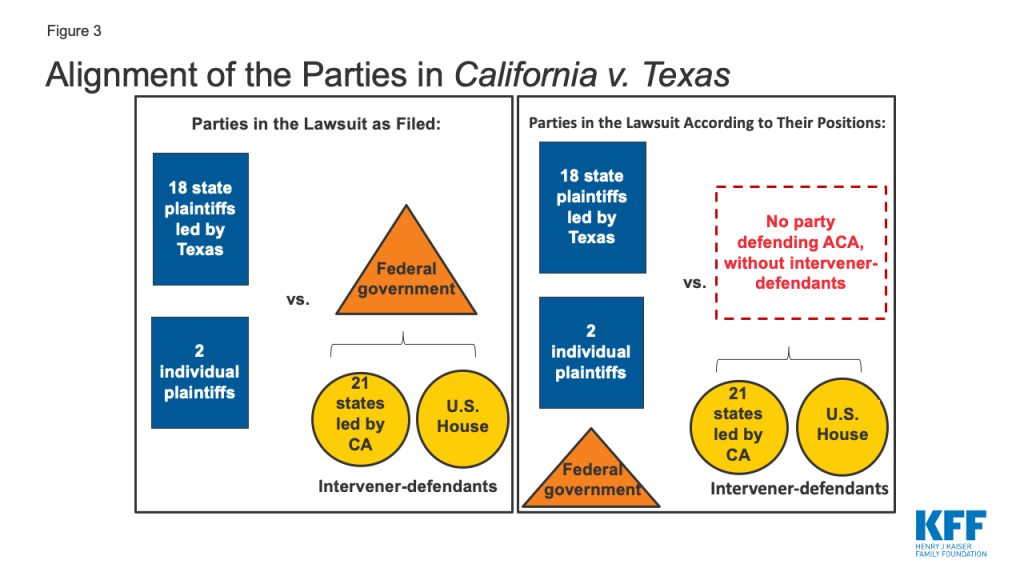
The 5th Circuit also allowed the U.S. House of Representatives to intervene in the case to defend the ACA on appeal.14 However, the 5th Circuit did not decide whether the House has standing to pursue the appeal.15 The standing of the state intervener-defendants and/or the House is particularly important in this case, since the federal government is not defending the ACA (Figure 3). At the Supreme Court, the parties are not contesting, and the Court has not asked for briefing on, California’s ability to pursue an appeal (California and the House both filed cert petitions raising the same issues, and the Court accepted California’s petition).
Figure 3: Alignment of the Parties in California v. Texas
4. What Did the 5th Circuit Decide?
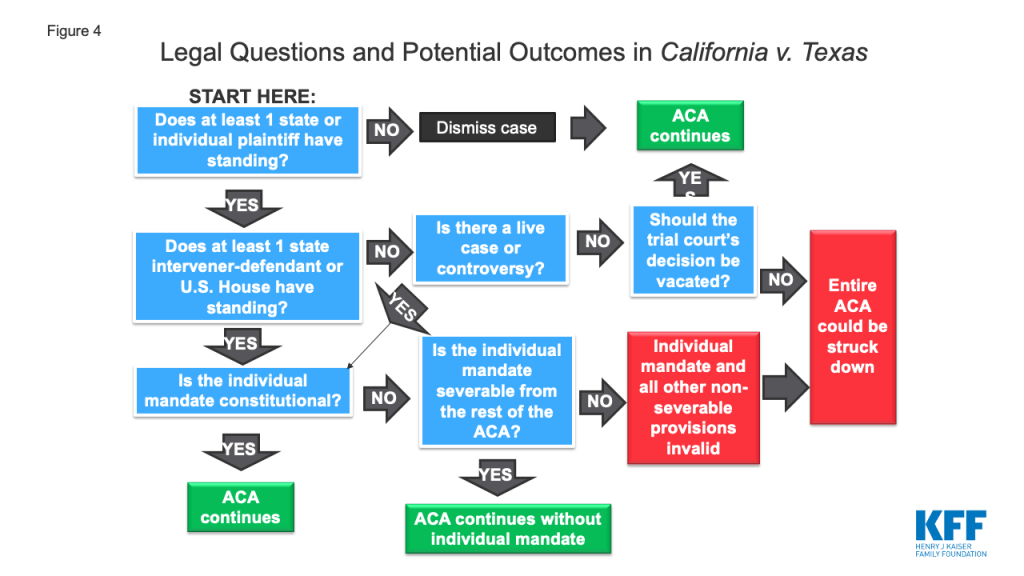
The 5th Circuit issued a 2:1 decision finding the individual mandate unconstitutional and sending the case back to the trial court for additional analysis about whether the rest of the ACA can survive. There are three main issues in the case: (A) whether the parties have standing to invoke the court’s jurisdiction; (B) whether the ACA’s individual mandate, as amended by the TCJA, is constitutional; and (C) if the mandate is unconstitutional, whether it can be severed from the rest of the ACA, or on the other hand, whether other provisions of the ACA also must be invalidated. Figure 4 illustrates the legal questions and potential outcomes in the case.
(A) The parties have standing to litigate the case.
The 5th Circuit decided that the case presented a live controversy for it to resolve, despite the unusual alignment of the parties’ positions. Although the federal government is “in almost complete agreement on the merits of the case” with the plaintiffs, it also has indicated that it will continue to enforce the ACA unless or until a court issues a final order striking the law down.16 The state intervener-defendants have standing to pursue an appeal because they would be injured by the loss of federal ACA funding, such as funding for the Medicaid expansion and the Medicaid Community First Choice attendant care program, if the trial court’s decision is upheld.17
Figure 4: Legal Questions and Potential Outcomes in California v. Texas
The 5th Circuit decided that the both the individual and state plaintiffs have standing to challenge the ACA in court. Standing ensures that federal courts are deciding actual cases or controversies as required by the U.S. Constitution. Standing is essential for the court to have jurisdiction to decide a case and therefore cannot be waived. To establish standing, a party must suffer an injury that is concrete and actual or imminent; fairly traceable to the challenged conduct; and likely to be redressed by a favorable court ruling. The 5th Circuit agreed with the trial court that the individual plaintiffs have standing because they have spent money that they otherwise would not have spent, absent the individual mandate, to purchase health insurance.18 The 5th Circuit also decided that the state plaintiffs have standing because they are incurring costs from the individual mandate from having to verify which state employees have minimum essential coverage.19
The dissent reached the opposite conclusion, finding that neither the individual nor the state plaintiffs has standing to bring the case. According to the dissent, any injury experienced by the individual plaintiffs “is entirely self-inflicted” because “absolutely nothing” will happen to them if they do not purchase insurance to meet the individual mandate now that the penalty is set at zero.20 The dissent also concluded that the state plaintiffs lack standing because they failed to provide evidence showing that “at least some state employees have enrolled in employer-sponsored health insurance” or that “anyone has enrolled in their Medicaid programs solely because of the unenforceable coverage requirement.”21
(B) The individual mandate is unconstitutional after the TCJA set the financial penalty at zero.
The 5th Circuit decided that the individual mandate as amended by the TCJA is unconstitutional. The court agreed with the state and individual plaintiffs and the federal government’s assertion that the requirement to produce some revenue is “essential” to the Supreme Court’s earlier finding in NFIB that the individual mandate could be saved as a valid exercise of Congress’s power to tax.22 Without that feature, the mandate is a command to purchase health insurance, which as the Supreme Court held in NFIB, is an unconstitutional exercise of Congress’ power to regulate interstate commerce.
The dissent concluded that the individual mandate remains constitutional because the TCJA amendment is “a law that does nothing.”23 The dissent reasoned that the TCJA did not change the text of the coverage requirement and therefore did not change the individual mandate into a mandatory command to purchase insurance. Rather, Congress “changed the parameters” of the choice about whether to purchase insurance from paying a tax penalty to “no consequences at all.”24
(C) The trial court’s analysis about whether the individual mandate is severable from the rest of the ACA was incomplete.
The 5th Circuit sent the case back to the trial court for additional analysis about which ACA provisions should survive without the individual mandate. The trial court incorrectly focused on the intent of Congress in 2010 when passing the ACA and instead should have considered Congress’ intent when enacting the TCJA and setting the shared responsibility payment at zero in 2017.25 In so doing, the trial court should “employ a finer-toothed comb. . . and conduct a more searching inquiry into which provisions of the ACA Congress intended to be inseverable from the individual mandate. . . us[ing] its best judgment to determine how best to break the ACA down into constituent groups, segments, or provisions to be analyzed.”26
The 5th Circuit also directed the trial court to consider the federal government’s new argument that any order prohibiting enforcement of the ACA should extend only to provisions that injure the plaintiffs and apply only in the plaintiff states. The trial court may consider whether the federal government timely raised this argument and whether Supreme Court precedent supports limiting the remedy in this way.27
The dissent criticized the majority’s failure to send the case back to the trial court instead of resolving the severability issue. Severability is a question of law, which the 5th Circuit could have resolved without sending the case back to the trial court. The dissent agreed with the majority that the severability analysis should look to the intent of Congress when passing the TCJA in 2017. However, the dissent concluded that the fact that Congress changed the tax penalty amount to zero while leaving the rest of the ACA in place indicates that Congress intended for all of the other provisions to remain in effect.28
5. What is Happening at the Supreme Court?
The Supreme Court has agreed to review four legal questions in the case. First, the Court will consider whether Texas and the individual plaintiffs have standing to bring the lawsuit to challenge the individual mandate. If so, the Court will determine whether the TCJA rendered the individual mandate unconstitutional. If the mandate is unconstitutional, the Court will decide whether the rest of the ACA can survive. Finally, if the entire ACA is held invalid, the Court will resolve whether the entire law should be unenforceable nationwide or whether it should be unenforceable only to the extent that provisions injure the individual plaintiffs.
The case will be argued at the Supreme Court on November 10, 2020. The Court has allotted one hour and twenty minutes for oral argument, with 40 minutes for each side. California will argue for 30 minutes of the time allotted to the parties defending the ACA, with the remaining 10 minutes argued by the House. The time allotted to the parties challenging the ACA will be evenly divided between the federal government and Texas, with 20 minutes for each. The Court denied Ohio and Montana’s motion to participate in oral argument as amici curiae in support of neither side. The decision could come as late as the end of term in June 2021.
Looking Ahead
If the Supreme Court finds that the individual mandate is unconstitutional and invalidates only that provision, the practical result will be essentially the same as the ACA exists today, without an enforceable mandate. If the Supreme Court adopts the position that the federal government took during the trial court proceedings and invalidates the individual mandate as well as the protections for people with pre-existing conditions, then federal funding for premium subsidies and the Medicaid expansion would stand, and it would be up to states whether to reinstate the insurance protections. The Supreme Court also could decide that Texas and the individual plaintiffs do not have standing to bring the lawsuit, which would allow the ACA as it exists today to remain in effect.
The most far-reaching consequences, affecting nearly every American in some way, will occur if the Supreme Court ultimately decides that all or most of the ACA must be overturned, as the federal government now argues. The number of non-elderly individuals who are uninsured decreased by 18.6 million from 2010 to 2018, as the ACA went into effect. The ACA made significant changes to the individual insurance market, including requiring protections for people with pre-existing conditions, creating insurance marketplaces, and authorizing premium subsidies for people with low and modest incomes. The ACA also made other sweeping changes throughout the health care system including expanding Medicaid eligibility for low-income adults; requiring private insurance, Medicare, and Medicaid expansion coverage of preventive services with no patient cost sharing; phasing out the Medicare prescription drug doughnut hole coverage gap; reducing the growth of Medicare payments to health care providers and insurers; establishing new national initiatives to promote public health, care quality, and delivery system reforms; and authorizing a variety of tax increases to finance these changes. All of these provisions could be overturned if all or most of the ACA is struck down by the courts, and it would be enormously complex to disentangle these provisions from the overall health care system.
For now, the ACA remains in effect. The trial court’s original decision that the entire ACA should be invalidated was never implemented and was set aside by the 5th Circuit. Additionally, the Trump Administration has indicated that it intends to continue enforcing the ACA while the appeal is pending. Although the Supreme Court’s decision in the case could come as late as June 2021, the Court’s decision to review the case now, without waiting for the lower courts to complete their review, will minimize the amount of time that the ACA’s future remains uncertain.29 If the Supreme Court had not agreed to review the case now, the litigation likely would have continued for several more years, while the trial court issued a new decision on severability and that decision was then reviewed by the 5th Circuit, before returning to the Supreme Court. Still, 10 years after its enactment, the only certainty for the ACA in the foreseeable future is that there is continuing uncertainty about its ultimate survival.
In addition, Montana and Ohio filed an amicus brief in the 5th Circuit and the Supreme Court, arguing that the individual mandate is now unconstitutional but that it should be severed, allowing the rest of the law to survive. ↩︎
The federal government and the state and individual plaintiffs also endorse the Supreme Court’s determination in NFIB that the individual mandate is not a constitutional exercise of Congress’ power to regulate interstate commerce. The trial court adopted and the 5th Circuit affirmed both of these conclusions in their decisions. ↩︎
The Court denied California’s request to review the cert petition on an expedited basis. California and the House had asked the Court to proceed on an expedited basis so that the case could be heard and decided in the current term, by June 2020. ↩︎
COVID-19 Outbreaks in Long-Term Care Facilities Were Most Severe in the Early Months of the Pandemic, but Data Show Cases and Deaths in Such Facilities May Be On the Rise Again
Most States Don’t Report Data for Assisted Living Facilities Specifically, but Those That Do Show Cases and Deaths Rising Over the Summer
The rate of new COVID-19 cases and deaths in long-term care facilities declined markedly in May and June after the novel coronavirus swept through nursing homes in April, but recent data show the incidence may be on the rise again, according to a new KFF analysis.
A second new analysis from KFF examines the impact of COVID-19 on assisted living facilities, a type of long-term care facility that, unlike nursing homes, is not federally regulated, and for which there is a dearth of data about COVID-19 cases and deaths.
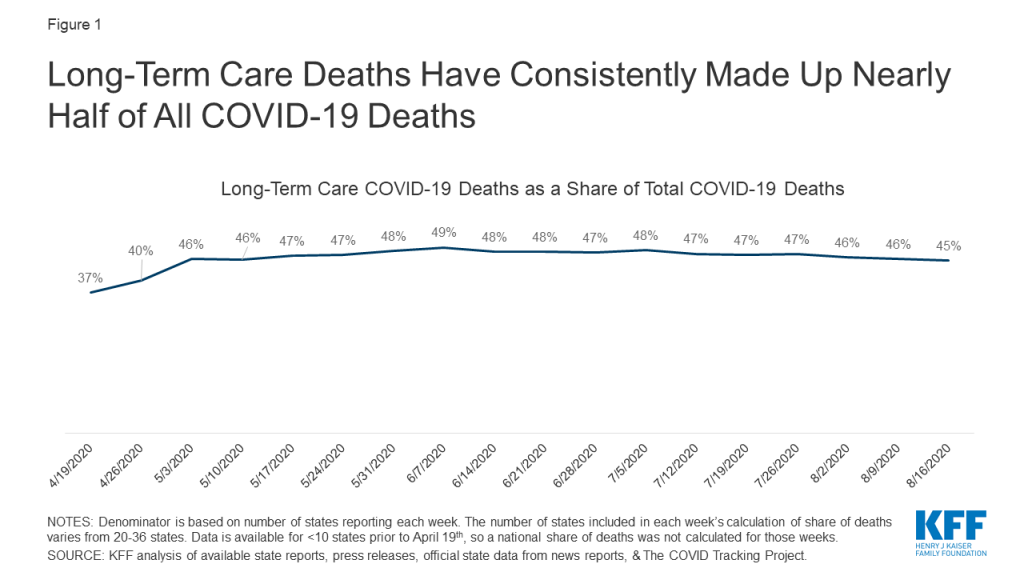
The virus has proved particularly deadly among people in long-term care settings, accounting for more than 70,000 deaths of residents and staff as of mid-August, according to the new analysis. People in long-term care facilities make up 8 percent of coronavirus cases, but 45 percent of all COVID-19 deaths.
The new analysis of trends in long-term care facilities finds that coronavirus outbreaks in such settings were most severe in the pandemic’s early stages, particularly in the Northeast, with the number of new cases and deaths in long-term care facilities per 100,000 U.S. residents considerably lower in June and July than in April and May. During August, cases and deaths have been rising somewhat. State-level data show notable state-level variation in new cases and new deaths in long-term care facilities, at most times mirroring patterns of new cases and deaths within the state.
The trend in new cases in long-term care facilities stands in contrast to trends in new cases overall. Nationally, new COVID-19 cases were substantially higher in July and August than in April and May due to the increase in cases among younger people in the summer months. The decline in the rate of new cases and deaths in long-term care settings over time may, in part, reflect measures such as visitor restrictions and more comprehensive testing of residents and staff that were implemented to mitigate the spread of the virus.
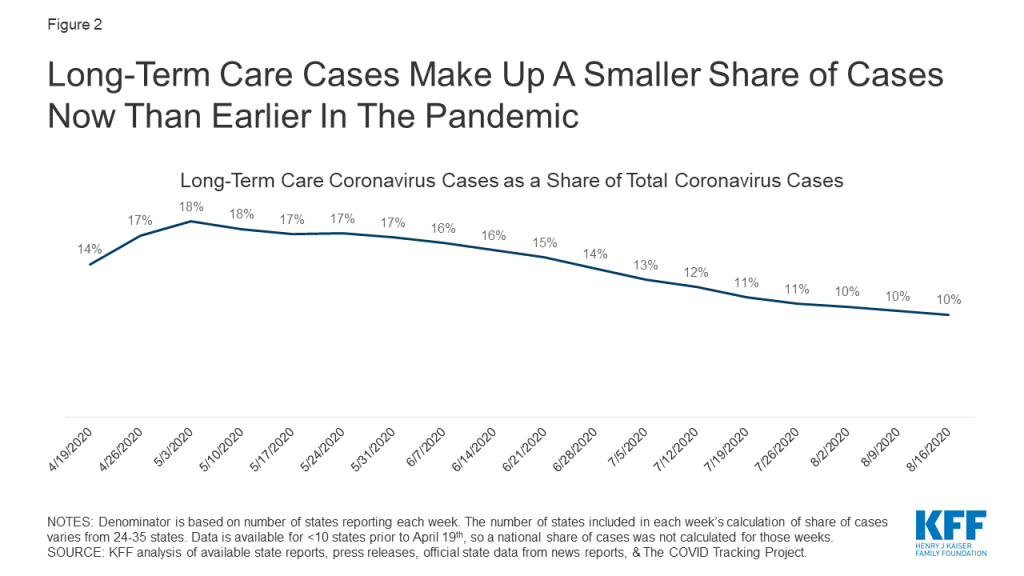
Nationally, the share of coronavirus deaths associated with long-term care facilities has stayed relatively constant since May, but the share of cases in such facilities has decreased over time. At the beginning of May, nearly 1 of every 5 coronavirus cases were in long-term care facilities. By mid-August, 1 in every 10 cases were. This decline is likely due to broader availability of testing that contributed to the identification of more cases in the general population nationally in June and July, as well as rising cases among younger people.
Trends in long-term care COVID-19 cases and deaths vary notably across states. Trend lines since April indicate that there are some states, such as New York, Massachusetts, New Jersey, and Connecticut, that have “flattened the curve”, while other states, such as California, Texas, Georgia, and Ohio, have continued to see a rise in long-term care cases and deaths. States that saw early peaks in long-term cases and deaths have experienced the highest burden of cases and deaths in such settings thus far, but that could change as the pandemic progresses.
Cases and Deaths in Assisted Living Facilities
While the impact of COVID in nursing homes has received a fair amount of media attention, assisted living facilities have been largely under the radar, in part because they are not subject to federal reporting requirements. Just 19 states are reporting data for COVID-19 in assisted living facilities separately from nursing homes, finds the other new KFF analysis.
As a result of the inconsistent and incomplete nature of state reporting of COVID data in assisted living facilities, it is difficult to know the true extent to which residents and staff in assisted living facilities have been affected by COVID-19. But based on data from states reporting this information in both June and August, the analysis shows that COVID-19 cases and deaths in assisted living facilities have increased, with a notable increase in cases among staff. This second analysis finds, for example:
Among the eight states that reported data on COVID-19 cases among staff of assisted living facilities in both June and August, the number of staff cases increased by 156 percent, from 2,085 cases in June to 5,333 in early August.
In 14 states for which there are data on COVID-19 deaths specific to assisted living facilities, a total of 2,651 COVID-19 deaths among residents and staff of such facilities had been reported as of early August, with a 59% increase in reported deaths among the 10 states reporting in both June and August.
For the full analyses, as well as other data and analyses related to COVID-19 and long-term care, visit kff.org.
Since the COVID-19 pandemic first surfaced in the United States, the number of cases and deaths in long-term care (LTC) facilities has been rising. As of August 20, 2020, over 70,000 COVID-19 related resident and staff deaths have been reported in nursing homes and other long-term care facilities, which is a conservative estimate because not all states publish these data. The increase in deaths among long-term care facility residents and staff has become an urgent concern for federal and state policymakers, the long-term care industry, family members of residents, residents themselves, and the general public.
While COVID-19 outbreaks and deaths in nursing homes have received a fair amount of attention, assisted living facilities (ALFs), which are home to over 800,000 mostly frail, elderly residents, have been largely overlooked. Unlike nursing homes, assisted living facilities are not federally regulated, leaving states to decide whether or not to publicly report data or to impose restrictions to protect residents. This analysis examines the impact of COVID-19 on assisted living facilities as well as changes over time, using state-level data on COVID-19 cases and deaths reported in early June 2020, and again in early August. These counts are a subset of the state-level COVID-19 cases and deaths in all long-term care facilities, including nursing homes, as reported in other KFF analyses. (See Methods for details).
Less Than Half of All States Report COVID-19 Cases in Assisted Living Facilities and Even Fewer Report Deaths
As of August 2020, 19 states identify COVID-19 cases or deaths specific to assisted living facilities, an increase of four states since June 2020. Of these 19 states, 13 [CO, CT, FL, KY, MA, NV, ND, OH, PA, RI, TN, TX, UT] report COVID-19 data for assisted living facilities in its own, distinct category, and 6 [CA, GA, LA, NC, NY, SC] report COVID-19 data for assisted living facilities along with congregate settings other than nursing homes (Tables 1 and 2). This leaves 31 states and DC that do not identify COVID-19 cases and deaths occurring in assisted living facilities specifically, as of August 2020.
18 of the 19 states report COVID-19 cases in assisted living facilities: As of August 2020, 18 states report COVID-19 cases in assisted living facilities, either in its own distinct category (13 states) or combined with other congregate, non-nursing facilities (5 states), and report either cumulatively (13 states) or active cases only (5 states). Of these 18 states, 14 report cases among residents and staff separately, 2 report cases among residents and staff combined, and 2 report cases among residents only.
14 of the 19 states report COVID-19 deaths in assisted living facilities: As of August 2020, 14 states report COVID-19 deaths in assisted living facilities, either in its own distinct category (8 states) or combined with other congregate settings other than nursing homes (6 states), and report either cumulatively (12 states) or only among facilities with ongoing outbreaks (2 states). Of these 14 states, 7 report deaths among residents and staff separately, and 7 states report deaths among residents only
COVID-19 Cases and Deaths in Assisted Living Facilities Have Increased, With a Notable Increase in Cases Among Staff
CASES:As of early August 2020, a total of 22,080 COVID-19 cases have been reported among residents and staff in assisted living facilities, based on the 18 states reporting COVID-19 cases data. This total reflects both the number of cases among 14 states that were reporting this information in June and the addition of 4 states that started reporting since then. Among the 14 states that reported COVID-19 cases in both June and August, the number of cases among residents and staff has increased by 66% and the number of cases among residents only has increased by 63%. This is an undercount because it is based on data reported by a minority of states.
As of early August 2020, a total of 7,626 cases were reported among assisted living staff in the 14 states reporting staff cases, including 6 states that started reporting since June. Among the 8 states that reported in both June and August, the number of staff cases has increased by 156% from 2,085 to 5,333 cases in early August.
DEATHS: As of early August 2020, a total of 2,651 deaths among residents and staff have been reported in the 14 states that identify COVID-19 deaths specific to assisted living facilities, including the 10 states that reported deaths in both June and August, and 4 states that started reporting since June. Among the 10 states that reported deaths in both June and August, the total number of deaths increased by 59% from 1,483 to 2,356 deaths in early August. The majority of reported COVID-19 deaths are among assisted living facility residents (2,257); a relatively small number represent deaths among staff (99).
As of early August 2020, a total of 99 deaths were reported among assisted living staff in the 7 states reporting staff deaths, including 2 states that started reporting since June. Among the 5 states that reported in both June and August, the number of deaths has increased by 219% from 31 to 99 deaths in early August.
In the 10 states reporting cumulative COVID-19 CASE numbers for assisted living facilities in both June and August, the percentage increase in the aggregate number of COVID-19 cases in the population overall was significantly greater than the percentage increase in aggregate resident and staff cases in ALFs (223% versus 61%). But the opposite is true in the states reporting cumulative deaths in assisted living facilities. In the nine states reporting cumulative DEATH data for assisted living facilities separately from nursing homes, the aggregate percentage increase in COVID-19 deaths occurring in the overall population in these states was roughly half of the increase in resident and staff deaths occurring in ALFs between June and August (36% vs. 60%).
Discussion
Despite intense scrutiny of the number of COVID-19 cases and deaths in nursing facility settings, less than half of all states are reporting data for COVID-19 in assisted living facilities specifically. As a result, it is difficult to know the extent to which residents and staff in assisted living facilities have been affected by COVID-19 or the extent to which interventions are urgently needed. Our analysis finds a significant increase in COVID-19 cases and deaths among residents and staff in assisted living facilities in the two-month period between June and August. The rise in cases among staff is especially noteworthy. Notably, four out of five states [CA, FL, NV, SC] with the largest increase in cases among staff are also considered “hotspot” states with widespread community transmission. The rise in COVID-19 cases among staff is most likely to disproportionately affect female, Black, and low-wage workers, based on a recent analysis.
Since COVID-19 data for assisted living facilities are reported separately from nursing facilities by a minority of states, the counts of cases and deaths presented in this analysis are undoubtedly conservative. Compounding this data limitation, states that do report for assisted living facilities separately from nursing homes vary significantly in what they report: some states report cases, but not deaths, and some do not report cases or deaths among staff. In fact, only seven states separately report deaths among staff working in assisted living facilities. Additionally, while some states (e.g., NY, LA) have been reporting cumulative case and death data dating back to early March, others do not specify the start date of their retrospective data reporting, leading to potential undercounts of cases and deaths that have occurred since the beginning of the pandemic. The reporting of active cases only by some states (such as Florida) is likely to result in an undercount of the true magnitude of cases and deaths since the numbers do not take into account cases and deaths that may have occurred but are no longer active.
Overall, the incomplete system of state-level reporting of COVID-19 data in assisted living facilities results in an incomplete picture of disease incidence and mortality among staff and residents in these facilities. Based on data from the states that do report, outbreaks in assisted living facilities, and protections for residents and staff, warrant more careful attention.
Tables
Table 1:
–
Methods
To collect data on COVID-19 cases and deaths in ALFs, we reviewed public reporting of COVID-19 surveillance data displayed on applicable state-run websites in all states, and collected numbers of cases and deaths for ALFs in states where this data is reported separately from cases and deaths in LTC facilities generally, in order to exclude nursing facilities from our analysis. Not all states report COVID-19 data for LTC facilities, and some only report this data for nursing homes. For this analysis, we collected state data on COVID-19 cases and deaths between June 5 and June 8, 2020, and between August 3 and August 6, 2020.
We included COVID-19 case and death data for each state (n=13) that reported for ALFs specifically, as well as other states (n=6) that report ALF data separately from nursing facilities, but do so within a larger category that includes ALFs along with other non-nursing home facility types, such as residential care facilities, personal care homes, and adult care facilities. We included these congregate facilities because assisted living facilities represent a large share of their total residents in many states. We intentionally excluded states reporting in broader categories that include nursing homes because these numbers are reported to CMS separately and our goal is to understand the impact of COVID-19 in assisted living facilities to the extent this is possible with current data limitations.
In order to compare increases in COVID-19 cases and deaths overall to increases in cases and deaths occurring in ALFs over the study period, we calculated the percent increases in cases and deaths occurring between June 8 and August 6, 2020 in the 11 states reporting cumulative ALF data in both the beginning and end of the study period, using the state data section of the KFF COVID-19 Coronavirus Tracker.
Notably, states vary widely in reporting data for cases and deaths. Among the 18 states that report ALF cases, 2 states report aggregate cases for residents and staff, 14 states report cases for residents and staff separately, and 2 states report cases for residents only. Among the 14 states that report ALF deaths, 7 states report deaths for residents and staff separately and 7 states report deaths for residents only. Since June, Connecticut and Texas, which were previously reporting cases and deaths for residents only, are now reporting staff cases, but not staff deaths (Texas) and cases and deaths for residents and staff separately (Connecticut). Most states in our analysis (n=14) report cumulative case and death data, however five states (Florida, North Carolina, North Dakota, Tennessee, Utah) report only active cases, which may lead to a significant undercount of cases and deaths that are no longer active. Within the two-month period, North Carolina switched from reporting cumulative cases to active cases.
States differ slightly in how many cases constitute a facility “outbreak” which triggers reporting – some states report data for facilities with just one active case, others begin reporting when two or more cases are reported by facilities. States also differ in whether they report suspected COVID-19 cases and deaths, in addition to confirmed cases – some only report cases confirmed via diagnostic test. For the purpose of this analysis, we have included both suspected and confirmed COVID-19 cases and deaths reported. Additionally, four states (Massachusetts, Rhode Island, Utah, and California) report ranges of cases and/or deaths, versus specific counts. For these states, we used the median of the reported range, or 5 in the case of “5 or above” reported, and 31 for “greater than 30”.
Long-term care (LTC) facilities have experienced a disproportionate share of deaths during the COVID-19 pandemic. The most recently available data show long-term care facilities making up 8% of all coronavirus cases, but more than 40% of all COVID-19 deaths. This analysis evaluates trends of long-term care cases and deaths between April and August 2020 to evaluate where and when the pandemic has hit long-term care facilities the hardest, how the share of cases and deaths attributed to long-term care facilities has changed over time, and whether states continue to report new cases and deaths in these facilities at the same rate now as they did back in April.
This analysis presents trends in long-term care data for states that have reported long-term care cases (35 states) and deaths (36 states) since early April 2020 (see methods and limitations for more details). Federally available, facility-specific data was not used for this analysis because facilities were not required to begin reporting until May 8, which would miss peaks in cases and deaths in April and May. Key findings from our analysis include:
Nationally, reported cumulative cases and deaths in long-term care facilities have increased over time, increasing from 10,000 deaths and 50,000 cases in mid-April to over 70,000 deaths and nearly 400,000 cases in mid-August. However, trends in cases and deaths vary notably across states. (Interactives 1 and 2). Some states, such as New York and Massachusetts, experienced a surge of long-term care cases and deaths that peaked and plateaued much earlier than other states where long-term cases and deaths were first reported in later months and have continued to climb, such as Texas and North Carolina (Interactives 1 and 2).
Nationally, the share of deaths attributed to LTC facilities has stayed relatively constant since May, but the share of cases attributed to LTC facilities has decreased over time (Figures 1 and 2). The decreasing share of cases attributed to long-term care facilities is likely due broader availability of testing that contributed to the identification of more cases in the general population, particularly in younger age groups, in June and July.
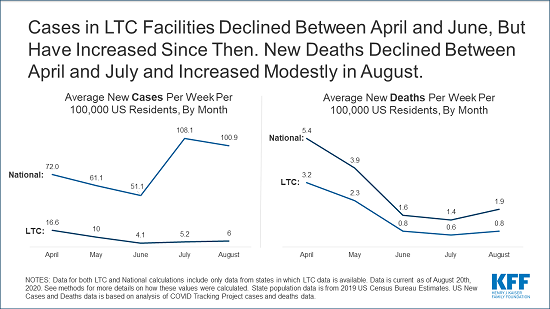
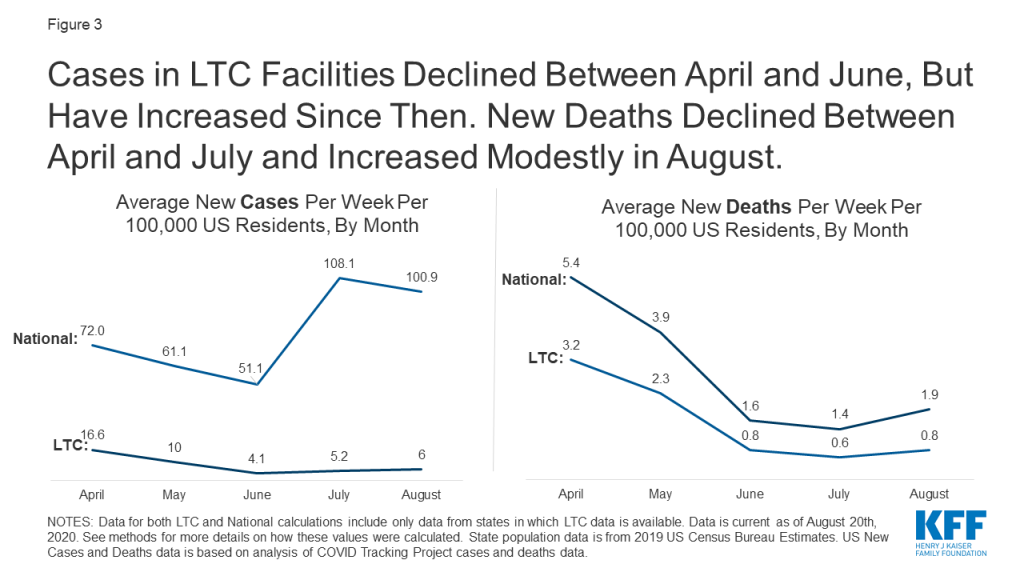
Nationally, the number of new LTC cases and deaths peaked in April, decreased in May and June, before rising in July, followed by a rise in new LTC deaths in August (Figure 3 and Table 2). These patterns of new LTC cases and deaths generally follow the patterns of cases and deaths that we have seen nationally, indicating a strong connection between community spread with cases and deaths in long-term care facilities. Recent analysis on cases in hotspot states supports this notion as well. A key distinction here is the number of new LTC cases per 100,000 residents in July and August was much lower than new LTC cases in April and May, which differs from the national pattern where new cases in the summer months were higher than new cases in April and May. (Figure 3).
Issue Brief
1. How do trends in total cases and deaths in long-term care facilities vary by state?
Total cases and deaths in long-term care facilities have increased over time, with notable differences across states (Interactives 1 and 2). Examining visual trend lines in cumulative cases and deaths since April indicates that there are some states, such as New York, Massachusetts, New Jersey, and Connecticut, that have “flattened the curve”, while other states, such as California, Texas, Georgia, and Ohio, have continued to see a rise in long-term care cases and deaths (Interactives 1 and 2).
As of August 20th, states with the highest burden of COVID-19 long-term care cases and deaths per 100,000 state residents were among those that experienced the earliest peaks in both long-term care and overall cases and deaths (Table 1). New Jersey, Massachusetts, Louisiana, Rhode Island, and Connecticut had the highest burden of cases and deaths in LTC facilities per 100,000 state residents (>250 cases per 100,000 residents and >40 deaths per 100,000 residents) among all states that report data. With the exception of Louisiana, these states were also among the states that experienced relatively large numbers of long-term care cases and deaths in the earlier months of the pandemic (Interactives 1 and 2, Table 2).
In contrast, while long-term care cases and deaths in states like California and Texas continued to rise into the summer months, after other states had flattened their curve (Interactives 1 and 2, Table 2), these states experienced a smaller number of long-term care cases and deaths per 100,000 residents (11-12 deaths and 118 cases per 100,000 state residents) than states that peaked in March/April (>40 deaths and >250 cases per 100,000 state residents) (Table 1). With the number of cases and deaths in these states continuing to rise, it will be important to re-assess the extent to which this finding holds over time.
Interactive 1:
–
Interactive 2:
–
2. How has the national share of deaths and cases attributed to long-term care facilities changed over time?
Nationally, the share of deaths attributed to long-term care facilities has stayed relatively constant over time (Figure 1). The share of reported deaths attributed to long-term care facilities increased from 37% the week of April 19th to 46% the week of May 3rd and has stayed relatively constant since then. The increase in share of deaths attributed to LTC facilities from April to May may be attributed to better reporting (Figure 1). Notably, 7 additional states started reporting data on deaths between the week of April 19th and the week of May 3rd.
Figure 1: Long-Term Care Deaths Have Consistently Made Up Nearly Half of All COVID-19 Deaths
In contrast, the share of cases attributed to long-term care facilities has decreased over time. When long-term care data began to be reported by more states in mid-April, 1 in every 7 coronavirus cases was a long-term care facility resident or staff member. By the beginning of May, that share had increased to nearly 1 of every 5 cases. However, since then, the share of cases attributed to residents and staff in long-term care facilities has decreased. The most recent data from mid-August show that 1 in every 10 cases is a long-term care facility case (Figure 2). This decrease can likely be attributed to an increase in testing of the general population, most likely due to the increased community transmission that occurred in June and July.These new cases primarily skewed towards a younger population, so share of cases attributed to long-term care facilities has decreased.
Figure 2: Long-Term Care Cases Make Up A Smaller Share of Cases Now Than Earlier In The Pandemic
3. What has happened with new cases and deaths in long-term care facilities nationally and at the state-level?
Nationally, new reported long-term care cases per week were the highest in April and decreased through May and June, before increasing again in July and August. (Figure 3 and Table 2). The number of new long-term care cases nationwide decreased from April to May (16.6 cases to 10.0 cases per 100,000 US residents) and again in June (4.1 cases per 100,000 US residents). However, beginning in July, new cases began to rise again (5.2 cases per 100,000 US residents) and again in August to 6.0 new long-term care cases per 100,000 US residents.
Figure 3: Cases in LTC Facilities Declined Between April and June, But Have Increased Since Then. New Deaths Declined Between April and July and Increased Modestly in August
New reported long-term care COVID-19 deaths per week were the highest in April, decreased through May, June, and July, before increasing modestly in August (Figure 3 and Table 2). New weekly long-term care deaths decreased from April to May (3.2 deaths to 2.3 deaths per 100,000 US residents), to June (0.8 deaths per 100,000 US residents), to July (to 0.6 deaths per 100,000 US residents) before increasing slightly in August to 0.8 deaths per 100,000 US residents.
The number of new LTC cases and deaths per 100,000 US residents was overall lower in July and August than in April and May. This pattern of new LTC cases differs from national new case trends, while the pattern of new LTC deaths is similar to national new death trends (Figure 3 and Table 2). New LTC outbreaks were more severe in the earliest months of the outbreak (primarily in the Northeast) than in more recent months, based on the lower number of new LTC cases and deaths per week (Figure 3 and Table 2). This pattern mirrors new deaths nationally, but is in contrast to national new case trends where, new cases in the general population were higher in July and August than in April and May (Figure 3). It is important to continue to track new LTC cases and deaths in the coming months to understand if we are at the beginning of a continued increase in new LTC cases and deaths that will outpace the rate of new cases and deaths identified in April and May.
Trends in long-term care facilities may mirror trends in community outbreaks, but may also be affected by measures that have been put in place to mitigate the impact of the pandemic on residents and staff. Trends of new cases and deaths, as well as recent analysis of cases and deaths by hotspot state status, support the idea that increased community transmission plays a role in increasing cases and deaths in long-term care facilities. However, nationally, long-term care facilities have seen less severe outbreaks now than they did earlier in the pandemic. While the severity of long-term care cases and outbreaks have decreased, potentially as a result of policies restricting visitors, implementing universal testing of staff and residents, and greater social distancing in communities, it will be important to look at burden of cases/deaths and new cases/deaths again if states experience a rise in cases and deaths in the community.
Tables
Table 1: Long-Term Care Coronavirus Cases and Deaths Per 100,000 Residents As of August 20th, 2020
State
Long-Term Care Cases Per 100,000US and State Residents
Long-Term Care Deaths Per 100,000US and State Residents
US TOTAL
128 cases per 100,000 US residents(35 states)
23 cases per 100,000 US residents(36 states)
Alabama
148 per 100,00 State Residents
N/A
Arkansas
42
N/A
California
118
12 per 100,000 State Residents
Colorado
88
13
Connecticut
287
91
Delaware
127
37
District of Columbia
147
24
Florida
N/A
19
Georgia
170
19
Idaho
105
10
Illinois
208
34
Indiana
148
27
Iowa
N/A
17
Kansas
57
7
Kentucky
112
12
Louisiana
319
42
Maryland
244
35
Massachusetts
356
82
Michigan
123
21
Minnesota
74
23
Mississippi
154
31
Nevada
78
7
New Jersey
425
79
New York
N/A
34
North Carolina
103
12
North Dakota
N/A
9
Ohio
138
22
Oklahoma
73
7
Oregon
43
5
Pennsylvania
194
40
Rhode Island
280
76
South Carolina
127
18
Tennessee
74
6
Texas
118
11
Utah
66
5
Vermont
38
N/A
Virginia
105
15
Washington
82
13
Wisconsin
28
7
NOTES: All state data is “per 100,000 State Residents”. See methods for more details on how these values were calculated. State population data is from 2019 US Census Bureau Estimates.
Table 2: Average New LTC Cases and Deaths Per Week Per 100,000 Residents, By Month
State
Average New Cases Per Week Per 100,000US and State Residents
Average New Deaths Per Week Per 100,000US and State Residents
April
May
June
July
August
April
May
June
July
August
US TOTAL
16.6(24 states)
10.0(31 states)
4.1(35 states)
5.2(35 states)
6.0(34 states)
3.2(20 states)
2.3(31 states)
0.8(36 states)
0.6(36 states)
0.8(35 states)
Alabama
5.7
7.3
7.3
8.4
9.6
Arkansas
1.3
1.4
2.7
4.3
California
8.8
7.1
3.6
8.7
7.9
0.8
0.5
0.7
0.5
Colorado
9.7
6.2
1.6
1.1
1.2
1.1
1.0
0.4
0.2
0.1
Connecticut
52.8
22.9
2.9
1.8
0.8
12.3
9.1
1.7
0.8
0.1
Delaware
7.7
13.7
6.0
1.0
1.5
2.4
3.0
2.3
0.9
0.1
District of Columbia
9.4
16.8
4.3
1.9
1.6
4.0
3.4
0.3
0.2
Florida
0.8
0.8
0.7
1.0
2.1
Georgia
12.0
7.5
4.4
9.4
11.4
1.1
1.1
0.5
0.8
1.3
Idaho
2.1
9.1
14.8
0.1
0.7
1.2
Illinois
22.5
17.8
7.9
4.0
4.0
3.1
3.3
1.4
0.6
0.5
Indiana
8.6
3.7
15.1
2.8
2.0
0.8
1.7
0.9
Iowa
1.2
0.7
0.7
0.8
Kansas
1.6
2.0
2.3
4.8
0.3
0.4
0.2
0.3
Kentucky
4.5
5.1
5.3
8.4
0.5
0.7
0.5
0.3
Louisiana
15.5
15.5
8.1
18.1
23.0
3.1
2.2
1.1
1.1
3.0
Maryland
16.9
11.2
5.0
4.9
2.9
2.2
0.5
0.3
Massachusetts
57.7
29.3
6.1
2.4
3.0
11.3
7.2
2.5
1.2
1.0
Michigan
1.9
1.8
3.0
0.2
0.4
0.3
Minnesota
5.2
7.3
2.3
0.9
2.9
2.1
1.1
0.4
0.5
Mississippi
8.0
8.3
5.8
7.1
11.7
0.9
2.1
1.0
1.6
2.3
Nevada
8.0
3.2
2.0
4.3
5.7
0.3
0.5
0.2
0.2
0.5
New Jersey
72.5
35.8
7.0
3.2
0.6
13.5
6.6
1.4
0.8
1.0
New York
0.8
2.7
0.3
0.2
0.1
North Carolina
4.7
4.3
3.5
5.1
10.0
0.7
0.7
0.5
0.3
1.0
North Dakota
0.2
0.3
0.3
Ohio
19.0
9.6
4.1
6.2
7.6
1.6
0.9
0.7
0.7
Oklahoma
5.2
3.3
1.5
3.3
5.4
0.5
0.5
0.1
0.2
0.4
Oregon
2.3
2.5
3.7
0.3
0.2
0.3
Pennsylvania
19.5
14.9
5.8
4.1
4.0
4.2
3.3
2.0
0.6
0.6
Rhode Island
36.9
24.4
5.3
1.2
2.6
2.9
8.3
3.6
0.7
0.2
South Carolina
5.0
5.8
2.8
9.7
12.0
0.6
0.7
0.5
1.4
1.9
Tennessee
2.7
1.9
0.9
3.7
13.5
0.2
0.3
0.1
0.1
0.9
Texas
1.4
2.0
16.1
9.9
0.2
0.2
0.9
1.3
Utah
2.1
3.6
5.9
3.8
0.2
0.2
0.5
0.4
Vermont
0.6
5.2
2.2
0.7
Virginia
4.9
8.6
5.3
3.3
3.8
0.4
1.7
0.8
0.3
0.4
Washington
2.5
2.5
3.8
0.4
0.3
0.6
Wisconsin
2.6
1.9
1.1
0.7
1.2
0.5
0.3
0.1
0.2
NOTES: National values are per 100,000 US residents. State values are per 100,000 state residents. Data is current as of August 20th, 2020. See methods for more details on how these values were calculated. State population data is from 2019 US Census Bureau Estimates.
Table 3: Variations in State Reporting of Long-Term Care Facility Cases and Deaths Related to COVID-19
State
What is reported?
Who is included in counts?
What types of long-term care facilities are included?
How often is/was data updated?
Additional State Data Notes
Alabama
Cases
Residents and Staff
Long-term care facilities
Daily
Arkansas
Cases and Deaths
Residents
Nursing Homes
Daily
Stopped updating number of cases at the end of July. Now only reports share of cases in nursing homes. Started reporting number of deaths in nursing homes at the beginning of August. Deaths are not included in this analysis due to short time period of availability.
California
Cases and Deaths
Residents and Staff
Nursing Homes, Residential Care Facilities for the Elderly, and Adult Residential Facilities (ARF)
Daily
4/23-5/14: Includes resident/staff cases/deaths in nursing homes5/19: Drop in cases from 9908 to 9869 because of exclusion of staff cases. Added other types of LTCF cases and deaths.5/25-present: Includes staff & other LTCFs.
Colorado
Cases and Deaths
Residents and Staff
Nursing Homes and Assisted Living Facilities
Weekly
Connecticut
Cases and Deaths
Residents and Staff
Nursing Homes and Assisted Living Facilities
Weekly
4/16: Cases and deaths in nursing home residents4/29: Added cases in assisted living facilities5/13: Added deaths in assisted living facilities7/14: Includes cumulative staff cases and deaths since 6/17 in NH and 7/1 in ALFs.7/21: Drop in cases from 10,166 to 10,1378/11: Number of facilities with outbreaks drops from 307 to 306
Delaware
Cases and Deaths
Residents
Long-term care facilities
Daily
Latest data on Staff cases/deaths is from June 26th – 461 staff cases and 1 staff death. Not included in counts due to inconsistent reporting of staff data.7/3: Drop in cases from 1,164 to 1,1547/10: Drop in deaths from 335 to 334 due to exclusion of resident who was found to be member of independent living facility
District of Columbia
Cases and Deaths
Residents and Staff
Long-term care facilities
Daily
6/9: Drop in deaths from 165 to 1578/20: Drop in cases from 1055 to 1034Previously, data was updated daily reports via spreadsheet. In recent weeks, data is updated more irregularly.
Florida
Deaths
Residents and Staff
Long-term care facilities
Daily
Only active cases are reported, so cumulative cases cannot be trended.
Georgia
Cases and Deaths
Residents and Staff
Nursing homes, Assisted Living Communities and Personal Care Homes
Daily
Idaho
Cases and Deaths
Residents and Staff
Nursing Home, Assisted Living Facility, or Intermediate Care Facility
Weekly
Illinois
Cases and Deaths
Residents and Staff
Long-term care facilities
Weekly
Indiana
Cases and Deaths
Residents and Staff
Long-term care facilities
Daily
4/26 – 7/19: Cases and deaths in residents in long-term care facilities from 4/26-7/197/26 – present: Staff cases and deaths added to counts
Iowa
Deaths
Residents and Staff
Long-term care facilities
Daily
Only active cases are reported, so cumulative cases cannot be trended.
Kansas
Cases and Deaths
Residents and Staff
Long-term care facilities
Previously reported data in summary PDF; now reports data as part of Cluster Summary dashboard
Kentucky
Cases and Deaths
Residents and Staff
Long-term care facilities
Daily
Louisiana
Cases and Deaths
Residents and Staff
Long-term care facilities
Weekly
3/29 – 5/10: nursing home resident cases/deaths5/18: staff cases added to countsLA also reports Adult Residential Care cases/deaths, but those are not reported consistently, so they are not included in this analysis to make trended data more reliable
Maryland
Cases and Deaths
Residents and Staff
Long-term care facilities
Weekly
Massachusetts
Cases and Deaths
Residents and Staff
Long-term care facilities
Daily
Michigan
Cases and Deaths
Residents and Staff
Long-term care facilities
Daily
Active cases only reported up till 6/14Deaths data fluctuates due to data reconciliation.
Minnesota
Cases and Deaths
Residents and Staff
Long-term care facilities
Daily
Mississippi
Cases and Deaths
Residents and Staff
Long-term care facilities
Daily
Nevada
Cases and Deaths
Residents and Staff
Long-term care facilities
Daily
New Jersey
Cases and Deaths
Residents and Staff
Long-term care facilities
Daily
New York
Deaths
Residents and Staff
Long-term care facilities
Daily
Deaths that occurred outside of facility are not counted. This excludes hospital deaths.
North Carolina
Cases and Deaths
Residents and Staff
Long-term care facilities
Multiple times per week
North Dakota
Deaths
Residents and Staff
Long-term care facilities
Daily
Only active cases are reported, so cumulative cases cannot be trended.
Ohio
Cases and Deaths
Residents and Staff
Long-term care facilities
Weekly
369 deaths reported prior to April 15th
Oklahoma
Cases and Deaths
Residents and Staff
Long-term care facilities
Daily
Oregon
Cases and Deaths
Residents and Staff
Care facilities, Senior living communities, and Congregate Living Settings
Weekly
Active cases, deaths, and outbreaks were reported until 6/21
Pennsylvania
Cases and Deaths
Residents and Staff
Nursing Homes and Personal Care Homes
Daily
Rhode Island
Cases and Deaths
Residents and Staff
Long-term care facilities
Weekly
South Carolina
Cases and Deaths
Residents and Staff
Long-term care facilities
Multiple times per week
Tennessee
Cases and Deaths
Residents and Staff
Long-term care facilities
6/12: cases and deaths drop from 1325 to 1055 and 155 to 1327/29: Aggregated & corrected data is reported, accounting for hike in cases & deaths
Texas
Cases and Deaths
Residents and Staff
Nursing Homes and Assisted Living Facilities
Daily
Staff cases are as of August 6th.
Utah
Cases and Deaths
Residents and Staff
Long-term care facilities
Daily
Vermont
Cases
Residents and Staff
Long-term care facilities
Weekly
7/22: Cases drop from 407 to 4057/29: Vermont began reporting congregate care/living settings separately from other outbreaks accounting for large drop in reported cases
Virginia
Cases and Deaths
Residents and Staff
Long-term care facilities
Daily
Washington
Cases and Deaths
Residents and Staff
Nursing Homes, Assisted Living Facilities, Adult Family Home
Weekly
7/12: Deaths drop from 820 to 815
Wisconsin
Cases and Deaths
Residents and Staff
Nursing Homes and Assisted Living Facilities
Daily
SOURCE: KFF analysis of available state reports, press releases, press conferences, official state data from news reports, and The COVID Tracking Project
Methods
This analysis is based on data from 38 states plus Washington DC, for a total of 39 states. Within these 39 states, we were able to trend long-term care cases in 35 states and long-term care deaths in 36 states. Data was trended as far back as internal records and publicly available historical data allowed. States were chosen based on where we could reliably trend data. States were excluded from this analysis if they do not report data on cases and deaths in long-term care facilities, if their data is sourced from sporadically released media reports, or if there were data quality issues. The 12 states excluded from the analysis were excluded for the following reasons:
Alaska, Arizona, Hawaii, Missouri, Montana, New Mexico, South Dakota – Not reporting cases and deaths in long-term care facilities
Maine, Nebraska, New Hampshire, Wyoming – Data on cases and deaths in long-term care facilities are sourced from sporadic media reports
West Virginia – State-reported data has severe data quality issues
For all states, we trended the subset of data that would give us the longest reliable trend line. Notable examples of this include Louisiana, where data from non-nursing home long-term care facilities were excluded because they were not consistently reported. In Delaware, data excludes staff cases because that data was not reported consistently. For this reason, this analysis should not be used to identify state-level or national data on total long-term care cases and deaths. The most recent data on total cases and deaths in long-term care facilities can be located here.
Table 1: Long-Term Care Coronavirus Cases and Deaths Per 100,000 US and State Residents As of August 20th, 2020
This table presents the burden of long-term care cases and deaths that each state has experienced as of August 20th, 2020. Total population data was taken from 2019 state population estimates from the US Census Bureau. The latest long-term care cases/deaths data available was used to calculate the burden of cases and deaths experienced by each state. National long-term care case burden was calculated by summing US population from 35 states that reported case data, dividing total cases by total population in those 35 states, and multiplying by 100,000 to find the value per 100,000 US residents. National long-term care deaths burden was calculated similarly by using data from 36 states that report LTC deaths.
Table 2: Average New LTC Cases and Deaths Per Week Per 100,000 US and State Residents, By Month
Total population data was taken from 2019 state population estimates from the US Census Bureau. The first week of available data for each state was not included in this analysis since the first week of data does not reflect a single week of cases/deaths, but rather all cases and deaths that have occurred up to that point. New cases and deaths were calculated for each week thereafter, and then averaged for all of the weeks within the month. April, June, and July reflect 4 weeks of data. May reflects 5 weeks of data. August reflects 3 weeks of data. These average new cases were converted to represent cases and deaths per 100,000 state residents to allow for easier comparison across states. National new cases and national new deaths were calculated by averaging new cases and new deaths across states. See limitations for more details on this process.
Limitations
There were several possible approaches to this analysis, all of which posed major limitations. This analysis could be limited to the time period where most major states are reporting, which would limit the time period of this analysis to mid-June to present day. However, this approach would miss the major peaks in states such as Massachusetts, Connecticut, and New Jersey. Another option was to limit the analysis to states where we had the earliest weeks of data available. However, this approach would exclude Texas, Michigan, Maryland, and several other states where data was not available until at least several weeks after other states began reporting. Deaths in the states that would have been excluded in this approach make up 30% of all long-term care deaths due to COVID-19. This analysis could have also used the federally reported data, but this would have limited the time period of analysis as well.
Due to data availability and quality issues, we were unable to include all states in this analysis. Thus, all national calculations in this analysis are subject to data availability. In particular, national calculations of new cases and deaths in Table 2 are limited by varying numbers of states included in each week and month, the differences in policies across states, and the lack of reporting comparability. However, given the data limitations, this is the best approximation of new cases and deaths per month.
We conducted a sensitivity analysis for the analysis in Table 2 to see how much using different states in each month affected both the raw Ns and the direction of the trend. Our sensitivity analysis found no notable differences. When looking at the same set of 23 states for new cases and 19 states for new deaths from April to August, we found similar trends as when looking at all available states in respective months. As mentioned above, this method excludes several major states, such as Texas, Michigan, and Maryland.
Another key limitation is related to data on cases. Two large states – Florida and New York – do not report data on cumulative cases. Thus, the national numbers we present for case data are not truly nationally representative. These states report a large number of deaths, so they have likely experienced similarly large numbers of cases.
On July 24, 2020, President Trump signed four executive orders related to prescription drug costs. All four orders will require regulatory action by the Administration before they can be implemented. Three of the four executive orders were released publicly – one pertaining to prescription drug importation, one pertaining to Medicare Part D drug rebates, and one pertaining to the cost of insulin and injectable epinephrine in federally qualified health centers. The fourth executive order, referred to by the President as the “most favored nation” proposal, that uses international reference prices to lower drug costs in the U.S., was not released with the others. Instead, the President announced he would give pharmaceutical companies 30 days to come up with an alternative approach before that order would take effect.
Those 30 days have now passed, and the executive order has still not been released. According to press reports, the pharmaceutical industry has put together an alternative proposal, but it is not known whether the proposal has been presented to the White House, nor whether the President will accept the industry’s proposal and drop the “most favored nation” proposal. The President has continued to tweet and talk about this proposal, including at some length on the opening day of the Republican National Convention. According to the President’s statement at the signing ceremony, the executive order would ensure that the U.S. pays no more for pharmaceuticals than other countries.
While the content of this executive order has not been released to the public, a portion of the textthat was captured by a photographer during the President’s signing ceremony indicates that it may be similar to a proposal announced by the Administration in October of 2018 in an advance notice of proposed rulemaking (ANPRM). Under the 2018 proposal, Medicare would test a model that uses lower drug prices from several foreign countries to set payments for drugs that are covered under Medicare Part B, with the aim of paying 126% of what other countries pay, down from 180% currently. Medicare Part B covers a limited set of prescription drugs that are administered in outpatient settings, such as physician offices and hospital outpatient departments, mainly high-cost drugs used to treat serious illnesses such as cancer or rheumatoid arthritis. As proposed, the model would have no direct impact on the price of drugs covered under Medicare Part D or private insurance.
If the new executive order is similar to the 2018 proposal, and applies only to Medicare Part B drug spending, it would apply to just 7% of total national spending on prescription drugs, according to our analysis (Figure 1).
Figure 1: A “Most Favored Nation” Approach to Setting Drug Prices, If Applied to Medicare Part B Drugs Only, Would Apply to Just 7% of Total Drug Spending in the U.S.
If a “most favored nation” approach was limited to setting prices for prescription drugs covered by Medicare Part B only, it could lower drug costs for approximately 4 million Medicare beneficiaries, based on the number of people who used Part B drugs in 2018 (just 7% of all 60 million beneficiaries covered by Medicare). However, it would have no direct impact on the lion’s share of drug spending under Medicare for prescriptions filled by the 45 million beneficiaries covered under Medicare Part D, nor would it lower drug costs for the 157 million people with employer coverage or for millions more with other insurance coverage or no coverage whatsoever.
Methods
To calculate the share of total drug spending accounted for by Medicare Part B drug spending, we used data from IQVIA, Medicine Spending and Affordability in the United States: Understanding Patients’ Costs for Medicines (August 2020) and MedPAC, A Data Book: Health Care Spending and the Medicare Program (July 2020). According to IQVIA, total net payer spending on prescription drugs in 2019, including both retail and non-retail settings, was $509 billion, and patient out-of-pocket spending on drugs, both retail and non-retail, was an additional $82 billion, for a total of $591 billion in total net payer and patient drug spending in 2019. According to MedPAC, Medicare Part B drug spending was $35 billion in 2018. We trended this 2018 estimate forward to 2019 using the 11% average annual growth rate in Part B spending between 2009 and 2018, as reported by MedPAC, to derive an estimated Part B drug spending amount for 2019 of $39 billion. This $39 billion estimate formed the numerator and the $591 billion IQVIA estimate formed the denominator for our calculation of total drug spending accounted for by Medicare Part B drug spending in 2019.
States have taken a number of Medicaid policy actions to address the impact of COVID-19 on seniors and people with disabilities, many of whom rely on long-term services and supports (LTSS) to meet daily needs and are at increased risk of adverse health outcomes if infected with coronavirus. Medicaid is the primary source of coverage for LTSS, financing over half of these services in 2018. Collectively these actions could expand access to coverage (by enhancing financial and functional eligibility criteria and streamlining enrollment), expand access to long-term care services (by adding new benefits and increasing utilization limits), and bolster providers (through increased reimbursement or retainer payments). Increased funding may be required to extend community-based care more broadly and additional enrollee protections and oversight could be achieved through strengthened reporting requirements. This issue brief identifies state actions taken as of August 21, 2020 and implications for future consideration.
States have taken a number of emergency LTSS actions related to Medicaid eligibility, benefits and providers (Figure 1). Over half of states have expanded eligibility criteria for seniors and people with disabilities, while few states have increased the total number of HCBS waiver enrollees served. Nearly all states have streamlined enrollment processes, and over one-third of states have eased premium and/or cost-sharing requirements for seniors and people with disabilities. Just over half of states have added a new LTSS benefit to meet enrollee needs during the emergency; most benefit expansions are home and community-based services (HCBS). Most states have increased service utilization limits and relaxed prior authorization requirements. Nearly all states have increased provider payment rates for at least one LTSS and modified provider qualifications, and many have adopted retainer payments. Among states with provider payment rate increases, just over half have increased institutional rates, while about two-thirds have increased rates for at least some HCBS. Few states have required reporting on COVID-19 cases and deaths for HCBS enrollees and/or settings. CMS has adopted separate COVID-19 reporting requirements for nursing facilities.
Figure 1: Medicaid Long-Term Services and Supports State Emergency Actions in Response to COVID-19, as of August 21, 2020
The duration of the public health emergency has implications for policy actions adopted under Medicaid emergency authorities as well as the availability of enhanced federal funding provided through the matching rate increase. Many state policy changes have been adopted through temporary authorities that will expire after the public health emergency declaration ends, which will lead policymakers to assess whether any policies can or should be retained and transitioned to other authorities. In addition, some policy changes in response to the pandemic may be difficult for states to sustain without additional federal financial support beyond the 6.2 percentage point increase in federal Medicaid matching funds authorized by Congress during the public health emergency, as states are facing revenue declines and budget shortfalls.
A great deal of attention has been focused on the impact of COVID-19 in nursing homes, given the disproportionate number of cases and deaths among residents and staff nationally, with less attention on community-based residential settings. The Trump Administration has issued guidance about how nursing homes should respond to the pandemic, announced the formation of an independent commission to assess nursing home response, and adopted new reporting requirements for COVID-19 cases and deaths in nursing homes. To date, less attention to COVID-19 cases and deaths generally has been paid to community-based residential settings, such as group homes, where the pandemic presents similar risks to Medicaid enrollees and providers due to the highly transmissible nature of the coronavirus, the congregate nature of the settings, and the close contact that many workers have with residents. Data about COVID-19 cases and deaths in both institutional and community-based congregate settings may allow policymakers to more fully assess the impact across populations at increased risk of adverse health outcomes. The pandemic also may exacerbate the need for HCBS waiver services, which already are subject to waiting lists in a number of states. For example, elderly parents sickened by COVID-19 may no longer be able to provide care for their adult children with disabilities. Beyond the pandemic, the coming age wave makes LTSS and Medicaid’s role as the primary payer likely to be policy issues faced by the next Administration, in addition to the continuing effects of the pandemic and economic crisis.
Introduction
As the COVID-19 pandemic continues, states have taken a number of Medicaid policy actions to address the impact on seniors and people with disabilities, many of whom rely on long-term services and supports (LTSS) to meet daily needs and are at increased risk of adverse health outcomes if infected with coronavirus. Medicaid covers nearly 7.4 million seniors and almost 11.1 million people who are eligible based on a disability as of 2014. These enrollees may be at increased risk for adverse health outcomes if infected with coronavirus due to their older age, underlying health conditions, and/or residence in congregate settings, such as nursing homes, intermediate care facilities for people with intellectual or developmental disabilities (I/DD), or group homes. In addition, many seniors and people with disabilities rely on Medicaid LTSS to meet daily self-care and independent living needs, which makes it important for their coverage and access to care to continue uninterrupted during the pandemic.
Many state policy changes related to Medicaid LTSS have been adopted through temporary authorities that, according to CMS guidance, will expire when the Health and Human Services Secretary’s COVID-19 public health emergency declaration ends. This will lead policymakers to assess whether any changes can or should be retained and transitioned to other authorities. The public health emergency declaration currently is set to expire on October 23, 2020. While some state actions have been supported by the 6.2 percentage point increase in federal Medicaid matching funds authorized by Congress during the public health emergency, policy changes may be difficult for states to sustain without additional federal financial support, given the severity and expected longevity of the economic crisis resulting from the pandemic. The amount of fiscal relief to states from the increase in federal matching funds depends on the duration of the public health emergency, while the economic consequences of the pandemic are likely to persist beyond the public health emergency period. The current increase in federal matching funds could offset or reduce state spending but is unlikely to fully offset state revenue declines and address budget shortfalls.
The election will have implications for LTSS issues, and Medicaid’s role as its primary payer, given the effects of the pandemic, the resulting economic crisis, and the coming age wave. Democratic Presidential nominee Joe Biden recently released a plan to increase access to Medicaid home and community-based services (HCBS), while the Trump Administration has proposed a Medicaid program-wide federal financing cap in the President’s FY 2020 budget and is asking the Supreme Court to invalidate the entire Affordable Care Act, including provisions that allows states to expand Medicaid HCBS. This issue brief identifies trends in state policy actions related to Medicaid for seniors and people with disabilities and LTSS as of August 21, 2020. These include actions to expand eligibility and streamline enrollment, ease premium and/or cost-sharing requirements, enhance benefits, increase provider payment, modify provider qualifications, and alter reporting requirements.
Key Findings
States are adopting Medicaid policies targeted to seniors, people with disabilities, and LTSS in response to the pandemic through a variety of authorities that have different expiration dates. These authorities include Disaster-Relief State Plan Amendments (SPAs), traditional SPAs, other administrative authorities, HCBS waiver Appendix K, Section 1115 demonstration waivers, and Section 1135 waivers. The beginning and ending dates vary by authority (Appendix Table 1).
Eligibility and Enrollment
Fifteen states are expanding financial eligibility limits for seniors and people who qualify for Medicaid based on a disability to increase access to coverage during the public health emergency (Figure 2). Coverage groups where eligibility is based on old age or disability (known as “non-MAGI groups”) have income limits, and at state option, also may have asset limits. State actions to expand financial eligibility in these pathways include applying less restrictive income or asset methodologies and/or increasing HCBS waiver cost limits during the emergency period. For example, North Carolina is disregarding increases in assets for all non-MAGI groups until after the emergency period ends, and Massachusetts is allowing people with disabilities to obtain a temporary hardship waiver of the medically needy spend down requirement during the public health emergency. In addition, North Carolina and Washington are modifying financial eligibility criteria for some HCBS to cover beneficiaries who would otherwise not be eligible.
Figure 2: Medicaid LTSS Eligibility and Enrollment State Emergency Actions to Address COVID-19, as of August 21, 2020
Less than half of states (23) are expanding functional eligibility criteria to help more people qualify for coverage based on a disability during the emergency period (Figure 2). In addition to meeting financial eligibility criteria, coverage groups related to disability status require individuals to meet functional criteria, for example, based on the extent of their self-care needs. Missouri expanded coverage to adults who test positive for coronavirus by considering it a qualifying disability for its aged/blind/disabled pathway.1 Indiana is giving HCBS waiver enrollment priority to people with COVID-19 or who are presumed positive from its waiting lists for waivers that provide non-residential supports for people with I/DD, while other states are temporarily modifying HCBS waiver functional eligibility targeting criteria. In addition, 13 states are modifying HCBS waiver assessment requirements to allow individuals to begin receiving services before a functional eligibility evaluation is completed (no data shown).
Maryland and Utah are increasing the total number of individuals served in HCBS waivers during the emergency period (Figure 2). Maryland is increasing the number of individuals served in its waiver for children with autism spectrum disorder; Utah is increasing the number of individuals served by a waiver for people transitioning from institutions to the community. Unlike state plan coverage groups, states can limit the number of people who enroll in waivers, which can result in waiting lists when the number of people seeking services exceeds the number of waiver slots available. States acknowledged that the pandemic may exacerbate the need for HCBS waiver services; for example, Pennsylvania noted that many people on its waiver waiting list have aging caregivers who may not be able to continue providing care if they develop COVID-19. However, few states have been able to increase the number of waiver enrollees served in response to the pandemic. In addition, 16 states are allowing individuals to maintain HCBS waiver eligibility without receiving services, which can keep enrollees connected to coverage while services are interrupted due to provider shortages or restrictions due to state stay-at-home orders or while individuals are receiving inpatient treatment during the pandemic (Figure 2).
Nearly all states are taking at least one action to streamline eligibility determinations to expedite enrollment in coverage for seniors and people with disabilities during the emergency. Eleven states are allowing hospitals to make presumptive eligibility determinations for non-MAGI groups during the emergency, which can help connect people to coverage at the time they seek medical treatment (Figure 2). Seven states are allowing applicants in non-MAGI pathways to self-attest to financial and/or functional eligibility requirements in lieu of requiring documentation before determining eligibility (Figure 2). The most frequent action in this area is permitting virtual evaluations to determine HCBS waiver functional eligibility and/or otherwise modifying processes for HCBS waiver level of care evaluations and reevaluations to account for social distancing during the pandemic, adopted by 50 states (Figure 2).
Almost all states are extending eligibility renewal due dates during the pandemic to keep people connected to coverage and enable states to focus limited state agency staff time on responding to the emergency. Forty-nine states are extending reassessment and reevaluation due dates for one or more HCBS waivers (Figure 2). Pennsylvania is extending eligibility renewal deadlines for non-MAGI populations to every 12 months. As one of the conditions of receiving the enhanced federal matching funds under the Families First Coronavirus Response Act, states must provide continuous eligibility for individuals enrolled on or after March 18, 2020 through the end of the month in which the public health emergency ends.2
Premiums and Cost-Sharing
States are eliminating or easing premiums and cost-sharing requirements to help seniors and people with disabilities remain in coverage and facilitate access to services during the pandemic. More than one-third of states are eliminating or waiving premiums in Medicaid pathways that offer buy-in coverage for working people with disabilities, while a couple of states are easing cost-sharing requirements (Figure 1). Connecticut is suspending copayments for individuals who are dually eligible for Medicare and Medicaid. Rhode Island has adopted a policy that helps ensure that people with short-term nursing home stays will have a community-based residence to which they can return post-discharge by allowing enrollees to receive a home maintenance allowance throughout the public health emergency. This policy accounts for the financial cost of maintaining a home in the community by reducing the amount that these enrollees must pay out-of-pocket for institutional care and applies to individuals who were institutionalized for less than six months as of March 1, 2020, and unable to be discharged home due to COVID-19.
Benefits
About half of states (27) are temporarily adding new services to their regular LTSS benefit packages to meet enrollee needs during the public health emergency (Figure 3). Nearly all state actions in this area relate to expanding the benefit packages available under HCBS waivers and/or Section 1915 (i) state plan HCBS. Frequently added services include home-delivered meals; medical supplies, equipment, and appliances; and assistive technology. Some states are adding other services to address the emergency. For example, Washington is adding wellness education to help HCBS waiver enrollees manage chronic conditions, avoid health risks and be informed about COVID-19. Indiana is adding rent and food reimbursement to help enrollees in an I/DD waiver offset the costs of room and board for an unrelated, live-in caregiver during the emergency. On the institutional LTSS side, Ohio has created a new benefit, Health Care Isolation Centers. These services are provided in specialized COVID-19 facilities to individuals who have been discharged from hospitals but continue to need medical and isolation care that cannot be provided in the community or their former congregate setting.
Figure 3: Medicaid LTSS Benefits State Emergency Actions to Address COVID-19, as of August 21, 2020
While the majority of benefits changes are expansions, one state is restricting benefits, and many are restricting visitors in HCBS settings in efforts to contain coronavirus spread (no data shown). Washington has authority to suspend specialized add-on nursing home services like habilitation during an emergency to protect the health of residents and staff. Similar to CMS guidance restricting visitors in nursing homes, 40 states are not allowing any visitors in at least some HCBS waiver residential settings to minimize the spread of infection.
Most states (43) are temporarily modifying utilization limits for covered services to ensure that enrollees can access services and address health and welfare issues during the emergency (Figure 3). Among these states, most are allowing utilization limits to be exceeded for HCBS waiver and/or state plan services. For example, Arkansas is removing its limit on physician visits in nursing homes, and Ohio is lifting hour and day limits on private duty nursing services post-discharge. In addition, 31 states are temporarily modifying the scope of HCBS waiver covered services to account for needs created by the pandemic (no data shown). For example, Tennessee is adding HCBS waiver services to support individuals with I/DD with shopping, hygiene, meal preparation and money management. By contrast, North Carolina, Rhode Island and Washington are restricting utilization of HCBS services (no data shown). All three states have Section 1115 waivers that allow them to vary the amount, duration, and scope of services based on population needs. In addition, North Carolina and Washington may target services on a less than statewide basis.
Most states (41) are suspending prior authorization requirements to ensure access to HCBS waiver and/or state plan services during the emergency (Figure 3). For example, Connecticut is waiving prior authorization for home health services, Maryland is suspending prior authorization for remote patient monitoring, and Nebraska is waiving prior authorization for transfers to post-acute long-term acute care hospitals, acute inpatient rehabilitation, or skilled nursing facility care. In addition, eight states are allowing other licensed providers to order home health services for state plan HCBS in addition to physicians (no data shown).
Nearly all states are expanding the settings where enrollees can receive HCBS to account for disruptions due to COVID-19 (Figure 3). Among these states, 49 are temporarily expanding the settings where HCBS waiver services can be provided during the public health emergency to include providing services in hotels, shelters, schools and churches, as needed. In addition, 35 states are allowing individuals in short-term inpatient settings to receive HCBS to provide communication and behavioral supports (Figure 3). Most states have adopted this policy for one or more HCBS waivers, and a couple are doing so for state plan HCBS: Alaska is allowing Community First Choice attendant care services to be provided in acute care hospitals, and Oregon is temporarily allowing payment for state plan HCBS, including home-based habilitation, behavioral habilitation, and psychosocial rehabilitation services, to individuals in an inpatient setting.
Nearly all states (50) are modifying care-planning processes to accommodate social distancing and facilitate access to services during the emergency (Figure 3). Examples of frequently adopted policy changes in this area include modifying the person-centered plan development process for HCBS waiver services, adjusting functional assessment requirements used to determine service levels, and adding electronic document signing. Other policy changes in this area include allowing verbal consent instead of a written signature for HCBS service plans and allowing the face-to-face encounter for home health services to take place up to one year after an individual begins receiving services. North Carolina and Washington are allowing for the provision of LTSS to individuals impacted by the emergency even if the services are not updated timely in the care plan. Michigan is extending service authorizations in person-centered service plans for state plan HCBS throughout the duration of the public health emergency.
Nearly all states have expanded the delivery of HCBS via telehealth (Figure 3). Forty-seven states are adding electronic service delivery methods to continue providing HCBS waiver and state plan in-home services remotely. Minnesota is allowing state plan group therapy and rehabilitative services to be provided via telehealth. Oregon is allowing adding telehealth delivery of state plan home-based habilitation, behavioral habilitation, and psychosocial rehabilitation services. Connecticut is allowing for telephonic check-ins in lieu of face-to-face assistance for certain mental health HCBS waiver enrollees. DC is also covering services provided remotely to state plan HCBS recipients, such as wellness checks and therapeutic activities.
Provider Payment
Just over half of states are increasing institutional LTSS payment rates (Figure 4). Among these 26 states, 24 have increased rates for nursing homes, which have been disproportionately affected by the COVID-19 pandemic, and five states are doing so for intermediate care facilities for people with intellectual or developmental disabilities or other institutional settings (no data shown). Most states are implementing per diem or percentage rate increases, while a few states are increasing the number of days for which facilities can receive bed hold payments to account for absences due to COVID-19 treatment. Alabama also is providing an additional add-on cleaning fee. Kentucky is temporarily pausing per diem rate sanctions to nursing facilities that are unable to meet medical record review thresholds to validate assignment of patients to reimbursement groups based on acuity during the public health emergency.
Figure 4: Medicaid LTSS Providers and Oversight State Emergency Actions to Address COVID-19, as of August 21, 2020
Some states limit the additional payments to facilities or patients with a COVID-19 diagnosis, while others apply them to all nursing facilities to account for increased costs related to staffing, equipment and cleaning as a result of the emergency (no data shown). For example, Michigan is providing a $5,000 per bed supplemental payment in the first month for COVID-19 regional hub nursing facilities to address immediate infrastructure and staffing needs and a $200 per diem rate increase in subsequent months to account for the higher costs of caring for COVID-19 patients.
A couple of states specifically have included pay increases for direct care workers in nursing homes and/or other institutional settings (no data shown). Arkansas adopted temporary supplemental payments that increase direct care workers’ weekly pay by a base supplemental payment according to number of hours worked and an additional tiered acuity payment for those working in facilities with COVID-19 positive patients. Texas’ nursing facility payment rates increase includes a pay increase for direct care workers and an increase for supply and dietary costs.
Just over two-thirds of states (35) are increasing provider payment rates for at least some HCBS state plan or waiver services during the public health emergency (Figure 4). For example, Alabama is increasing waiver payment rates for personal care, adult companion, respite, and skilled nursing care to account for overtime pay, staffing needs and infection control supplies. Louisiana has received approval to increase payments for all services provided under its Community Choices Waiver for elderly and disabled adults by up to 50% as needed to maintain staffing. States increasing payment rates for HCBS provided under state plan authority include targeted case management (AK), day habilitation (AR), skilled and/or private duty nursing (DC, OK), and home health and adult care homes (NC). Arkansas’s temporary supplemental payments for direct care workers in nursing facilities also apply to direct care workers in assisted living facilities and those providing home health and personal care services in the community. Michigan adopted a supplemental payment for providers of personal care and behavioral health treatment technician in-person services. Washington’s Section 1115 demonstration waiver allows the state to increase rates for Community First Choice attendant care services by up to 50 percent to maintain provider capacity during the public health emergency. In addition, Tennessee has adopted temporary payment rate increases for community-based residential, personal care, attendant care, personal assistance and intensive behavioral treatment stabilization and treatment services and a temporary per diem add-on to community-based residential and personal care payment rates to account for direct support staff hazard pay, overtime, and PPE costs using its existing directed payment authority; these services are provided under a Section 1115 HCBS waiver.
Among the states adopting LTSS provider payment increases, 18 states have increased rates for both institutional and community-based services (no data shown). Ten states have increased provider payments for only institutional services, while 17 states have increased rates for HCBS only.
About three-quarters of states are adopting retainer payments for HCBS providers (Figure 4). Thirty-eight states have adopted retainer payments for providers offering HCBS through waiver and/or state plan authorities. For example, Washington and New Hampshire have an approved Section 1115 waiver that authorizes retainer payments for personal care and habilitation services provided under state plan authority.
Two states are making interim payments to LTSS providers (Figure 4). Among these states, North Carolina allows any Medicaid-enrolled provider to request that their reimbursement be converted to an interim payment methodology, while Georgia is making interim payments to skilled nursing facilities.
Provider Qualifications
Nearly all states (50) are temporarily modifying HCBS state plan and/or waiver provider qualifications in response to potential staff shortages and increased demand due to COVID-19 (Figure 4). Frequently adopted policies in this area include temporarily permitting payment for HCBS waiver services rendered by family caregivers or other legally responsible relatives during the emergency (if not already permitted in the waiver), adopted by 38 states (no data shown). Twenty-three states are waiving conflict of interest rules and allowing case management entities to also be direct service providers for HCBS waiver enrollees during the emergency (no data shown). In addition, all states have adopted modified provider screening requirements through Section 1135 waiver authority, which may apply to LTSS providers as well as other providers.
Reporting and Oversight
Few states are adopting reporting requirements for COVID-19 cases and deaths among HCBS enrollees (Figure 4). CMS is requiring all nursing facilities to report COVID-19 cases and deaths as of May 8, 2020, but just nine states are requiring reporting of COVID-19 cases among HCBS waiver enrollees. HCBS waiver enrollees living in congregate settings such as group homes are likely to experience increased risk from coronavirus infection similar to individuals in nursing homes. In addition to the CMS nursing home reporting requirements, three states (AZ, CT, IN) have adopted their own reporting requirements related to COVID-19 cases and deaths for long-term care facilities. For example, Connecticut requires managed residential communities and nursing homes to provide daily COVID-19 status reports. Arizona also requires reporting on COVID-19 cases and deaths from group homes.
Twenty-nine states are temporarily modifying HCBS waiver incident reporting requirements and other participant safeguards during the public health emergency (Figure 4). This allows states to focus their administrative efforts on the COVID-19 response. However, there are potential risks for enrollees as incident reporting is a requirement for HCBS programs to protect enrollees from abuse, neglect and injury and to ensure their health and safety. Twenty-eight states are delaying submitting HCBS waiver enrollment and spending reports to CMS and/or are suspending data collection for performance measures other than health and welfare (no data shown). In addition, forty-seven states are suspending pre-admission screening and annual resident review requirements for nursing facilities (no data shown).
Looking Ahead
The duration of the public health emergency has implications for policy actions adopted under Medicaid emergency authorities as well as the availability of enhanced federal funding provided through the match rate increase. Many state policy changes have been adopted through temporary authorities that will expire after the public health emergency declaration ends, which will lead policymakers to assess whether any policies can or should be retained and transitioned to other authorities. In addition, some policy changes in response to the pandemic may be difficult for states to sustain without additional federal financial support beyond the 6.2 percentage point increase in federal Medicaid matching funds authorized by Congress during the public health emergency, as states are facing revenue declines and budget shortfalls.
A great deal of attention has been focused on the impact of COVID-19 in nursing homes, given the disproportionate number of cases and deaths among residents and staff nationally with less attention on community-based residential settings. The Trump Administration has issued guidance about how nursing homes should respond to the pandemic, announced the formation of an independent commission to assess nursing home response, and adopted new reporting requirements for COVID-19 cases and deaths in nursing homes. To date, less attention to COVID-19 cases and deaths generally has been paid to community-based residential settings, such as group homes, where the pandemic presents similar risks to Medicaid enrollees and providers due to the highly transmissible nature of the coronavirus, the congregate nature of the setting, and the close contact that many workers have with residents. Data about COVID-19 cases and deaths in both institutional and community-based congregate settings may allow policymakers to more fully assess the impact across populations at increased risk of adverse health outcomes. The pandemic also may exacerbate the need for HCBS waiver services, which already are subject to waiting lists in a number of states. For example, elderly parents sickened by COVID-19 may no longer be able to provide care for their adult children with disabilities. Beyond the pandemic, the coming age wave makes LTSS and Medicaid’s role as the primary payer likely to be policy issues faced by the next Administration, in addition to the continuing effects of the pandemic and economic crisis.
Appendix
Appendix Table 1: Medicaid Emergency Authorities
Authority
Description
Start Date
End Date
Disaster-Relief SPA
Allows states to make temporary changes to address eligibility, enrollment, premiums, cost-sharing, benefits, payments, and other policies differing from their approved state plan during the COVID-19 emergency. States may not make changes that restrict or limit payment, services, or eligibility or otherwise burden beneficiaries and providers.
1/1/20 (using Section 1135 waiver authority) or later date elected by state
End of public health emergency or earlier date elected by state
Traditional SPA
Allows states to amend their Medicaid state plans, which govern program elements such as coverage groups, covered services, provider reimbursement methodologies, and administrative activities.
1st day of quarter in which SPA is submitted to CMS or later date elected by state
Continues until subsequently amended or terminated
HCBS Waiver Appendix K
Allows state to amend Section 1915 (c) or Section 1115 HCBS waiver provisions related to eligibility, services, payment, provider qualifications, level of care evaluations, person-centered service plans, incident reporting, settings, and other policies to respond to emergency.
1/27/20 or later date elected by state and approved by CMS
1/26/21 or earlier date elected by state
Section 1115 Demonstration Waiver
Allows states operate to Medicaid programs without regard to specific statutory or regulatory provisions to furnish medical assistance in a manner intended to protect, to the greatest extent possible, the health, safety, and welfare of individuals and providers who may be affected by COVID-19.
3/1/20 or later date elected by state and approved by CMS
60 days after public health emergency ends or earlier date approved by CMS
Section 1135 Waiver
Allows states to operate Medicaid programs without regard to certain fee-for-service prior authorization, LTSS authorization and assessment, fair hearing procedural and timeline, provider enrollment, reporting and oversight, and other requirements, to ensure that sufficient health care items and services are available to meet enrollee needs and that providers are reimbursed.
3/1/20
End of public health emergency, per CMS guidance
SOURCE: KFF analysis of Medicaid emergency authorities and CMS guidance.
Endnotes
Missouri elects the Section 209 (b) option to apply Medicaid financial and/or functional eligibility rules to SSI beneficiaries that differ from federal SSI rules. KFF, Medicaid Financial Eligibility for Seniors and People with Disabilities: Findings from a 50-State Survey (June 2019), https://modern.kff.org/report-section/medicaid-financial-eligibility-for-seniors-and-people-with-disabilities-findings-from-a-50-state-survey-issue-brief/. In its COVID-19 Frequently Asked Questions, CMS notes that “[i]n making disability determinations, a state must generally use the same definition of disability as used for supplemental security income (SSI). A positive diagnosis for COVID-19 is not a per se disability under SSI criteria and therefore cannot be the sole basis of a determination of disability for purposes of Medicaid eligibility.” CMS, COVID-19 Frequently Asked Questions (FAQs) for State Medicaid and Children’s Health Insurance Program (CHIP) Agencies at II.C.2 (last updated June 30, 2020), https://www.medicaid.gov/state-resource-center/Downloads/covid-19-faqs.pdf. ↩︎
States generally must maintain Medicaid eligibility through the end of the month in which the public health emergency period ends for all individuals enrolled on or after March 18 2020, as a condition of receiving the 6.2 percentage point increase in federal matching funds. KFF, Key Questions About the New Increase in Federal Medical Matching Funds for COVID-19 (May 2020), https://modern.kff.org/coronavirus-covid-19/issue-brief/key-questions-about-the-new-increase-in-federal-medicaid-matching-funds-for-covid-19/. CMS has clarified that states are not prohibited from conducting regular eligibility renewals during this period, but as a condition of receiving the enhanced federal matching funds, states cannot terminate coverage for any Medicaid beneficiary enrolled on or after March 18 2020, unless the individual is no longer a state resident or requests voluntary termination. CMS, Families First Coronavirus Response Act – Increased FMAP FAQs, question B.11 (updated as of 4/13/2020), https://www.medicaid.gov/state-resource-center/downloads/covid-19-section-6008-faqs.pdf. ↩︎
Amid the coronavirus pandemic, half of Americans report that their mental health has been negatively impacted due to related stress and worry. Many are, or will be, struggling with mental health challenges due to anxiety, social isolation, loss of loved ones, and job losses – potentially leading to increased mental health care needs over the long term.
A new issue brief examines where President Trump and Democratic presidential nominee Joe Biden stand on key aspects of the nation’s mental health and substance use challenges. Key points include:
Opioid epidemic. President Trump declared a national public health emergency in 2017 and has renewed it repeatedly since then. His proposed 2021 budget would decrease total funding to the Substance Abuse and Mental Health Services Administration and to Medicaid, the nation’s largest payer for mental health services and main contributor for substance use disorder services. Vice President Biden’s campaign website features a five-point plan to address the opioid crisis that would increase access to services, curb unnecessary opioid prescriptions, and hold pharmaceutical companies accountable for their role in the crisis.
Suicide prevention. Both candidates’ suicide prevention plans focus on veterans, with President Trump creating a task force to tackle the issue and proposing to boost the Veterans Administration (VA) budget for suicide prevention. Vice President Biden proposes to expand and strengthen veterans’ mental health programs inside and outside the VA, as well as strengthen programs aimed at reducing suicide among LGBTQ teenagers.
Mental health parity. Vice President Biden’s campaign vows to redouble efforts to enforce existing mental health parity laws and expand funding for mental health, but has not offered specific plans. President Trump’s campaign website does not address mental health parity. His administration is seeking to overturn the Affordable Care Act, which would substantially limit the scope of parity rules.
Mental health workforce. Neither candidate specifically addresses mental health workforce shortages on their campaign websites. However, President Trump’s 2021 budget proposal includes a 24% increase for behavior health workforce development programs, and Vice President Biden’s education plan would double the number of psychologists, counselors and other mental health professionals in schools.
The brief draws on each candidates’ campaign website, news coverage, public statements and budget proposals. It is part of KFF’s ongoing efforts to provide useful information related to the health policy issues relevant for the 2020 elections, including policy analysis, polling, and journalism. Find more on our Election 2020 resource page.
KFF also has compiled state-specific data on mental health and substance use on more than 20 indicators, with mental health state fact sheets available profiling each state, as well as an updated look at how the COVID-19 pandemic is affecting Americans’ mental health.