Sources of Payment for Uncompensated Care for the Uninsured

Authors: Teresa A. Coughlin, Haley Samuel-Jakubos, and Rachel Garfield
Published: Apr 6, 2021

Issue Brief

Summary

Uncompensated care costs for the nation’s uninsured averaged $42.4 billion per year in the 2015-2017 time period. While substantial, these costs significantly declined following implementation of the Affordable Care Act’s coverage expansion, down from $62.8 billion per year in 2011-2013. Although health care providers incur substantial cost in caring for the uninsured, the bulk of their costs are compensated through a web of complicated funding streams, financed largely with public funds from the federal government, states and localities. This brief estimates the level of public funding that was paid to help offset providers’ uncompensated care costs for the uninsured in 2017. To conduct the analysis, we rely on several secondary data sources including government budget appropriations and expenditure data for major public programs that provided funds to cover the cost of care for the uninsured, as well as analyses of secondary data sources completed by others.  Key findings include:

  • Nationally, at least $33.6 billion in public funds were paid to providers to help defray providers’ uncompensated care costs associated with caring for the uninsured in 2017.
  • The federal government accounted for an estimated $21.7 billion, or nearly two-thirds of the public funding sources examined, most of which was through the Veterans Health Administration or Medicaid; providing $11.9 billion, states and localities made up the balance, primarily through indigent care and public assistance programs.
  • Comparing the level of public funding to our estimate of total uncompensated care costs for the uninsured ($42.4 billion per year in 2015-2017), we calculate that in the aggregate nearly 80.0 percent of providers’ uncompensated care costs were offset by government payments designed to cover these costs.

Given the rise in the number of the uninsured since 2017, provider uncompensated care costs associated with caring for the uninsured have likely increased. Between 2017 and 2019, the number of uninsured grew by an estimated 1.5 million.  In addition, with the economic toll brought on by the pandemic, the nation’s uninsured rate may have continued to climb in 2020. With the increase in uninsurance since 2017, provider uncompensated care also likely increased.  As policymakers undertake efforts to expand coverage and assess the financial impact of the pandemic, understanding uncompensated care costs and the adequacy of public funding to help defray these costs can help direct policies targeted to the uninsured. With substantial public funding of uncompensated care, government costs associated with increases in coverage could be offset in part by savings in other parts of the public ledger.

Introduction

Uninsured people use less care than their insured counterparts, but when they do use care and cannot pay for it themselves, the cost of that care is uncompensated.  Providers may absorb these costs as bad debt or tap into funding sources designed to cover some of the costs. However, these funding sources  may be inefficient or may not target funds to providers with the most uncompensated care, which can  leave uninsured people with bad debt, credit issues, or even bankruptcy.

Over the years, the federal government, states, and localities have devoted considerable resources to pay providers for care they provide to uninsured patients through several public program efforts (e.g., Veterans Health Administration and state and local indigent care programs) and also through direct financial support (e.g., Medicaid disproportionate share hospital (DSH) payments).

The economic downturn caused by the COVID-19 pandemic has potentially led to millions more people in the United States being uninsured. In addition to posing challenges to these individuals’ ability to access needed health care and be protected from medical debt, rising uninsured rates could exacerbate issues with uncompensated care costs associated with providing health care to the uninsured.

In this brief, we examine government funding streams that were available to help providers defray the costs of providing medical services to the uninsured in 2017. Specifically, building on previous analyses, we use government program data and appropriations information and other data to estimate the level of public funds paid in 2017 to help offset providers’ uncompensated care costs associated with caring for the uninsured. This study complements our analysis that estimates the total cost of uncompensated care for uninsured people, using an alternative approach to estimate specific sources of funding for uncompensated care.1  We compare the total amount estimated in this analysis to our 2017 estimate of the total cost of care for uninsured people to assess the extent to which government funding defrays the uncompensated care costs for uninsured people.

Methods

We use publicly available program data and appropriations information and other secondary data to estimate the level of public funds paid in 2017 to help offset providers’ uncompensated care costs associated with caring for the uninsured. Specifically, we examine the following government funding sources: the Veterans Health Administration, the Medicaid program (namely, Medicaid DSH and uncompensated care pool payments), state and local indigent care programs, state and local public assistance programs, the Indian Health Service, and community health centers. For government funding tied to individual patients, the estimates reflect payments various programs made for direct medical care and services for uninsured people including inpatient care, outpatient care, behavioral health serves and prescription drugs. Non-medical related program activities (e.g., costs associated with facilities and administration) are not included. We also excluded uncompensated care costs associated with long-term care services. We then compare this level of estimated public funding to our estimate of the cost of uncompensated care provided to uninsured people in 2017, which was generated using data from the Medical and Expenditure Panel Survey.

Although we include major sources of public funding, we acknowledge that we do not account for all available government funding streams to help provide care for the uninsured.2  While this leads us to underestimate the level of available public funds for uncompensated care, previous analysis indicates that these sources account for a relatively small share of public funds for uncompensated care. To the extent possible, we tried to match services and payments we included with those contained in our recent analysis that estimated the level of uncompensated care costs for the uninsured. This was done so we could compare the extent to which government funding defrays the uncompensated care costs for uninsured people, but we acknowledge that the alignment is likely imperfect.

Another limitation to the analysis is that we do not account for private funding sources that are available to help pay for care received by the uninsured such as care provided to the uninsured by philanthropic organizations or by private physicians or private funds that flow through government-funded programs, such as prescription drug rebates.

These estimates rely on available information on program budgets as well as a series of supported assumptions about to what extent funds are directed to cover the cost of care for uninsured people. Details on the different data sources, the assumptions, and the process for estimating the level of government funding can be found in the technical appendix.

Findings

In the aggregate, we estimate that government payments to offset the cost of uncompensated care for the uninsured totaled $33.6 billion in 2017 (Figure 1 and Table 1).  The federal government contributed nearly two-thirds of these payments, an estimated $21.7 billion. States and local government payments accounted for the remaining amount, $11.9 billion.

Figure 1: Sources of Public Funding for Uncompensated Care Costs for Uninsured People, by Program Type and Source of Funds, 2017

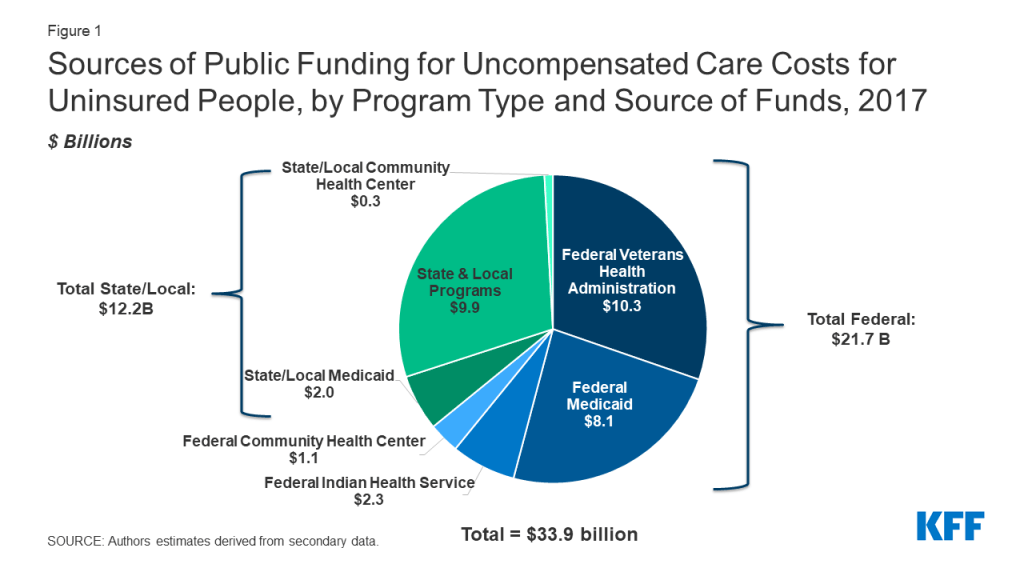
The Veterans Health Administration was the single largest government payment source, spending an estimated $10.3 billion in caring for the uninsured in 2017, all of which was federal funds (Table 1). With estimated spending totaling $9.8 billion, funding provided through the Medicaid program followed closely. Medicaid payments to cover the cost of care for the uninsured were split between DSH payments ($4.4 billion) and uncompensated care pool payments ($5.4 billion).  The federal government accounted for more than four-fifths of this Medicaid funding, reflecting states’ use of alternate financing arrangements to finance their share of DSH and uncompensated care pool funds.3 

Through public assistance and indigent care programs, states and localities spent an estimated $9.9 billion on caring for the uninsured. The bulk of these payments, $7.7 billion, came from tax appropriations for indigent care programs. An estimated $2.2 billion was spent through state and local government public assistance programs.

Other federal programs examined were the Indian Health Service, which spent an estimated $2.3 billion on the uninsured (all federal funds), and community health centers which spent an estimated $1.3 billion, with $1 billion being federal payments and $0.3 billion state and local.

Table 1: Estimate of Public Funding for Uncompensated Care Costs for Uninsured by Program Type and Funding Sources Examined, 2017 ($Billions)
ProgramFunding by Program by Level of Government ($Billions)
FederalState/LocalTotal
Total Estimated Public Funding for UCC Costs for Uninsured by Payment Sources Examined$21.7$11.9$33.6
Veterans Health Administrationa$10.3NA$10.3
Medicaid Programb$8.1$1.7$9.8
UCC Pool Payments$4.6$0.8$5.4
DSH Payments$3.5$0.9$4.4
State and Local ProgramsNA$9.9$9.9
State/Local Tax Appropriations for Indigent ProgramscNA$7.7$7.7
State/Local Public AssistancedNA$2.2$2.2
Indian Health Servicee$2.3NA$2.3
Community Health Centersf$1.0$0.3$1.3
NOTES:a U.S. Department of Veteran Affairs. (2019). “Volume II Medical Programs and Information Technology Programs Congressional Submission FY 2019 Funding and FY 2020 Advance Appropriations.” http://www.va.gov/vetdata/Expenditures.asp; Huang, G., Muz, B., Kim, S., & Gasper, J. (2018). “2017 Survey of Veteran Enrollees’ Health and Use of Health Care.” Westat. https://www.va.gov/HEALTHPOLICYPLANNING/SOE2017/VA_Enrollees_Report_Data_Findings_Report2.pdf.b Medicaid and CHIP Payment and Access Commission (MACPAC). (2018, December) “MACStats: Medicaid and CHIP Data Book.” https://www.macpac.gov/wp-content/uploads/2018/12/December-2018-MACStats-Data-Book.pdf; U.S. Government Accountability Office (GAO). (2019, July). “Medicaid States’ Use and Distribution of Supplemental Payments to Hospitals.” Report to Congressional Requesters. GAO-19-603. https://www.gao.gov/assets/710/700378.pdf;  U.S. Government Accountability Office (GAO). (2014, July). “Medicaid Financing States’ Increased Reliance on Funds from Health Care Providers and Local Governments Warrants Improved CMS Data Collection.” Report to Congressional Requesters. GAO-14-627. https://www.gao.gov/assets/670/665077.pdf; U.S. Government Accountability Office (GAO). (2015, March 13). “Medicaid Financing: Questionnaire Data on States’ Methods for Financing Medicaid Payments from 2008 through 2012.” GAO-15-227SP. https://www.gao.gov/products/gao-15-227sp;MACPAC. (2019, March). “Medicaid Base and Supplemental Payments to Hospitals.” Note the link to this issue brief is no longer publicly available but formerly accessed at https://www.macpac.gov/wp-content/uploads/2018/06/Medicaid-Base-and-Supplemental-Payments-to-Hospitals.pdf.c Centers for Medicare and Medicaid Services. (2019, December). “National Health Expenditure Accounts (NHEA).” https://www.cms.gov/Research-Statistics-Data-and-Systems/Statistics-Trends-and-Reports/NationalHealthExpendData/NationalHealthAccountsHistorical.d Centers for Medicare and Medicaid Services. (2019, December). “National Health Expenditure Accounts (NHEA). ”https://www.cms.gov/Research-Statistics-Data-and-Systems/Statistics-Trends-and-Reports/NationalHealthExpendData/NationalHealthAccountsHistorical.e U.S. Department of Health and Human Services, Indian Health Service. (2018). “Indian Health Service Budget Submission Fiscal Year 2019 Congressional Justification.” https://www.ihs.gov/sites/budgetformulation/themes/responsive2017/display_objects/documents/FY2019CongressionalJustification.pdf.f U.S. Department of Health and Human Services, Health Resources & Services Administration (HRSA), Bureau of Primary Health Care. (2017). “2017 Health Center Data.”  https://bphc.hrsa.gov/uds2017/datacenter.aspx?q=tall&year=2017&state=.SOURCE: Authors’ estimates derived from secondary data.

Government payments substantially offset the cost of uncompensated care for the uninsured. In other recent work, we estimated uncompensated care costs for the nation’s uninsured averaged $42.4 billion per year in the 2015-2017 time period. Comparing this estimate to our estimate of government payments for uncompensated care in 2017 ($33.6 billion), public dollars cover nearly 80 percent of providers’ costs of caring for the uninsured.

The remaining share of uncompensated care (about 20 percent) may be covered by private sources, provider charity, or possibly transferred to other payers in the health care system. While, overall, government funding offsets nearly four-fifths of provider uncompensated care costs, it does not pay for all of these costs.  Based on our estimates, about $8.8 billion is not covered by public dollars included in this analysis.  Some of this remaining share may be accounted for by public sources not considered in this analysis, though in earlier analysis we estimate those amounts to be relatively small. Private funding sources (e.g., workers compensation, provider charity and philanthropic organizations), which we did not consider here, may also cover some of the residual share. Some of it may be also be paid for by the privately insured through increased health insurance premiums. The extent to which providers shift costs associated with shortfalls in Medicare and Medicaid payments and caring for the uninsured to private payers has been a long-standing health policy question and remains unsettled.4  While limited research has been conducted on provider cost shifting to pay for charity care associated with the uninsured,5 considerable work has examined whether hospitals charge private payers more because of shortfalls in public payments. Evidence on this question is mixed, showing that provider’s ability to do so is largely based in market power, cost shifting occurs at a relatively low rate, and when it occurs it does so well below a “dollar for dollar” shift.6 

Even if we assume, however, that all the $8.8 billion spending on the uninsured not covered by public dollars was passed to the privately insured, the effect on premiums would be small. According to the National Health Expenditures Account, spending on private health insurance premiums totaled $975.5 billion in 2017, so uncovered spending on the uninsured accounted for less than 1 percent total spending on health insurance premiums.

Looking Ahead

Even with the significant coverage expansion afforded by the ACA, provider uncompensated care costs associated with caring for the uninsured remain substantial. In other recent work, we estimate that these costs averaged $42.4 billion each year in 2015-2017. At the same time, as reported here we find that the government covers the vast majority of uncompensated care costs; we calculate that nearly 80 percent of these costs were compensated with public funding.

Importantly, though, our analysis examined providers’ uncompensated care costs and sources of public funding in the aggregate, not at the individual provider level. The federal government, states and localities support multiple programs designed to help offset provider uncompensated care costs, and targeting of payments made under these varied programs has been a longstanding issue. Thus, some providers may incur costs treating the uninsured and receive little to no compensation.

The level of provider uncompensated care is far from static. Since 2017, the level of uninsurance has increased. Between 2017 and 2019, the number of the uninsured grew by 1.5 million and may have continued to increase in 2020 due the economic downturn caused by COVID-19. So, in all likelihood, provider uncompensated care costs have also increased since 2017.

Apart from rising uninsurance, changes to government payments to cover uncompensated care costs have occurred since 2017, and more are scheduled.  Beginning in in fiscal year 2020, for example, the distribution of Medicare hospital uncompensated care payments changed so that hospital uncompensated care levels rather than Medicaid and Supplemental Security Income (SSI) days are used to allocate these payments. Estimated to total about $8.4 billion each year, this Medicare policy change provides a substantial new funding source to help offset providers’ uncompensated care costs associated with the uninsured.7  On the other hand, sizable reductions in federal Medicaid DSH allotments are scheduled. Under current law, cutbacks in federal funding totaling $8 billion each year are set to start fiscal year 2024 and run to fiscal year 2027. As policymakers undertake efforts to expand coverage and assess the financial impact of the pandemic, understanding uncompensated care costs and the adequacy of public funding can help direct policies targeted to the uninsured. With substantial public funding of uncompensated care, government costs associated with increases in coverage could be offset in part by savings in other parts of the public ledger.

Teresa A. Coughlin and Haley Samuel-Jakubos are with The Urban Institute. Rachel Garfield is with KFF.

Appendix

Technical Appendix

In this appendix, we provide a more detailed description of data sources, assumptions, and limitations used in the analysis.  The discussion is arranged by program funding source and level of spending.

As mentioned in the brief, we rely on government program data and appropriations information and other secondary data to estimate the level of public funds paid in 2017 to help offset providers’ uncompensated care costs associated with caring for the uninsured. Specifically, we examine the following funding sources: Veterans Health Administration, Medicaid DSH payments, Medicaid uncompensated care pool payments, state and local indigent care programs, and state and local public assistance programs, Indian Health Service, and community health centers.8  For direct patient payments, the estimates reflect payments made for direct medical care and services only;9  they do not include spending on non-medical related program activities (e.g., costs associated with facilities and administration). More specifically, we excluded costs associated with medical facilities, medical support and compliance, enabling services (e.g., outreach, education, community health workers, etc.), as well as long-term care services and supports.

These estimates are based on available information on program budgets as well as a series of supported assumptions about to what extent funds are directed to cover the cost of care for uninsured people. As such, there is uncertainty in these estimates.

Veterans Health Administration. The Veterans Health Administration (VHA) provides care to over 9 million veterans enrolled in the VA health care program. In 2017, the VHA spent $51.0 billion on direct medical care for veterans, which included direct medical care obligations used to support inpatient care and outpatient care, as well as dental care, mental health care, prosthetics and rehabilitation care. A 2017 national survey of VHA enrollees found that 20.2 percent of VHA enrollees lacked health coverage. Assuming that uninsured VHA enrollees incur costs proportionate to their share of the patient population, we apply the percent of uninsured VHA enrollees to the direct medical care spending to estimate that total VHA spending on care for the uninsured was $10.3 billion in 2017, all of which was federally funded (Appendix Table 1). This estimate may be an undercount if uninsured patients incur a larger share of costs relative to their share of the VHA patient population.

Appendix Table 1: Estimated Veterans Health Administration (VHA) Appropriations/Obligations Spent on Medical Care for the Uninsured, 2017 ($Billions)
VHA Appropriations for Direct Acute Medical Care Servicesa$51.0
Percent of VHA Users with No Public or Private Health Insuranceb20.2%
Estimated Direct Medical Care Spending for Uninsured$10.3
NOTES:a Estimate of VHA appropriations expenditures devoted to direct medical care services is derived from final FY 2017 national VHA budget: inpatient care ($10.7 billion) + outpatient (ambulatory) care ($29.3 billion) + dental care ($1.0 billion) + mental health care ($6.1 billion) + prosthetics ($3.2 billion) + rehabilitation care ($0.7 billion)  = $51.0 billion. Final direct medical budget appropriations for inpatient and outpatient services includes those discretionary and mandatory obligations associated with medical services and community care. U.S. Department of Veteran Affairs. (2019). “Volume II Medical Programs and Information Technology Programs Congressional Submission FY 2019 Funding and FY 2020 Advance Appropriations.” http://www.va.gov/vetdata/Expenditures.asp.b Huang, G., Muz, B., Kim, S., & Gasper, J. (2018). “2017 Survey of Veteran Enrollees’ Health and Use of Health Care.” Westat. https://www.va.gov/HEALTHPOLICYPLANNING/SOE2017/VA_Enrollees_Report_Data_Findings_Report2.pdf.SOURCE: Authors’ estimate based on U.S. Department of Veterans Affairs expenditures data: http://www.va.gov/vetdata/Expenditures.asp.

 Medicaid Program. Apart from base payments paid to hospitals, the Medicaid program also makes supplemental payments to hospitals, some of which can be targeted to help pay for uncompensated care hospitals render to the uninsured.  As set out in a 2019 report by MACPAC, Medicaid makes two types of supplemental payments that are designed, at least in part, to support uncompensated care costs hospitals incurring in caring for the uninsured: disproportionate share hospital (DSH) payments and uncompensated care pool payments.10 

Medicaid DSH payments.  Required by federal law, Medicaid DSH payments are intended to help hospitals that serve a high or disproportionate share of Medicaid and low-income patients. DSH payments can be used not only to cover the unpaid cost of caring for uninsured patients but also can help offset Medicaid shortfall—that is, the difference between a hospital’s cost of providing care to a Medicaid patient and the Medicaid payment received for providing care.  Within broad federal guidelines, states decide on what basis they allocate DSH payments among hospitals.

In 2017, Medicaid DSH payments to hospitals totaled $12.1 billion, with the federal share totaling $6.9 billion; the state share, $5.2 billion.11   To estimate what portion of these payments were available to help defray hospitals’ uncompensated care costs for the uninsured, we made several assumptions. First, we assumed that 50 percent of DSH payments went to cover uncompensated care costs for uninsured patients and 50 percent went to offset shortfalls in Medicaid base payments.  Limited information is available on how DSH funds are actually allocated. To our knowledge the most recent available information is 2019 work done by MACPAC which used 2014 DSH audit statements to examine on what basis DSH payments are distributed. MACPAC reported that nationally, in 2014, 69 percent of DSH hospital payments went to help offset the cost of caring for uninsured patients, and 31 percent went to cover Medicaid payment shortfall.12  Owing to the ACA coverage expansion, between 2014 and 2017, the number of uninsured declined while the number of Medicaid enrollees increased. Because of this decline, for this analysis we assumed that states adjusted their DSH allocations to account for these shifts in insurance coverage. If states in 2017 paid out less than 50 percent of Medicaid DSH payments to help defray uncompensated care costs, we overstate the availability of these payments to cover unpaid costs of uninsured patients.13  Alternatively, if states allocated more than 50% of their DSH payments to cover uncompensated care costs, we understate availability.

Second, we made assumptions about what share of Medicaid DSH payments represent new funding available to hospitals to help cover uncompensated care costs for the uninsured. For many years states have relied on provider taxes, inter-governmental transfers (IGTs), certified public expenditures (CPEs) and other financing mechanisms to finance their share of DSH payments rather than using revenue from state general funds, which is generally the source of funding for the state Medicaid share. Data collected by the US. General Accountability Office for state fiscal year 2012 (the most recently available information to our knowledge) found that, nationally, 63.9 percent of the state share of DSH payments used revenues from provider taxes, IGTs and similar funding types for financing; the balance of the state share (36.1 percent) of DSH payments was financed with state funds such as state general revenues.

To account for these alternative financing sources, we assumed that the state share of DSH payments raised by provider taxes, IGTs and like financing was the same in 2017 as it was in 2012. We further assumed that the state share of DSH payments financed with these alternative financing sources did not represent new funds to the hospitals. In many instances, hospitals supply the money to fund the alternative financing sources that states then used to pay the state share of DSH payments. In contrast, we assumed that the state share of the DSH payments financed with state general funds did represent new funds available to hospitals to help pay for the unpaid costs of caring for the uninsured. We similarly assumed that the entirety of the federal share of DSH payments represented new funding to hospitals available to defray the unpaid costs for the uninsured. Applying these assumptions, we estimate that $1.9 billion of the state share of DSH payments (.36 x $5.2 billion) in 2017 represents new funding to hospitals, of which 50 percent ($0.9 billion) went to help cover uncompensated care costs for the uninsured. Similarly, we estimate that 50 percent of the full federal share of DSH payments (half of $6.9 billion or $3.5 billion), were paid to hospitals to help cover uncompensated care costs for the uninsured (Appendix Table 2).  Combining the federal and state share we estimate that in 2017 $4.4 billion in Medicaid DSH payments were directed to hospitals with the goal of helping to defray the uncompensated care costs of the uninsured.

Appendix Table 2: Estimate of Medicaid Supplemental Payments Available to Fund Uncompensated Care Costs for Uninsured, 2017 ($Billions)
Potentially Available Funding ($Billions)
FederalState/LocalTotal
Estimated Medicaid Funding for Uninsured$8.1$1.7$9.8
DSH Paymentsb$3.5$0.9$4.4
UCC Pool Paymentsa$4.6$0.8$5.4
NOTES:a MACPAC. (2019, March). “Medicaid Base and Supplemental Payments to Hospitals.” Note the link to this issue brief is no longer publicly available but formerly accessed at https://www.macpac.gov/wp-content/uploads/2018/06/Medicaid-Base-and-Supplemental-Payments-to-Hospitals.pdf; U.S. Government Accountability Office (GAO). (2014, July). “Medicaid Financing- States’ Increased Reliance on Funds from Health Care Providers and Local Governments Warrants Improved CMS Data Collection.” Report to Congressional Requesters. GAO-14-627. https://www.gao.gov/assets/670/665077.pdf.b Medicaid and CHIP Payment and Access Commission (MACPAC). (2018, December) “MACStats: Medicaid and CHIP Data Book.” https://www.macpac.gov/wp-content/uploads/2018/12/December-2018-MACStats-Data-Book.pdf; U.S. Government Accountability Office (GAO). (2019, July). “Medicaid- States’ Use and Distribution of Supplemental Payments to Hospitals.” Report to Congressional Requesters. GAO-19-603.  https://www.gao.gov/assets/710/700378.pdf;  GAO. (2014, July). “Medicaid Financing States’ Increased Reliance on Funds from Health Care Providers and Local Governments Warrants Improved CMS Data Collection.” Report to Congressional Requesters. https://www.gao.gov/assets/670/665077.pdf.SOURCE:  Authors’ estimates using secondary data sources.

 Medicaid Uncompensated Care Pool Payments. In fiscal year 2017, nine states supported uncompensated care pool payments through Medicaid Section 1115 demonstrations.14  Combined, $8.0 billion in pool payments were made in 2017 across the nine states, about $4.6 billion in federal funds and $3.4 billion in state funding.15  The specifics of how pool payments are made and on what basis vary state to state; California’s Global Payment Program (accounting for nearly half, $3.8 billion, of all pool payments in 2017), for example, supported payments to cover the uninsured costs of care with a particular emphasis on providing care in appropriate, cost-effective settings.

Similar to state financing of Medicaid DSH payments, a large part of the state share of uncompensated care pool payments is financed with funds from providers and local governments through provider taxes and IGTs. According to the U.S. General Accounting Office, nationally, providers and local governments provided 78 percent of the state share of non-DSH supplemental payments in 2012.16  Consistent with our adjustment for state use of alternative funding sources in financing DSH payments, we assumed that the state share of uncompensated care pool payments paid for with these alternative sources did not represent new funds to providers. We further assumed that the state share of uncompensated care pool payments (22 percent) financed with state funds did represent new funds to providers. We also assumed that the entirety of the federal share of uncompensated care pool payments represented new funding to providers. Applying these assumptions, we estimate that $0.8 billion of the state share of uncompensated care pool payments (.22 x $3.4 billion) in 2017 represents new funding to providers. Combining this with the full federal share of uncompensated care pool payments ($4.6 billion), we estimate that $5.4 billion in Medicaid uncompensated care payments were paid to providers to help cover the unpaid costs of the uninsured in 2017 (Appendix Table 2). Between Medicaid DSH and UCC payments, we estimate that Medicaid paid $9.8 billion to help cover the cost of caring for the uninsured, with $8.1 billion in federal funds and $1.7 billion in state funds.

State and Local Tax Programs and Public Assistance. State and local governments provide funds to cover some uncompensated care costs through subsidies to providers and funding of public assistance and indigent care programs. We estimate state and local tax expenditures and spending on public assistance that goes toward uncompensated care based on the National Health Expenditure Accounts (NHEA) for 2017. There is no comprehensive information available on how these funds were used or what share went toward care for the uninsured. Mirroring our previous work in this area, we assume that 50 percent of these funds support uncompensated care costs.

Specifically, we calculated state and local tax appropriations to cover the cost of uncompensated care for the uninsured based on funds reported as “Other state and local programs” that went toward the following services: hospital ($15.3 billion), physician and other clinical services ($0.08 billion), other professional services ($0.01 billion), and prescription drugs ($0.01 billion). We assume half of these total funds support uncompensated care, leading to an estimated $7.7 billion in payments made by state and local tax appropriations in 2017 (Appendix Table 3).

For state and local public assistance spending to cover the cost of uncompensated care for the uninsured we use funds reported as “general assistance” that went toward the following services: hospital ($2.6 billion), physician and other clinical services ($0.8 billion), other professional services ($0.1 billion), and prescription drugs ($0.9 billion). We assume half of these total funds supported uncompensated care costs, leading to an estimated $2.2 billion in state and local public assistance paid in 2017 (Appendix Table 3).

Appendix Table 3: Estimate of State and Local Tax Programs and Public Assistance Programs for Medical Care for Uninsured, 2017 ($Billions)
Estimated State/Local Spending on the Uninsured$9.9
State/Local Tax Appropriations for Indigent Programs, 2017a$7.7
State/Local Public Assistance Spending on the Uninsured, 2017b$2.2
NOTES:a State and local appropriations for indigent programs reflect those public payments designated as “other state and local programs” including total hospital expenditures ($15.3 billion) + total physician and other clinician services expenditures, other professional services expenditures, and prescription drug expenditures (collectively amount to roughly $0.1 billion). Note that we assume that half of the public payments tied to these expenditures support uncompensated care.b State and local public assistance reflect those public payments designated as “general assistance” including total hospital expenditures ($2.6 billion) + total physician and other clinician services expenditures ($0.8 billion) + total other professional services expenditures ($0.1 billion) + total prescription drug expenditures ($0.9 billion). Note that we assume that half of the public payments tied to these expenditures support uncompensated care.SOURCE: U.S. Department of Health and Human Services Centers for Medicare and Medicaid Services National Health Expenditure Accounts (NHEA) CY 2017: https://www.cms.gov/Research-Statistics-Data-and-Systems/Statistics-Trends-and-Reports/NationalHealthExpendData/NationalHealthAccountsHistorical.

 Indian Health Service. In 2017, the Indian Health Service (IHS) spent $3.4 billion providing direct medical care services to American Indians and Alaska Natives. This included spending on inpatient hospital services and services provided in health clinics (e.g., outpatient care and prescription drugs) as well as referred care services which supports the delivery of health care services not available in IHS-operated facilities. To estimate how much of this spending went to care for uninsured American Indians and Alaska Native, we deducted the $1.1 billion IHS received from third-party payers from total medical spending ($3.4 billion), and estimate that IHS spent $2.3 billion caring for the uninsured in 2017, all of which was federally funded (Appendix Table 4).

Appendix Table 4: Estimate of Indian Health Service Spending for Medical Care for Uninsured, 2017 ($Billions)
Estimated Appropriations Spent on Uninsured$2.3
IHS Spending for Medical Care Services, 2017a$3.4
Collections from Public and Private Insurance<$1.1>
NOTE:a IHS spending for medical care services includes hospital and health clinic services (e.g., inpatient care, ambulatory care, labs, pharmacy, etc.), dental services, mental health, alcohol and substance abuse services, and purchased/referred care services.SOURCE: U.S. Department of Health and Human Services Indian Health Service FY 2019 Performance Budget Submission to Congress: https://www.ihs.gov/sites/budgetformulation/themes/responsive2017/display_objects/documents/FY2019CongressionalJustification.pdf.

Community Health Centers. Administrated by the federal government, the Community Health Center (CHC) program comprises 1,373 health centers which, nationwide, provided health care services to 27 million individuals. National program data report that CHCs spent $15.5 billion on direct medical care and other clinical care services (e.g., dental, mental health, and prescription drugs) in 2017.17  Patient program revenue data show that 16.9 percent of total annual charges in 2017 were attributed to self-paying patients.  Applying the share of charges attributed to self-pay patients to total spending on medical spending, we estimate that CHCs spent $2.6 billion in caring for the uninsured in 2017 (Appendix Table 5).  We then deducted total collections received from self-pay patients ($1.1 billion) and funding received from private grants and contracts for the uninsured ($0.2 billion) and estimate that CHCs spent $1.3 billion in direct care for the uninsured.

Finally, to estimate the share of CHC spending on the uninsured by type of funding source (federal, state, or local), we multiplied the estimated level of CHC spending on the uninsured ($1.3 billion) by the share of total CHC program spending by federal, state and local sources. In 2017, program data show that the federal government provided 64 percent of overall CHC program funding, and state and local governments 24 percent.18  Applying these percentages to total estimated CHC spending on the uninsured, we estimate that the federal government paid $1.0 billion and federal and state and local governments $0.3 billion (Appendix Table 5).

Appendix Table 5: Estimated Community Health Centers Uncompensated Care Costs for Uninsured, 2017 ($Billions)
Estimated Uncompensated Care Spending on Uninsured$1.3
Medical and Other Clinical Services Spendinga$15.5
Share of Total CHC Spending for Self-Pay Patientsb16.9%
Share of Medical and Other Clinical Services Spending for Self-Pay Patients$2.6
Payments made by Self-Pay Patients<$1.1>
Private Payments for Uninsuredc<$0.2>
NOTES:a CHC medical costs for 2017 included medical care ($9.4 billion) and other clinical services ($6.1 billion).b CHC patient charges in 2017 totaled $27.7 billion, 16.9 percent ($4.3 billion) were incurred by self-pay patients.c Private payments includes funding from foundation/private grants and contracts.SOURCE: Bureau of Primary Health Care, HRSA, Uniform Data System, 2017 Health Center Data: https://bphc.hrsa.gov/uds2017/datacenter.aspx?q=tall&year=2017&state=.

Endnotes

  1. The estimates in this brief include spending to cover both implicitly subsidized care (that is, the cost of care for an uninsured person with no identifiable source tied to that specific person) and care covered through alternative (non-health insurance) sources, such as payments to providers through the Indian Health Service or grants to Community Health Centers. ↩︎
  2. For example, we do not include funding from the Ryan White HIV/AIDS Program or the Title V Maternal and Child Health Services Block Grant Program. ↩︎
  3. The high share of federal funding is due to how states generally finance their share of these payments, which is through alternative financing sources such as provider taxes and intergovernmental transfers. See appendix for details. ↩︎
  4. See for example, Frakt, A.B. (2011). How Much Do Hospitals Cost Shift? A Review of the Evidence. The Milbank Quarterly,  89 (1); 90-130. DOI: 10.1111/j.1468-0009.2011.00621.x;Gruber, J. & Rodriquez, D. (2007). How much uncompensated care do doctors provide? J. of Health Economics 26,  1151-1169. DOI: 10.1016/j.jhealeco.2007.08.001;Colorado Department of Health Care Policy & Financing. (n.d.). Colorado Cost Shift Analysis. https://www.colorado.gov/pacific/hcpf/colorado-cost-shift-analysis. ↩︎
  5. One important exception to this is a study that showed that physicians provide negative to very limited uncompensated care to the uninsured. Gruber, J. & Rodriquez, D. (2007). How much uncompensated care do doctors provide? J. of Health Economics 26, 1151-1169. DOI: 10.1016/j.jhealeco.2007.08.001. ↩︎
  6. The ability to cost shift depends upon several factors, one being relative market power between hospitals and health plans. So, in some cases hospitals with substantial market power may have the ability to negotiate higher payments from insurers in response to increases in uncompensated care costs. But, Frakt finds that the preponderance of the literature as of 2011 shows that cost shifting is one strategy hospitals can adopt to make up for payment shortfall but that others (e.g., cutting costs) may be even more important. Changes to the health care market since 2011 (e.g., increased provider integration and consolidation) could shift the dynamics between payors and hospitals, in turn affecting the extent of provider cost shifting. Frakt, A.B. (2011). How Much Do Hospitals Cost Shift? A Review of the Evidence. The Milbank Quarterly, 89 (1); 90-130. DOI: 10.1111/j.1468-0009.2011.00621.x ↩︎
  7. In our analysis, we did not consider Medicare uncompensated care payments because until 2020 these payments were focused on defraying providers’ Medicaid payment shortfall not on the uninsured. Centers for Medicare and Medicaid Services. (2019, August 2). “Fiscal Year (FY)2020 Medicare Hospital Inpatient Prospective Payment System (IPPS) and Long Term Acute Care Hospital (LTCH) Prospective Payment System (CMS-1716-F).” https://www.cms.gov/newsroom/fact-sheets/fiscal-year-fy-2020-medicare-hospital-inpatient-prospective-payment-system-ipps-and-long-term-acute-0. ↩︎
  8. Unlike in our previous work on this topic, we do not include Medicare payments as a funding source for uncompensated care for the uninsured. While Medicare makes DSH and uncompensated care payments, in 2017 these payments were not directed to covering uncompensated care costs for the uninsured. Centers for Medicare and Medicaid Services. (2016, August 2). “Hospital Inpatient Prospective Payment System (IPPS) and Long Term Acute Care Hospital (LTCH) Final Rule Policy and Payment Changes for Fiscal Year (FY) 2017.” https://www.cms.gov/newsroom/fact-sheets/hospital-inpatient-prospective-payment-system-ipps-and-long-term-acute-care-hospital-ltch-final-rule. Specifically, in 2017 Medicare DSH payments were paid based on the level of a hospital’s Medicaid inpatient days, and Medicare uncompensated care payments were allocated based on a combination of the number of a hospital’s inpatient Medicaid days and the number of Medicare days for low-income Medicare patients who received Supplemental Security Incomes (SSI). In other words, in 2017 Medicare DSH and uncompensated care payments were largely directed at making up for the shortfall in Medicaid base payment, not uncompensated care for the uninsured. For more on this topic, see Stensland, J., Gaumer, Z.R., & Miller, M.E. (2016). Contrary To Popular Belief, Medicaid Hospital Admissions Are Often Profitable Because Of Additional Medicare Payments. Health Affairs, 35 (12), 2282- 2288. https://www.healthaffairs.org/doi/pdf/10.1377/hlthaff.2016.0599.  Importantly, beginning in fiscal year 2020 the way in which Medicare uncompensated care payments are distributed changed: Hospital uncompensated care levels (as reported in the Medicare cost report) rather than Medicaid and SSI days will be used to allocate Medicare uncompensated care payments, which are estimated to total about $8.4 billion. Centers for Medicare and Medicaid Services. (2019, August 2). “Fiscal Year (FY)2020 Medicare Hospital Inpatient Prospective Payment System (IPPS) and Long Term Acute Care Hospital (LTCH) Prospective Payment System (CMS-1716-F).” https://www.cms.gov/newsroom/fact-sheets/fiscal-year-fy-2020-medicare-hospital-inpatient-prospective-payment-system-ipps-and-long-term-acute-0. Another source of Medicare funding for uncompensated care for the uninsured that we included in previous work was Medicare Indirect Medical Education or IME payments which compensate teaching hospitals for the indirect costs of activities associated with medical teaching that add to the cost of treating Medicare patients. Similar to the distribution of Medicare DSH and uncompensated care payments in 2017, IME payments are paid out as a percentage add-on to a hospital’s inpatient Medicare payments and do not consider uncompensated care costs for uninsured in determining payment. The costs of uncompensated care for the uninsured is not part of the Medicare IME distribution formula.  http://www.medpac.gov/-public-meetings-/meeting-details/september-2019-public-meeting. ↩︎
  9. See note 1. ↩︎
  10. In addition to DSH and uncompensated care pool payments, states can also make other Medicaid hospital supplemental payments. As identified by the Medicaid and CHIP Payment and Access Commission (MACPAC) these are upper payment limit (UPL) payments, delivery system reform incentive (DSRIP) payments, and graduate medical education (GME) payments. MACPAC. (2019, March). “Medicaid Base and Supplemental Payments to Hospitals.” Note the link to this issue brief is no longer publicly available but formerly accessed at https://www.macpac.gov/wp-content/uploads/2018/06/Medicaid-Base-and-Supplemental-Payments-to-Hospitals.pdf;  Unlike DSH and uncompensated care pool payments, however, UPL, DSRIP and GME payments are not intended to help hospitals cover the unpaid costs of the uninsured but rather are designed to support other purposes. For example, UPL payments are meant to supplement Medicaid hospital fee-for-serve base payments that in recent years many states have reduced or frozen. U.S. Government Accountability Office (GAO). (2019, July). “Medicaid States’ Use and Distribution of Supplemental Payments to Hospitals.” Report to Congressional Requesters. GAO-19-603. https://www.gao.gov/assets/710/700378.pdf. DSRIP payments, which are made available under some Medicaid Section 1115 demonstrations, are not intended to pay for medical services but rather are designed to help providers (hospitals and others) undertake infrastructure and other investments to improve access to and quality of care provided to Medicaid enrollees. Finally, GME payments are designed to support teaching hospitals in their efforts to train medical professionals, among other things. Given this, we do not include UPL, DSRIP and GME payments as funding for uncompensated care costs associated with the uninsured. ↩︎
  11. In addition to community-based acute care hospitals, Medicaid DSH payments are also paid to institutions for mental diseases or IMDs. To better align with our uncompensated care estimate based on the MEPS, which excludes individuals residing in institutions from the survey sample, we exclude IMD DSH payments from this analysis. Medicaid and CHIP Payment and Access Commission (MACPAC). (2018, December) “MACStats: Medicaid and CHIP Data Book.” https://www.macpac.gov/wp-content/uploads/2018/12/December-2018-MACStats-Data-Book.pdf. ↩︎
  12. States are statutorily required to submitting DSH audit data to CMS; at the time of MACPAC 2019 report 2014 was the latest year for which data were available. MACPAC. (2019, June). Report to Congress on Medicaid and CHIP June 2019. Chapter 2: Treatment of Third-Party Payments in the Definition of Medicaid Shortfall. https://www.macpac.gov/wp-content/uploads/2019/06/Treatment-of-Third-Party-Payments-in-the-Definition-of-Medicaid-Shortfall.pdf. ↩︎
  13. Increasingly, states have relied on Medicaid UPL payments to help cover the Medicaid shortfall. In 2017, states paid $12.9 billion in hospital UPL payments, higher than the $12.1 billion states paid in DSH in the year. MACPAC. (2019, March). “Medicaid Base and Supplemental Payments to Hospitals.” Note the link to this issue brief is no longer publicly available but formerly accessed at https://www.macpac.gov/wp-content/uploads/2018/06/Medicaid-Base-and-Supplemental-Payments-to-Hospitals.pdf.Given the scale of state use of hospital UPL payments, it is plausible, though not certain, that a sizable share of Medicaid DSH payments is targeted to cover unpaid costs of the uninsured. ↩︎
  14. The nine states: Arizona, California, Florida, Hawaii, Indiana, Kansas, New Mexico, Tennessee and Texas. MACPAC. (2019, March). “Medicaid Base and Supplemental Payments to Hospitals.” Note the link to this issue brief is no longer publicly available but formerly accessed at https://www.macpac.gov/wp-content/uploads/2018/06/Medicaid-Base-and-Supplemental-Payments-to-Hospitals.pdf. ↩︎
  15. ibid. ↩︎
  16. In addition to Medicaid uncompensated care pool payments, the GAO study included UPL payments and other add on payments in its non-DSH supplemental payment category. Similar to DSH payments, we considered the category of other sources of funding (e.g., tobacco settlement funds) as state funds for non-DSH supplemental payments. U.S. Government Accountability Office (GAO). (2015, March 13). “Medicaid Financing: Questionnaire Data on States’ Methods for Financing Medicaid Payments from 2008 through 2012.” GAO-15-227SP. https://www.gao.gov/products/gao-15-227sp. ↩︎
  17. Note that we have excluded expenditures for enabling services such as outreach, case management, transportation services, as well as facility and non-clinical support services. Bureau of Primary Health Care, Health Resources and Services Administration (HRSA). (n.d.) Uniform Data System, 2017 Health Center Data. https://bphc.hrsa.gov/uds2017/datacenter.aspx?q=tall&year=2017&state=. ↩︎
  18. At 12 percent, private sources accounted the rest of Community Health Center (CHC) funding. Health Resources and Services Administration (HRSA). (n.d.). Health Center Program Data Table 9E. https://data.hrsa.gov/tools/data-reporting/program-data/national/table?tableName=9E&year=2017. ↩︎
News Release

KFF/Post Survey Reveals the Serious Mental Health Challenges Facing Frontline Health Care Workers a Year into the COVID-19 Pandemic

8 in 10 Say Potentially Being Exposed to COVID-19 at Work and Putting Family Members at Risk are Sources of Stress

Published: Apr 6, 2021

About 1 in 6 Tested Positive for COVID-19, though Few Experienced Major Symptoms; Those Working in Nursing Homes or Assisted Living Facilities Most Likely to Report Testing Positive

More than a year into the COVID-19 pandemic, a majority of frontline health care workers say the crisis is taking a toll on their mental health, including about 3 in 10 who either received mental health services or thought they needed them directly as a result of the pandemic, a KFF/The Washington Post national survey finds.

Most (62%) frontline health care workers say that worry and stress related to the pandemic has negatively affected their mental health, the survey of all frontline health care workers shows. At least 4 in 10 frontline health care workers say that the pandemic has negatively impacted their physical health (49%), and their relationships with family members (42%) and coworkers (41%).

Sizeable shares report experiencing sleep-related problems (47%), frequent headaches or stomachaches (31%), and increased alcohol or drug use (16%) that they attribute to pandemic-related worry and stress. More than half (56%) report experiencing at least one of these three issues.


About 8 in 10 frontline health care workers say concerns about being exposed to COVID-19 at work and exposing others in their household have been sources of stress during the past year, including at least 4 in 10 who say these concerns were “major sources of stress.” A smaller majority (63%) say concern about having enough personal protective equipment has been a source of stress.

For about 3 in 10 frontline health workers, the mental health challenges led them to obtain mental health care or medications (13%) or to think that they needed such services but didn’t get them (18%). Among those who felt they needed but didn’t get mental health care, the most commonly cited reasons are because they were too busy (27%), they were afraid or embarrassed about seeking care (17%), they couldn’t afford it (16%), or they couldn’t get time off work (14%).

The survey results show that younger frontline health care workers (those under age 30) seem to be the hardest hit, with three quarters (75%) reporting that the pandemic has had a negative impact on their mental health, and nearly as many (69%) saying they feel “burned out.”

About 1 in 6 frontline health care workers (16%) say they tested positive for COVID-19 at some point during the pandemic. The share who contracted COVID-19 was somewhat higher among those working in nursing homes or assisted care facilities (24%) than in hospitals (18%), doctor’s offices or clinics (14%), or home health care (8%).

About a quarter of those who tested positive (4% of all health care workers) say they experienced “major symptoms,” while the rest reported only minor symptoms or no symptoms at all.

The findings come from the latest KFF/Post partnership survey, which examines the experiences of frontline health care workers during the COVID-19 pandemic. Frontline health care workers include those who come into contact with patients or bodily fluids across many different aspects of patient care, including diagnosis and treatment, administrative duties, and assisting with as bathing, eating, cleaning, exercising, and housekeeping. Findings appear in The Washington Post and in a KFF report.

More than half (56%) of those who worked in hospitals say their intensive-care units were overcapacity at some point during the pandemic, and a third (34%) of those who worked at hospitals or nursing homes say that at some point they ran out of personal protective equipment.

Other findings include:

  • A slim majority (56%) of frontline health care workers who are not self-employed say that their employer is “falling short” in providing hazard pay for those who work in the most high-risk situations. Fewer say their employer is “falling short” in providing adequate paid sick leave (33%) or ensuring employees can get vaccinated (12%).
  • Most frontline health workers (58%) don’t expect Americans to be able to safely return to normal life until 2022. Smaller shares expect a return to normal by mid-summer (24%) or between mid-summer and mid-fall (18%).
  • When asked to describe in their own words what the hardest part of working during the pandemic has been, similar shares say that it was being worried about getting exposed to and sick from COVID-19 or exposing family members (21%) and having to wear masks and other personal protective equipment (16%).  Fewer cited other concerns such as safety protocols and precautionary measures (8%) and being overworked with long hours and lack of time off (7%).

The project, the 35th KFF/The Washington Post partnership survey, includes interviews with a nationally representative sample of 1,327 frontline health care workers (direct contact with patients and their bodily fluids), representing hospitals, doctors’ offices, outpatient clinics, nursing homes and assisted care facilities, and those working in home health care. The sample includes workers who work in many, and multiple, different aspects of patient care including patient diagnosis and treatment, administrative duties, and/or assisting with patient care such as bathing, eating, cleaning, exercising, and housekeeping. The survey also included a comparison survey allowing researchers to compare the group of frontline healthcare workers to the general population, that included 971 U.S. adults not working as frontline health care workers. The margin of sampling error for the group of frontline health care workers is 3 percentage points, national comparison sample is 4 percentage points. For results based on subgroups, the margin of sampling error may be higher.

Poll Finding

KFF/The Washington Post Frontline Health Care Workers Survey

Published: Apr 6, 2021

Overview

This partnership survey from the Kaiser Family Foundation (KFF) and The Washington Post examines the experiences and attitudes of frontline health care workers during the coronavirus pandemic. These individuals, who work across many different health care fields including doctors and nurses, nursing home managers, front desk clerks, as well as those who assist with patient care such as bathing, eating, cleaning, exercising, or housekeeping, have been on the front lines of an industry providing care for the sickest adults.

The project includes interviews with a nationally representative sample of 1,327 frontline health care workers (those with direct contact with patients and their bodily fluids), representing hospitals, doctors’ offices, outpatient clinics, nursing homes and assisted care facilities, and those working in home health care. The sample includes workers who work in many, and multiple, aspects of patient care. The project also includes a comparison survey allowing researchers to compare the group of frontline health care workers to the general population, that included 971 U.S. adults not working as frontline health care workers.

This is the first release from this comprehensive survey focusing on the intentions among frontline health care workers to get vaccinated, and the factors influencing those decisions. Upcoming releases will focus on the emotional, physical, and financial toll of the last year on frontline health care workers.

This survey is the 35th in a series of surveys dating back to 1995 that have been conducted as a part of The Washington Post/KFF Survey Project.

Read The Washington Post’s reporting on frontline health care workers:

More than 4 in 10 health-care workers have not been vaccinated, Post-KFF poll finds

Yes, vaccine skepticism exists among health-care workers — but far less so among top medical professionals

Should health-care workers be required to get coronavirus shots? Companies grapple with mandates.

Stress on the front lines of covid-19: Health-care workers share the hardest parts of working during the pandemic.

Burned out by the pandemic, 3 in 10 health-care workers consider leaving the profession

Vaccine Intentions

KFF/Washington Post Frontline Health Care Workers

The latest partnership survey from the Kaiser Family Foundation (KFF) and The Washington Post examines the experiences and attitudes of frontline health care workers during the coronavirus pandemic. More than one year into a global pandemic that has infected almost 29 million Americans including more than 500,000 who have died due to the coronavirus, one of the most directly impacted groups has been frontline health care workers. These individuals, who work across many different health care fields including doctors and nurses, nursing home managers, front desk clerks, as well as those who assist with patient care such as bathing, eating, cleaning, exercising, or housekeeping, have been on the front lines of an industry providing care for the sickest adults. The spread of COVID-19 throughout the country overwhelmed many health care settings with intensive care units at capacity and other facilities struggling to keep both patients and employees safe. Now, with three COVID-19 vaccines currently being distributed to adults across the country, this project takes a look at the toll of the last year on frontline health care workers.

The project includes interviews with a nationally representative sample of 1,327 frontline health care workers (direct contact with patients and their bodily fluids), representing hospitals, doctors’ offices, outpatient clinics, nursing homes and assisted care facilities, and those working in home health care. The sample includes workers who work in many, and multiple, different aspects of patient care including patient diagnosis and treatment (n=636), administrative duties (n=251), and/or assisting with patient care such as bathing, eating, cleaning, exercising, and housekeeping (n=526). The survey also included a comparison survey allowing researchers to compare the group of frontline health care workers to the general population, that included 971 U.S. adults not working as frontline health care workers. For more information about sampling and method of recruitment, see methodology.

This survey is the 35th in a series of surveys dating back to 1995 that have been conducted as a part of The Washington Post/KFF Survey Project.

Vaccine Intentions Among Frontline Health Care Workers

As of early March, just over half (52%) of frontline health care workers say they have received at least one dose of a COVID-19 vaccine, including 42% who have received both doses. This leaves 48% of frontline health care workers who have not yet received a COVID-19 vaccine despite the fact that health care workers who have direct contact with patients were the among the first groups prioritized for vaccine access across all states (NOTE: the survey was fielded February 11- March 7th, 2021, at the start of which both the Pfizer vaccine and Moderna vaccine had already received emergency use authorization from the Food and Drug administration, the Johnson & Johnson single dose vaccine was authorized during the survey field period on February 27, 2021).

Majorities of health care workers working in hospitals (66%) and outpatient clinics (64%) say they have received a COVID-19 vaccine, compared to half of those working doctors’ offices (52%), or in nursing homes or assisted care facilities (50%), and just one in four (26%) home health care workers. Similarly, about seven in ten (68%) of those responsible for patient diagnosis and treatment like a doctor or a nurse report receiving a COVID-19 vaccine, compared to about four in ten of those who perform administrative duties (44%) or who assist with patient care such as bathing, eating, cleaning, exercising, and housekeeping (37%).

Less than half of Black frontline health care workers (39%) and Hispanic frontline health care workers (44%) report personally receiving a COVID-19 vaccine, compared to six in ten (57%) White health care workers, mirroring the disparities found in vaccine uptake rates among the national adult population. While the KFF COVID-19 Vaccine Monitor has found a steady increase in the share of Black adults and Hispanic adults who report being vaccinated for COVID-19 or saying they will get the vaccine as soon as it’s available to them, these populations remain more likely than White adults to say they’re waiting to see how the vaccine works for other people before getting vaccinated themselves.

The unvaccinated group includes one in five frontline health care workers who either have their vaccine scheduled (3%) or who plan to get vaccinated but haven’t scheduled it yet (15%), as well as 12% who have not decided whether they will get vaccinated, and one in five (18%) who say they do not plan on receiving a COVID-19 vaccine. About three in ten (28%) of Black health care workers say they do not plan on getting vaccinated, as do one-fourth of health care workers working in nursing homes or assisted care facilities (24%) or providing patient in-home care (23%), those who assist with patient care (24%), and health care workers without a college degree (24%).

WHY ARE NEARLY HALF OF HEALTH WORKERS NOT VACCINATED? The Role of employers

The role of employers in getting frontline health care workers vaccinated may be a factor for the nearly half of frontline health care workers who say they have not received a COVID-19 vaccine. Reflecting the overall vaccination rates among frontline health care workers, the share of workers who were offered a COVID-19 vaccine from their employer was much lower among those working in patients’ homes. One in three home health care workers (34%) say they have either been offered or received a COVID-19 vaccine from their employer compared to eight in ten of those working in hospitals (80%), and majorities working in nursing homes or assisted care facilities (72%), outpatient clinics (64%), and doctors’ offices (50%).

More than eight in ten (84%)  vaccinated health care workers who are not self-employed say they received a COVID-19 vaccine from their employer, including 93% of vaccinated workers who work in a hospital, 90% of those working nursing homes or assisted care facilities, eight in ten of those working doctor’s office (79%) or outpatient clinics (79%), and seven in ten (69%) home health care workers. About one in five (17%) vaccinated health care workers who provide in-home care say they received a COVID-19 vaccine from their state or county health department.

The vast majority of health care workers who were able to get vaccinated through their employer say it was easy to schedule their COVID-19 vaccine, including 70% who say it was “very easy.” On the other hand, four in ten (41%) of the vaccinated health care workers who did not get a vaccine from their employer (16% of all non-self employed vaccinated frontline health care workers) say it was difficult to schedule. The majority of self-employed frontline health care workers had not received a COVID-19 vaccine (61%).

Among those who are not self-employed and have not received a COVID-19 vaccine but are planning to get vaccinated or have a vaccine appointment scheduled, six in ten say they plan on getting it through their employer (60%) while 6% say they were offered it from their employer are planning to get it somewhere else. An additional 28% say they were not offered a COVID-19 vaccine from their employer.

WHY ARE NEARLY HALF OF HEALTH WORKERS NOT VACCINATED? Concerns About Safety And Efficacy

Concerns about vaccine safety and effectiveness are major factors why some frontline health care workers say they have not received a COVID-19 vaccine. Among the nearly half of health care workers who have not received a COVID-19 vaccine, eight in ten say worries about potential side effects (82%) and thinking the vaccine is too new and wanting to wait to see how it works for others (81%) are major factors in their decisions on whether to get vaccinated. In addition, two-thirds (65%) say distrust in the government to ensure safety and effectiveness is a major factor. The concerns of the unvaccinated health care workers mirror the concerns among the general public and highlight challenges for national vaccination adoption.

The top concerns are consistent across key demographic groups, with larger shares saying side effects and newness of the vaccines are major factors in their decision to not get a COVID-19 vaccine than lack of trust in the government (but still a majority say it is a major factor). Notably, three-fourths of Black health care workers who have not received a COVID-19 vaccine (77%) say distrust of the government to ensure safety and effectiveness is a major factor in their decision, compared to smaller shares of White and Hispanic health care workers (60% and 61%).

While large majorities of unvaccinated health care workers say worries about possible side effects are a major factor why they haven’t been vaccinated, few (6%) vaccinated health care workers report experiencing major side effects. The majority of vaccinated health care workers (60%) say they experienced minor side effects and one-third (34%) say they didn’t experience any side effects. The most commonly reported major side effects include pain (4%), headaches (3%), fever (3%), tiredness (3%), and chills (2%). According to the Centers for Disease Control and Prevention, most of these reported side effects would be classified as mild to moderate, and are common.

Majorities of frontline health care workers and the general public are confident that the COVID-19 vaccines available in the U.S. have been tested for safety and effectiveness. More than six in ten are confident vaccines being used in the U.S. have been properly tested for safety and effectiveness (64% and 65%, respectively), but still more than one-third of frontline health care workers say they are not confident (36%). Among health care workers, views on the safety and effectiveness of the vaccines are largely connected to vaccine intent with seven in ten (71%) of those who are confident in the vaccines’ safety and effectiveness reporting receiving at least one dose of a vaccine, compared to 17% of those who are less confident.

Overall confidence in the U.S.’s testing of the vaccines differs among race and ethnic groups, education levels, and partisanship, both among health care workers and the public overall. Large shares of Black adults, adults without a college degree, and Republican and Republican-leaning adults say they are not confident the COVID-19 vaccines have been properly tested for safety and effectiveness. Among frontline health care workers, these groups are also the groups in which one in five say they will definitely not receive a COVID-19 vaccine.

Views of the safety and effectiveness of the vaccine are different among Republican health care workers and total Republican adults at higher levels of education. Seven in ten Republican health care workers with a college degree (69%) and more than eight in ten (85%) Republican health care workers with a post-graduate degree are confident that the vaccines have been properly tested and approved. This is compared to around six in ten of total Republican adults with higher levels of education who are confident.

These differing views of the safety and efficacy of the vaccines may also be related to vaccine intent with majorities of Republican health care workers with a college degree (57%) and a post-graduate degree (69%) say they have received at least one dose of a COVID-19 vaccine, compared to 37% of Republican health care workers with less than a college degree.

Toll Of The Pandemic

The Toll Of The Coronavirus Pandemic On Health Care Workers

The report, based on findings from the KFF/Washington Post Frontline Health Care Workers Survey, explores the coronavirus pandemic through the lens of a frontline health care worker in the U.S.. This survey is the 35th in a series of surveys dating back to 1995 that have been conducted as a part of The Washington Post/Kaiser Family Foundation Survey Project and includes interviews with a nationally representative sample of 1,327 frontline health care workers (those with direct contact with patients and their bodily fluids), representing people working in hospitals, doctors’ offices, outpatient clinics, nursing homes and assisted care facilities, and those working in home health care. The sample includes workers who work in many, and multiple, aspects of patient care. The survey also included a comparison survey of 971 U.S. adults not working in health care. See Appendix A for the demographic profile of the frontline health care workers included in this project.

More than one year after COVID-19 overwhelmed the U.S. health care system, the Frontline Health Care Workers Survey finds that some health care workers are now seeing the light at the end of the tunnel as the vaccine roll-out continues. But with less than half of health care workers reporting receiving a COVID-19 vaccine and majorities of frontline health care workers saying they have experienced adverse mental health impacts from the pandemic, this analysis also finds that there may be some longer term impacts on those who were at the forefront during this global pandemic.

  • The coronavirus pandemic has had a major impact on the mental health of frontline health care workers. A majority of frontline health care workers (62%) say worry or stress related to COVID-19 has a negative impact on their mental health. In addition, more than half (56%) of all frontline health care workers say that worry or stress related to COVID-19 has caused them to experience trouble with sleeping or sleeping too much (47%), frequent headaches or stomachaches (31%), or increased alcohol or drug use (16%). In addition, 13% of health care workers say they have received mental health services or medication specifically due to worry or stress related to COVID-19 and an additional one in five (18%) say they thought they might need such services, but did not get them.
  • The youngest health care workers (18-29 years old) seem to have been hit hardest by working during a global pandemic. Three-fourths of younger frontline health care workers report worry or stress related to COVID-19 has had a negative impact on their mental health and seven in ten say they feel “burned out” about work. These feelings may be directly tied to their work experiences during the COVID-19 pandemic as four in ten of these youngest workers are working in a hospital setting and nearly half (45%) report assisting with patient care such as bathing, cleaning, and housekeeping. And, almost one in eight (13%) of 18-29 year old frontline health care workers say they had at least 10 patients in their direct care who died as a result of COVID-19.
  • Throughout the past year, news reports have told of hospitals running low on personal protective equipment (PPE) and at over-capacity for the intensive care units. This experience seems relatively common among the hardest hit frontline health care workers. Over half (56%) of health care workers in hospitals say that their workplace reached over-capacity of ICU beds to treat critical patients, and one third (34%) of health care workers working in either hospitals or nursing homes say that at some point during the pandemic, their workplace ran out of PPE for its employees. And while most health care workers say their employer is “doing about the right amount” or “going above and beyond” when it comes to providing sick leave to employees who had COVID-19 or ensuring employees have the ability to get vaccinated, more than half of health care workers – including a majority of health care workers across different types of health care settings including hospitals (59%), office or clinic (52%), nursing home or assisted care facility (58%), and those who work in patient homes (56%) – say their employer is “falling short” when it comes to providing additional pay for employees who are working in the most high-risk situations.
  • The survey also finds some optimism among frontline health care workers with most health care workers across workplaces and across race and ethnicity saying that the COVID-19 outbreak in the U.S. is at least “somewhat under control” including one fourth who say it is “mostly under control” or “completely under control.” Nearly six in ten frontline health care workers also say they anticipate the COVID-19 pandemic in the U.S. to be controlled enough so that people can resume normal life by early 2022 or later, while 47% say normal life can resume by mid-fall or sooner—including 5% who say life can safely resume in the U.S. now.

Majorities Of Health Care workers Report feeling hopeful, But significant shares also report negative feelings

More than one year into a global pandemic, the KFF/Washington Post Frontline Health Care Workers Survey finds three-fourths (76%) of frontline health care workers saying they feel “hopeful” when going to work these days. Majorities also say they feel “optimistic” (67%) and motivated (63%). Yet, about half also say they feel “ burned out” (55%) or “anxious” (49%). About one in five (21%) say they feel “angry” when they go to work these days.

The share of frontline health care workers who report feeling these emotions does not vary drastically across places where they work (hospital, nursing home, office or clinic, or providing in-home care), but there are some differences depending on their direct experience with the coronavirus. Nearly one-third of frontline health care workers who had a patient die as a result of COVID-19 (32%) or they themselves tested positive for COVID-19 (29%) report feeling “angry.”

Younger health care workers are more likely to report negative emotions than their older counterparts. Seven in ten (69%) frontline health care workers between the ages of 18 and 29 say they feel “burned out” compared to 59% of health care workers between the ages of 30 and 49, 43% of those ages 50 to 64 years, and 27% of health care workers who are ages 65 and older. Three in ten frontline health care workers ages 18-29 also report feeling “angry” about going into work these days. A smaller share of younger health care workers (49 years and younger) also report feeling positive emotions, such as hopeful, optimistic or motivated about going to work than their older counterparts (50 and older).

Young Health Care Workers Report Feeling COVID-19 Burden The Hardest

The youngest group of frontline health care workers are more likely to report feeling negative emotions about their work, but this may be directly tied to their work experiences during the COVID-19 pandemic. Four in ten 18-29 year old adults (41%) report working in a hospital setting (which saw the most severe COVID-19 cases) and nearly half (45%) worked directly assisting with patient care such as bathing, cleaning, and housekeeping, while a smaller share reporting being responsible for patient diagnosis (37%) or administrative tasks (27%).Seven in ten 18-29 year old frontline health care workers say they have had to work more hours or work harder as a result of the COVID-19 pandemic, compared to 59% of 50-64 year olds, and half of those ages 65 and older (49%). A larger share of 18 to 29 year olds also report directly caring for the sickest patients suffering from COVID-19. Six in ten 18-29 year old frontline health care workers (61%) say they worked directly with COVID-19 patients during the past year, including three in ten who treated patients who died as a result of COVID-19. Thirteen percent of 18-29 year old frontline health care workers say they had at least 10 patients in their direct care who died as a result of COVID-19.

How would you describe the work that you do?(% of 18-29 year old frontline health care workers)

Responsible for administrative duties like a nursing home manager/front desk clerk: 27%Responsible for patient diagnosis and treatment like a doctor or a nurse: 37%Responsible for assisting with patient care like bathing, eating, housekeeping: 45%

The Mental health Burden

A majority of frontline health care workers (62%) say worry or stress related to COVID-19 has a negative impact on their mental health. A smaller share, but still at least four in ten say the same about their physical health (49%), relationships with family members (42%), and relationships with coworkers (41%). While the share of frontline health care workers who say their mental health has been negatively impacted is similar to the share of the public overall, there are some key groups that report disproportionate impacts.

Once again, the burden seems to be hardest hit on the youngest group of frontline health care workers. Four in ten 65 and older frontline health care workers report that worry or stress related to COVID-19 has had a negative impact on their mental health, as do a majority of 50-64 year olds (51%) and 30-49 year olds (65%); yet an even larger share of 18-29 year olds report the same (75%).

More than half (56%) of all frontline health care workers say that worry or stress related to COVID-19 has caused them to experience trouble with sleeping or sleeping too much (47%), frequent headaches or stomachaches (31%), or increased alcohol or drug use (16%). In addition, 13% of health care workers say they have received mental health services or medication due to worry or stress related to COVID-19 and an additional one in five (20%) say they thought they might need such services but did not get them. Among those who felt they needed but didn’t get mental health care , the most commonly cited reasons are because they were too busy (27%), they were afraid or embarrassed about seeking care (17%), they couldn’t afford it (16%), or they couldn’t get time off work (14%).

Three in ten frontline health care workers say that as a result of the COVID-19 pandemic, they have considered no longer working in health care. This includes at least one-third of those working in administrative tasks or assisting with patient care like bathing and cleaning. One-fourth of those responsible for patient treatment and diagnosis like doctors and nurses say they considered leaving health care as a result of the COVID-19 pandemic.

One group that disproportionately reports higher rates of considering leaving health care (48%) are those who worked in places like hospitals and nursing homes during the pandemic and their facilities ran out of PPE and where the ICU was over capacity.

The Hardest Part Of The Pandemic? Concerns Over Safety For Both Themselves And Their Family Members

When asked to say in their own words, one in five frontline health care workers say the hardest part of working during the COVID-19 pandemic was their worry about getting exposed to the coronavirus or getting sick from the virus themselves or exposing their family members (21%). This is closely followed by 16% who say having to wear personal protective equipment (PPE) was the hardest part of work. Fewer offer responses like precautionary measures/safety protocols (8%),  long hours and lack of time off (7%), not enough PPE or other supplies (5%), patients being isolated (5%), or dealing with stress, anxiety, or fear (5%) as the hardest part of working during the COVID-19 pandemic.

IN THEIR OWN WORDS: Thinking about your work in health care delivery settings, what has been the hardest part of working during the COVID-19 pandemic?“Dealing with people that are positive or suspected positive and wearing all the PPE layers can take a burden on your mind.” –59 year old man, responsible for assisting with patient care in a nursing home or assisted living facility, Wisconsin

“Coming in contact with it and not knowing who came into contact with it so we weren’t protected.” –59 year old woman, responsible for assisting with patient care in a nursing home or assisted living facility, Michigan

“I work in the Emergency Department and at the height of the pandemic – December, January – we couldn’t keep up with the capacity of patients, both Covid and not, that were coming into the hospital. The staff was overwhelmed, the resources were running out, and our exposure to Covid was extremely high. It was terrible, honestly, and scary.” –38 year old woman, responsible for administrative duties in a hospital, Pennsylvania

“Trying not to get infected [and] covid 19 skeptics. It’s very irritating to have people come in and downplay the importance of masks.” –65 year old woman, responsible for patient treatment and diagnosis at a doctor’s office and outpatient clinic, Montana

“Entering covid positive rooms. My patients aren’t in the hospital for covid but are tested for it. It’s difficult to do my job effectively with all the PPE on though I am thankful for it. It is also stressful to have to enter a Covid positive room.” –53 year old woman, responsible for patient treatment and diagnosis in a hospital, Ohio

“The extra steps needed when I come home from working with Covid patients. [I] have to undress in the garage and straight to the shower. Sometimes making my son sleep overnight at his grandmas when I have seen Covid patients that day.” –33 year old woman, responsible for patient treatment and diagnosis, in-home patient care, Missouri

“Stress and anxiety levels to do work and help keep patients calm. Extra workload.” –59 year old woman, responsible for patient treatment and diagnosis in an outpatient clinic, Minnesota

“Trying to stay protected and protect patients without supportive management.” –31 year old woman, responsible for patient treatment and diagnosis in a doctor’s office, Texas

Many health care workers report that they did get sick from coronavirus in the past year, but few experienced major symptoms. One in six frontline health care workers say they tested positive for COVID-19, including 8% who say both they and someone else in their household tested positive. An additional 11% say someone in their household tested positive but they did not. One-fourth of frontline health care workers working in nursing homes or assisted care facilities say they tested positive for COVID-19 (24%) compared to less than one in five working in hospitals (18%), doctor’s offices or clinics (14%), or providing in-home care (8%).

Among health care workers who tested positive, one-fourth (4% of all health care workers) say they experienced “major symptoms” while most say they experienced “minor symptoms” (72% of those who tested positive and 12% of all health care workers). One in twenty say they tested positive but didn’t experience any symptoms (1% of all health care workers).

About eight in ten frontline health care workers say that concern about being exposed to COVID-19 at work and exposing others in their household has been sources of stress during the past year, including at least four in ten who say these concerns were a “major source of stress.” A smaller share, but still a majority (63%), say concern about having enough personal protective equipment (PPE) has been a source of stress.

While there are no differences in sources of stress across the different types of work or places they work with majorities all saying these were all at least minor sources of stress, there is a connection between mental health and sources of stress. Among frontline health care workers who reported experiencing adverse mental health impacts from the pandemic (six in ten of total frontline health care workers), about nine in ten say concerns about being exposed to COVID-19 at work or concern about exposing others in their household to COVID-19 were sources of stress.

Views Of their Employers

Throughout the past year, news reports have told of hospitals running low on personal protective equipment (PPE) and surpassing their capacity in intensive care units.  This experience is common among the hardest hit frontline health care workers. Over half (56%) of health care workers in hospitals say that their workplace reached over-capacity of ICU beds of places to treat critical patients, and one third (34%) of health care workers in either hospitals or nursing homes say that at some point during the pandemic, their workplace ran out of PPE for its employees.

And while most health care workers say their employer is “doing about the right amount” or “going above and beyond” when it comes to providing sick leave to employees who had COVID-19 (66%) or ensuring employees have the ability to get vaccinated (88%), more than half of health care workers who are not self-employed say their employer is “falling short” when it comes to providing additional pay for employees who are working in the most high-risk situations (56%).

A majority of health care workers across different types of health care settings including hospitals (59%), office or clinic (53%), nursing home or assisted care facility (58%), and those who work in patient homes (56%) say their employer is “falling short” in providing additional pay for employees working in high-risk situations.

Despite these issues, eight in ten health care workers say that they think the general public has shown a great deal (28%) or a fair amount (52%) of respect for health care workers like them throughout this time. Nine in ten say that the patients they interact with have a great deal (35%) or a fair amount (52%) of respect for them.

Frontline health Care Workers Are optimistic About the current status of the vaccine, say life will return to normal relatively soon

Majorities of health care workers across workplaces and race and ethnicity say that the COVID-19 outbreak in the U.S. is at least “somewhat under control” including one fourth who say it is “mostly under control” or “completely under control.” The view of the status of the pandemic is similar across demographic groups but notably, while about one-fourth of White health care workers say that the outbreak is either “completely” (4%) or “mostly under control” (19%), only about one in ten Black health care workers say the same. Three in ten (31%) of Black health care workers say the COVID-19 outbreak is “not at all under control.” While majorities across workplaces say that the COVID-19 is at least somewhat under control, one-fourth of those working in in-home patient care (27%) say that it is “not at all under control.”

About four in ten frontline health care workers say they anticipate the COVID-19 pandemic in the U.S. to be controlled enough so that people can resume normal life by mid-fall or sooner – including 6% who say life can safely resume in the U.S. now. However, most frontline health care workers think the pandemic will only be under control enough for normal life to resume in early 2022 or later (58%). The general public has similar expectations about when they expect normal life to resume, with one quarter (27%) saying by mid-summer or sooner, 17% saying mid-fall, four in ten (38%) saying by early 2022 and an additional 17% saying later than that.

About one in four in-home health care workers saying they expect a return to normal later than early 2022. This is similar to the share of those working in nursing homes and assisted care facilities. These groups are also less likely to say they have received at least one dose of a COVID-19 vaccine, due to both concerns about getting it and a lack of access.

Six in ten (61%) frontline health care workers say that most Americans are not taking enough precautions to prevent the spread of COVID-19, similar to the share of the general population who say the same about their peers. Seven in ten (68%) Black health care workers, younger health care workers ages 18-29 (68%) and health care workers who are Democrats and Democratic leaning independents (73%) say Americans are not taking enough precautions, while a majority of health care workers who are Republicans or Republican leaning independents (56%) say Americans are taking enough precautions to prevent the spread of COVID-19.

Methodology

The KFF/Washington Post is a partnership combining survey research and reporting to better inform the public. The KFF/Washington Post Frontline Health Care Workers Survey is the 35th in the series and focuses on the toll of the coronavirus pandemic on frontline health care workers, These individuals, who work across many different health care fields including doctors and nurses, nursing home managers, front desk clerks, and those who assist patients with daily tasks like bathing, eating, cleaning, exercising, or housekeeping, have been on the front lines of an industry providing care for the sickest adults during the past year.

Interviews were conducted in English and Spanish with a nationally representative sample of 1,327 frontline health care workers, defined as those who work in a health care delivery setting in direct contact with patients or bodily fluids. The survey also included a comparison survey allowing researchers to compare the group of frontline health care workers to the general population, that included 971 U.S. adults not working as frontline health care workers using the SSRS Online Panel. The survey was conducted online and via telephone from February 11- March 7, 2021. Sampling, data collection, weighting, and tabulation were managed by SSRS of Glenn Mills, Pennsylvania. Teams from KFF and The Washington Post worked together to develop the questionnaire and analyze the data, and both organizations contributed financing for the survey.

Sampling and Recruitment

Frontline health care workers are defined for the purpose of this project as individuals who work in a health care delivery setting and have direct contact with patients or their bodily fluids. This definition is based on the Centers for Disease Control and Prevention’s Advisory Committee on Immunization Practices (ACIP) category of essential health care workers.

The frontline health care worker sample includes a hybrid sample from two online probability-based panels and telephone samples recruited from random digit dialing (RDD). The online panels were the SSRS Opinion Panel, a representative probability-based panel of U.S. adults age 18 and older, recruited using the SSRS Omnibus poll (a weekly dual-frame RDD telephone survey) and through address-based sampling (ABS) (n=398), and the IPSOS KnowledgePanel, a probability-based online panel of U.S.  adults age 18 and older recruited through ABS (n=628), targeting panelists who previously indicated they were employed. The telephone sample of frontline health care workers include computer-assisted telephone interviews conducted with respondents reached by cell phone and landline. To efficiently maximize the sample of health care workers, the sample included 124 respondents who previously completed an interview on KFF’s monthly tracking poll (n=85) or the SSRS Omnibus Poll (n=39) and said they worked in a health care delivery setting. An additional 94 respondents who previously completed an interview on the SSRS Omnibus and indicated that they were employed were also reached.

Weighting and Data Processing

The combined landline, cell phone, and web sample was weighted to match the sample demographics to estimates for the national population, and specifically to the adult health care worker population. A multi-stage weighting process was used to adjust for the fact that not all survey respondents were selected with the same probabilities and to account for systematic non-response. In the first weighting stage, adjustments were made regarding the probabilities of selection to the two web panels, and for probability of selection and non-response to the telephone callback samples. In the second stage, weighting was conducted separately for those who qualified as health care workers and all other adults. Demographic benchmarks for health care workers were derived from analysis of a sample of all respondents interviewed on the SSRS Omnibus survey between December 21, 2020 and February 28, 2021 (N=10,075), and the December 2020 KFF Health Care Tracking Poll and January 2021 KFF COVID-19 Vaccine Monitor Survey (combined N=3,239). Each of these surveys were probability samples of the U.S. adult population that were weighted to the Census Bureau’s American Community Survey and included questions to identify front-line health care workers. While there are no known administrative data available for frontline health care workers, the survey-derived benchmarks for front-line health care workers estimates were validated by comparison to the 2019 ACS demographic estimates within matching occupation and industry code. In the final weighting stage, each group (health care workers and all others) was weighted to reflect its actual share in the U.S. adult population.

All sampling error margins and tests of statistical significance have been adjusted to account for the sample design and weighting. The margin of sampling error for the total frontline health care worker sample is plus or minus 3 percentage points. The margin of sampling error for the comparison sample (U.S. adults) is 4 percentage points. The margin of sampling error may be higher for subgroups. Note that sampling error is only one of many potential sources of error in this or any other public opinion poll. Kaiser Family Foundation public opinion and survey research and The Washington Post are charter members of the Transparency Initiative of the American Association for Public Opinion Research.

Each organization bears the sole responsibility for the work that appears under its name. The project team from KFF included: Mollyann Brodie, Ph.D., Ashley Kirzinger, Ph.D., Audrey Kearney and Liz Hamel. The project team from The Washington Post included: Scott Clement and Emily Guskin.

Appendix

News Release

KHN and Guardian US Win Batten Medal for “Lost on the Frontline”

The Year-Long Investigative Project Chronicles the Lives of More than 3,600 Health Care Workers Who Died of COVID-19

Published: Apr 5, 2021

The News Leaders Association (NLA) awarded KFF’s Kaiser Health News (KHN) and Guardian US the 2021 Batten Medal for Coverage of the Coronavirus Pandemic for their year-long “Lost on the Frontline” investigation documenting the lives of more than 3,600 health care workers in the U.S. who died of COVID-19 after contracting the disease on the job.

The project honored their lives and asked, “Did so many have to die?” by investigating the circumstances of their exposure, examining the sometimes-unnecessary risks borne by those on the front lines of care.

The Batten Medal is one of the highest honors awarded by the NLA, recognizing coverage of the pandemic that reflects the previously unthinkable challenges that newsrooms had to overcome in the face of this once-in-a-generation crisis, named in memory of James K. Batten, a reporter, editor and ultimately Knight Ridder’s chief executive officer.

The project began in April 2020 after the death of Frank Gabrin, the first emergency room doctor known to have died of COVID-19. A reporter for the KHN/Guardian project obtained text messages about Gabrin’s deep concerns about shortages of personal protective equipment as he treated a crush of COVID-19 patients in New York City and northern New Jersey. Yet in the days after his death, the ER chiefs at his hospitals offered full-throated denials of any PPE problems.

From there, the project documented the lives and COVID-related deaths of health care workers, many of whom faced daily risks that employers charged with protecting them were often quick to dismiss or deny.

As part of the project, more than 70 reporters spent nearly a year filing public records requests, cross-connecting governmental and private data sources, scouring obituaries and online posts. Frequently, relatives spoke about their deceased family members with the team for the first time.

Ultimately, the team tracked more than 3,600 deaths in an interactive database and published hundreds of in-depth profiles of those lost on the frontlines, the nation’s most-complete accounting of the pandemic’s toll on health care workers. The profiles not only feature doctors, nurses and other medical professions, but also others working at hospitals, nursing homes and other medical facilities, including aides, administrative employees, and cleaning and maintenance staff.

As the project evolved, the team of journalists published multiple investigative stories examining why workers died and assembled a clearer picture of who was hit hardest: Workers of color, younger staffers, and low-paid employees with extensive patient contact working in the shadows of American health care.

“The government wasn’t counting or investigating health care worker deaths, so journalists filled the void,” said Elisabeth Rosenthal, KHN’s editor-in-chief. “As a result, readers and families of the victims have a memorial to those lost. Equally important, we pursued accountability from all the institutions that failed to protect the safety of these workers, who were forced to put their lives on the line.”

“These workers fought the hardest and the longest on behalf of others over the last year. ‘Lost on the Frontline’ was the most expansive piece of journalism the Guardian undertook in 2020 and hopefully it will serve as a historical record that marks their service and remembers their lives,” said John Mulholland, editor of Guardian US.

About KFF and KHN

KHN (Kaiser Health News) is a national newsroom that produces in-depth journalism about health issues. Together with Policy Analysis and Polling, KHN is one of the three major operating programs at KFF (Kaiser Family Foundation). KFF is an endowed nonprofit organization providing information on health issues to the nation.

About Guardian News & Media

Guardian US is renowned for its Pulitzer Prize-winning investigation into widespread secret surveillance by the National Security Agency, and for other award-winning work, including The Paradise Papers. Guardian US has bureaus in New York, Washington, New Orleans and Oakland, California, covering the climate crisis, politics, race and immigration, gender, national security and more.

Guardian News & Media (GNM), publisher of theguardian.com, is one of the largest English-speaking newspaper websites in the world. Since launching its U.S. and Australian digital editions in 2011 and 2013, respectively, traffic from outside of the U.K. now represents over two-thirds of The Guardian’s total digital audience.

The Health Center COVID-19 Vaccination Program is Prioritizing Hard-to-Reach Communities

Authors: Bradley Corallo and Jennifer Tolbert
Published: Mar 31, 2021

As part of the Biden administration’s plans to facilitate more equitable access to vaccinations, the administration has formed a partnership with community health centers, known for providing health care to some of the hardest-to-reach populations. This partnership, called the Health Center COVID-19 Vaccination Program, directly supplies health centers with a limited number of doses to increase vaccinations among people of color, low-income communities, and other underserved populations that make up a large share of health center patients. The first phase of the program kicked off February 15, 2021 and invited 250 health centers to participate, aiming to provide them with 1 million vaccine doses over the course of 4 weeks. Currently, the program is in the process of adding 700 more health centers, phasing in participation over a period of six weeks, and, by May, the administration expects to open the program to all 1,400 health center organizations across the U.S.

As of March 22, 2021, there were 325 health centers participating in the Health Center COVID-19 Vaccination Program and they had received over 1 million vaccine doses. Based on 2019 data, 75% of all patients visiting these health centers were people of color and 92% had incomes at or below 200% of the federal poverty level. Prior KFF research has shown that health centers are vaccinating people of color at higher rates than vaccine efforts nationally, and that is especially true for health centers participating in the federal program where, according to federal officials, over 65% of the allocated doses have been administered to people of color.

The first 325 health centers to participate in the program have the capacity to reach very specific, high-need populations that may require more resource-intensive vaccination efforts. Many of the health centers participating in the early phase of the program receive designated funding to treat agricultural workers, patients experiencing homeless, and/or patients living in or near public housing. They are also larger, on average, than other health centers. Our analysis shows that these health centers served just under half of all health center patients in 2019, as well as 80% of all health center patients who are agricultural workers, 69% of all patients living in or near public housing, 62% of patients with limited English proficiency, and just over half (54%) of patients experiencing homelessness (Figure 1). Although health centers provide services to only a subset of these individuals, reaching high-need populations as well as others facing barriers to vaccinations in the greatest numbers possible will be helpful in achieving population-level immunity.

Although the Health Center COVID-19 Vaccination Program represents a small portion of vaccinations nationally to date, increased federal funding for the program will enable participating health centers to reach many more people. On March 25, 2021, the Biden administration announced $6 billion in federal funding from the American Rescue Plan would be directed to health centers to expand vaccine access. This investment, coupled with new flexibility allowing health centers to vaccinate people in ACIP’s Phase 1c priority group along with other state priority populations, will enable health centers to reach more of their patients and other higher-risk individuals in their communities. Currently, the program is onboarding 700 more health centers as part of the second phase of the program, including those serving large shares of people with low incomes and people of color, those located in rural and frontier areas, those serving tribal communities, and health centers operating mobile vans with the ability to take vaccinations out into the community. Ensuring more equitable access to the COVID-19 vaccine will be a meaningful step in mitigating the disparate impacts of the pandemic and limiting health disparities in the future.

Methods

For this analysis, we matched health centers listed on the Health Center COVID-19 Vaccine Program Participants web page with data from the 2019 Uniform Data System (UDS). We also used data from data.HRSA.gov to assist with matching health center name, city, and state information. All data presented here include federally funded health centers and look-alike organizations, which meet all Health Center Program requirements but do not receive federal grants under Section 330 of the Public Health Service Act. We accessed the list of health centers on March 23, 2021 and identified 324 participating health centers (of 950 invited health centers). More recent information from HRSA indicates that the number of participating health centers as of March 22, 2021 was 325, and so we were not able to identify one participating health center for our analysis.

News Release

Vaccine Monitor: 6 in 10 Adults Have Either Gotten a COVID-19 Vaccine or Want To “as Soon as Possible;” “Wait and See” Group Continues To Shrink

Black Adults See Biggest Jump in Enthusiasm, Up 14 Percentage Points Since February

Published: Mar 30, 2021

Among Those Who Have Not Been Vaccinated, 3 in 10 Are Unsure if They are Eligible Yet; Hispanic Adults and People with Low Incomes More Likely to Be Unsure

The latest KFF COVID-19 Vaccine Monitor report finds enthusiasm for getting a COVID-19 vaccine continuing to grow, with roughly 6 in 10 adults (61%) now saying they have already gotten at least one dose (32%) or want to get vaccinated as soon as they can (30%).

That’s up from a combined 55% in February and 47% in January, as more people report getting vaccinated and fewer say they want to “wait and see” how the vaccine works in others before getting it themselves (17% now, compared to 22% in February and 31% in January).

A quarter (24%) of Black adults continue to want to “wait and see” before getting vaccinated, down from a third (34%) in February, but still somewhat higher than the share of White adults (16%).

About 1 in 5 adults (20%) remain more reluctant about vaccination, either saying they would only do so if required for work, school or other activities (7%), or would definitely not get vaccinated (13%). The groups most likely to say “definitely not” to a vaccine include Republicans (29%) and White Evangelical Christians (28%)

“With more people embracing vaccination and the ‘wait and see’ group shrinking rapidly, outreach efforts increasingly can target people with more deep-seated resistance,” KFF President and CEO Drew Altman said.

Most People Now Say They Know Enough About When and Where They Can Get Vaccinated

For the first time, a majority of those who have not yet been vaccinated say they have enough information both about where (67%) and when (53%) they can get vaccinated, though the report also finds a sizeable minority that lacks key vaccine information.

Overall, 3 in 10 of those who have not been vaccinated say they don’t know if they are currently eligible to get a vaccine in their state. The share that is uncertain is highest among Hispanic adults (45%), those under age 30 (39%), with annual household incomes under $40,000 annually (37%), and those without a college degree (35%).

Among all adults who have not been vaccinated but believe they are eligible, about one-third say they tried to make an appointment to get the COVID-19 vaccine, including roughly equal shares who say they were (16%) and were not (17%) able to successfully schedule an appointment.

“As vaccine supply has increased and more people become eligible to get a shot, more people seem able to navigate the system – though key information gaps remain, particularly for those with low incomes and lower levels of education,” Executive Vice President Mollyann Brodie said.

Information and Employer Incentives Could Encourage More People to Get Vaccinated

This month’s monitor also tests various pieces of information to gauge whether they influence those who aren’t already vaccinated or hoping to get vaccinated as soon as possible. Some of the most effective are hearing that:

  • The vaccines are nearly 100% effective at preventing hospitalizations and deaths from COVID-19 (41% say this would make them more likely to get vaccinated).
  • Scientists have been working on the technology used in the new COVID-19 vaccines for 20 years (32%).
  • There is no cost to get the vaccine (27%).
  • More than 100,000 people from diverse backgrounds and ethnicities took part in the vaccine trials (26%).
  • The vast majority of doctors who have been offered the vaccine have taken it (26%).

The monitor also probes the potential for employers to promote vaccination through conveniences and financial incentives.

Among people who are employed but are not yet convinced to get a vaccine right away, a quarter (25%) say they would be more likely to do so if their employer arranged for a medical provider to administer the vaccine at work.

Nearly as many (19%) say they would be more likely to get vaccinated if their employer offered an extra $50 if they got vaccinated, and that share rises to 22% for a $200 financial incentive.

The public is almost evenly divided on whether an employer should be allowed to require certain workers to get vaccinated for COVID-19, with half (51%) saying it should and nearly as many (45%) saying it shouldn’t. This split reflects a sharp partisan divide, with most Democrats (70%) saying employer should be allowed to require vaccination, and most Republicans (71%) saying they should not.

Across the board, the information and incentives tested are most effective at persuading the “wait and see” group to get vaccinated, and to a lesser extent, the “only if required” group. Few of those who say they “definitely will not” get the vaccine say any of the incentives or messages would increase their likelihood of getting vaccinated.

Most Who Are Open to Getting Vaccinated Don’t Have a Strong Preference for a Specific Vaccine

There are now three vaccines available in the U.S. About half (46%) of those who are open to getting vaccinated do not have a preference which one they get, while about a quarter (24%) having a slight preference and a bit more (28%) having a strong one.

Among those open to getting vaccinated, similar shares say they would definitely or probably get the one-dose Johnson & Johnson vaccine (69%), and the Pfizer (70%) and Moderna (67%) two-dose vaccines.

The report suggests a one-dose vaccine appeals to a significant segment of the public. Among those who express a preference for one vaccine over another, their top reason was the ease of a one-dose vaccine (24% cited this). Other reasons include their perceptions of the vaccines’ relative effectiveness (14%), hearing good or better things about a particular vaccine vs. others (7%), and being concerned about side effects or a reaction to a particular vaccine.

Designed and analyzed by public opinion researchers at KFF, the KFF Vaccine Monitor survey was conducted from March 15-22 among a nationally representative random digit dial telephone sample of 1,862 adults, including oversamples of adults who are Black (490) or Hispanic (476). Interviews were conducted in English and Spanish by landline (356) and cell phone (1,506). The margin of sampling error is plus or minus 3 percentage points for the full sample. For results based on subgroups, the margin of sampling error may be higher. 

The KFF COVID-19 Vaccine Monitor is an ongoing research project tracking the public’s attitudes and experiences with COVID-19 vaccinations. Using a combination of surveys and qualitative research, this project tracks the dynamic nature of public opinion as vaccine development and distribution unfold, including vaccine confidence and hesitancy, trusted messengers and messages, as well as the public’s experiences with vaccination.

Poll Finding

KFF COVID-19 Vaccine Monitor: March 2021

Published: Mar 30, 2021

Findings

The KFF COVID-19 Vaccine Monitor is an ongoing research project tracking the public’s attitudes and experiences with COVID-19 vaccinations. Using a combination of surveys and qualitative research, this project tracks the dynamic nature of public opinion as vaccine development and distribution unfold, including vaccine confidence and acceptance, information needs, trusted messengers and messages, as well as the public’s experiences with vaccination.

Key Findings

  • The share of U.S. adults who report being vaccinated for COVID-19 or intending to do so as soon as possible continues to rise (currently 61%) and the share taking a “wait and see” approach continues to shrink (now 17%), while the share who say they will “definitely not” get the vaccine (13%) has remained about the same since December, according to the latest KFF COVID-19 Vaccine Monitor. Black adults saw the largest increase in vaccine enthusiasm (55% of them now say they have either gotten vaccinated or want to as soon as possible), but one-quarter of Black adults say they still want to “wait and see” how the vaccine works for others before getting vaccinated, somewhat higher than the share of White adults who say the same. About three in ten Republicans and White Evangelicals say they will “definitely not” get the vaccine, as do one in five adults living in rural areas.
  • While a growing share of adults say they now have enough information about where and when they will be able to get vaccinated, three in ten – including larger shares of Hispanic adults, young adults, and those with lower incomes – are unsure whether they’re currently eligible to receive the vaccine in their state. Among those who believe they are eligible, about one-third say they tried to make an appointment to get vaccinated and about half of this group says their attempt was unsuccessful. In a sign that the appointment process may be getting easier at least for older adults, the share of those ages 65 and over who say they tried but were unable to get an appointment declined from 16% in February to 7% this month.
  • In the latest COVID-19 Vaccine Monitor, we tested a variety of potential incentives, messages, and pieces of information that might be used to increase vaccination uptake. We find there is a role for convenient access to vaccines in medical settings; about half of those in the “wait and see” group say they would be more likely to get vaccinated if the vaccine were offered to them during a routine medical appointment. Travel and freedom of movement may be incentives for others; about four in ten in both the “wait and see” and “only if required” groups say they would be more likely to get a shot if airlines required it of passengers or if the CDC said that vaccinated people could travel freely and would not have to wear masks in most situations. Employers also have a role to play, both in facilitating access and offering incentives. About four in ten employed adults in the “wait and see” group say they would be more likely to get the vaccine if their employer arranged for on-site vaccination or offered them a $200 incentive to get vaccinated.
  • Among the pieces of information tested, the most impactful was that the vaccines are nearly 100% effective at preventing hospitalization and death from COVID-19 (two-thirds of those in the “wait and see” group said hearing this would make them more likely to get vaccinated). Other messages that were effective for at least four in ten of those in the “wait and see” group include that scientists have been working on the technology used in the new COVID-19 vaccines for 20 years, that more than 100,000 people from diverse backgrounds took part in the vaccine trials, that the vast majority of doctors who have been offered the vaccine have taken it, and that there is no cost to get the vaccine. However, while a variety of incentives, messages, and information may be helpful in swaying some in the “wait and see” and “only if required” groups to consider vaccination, none of them do much to sway those in the “definitely not” camp.
  • With the introduction of the one-dose Johnson & Johnson (J&J) vaccine to the U.S. market, we find that about half of those who are open to getting vaccinated say they do not have a preference for which vaccine they would like to get, while about three in ten say they have a strong preference and about one-quarter have a slight preference. Among those who have not been vaccinated, just over half say they would probably or definitely get each of the three available brands (Pfizer, Moderna, and J&J), though a slightly larger share of those in the “wait and see” group say they would “definitely” get the one-dose J&J vaccine (16%) than says the same about the Pfizer or Moderna two-dose versions (8% and 7%, respectively). Among those who express a preference, the most common reason offered is that they prefer a one-dose vaccine (24%), suggesting that the convenience of a one-dose vaccine may make it easier to reach certain harder-to-convince populations to get vaccinated.

As states continue to expand eligibility for COVID-19 vaccination, the latest KFF COVID-19 Vaccine Monitor reports that the share of the public that has gotten the vaccine or is eager to do so continues to grow while the share that is waiting to see how the vaccine works for others continues to shrink. About six in ten adults (61%) say they have already gotten at least one dose of the vaccine (32%) or will get it as soon as they can (30%), up 6 percentage points since February. At the same time, the share taking a “wait and see” approach declined from 22% in February to 17% this month. A small but persistent share say they will get the vaccine only if they are required to do so for work, school, or other activities (7%) or that they will “definitely not” get the vaccine (13%), similar to the shares who have given those responses since January.

Enthusiasm for getting the COVID-19 vaccine continues to grow among people across racial and ethnic backgrounds, with the largest increase this month among Black adults. Over half of Black adults (55%) now say they’ve either gotten at least one dose of the vaccine or will get it as soon as they can, up from 41% in February and approaching the shares among Hispanic adults (61%) and White adults (64%). At the same time, the share of Black and Hispanic adults who say they will “wait and see” how the vaccine works for others before getting vaccinated themselves has fallen steadily since December. However, Black adults (24%) remain somewhat more likely than White adults (16%) to say they will “wait and see” before getting vaccinated.

While enthusiasm for getting the COVID-19 vaccine continues to inch up across partisan groups, a persistent divide remains, with about eight in ten Democrats (79%), almost six in ten independents (57%), and fewer than half of Republicans (46%) saying they have either received at least one dose of the vaccine or intend to do so as soon as possible. About three in ten Republicans (29%) say they will “definitely not” get vaccinated, similar to the share who said so in February.

Looking across various demographics, the groups most likely to say they’ve either already gotten the vaccine or will get it as soon as possible are adults ages 65 and over (82%), Democrats (79%), and college graduates (73%). Young adults ages 18-29 (25%) and Black adults (24%) continue to be among the groups most likely to say they want to “wait and see” before getting a COVID-19 vaccine. About three in ten Republicans (29%) and a similar share of White adults who identify as Evangelical Christians (28%) say they will definitely not get the vaccine, as do one in five rural residents (20%) and essential workers in fields other than health care (21%).

Information Needs And Experiences With Appointments

The share of unvaccinated adults who say they have enough information about when they will be able to get the COVID-19 vaccine increased from 36% in February to 53% in March, and the share who say they know enough about where they can get a vaccine increased from 55% to 67%. Still, that leaves almost half the public feeling like they don’t have enough information about when they can get the vaccine and one third saying they don’t know enough about where they can get it.

Further, three in ten of those who have not yet been vaccinated say they are not sure if they’re currently eligible to get a COVID-19 vaccine in their state or not. This share rises to about four in ten among Hispanic adults (45%), adults under age 30 (39%), those with household incomes under $40,000 (37%), and adults without a college degree (35%).

Among adults ages 65 and over, almost two-thirds (64%) say they’ve gotten at least one dose of the vaccine (up from 44% last month) and another 7% have scheduled an appointment to get vaccinated. Just 7% say they tried but were unable to get an appointment (down from 16% last month). The share of older adults who report receiving at least a first dose of the vaccine is somewhat higher among those ages 75 and over (72%) and college graduates (77%).

Among all adults who have not been vaccinated but believe they are eligible, about one-third say they tried to get an appointment to get the COVID-19 vaccine, including 16% who say they were able to schedule an appointment and another 17% who say they tried but were unable to get an appointment.

Among all adults who tried but were unable to get an appointment, 43% say they couldn’t get an appointment because they didn’t meet eligibility requirements, one-third say there were no appointments available, and smaller shares report that the vaccine was not available (6%), the available appointment times didn’t work for their schedule (5%), or they had technical difficulties (4%).

Concerns Among Those Who Have Not Yet Been Vaccinated

Among the 37% of adults who are not yet convinced to get the vaccine right away (defined as those who say they will “wait and see” before getting vaccinated, will get the vaccine “only if required” or will “definitely not” get it), side effects continue to be the top concern, with about seven in ten (70%) saying they are very or somewhat concerned that they might experience serious side effects from the vaccine. Just over six in ten (63%) are also concerned that the effects of the vaccine might be worse than if they actually got COVID-19 and the same share are concerned that they might be required to get the vaccine even if they don’t want to. About four in ten are concerned that they might have to miss work because of vaccine side effects (45%) or that they might get COVID-19 from the vaccine (39%), while fewer are concerned that they won’t be able to get the vaccine from a place they trust (21%), or they will have difficulty traveling to a vaccination site (10%).

The potential side effects of the vaccine continue to be the top concern across racial and ethnic groups. Among those who are not convinced to get vaccinated right away, about half of Black adults (50%) and Hispanic adults (52%) are concerned they might get COVID-19 from the vaccine, higher than the share of White adults who express this concern (33%). In addition, four in ten Black adults (38%) and one-quarter of Hispanic adults (27%) are concerned they won’t be able to get the vaccine from a place they trust, and about one in five (20% of Black adults and 22% of Hispanic adults) are concerned they will have difficulty traveling to a vaccination site.


Among those who are not convinced to get vaccinated right away, a larger share of Republicans (71%) compared to independents (57%) and Democrats (53%) say they are concerned that they might be required to get the vaccine even if they don’t want to.

While many vaccine outreach efforts are currently focused on the “wait and see” group – a group that has been shrinking over time – the share of the public who say they will “definitely not” get the vaccine has been about the same size since December 2020, representing about one in seven adults (13%). Understanding this group’s concerns about the vaccine will be crucial to any effort to ultimately convince them to get vaccinated.

When asked to say in their own words the main reason why the don’t want to get vaccinated, those in the “definitely not” group cite a range of concerns. The most frequently mentioned reason is feeling that the vaccines are too new or that there is not enough information about the long-term effects (mentioned by 17%), followed by concerns that the vaccines are not effective against COVID-19 (8%), a general sense that they don’t need the vaccine (8%), and concerns about the vaccines’ ingredients (8%). The range of reasons suggests that there is not a single message that will help sway these individuals to consider getting vaccinated, but that a range of strategies and conversations will be needed to move even some of them away from their “hard no” position.

IN THEIR OWN WORDS: What is the MAIN reason why you don’t want to get the COVID-19 vaccine? (among those who say they will “definitely not” get it)

“I don’t want to be a guinea pig, they haven’t tested it yet.” – 78 year-old woman

“Because I don’t believe they did enough research on it. It takes years to come up with vaccines for other diseases, all of a sudden they come out with a vaccine within a year. They should also put out the side effects it can cause, they should let people know if you have a reaction to the flu shot, you will have reaction to the vaccine.” – 50 year-old woman

“I don’t believe it works, COVID is not dangerous as I’m not over 60.” – 22 year-old woman

“Because I don’t think it’s necessary. Don’t want to put chemicals in my body.” – 49 year-old woman

“I’m pregnant and risking putting a disease in my body.” – 28 year-old woman

“I never in my life had flu shot, and this is super flu, and I am not going to do it.” – 71 year-old man

“Since it’s overly exaggerated, I have trust issues with it.” – 20 year-old man

“Not interested. I think this whole COVID thing is blown up hubbub.” – 35 year-old man

“I already had COVID so there is not reason to get it.” – 44 year-old man

Messages, Information, And Incentives That Might Increase Vaccination Uptake

In the latest COVID-19 Vaccine Monitor, we tested a variety of potential incentives, messages, and pieces of information that might be used to increase vaccination uptake. We find that while various incentives and messages may help convince people in the “wait and see” and “only if required” groups to get vaccinated, very few of them move people in the “definitely not” group.

Travel And Routine Medical Visits

About three in ten adults who are not convinced to get the vaccine right away say they would be more likely to get the COVID-19 vaccine if airlines required passengers to be vaccinated before they could fly (31%), if the CDC said vaccinated people could travel freely and would not need to wear masks in most situations (31%), or if the vaccine was offered to them during a routine medical visit (30%).

Notably, half of adults who want to “wait and see” before getting the vaccine say they would be more likely to get it if it was offered to them at a routine medical visit (50%). Those who say they would only get the vaccine if they are required are less motivated by having the vaccine offered at a routine appointment (32%), but about four in ten of this group says they would be more likely to get vaccianted if airlines required it of passengers and if the CDC said that vaccinated people could travel freely and not wear masks in most situations (similar to the share who say so among the “wait and see” group). Among those who say they will definitely not get the vaccine, fewer than one in ten are moved by any of these potential scenarios.

Across racial and ethnic groups, about half of Hispanic adults who are not yet convinced to get the vaccine right away say they would be more likely to get vaccinated if airlines required it to fly (49%) and if the CDC said vaccinated people could travel freely and not wear masks in most situations (47%). Fewer than three in ten White adults say they would be more likely to get vaccinated when presented with any of these scenarios.

The Role Of Employers

Employers also have a role to play in incentivizing their employees to get vaccinated and offering access to the vaccine on the job.

Among those who are employed and not yet convinced to get the vaccine right away, about one-quarter (25%) say they would be more likely to get the vaccine if their employer arranged for a medical provider to come to their place of work and administer it to employees, rising to 37% among employed people in the “wait and see” category. In addition, one in five say they would be more likely to get vaccinated if their employer offered them an extra $50 to get vaccinated (19%) while an additional 3% say they would be more likely to get the vaccine if their employer offered them $200, for a total of 22%. Among employed people in the “wait and see” group, 30% say they’d be more likely to get vaccinated if their employer offered them an extra $50 and a total of 38% say the same about a financial incentive of $200.

In a separate question, about half the public (51%) says that employers should be allowed to require certain employees to get vaccinated for COVID-19, while nearly half (45%) say this should not be allowed. There is a large partisan divide on this question that reflects the divide on many questions about the pandemic, with seven in ten Democrats (70%) saying employers should be allowed to require vaccination and a similar share of Republicans (71%) saying they should not.

Messages And Information

When those who are not yet convinced to get the COVID-19 vaccine right away are presented with messages and information that might encourage vaccination, the most effective piece of information is that the vaccines are nearly 100% effective at preventing hospitalization and death from COVID-19. Two-thirds (66%) of those in the “wait and see” group and about four in ten (42%) in the “only if required” group say hearing this would make them more likely to get vaccinated. In addition, hearing that scientists have been working on the technology used in the new COVID-19 vaccines for 20 years is an effective message for many, with half (49%) of the “wait and see” and about four in ten (39%) of the “only if required” group saying this would make them more likely to consider vaccination.

Three other pieces of information were convincing for about four in ten of the “wait and see” and at least three in ten of the “only if required groups: that more than 100,000 people from diverse backgrounds took part in the vaccine trials, that the vast majority of doctors who have been offered the vaccine have taken it, and that there is no cost to get the vaccine. About a third in both groups say they’d be more likely to get vaccinated after hearing that while the long-term effects of the vaccine are unknown, the long-term effects of COVID-19 could be worse. Somewhat fewer say they would be more likely to get the vaccine after hearing that some young and healthy people have been hospitalized and died from COVID-19 and that the reason the vaccines were approved so quickly was because red tape that is usually part of the process was removed, not because corners were cut.

Few of these messages or pieces of information were effective at moving those who say they will definitely not get vaccinated, with the share of that group saying they’d be more convinced after hearing each message in the single digits.

Among those not yet convinced to get the COVID-19 vaccine right away, few (15%) say they would be more likely to get the vaccine if former President Donald Trump came out with a message strongly urging people to get vaccinated. Indeed, even among Republicans, just one in five say they would be more likely to get vaccinated if former President Trump strongly urged people to get vaccinated.

Do People Have A Preference For A Specific Vaccine?

With the FDA granting emergency use authorization to the Johnson & Johnson (J&J) COVID-19 vaccine on February 27, the U.S. now has three highly effective vaccines available to the public. All three vaccines have been rigorously studied and proven to prevent hospitalization and death from COVID-19, though they use different technologies. While the Moderna and Pfizer vaccines that have been on the market since January require two doses administered several weeks apart, the J&J vaccine is administered as a single dose.

Despite the high efficacy of all three vaccines, there has been some confusion surrounding these different technologies and the different dosages. When asked if there are differences in how well the three COVID-19 vaccines available on the U.S. market work, half (52%) of the public say they are not sure. Fourteen percent think there are major differences in how well the vaccines work, about a quarter (26%) think there are minor differences, and 8% say there are no differences. As the vaccine roll-out continues, uptake may be dependent on how well the public trusts the safety and efficacy of the different vaccines.

Among U.S. adults who are at least somewhat open to getting the vaccine—expressed by saying they either want the vaccine as soon as possible, they want to wait and see how it works for others before getting it themselves, or they will get it if required to do so for work, school, or other activities—three in ten say that they have a “strong preference” for which vaccine they get (28%), while an additional one in four (24%) say they have a “slight preference”, and 46% say they do not have a preference. Younger adults are more likely to say it doesn’t matter which vaccine they get, with nearly six in ten willing 18-29 year-olds (56%) saying they have no preference, compared to four in ten of those ages 30-49 (43%) or 50-64 (41%) and one third of those ages 65 and over (33%). Four in ten (43%) of people ages 65 and over who have not yet been vaccinated say they have a strong preference for which vaccine they would like to get and 21% say they have a slight preference.

When asked separately about each of the three FDA authorized COVID-19 vaccines, majorities of those planning or considering getting vaccinated say they would be open to getting each one. About seven in ten say they would “probably” or “definitely” get each of the three vaccines, including at least one-third who say they would “definitely get” each. About one in seven say they would definitely not get each of the vaccines.

Among those who want to wait and see how the vaccines are working for other people before getting vaccinated, a larger share says they would definitely get the J&J one-dose vaccine compared to either of the two-dose options. One in six (16%) of those in the “wait and see” group say they would “definitely get” the J&J vaccine, compared to about one in ten who say the same about the Pfizer or Moderna vaccines (8% and 7%, respectively). This analysis shows that the convenience of a one-dose vaccine may make it easier to reach certain harder-to-convince populations to get vaccinated.

Among those who say they have a preference for one vaccine over another, the main reasons are that they prefer the ease of a one-dose vaccine (24%), their perceptions of the level of effectiveness of the different vaccines (14%), they have heard good or better things about one vaccine (7%), they are concerned about side effects or a reaction to a particular vaccine (7%), the ingredients or formulation of the vaccines (6%), or they say one vaccine would be more convenient or easier to obtain than others (6%).

IN THEIR OWN WORDS: What is the MAIN reason you prefer one COVID-19 vaccine over the others?

“Johnson and Johnson is only one dose and would rather take one dose. But [I would get] whatever is available.” – 68 year-old, slight preference

“Johnson and Johnson just came out and hasn’t been out that long but the Pfizer and Moderna have been out longer.” –55 year-old, strong preference

“Moderna vaccine doesn’t seem to have the distribution needed and temperature regulation is a concern. [I am] worried it wouldn’t be at right temperature, J&J didn’t have temperature requirement.” –62 year-old, strong preference

“Right now, the concern is with the MRNA vaccines; it is very new.” –34 year-old, slight preference

“The combination of chemicals used in Pfizer and Moderna are different from the J&J vaccine, and I have not heard of complications from the J&J vaccine, J&J doesn’t require special handling.” –82 year-old, strong preference

“The more shots you have the more chance you have for an adverse reaction.” –38 year-old, slight preference

“The reputation and amount of time the experience these companies have with distributing the vaccines.”—46 year-old, slight preference

Methodology

This KFF COVID-19 Vaccine Monitor was designed and analyzed by public opinion researchers at the Kaiser Family Foundation (KFF). The survey was conducted March 15-22, 2021, among a nationally representative random digit dial telephone sample of 1,862 adults ages 18 and older (including interviews from 476 Hispanic adults and 490 non-Hispanic Black adults), living in the United States, including Alaska and Hawaii (note: persons without a telephone could not be included in the random selection process). Phone numbers used for this study were randomly generated from cell phone and landline sampling frames, with an overlapping frame design, and disproportionate stratification aimed at reaching Hispanic and non-Hispanic Black respondents. Stratification was based on incidence of the race/ethnicity subgroups within each frame. Specifically, the cell phone frame was stratified as: (1) High Hispanic: Cell phone numbers associated with rate centers from counties where at least 35% of the population is Hispanic; (2) High Black: Cell phone numbers associated with remaining rate centers from counties where at least 35% of the population is non-Hispanic Black; (3) Else: numbers from all remaining rate centers. The landline frame was stratified as: (1) High Black: landline exchanges associated with Census block groups where at least 35% of the population is Black; (2) Else: all remaining landline exchanges. The sample also included 190 respondents reached by calling back respondents that had previously completed an interview on the KFF Health Tracking Poll at least nine months ago. Another 402 interviews were completed with respondents who had previously completed an interview on the SSRS Omnibus poll (and other RDD polls) and identified as Hispanic (n = 178; including 63 in Spanish) or non-Hispanic Black (n=224). Computer-assisted telephone interviews conducted by landline (356) and cell phone (1,506, including 1,093 who had no landline telephone) were carried out in English and Spanish by SSRS of Glen Mills, PA. To efficiently obtain a sample of lower-income and non-White respondents, the sample also included an oversample of prepaid (pay-as-you-go) telephone numbers (25% of the cell phone sample consisted of prepaid numbers) Both the random digit dial landline and cell phone samples were provided by Marketing Systems Group (MSG). For the landline sample, respondents were selected by asking for the youngest adult male or female currently at home based on a random rotation. If no one of that gender was available, interviewers asked to speak with the youngest adult of the opposite gender. For the cell phone sample, interviews were conducted with the adult who answered the phone. KFF paid for all costs associated with the survey.

The combined landline and cell phone sample was weighted to balance the sample demographics to match estimates for the national population using data from the Census Bureau’s 2019 U.S. American Community Survey (ACS), on sex, age, education, race, Hispanic origin, and region, within race-groups, along with data from the 2010 Census on population density. The sample was also weighted to match current patterns of telephone use using data from the January- June 2020 National Health Interview Survey and to adjust for non-response bias, predominantly in the callback sample frames, on health insurance coverage, registered voter status, age, and reported vaccination rates (based on the non-callback RDD sample). The weight takes into account the fact that respondents with both a landline and cell phone have a higher probability of selection in the combined sample and also adjusts for the household size for the landline sample, and design modifications, namely, the oversampling of prepaid cell phones and likelihood of non-response for the re-contacted sample. All statistical tests of significance account for the effect of weighting.

The margin of sampling error including the design effect for the full sample is plus or minus 3 percentage points. Numbers of respondents and margins of sampling error for key subgroups are shown in the table below. For results based on other subgroups, the margin of sampling error may be higher. Sample sizes and margins of sampling error for other subgroups are available by request. Note that sampling error is only one of many potential sources of error in this or any other public opinion poll. Kaiser Family Foundation public opinion and survey research is a charter member of the Transparency Initiative of the American Association for Public Opinion Research.

This work was supported in part by grants from the Chan Zuckerberg Initiative DAF (an advised fund of Silicon Valley Community Foundation), the Ford Foundation, and the Molina Family Foundation. We value our funders. KFF maintains full editorial control over all of its policy analysis, polling, and journalism activities.

GroupN (unweighted)M.O.S.E.
Total1,862± 3 percentage points
COVID-19 Vaccination Status
Have gotten at least one dose of the COVID-19 vaccine754± 5 percentage points
Have not gotten the COVID-19 vaccine1,103± 4 percentage points
Race/Ethnicity
White, non-Hispanic760± 4 percentage points
Black, non-Hispanic490± 6 percentage points
Hispanic476± 6 percentage points
Party Identification
Democrats731± 5 percentage points
Republicans342± 7 percentage points
Independents523± 6 percentage points
News Release

New Analysis Indicates U.S. County Vaccination Rates Do Not Correspond to COVID-19 Impact Thus Far

Published: Mar 29, 2021

An analysis of Centers for Disease Control and Prevention (CDC) COVID-19 vaccination data from 72% of all counties in the U.S. shows that counties classified as having “low” COVID-19 community transmission (cases and positive tests) levels have an average vaccination rate greater than the rate in counties with “high” community transmission levels. Additionally, counties with the lowest COVID-19 deaths per 100,000 people have an average vaccination rate greater than the rates in counties with the highest COVID-19 deaths per 100,000 people. Vaccination rates in the analysis are defined as the percent of the relevant population within a county that has been fully vaccinated.

Previous analyses have shown that the pandemic has had a disproportionate impact on people of color and that Black and Hispanic people are receiving smaller shares of COVID-19 vaccinations compared to their shares of cases and deaths and to their shares of the overall population. The brief, Vaccination is Local: COVID-19 Vaccination Rates Vary by County and Key Characteristics, provides further insight into these equity issues. Counties with higher shares of Black people have a vaccination rate of 13.7% compared to 16.4% for counties with low shares of Black people. The population vaccination rate in counties with higher shares of Hispanic people is 15% versus 15.9% for counties with lower shares of Hispanic people.

The analysis also examines how county vaccination rates align with CDC prioritization recommendations and ensuing state decisions. With all states prioritizing older adults, counties with higher shares of people age 65 and older have an 18.2% vaccination rate compared to 14.9% in counties with lower shares of the population.

However, while many states are prioritizing individuals with certain high-risk medical conditions, counties with higher shares of people with certain high-risk conditions have a lower vaccination rate compared to counties with lower shares of people with these conditions (14% versus 16.7%).

Other findings from the analysis include:

  • Higher county uninsured and poverty rates are associated with lower vaccination rates.
  • Metro counties have lower vaccination rates for the total population than non-metro counties.
  • Rates are lower in counties that voted for Donald Trump compared to those that voted for Joe Biden.

How the American Rescue Plan Act Affects Subsidies for Marketplace Shoppers and People Who Are Uninsured

Authors: Matthew Rae, Cynthia Cox, Gary Claxton, Daniel McDermott, and Anthony Damico
Published: Mar 25, 2021

The Affordable Care Act (ACA) has provided subsidized health insurance on HealthCare.gov and state-run Marketplaces since 2014, with about 9 million people purchasing coverage with federal premium help. However, millions remain uninsured despite being eligible to purchase on the Marketplace. Some uninsured people have been priced out of the market because their incomes did not qualify them for a subsidy; other uninsured people have been eligible for subsidized or even free Marketplace coverage but either did not know about the financial assistance available to them or still found coverage unaffordable or unappealing due to high deductibles. Additionally, people already purchasing Marketplace or off-exchange coverage may still face affordability challenges.

The March 2021 COVID-19 relief legislation, the American Rescue Plan Act (ARPA), extends eligibility for ACA health insurance subsidies to people buying their own health coverage on the Marketplace who have incomes over 400% of poverty. The law also increases the amount of financial assistance for people at lower incomes who were already eligible under the ACA. Both provisions are temporary, lasting for two years, retroactive to January 1, 2021. A more detailed explanation of these enhanced and expanded subsidies and other coverage provisions of the ARPA can be found here, and an earlier analysis and interactive comparison of ARPA and ACA subsidies can be found here.

In this brief, we use data from the American Community Survey (ACS) to provide estimates of eligibility for and the amount of financial assistance to purchase Marketplace coverage under the ARPA among both current individual market purchasers, as well as Marketplace-eligible uninsured people.

We find that the number of people eligible for a subsidy to purchase Marketplace coverage has increased 20% from 18.1 million to 21.8 million with passage of the ARPA. We estimate that the average savings under the ARPA subsidies will be $70 per month for current individual market purchasers, ranging from an average savings of $213 (39% of current premiums after subsidies) per month for people with incomes between 400% and 600% of poverty to an average savings of $33 per month (100% of current post-subsidy premiums) for people with incomes under 150% of poverty (who will now have zero-dollar premiums for silver plans with significantly reduced out-of-pocket costs).

We also find that the majority of uninsured people (63%) are now eligible for financial assistance through the Marketplaces, Medicaid, or Basic Health Plans. In fact, more than 4 out of 10 uninsured people are eligible for a free or nearly free health plan through one of these programs.

Changes in Eligibility for Financial Assistance Among the Uninsured

Before passage of the ARPA, it was already the case that most (57%) uninsured people in the U.S. were eligible for financial assistance for coverage under the ACA. With 1.4 million uninsured people newly eligible for subsidized Marketplace coverage under the ARPA, 63% of uninsured people in the U.S. are now eligible for financial assistance to get coverage through the Marketplaces, a Basic Health Plan,1  or Medicaid. The largest group of uninsured people remaining ineligible for financial assistance to get health coverage under the ARPA are undocumented immigrants (3.9 million people). The second largest group of uninsured people ineligible for assistance are those with offers of employer coverage that are deemed affordable under the ACA (3.5 million people). The third largest group of uninsured people ineligible for assistance are those in the Medicaid coverage gap (2.2 million people). An additional 1.1 million uninsured people have a Marketplace plan available to them that is considered affordable without a subsidy (with a benchmark premium less than 8.5% of their household income, which is the cap under the ARPA), discussed more below.

Distribution of Eligibility for ACA Health Coverage Among the Non-Elderly Uninsured

The ARPA includes financial incentives to states to encourage them to expand Medicaid to cover all people with incomes up to 138% of poverty (which 12 states have not done), but it is not certain how many if any new states will take advantage of that extra funding.

All estimates in this analysis depend on insurance coverage status and incomes, which have likely changed to some degree over the course of the pandemic. Our analysis is based on 2019 American Community Survey data, and the time lag is a limitation of the analysis. However, other analyses suggest the uninsured rate may not have changed much during the pandemic, so these estimates likely come close to reflecting current eligibility.

Changes in Marketplace Subsidy Eligibility

Under the ACA, before passage of the ARPA, there were an estimated 18.1 million people eligible for a Marketplace premium subsidy (including people who were insured and those who were uninsured). Because federal ACA subsidies maxed out at 400% of poverty before the passage of ARPA, nearly all of these 18.1 million people eligible for Marketplace subsidies had incomes below 400% of the poverty level, which is $51,040 for a single individual or $104,800 for a family of four. Only a very small group (less than 1%) of people eligible for ACA subsidies before the passage of the ARPA had incomes over 400% of poverty, with only the state of California offering state-funded financial assistance to some people this group.

Number of People Eligible for Marketplace Subsidies Before and After American Rescue Plan Act

We estimate that the number of people eligible for subsidized Marketplace coverage has increased 20% with the passage of the ARPA, from 18.1 million to 21.8 million people, including both insured and uninsured people. Of the people eligible for Marketplace subsidies for the next two years under the ARPA, it is still the case that most (84%) have incomes below 400% of poverty, but now 11% of people eligible for Marketplace subsidies have incomes between 400-600% of poverty (up to an income of $76,560 for a single individual or $157,200 for a family of four). Marketplace subsidies work by capping an individual’s required premium contribution toward a benchmark plan (the second-lowest-cost silver plan) at a certain percent of their income. Marketplace premiums vary by age and location and tend to be higher for older adults and those in rural areas, with unsubsidized premiums for some people in these groups rising above 20% of their income. Because of this, some people with incomes above 600% of poverty will qualify for subsidies, though this is very rare, with only about 5% of people eligible for Marketplace subsidies under the ARPA having incomes over 600% of poverty. Most (61%) people gaining subsidy eligibility under the ARPA were already insured through the individual market, though some may have been purchasing non-compliant coverage or plans with very high cost-sharing. With new subsidies, they will likely be able to afford more comprehensive coverage.

With the passage of the ARPA, we find that the vast majority (92%) of current individual market purchasers (on and off exchange) are now eligible for Marketplace subsidies, so long as off-exchange purchasers are willing to move onto exchange coverage. Plans are similar on and off exchange, but subsidies are only available for people purchasing through an exchange. We estimate that only 8% of current individual market shoppers would not receive a Marketplace subsidy under the ARPA because their incomes are too high relative to the cost of an unsubsidized benchmark plan in their area. Individual market consumers who would still not receive financial assistance under the ARPA tend to have relatively high incomes, averaging more than ten-times the poverty level ($132,600 for a single individual). As such, their benchmark silver premium is less than 8.5% of their household income, and they therefore do not receive a subsidy. If their premium were to rise in the future and cross over 8.5% of their income, they would become eligible to receive a subsidy under the ARPA.

Changes in Premium Payments after Subsidies

As shown in our earlier analysis, the ARPA lowers premiums not just for people who are newly eligible for financial assistance (those with incomes over 400% of poverty), but also for people who were already eligible for subsidies under the ACA and are now eligible for more significant financial assistance.

We estimate that the average savings for current individual market purchasers will be $70 per month (25% of current premiums after subsidies), ranging from an average savings of $213 per month (39% of current premiums after subsidies) for people with incomes between 400% and 600% of poverty to an average savings of $33 per month for people with incomes under 150% of poverty (who will now pay $0 for silver plans with reduced cost sharing). Households with multiple family members purchasing Marketplace coverage could see even greater savings. These estimates and the chart below include all current individual market enrollees, including the few who are still ineligible for a subsidy (and who are therefore counted as having a $0 subsidy).

Average Premium Cost and Subsidy Among Current Individual Market Enrollees Under American Rescue Plan Act

Under the ARPA, Marketplace shoppers with higher incomes will still be liable for a larger share of their premium than people with lower incomes. On average, current individual market enrollees who either stay or move onto the Marketplace will be expected to pay $205 per month for a benchmark silver plan, ranging from $0 per month for people with incomes below 150% of poverty to an average of $513 per month for people with incomes over 600% of poverty.

Uninsured people who could buy on the Marketplace would similarly see lower premiums than they would have if they shopped before the APRA went into effect. Relative to previous premium liability for uninsured people eligible to shop on the Marketplace, the ARPA reduces their monthly costs by an average of $61 (26% of current premiums after subsidies), ranging from $174 (33% of current premiums after subsidies) per month for uninsured people with incomes between 400-600% of poverty to a savings of $23 per month for uninsured people with incomes below 150% of poverty (who are now eligible for $0 premium platinum-like coverage, discussed more below).

Eligibility for Zero-Premium Coverage

Millions of potential Marketplace shoppers will become eligible for zero-premium coverage for two years under the ARPA. There are at least 5.2 million people who are now eligible for zero-premium silver plans with cost-sharing reductions (CSRs) that bring their deductibles down to an average of $177. At this income level, silver plans are modified to resemble platinum coverage. (CSRs lower otherwise applicable cost-sharing in silver plans; three levels of CSR apply to enrollees with income up to 150% FPL, between 150-200% FPL, and between 200-250% FPL.) Additionally, any enrollee receiving unemployment insurance for any part of the year 2021 is also eligible for zero-premium platinum-like coverage. Some people with incomes just above 150% of poverty may also qualify for zero-premium silver plans with slightly less cost-sharing assistance (such that their silver plan resembles a gold plan), and many people also qualify for zero-premium bronze plans, though with much higher deductibles.

We estimate that, at a minimum, about half (46%) of the remaining uninsured population is now eligible for free or nearly free coverage through Medicaid or a zero-premium Marketplace plan, before accounting for people receiving unemployment insurance (so the actual number is likely even larger).

Distribution of Marketplace Eligibility Among the Uninsured

.Cost to Federal Government

The Congressional Budget Office (CBO) and Joint Committee on Taxation (JCT) project that the enhanced premium tax credits included in the ARPA would increase federal deficits by $34.2 billion over ten years (including an increase in direct federal spending of $22.0 billion and a reduction in revenues of $12.2 billion). Additionally, CBO and JCT expect the enhanced subsidies for people receiving unemployment insurance to add another $4.5 billion over the next ten years (including an increase in outlays of $2.4 billion and a decrease in revenues of $2.1 billion).

CBO projections are generally over a 10-year period. Because the enhanced subsidies only last two years, though, most of the costs would be concentrated in 2021 and 2022. However, CBO and JCT expect some new enrollees to continue purchasing subsidized Marketplace coverage for a few years, even if those enrollees are no longer receiving enhanced subsidies.

The CBO and JCT estimate that, in 2022, 1.7 million people would gain coverage through the Marketplace, 1.3 million of whom were previously uninsured. They estimate that new enrollees will account for $13.0 billion in federal costs, with the remaining going to enhanced premium tax credits for existing enrollees.

It remains to be seen whether these additional subsidies will attract significant numbers of uninsured people or off-exchange purchasers to the Marketplaces. Even with the additional subsidies, some current and new enrollees will still face affordability challenges, particularly those who do not qualify for cost-sharing reductions to lower their deductibles.

Methods

Data on population, income, and eligibility for subsidies come from KFF analysis of the Census Bureau’s 2019 American Community Survey (ACS). The ACS includes a 1% sample of the US population and allows for precise state-level estimates. The ACS asks respondents about their health insurance coverage at the time of the survey. Respondents may report having more than one type of coverage; however, individuals are sorted into only one category of insurance coverage.

This analysis does not include individuals who are over the age of 65, who are eligible for Medicaid in 2021, who are in the Medicaid Coverage Gap, or are undocumented immigrants. Under the current ACA structure, workers and their family members are ineligible for tax credits if any worker in the household is offered “affordable” health insurance through their employer. Employer coverage is considered affordable if the worker’s premium contribution for self-only amounts to less than 9.78% of household income. For the purposes of this analysis, people who are uninsured but turned down an offer of employer-coverage are categorized as “uninsured ineligible for financial assistance,” though some of them are likely to have offers of coverage that exceed 9.78% of their income, and hence would be eligible for subsidies to help purchase Marketplace plans. 

2021 Premiums come from KFF analysis of premium data from Healthcare.gov and state rating filings. Unsubsidized premiums used in this analysis are the full price of plans, rather than specifically the portion that covers essential health benefits (EHB). Since premium tax credits can only be used to cover the EHB portion of premiums, some of the individuals denoted as having access to a “free” bronze plan might actually have to pay a very small premium for non-essential health benefits if they enrolled in a bronze plan with added benefits. The ACA does not permit federal subsidies to pay for abortion coverage and requires plans to collect no less than $1.00 per month for this coverage. In CA, IL, NY, ME, OR, and WA, state law requires that that all state regulated plans include abortion coverage. Policyholders who live in these states must pay the abortion surcharge even though they may qualify for subsidies that provide the full cost of premiums if they select a bronze plan. Providence Health Plans in OR and WA have a religious exemption allowing them to exclude abortion coverage. 

  1. The ACA gives states the option to implement a Basic Health Program (BHP) that covers low-income residents through state-contracting plans outside the health insurance marketplace, rather than qualified health plans (QHPs). State Medicaid agencies participate in BHP administration; premiums and cost-sharing are lower and benefits are sometimes broader compared to Marketplace plans. To date, Minnesota and New York are the only states to have adopted a BHP. ↩︎

Moving the Needle on Prescription Drug Costs: Using the Innovation Center and Other Demonstration Authority

Published: Mar 25, 2021

Issue Brief

During the 2020 presidential campaign, President Biden supported several policies to lower prescription drug costs, including proposals to authorize the federal government to negotiate drug prices, cap out-of-pocket drug costs in Medicare Part D, and limit drug price increases to the rate of inflation. Whether or not the 117th Congress acts on these or other prescription drug proposals, the Administration has at its disposal a variety of administrative levers to address drug costs.

This brief focuses on two pathways through which the Biden Administration could use its executive authority to implement policy changes related to prescription drug costs. The first pathway would use the authority provided under the Affordable Care Act (ACA) through the Center for Medicare and Medicaid Innovation (CMMI, or Innovation Center) (established under Section 1115A of the Social Security Act). The Innovation Center is authorized to design, implement, and test new health care payment models to address concerns about rising costs, quality of care, and inefficient spending. The second pathway would use authority that was established soon after Medicare was enacted – known as Section 402 demonstration authority – to implement Medicare demonstrations to test new ways of delivering health care and paying health care providers.

We review examples of recent efforts to use these authorities to lower prescription drug costs, including the Trump Administration’s Most Favored Nation Model initiated through the Innovation Center and the Trump Administration’s proposed $200 prescription drug vouchers for Medicare Part D beneficiaries via Section 402 demonstration authority. We examine questions that have been raised regarding the use of these authorities and discuss how the Biden Administration might use them to implement prescription drug policies. In addition to these pathways, the Administration could employ other administrative tools to implement policy changes related to prescription drug costs, including through annual payment and policy rules, regulatory guidance, and waivers; those tools are not discussed further here.

Background

Since the early days of the Medicare program, the HHS Secretary has had the authority to initiate demonstrations that can lead to permanent changes in the Medicare program. The Secretary was first granted this authority under Section 402 of the Social Security Amendments of 1967, which was then modified by the Social Security Amendments of 1972. Section 402 provides broad authority to the Secretary to develop and implement demonstration projects to test new Medicare payment methodologies, and allows the Secretary to waive compliance with certain Medicare requirements relating to payment and reimbursement to conduct these demonstrations.1  In addition to demonstrations and models initiated by the Executive Branch, Congress has also mandated demonstration projects through legislation, either as part of more comprehensive legislation relating to the Medicare program or as part of appropriations legislation.

In the years leading up to the establishment of the Innovation Center, the Medicare Payment Advisory Commission (MedPAC) and other experts noted shortcomings with the demonstration process, including insufficient and declining funding, the long timeframe for research and evaluation of demonstration projects, administrative barriers including requirements under the Paperwork Reduction Act, implementation or expansion delays due to administrative and judicial review, and the condition of budget neutrality. Further, the process for scaling up successful models required Congressional action, which may delay or block their implementation. Additionally, the Centers for Medicare and Medicare Services (CMS) can be prevented from modifying or ending demonstration models based on early results (whether positive or negative) when models are specified in law.

Partly in response to these concerns, Congress established the CMS Innovation Center in the Affordable Care Act of 2010 (ACA). Congress specifically directed the Innovation Center to focus on models that could potentially lower health care spending for Medicare, Medicaid, and the Children’s Health Insurance Program (CHIP) while maintaining or enhancing the quality of care furnished under these programs. While the focus of the Innovation Center is on Medicare, Medicaid, and CHIP, Innovation Center models have also incorporated multi-payer and all-payer approaches that affect patients with private insurance to increase the potential impact of these models on the broader health system.

Through the Innovation Center, the ACA granted the HHS Secretary more tools to design, adapt, and test models that could produce savings and be more rapidly scaled. The Secretary has the ability to waive more regulations and has broader authority to expand and implement successful Innovation Center programs into Medicare, Medicaid, and CHIP, and terminate the models that fail. Further, the law allocated dedicated funding to the Innovation Center: $5 billion for fiscal year 2010, $10 billion for the years 2011 through 2019, and another $10 billion for each decade thereafter. These funds are not subject to annual appropriations and are designated for the operation of the Innovation Center, including direct support for individual models and delivery system reform initiatives, and operational expenses, including payroll expenses for full-time employees, contracts, and administrative expenses. Notably, Innovation Center models are not subject to the Paperwork Reduction Act, and there is no administrative or judicial review of the Secretary’s decisions for certain aspects of models (described in greater detail below). HHS also cannot require that an Innovation Center model initially be budget neutral.

With the passage of the ACA, the Innovation Center is the primary vehicle through which the Administration tests new models, even though Section 402 demonstration authority has existed much longer. More detailed discussion of these administrative pathways, plus examples of how they have been used to implement policy changes related to prescription drugs, is below.

Innovation Center Models

The ACA established the Innovation Center to test innovative payment and service delivery models that could lead to permanent program changes, with the goal of reducing program spending while preserving or enhancing the quality of care or improving quality of care without increasing spending. The law expanded the Secretary’s authority to waive Medicare and other program requirements in order to develop and conduct these models, and does not limit this authority to reimbursement or payment related changes. (This is in contrast to the Secretary’s waiver authority for Section 402 demonstrations, discussed more below.)

For the sole purpose of testing models, the Secretary may waive all requirements of Title XI of the Social Security Act (SSA) (General Provisions, Peer Review, and Administrative Simplification) and Title XVIII of the SSA (Medicare), three sections of Title XIX of the SSA relating to the Medicaid program, and nearly all sections of Title XIX of the SSA pertaining to the Program of All-Inclusive Care for the Elderly (PACE).2  The waiver authority for Title XI includes all sections, including fraud and abuse laws, such as the federal anti-kickback statute. The waiver authority for Title XVIII also includes all sections, including for example provisions related to Medicare eligibility, covered benefits, and payment rules, among others. However, provisions pertaining to Medicare that are not included in Title XVIII and not explicitly mentioned cannot be waived, such as the Medicare payroll tax of 1.45% on employers and employees, which is specified in the Internal Revenue Code.

Innovation Center Model Implementation and Expansion

Congress gave the Innovation Center more authority to initiate, terminate, modify, or expand models than what is allowed under Section 402 demonstration authority. As defined by statute, Innovation Center models are first implemented under Phase I, and if a model meets certain criteria, it can be expanded, including on a nationwide basis, under Phase II.

phase I

Phase I for Innovation Center models is the testing phase. The law directs the Secretary to select models for testing “where the Secretary determines that there is evidence that the model addresses a defined population for which there are deficits in care leading to poor clinical outcomes or potentially avoidable expenditures.” The law also mentions a list of possible models to be tested including but not limited to:

  • Contracting directly with groups of providers of services and suppliers to promote innovative care delivery models, such as through risk-based comprehensive payment or salary-based payment.
  • Promoting care coordination between providers of services and suppliers that transition health care providers away from fee-for-service based reimbursement and toward salary-based payment.
  • Allowing States to test and evaluate systems of all-payer payment reform for the medical care of residents of the State, including dual eligible individuals.

The ACA prohibits the Secretary from requiring budget neutrality as a condition of testing during Phase 1 of the model. However, after testing of a model has begun in Phase I, the statute authorizes the Secretary to modify the design of a model or terminate a model unless it is expected to:

  • improve quality of care without increasing spending under the applicable program (i.e., Medicare, Medicaid or CHIP);
  • reduce program spending without reducing quality of care; or
  • improve the quality of care and reduce program spending.

The statute also specifies that, following Phase I of the model, the Secretary shall conduct an evaluation of the model, which includes an analysis of the quality of care provided and changes in program spending attributed to the model.

phase ii

Phase II for Innovation Center models is the expansion phase. Under Phase II, taking into account the evaluation from Phase I, the Secretary may expand the duration and scope of a model, through rulemaking, including implementation on a nationwide basis. While not specifically required by statute, Phase I models that require mandatory participation have also typically been subject to the public rulemaking process.

In order for a model to be implemented nationwide, it must meet the following three criteria:

  1. The Secretary determines that such expansion of the model would reduce spending under the applicable program (i.e., Medicare, Medicaid or CHIP) without reducing the quality of care; or would improve the quality of care without increasing spending;
  2. The Chief Actuary of CMS certifies that such expansion would reduce (or would not result in any increase in) net program spending; and
  3. The Secretary determines that such expansion would not deny or limit the coverage or provision of benefits under the applicable program for beneficiaries.

To date, four Innovation Center models have met the statutory criteria to be certified by the Secretary for expansion. These four models are the Diabetes Prevention Program (DPP) model, the Home Health Value-Based Purchasing (HHVBP) Model, the Prior Authorization Model for Repetitive Scheduled Non-Emergent Ambulance Transport (RSNAT), and the Pioneer ACO model. These certifications enable the Secretary to expand the program to become a permanent part of Medicare, as the Secretary did for the Diabetes Prevention Program Model, which became a full preventive benefit in Medicare Part B for eligible beneficiaries (the “Medicare Diabetes Prevention Program”), effective April 2018.

In September 2020, CMS announced that the RSNAT model would be expanded nationwide, though the implementation of the expansion into new states is being delayed due to the COVID-19 pandemic. In January 2021, CMS announced its intent to expand the HHVBP model, and this expansion must be implemented through rulemaking to begin no earlier than January 1, 2022. The Secretary has not made the Pioneer ACO model a part of the full Medicare program.

In contrast to Section 402 demonstrations discussed below, the testing, evaluation and expansion of Innovation Center models are specifically exempted from the Paperwork Reduction Act, which can be time consuming and burdensome.3  Further, the statutory language notes that specific features of the model are not subject to administrative or judicial review:

  • the selection of models for testing or expansion;
  • the selection of organizations, sites, or participants to test those models selected;
  • the elements, parameters, scope, and duration of such models for testing or dissemination;
  • determinations regarding budget neutrality;
  • the termination or modification of the design and implementation of a model;
  • determinations about expansion of the duration and scope of a model.

Section 402 Demonstrations

Since the passage of the ACA, both the Obama and Trump Administrations relied more on the authority provided under the Innovation Center than on Section 402 demonstrations, with a few notable exceptions. Section 402 gives the Secretary authority to engage in demonstration projects to determine whether changes in methods of payment or reimbursement will have the effect of “increasing the efficiency and economy of health services” without affecting quality of care. Such demonstrations could include paying providers for services not otherwise covered by Medicare at the time of the demonstration or experimenting with changing the basis of provider payments.4  Section 402 allows the Secretary to waive requirements under Medicare and Medicaid, but only as long as they relate “to reimbursement or payment on the basis of reasonable cost, or (in the case of physicians) on the basis of reasonable charge.”

While budget neutrality is not specified in statute or regulation, according to CMS’ Medicare Waiver Demonstration Application, “Medicare-waiver-only demonstrations must be budget neutral. Budget neutrality means that the expected costs under the demonstration cannot be more than the expected costs were the demonstration not to occur.” Although most demonstrations have generally conformed to the administrative practice of budget neutrality, there have been exceptions, which are discussed in more detail below. Section 402 demonstrations also have typically been subject to certain types of review such as requirements under the Paperwork Reduction Act and administrative or judicial review.5  Under the Paperwork Reduction Act, agencies that plan to collect data on 10 or more individuals must submit information to the Office of Management and Budget (OMB) on proposed collection efforts as well as provide a 60-day period for public comment.6  Some Section 402 demonstrations, such as competitive bidding for clinical laboratory services and durable medical equipment, have also been subject to judicial review, a situation when the courts review various federal agencies’ actions, typically based on criteria included in the Administrative Procedure Act (APA).

Many of the demonstrations initiated by the Secretary under Section 402 and by Congress have ultimately led to permanent changes in Medicare law. For example, hospice demonstrations beginning in 1974 ultimately led to a hospice benefit becoming first authorized as part of Medicare in the Tax Equity and Fiscal Responsibility Act of 1982 (TEFRA). This benefit was originally scheduled to sunset in 1986 but then permanently added to Medicare benefits in the Consolidated Omnibus Budget Reconciliation Act of 1985. The inpatient prospective payment system (IPPS), which is how Medicare pays hospitals for acute inpatient stays, also had its origins in various demonstration projects. Starting in 1974, the Health Care Financing Administration (a precursor to CMS) engaged in various demonstrations that led to the design of a new Medicare prospective payment system, using a system of diagnosis-related groups (DRGs), which was enacted as part of the Social Security Amendments of 1983. Other demonstration projects that have been expanded program-wide include the skilled nursing facility and home health prospective payment systems; competitive bidding for durable medical equipment; and Medicare coverage for heart transplants.7 

While the funding of some demonstrations has been Congressionally earmarked, CMS has a research, evaluations, and demonstrations (RDE) budget that is appropriated annually. In FY 2020, $20.1 million was appropriated for these activities, significantly less than the funding allocated to the Innovation Center, which averages $1 billion per year. Funding appropriated to the RDE generally fluctuates from year to year, but has been declining over time, particularly after the establishment of the Innovation Center, from $57.4 million in FY 2007 to $35.6 million in FY 2010 and $20.1 million in FY 2020. The RDE section of the budget notes that “CMS leverages other funding sources, such as ACA 3021 (Innovation Center) funding, to support RDE projects wherever possible.”

How Have Innovation Center Models and Section 402 Demonstration Authority Been Used to Address Prescription Drug Costs?

Innovation Center: The Trump Administration leveraged the flexibility and authority of the Innovation Center to address prescription drugs at least three times. Two of the models are ongoing: the Part D Senior Savings model, which limits out-of-pocket costs on insulin in participating Part D plans, and the Part D Payment Modernization Model, which tests the impact of a revised Part D payment structure that creates incentives for plans, patients, and providers to choose drugs with lower list prices in order to better manage spending in the catastrophic phase. This Part D Payment Modernization Model was updated by the Trump Administration for calendar year 2022 to waive the requirement that all drugs in five of six protected classes (all protected class drugs except antiretrovirals) be included in formularies, the requirement that plans cover a minimum of two drugs in other therapeutic classes, and the requirement that sponsors take on downside risk. However, the Biden Administration recently announced that they are not moving forward with these changes. Sponsors may not modify coverage of drugs in protected classes, they must continue to cover a minimum of two drugs in other therapeutic classes, and sponsors must continue to take on two-sided risk to participate in the model. To date, only two Part D plans are participating in this model.

The third model is the Most Favored Nation model, a mandatory nationwide model designed to lower payments for the top 50 Part B drugs that contribute to high Part B spending, by aligning payment for Part B drugs more closely to what other countries pay and removing incentives for doctors to prescribe higher-priced drugs. The model was set to go into effect January 2021, but stakeholders filed lawsuits to block the model from being implemented, with one of the primary complaints being that the Administration violated the APA by not following the appropriate rulemaking process. HHS has been temporarily blocked from implementing this rule under a preliminary injunction issued by the U.S. District Court for the Northern District of California, based on its ruling that the Trump Administration failed to follow the standard notice and comment rulemaking procedures. According to the Innovation Center, the Biden Administration will not implement this rule without further rulemaking.8 

While the Obama Administration frequently used Innovation Center authority, such as for Accountable Care Organizations (ACO), bundled payment models, and in collaboration with states for all-payer ACO models such as in Vermont and Maryland, it did not do so as often relating to prescription drug costs.

In March 2016, the Obama Administration issued a proposed rule for a Part B Drug Payment Model to be implemented through the Innovation Center – although this model was ultimately withdrawn prior to implementation due to criticisms of the mandatory nature of the proposed model and opposition from patient and physician groups. The model offered alternative payment designs for Part B drugs to test whether these approaches would “strengthen the financial incentive for physicians to choose higher value drugs.” Under current law, for most Part B drugs, providers are reimbursed based on the average sales price (ASP) of a given drug plus a 6 percent add-on payment. The first phase of the model would have assigned certain providers an alternative payment approach of ASP plus 2.5 percent, plus a flat fee. The second phase of the model would have tested the application of value-based purchasing tools, in addition to the alternative ASP add-on payments. To eliminate selection bias and test whether these alternative payment approaches would change physician behavior and achieve savings, all providers and suppliers in selected geographic areas would have been required to participate.

While not solely a model pertaining to prescription drugs, the Obama Administration initiated the Medicare Advantage Value-Based Insurance Design (VBID) Model (though the model went into effect during the Trump Administration). Among the variety of payment and delivery approaches the model tests, the model provides Medicare Advantage plans with flexibilities, targeted to Medicare beneficiaries based on chronic conditions, including allowing reductions in cost-sharing for Medicare Part D covered drugs. For 2021, 19 sponsors are participating in this model.

The Obama Administration also initiated the Part D Enhanced Medication Therapy Management Model through the Innovation Center (though the model went into effect during the Trump Administration), which seeks to provide basic, stand-alone prescription drug plans with flexibility to implement innovative medication therapy management programs to optimize medication use. This model is ongoing.

Section 402: The Trump Administration proposed to use Section 402 demonstration authority relating to prescription drugs in order to send $200 prescription drug cards to Medicare Part D beneficiaries, though this proposal was not finalized. According to a draft document, the demonstration was designed to determine whether these $200 drug cards, which would help cover out-of-pocket costs for beneficiaries’ prescription drugs, would improve medication adherence, health outcomes, and improve the efficiency of Medicare payments. Questions pertaining to the design and cost of this proposed demonstration are discussed in more detail in the section below.

One of the Trump Administration’s stated rationales for using this demonstration authority for the proposed drug cards (rather than the Innovation Center) is that CMS has previously used Section 402 authority to test other changes to Part D, citing the Part D Low-Income Newly Eligible Transition Program and the Part D Reinsurance Payment Demonstration (Appendix Table 1). These demonstrations were initiated by the Bush Administration in the years after the enactment of the Medicare Modernization Act of 2003, which created the Part D program for prescription drugs, and before the Innovation Center was established. The Part D Low-Income Newly Eligible Transition Program adjusted weighting for regional benchmarks to ensure low-income Medicare beneficiaries had access to affordable plan choices and increase incentives for them to enroll in low-cost plans. The Part D Reinsurance Payment Demonstration was designed to encourage Part D sponsors to offer enhanced benefit packages by offering an alternative method for reinsurance financing, including paying organizations up-front capitated payments. While the Obama Administration did not use Section 402 demonstration authority relating to prescription drugs, it did use this authority to implement the Medicare Advantage Quality Bonus Payment demonstration, which is discussed below.

Questions Raised About the Use of Innovation Center Models and Section 402 Demonstration Authority

Over the years, the Government Accountability Office (GAO), the HHS Office of Inspector General (OIG), members of Congress, and other stakeholders have raised questions with respect to models initiated through the Innovation Center and demonstrations conducted under Section 402 authority.

Can models require mandatory participation?

Some stakeholders have questioned whether Innovation Center models are allowed to be mandatory, although the ACA does not specify that models must be voluntary. Part of the reason mandatory models have been proposed is to ensure that a sufficient number of providers participate in both the research and control groups, and minimize the risk of selection bias. In 2016, over 170 members of Congress stated in a letter to CMS that the Innovation Center was overstepping its authority by making models mandatory, mentioning the Comprehensive Care for Joint Replacement (CJR) model, and the proposed Part B Drug Payment Model discussed above, among others. The CJR model was initially mandatory for all hospitals in 67 designated areas of the country, but the Trump Administration pared back the mandatory hospital participation requirement, effective January 2018. However, in the final rule that made participation in the CJR model voluntary, CMS responded to commenters who contended that CMS lacks the authority to mandate participation in Innovation Center models, by affirming it does have this authority, stating that:

“We disagree that the Innovation Center lacks the authority to test mandatory models under section 1115A of the Act. Section 1115A of the Act authorizes the Secretary to test innovative payment and service delivery models to reduce program expenditures while preserving or enhancing the quality of care furnished to Medicare, Medicaid, and Children’s Health Insurance Program (CHIP) beneficiaries. Section 1115A of the Act does not specify that participation in models must be voluntary. Moreover, the Secretary has authority to establish regulations to carry out the administration of Medicare. Specifically, the Secretary has authority under both sections 1102 and 1871 of the Act to implement regulations as necessary to administer Medicare, including testing these Medicare payment and service delivery models.”

Are models subject to an adequate rulemaking process?

Some members of Congress have expressed concern with the rulemaking process for Innovation Center models. In a January 2019 letter to CMS, Ways and Means Chairman Richard Neal and Ranking Member Kevin Brady argued that the Innovation Center process has been historically opaque and does not use the traditional rulemaking cycle, particularly for models that are not mandatory. Further, in the 116th Congress, Representative Sewell sponsored H.R.5741, “The Strengthening Innovation in Medicare and Medicaid Act,” which seeks to address these and other concerns, such as requiring more advance public notice and opportunities for stakeholder input, limiting the scope of models to no more applicable individuals than necessary to obtain a statistically valid sample, and establishing judicial review of some aspects of models, including review of the elements, parameters, scope, and duration of such models for testing or dissemination as well as determinations about expansion of the duration and scope of a model.

Concerns over the rulemaking process were one of the main criticisms of the Trump Administration’s Most Favored Nation model, which was finalized in an interim final rule, meaning it can be effective immediately without public comment. This model was set to go into effect January 1, 2021, but stakeholders including PhRMA, BIO, and others, filed lawsuits to block the model from being implemented, with one of the primary complaints being that the Administration violated the APA by not following the appropriate rulemaking process. Generally, the APA requires agencies to publish notices of rulemaking in the Federal Register, providing at least 60 days for public comment before going into effect. The Trump Administration attempted to make a case for a “good cause” exception, which allows them to waive the notice and comment requirements under the APA, citing the “particularly acute need for affordable Medicare Part B drugs now, in the midst of the COVID-19 pandemic.” However, several U.S. district courts agreed with the reasoning in the complaints and have blocked implementation, including a preliminary injunction by the U.S. District Court for the Northern District of California based on its ruling that the Trump Administration failed to follow the standard notice and comment rulemaking procedures.9  According to the Innovation Center, this rule will not be implemented without further rulemaking.

Is the demonstration designed as an experiment, with a comparison group to test for significant outcomes?

One question that has been raised in relation to demonstrations is whether the demonstration has an adequate comparison group. This matter was recently highlighted with the Trump Administration’s proposed $200 prescription drug cards. According to the draft document, the demonstration would test the impact of lower out-of-pocket drug costs on medication adherence and discontinuation rates, as well as downstream effects on health care utilization and Medicare Part A and B spending. However, many experts have questioned the experimental design of the demonstration. Because every Medicare Part D beneficiary who does not receive the most generous level of low-income subsides would be eligible for the card, there would be no comparison group. Critics also argue that the “test” the demonstration seeks to carry out has already been well established, with many studies showing that lower cost sharing for drugs improves medication adherence.

Will the demonstration achieve savings or increase costs?

The high cost of demonstrations has also been a concern, particularly when they are not designed to achieve savings. While most demonstrations conducted under Section 402 authority are generally required to be budget neutral by OMB, this has not been true of all demonstrations. This issue was raised in regard to the Trump Administration’s proposed $200 prescription drug cards. The drug cards were intended to lower the cost of medications, which could improve medication adherence and reduce unnecessary health care utilization, ultimately lowering Medicare Part A and B spending over time. However, the draft document acknowledges that actually observing such reductions would be difficult given the short duration of the demonstration, and estimated that the cost of the demonstration would be $7.9 billion dollars without any estimate of potential savings or expectation of budget neutrality. Many stakeholders were critical of the cost of the plan, with members of Congress sending letters to HHS and GAO seeking to review the proposal’s legality, including a determination of whether the discount card would have “the effect of increasing the efficiency and economy of Medicare” – a condition of section 402 demonstrations.

Though it was not intended to address to prescription drug policy, questions about the cost a demonstration were also raised when the Obama Administration initiated the Medicare Advantage (MA) Quality Bonus Payment demonstration that was in effect from 2012 to 2014. The HHS Secretary initiated this demonstration under Section 402 authority to test an alternative method for calculating and awarding MA bonuses, rather than implementing the bonus structure set forth in the ACA. The Office of the Actuary (OACT) estimated the cost to be over $8 billion dollars.

GAO evaluated the extent to which this demonstration conformed to principles of budget neutrality, relative to other Medicare demonstrations, and recommended canceling the demonstration due in large part to its high cost. The GAO concluded that this demonstration “dwarfs all other Medicare demonstrations—both mandatory and discretionary—conducted since 1995 in its estimated budgetary impact and is larger in size and scope than many of them.”

How Could the Biden Administration Use Executive Authority to Take Action on Prescription Drug Costs?

Having narrow Democratic majorities in both the House and the Senate may give the Biden Administration somewhat more room to implement pieces of its health policy agenda through legislation. But the Biden Administration may also consider executive action, potentially relying on the Innovation Center or Section 402 demonstration authority to pursue health care changes, including changes related to prescription drugs.

Several proposals supported by President Biden during his campaign would lower drug costs for Medicare and private insurers. The Innovation Center has authority and has tested multi-payer or all-payer models that include private insurers in the past (e.g., delivering primary care or providing coordinated oncology treatments). However, it may be somewhat easier to test models that apply exclusively to Medicare in the case of prescription drugs, because the Innovation Center has less leverage outside of the Medicare program to enforce lower payments. For example, the negotiation provision under H.R. 3, the drug price legislation passed by the House of Representatives in December 2019, applied to both Medicare and private insurance, enforced by financial penalties on drug manufacturers that did not agree to participate in the negotiation process. However, an Innovation Center model would not have the same leverage to reach all private insurers, and in particular, would not be able to compel drug manufacturers to offer the lower, negotiated Medicare drug price to private insurers. The Innovation Center would need to identify a new mechanism to apply lower drug prices more broadly to private insurers.

During his campaign, President Biden supported allowing the federal government to negotiate drug prices in Medicare Part D and for other payers as well as “directing the Medicare program to target excessively priced prescription drugs that face little or no competition.” To pursue this goal in the absence of Congressional action, the Biden Administration could, for example, consider initiating a model designed to test whether the federal government could achieve savings, without adversely affecting quality, by negotiating prices under Medicare for high-priced drugs that lack competition. According to CBO’s analyses of previous drug negotiation legislative proposals, CBO expects that Medicare savings would be achieved from negotiations over high-priced drugs that lack competition, which would lead to lower beneficiary premiums and cost sharing. CBO also noted that this new authority would lower revenues for some drug manufacturers, and (depending on design details) could lead to higher drug prices in other countries and a reduction of about 8 drugs coming to market from the 2020 to 2029 period and about 30 fewer drugs over the subsequent decade, due to the loss in revenue for drug manufacturers. However, CBO did not analyze the potential effects of this foregone innovation on public health.

The Biden campaign supported a proposal to “empower the HHS Secretary to negotiate prices that are capped to a level associated with average OECD median prices.” Depending on whether or not the Biden Administration moves forward in some fashion with the Trump Administration’s Most Favored Nation Model that is currently blocked in the courts, the Administration could design a new model to test the use of international reference prices for setting prices for certain Medicare-covered drugs. If similar to the Trump Administration’s model, Medicare’s actuaries estimated $85.5 billion in savings over the course of the 7-year demonstration. However, the pharmaceutical industry and others have raised concerns about the potential for this approach to adversely affect patients’ access to medications and to lead to higher prices in other countries.

During the campaign, President Biden also supported an approach that would limit drug price increases to the rate of inflation. In the absence of legislation, the Administration could consider initiating such a model through the Innovation Center, designed to test whether limiting price increases for certain Medicare-covered drugs to the rate of inflation, such as drugs that have historically high increases year over year, reduces spending for the Medicare program. CBO analyses of similar proposals lawmakers introduced during the 116th Congress for Medicare Part B and Part D drugs indicate the potential for significant savings if drug manufacturers limited price increases to the rate of inflation or paid a rebate to the federal government. Given concerns that inflation caps could result in higher launch prices that would affect Medicare spending and have spillover effects on costs incurred by other payers, the Innovation Center would need to assess in advance of launching the new model whether this model would be expected to achieve net savings for the program (without adversely affecting quality).

This is by no means an exhaustive list of ideas to address prescription drug costs, and Innovation Center and Section 402 demonstration authority are not the only regulatory vehicles for implementing changes to prescription drug policies. Previous administrations have also implemented changes to prescription drug policies through the annual rulemaking process, such as changes to formulary requirements, as in a recent final rule that allows Medicare Part D plans to establish a second specialty tier, and proposed (but not finalized) modifications to the treatment of protected classes in Part D. While the Administration can use annual payment and policy rules to implement programmatic changes, these changes typically are not major shifts in policy as they are not allowed to waive existing Medicare payment rules and statutory requirements using these mechanisms (unlike under demonstration and Innovation Center authority).

KFF polling from December 2020 shows that there is strong bipartisan support for some of President Biden’s health care proposals, including 89% who favor allowing the federal government to negotiate with drug companies to get a lower price on medications that would apply to both Medicare and private insurance – a proposal that would require legislation, such as the bill (H.R. 3) that passed the House of Representatives in the last Congress. While addressing the COVID-19 crisis is clearly the first order of business for the Biden Administration, there will likely be continued pressure to address high prescription drug prices and rising drug costs, and some of these policies could potentially be carried out via the Innovation Center or Section 402 demonstration authority.

This work was supported in part by Arnold Ventures. We value our funders. KFF maintains full editorial control over all of its policy analysis, polling, and journalism activities.


Appendix

Appendix Table 1: Examples of Demonstrations Related to Prescription Drugs

Demonstration Name

Year DescriptionResult
Section 402
Demonstration of Improved Quality of Care for Cancer Patients Undergoing Chemotherapy2005 (modified significantly for 2006)Asks chemotherapy patients questions about how they had responded to treatment and makes additional payment to oncologists for submitting this quality of life and patient care dataConcluded
Reimbursement of State Costs for Provision of Part D Drugs2006Reimburses States for drug costs and related administrative costs incurred during the transition period for full-benefit dually eligible beneficiaries to Medicare Part DConcluded
Medicare Part D Payment Demonstration (also known as Medicare Part D Reinsurance Demonstration)2006Provides alternative methods of receiving reinsurance for drug costs above the “catastrophic” level for Part D plans offering enhanced coverageConcluded
Medicare Demonstration to Transition Enrollment of Low-Income Subsidy (LIS) Beneficiaries2007Phase-in the enrollment weights methodology for regional benchmarks to maintain substantial availability of below-benchmark plans and minimize disruption to LIS beneficiariesConcluded
Innovation Center
Medicare Advantage Value-Based Insurance Design (VBID) Model2017Tests a variety of payment and delivery approaches, including flexibilities targeted to Medicare beneficiaries based on chronic condition, one of which is reductions in cost sharing for covered Part D drugsOngoing through 2024
Part D Enhanced Medication Therapy Management Model2017Provides basic, stand-alone prescription drug plans with flexibility to implement innovative medication therapy management programs with the goal of optimizing medication useOngoing through 2021
Part D Payment Modernization Model2020Tests the impact of a revised Part D program design and incentive alignment on overall Part D prescription drug spending and beneficiary out-of-pocket costsOngoing through 2024
Part D Senior Savings Model2021Allows Part D sponsors, through enhanced plans, to offer a Part D benefit design that limits out of-pocket costs for insulin to $35 a monthOngoing through 2025
Most Favored Nation Model2021Modifies payments for certain Part B drugs that contribute to high Part B spending to align more closely with international prices and also removes incentives for physicians to prescribe high-cost Part B drugsNot yet in effect; HHS enjoined from implementing
NOTE: This table does not include Congressionally mandated models.

Endnotes

  1. This authority also allows for demonstrations under Medicaid, though waivers have been more typically used in the Medicaid program. https://modern.kff.org/medicaid/issue-brief/the-landscape-of-medicaid-demonstration-waivers-ahead-of-the-2020-election/ ↩︎
  2. Medicaid requirements that can be waived include: that a Medicaid program must be operated statewide (Section 1902(a)(1)); that it must have a public process for determining payment rates for hospital services (1902(a)(13)); and a provision relating to prepaid payments under Medicaid managed care (1903(m)(2)(A)(iii)). The Program of All-Inclusive Care for the Elderly (PACE) is section 1934 and the Secretary can waive all provisions except subsections (b)(1)(A) and (c)(5). ↩︎
  3. The Medicare Payment and Advisory Commission, “Report to Congress – Chapter 1: Enhancing Medicare’s Ability to Innovate,” June 2010. http://www.medpac.gov/docs/default-source/reports/Jun10_Ch01.pdf?sfvrsn=0 ↩︎
  4. Ibid. ↩︎
  5. Ibid. ↩︎
  6. Government Accountability Office, “CMS Innovation: Model Implementation and Center Performance,” March 2018. https://www.gao.gov/assets/700/690875.pdf ↩︎
  7. The Medicare Payment and Advisory Commission, “Report to Congress – Chapter 1: Enhancing Medicare’s Ability to Innovate,” June 2010. http://www.medpac.gov/docs/default-source/reports/Jun10_Ch01.pdf?sfvrsn=0 ↩︎
  8. In another case, the U.S. District Court for the Southern District of New York temporarily prohibited the federal government from applying the rule to a single drug (EYLEA), manufactured by Regeneron Pharmaceuticals. ↩︎
  9. The Northern District of California case has been stayed until April 23, 2021, at which point the parties will update the court on whether to continue the stay, allow the lawsuit to proceed, or dismiss the case. In another case, the U.S. District Court for the District of Maryland entered a temporary restraining order prohibiting implementation of the rule until January 20, 2021. The parties agreed to stay the Maryland litigation until a final rule based on the interim final rule is published, provided that the federal government does not seek to have the California court’s preliminary injunction overturned on appeal. If the federal government decides to rescind the interim final rule or otherwise decides not to proceed with it, the parties must notify the court. ↩︎