News Release

Vaccine Monitor: Women and Younger Adults Hit Hardest by Mental Health Impacts Due to COVID-19

Published: Apr 14, 2021

Gender and age differences are revealed in a new analysis that finds nearly seven in ten (69%) young women ages 18 to 29 say the COVID-19 pandemic has negatively impacted their mental health, compared to smaller shares of women who are older and men across all age groups.

By mid-2020 about half (53%) of adults reported that worry and pandemic-related stress had negatively impacted their mental health. Now with millions of U.S. residents getting vaccinated against COVID-19, the latest analysis from the KFF COVID-19 Vaccine Monitor finds 47% of adults continue to report negative mental health impacts, and about a third of this group (or 15% of adults overall) report unmet needs for mental health care. The new report highlights recent data on the mental health impacts of the COVID-19 pandemic across gender, age, race, and income. Key findings include:

  • Women, including mothers with children under 18, younger adults, and those in middle income groups are most likely to report their mental health has been negatively impacted as a result of the pandemic, compared to those 65 and older and men, including fathers with children under 18, who are least likely to report any mental health impact from the pandemic.
  • The groups most likely to be worried that they or a family member may get sick from COVID-19 are women, Black and Hispanic adults, and younger adults. Among those expressing this worry, nearly six in ten say it has negatively impacted their mental health, showing a direct link between worry and negative mental health impact.
  • Among mothers who say their mental health had been negatively impacted by the pandemic, nearly half (46%) report they did not get the mental health services or medications they needed, representing about one in four (27%) mothers overall.
  • Among adults who did not get the mental health care they may have needed in the past year, some of the biggest reasons include not being able to find a provider (24%), inability to afford the cost (23%), or being too busy or unable to take off work in order to seek treatment (18%).

The KFF COVID-19 Vaccine Monitor is an ongoing research project tracking the public’s attitudes and experiences with COVID-19 vaccinations. Using a combination of surveys and qualitative research, this project tracks the dynamic nature of public opinion as vaccine development and distribution unfolds, including vaccine confidence and hesitancy, trusted messengers and messages, as well as the public’s experiences with vaccination.

News Release

Private Insurers Are Expected to Pay $2.1 Billion in Rebates to Consumers This Year for Excessive Health Insurance Premiums Relative to Health Care Expenses

Published: Apr 12, 2021

Private insurance companies are expecting to pay out $2.1 billion in rebates to consumers this fall, the second highest amount ever issued under the Affordable Care Act, according to a new KFF analysis.

The rebates, which are calculated based on the share of premium revenues that insurance companies paid out for health care expenses and quality improvement, are roughly $400 million lower than last year’s record high of $2.5 billion, but more than 50 percent higher than the $1.4 billion insurers sent back to policy holders in 2019.

Rebate amounts will vary by market. Individual market insurers account for the majority of the payments, with expected rebates of at least $1.5 billion, finds the analysis of data reported by insurers to the Centers for Medicare and Medicaid Services. Rebates in the small and large group insurance markets are expected to be $308 million and $310 million, respectively. The amounts are preliminary estimates, with final rebate data coming later this year.

The rebates are the result of insurance companies not meeting the ACA’s medical loss ratio threshold, which requires insurers to spend at least 80 percent of premium revenues (85% for large group plans) on health care claims or quality improvement activities. Most people in large group plans are in self-insured plans, which the MLR threshold rule does not apply to.

Not all policy holders are due rebates, but among those who are, this year’s rebates work out to roughly $299 per plan member in the individual market, $127 per member in the small group market and $95 per member in the large group market, according to KFF’s analysis. By law, insurance companies must begin issuing the latest rebates to eligible consumers later this fall.

One reason some companies failed to meet the threshold in 2020 is that the pandemic drove health spending and utilization down, as providers cancelled elective procedures and consumers opted to forego routine care out of fear of being infected. As a result, insurers generated higher levels of profits than they had anticipated when they set their 2020 premiums well before the pandemic emerged. Overall rebates would have been even higher had some insurers not taken steps to increase their claims costs relative to their premium income, including offering premium holidays and waiving certain out-of-pocket costs for enrollees, such as costs for telemedicine and for treatment for COVID-19. Claims costs also began to rise toward the end of the year during the winter surge in COVID-19 cases.

Rebates are calculated using a three-year average so the large rebates are not just a side effect of the pandemic. In the individual market, this year’s rebates are driven in large part by significant insurer profits in 2018 and 2019 (as rebates issued in 2021 are based on insurer financial performance in 2018, 2019, and 2020).

For more data and analyses about the pandemic, insurers’ financial performance and the ACA, visit kff.org.

News Release

Analysis: Hospital Price Transparency Data Lacks Standardization, Limiting Its Use to Insurers, Employers, and Consumers

Published: Apr 9, 2021

In spite of a new price transparency rule that requires hospitals to publish the prices of common health services, comparing prices across hospitals remains challenging due to limited compliance with the law and a lack of standardization in the available data, a new KFF analysis finds.

The federal rule, which went into effect on January 1, 2021, aims to lift the veil on how much health plans pay hospitals for health services. To be compliant, hospitals must post payer-specific negotiated rates for medical services and products in two formats on their websites: in a machine-readable file that insurers, employers, health care providers, and other stakeholders can use to compare prices across providers, and in a consumer-friendly tool that allows patients to shop for lower-priced care.

Using data collected from large hospitals in all 50 states and the District of Columbia, the analysis finds limited compliance with the new federal rule. Only 35 of the 102 hospitals included in the analysis provide some payer-negotiated rates accessible to the public in a machine-readable file; only 3 provide payer-negotiated rates via consumer tools.

Even when hospitals are compliant, the lack of data standardization makes it difficult to compare prices across facilities. Many of the hospitals included in the analysis define and describe prices differently. For example, some hospitals include professional fees (e.g., for physician services) in the posted prices, other hospitals do not, and still others do not specify either way. Many hospital machine-readable files are inconsistently formatted and leave out key information, including the full range of payers and plans in a given region.

While the new price transparency data does not yet support price comparison across hospitals, it could in some cases facilitate analysis of price variation within a hospital. Using payer-negotiated rates from ten U.S. hospitals, the brief finds significant variation in the price of common services. For example, the price of a lower back MRI at a hospital in New Mexico ranged from $221 to $2,142 depending on the payer. The authors note that the available hospital data does not always clearly indicate the market in which a payer is operating; thus, an analysis of variation in prices by insurer market segment is not possible for most hospitals examined.

The brief is available on the Peterson-KFF Health System Tracker, an online information hub dedicated to monitoring and assessing the performance of the U.S. health system.

Early Results from Federal Price Transparency Rule Show Difficultly in Estimating the Cost of Care

Authors: Nisha Kurani, Giorlando Ramirez, Julie Hudman, Cynthia Cox, and Rabah Kamal
Published: Apr 9, 2021

A new issue brief examines compliance with a new federal price transparency rule and variation in payer-negotiated rates at U.S. hospitals. The analysis looks at the websites of the two largest hospitals in each state and the District of Columbia, and finds that a lack of consistency in the data and limited compliance among the hospitals sampled makes it difficult to compare prices across facilities.

The brief is available on the Peterson-KFF Health System Tracker, an online information hub dedicated to monitoring and assessing the performance of the U.S. health system.

COVID-19 Vaccination among American Indian and Alaska Native People

Published: Apr 9, 2021

Summary

With the distribution of the COVID-19 vaccine underway, ensuring equitable and rapid distribution to the U.S. population will be important for mitigating the disproportionate impacts of the pandemic for people of color, preventing widening racial health disparities going forward, and achieving broad population immunity. Reflecting underlying inequities, the COVID-19 pandemic has disproportionately affected American Indian and Alaskan Native (AIAN) people who account for over 5 million people in the U.S. At the same time, vaccination rates among AIAN people have been higher than average to date. This brief presents available data on COVID-19 vaccinations among AIAN people from federal and state sources and discusses factors contributing to success in these vaccination efforts. It finds:

Underlying inequities that existed prior to the pandemic contribute to AIAN people facing increased barriers to accessing health care and being disproportionately affected by the COVID-19 pandemic. Chronic underfunding of the Indian Health Service (IHS) relative to health needs and high uninsured rates contribute to barriers to health care among AIAN people. Existing social, economic, and health inequities have also led to higher rates of illness and death among AIAN people due to COVID-19.

Data available to date show that AIAN people are being vaccinated at a higher rate compared to other racial/ethnic groups. Federal data show that 32% of AIAN people had received at least one dose of a COVID-19 vaccine, compared to 19% of White people, 16% of Asian people, 12% of Black people and 9% Hispanic people of as of April 5, 2021.State data similarly find higher vaccination rates among AIAN people compared to other groups.

The high vaccination rate among AIAN people largely reflects Tribal leadership in implementing vaccine prioritization and distribution strategies that meet the preferences and needs of their communities. The high rates may also, in part, reflect the greater supply of vaccine doses delivered to the IHS relative to the number of people served compared to state vaccination programs. Tribes have supported and built on existing trusted community resources and providers to distribute vaccines. The success Tribes have achieved in vaccinating their communities provide lessons learned that may help inform broader vaccination efforts going forward.

Background: Health and Health Care for AIAN People

Under treaties and laws, the federal government has a unique responsibility to provide health care services to AIAN people. The IHS is the primary vehicle through which the federal government fulfills this responsibility for members of federally recognized tribes, who make up approximately 2.6 million of the over 5 million individuals who self-identify as AIAN nationwide. The IHS provides services directly, through Tribally operated health programs, and through services purchased from private providers. The IHS also funds Urban Indian Organizations to make health care services accessible to people who reside in urban areas, who include most of the AIAN population.

Due to longstanding limitations and underfunding of the IHS, AIAN people face disproportionate barriers to accessing health care. IHS services generally are limited to members of or descendants of members of federally recognized Tribes, and not all individuals who self-identify as AIAN belong to one of these Tribes. IHS historically has been underfunded to meet the health care needs of AIAN people, and access to services through IHS often varies across locations. Given the limitations of IHS, Medicaid and other sources of health insurance remain important for expanding access to care for AIAN people. However, as of 2019, 22% of AIAN nonelderly people were uninsured, the highest of all racial and ethnic groups (Figure 1).

Figure 1: Uninsured Rates among the Nonelderly Population by Race/Ethnicity, 2019 ​

The COVID-19 pandemic has disproportionately affected AIAN people. AIAN people face increased risk of exposure to the virus to due underlying social and economic factors and have higher high rates of health conditions that put them at increased risk for serious illness if they contract coronavirus. Reflecting these increased risks, AIAN people are nearly twice as likely to be infected with the virus, nearly four times likely to be hospitalized, and nearly two and half times as likely to die due to COVID-19 as their White counterparts, based on age-adjusted data (Figure 2).

Figure 2: Risk of Infection, Hospitalization, and Death Compared to White People in the U.S., Adjusted for Age​

COVID-19 Vaccination among AIAN People

The federal government is allocating COVID-19 vaccines directly to the IHS, and Tribal health programs and Urban Indian Organizations choose whether to receive vaccines directly from the IHS or through their respective state distribution mechanisms. As of March 15, 2021, 351 of the 609 IHS facilities, Tribal health programs, and Urban Indian Organization facilities had elected to receive vaccines directly through IHS; facilities can change their election. When Tribal health programs and Urban Indian Organizations elect to receive vaccines through the state, the CDC provides the state a “sovereign nation supplement” of vaccine doses. CDC data shows that as of April 5, 2021, nearly 1.5 million vaccine doses had been delivered to IHS, over 1 million doses had been administered via IHS, and more than 630,000 people had received at least one dose through IHS, making up over 30% of the population served by IHS.

Data available to date suggest that AIAN people are being vaccinated at a higher rate compared to other racial/ethnic groups. Data gaps limit the ability to have a complete picture of who is being vaccinated and how vaccination rates vary across groups. However, data available to date show that AIAN people are being vaccinated at a higher rate relative to other racial/ethnic groups. For example, federal data from CDC, which were available for about half of people who have received at least one dose as of April 5, 2021, suggest that over 720,000 AIAN people had received at least one COVID-19 vaccine dose, making up over 30 percent of the 2.2 million people who self-identify solely as AIAN (Figure 3). In contrast, these data show 19% of White people, 16% of Asian people, 12% of Black people, and 9% of Hispanic people had received at least one vaccine dose.

Figure 3: Percent of Total Population that has Received 1 or More COVID-19 Vaccine Doses by Race/Ethnicity, April 5, 2021

State-level data on vaccinations among AIAN people is limited. Only 36 states were reporting vaccinations among AIAN people as of March 29, 2021. Moreover, the state-reported data does not reflect vaccines administered through allocations received through IHS, and, as such, may understate vaccination rates and further limit the ability to calculate reliable estimates. However, data from several states show that AIAN people are being vaccinated at higher rates compared to other groups. For example, in Alaska, 22% of vaccinations have gone to AIAN people while they account for 15% of the population. The pattern is similar at the county-level. As of April 5, 2021, counties with high shares of AIAN people had a higher average vaccination rate (20%) when compared to the average across counties and counties with low shares of AIAN people (19% and 18%, respectively).1 

Factors Contributing to High AIAN Vaccination Rates

The high vaccination rate among AIAN people stands in stark contrast to the gaps in vaccinations for Black and Hispanic people observed to date. The underlying inequities and barriers to health care facing AIAN people similarly could have led to barriers to vaccination. However, experiences suggest that the autonomy provided to Tribes to design and implement vaccine distribution efforts among their communities has contributed to success in vaccinating the population. The high rates may also, in part, reflect the greater supply of vaccine doses delivered to the IHS relative to the population served compared to state vaccination programs. As of April 5, 2021, over 1.5 million doses had been delivered to IHS, which represents roughly nearly 75,000 per 100,000 people served by the IHS. Only 2 states and Washington DC had higher rates of doses delivered than the IHS, although the IHS rate of doses administered is lower compared to these states. Additionally, the availability of more complete race/ethnicity data for AIAN people receiving the vaccine, since many are receiving it through IHS, Tribal health, and Urban Indian Organization facilities, may also be contributing to the high rates. Federal and some state data have high shares of vaccinations with unknown or “other” race/ethnicity, which may affect vaccination rates across racial/ethnic groups.

IHS, Tribal health programs, and Urban Indian Organizations have autonomy and flexibility to implement priority and distribution strategies that meet the needs and preferences of their communities. The IHS developed a COVID-19 Vaccine Task Force (VTF) to advance plans for prioritization strategies, vaccine administration, distribution, data management, safety and monitoring, and communications. Consistent with the federal recommendations from the Advisory Committee on Immunization Policies (ACIP), IHS first prioritized health care workers and residents of long-term care facilities. Initial doses allocated to IHS were estimated to be sufficient for 100% of its health care workforce and residents of long-term care facilities. Like states, Tribes and Urban Indian Organizations have authority to make their own prioritization decisions. Many chose to prioritize elders and some, like the Standing Rock Sioux Tribe, prioritized speakers of native languages, to protect against further losses of culture and traditions that the pandemic has threatened. Several Tribes, including Chickasaw Nation, Cherokee Nation, and Lummi Nation, have already had so much success in vaccinating their priority groups that they have expanded distribution to include non-Native members of the public.

Tribes are building on and supporting existing trusted community resources and providers to distribute vaccines. Tribes are utilizing the networks and resources in the community and drawing upon years of experience to reach tribal members with various access barriers. For example, the Navajo Nation has vaccinated between 4,000 and 5,000 homebound citizens by collaborating with public health workers to reach those residents in rural communities. In Alaska, tribal health organizations relied on longstanding strategies developed to reach geographically isolated communities, including partnering with local pilots to transport pharmacists and vials of vaccines to such areas. In addition, many Tribes have established vaccine sign-up systems that match the resources and preferences of their populations. For example, media reports suggested that many Tribes have set up call centers to answer inquiries, book appointments, and reach out to people.

Tribes have launched tailored outreach and communication plans that share culturally relevant messages through trusted individuals in the community. A national survey of AIAN people conducted in late 2020 found that the majority were willing receive a COVID-19 vaccine and that the most commonly held motivation for getting a vaccine was a sense of responsibility to protect the Native community and preserve cultural ways. Regardless of willingness to get a vaccine, the most frequently reported concern about the vaccine was how fast the vaccine moved through clinical trials. Some Tribes have utilized fluent language speakers to address concerns about the vaccine among the community. For example, the Cherokee Nation prioritized Cherokee language speakers to create optimism and show that the vaccine was safe. Similarly, the Navajo Nation employed fluent doctors and health care professionals to serve as trusted sources of information on the vaccine.

Looking Ahead

Given the disparate impacts of COVID-19 on AIAN people and the barriers and challenges they face to accessing health care, ensuring access to the COVID-19 vaccine is particularly important. Data available to date show a high COVID-19 vaccination rate among AIAN people, largely reflecting the role of Tribes in designing and implementing vaccine distribution strategies that meet the needs and preferences of the communities they serve. The success Tribes have achieved in vaccinating their communities provide lessons learned that may help inform broader vaccination efforts going forward. The American Rescue Plan Act of 2021 provides IHS with an additional $600 million for vaccine efforts, $1.5 billion to trace COVID-19 infections, $240 million to establish and sustain a COVID-19 public health workforce, and $600 million for COVID-19 related facility improvements, which may further enhance Tribal vaccination efforts and their response to COVID-19.

  1. KFF analysis of Centers for Disease Control and Prevention’s (CDC) COVID-19 Integrated County View data. Counties in which the share of AIAN people is above the national average of 0.7% were classified as counties with high shares of AIAN people. Of the 2,350 reporting counties, 617 fall into the high share of AIAN people category (26% of the counties). ↩︎
News Release

Vaccine Monitor: More than Half of Rural Residents Have Gotten a COVID-19 Vaccine or Intend to Do So as Soon as Possible

1 in 5 Rural Residents Say They Definitely Won’t Get Vaccinated, Reflecting the Larger Share of Republicans and White Evangelical Christians Who Live There; Most Rural Residents Say Vaccine Supply and Access is Not a Problem, though Black Residents Report Greater Difficulties

Published: Apr 9, 2021

More than half (54%) of rural adults say they have already gotten at least one dose of a COVID-19 vaccine or will do so as soon as possible, as rural residents report less issues with both supply and access than those living in urban and suburban areas, according to a new KFF COVID-19 Vaccine Monitor report focused on rural America.

A somewhat larger share of rural residents (39%) than those living in urban (31%) or suburban (31%) areas say they have already received at least one dose of a COVID-19 vaccine.

However, there is a larger share of rural residents (21%) than urban (10%) or suburban (13%) ones saying they will “definitely not” get a COVID-19 vaccine, a gap largely explained by the concentration of Republicans and White Evangelical Christians who live there.

Among rural residents who say they will “definitely not” get vaccinated, nearly three quarters (73%) identify as Republican or Republican-leaning, and 4 in 10 (41%) identify as White Evangelical Christians.

“There’s nothing inherently unique about living in a rural area that makes people balk at getting vaccinated,” KFF President and CEO Drew Altman said. “It’s just that rural areas have a larger share of people in the most vaccine-resistant groups: Republicans and White Evangelical Christians.”

The new report examines in depth the vaccine-related views and experiences of a nationally representative sample of rural residents. Earlier Vaccine Monitor reports showed concerns about vaccine uptake among this group, which represents about a fifth of the nation’s population and has often reported difficulty accessing health care.

Among rural residents who have not received a COVID-19 vaccine, few (11%) say they have tried to get an appointment – half the share of those living in urban (21%) and suburban (22%) areas.

The large share of rural residents who say they will “definitely not” get vaccinated, and the relatively small shares who have tried to get an appointment or who hope to get vaccinated “as soon as possible” suggest the potential for vaccination rates in rural America to eventually lag behind those in urban and suburban areas.

Rural residents are more likely to say that their area has enough COVID-19 vaccine to serve their communities (58%) than residents of urban or suburban communities are (46% each). In addition, two thirds (68%) of rural residents say there are enough locations to get vaccinated, compared to just over half of urban (52%) and suburban (55%) residents.

Importantly, fewer Black rural residents (53%) than White (69%) or Hispanic (67%) rural residents say there are adequate vaccination locations in their communities. In addition, half of Black (47%) and Hispanic (52%) residents, compared to 6 in 10 White adults (59%), say there is an adequate supply of vaccine.

“Contrary to conventional wisdom, most rural residents have embraced the COVID-19 vaccine, with over half saying they’ve gotten it already or want to get it as soon as they can,” KFF Executive Vice President Mollyann Brodie said. “Most people in rural areas believe their communities have enough vaccine and places to get vaccinated, though fewer Black residents do, suggesting a gap in access.”

The report also captures the impact of a variety of potential incentives, messages, and pieces of information on vaccination uptake.

Similar to the general public, various incentives and messages are most effective in moving rural residents in the “wait and see” and “only if required” groups. For example, at least half of those in the “wait and see” group say hearing that the vaccines are nearly 100% effective at preventing hospitalization and death from COVID-19 (64%) or that scientists have been working on the technology used in the new COVID-19 vaccines for 20 years (52%) will make them more likely to get vaccinated.

Across the board, none of the messages or pieces of information were effective at moving those who say they will definitely not get vaccinated.

Other highlights include:

  • Half of adults in rural areas (49%) who have received at least one dose of a COVID-19 vaccine say it took them less than 15 minutes to get to the vaccination site, similar to the share of urban and suburban residents who say so.
  • Rural residents (40%) are less likely to say they are worried about themselves or their family members getting sick from coronavirus than urban (54%) and suburban residents (49%) are, and are more likely to believe the news has “generally exaggerated” the seriousness of the coronavirus pandemic (44%) than urban (27%) and suburban (33%) residents are.
  • More (58%) rural residents view getting vaccinated as a personal choice rather than part of everyone’s responsibility to protect the health of others (42%). The reverse is true among urban residents, while suburban residents are more evenly divided.

Designed and analyzed by public opinion researchers at KFF, the KFF Vaccine Monitor: Rural America was conducted from March 15-29 among a nationally representative random digit dial telephone sample of 1,001 adults living in rural America, the margin of sampling error is plus or minus 4 percentage points. For results based on subgroups, the margin of sampling error may be higher. All comparisons to urban and suburban residents are from the KFF March Vaccine Monitor. The KFF COVID-19 Vaccine Monitor is an ongoing research project tracking the public’s attitudes and experiences with COVID-19 vaccinations. Using a combination of surveys and qualitative research, this project tracks the dynamic nature of public opinion as vaccine development and distribution unfold, including vaccine confidence and hesitancy, trusted messengers and messages, as well as the public’s experiences with vaccination.

Poll Finding

KFF COVID-19 Vaccine Monitor- Rural America

Published: Apr 9, 2021

Findings

The KFF COVID-19 Vaccine Monitor is an ongoing research project tracking the public’s attitudes and experiences with COVID-19 vaccinations. Using a combination of surveys and qualitative research, this project tracks the dynamic nature of public opinion as vaccine development and distribution unfold, including vaccine confidence and acceptance, information needs, trusted messengers and messages, as well as the public’s experiences with vaccination.

Key Findings

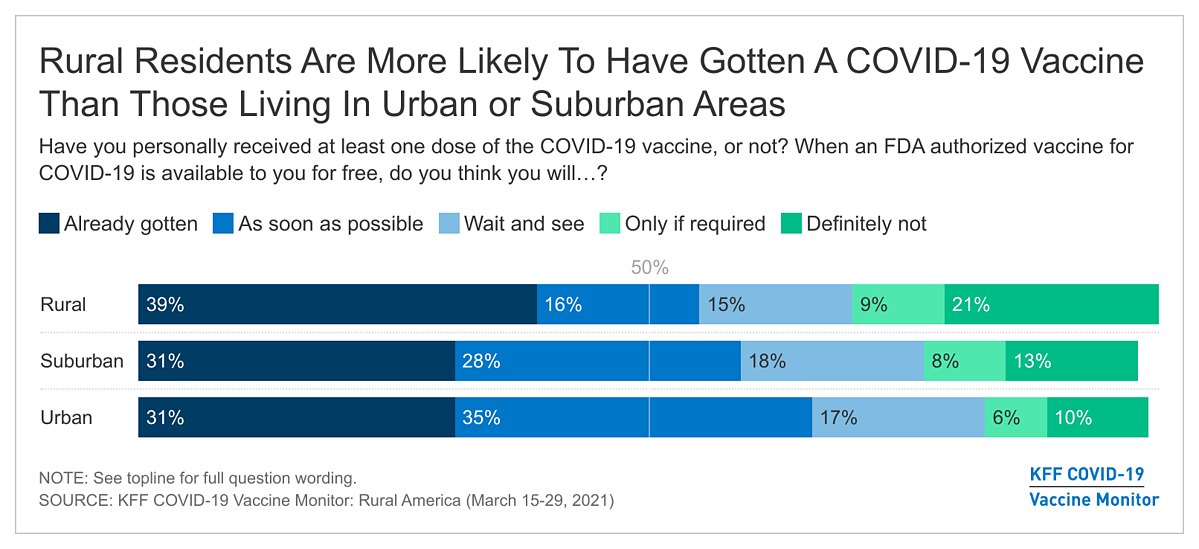
  • The KFF COVID-19 Vaccine Monitor took a deep dive into how the coronavirus pandemic has impacted rural communities in the U.S. including an analysis of the vaccine intentions of rural residents. Based on interviews of 1,001 adults living in rural America, the Monitor finds four in ten (39%) saying they have already gotten at least one dose of a COVID-19 vaccine, larger than the shares of adults living in urban or suburban areas who say the same (31% each). The Monitor results suggest there are many reasons why rural communities may so far be outpacing suburban and urban areas in vaccination rates, including the fact that rural residents are more likely than urban and suburban residents to say their community has enough vaccination locations and vaccine supply.
  • While rural residents have outpaced suburban and urban residents in early self-reported uptake of COVID-19 vaccines, fewer rural residents compared to urban and suburban residents say they are planning or considering getting vaccinated. Three in ten rural residents say they will get vaccinated as soon as possible (16%) or are waiting to see how it is working for other people (15%), compared to about half of urban and suburban residents who say the same. Three in ten rural residents say they will either “definitely not” get vaccinated or will only do so if required, and few unvaccinated rural residents (11%) say they have tried to get an appointment. These results suggest that vaccination uptake in rural America may start lagging behind urban and suburban areas. The groups within rural communities that are the least likely to report either already receiving a vaccine or planning to do so as soon as possible are Republicans, White Evangelicals, essential workers in fields other than health care, and young adults 18-49. About three in ten in each of these groups report they will “definitely not” receive a COVID-19 vaccine.
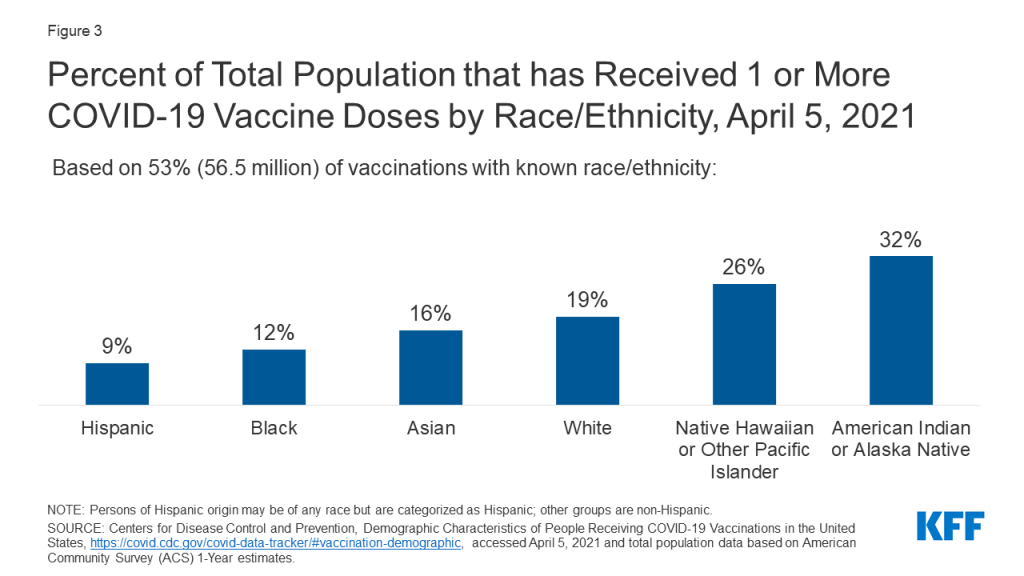
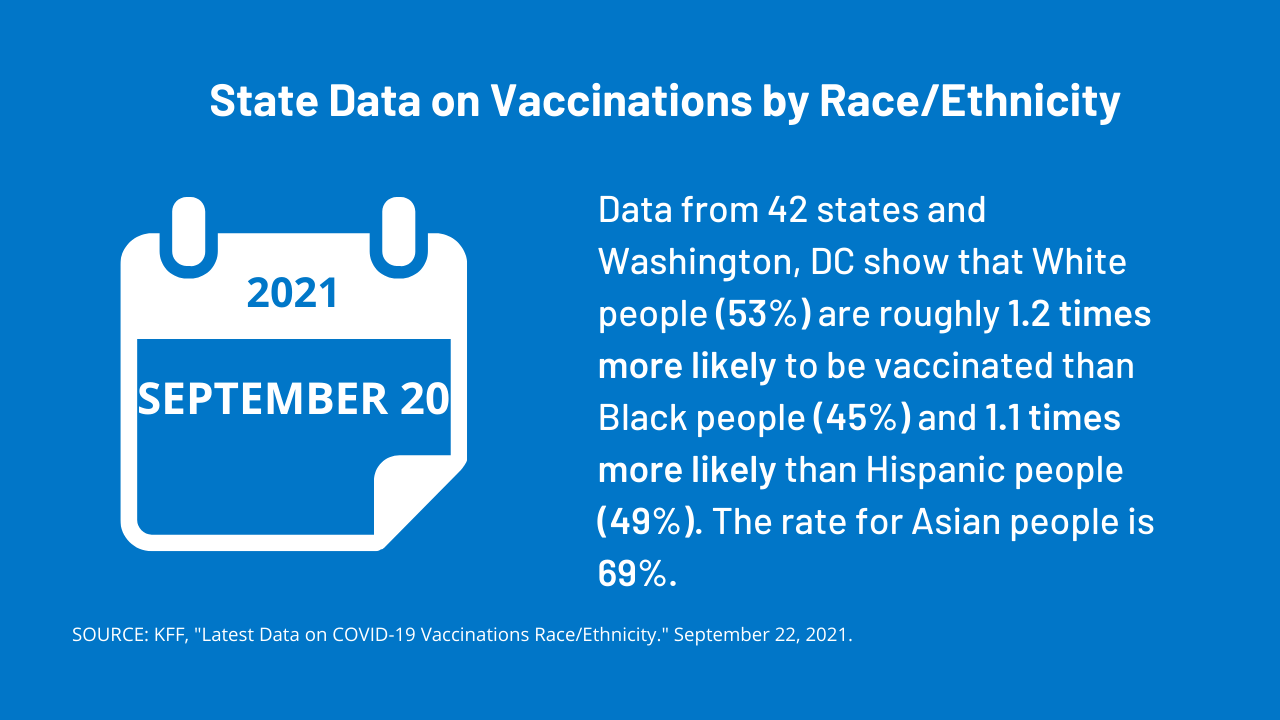
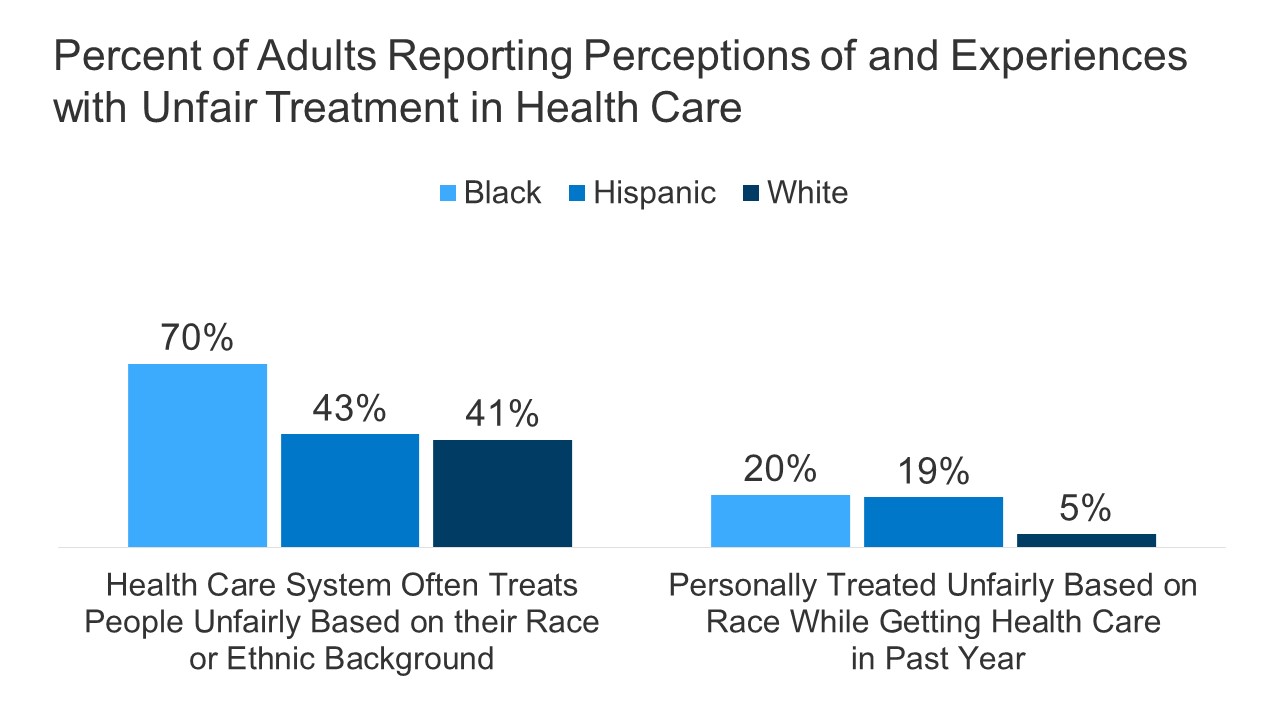
  • More than half of Black rural adults (64%) say they have either received a vaccine or will do so as soon as they can, but this population also disproportionately reports difficulty accessing COVID-19 vaccine resources. Less than half of Black adults say their rural communities have enough supply of COVID-19 vaccine (compared to 59% of White rural adults) and half (53%) say their community has enough vaccination locations (compared to 69% of White adults). Access to COVID-19 vaccines within the Black community is consistent with other forms of health care access in rural communities with Black residents also less likely than White residents to say their community has enough hospitals and doctors and health care providers.
  • While the concerns about the vaccine for those living in rural areas are similar to urban and suburban areas, there are a variety of other attitudes towards the pandemic overall that may help explain why a larger share of rural residents say they will “definitely not” get vaccinated. About six in ten rural residents (compared to less than half of urban and suburban residents) say getting vaccinated against COVID-19 is a personal choice. Rural residents are also less likely to say they are worried about themselves or their family members getting sick from coronavirus or that they wear a mask most of the time when they leave their house.

COVID-19 Vaccine Intentions In Rural America

About four in ten U.S. adults living in rural areas say they have already received at least one dose of a COVID-19 vaccine (27% say they have received a full course either receiving both doses of a two-dose vaccine or a one-dose vaccine). The share of rural residents who have been vaccinated is up sixteen percentage points from February 2021 as many states increase their vaccine rollout to larger shares of the population, with an additional 16% of rural residents saying they will get the vaccine as soon as they can. At the same, nearly half of rural residents say they are either taking a “wait and see” approach (15%), they will get the vaccine only if they are required to do so for work, school, or other activities (9%), or that they will “definitely not” get the vaccine (21%), similar to the shares who have given those responses since January.

While a larger share of rural residents say they have already received at least one dose of a COVID-19 vaccine than urban and suburban residents (31%, each), fewer rural residents compared to urban and suburban residents say they will get it as soon as possible (16% compared to 35% and 28%). This suggest that vaccine uptake in rural communities is currently outpacing urban and suburban areas but may begin lagging behind more populated areas as they experience increased access. Two-thirds of those living in urban areas say they have either already received a vaccine or will get it as soon as possible as do six in ten (59%) of those living in suburban areas.

Vaccine uptake does not differ within rural communities of varying size or regions of the U.S. Fifty-six percent of those living in less populated rural areas report receiving a vaccine or intending to get it as soon as they can, as do 52% of those living in more populated rural areas. In addition, similar shares of rural residents living in the Midwest, South, and West say they have already been vaccinated or will as soon as possible (50%, 57%, 56%).

Looking across various demographics within rural communities, the groups most likely to say they’ve either already gotten the vaccine or will get it as soon as possible are Democrats and Democratic-leaning independents (82%), adults ages 65 and over (79%), and college graduates (67%). About three in ten Republicans (32%), essential workers in field other than health care (29%), and adults under the age of 50 (28%) say they will “definitely not” get the vaccine.

Understanding Who Is “Wait and See” And Who Is “Definitely Not” Getting the VACCINE In rural America

Twenty percent of U.S. adults live in rural America and this significant segment of the population reflect a very diverse community across race and ethnicity, educational levels, employment, partisanship and many other factors. In addition to understanding the vaccine intentions among certain demographic groups, it is also important to understand the demographics of the varying vaccine intention groups. Large shares of those who say they will “definitely not” receive a COVID-19 vaccine self-identify as White Evangelicals (41%) and Republicans or Republican leaning independents (73%). More than eight in ten in this group (85%) also say they do not normally get a flu vaccine.

Access To COVID-19 Vaccines In Rural Communities

Despite the fact that about half of rural residents who have not yet been vaccinated believe they are currently eligible to receive a vaccine, few (11%) say they have tried to get an appointment, which is half the share of those living in urban (21%) and suburban (22%) areas. A majority of rural residents who have tried to get an appointment say they were able to get one. Among those who say they were unable to get an appointment for a vaccine, the most common reason why was that they did not meet their area’s eligibility requirements, followed by a smaller portion who reported there weren’t any appointments available.

A majority of rural adults think their community has enough hospitals (73%), doctors and health care workers (70%) to serve local residents as well as enough COVID-19 vaccination locations (68%) and supply of the COVID-19 vaccine (58%) for local residents. Perception of availability of COVID-19 vaccines and vaccination locations does not vary within types of rural communities. Adults who live in more populated rural areas, on the whole, are no more or less likely to report enough access to the services listed than those who live in less populated rural areas.

Consistent with the higher reported vaccination rates among rural residents, the Monitor finds that rural residents are more likely to say their community has enough supply of the COVID-19 vaccine to serve local residents than urban or suburban community members (46% each). In addition, 68% of adults in rural areas report having enough vaccination locations, compared to smaller shares of urban (52%) and suburban (55%) adults.

Eight in ten suburban adults report having enough hospitals to serve their community than either urban or rural residents (compared to 76% urban and 73% rural), which is similar to the share who say the same about the number of doctors and health care providers. Less than half of urban, suburban, and rural residents say their community has enough mental health providers.

Among those living in rural areas, Black adults are less likely than White and Hispanic adults to feel their community has enough health care providers and vaccination access to serve the local population. Slightly less than half of Black rural adults say their community has enough supply of the COVID-19 vaccine, while 59% of White rural adults and 52% of Hispanic rural adults say the same. In addition, while about two-thirds of Hispanic and White rural adults say their community has enough vaccination locations, about half of Black rural adults think so. Black residents in rural communities are also less likely than White and Hispanic residents to say their community has enough hospitals, and doctors and health care providers.

In addition to perceived access to COVID-19 vaccines and vaccination locations within their communities, larger shares of rural residents (59%) say they think vaccines in the U.S. are being distributed fairly to people across urban, suburban, and rural areas compared to urban (43%) and suburban residents (50%).

This is despite the fact that majorities of rural residents, including 50% of Democrats and Democratic-leaning independents, and 66% of Republicans and Republican-leaning independents, say the federal government does more to help people living in and around large cities than to help people living in rural areas.

Rural Residents Report Minimal Travel Burdens To Get A COVID-19 Vaccine, Black Residents Report Longer Travel Times

Around half of adults in all rural areas (49%) who have received at least one dose of the COVID-19 vaccine report it took them less than 15 minutes to travel to the place where they got the vaccine, which is similar to the share of urban residents (47%) and suburban residents (42%) who say the same.

About one-fourth of rural residents traveling to get a COVID-19 vaccine say it took them 30 minutes or longer to travel to the place to get vaccinated, however 14% of those living in more populated rural areas say it took them an hour or longer.

Rural adults who haven’t received their vaccine yet estimate that it will take them a little longer to travel to the nearest COVID-19 vaccination site in their area than those in urban and rural environments. About seven in ten rural adults in less populated areas think it will take them under 30 minutes to travel to their closest vaccination site, while fewer rural adults in more populated areas (68%) think it will take them under 30 minutes. At least six in ten urban (69%), suburban (63%), and rural (71%) residents estimate it will take them under 30 minutes in transit time.

Factors In Rural Residents’ Decisions To Get Vaccinated

Rural residents express a variety of attitudes toward the COVID-19 pandemic overall that differ somewhat from their urban and suburban counterparts and may explain their different level of willingness to get vaccinated. For example, several findings suggest that rural residents are less likely to view the pandemic as a serious threat either to the country or their families. More than four in ten rural residents (44%) say they think the news has “generally exaggerated” the seriousness of coronavirus, while one-third say the news has gotten it “generally correct” and one-fifth say it has been “generally underestimated.” A larger share of rural residents say it has been exaggerated compared to urban (27%) and suburban (33%) residents. Rural residents (40%) are also less likely to say they are worried about themselves or their family members getting sick from coronavirus compared to urban (54%) and suburban residents (49%). In addition, while majorities of rural residents report wearing a face mask to protect themselves and others at least most of the time when they leave their house (74%), it is a smaller share compared to urban (90%) and suburban (87%) residents.

Views of the coronavirus pandemic and willingness to wear a protective mask are also strongly connected to rural resident’s decisions to receive a COVID-19 vaccine. More than half rural residents who think the seriousness of the pandemic has been either generally correct or underestimated say they have already received a COVID-19 vaccine, compared to one in five (20%) of those who think the seriousness has been generally exaggerated. In addition, nearly half of rural adults who only wear a mask “some of the time” or “never” say they will definitely not get vaccinated.

Concerns Among Those Who Have not Yet Been Vaccinated

When asked to say in their own words the main reason why they don’t want to get vaccinated, rural residents in the “definitely not” group cite a range of concerns. The most frequently mentioned reason is feeling that the vaccines are too new or that there is not enough information about the long-term effects (mentioned by 19%). About one in ten cite general distrust of the vaccine (12%), dislike of vaccines in general (9%), don’t believe the vaccine is effective against COVID-19 (8%), or report that they either generally don’t need it (3%) or don’t need it because they already had COVID-19 (5%).

IN THEIR OWN WORDS: What is the MAIN reason why you don’t want to get the COVID-19 vaccine? (among rural adults who say they will “definitely not” get it)

“Pretty good immune system don’t want to mess with it.” – 55 year-old man

“I have allergies to flu shots. They make me very ill. I’m nervous about it.” – 50 year-old woman

“l don’t just want to get it, don’t see the point in getting it. Lot of negative reaction I rather not.” – 37 year-old woman

“99.9 survival.” – 71 year-old man

“I have already had the coronavirus and I am currently of the belief that it has more side effects than the government wants to admit to.” – 54 year-old man

“Because who knows of the effects or what the vaccine truly is.” – 41 year-old woman

“I honestly don’t think it will work full force and there will just be more COVID and different shots and I honestly think this is government made.” – 36 year-old woman

“I’ve never gotten a COVID or flu vaccine before.” – 31 year-old man

“It is not a vaccine, it is just a flu shot that has not been tested.  It only makes the COVID flu, if you get it, easier for your body to resolve.  A vaccine means you will not ever contract the virus you are vaccinated against.” – 77 year-old man

“I am a healthy young person. I will save it for someone else.” – 29 year-old woman

“Uh, because I have other health issues that weakened my immune system.” – 48 year-old man

“I’m scared. I just feel like if it is meant for me to catch it I will catch it.” – 34 year-old woman

“COVID virus has a 99% recovery rate.” – 42 year-old woman

“It’s a trial. Don’t know long term effects.” – 28 year-old woman

Six in ten rural residents (compared to four in ten urban residents and 47% suburban residents) say getting vaccinated against COVID-19 is a personal choice. This is a much larger share than the share of rural residents who say getting vaccinated is part of everyone’s responsibility to protect the health of others (42% of rural residents compared to 52% of suburban, 59% of urban).

Because a majority of rural residents think getting vaccinated is a personal choice, one of the top concerns among the 45% of rural residents who are not yet convinced to get the vaccine right away (defined as those who say they will “wait and see” before getting vaccinated, will get the vaccine “only if required” or will “definitely not” get it) is that they might be required to get a COVID-19 vaccine even if they don’t want to (66%). This is a top concern among both those who want say they definitely won’t be getting a vaccine as well as among those who want to “wait and see”. Other top concerns include possible serious side effects from the vaccine (64%) or the effects of the vaccine will be worse than getting COVID-19 (53%). Notably few rural residents cite inability to get the vaccine from a place they trust or difficulty traveling to a vaccination site as concerns (15% and 9%, respectively).

Among those who are not convinced to get vaccinated right away, seven in ten Republicans in rural areas (71%) say they are concerned that they might be required to get the vaccine even if they don’t want to.

Majorities Now Say They Have enough Information About Where And When to receive a COVID-19 vaccine

A growing share of the overall population now say they have enough information about when and where they will be able to get the COVID-19 vaccine. Three-quarters of rural residents who are not yet vaccinated now say they have enough information about where they will be able to get a COVID-19 vaccine, up from 61% in February, and 66% have enough information about when they will be able to get vaccinated, up from 38% last month. Rural residents are more likely to say they have enough information about when they’ll be able to get vaccinated than both urban and suburban residents, with smaller differences on the question of where.

Messages, Information, And Incentives That Might Increase Vaccination Uptake

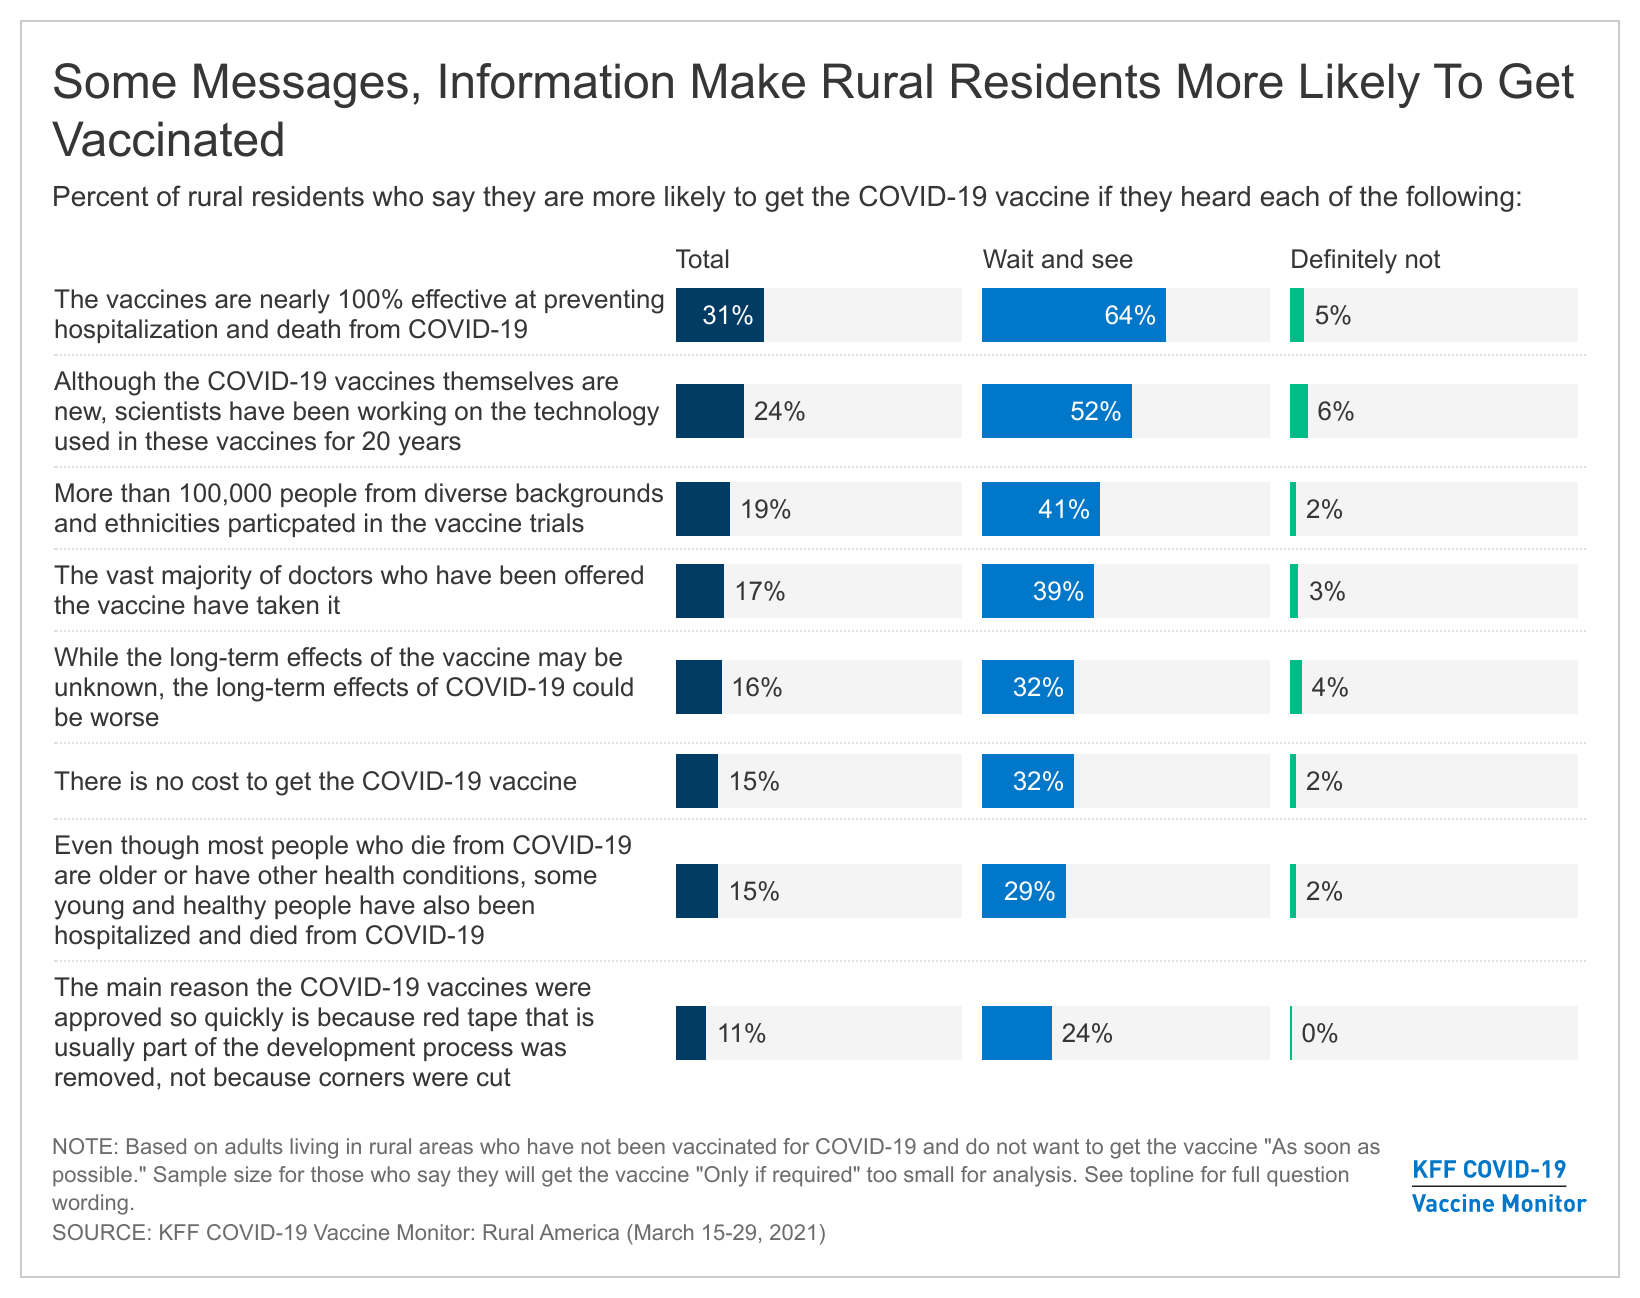
The latest COVID-19 Vaccine Monitor tested a variety of potential incentives, messages, and pieces of information that might be used to increase vaccination uptake. Similar to the general public, within the rural community there are various incentives and messages that may help convince people in the “wait and see” and “only if required” groups to get vaccinated, but very few of them move people in the “definitely not” group. For example, more than half of those in the “wait and see” group say hearing that the vaccines are nearly 100% effective at preventing hospitalization and death from COVID-19 (64%) or that hearing that scientists have been working on the technology used in the new COVID-19 vaccines or 20 years (52%) will make them more likely to get vaccinated. Across the board, no message or piece of information were effective at moving those who say they will definitely not get vaccinated, with the share of that group saying they’d be more convinced after hearing each message in the single digits.

Among rural residents who are not yet convinced to get the COVID-19 vaccine right away, few (14%) say they would be more likely to get vaccinated if President Trump came out with a message strongly urging people to do so. One in four rural residents in the “wait and see” group say this type of messaging could make them more likely to get a vaccine.

Methodology

The KFF COVID-19 Vaccine Monitor – Rural America was designed and analyzed by public opinion researchers at the Kaiser Family Foundation (KFF). The survey was conducted March 15-29, 2021 via telephone and online among a nationally representative sample of 1,001 adults residing in rural counties (including interviews from 159 Hispanic adults and 170 non-Hispanic Black adults). For the telephone components, respondents were reached through randomly generated telephone numbers from cell phone and landline sampling frames associated with rural counties, with an overlapping frame design, and disproportionate stratification. Stratification was based on incidence of the race/ethnicity subgroups within each frame. Specifically, the cell phone frame was stratified as: (1) High Hispanic: Cell phone numbers associated with rate centers from counties where at least 35% of the population is Hispanic; (2) High Black: Cell phone numbers associated with remaining rate centers from counties where at least 35% of the population is non-Hispanic Black; (3) Else: numbers from all remaining rate centers. The landline frame was stratified as: (1) High Black: landline exchanges associated with Census block groups where at least 35% of the population is Black; (2) Else: all remaining landline exchanges. Rate centers and exchanges were considered likely rural if they were in a county that was not part of a metropolitan statistical area. Respondents’ rural residency was established by self-reported zip code or county of residence.

A total of 206 rural respondents were interviewed as part of the March KFF Vaccine Monitor (March 15-March 22), and 795 were part of a mixed-mode rural supplement from March 23 to March 29. The supplement used the same stratification plan, including only numbers in areas identified as micropolitan or noncore based on the CDC’s Urban-Rural Classification Scheme for Counties.  To reach a total minimum of 1,000 rural respondents, of whom 150 were Hispanic and 150 non-Hispanic Black, SSRS employed multiple approaches:  First, the total number of completed interviews in the High Hispanic and High Black strata were oversampled; meaning, if the respondent reached through the oversamples was neither Hispanic nor Black, the interview was terminated, and the respondent screened out. In total 31 Hispanic and 66 Non-Hispanic Black respondents were reached through oversampling. The landline sample included a small oversample of records in the frame that were matched to directory-records with a distinctively Hispanic surname. An additional 32 interviews were completed with respondents who had previously completed interviews on the KFF Health Tracking Poll six months ago or more and were called back for this month’s study. Finally, 35 interviews were completed with respondents who had previously completed an interview on the SSRS Omnibus poll (and other RDD polls) and identified as Hispanic (including 4 in Spanish) and 49 interviews were completed with respondents who had previously completed an interview on the on the SSRS Omnibus poll (and other RDD polls) and identified as non-Hispanic Black. SSRS Omnibus is a weekly RDD poll, employing an overlapping dual-frame design. In total, 206 respondents from the VM survey said they live in a zip code that matched the definition of rural counties, meaning their county was not in a metropolitan statistical area; 29 of these respondents were Hispanic, and 36 non-Hispanic Black.

In the course of the field period, SSRS also invited members of its probability-based online panel (SSRS Opinion Panel) to participate in the study. Invitees all self-reported living in rural zip codes. As with other sample components, Hispanic and Black respondents were oversampled.  The SSRS Opinion Panel is a nationally representative probability-based web panel. SSRS Probability Panel members are recruited randomly in one of two ways: (a) Through invitations mailed to respondents randomly sampled from an Address-Based Sample (ABS). ABS respondents are randomly sampled by MSG through the U.S. Postal Service’s Computerized Delivery Sequence (CDS). (b) from a dual-frame random digit dial (RDD) sample, through the SSRS Omnibus survey platform. Sample for the SSRS Omnibus is obtained through Marketing System Groups (MSG). In total 272 interviews in the rural supplement sample were completed via landline and 438 via cell phone, including 328 who could not be reached via landline. 291 respondents completed the survey online.

The combined landline, cell phone, and online rural samples were weighted to balance the sample demographics to match estimates for the national population using data from the Census Bureau’s 2019 U.S. American Community Survey (ACS), on sex, age, education, race, Hispanic origin, and region, within race-groups, along with data from the 2010 Census on population density. The sample was also weighted to match current patterns of telephone use using data from the January- June 2020 National Health Interview Survey. The rural sample was also weighted to match aggregate county level demographics for the rural counties. Population parameters were derived using Census-based estimates provided by Nielsen Pop-Facts through Marketing Systems Group based on data from data Census Bureau’s 2019 American Community Survey (ACS). Weighting parameters included race and Hispanic origin, race by gender, educational attainment, age, Census region and micropolitan status. Data were also adjusted to match internet-use estimates for rural areas based on ACS data. The weight takes into account the fact that respondents with both a landline and cell phone have a higher probability of selection in the combined sample and also adjusts for the household size for the landline sample, and design modifications, namely, the oversampling of prepaid cell phones and likelihood of non-response for the re-contacted sample. All statistical tests of significance account for the effect of weighting.

The margin of sampling error including the design effect for the full sample is plus or minus 3 percentage points. Numbers of respondents and margins of sampling error for key subgroups are shown in the table below. For results based on other subgroups, the margin of sampling error may be higher. Sample sizes and margins of sampling error for other subgroups are available by request. Note that sampling error is only one of many potential sources of error in this or any other public opinion poll. Kaiser Family Foundation public opinion and survey research is a charter member of the Transparency Initiative of the American Association for Public Opinion Research.

This work was supported in part by grants from the Missouri Foundation for Health, the Chan Zuckerberg Initiative DAF (an advised fund of Silicon Valley Community Foundation), the Ford Foundation, and the Molina Family Foundation. We value our funders. KFF maintains full editorial control over all of its policy analysis, polling, and journalism activities.

GroupN (unweighted)M.O.S.E.
Community Type
NET: Non-rural1,656± 3 percentage points
Urban764± 5 percentage points
Suburban892± 4 percentage points
Rural1,001± 4 percentage points
 
Race/Ethnicity among Rural
White, non-Hispanic628± 5 percentage points
Black, non-Hispanic170± 10 percentage points
Hispanic159± 10 percentage points
Party Identification among Rural
Democrats357± 8 percentage points
Republicans285± 7 percentage points
Independents234± 9 percentage points
Rural density
More populated rural areas628± 5 percentage points
Less populated rural areas370± 7 percentage points

COVID-19 Pandemic-Related Excess Mortality and Potential Years of Life Lost in the U.S. and Peer Countries

Authors: Krutika Amin and Cynthia Cox
Published: Apr 8, 2021

A new issue brief reviews excess death rates in the U.S. and peer countries by age groups to examine how the pandemic has affected excess mortality rate among younger people. The analysis looks specifically at the excess deaths that arose in 2020 to examine how the age at death during the pandemic has differed between the U.S. and peer nations, and estimates the excess potential years of life lost (a measure of “premature excess death”) during the pandemic. The brief also explores racial disparities in the age of death in the U.S.The analysis is available on the Peterson-KFF Health System Tracker, an online information hub dedicated to monitoring and assessing the performance of the U.S. health system.

News Release

Compared to Peer Countries, the U.S. Had the Highest Rate of Mortality Among People Under Age 65 and Potential Years of Life Lost in 2020 Due to the Pandemic

Published: Apr 8, 2021

A new KFF issue brief examines 2020 data on excess mortality – the number of deaths above what is expected in a typical year – and finds that among similarly large and wealthy nations, the United States had the highest premature excess mortality rate in 2020, indicating that younger people in the U.S. were more likely to have died due to the pandemic than younger people in other countries.

The excess mortality rate among Americans ages 15-64 was 58 per 100,000 people in the age group in 2020 – more than double that of the next closest peer nation, the United Kingdom (25 per 100,000).  Nearly half (48%) of excess deaths in the U.S. were among people younger than 75, compared to 18% for Belgium, a country with a comparable overall excess mortality rate.

The brief also estimates excess potential years of life lost (“premature excess deaths”) in the U.S. and peer nations. Excess potential years of life lost (up to age 75) is a measure of excess mortality and is used to compare differences in disease burden and longevity across countries. The analysis finds that the U.S. had 1,171 excess potential years of life lost up to age 75 per 100,000 people ages 0-74, which is over twice the rate of premature excess mortality in the next closest country, the U.K. (488 per 100,000 people). This approach, which follows OECD methods, may understate premature excess mortality in 2020, as excess deaths over age of 75 in 2020 were also premature compared to a typical year.

In comparison to a typical year, the U.S. lost an additional 3.6 million potential years of life in 2020. The high premature excess death rate in the U.S. was driven in part by racial disparities. American Indian and Alaska Native, Black, Native Hawaiian and Other Pacific Islander, and Hispanic people had over 3 times the premature excess death rate in the U.S. in 2020 than the rate among other groups. Thirty percent of the total excess potential years of life lost in the U.S. were among Black people, and 31% were among Hispanic people, rates disproportionate to their shares of the total U.S. population.

Prior to 2020, the U.S. already had the highest rate of premature deaths among peer countries. This analysis shows the gap in premature mortality rates between the U.S. and peer countries has increased due to the pandemic.

The analysis is available on the Peterson-KFF Health System Tracker, an online information hub dedicated to monitoring and assessing the performance of the U.S. health system.

Racial Equity and Health Data Dashboard

Vaccines

ACA Coverage

COVID-19

Perspectives on being black in america today

Latest Polling
79%
Most Black adults say systemic racism is a major obstacle to Black people achieving equal outcomes with White people.
66%
Two out of three Black adults say the government’s response to the COVID-19 pandemic would be stronger if White people were getting sick and dying at higher rates than people of color.
71%
About 7 in 10 Black adults say unconscious bias has been an obstacle in their own life.
65%
Most Black adults are not confident that the development of the coronavirus vaccine is taking needs of Black people into account.

Health status

Economic and social factors

essential resources

  • Topic page

    Racial Equity and Health Policy Topic Page

    The Racial Equity and Health Policy Program provides timely and reliable data, information, and policy analysis on health and health care disparities affecting people of color and underserved groups and efforts to advance racial equity in health and health care.
  • Blog

    Health Disparities are a Symptom of Broader Social and Economic Inequities

    Despite being long documented, racial and ethnic disparities in health have persisted and in some cases widened over time, with Black individuals and other groups of color faring worse compared to White individuals across many health status measures.
  • report

    Key Facts on Health and Health Care by Race and Ethnicity

    Data on demographics; health coverage, access, and utilization; and health status by race and ethnicity to provide greater insight into the status of health disparities and changes in disparities since implementation of the ACA.
  • State-level data

    State Data on Disparities

    This category includes data on demographics, health coverage, health status, and certain health conditions by race/ethnicity and gender to provide insight into health disparities and changes in disparities over time.
  • state-level data

    State Data and Policy Actions to Address Coronavirus

    This data tool provides state-level information related to COVID-19 including cases and deaths by race/ethnicity.