Are Health Centers Facilitating Equitable Access to COVID-19 Vaccinations? A June 2021 Update.

Authors: Bradley Corallo, Samantha Artiga, and Jennifer Tolbert
Published: Jun 2, 2021

Key Takeaways

Community health centers are a national network of safety net primary care providers and are a primary source of care for many low-income populations and communities of color. This updated analysis examines the extent to which COVID-19 vaccination efforts through community health centers are reaching people of color using data from the federal government’s weekly Health Center COVID-19 Survey for the weeks of January 8 through May 21, 2021 (the latest data available). Key findings include:

  • Over the period of January 8 through May 21, 2021, people of color made up nearly two-thirds (64%) of people receiving the first dose and 61% of people receiving the second/final dose of the vaccine at health centers.
  • Weekly data show that the share of first doses administered to people color at health centers has grown from 34% in early January to 77% in the week ending May 21. Growth was especially rapid among Hispanic people who made up 17% of first doses administered in the first week of January, growing to a high of 52% in the week of May 7.
  • People of color represent greater shares of vaccinations at health centers compared to their shares of vaccinations nationally based on data reported by the CDC, especially for Hispanic people. To date, 34% of total first doses administered at health centers have gone to Hispanic people, over two times higher than their share of people who have received one or more doses nationally (14%).
  • Health centers appear to be vaccinating people of color at similar or higher rates than their shares of the U.S. population, but data suggest there remain opportunities for health centers to reach more Black patients. The shares of people vaccinated at health centers who were Black, Hispanic, and Asian matched or exceeded their shares of the U.S. population. However, Black peoples’ share of health center vaccinations was lower than their share of the health center patient population for both first and second/final doses administered.

Introduction

Current data suggest significant racial disparities in COVID-19 vaccinations, with higher vaccination rates among White people compared to Hispanic and Black people as of late May, based on available state-reported data. The Biden administration has identified equity as a key priority in its national COVID-19 response strategy. One action the administration is pursuing to advance equity in vaccinations is to increase distribution through community health centers. Health centers are a primary source of care for low-income populations and people of color and served nearly 30 million patients in 2019. Given health centers’ focus on underserved communities and their long-standing role in encouraging and providing immunizations, health centers are generally seen as trusted providers in their communities, especially among people of color.

The Health Center COVID-19 Vaccine Program began allocating vaccines directly to an initial group of 250 health centers in mid-February. The early participants in the program serve large volumes of specific high-need populations that may require more resource-intensive vaccination efforts, such as agricultural workers, people living in or near public housing, individuals with limited English proficiency, and people experiencing homelessness. By April 7, 2021, the program expanded to include all health centers nationwide (roughly 1,400 health center organizations), with participation phasing in over several weeks.  Although roughly 800 health centers were participating as of May 24, the majority of vaccinations administered by health centers so far have been supplied by states and local jurisdictions, which are also working with health centers to speed up equitable distribution of the vaccine. Between the doses supplied through the Health Center COVID-19 Vaccination Program and through state and local partnerships, health centers had administered more than 10 million doses of the COVID-19 vaccine by May 2021.

This analysis examines the extent to which vaccination efforts through community health centers are reaching people of color based on data from weekly surveys of health centers administered by the Health Resources and Services Administration (HRSA). We use cumulative weekly data starting January 8, 2021 (when health centers began reporting vaccinations in the survey) and ending May 21 (the most recent data available). We also provide information on first doses administered and second/final doses administered. Notably, the Johnson & Johnson vaccine is only reported as the second/final dose administered in the weekly survey, as it is completed in a single dose. Additionally, this analysis compares community health center survey data to national vaccination data reported by the CDC, total population data, and total community health center patient population data. (See the methods section for more information about the data underlying this analysis.)

Key Findings

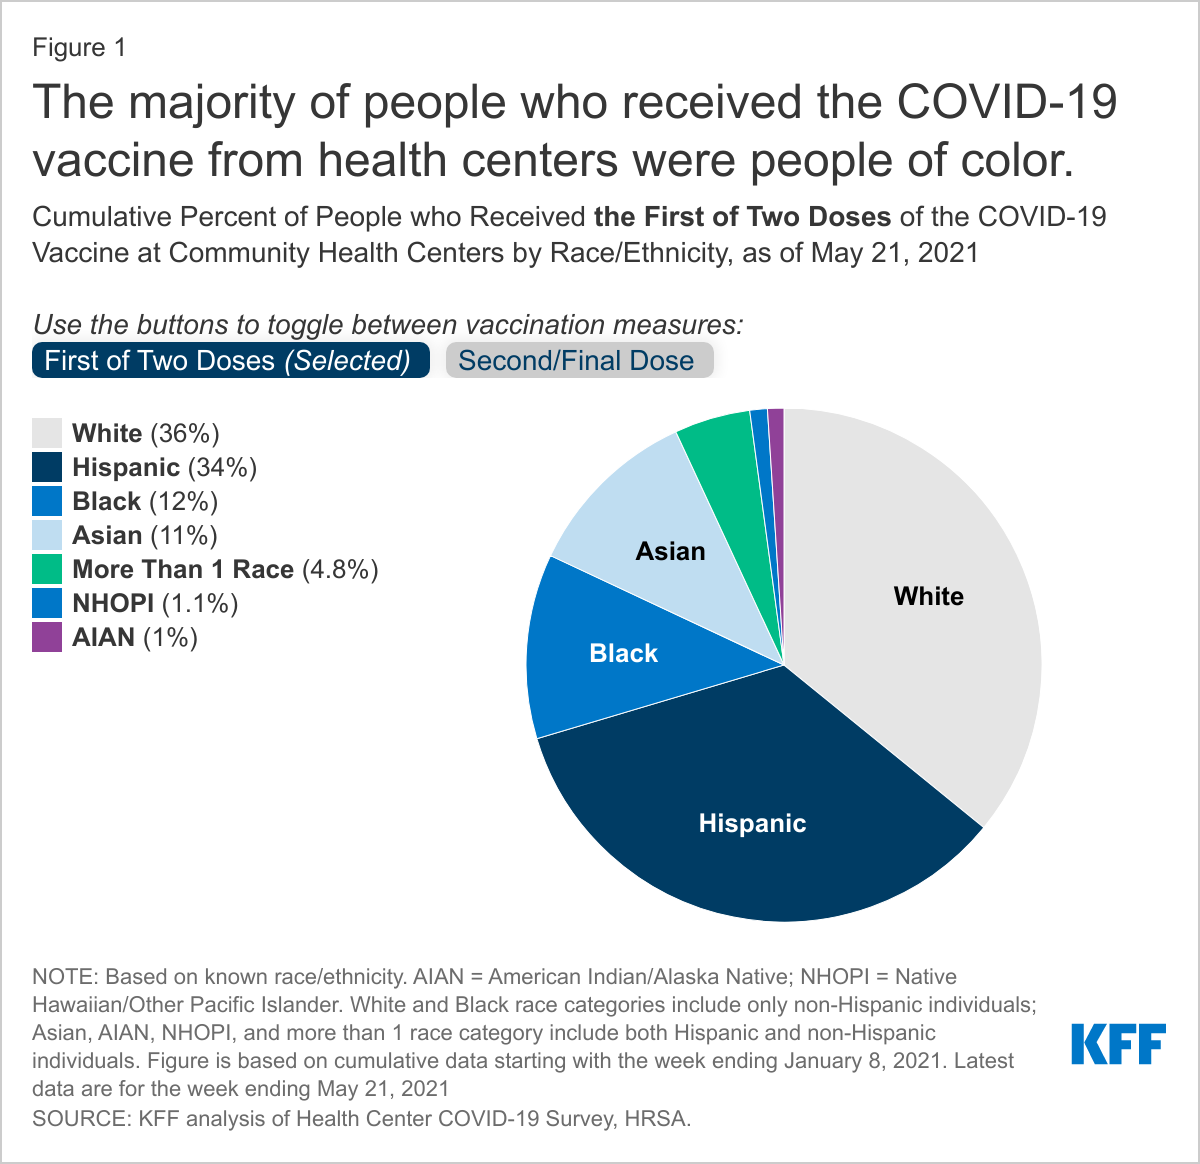
Among those with known race/ethnicity information, people of color made up the majority of people who received vaccinations at community health centers between January 8 and May 21, including 64% of people receiving the first dose and 61% of people receiving the second/final dose of the vaccine. Hispanic people made up 34% of first doses and 32% of second/final doses administered by health centers, followed by Black people (12% and 11% of first and second/final doses, respectively), and Asian people (11% for both first and second/final doses). People identifying with more than one race, as well as American Indian and Alaska Native (AIAN) and Native Hawaiian and Other Pacific Islander (NHOPI) people each made up 5% or less of those receiving first and second/final doses (Figure 1). Race/ethnicity was unknown or not reported for about 16% of both first doses administered and second/final doses administered, resulting in gaps in the data. However, health center vaccination data are considerably more complete than national vaccinations reported by the CDC, which are missing race/ethnicity information for 43% of people receiving 1 or more vaccinations and 39% of people who are fully vaccinated as of May 25, 2021.

The majority of people who received the COVID-19 vaccine from health centers were people of color.

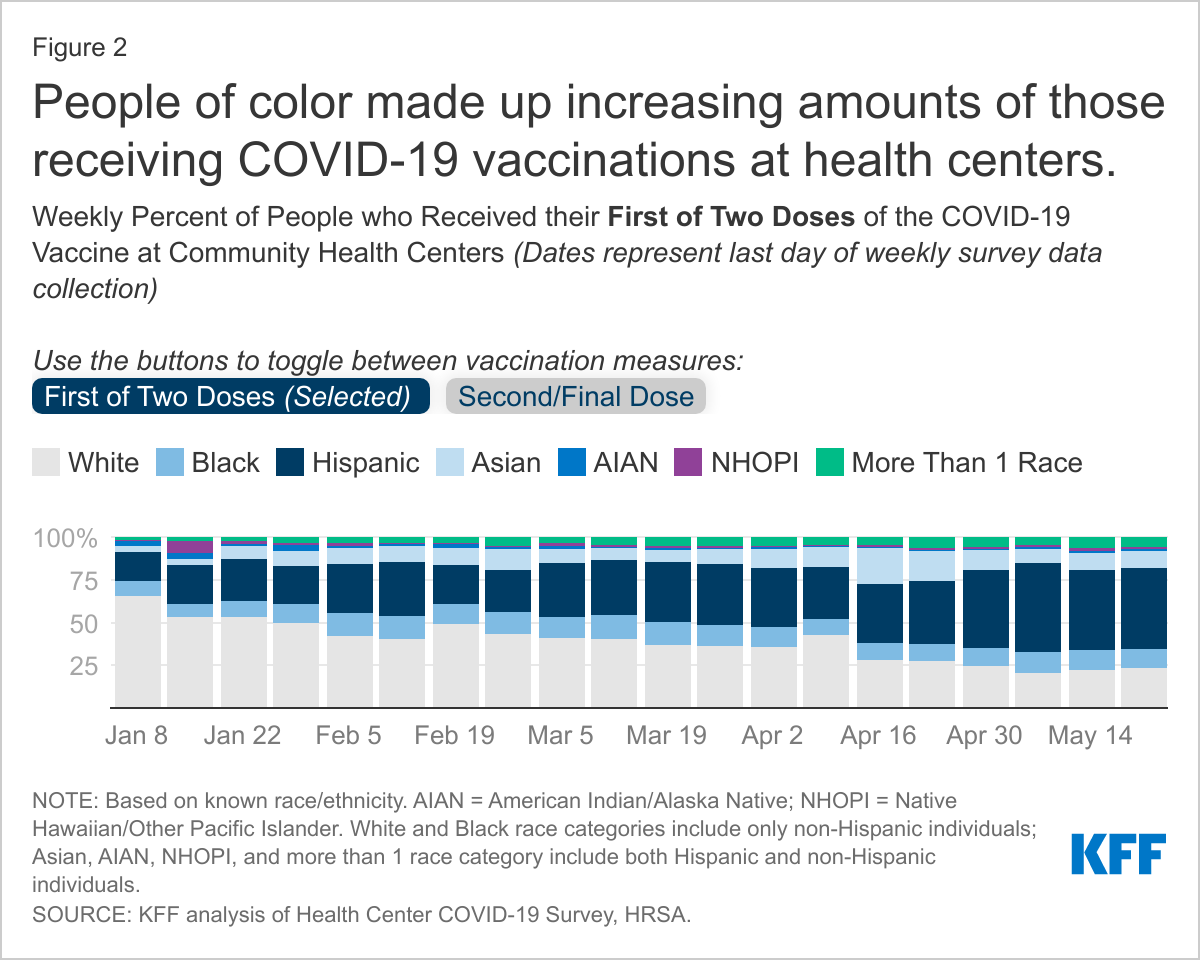
Weekly data show that the share of first doses administered to people of color at health centers has grown from 34% in early January to 77% in the week ending May 21 (Figure 2). Growth in the share of people receiving the first dose who were Hispanic was especially rapid, growing from 17% of vaccinations to as much as 52% in the week ending May 7 (then declining slightly to 48% in mid-May). Asian people have also accounted for a growing share of the first doses administered, growing from 3% in early January to 10% in the week of May 21. Black people have experienced a modest increase in their share of first doses, growing from 9% in early January to 11% in the week of May 21. Additionally, the number of vaccinations at health centers reported through the survey has increased since January, although vaccinations appear to have reached their peak in April and has since declined, similar to national trends. The number of vaccinations administered per health center responding to the survey has grown from 60 total doses per responding health center during the week of January 8 to peak at 980 during the week ending April 9. Data for most recent week ending May 21 shows 554 total doses per health center responding to the survey. While the rate of overall vaccinations at health centers has slowed since the peak in April, health centers appear to be focusing greater shares of vaccinations on communities color.

People of color made up increasing amounts of those receiving COVID-19 vaccinations at health centers.

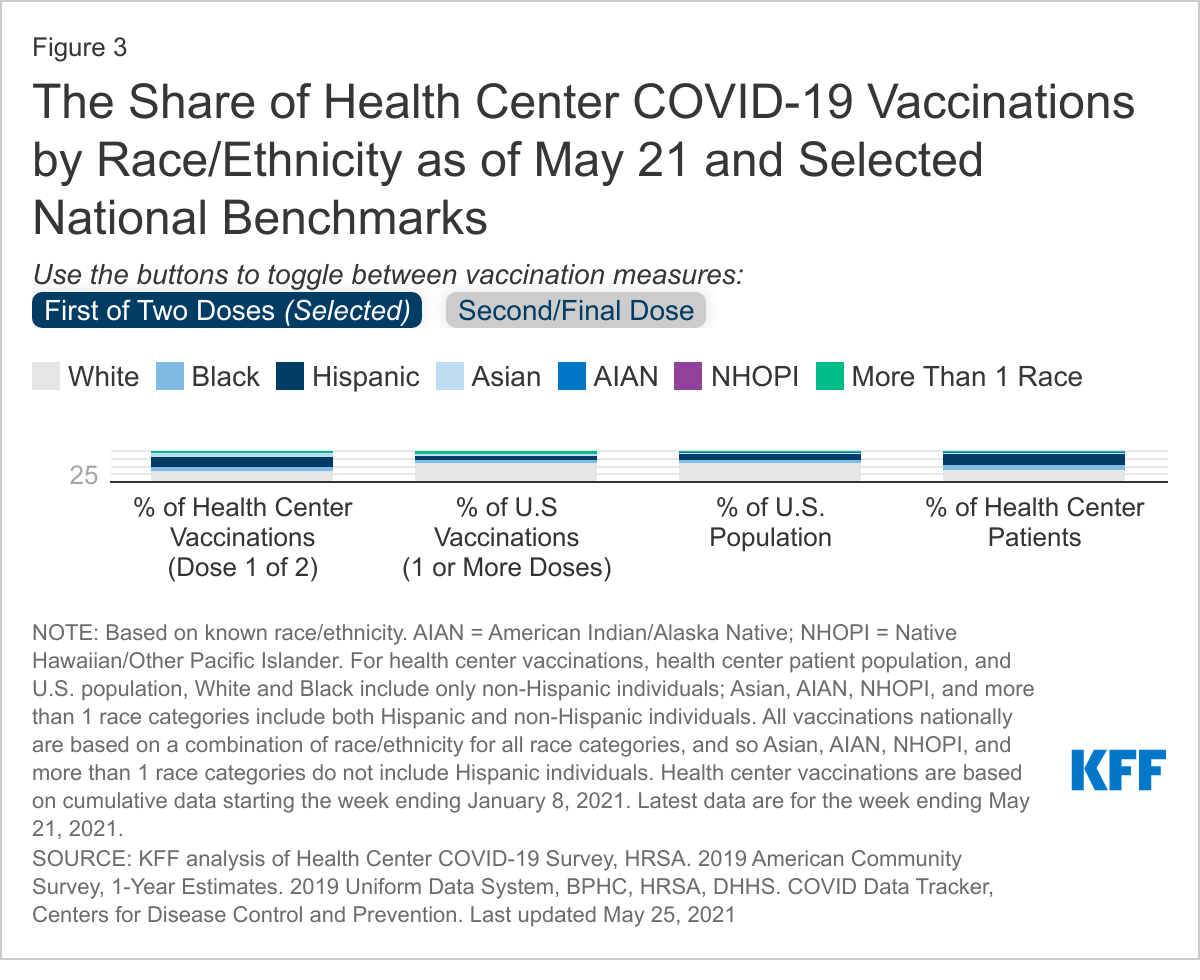
The data suggest that people of color represent greater shares of vaccinations at health centers compared to their shares of vaccinations nationally based on data reported by the CDC (Figure 3). For example, Hispanic people accounted for 34% of those who have received their first dose through a health center as of May 21, while they made up 14% of people who received 1 or more doses administered nationally as of May 25. Similarly, 12% of people who received their first dose through health centers were Black, while Black people made up 9% of those who received 1 or more doses nationally. Asian people also appear to be receiving vaccinations in greater shares at health centers compared to their share nationally, making up 11% of first doses administered at health centers vs 6% nationally. Overall findings were similar for second/final doses administered at health centers. However, the ability to draw strong conclusions from these comparisons is limited by differences between the data as well as gaps in the CDC data, including the high share of vaccinations with unknown race/ethnicity and a relatively high share of people reporting multiple or other race.

Health centers appear to be vaccinating people of color at similar or higher rates than their shares of the total population, but data suggest there remain opportunities for health centers to reach more Black patients (Figure 3). Health centers reached particularly large shares of Hispanic and Asian people relative to their shares of the total population, while the share of vaccinations that went to Black people was comparable to their share of the population. These vaccination patterns largely mirror health centers’ larger role serving patients of color, who made up 63% of patients in 2019. Although Hispanic and Asian peoples’ shares of vaccinations were generally similar to or greater than their shares of the health center patient population, the shares of first and second doses administered to Black people through health centers (12% and 11%, respectively) were lower than their shares of the patient population (19%), suggesting remaining opportunities for them to reach greater shares of Black people.

The Share of Health Center COVID-19 Vaccinations by Race/Ethnicity as of May 21 and Selected National Benchmarks

Looking Ahead

Health centers’ role in vaccine distribution is a major part of ongoing efforts to address the racial disparities in COVID-19 vaccinations that have emerged, especially for Hispanic people. The KFF COVID-19 Vaccine Monitor from April 2021 shows that 22% of vaccinated Hispanic adults and 10% of vaccinated Black adults reported getting their vaccine at a community health center. Reflecting their larger role serving and established trusted relationships with communities of color, evidence to date indicates that health centers are vaccinating larger shares of people of color compared to overall vaccination efforts. Health centers are also administering the vaccine to larger shares of people of color than their shares of the population, and there has been a substantial uptick in the share of people of color vaccinated at health centers over time. While people of color make up the majority of health center vaccinations, data suggest that there are further opportunities for health centers to reach more Black people, as the share of Black people vaccinated through health centers is still lower than their share of the health center patient population.

The growth in the share of people vaccinated in health centers who are people of color likely reflects several factors, including improvements in community outreach, logistics, and efforts to address access barriers faced by many people of color, as well as continued increases in people’s willingness to receive the vaccine over time. The Health Center COVID-19 Vaccine Program has increased the share of vaccinations distributed to people of color as well, although data are relatively limited on the program. According to federal officials, approximately 70% of the allocated doses have been administered to people of color.

Although health centers appear to be advancing equitable access to vaccinations, the number of vaccinations administered by health centers remains relatively small when scaled to the national total reported by the CDC. As of May 21, 2021, health centers had reported a cumulative 11.5 million doses (6.2 million first doses and 5.3 million second/final doses) administered in weekly surveys. However, this is likely an undercount, as between 56% and 81% of health centers have responded to weekly surveys, and those that do not respond are not included in the total vaccination counts for the week. Despite a likely undercount, health center vaccinations represent a fraction of the 288 million doses administered nationally as of May 21 and in comparison to the nearly 30 million health center patients in 2019. Still, health centers have focused the majority of their vaccinations within communities of color, especially in recent weeks, even as the number of vaccinations nationally have begun to slow since April 2021. Health centers’ continued involvement in vaccination and outreach efforts at the federal, state, and local levels will likely be a meaningful step in reaching people of color in greater numbers and advancing equity over the long term.

Methodology

This analysis primarily draws from the weekly Health Center COVID-19 Survey, administered by the Health Resources and Service Administration (HRSA). We rely on weekly data on the number of vaccinations per week by race/ethnicity starting with the January 8, 2021 survey through the May 21, 2021 survey. The National Association of Community Health Centers provided us with national totals of vaccinations by race/ethnicity for the week of January 22, which we were unable to access. We sum all weekly data over the period analyzed to represent cumulative totals.

Health center vaccinations are reported separately for first dose and second/final doses in this analysis. To report first doses administered, health centers are asked, “By race and ethnicity, how many patients have initiated (1st of 2 doses received) their COVID-19 immunization series in the last week?” For second/final doses administered, health centers are asked, “By race and ethnicity, how many patients have completed (2nd, or only, dose received) their COVID-19 immunization series in the last week?” In separate guidance, HRSA specified that health centers should report patients receiving doses administered as a one-dose vaccine series (i.e., the Johnson & Johnson vaccine) to be reported as the second/final dose. In the same guidance, HRSA also specified that health centers should include vaccinations at the health center, as well as among established patients receiving the vaccination elsewhere, if the health center has records of the immunization. When comparing changes in first and second/final doses over a period of weeks (e.g., Figure 2), the baseline week for second/final doses began later than that for first doses (the week of February 5 vs. the week of January 8) due to low numbers of second/final doses administered in January.

All findings reported are based on known race/ethnicity. For our calculations, both the “Unreported/Refused to Report Race and Ethnicity” as well as “Non-Hispanic/Latino Ethnicity Patients (Unreported/Refused to Report Race)” were defined as unknown race/ethnicity. “Hispanic/Latino Ethnicity Patients (Unreported/Refused to Report Race)” were categorized as ‘Hispanic’ individuals for our analysis.

The Health Center COVID-19 Survey reports race/ethnicity differently from most other data sources. White and Black categories only include non-Hispanic individuals, while Asian, AIAN, NHOPI, and more than one race include Hispanic and non-Hispanic individuals. When comparing to population estimates from the 2019 American Community Survey and the Uniform Data System, we adjusted race categories to match the Health Center COVID-19 Survey’s race/ethnicity categories. We did not adjust national vaccination tabulations by race/ethnicity from the CDC’s COVID Data Tracker.

Vaccination data by race/ethnicity from the CDC are based on administrative data reported to the CDC. However, the health center data are based on vaccinations from weekly surveys beginning in January 2021 with varying response rates. In addition to different data collection methods, it is possible that the health center survey data may also exclude some vaccinations in December 2020. Additionally, the CDC reports data for 1 or more vaccinations administered, while the health center data report first and second/final doses separately. Additionally, the health center first dose data do not include the Johnson & Johnson vaccine, which is reported as second/final dose.

White House Releases Full FY 2022 Budget Request

Published: Jun 2, 2021

President Biden released his full FY 2022 budget request to Congress on May 28, 2021 (an initial, topline discretionary FY 2022 budget proposal was released on April 9, 2021). The request includes an increase of almost $1 billion for global health programs, most of which (84%) is for global health security. Almost all other global health program areas were level-funded in the request, with the exception of small increases for maternal and child health (MCH) and family planning/reproductive health (FP/RH) compared to FY 2021 enacted levels. This marks a break from President Trump’s requests, which had proposed significant cuts to most global health programs throughout his term (Congress rejected those cuts). The FY 2022 budget request includes funding for U.S. global health programs at the State Department, the U.S. Agency for International Development (USAID), the Centers for Disease Control and Prevention (CDC), and the National Institutes of Health (NIH). Details on additional funding in these and other departments/agencies is not yet known but will be provided, when available. Key highlights for the known amounts are as follows (see table for additional detail). In addition, for an overview of historical trends in U.S. funding for global health, see our new analysis.

State Department & USAID:

Funding for global health programs through the Global Health Programs (GHP) account, which represents the bulk of global health assistance, totaled $10.05 billion, an increase of $855 million (9%) from the FY21 enacted level, almost all of which was for global health security.

  • Funding for global health security totals $905 million, an increase of $715 million (376%) above the FY21 enacted level ($190 million).
  • Bilateral HIV funding through the President’s Emergency Plan for AIDS Relief (PEPFAR) is $4.7 billion, matching the FY21 enacted level. In FY21, Congress appropriated an additional $250 million in emergency supplemental funding to address the impact of COVID-19 on bilateral HIV programs; this funding is not included in this analysis.
  • The request includes $1.56 billion for the U.S. contribution to the Global Fund to Fight AIDS, Tuberculosis and Malaria (Global Fund), matching the FY21 enacted level. In FY21, Congress appropriated an additional $3.5 billion in emergency COVID-19 supplemental funding to the Global Fund; this funding is not included in this analysis.
  • Funding for tuberculosis (TB) totals $319 million, matching the FY21 enacted level.
  • Funding for malaria totals $770 million, matching the FY21 enacted level.
  • The request includes $880 million for maternal and child health (MCH), a slight increase of $24 million (3%) above the FY21 enacted level ($856 million), all for bilateral MCH programs. Other specific areas under MCH include multilateral contributions to:
    • Gavi, the Vaccine Alliance which totals $290 million, matching the FY21 enacted.
    • UNICEF which totals $139 million, matching the FY21 enacted level.
  • Funding for the nutrition program totals $150 million, matching the FY21 enacted level.
  • Bilateral family planning and reproductive health (FP/RH) funding totals $584 million ($550 million through the GHP account and $33.7 million through the ESF account)[i], a slight increase of $9 million (2%) above the FY21 enacted level ($575 million, of which $524 million was through the GHP account and $51.1 million was through the ESF account). Funding for multilateral contributions to the United Nations Population Fund (UNFPA) totals $56 million, $23.5 million (72%) above the FY21 enacted level ($32.5 million)
  • Funding for the vulnerable children program totals $25 million, matching the FY21 enacted level.
  • Funding for neglected tropical diseases (NTDs) totals $103 million, matching the FY21 enacted level.
  • Funding to replenish the Emergency Reserve Fund, which is used to “quickly and effectively respond to emerging infectious disease outbreaks,” totals $90 million; in FY21, no funding was appropriated for the Emergency Reserve Fund, but Congress provided the authority to transfer up to $50 million in funding from other areas to the Emergency Reserve Fund if needed.

Centers for Disease Control and Prevention (CDC): Funding for global health provided to the CDC totals $698 million, an increase of $105 million (18%) above the FY21 enacted level ($593 million), almost all of which (95%) is to support global health security activities; all other areas remained flat except for parasitic diseases funding which increased slightly.

National Institutes of Health (NIH) [ii]: Funding for global HIV/AIDS at NIH totals $617 million, essentially flat compared to the FY21 enacted level ($616 million). Funding for the Fogarty International Center (FIC) at NIH totals $96 million, $12 million (15%) above the FY21 enacted level ($84 million).

Resources:

The table (.xls) below compares global health funding in the FY 2022 request to the FY 2021 enacted funding amounts as outlined in the  “Consolidated Appropriations Act, 2021” (P.L. 116-260; KFF summary here). Note that total funding for global health is not currently available as some funding provided through USAID, Health and Human Services (HHS), and the Department of Defense (DoD) is not yet available.

See the KFF budget tracker for details on historical annual appropriations, including Senate and House amounts, for global health programs.

Table: KFF Analysis of FY22 Budget Request for Global Health
Department / Agency / AreaFY21 Enacted(millions)FY22 Request(millions)Difference:FY22 Request – FY21 Enacted
State, Foreign Operations, and Related Programs (SFOPs) – Global Health
HIV/AIDS$4,700.0$4,700.0$0 (0%)
State Department$4,370.0$4,370.0$0(0%)
USAID$330.0$330.0$0(0%)
of which Microbicides$45.0$45.0$0(0%)
Global Fund$1,560.0$1,560.0$0 (0%)
Tuberculosisi –
Global Health Programs (GHP) account$319.0$319.0$0(0%)
Economic Support Fund (ESF) accountNot specifiedNot specified –
Malaria$770.0$770.0$0 (0%)
Maternal & Child Health (MCH)ii –
GHP account$855.5$879.5$24.0(2.8%)
of which Gavi$290.0$290.0$0(0%)
of which Polio$65.0Not specified –
UNICEFiii$139.0$139.0$0(0%)
ESF accountNot specifiedNot specified –
of which PolioNot specifiedNot specified –
Nutritioniv –
GHP account$150.0$150.0$0(0%)
ESF accountNot specifiedNot specified –
Family Planning & Reproductive Health (FP/RH)v$607.5$639.7$32.2 (5.3%)
Bilateral FP/RHv$575.0$583.7$8.7(1.5%)
GHP accountv$524.0$550.0$26.0(5%)
ESF accountv$51.1$33.7$-17.4(-34%)
UNFPAvi$32.5$56.0$23.5(72.3%)
Vulnerable Children$25.0$25.0$0 (0%)
Neglected Tropical Diseases (NTDs)$102.5$102.5$0 (0%)
Global Health Security$190.0$905.0$715.0 (376.3%)
USAID GHP accountvii$190.0$655.0$465.0(244.7%)
State GHP accountviiiNot specified$250.0 –
Emergency Reserve Fundix$90.0 –
SFOPs Total (GHP account only)$9,196.0$10,051.0$855.0 (9.3%)
Labor Health & Human Services (Labor HHS)
Centers for Disease Control & Prevention (CDC) – Total Global Health$592.8$697.8$105.0 (17.7%)
Global HIV/AIDS$128.4$128.4$0(0%)
Global Tuberculosis$9.2$9.2$0(0%)
Global Immunization$226.0$226.0$0(0%)
Polio$176.0$176.0$0(0%)
Other Global Vaccines/Measles$50.0$50.0$0(0%)
Parasitic Diseases$26.0$31.0$5.0(19.2%)
Global Public Health Protection$203.2$303.2$100.0(49.2%)
Global Disease Detection and Emergency Response$193.4$293.4$100.0(51.7%)
of which Global Health Security (GHS)Not specifiedNot specified –
Global Public Health Capacity Development$9.8$9.8$0(0%)
National Institutes of Health (NIH) – Total Global Health$892.8Not specified –
HIV/AIDS$616.7$617.1$0.4(0.1%)
Malaria$192.0Not specified –
Fogarty International Center (FIC)$84.0$96.3$12.3(14.6%)
Notes:
i – Some tuberculosis funding is provided under the ESF account, which is not earmarked by Congress in the annual appropriations bills and determined at the agency level (e.g. in FY19, TB funding under the ESF account totaled $3.6 million).
ii – Some MCH funding is provided under the ESF account, which is not earmarked by Congress in the annual appropriations bills and determined at the agency level (e.g. in FY19, MCH funding under the ESF account totaled $14.42 million).
iii – UNICEF funding in the FY21 final bill includes an earmark of $5 million for programs addressing female genital mutilation.
iv – Some nutrition funding is provided under the ESF account, which is not earmarked by Congress in the annual appropriations bills and determined at the agency level. (e.g. in FY17, nutrition funding under the ESF account totaled $21 million).
v – The FY21 final bill states that “not less than $575,000,000 should be made available for family planning/reproductive health.” The FY22 request funding amounts are based on a bilateral total of $583.7 million as specified in the FY22 OMB Budget Appendices for the Department of State and Other International Programs.
vi – The FY21 final bill texts state that if this funding is not provided to UNFPA it “shall be transferred to the ‘Global Health Programs’ account and shall be made available for family planning, maternal, and reproductive health activities.”
vii – According to the Department of State, Foreign Operations, and Related Programs FY22 Congressional Budget Justification, $300 million of this funding is “for contributions to support multilateral initiatives leading the global COVID response through the Act-Accelerator platform.”
viii – According to the Department of State, Foreign Operations, and Related Programs FY22 Congressional Budget Justification, this funding is “to support a new health security financing mechanism, which would be developed alongside U.S. partners and allies, to ensure global readiness to respond to the next outbreak.”
ix – The FY21 final bill states that “up to $50,000,000 of the funds made available under the heading ‘Global Health Programs’ may be made available for the Emergency Reserve Fund.”

[i] The FY22 request funding amounts are based on a bilateral total of $583.7 million as specified in the FY22 OMB Budget Appendices for the Department of State and Other International Programs.

[ii] While funding for global research activities at NIH is not yet known, the agency overall got a significant increase ($9 billion or a 21% increase, from approximately $43 billion in FY21 to $52 billion in the FY22 request).

Potential Impact of Additional Federal Funds for Medicaid HCBS for Seniors and People with Disabilities

Authors: Priya Chidambaram and MaryBeth Musumeci
Published: May 28, 2021

Home and community-based services (HCBS) help seniors and people with disabilities and chronic illnesses live independently outside institutions by assisting with daily needs. HCBS include but are not limited to home health aide services, assistance with self-care tasks such as eating or bathing, supportive housing, and assistive technology. People who use HCBS include seniors with physical and/or cognitive limitations, people with intellectual disabilities such as Down’s syndrome or autism, people with physical disabilities such as spinal cord injuries or cerebral palsy, people with serious mental illness, and people with disabling chronic conditions.

The unmet need for HCBS for seniors and people with disabilities pre-dates the COVID-19 pandemic, with Medicaid serving as the primary source of coverage for HCBS. These services are unaffordable out-of-pocket for many people and unavailable through private insurance or Medicare. The pandemic’s disproportionate impact on seniors and people with disabilities, particularly those living in congregate settings such as nursing homes, has brought heightened focus on the need for additional HCBS, and the growing elderly population in the coming years will further intensify the need for these services. Over the last several decades, states have focused on shifting the Medicaid program’s historical bias toward institutional services by devoting an increasing share of their total long-term services and supports (LTSS) spending to HCBS. Spending on HCBS surpassed spending on institutional care for the first time in FY 2013 and comprised 56% of total Medicaid LTSS spending in FY 2018, with substantial variation among states.

The American Rescue Plan, the COVID relief package recently signed into law by President Biden, includes a provision to increase the federal matching rate (FMAP) for spending on Medicaid HCBS by 10 percentage points from April 1, 2021 through March 31, 2022 provided states maintain state spending levels as of April 1, 2021. To access the new funds, recent guidance requires states to submit for CMS approval an initial HCBS spending plan projection and narrative by June 12, 2021, though CMS recently announced that states could request a 30-day extension for their initial submission due date. This brief discusses the new provision and provides state by state estimates of the potential effects of the policy change.

What does the American Rescue Plan do for HCBS?

The HCBS provision in the American Rescue Plan increases the federal matching rate (FMAP) for Medicaid HCBS spending by 10 percentage points from April 1, 2021 through March 31, 2022. The law specifies that states must use the enhanced funds to “implement, or supplement the implementation of, one or more activities to enhance, expand, or strengthen” Medicaid HCBS. CMS guidance released on May 13, 2021 confirms that the enhanced funds must be used for activities “beyond what is available under the [state’s] Medicaid program as of April 1, 2021.” While the final version of the law did not detail specific activities, the CMS guidance provides a non-exhaustive list of initiatives that states might fund, including activities to meet HCBS needs created by COVID-19 and activities to build state HCBS capacity and advance LTSS rebalancing reforms. For example, in response to COVID-19, states might use the enhanced funds to expand covered services to reduce the risk of institutionalization, facilitate COVID-19 vaccine access for HCBS enrollees, or support the direct care workforce. To build HCBS capacity and advance LTSS rebalancing, states might streamline eligibility and enrollment processes, increase covered services, expand the direct care workforce, or serve additional HCBS enrollees. (Figure 1). States have until March 31, 2024 to spend the enhanced funds. The Appendix Table contains a detailed summary of the activities included in the CMS guidance.

Figure 1: Examples of Activities States Might Fund with American Rescue Plan Medicaid HCBS 10 Percentage Point Federal Match Increase

The law increases the total dollars available for Medicaid HCBS, as states are required to maintain their current HCBS spending to qualify for the enhanced federal funds. Specifically, states must maintain their level of HCBS spending as of April 1, 2021. CMS guidance confirms that states “cannot use state funds equivalent to the amount of federal funds made available by the increased FMAP to pay for HCBS that [are] available under the[ir] Medicaid program as of April 1, 2021.” The Appendix provides more detail about the conditions states must meet to satisfy this requirement according to CMS guidance. The proposed 10 percentage point increase for HCBS will be added to the state’s regular Medicaid matching rate (which ranges from 50% to 78% in FY 2022), as well as to other FMAP increases available to states, including the 6 percentage point increase for Community First Choice attendant care services, the 6.2 percentage point increase provided to address the COVID-19 public health emergency (PHE) under the Families First Coronavirus Response Act, any disaster recovery FMAP (available to states with a federally declared disaster and a certain amount of FMAP decline), and the 90% federal matching rate for Medicaid expansion adults under the ACA, as well as the new 5 percentage point increase in the regular matching rate for states newly adopting the ACA expansion provided in a separate section of the law. The cumulative enhanced matching rate for Medicaid HCBS under the law is capped at 95%.

What is the estimated effect of the American Rescue Plan HCBS funding for states?

We estimate that nationally, federal spending for HCBS could increase by about $11.4 billion (Table 1). This estimate is similar to that put out by the Congressional Budget Office, which estimated increased federal costs of approximately $12.7 billion. In the time period that the FMAP increase would be in effect (the final two quarters of FY 2021 and the first two quarters of FY 2022), we estimate that total federal and state Medicaid HCBS spending will be approximately $114 billion (Table 1). Estimated total Medicaid HCBS spending varies widely by state, ranging from $198 million dollars in Wyoming to nearly $22 billion in California. The additional $11.4 billion federal dollars from this FMAP increase would be distributed proportional to the size of state HCBS programs, with California receiving nearly $2.2 billion additional federal dollars and Wyoming receiving about $19.8 million additional federal dollars. This wide state variation reflects both state size and various state policy choices on HCBS programs, nearly all of which are offered at state option.

These estimates are made with a degree of uncertainly. Our estimates reflect HCBS spending in FY 2021 and FY 2022 based on inflation rates from CBO’s projected spending on Medicaid LTSS. However, these estimates do not account for states expanding underlying HCBS spending beyond current levels due to the additional federal incentive. Additionally, some spending in some states may not be eligible for the full increase, should the state hit the 95% federal match cap, after accounting for the 10 percentage point increase in the bill as well as other enhanced matching rates available to states, such as the enhanced match for the ACA Medicaid expansion group. These estimates assume that all states maintain their current spending levels, as required by the law.

Methods

This data note uses spending data from KFF’s FY 2018 HCBS program surveys and FY 2018 Medicaid expenditure data from CMS Financial Management Reports to estimate the amount of additional federal funds available to each state under the proposed FMAP increase. The estimates rely primarily on state-reported data from KFF’s FY 2018 HCBS program survey for expenditures on home health, personal care, Community First Choice, and Section 1915 (i) state plan services as well as HCBS expenditures provided through Section 1915 (c) and Section 1115 waivers. These categories make up the vast majority of Medicaid HCBS spending, and our estimates include capitated spending in these categories.

There are also several additional HCBS categories identified in the law that are eligible for the HCBS match but are not covered by our annual HCBS survey. These categories are PACE, Section 1915 (b) primary care case management, Section 1915 (j) personal care assistance, state plan case management services, and state plan rehabilitative services. FY 2018 spending for these additional categories are pulled from FY 2018 CMS-64 reports and reflect only fee-for-service spending. These totals reflect about $7.5 billion out of a total of $100 billion in estimated Medicaid HCBS spending in FY 2018. HCBS spending was then summed across all program authorities to identify Medicaid HCBS state totals for FY 2018. The estimates do not include state spending for private duty nursing services provided in a beneficiary’s home, which are eligible for the HCBS match according to CMS’s May 2021 guidance.

These totals were inflated using CBO’s projected Medicaid LTC spending baseline from FY 2019 to FY 2022. Since CBO’s current published estimates do not include baseline Medicaid LTC spending for FY 2018, the same amount of growth was used to estimate spending from FY 2018 to FY 2019 as FY 2019 to FY 2020. Annual growth rates using CBO’s Medicaid LTC baseline range from 3.0% to 4.2% from FY 2019 – FY 2022. Total Medicaid HCBS spending for the four quarters during which this additional federal match would be available reflects half of estimated Medicaid HCBS spending from FY 2021 and half of the estimated Medicaid HCBS spending from FY 2022, which amounts to approximately $114 billion (Table 1). Additional federal dollars available through the proposed FMAP bump are calculated by taking 10% of estimated state and national totals from this time period. We assume that this law is intended to provide fiscal relief with a stipulation that states use new funds from the FMAP increase to “supplement and not supplant” current state spending. ​

The estimates do not reflect the opportunity outlined in CMS’s May 2021 guidance for states to receive additional enhanced federal funding. According to the guidance, states receive the 10 percentage point enhanced federal matching funds when they submit claims for HCBS from April 1, 2021 through March 31, 2022. Once states receive the enhanced federal matching funds, that money is considered to be state funds. In the guidance, CMS explains that states can then use those state funds (equivalent to the amount of enhanced federal funds they have drawn down) to provide additional Medicaid-covered HCBS (beyond what was covered as of April 1, 2021). If states use funds in this way, they can receive the increased FMAP on that spending one additional time for claims paid between April 1, 2021 and March 31, 2022.


Table 1: Estimated Additional Federal Dollars for Medicaid HCBS Under American Rescue Act HCBS FMAP Bump
StateEstimated Medicaid HCBS Spending – April 1st, 2021 – March 31st, 2022 Estimated Additional Federal Dollars for Medicaid HCBS
US TOTAL $113,828,064,000  $11,382,811,000
Alabama$871,267,000 $87,127,000
Alaska $374,649,000 $37,465,000
Arizona $1,797,659,000 $179,766,000
Arkansas $1,178,098,000 $117,810,000
California $21,694,742,000 $2,169,474,000
Colorado $1,539,931,000 $153,993,000
Connecticut $1,944,728,000 $194,473,000
DC $892,504,000 $89,250,000
Delaware $372,613,000 $37,261,000
Florida $3,195,868,000 $319,587,000
Georgia $1,555,865,000 $155,587,000
Hawaii $275,132,000 $27,513,000
Idaho $534,865,000 $53,487,000
Illinois $1,770,892,000 $177,089,000
Indiana $1,395,860,000 $139,586,000
Iowa $931,020,000 $93,102,000
Kansas $1,400,775,000 $140,078,000
Kentucky $968,416,000 $96,842,000
Louisiana $906,192,000 $90,619,000
Maine $601,967,000 $60,196,000
Maryland $2,344,175,000 $234,418,000
Massachusetts $4,092,432,000 $409,243,000
Michigan $1,391,405,000 $139,141,000
Minnesota $4,886,088,000 $488,609,000
Mississippi $538,547,000 $53,855,000
Missouri $2,286,356,000 $228,636,000
Montana $323,827,000 $32,383,000
Nebraska $484,708,000 $48,471,000
Nevada $605,863,000 $60,586,000
New Hampshire $433,200,000 $43,320,000
New Jersey $1,726,932,000 $172,693,000
New Mexico $836,622,000 $83,662,000
New York $12,609,573,000 $1,260,957,000
North Carolina $1,823,280,000 $182,328,000
North Dakota $316,001,000 $31,600,000
Ohio $4,344,503,000 $434,450,000
Oklahoma $660,643,000 $66,064,000
Oregon $1,240,435,000 $124,044,000
Pennsylvania $7,291,355,000 $729,136,000
Rhode Island $338,718,000 $33,872,000
South Carolina $847,649,000 $84,765,000
South Dakota $202,815,000 $20,282,000
Tennessee $1,569,796,000 $156,980,000
Texas $8,621,124,000 $862,112,000
Utah $468,343,000 $46,834,000
Vermont $482,800,000 $48,280,000
Virginia $2,133,627,000 $213,363,000
Washington $2,530,236,000 $253,024,000
West Virginia $626,949,000 $62,695,000
Wisconsin $3,369,435,000 $336,944,000
Wyoming $197,584,000 $19,758,000
NOTES: Estimates are based on estimates of Medicaid HCBS spending in FY 2021 and FY 2022. See Methods for more details.SOURCES: KFF estimates based on KFF FY 2018 Medicaid HCBS Program Surveys, FY 2018 Expenditure Reports From MBES/CBES, and FY 2019 – FY 2022 CBO Medicaid Baseline Projections

Appendix

CMS’s May 2021 guidance adopts a three-pronged maintenance of effort requirement for states to demonstrate that they are using the new federal funds to supplement and not supplant existing state spending as required by the American Rescue Plan. Specifically, states must (1) not impose eligibility standards, methodologies or procedures for HCBS programs and services stricter than those in effect on April 1, 2021; (2) maintain coverage of HCBS and the amount, duration, and scope of those services as of April 1, 2021; and (3) not decrease provider payments below the rate in effect on April 1, 2021.

The guidance provides that states must maintain any temporary changes to HCBS eligibility, services, or provider payment adopted under Medicaid emergency authorities in response to the COVID-19 PHE “for as long as allowable under those authorities.” However, CMS clarifies that, to meet the requirements to receive the enhanced HCBS FMAP, states do not have to retain such changes past the approved end date of any emergency authorities. CMS also notes that states will not be penalized for fluctuations in HCBS enrollment, utilization, or spending that are unrelated to changes in state policies and procedures, especially during the COVID-19 PHE.

The state’s initial HCBS spending plan projection and narrative should estimate the total amount of enhanced funds that the state anticipates claiming from April 1, 2021 through March 31, 2022 and the anticipated expenditures for activities the state intends to implement. CMS will approve state submissions that meet the terms of the guidance within 30 days. Until all of the enhanced funds are expended, states must submit quarterly HCBS spending plans and narratives that estimate the amount of enhanced funds that the state has claimed or anticipates claiming and anticipated and/or actual expenditures and provide progress reports on state activities. The guidance indicates that CMS will publicly post summary information from the state reports.

Appendix Table: Examples of American Rescue Plan State Activities to Enhance, Expand, or Strengthen Medicaid Home and Community-Based Services (HCBS)
 Activities to Support State COVID-Related HCBS Needs
TopicActivityExamples
ServicesIncrease covered servicesProvide new HCBS or expand scope of existing HCBS to reduce risk of institutionalization during COVID-19 PHE

Specific services highlighted include:

  • Assistive technology (including necessary internet activation costs) and staffing to mitigate social isolation and ensure service plans continue to be fully implemented during PHE
  • One-time community transition costs and transition coordination services for those moving from institutions or provider-operated congregate community setting to private community residence
  • Mental health and substance use disorder treatment and recovery services (including via telehealth) to address HCBS enrollee needs during PHE
  • Rehabilitative services to regain skills lost during PHE
Facilitate COVID vaccine accessAssist with scheduling appointments

Provide direct support services during appointments

Provide transportation to appointments

Develop in-home vaccine options

Conduct vaccine education and outreach

Provide COVID education/outreachDevelop educational materials in accessible formats about COVID prevention, treatment, and recovery for HCBS enrollees, their families, and the general community

Pay for American Sign Language and other interpreters to assist in providing HCBS and provide information about COVID

WorkforceIncrease worker compensationIncrease payment rates for HCBS providers (e.g., home health agencies, PACE organizations, agencies or beneficiaries that employ DSPs), with the expectation that direct care worker pay will increase

Provide paid sick, family, medical leave and/or hazard, overtime, shift differential pay for home health workers and DSPs

Increase behavioral health provider payment rates to expand access to mental health and substance use disorder services for HCBS enrollees during PHE

Engage in worker recruitmentConduct activities and offer incentive payments to recruit and retain home health workers and DSPs

Conduct activities to recruit more behavioral health providers

Provide family caregiver supportsCover equipment and supplies need by family caregivers, including items not typically covered such as PPE and payment as a service provider
Support provider COVID responsePurchase PPE and routine COVID testing for direct services workers and people receiving HCBS

Provide home health worker/DSP training specific to COVID PHE

Fund adult day health centers to make physical, operational or other changes to safely deliver services during COVID PHE

Activities to Support State HCBS Capacity Building and LTSS Rebalancing Reform
TopicActivityExamples
Eligibility and EnrollmentStreamline eligibility and enrollment processesAdopt new policies such as expedited HCBS eligibility (subject to CMS approval)

Streamline application and enrollment processes

Reduce or eliminate HCBS waiting listsIncrease number of HCBS waiver slots to serve additional enrollees
Build no wrong door systemsEstablish toll free phone lines

Develop informational websites

Automate screening and assessment tools

Conduct marketing and outreach

ServicesIncrease covered servicesProvide new services or increase scope of existing services

Specific examples highlighted include:

  • Community transition (add new populations and/or services)
  • Equipment and devices to address functional needs and promote independence and support community integration (e.g., eyeglasses, wheelchair transfer boards, adaptive cooking equipment)
  • Assistive technology (e.g., individual tele-communication start-up costs such as equipment or internet connectivity activation, smartphones or computers to address functional needs and promote independence and support community integration)
Improve service planningAdopt standardized functional assessments

Enhance person-centered planning/provide training

WorkforceEngage in worker recruitment and retentionCreate financial incentives to expand the number, retention rate, and skills of direct care workforce

Expand opportunities for self-direction

Provide family caregiver supportsProvide respite services
Offer worker trainingProvide training for caregivers, enrollees, and providers (general or to support community integration)
Increase provider capacityFund nursing homes/institutional settings to convert to assisted living facilities or to provide adult day health, respite, or other HCBS
Oversight/Data/ SystemsStrengthen institutional diversion and community transition programsImprove use of data (MDS, claims, encounter) to support community transition programs

Strengthen and improve PASRR processes to prevent unnecessary institutionalization

Embed options counselors in hospital discharge programs

Address social determinants of healthAssess health disparities for seniors and people with disabilities

Test alternative payment models or delivery of new services to address social determinants of health, such as housing supports, employment supports, community integration

Build social determinant of health network partnerships

Invest in quality improvementUpgrade critical incident management reporting systems

Adopt new quality measures

Implement experience of care surveys such as HCBS CAHPS

Provide training and technical assistance to build provider performance measurement and predictive analytic capabilities

Improve cross-system data integrationEstablish data sharing agreements among state/county agencies, providers, community-based organizations

Integrate claims/encounter data with incident management system

Invest in infrastructure to incorporate HCBS into electronic health records

Integrate Medicare and Medicaid data

Improve care coordinationImplement information technology care coordination enhancements such as notification systems and capabilities (e.g., hospital admission/discharge/transfer) to share information across settings

Improve Medicaid managed care plan access to Medicare data to improve care coordination for dual eligible enrollees receiving HCBS

Implement integrated care models to more effectively address complex population needs

Provide more intensive care coordination for enrollees with significant socioeconomic needs based on risk stratification modeling

Develop cross-system partnershipsIncentives health plans and providers to partner with community-based organizations, social service agencies, counties, housing agencies, public health agencies

Require providers to participate in local/regional provider networks

Build Medicaid housing partnerships

NOTES: DSP = direct support professional. PPE = personal protective equipment. List of examples is not exhaustive.SOURCE: KFF analysis of CMS SMD #21-003, Implementation of American Rescue Plan Act of 2021 Section 9817:  Additional Support for Medicaid Home and Community-Based Services during the COVID-19 Emergency, Appendixes C and D (May 13, 2021).

A Look at Parental Consent and COVID-19 Vaccination for Adolescents

Authors: Natalie Singer, Jennifer Kates, Jennifer Tolbert, and Daniel McDermott
Published: May 28, 2021

COVID-19 vaccine distribution has begun for adolescents ages 12 to 15 (and is ongoing for those ages 16 to 17), and authorization of a vaccine for even younger children is expected by this fall. This has focused attention on the role of parents and parental consent for vaccination, especially since most parents are not yet ready to get their children vaccinated. To better understand the landscape of parental consent laws, KFF assessed which states have such laws, for what ages, and where exceptions for COVID-19 vaccination have been made.

As shown in the map below, most states (41) require parental consent for vaccination of minors below the age of 18, although one of these states (NE) requires consent below age 19. In 5 states, a minor’s ability to self-consent is based on a specific age below 18 (RI, SC, OR, AL, DC). The remaining 5 states apply the “mature minor doctrine”, meaning that there is no specific age cut-off but providers have discretion to decide if a minor possesses the maturity to consent for themselves (AR, ID, NC, TN, WA). For more details on how these laws vary by state and the important role they will play in increasing vaccinations among young people, please visit kff.org.

Source

COVID-19 Vaccination and Parental Consent

News Release

Vaccine Monitor: Vaccination Rates Continue to Inch Upwards Across Groups, Especially Among Hispanic Adults, But Few Who Are Eager to Get a Shot Remain Unvaccinated

Full FDA Approval of Vaccines Emerges as a Potential Motivator for Many to Get Vaccinated

Published: May 28, 2021

4 in 10 Parents Say Their Adolescent Children Have Already Gotten a Shot or Will Do So Right Away; One Quarter of Parents of Children Under 12 Will Get Them Vaccinated as Soon as They Are Eligible

Few Unvaccinated Adults Say that CDC’s Guidelines for Vaccinated Adults Make Them More Likely to Get a Shot

Nearly all adults who are eager to get a COVID-19 vaccine now have already gotten at least one shot as COVID-19 vaccination rates inch higher this month, with the biggest increase among Hispanic adults, a new KFF COVID-19 Vaccine Monitor report finds.

The report shows that 62% of adults say they have gotten at least one dose, up from 56% in April, while the share who say they want to get a shot “as soon as possible” dipped from 9% in April to 4% now.

An additional 12% say they want to “wait and see” how the vaccines work for others before getting a shot themselves, down slightly since April (15%). Within the wait-and-see group, about a third (36%, or 4% of all adults) say they have already scheduled an appointment to get vaccinated or plan to do so within the next three months. If this group and those who want a vaccine “as soon as possible” follow through and get a vaccine, it could push the overall vaccination rate for adults to 70% over the summer.

“At this point, there’s almost no low-hanging fruit, but there’s a path toward a slow-but-steady increase in vaccination rates through improved access, information, persuasion and incentives,” KFF President and CEO Drew Altman said.

The size of the two most reluctant groups also remains largely unchanged from April, with 7% saying they would get vaccinated “only if required” for work, school or other activities, and 13% saying they will “definitely not” get vaccinated.

Self-reported vaccination rates inched up across most demographic groups, including among Hispanic adults (57%, up from 47% in April) and adults without college degrees (55%, up from 48%). At least half of adults across most demographic subgroups now say they have gotten vaccinated.

One group whose enthusiasm appears to have stalled over the past month is Republicans, among whom about half (49%) say they’ve gotten at least one dose of a vaccine and 27% say they will “definitely not” get vaccinated.

With adolescents ages 12-17 now eligible to get a COVID-19 vaccine, 4 in 10 (41%) parents with kids in that age range say their child has already received at least one dose (24%) or will get one right away (18%).

Parents of younger children who are not yet eligible for a vaccine are less eager at this stage. About a quarter (26%) say they will get their child vaccinated as soon as they are eligible, while a third (33%) say they will wait and see how well it works for others first. Smaller shares say they would get their younger children vaccinated only if required (14%) or would definitely not get them vaccinated (26%).

Parents’ views about the COVID-19 vaccine don’t necessarily reflect broader vaccine concerns. Just 11% of parents overall say that they have ever delayed or skipped other vaccines for their children.

Full FDA Approval of a COVID-19 Vaccine among Biggest Potential Motivators

There are currently three COVID-19 vaccines available in the United States under an emergency use authorization from the Food and Drug Administration (FDA). One significant potential motivator for people would be if the FDA were to grant full approval to one or more of those vaccines.

The Monitor finds that 32% of unvaccinated adults, including 44% of those in the wait-and-see group, say they would be more likely to get vaccinated if a vaccine received full FDA approval.

In addition, 1 in 5 (21%) of those who are employed and unvaccinated say they’d be more likely to get a vaccine if their employer gave them paid time off to get vaccinated and recover from any side effects.

Other potential motivators to encourage vaccination could have a more modest impact on unvaccinated adults’ willingness to get vaccinated. These include being offered $100 from their state government (15% say this would make them more likely to get vaccinated); being offered free transportation from a ride-share company (13%); free tickets to a sporting event or concert (11%); and being offered a $20 coupon for food or drink (10%).

These incentives are somewhat more likely to influence some groups where vaccination rates to date have lagged, including Black and Hispanic adults, and those with lower household incomes.

4 in 10 Say the CDC’s Guidance on Safe Behaviors is Confusing

The monitor also gauges the public’s initial reaction to the May 13 guidance issued by the Centers for Disease Control and Prevention (CDC) that fully vaccinated people do not need to wear a mask or physically distance in most circumstances.

Among the public overall, a majority (54%) says the CDC’s guidance is clear and easy to follow, while just over four in ten (43%) say the guidance is confusing and hard to follow. The split is similar among both vaccinated and unvaccinated adults. Among partisans, Republicans are somewhat more likely to say the guidance is confusing (56%) than Democrats (39%) or independents (37%) are.

Among those who are unvaccinated, a large majority (85%) say the CDC’s guidance does not affect their enthusiasm for getting vaccinated, though one in ten say that it makes them more likely to do so and a small share (4%) say it makes them less likely.

Designed and analyzed by public opinion researchers at KFF, the KFF Vaccine Monitor survey was conducted from May 18-25 among a nationally representative random digit dial telephone sample of 1,526 adults. Interviews were conducted in English and Spanish by landline (248) and cell phone (1,278). The margin of sampling error is plus or minus 3 percentage points for the full sample. For results based on subgroups, the margin of sampling error may be higher.

The KFF COVID-19 Vaccine Monitor is an ongoing research project tracking the public’s attitudes and experiences with COVID-19 vaccinations. Using a combination of surveys and qualitative research, this project tracks the dynamic nature of public opinion as vaccine development and distribution unfold, including vaccine confidence and acceptance, information needs, trusted messengers and messages, as well as the public’s experiences with vaccination.

Poll Finding

KFF COVID-19 Vaccine Monitor: May 2021

Published: May 28, 2021

Findings

The KFF COVID-19 Vaccine Monitor is an ongoing research project tracking the public’s attitudes and experiences with COVID-19 vaccinations. Using a combination of surveys and qualitative research, this project tracks the dynamic nature of public opinion as vaccine development and distribution unfold, including vaccine confidence and acceptance, information needs, trusted messengers and messages, as well as the public’s experiences with vaccination.

Key Findings

  • The latest KFF COVID-19 Vaccine Monitor shows continued steady progress in vaccine uptake, with 62% of U.S. adults saying they’ve gotten at least one dose of a vaccine (up from 56% in April) and the share saying they will “wait and see” down slightly from 15% to 12%. This leaves few remaining eager to get vaccinated, while the shares saying they will get vaccinated “only if required” (7%) or will “definitely not” get a vaccine (13%) essentially unchanged over the last several months. Yet findings also suggest the overall adult vaccination rates could reach 70% over the next several months, with 4% saying they want the vaccine as soon as possible and about a third of the “wait and see group” (or 4% of all adults) saying they have already scheduled an appointment or plan to get the vaccine in the next 3 months.
  • One potential avenue for further increasing vaccine uptake is full FDA approval of one of the vaccines currently authorized for emergency use, with about one-third (32%) of unvaccinated adults saying such approval would make them more likely to get vaccinated. In addition, one in five (21%) employed adults who have not gotten a vaccine say they would be more inclined to do so if their employer gave them paid time off to get vaccinated and recover from side effects. Certain financial incentives may also motivate small shares (between 10-15%) of the unvaccinated to get a vaccine. Such incentives, including free transportation from ride share companies, lead larger shares of Hispanic and Black adults as well as those with lower incomes to say they would get vaccinated, suggesting incentives could play a role in further decreasing racial, ethnic, and socioeconomic disparities in vaccination rates.
  • Over four in ten adults (43%) say that CDC guidance on the types of activities that vaccinated and unvaccinated people can safely engage in is confusing and hard to follow, a share is similar among vaccinated and unvaccinated adults but rises to 56% among Republicans. The vast majority of those who have not been vaccinated say the new CDC guidelines stating that fully vaccinated people do not need to wear masks or practice social distancing in most situations does not make a difference in their own decision about whether to get vaccinated.
  • Among parents of adolescents ages 12-17, four in ten (41%) say their child has already received at least one dose of the COVID-19 vaccine or they will get them vaccinated right away. Parents of younger children under age 12 are more cautious, with about a quarter saying they will get their young child vaccinated as soon as a vaccine is authorized for their age group and one-third saying they will take a “wait and see” approach.

While the share of U.S. adults who report receiving at least one dose of a COVID-19 vaccine has continued to climb from 56% in April to 62% in May, the share who say they intend to get the vaccine as soon as possible fell to just 4%, leaving a very small group that is ready to get vaccinated right away. At the same time, the share who say they want to “wait and see” before getting vaccinated inched downward from 15% to 12% over the past month, while the shares saying they will get a vaccine “only if required” for work or other activities, or will “definitely not” get vaccinated remain essentially unchanged since January.

Share Who Report Receiving A COVID-19 Vaccine Continues To Increase, With Few Remaining Eager To Get A Vaccine ASAP

Within most demographic subgroups of the population, there was an uptick between March and April in the share saying they have received a vaccine and a decrease in the share who say they have not gotten the vaccine but want it right away. The increase in self-reported vaccination rates between April and May was notable among Hispanic adults (from 47% to 57%) and those without college degrees (from 48% to 55%), two groups for whom vaccine uptake has lagged behind others. 

Table 1: Change in self-reported COVID-19 Vaccination Rates April to May 2021
Percent who report receiving at least one dose of a COVID-19 vaccineApril 2021May 2021Change (percentage points)
Total adults56%62%+6
Race/ethnicity
Black51%56%+5
Hispanic47%57%+10
White60%65%+5
Education
No college degree48%55%+7
College graduates75%77%+2
Gender
Women57%64%+7
Men54%59%+5
Age
18-2940%48%+8
30-4948%51%+3
50-6463%69%+6
65+76%83%+7

This leaves a picture that is very similar to April, with at least half of adults in almost every demographic group saying they’ve gotten at least one dose of a vaccine, including large majorities of older adults, those with serious health conditions, college graduates, and Democrats. Younger adults and Black adults remain disproportionately likely to say they will wait and see before getting a vaccine, while Republicans, rural residents, and White Evangelical Christians are disproportionately likely to say they will definitely not get vaccinated. Notably, after increasing somewhat last month, vaccine enthusiasm seems to have stalled among Republicans, with about half (49%) saying they’ve gotten at least one dose of the vaccine (statistically similar to the 52% who said so last month) and 27% saying they will definitely not get vaccinated.

Across Most Subgroups, At Least Half Report Being Vaccinated For COVID-19, Few Remain Who Want The Vaccine As Soon As Possible

How Long Will the “Wait and See” Keep Waiting?

While few who are eager remain unvaccinated, the Monitor does provide some indication that vaccination rates could continue to increase over the next few months. In addition to the remaining 4% of all adults who say they have not been vaccinated but plan to do so as soon as they can, about a third of those in the “wait and see” group (4% of all adults) say they either already have a vaccine appointment scheduled or that they will wait 3 months or less before getting vaccinated, suggesting the possibility that the adult vaccination rate could surpass 70% this summer. Still, over four in ten of those in the “wait and see” group say they intend to wait more than 6 months to get a vaccine, including one third who plan to wait more than a year.

About A Third Of Those In "Wait And See" Plan To Get COVID-19 Vaccine Within Three Months, But Another Third Will Wait Over A Year

What Else Might Encourage Vaccine Uptake?

Among various incentives tested in this month’s Monitor, the one that appears to have the most resonance, particularly for those in the “wait and see” group, is full FDA approval of one or more of the COVID-19 vaccines. About a third (32%) of those who have not been vaccinated, including 44% of those who say they want to “wait and see,” say they would be more likely to get vaccinated if one of the vaccines currently authorized for emergency use received full approval from the FDA. One in five (21%) of those who are employed and unvaccinated say they’d be more likely to get the vaccine if their employer gave them paid time off to get vaccinated and recover from any side effects.

Among various financial incentives, small shares of those who haven’t gotten a vaccine say they’d be more likely to do so if they were offered $100 from their state government (15%), free transportation from a ride sharing company (13%), free tickets to a sporting event or concert (11%), or a $20 coupon for items like food or drinks (10%).

Full FDA Approval Could Boost COVID-19 Vaccine Uptake, Particularly Among The "Wait And See" Group

The shares who say they’d be more likely to get vaccinated if offered many of these financial incentives are larger among some key populations among whom vaccination rates have lagged, including Black and Hispanic adults and those with lower household incomes. Notably, larger shares of Both Black and Hispanic adults compared to White adults who have not been vaccinated say they’d be more likely to get a vaccine if they were offered free transportation from a ride share company like Uber or Lyft, reflecting disproportionate concern about having difficulty traveling to a vaccination site among these populations identified in previous Monitor reports. These findings suggest that financial incentives and travel assistance could help further close gaps in vaccination rates between White communities and people of color, in addition to helping some adults with lower socioeconomic status get vaccinated.

Table 2: Effect of Financial Incentives on COVID-19 Vaccine Uptake Among Key Groups
Percent who say they would be more likely to get vaccinated if offered the following…Race/EthnicityHousehold income
BlackHispanicWhite<$40,000$40,000 or more
$100 from their state government25%29%8%22%11%
Free transportation from a ride share company22%29%5%21%7%
Free tickets to a sporting event or concert20%21%6%17%7%
$20 coupon for items such as food or drinks15%22%6%16%6%

There is also the possibility for incentives and requirements to get vaccinated to backfire with certain individuals. In fact, among those who have not been vaccinated and are not ready to get the vaccine as soon as possible, about four in ten (41%) say they have felt “unfairly pressured” to get the COVID-19 vaccine, including half of those who say they will “definitely not” get vaccinated (51%) and similar shares of women (48%) and college graduates (52%).

When those who report feeling unfair pressure are asked who they think has been applying that pressure, the most common responses include the government (36%), the media (19%), society in general (14%), and their friends, family, or coworkers (12%). 

Four In Ten Of Those Not Ready To Get A COVID-19 Vaccine Say They Have Felt Unfair Pressure To Get It, Including Larger Shares Among Women And Those With College Degrees

Reactions to New CDC Guidance on Safe Activities for Fully Vaccinated Adults

On May 13, 2021, the Centers for Disease Control and Prevention (CDC) issued updated public health guidelines for activities that fully vaccinated people can safely engage in. Among other things, the new guidance states that fully vaccinated people no longer need to wear a mask or physically distance in any setting, except where required by other laws, regulations, or business restrictions. Asked how they feel about the CDC guidelines, just over half the public (54%) says they are “clear and easy to understand” and just over four in ten (43%) say they are “confusing and hard to follow”. Notably, similar shares of both vaccinated and unvaccinated adults say they find the guidance confusing, though there is a partisan divide with a majority of Republicans (56%) saying the guidance is confusing and majorities of Democrats (59%) and independents (60%) saying it is clear. This may reflect partisan differences in trust of the CDC as identified in previous Vaccine Monitor reports.

Four In Ten Overall, Including Majority Of Republicans, Say New CDC Guidance Is Confusing

When those who have not been vaccinated for COVID-19 are asked how the new CDC guidance saying fully vaccinated people do not need to wear masks or social distance in most places might affect their own vaccination plans, the vast majority (85%) say it makes no difference. One in ten say this updated guidance makes them more likely to get vaccinated, but a small share (4%) say it makes them less likely to get a vaccine.

Large Majority Of Those Who Have Not Been Vaccinated Say Updated CDC Guidance On Activities For Vaccinated Individuals Has No Effect On Their Own COVID-19 Vaccine Plans

Parents’ Intentions for Vaccinating Children

With the recent FDA authorization for the use of the Pfizer COVID-19 vaccine in children ages 12 and older, the latest Monitor finds about four in ten (41%) parents of children ages 12-17 say their child has already received at least one dose of the vaccine (24%) or that they will get them vaccinated right away (18%). About one in five parents of adolescents say they will “wait a while to see how it is working” before getting their child vaccinated (21%), while 14% say they will get their child vaccinated only if their school requires it and another one in five say they will “definitely not” get their 12-17 year-old vaccinated.

Four In Ten Parents Say Their Adolescent Has Already Received A COVID-19 Vaccine Or Will Do So Right Away

Parents of younger children, for whom a COVID-19 vaccine is not yet authorized, are more cautious in their approach to the vaccine. One-quarter (26%) say they will get their child under age 12 vaccinated as soon as a vaccine is authorized for their age group, while one-third intend to wait a while to see how the vaccine is working. An additional 14% say they will vaccinate their young child only if school requires it and one-quarter (26%) say they will definitely not get them vaccinated.

Parents’ own vaccination status is correlated with their intentions to vaccinate their children for COVID-19. Among parents of children under age 12 who have received a vaccine themselves, nearly half (46%) say they will get their younger child a vaccine as soon as one is authorized for their age group compared to just 8% of parents who have not received a vaccine. By contrast, 42% of unvaccinated parents say they will “definitely not” get their child under age 12 vaccinated compared to just 8% of parents who have received the vaccine themselves.

One-Quarter Of Parents Of Children Under Age 12 Say They'll Get Their Child A COVID-19 Vaccine As Soon As It's Available, With Large Differences By Parent Vaccination Status

When parents are asked the biggest question they have when it comes to their child receiving a COVID-19 vaccine, the questions echo many of the concerns we have heard from adults about getting the vaccine themselves. One in five parents mention questions about potential side effects or negative reactions to the vaccine, and another 10% have questions about long-term side effects specifically. Six percent of parents say they want to know more about the research that was done on children and 5% have questions about the safety of the vaccine for children. Smaller shares mention questions about vaccine effectiveness, availability, and whether it’s necessary for children to get vaccinated. About one in five parents (19%) say they do not have any questions when it comes to their child receiving a vaccine.

These questions and concerns don’t necessarily reflect a resistance among parents to vaccines more broadly. Just 11% of parents say they have ever delayed or skipped other vaccines for their children.

In their own words: What is the biggest question you have, if any, when it comes to your child or children receiving a COVID-19 vaccine?

"I’m most interested in the long term impact of their development, physical, mental and reproductive development."—Black mother of child under age 12, will get child vaccinated only if school requires it

"I want to know how my children's bodies will react to the vaccine. I also want to know if it will be authorized completely by the FDA."—Hispanic mother of child under age 12, will get child vaccinated only if school requires it

"The pain the shot will cause them, my arm was severely sore, so how is that going to affect my child?"—Hispanic mother of child under age 12, will wait and see before getting child vaccinated

"Is it gonna really work? Is it going to keep them safe considering all the side effects people are having?"—Black father of child under age 12, will wait and see before getting child vaccinated

"If a child has health conditions already, no one knows what the side effects are. If they take the COVID vaccine and they were to get sick, what would be to prevent them from getting worse?"—White father of child age 12-15, will wait and see before getting child vaccinated

"So the biggest question I have is how will they follow up with the new vaccine in the following year? With the strain ever changing. How will they follow up the next year? Or do they just expect me to continue to pump my kid with a drug that they don't know how it affects everything?"—Hispanic mother of child age 16-17, will get child vaccinated only if school requires it

"I want to know if the vaccines my children are taking are really effective against the virus. I want to know if younger children also have to get the vaccine."—Hispanic mother of children ages 12-15 and 16-17, child has already been vaccinated

"I do not have a question because they are not getting it."—White mother of children under age 12 and ages 12-17, will definitely not get child vaccinated

Methodology

This KFF COVID-19 Vaccine Monitor was designed and analyzed by public opinion researchers at the Kaiser Family Foundation (KFF). The survey was conducted May 18-May 25, 2021, among a nationally representative random digit dial telephone sample of 1,526 adults ages 18 and older (including interviews from 327 Hispanic adults and 307 non-Hispanic Black adults), living in the United States, including Alaska and Hawaii (note: persons without a telephone could not be included in the random selection process). Phone numbers used for this study were randomly generated from cell phone and landline sampling frames, with an overlapping frame design, and disproportionate stratification aimed at reaching Hispanic and non-Hispanic Black respondents. Stratification was based on incidence of the race/ethnicity subgroups within each frame. Specifically, the cell phone frame was stratified as: (1) High Hispanic: Cell phone numbers associated with rate centers from counties where at least 35% of the population is Hispanic; (2) High Black: Cell phone numbers associated with remaining rate centers from counties where at least 35% of the population is non-Hispanic Black; (3) Else: numbers from all remaining rate centers. The landline frame was stratified as: (1) High Black: landline exchanges associated with Census block groups where at least 35% of the population is Black; (2) Else: all remaining landline exchanges. The sample also included 162 respondents reached by calling back respondents that had previously completed an interview on the KFF Tracking poll at least nine months ago. Another 134 interviews were completed with respondents who had previously completed an interview on the SSRS Omnibus poll (and other RDD polls) and identified as Hispanic (n = 46; including 19 in Spanish) or non-Hispanic Black (n=88). Computer-assisted telephone interviews conducted by landline (248) and cell phone (1,278, including 963 who had no landline telephone) were carried out in English and Spanish by SSRS of Glen Mills, PA. To efficiently obtain a sample of lower-income and non-White respondents, the sample also included an oversample of prepaid (pay-as-you-go) telephone numbers (25% of the cell phone sample consisted of prepaid numbers) Both the random digit dial landline and cell phone samples were provided by Marketing Systems Group (MSG). For the landline sample, respondents were selected by asking for the youngest adult male or female currently at home based on a random rotation. If no one of that gender was available, interviewers asked to speak with the youngest adult of the opposite gender. For the cell phone sample, interviews were conducted with the adult who answered the phone. KFF paid for all costs associated with the survey.

The combined landline and cell phone sample was weighted to balance the sample demographics to match estimates for the national population using data from the Census Bureau’s 2019 U.S. American Community Survey (ACS), on sex, age, education, race, Hispanic origin, and region, within race-groups, along with data from the 2010 Census on population density. The sample was also weighted to match current patterns of telephone use using data from the January- June 2020 National Health Interview Survey The weight takes into account the fact that respondents with both a landline and cell phone have a higher probability of selection in the combined sample and also adjusts for the household size for the landline sample, and design modifications, namely, the oversampling of potentially undocumented respondents and of prepaid cell phone numbers, as well as the likelihood of non-response for the re-contacted sample. All statistical tests of significance account for the effect of weighting.

The margin of sampling error including the design effect for the full sample is plus or minus 3 percentage points. Numbers of respondents and margins of sampling error for key subgroups are shown in the table below. For results based on other subgroups, the margin of sampling error may be higher. Sample sizes and margins of sampling error for other subgroups are available by request. Note that sampling error is only one of many potential sources of error in this or any other public opinion poll. Kaiser Family Foundation public opinion and survey research is a charter member of the Transparency Initiative of the American Association for Public Opinion Research.

GroupN (unweighted)M.O.S.E.
Total1,526± 3 percentage points
COVID-19 Vaccination Status
Have gotten at least one dose of the COVID-19 vaccine1,009± 4 percentage points
Have not gotten the COVID-19 vaccine500± 5 percentage points
Race/Ethnicity
White, non-Hispanic739± 4 percentage points
Black, non-Hispanic307± 7 percentage points
Hispanic327± 6 percentage points
Party Identification
Democrats549± 5 percentage points
Republicans288± 7 percentage points
Independents473± 5 percentage points
Parents
Parents of children under 18 in household357± 6 percentage points
Parents of children ages 12-17190± 8 percentage points
Parents of children under 12 years old259± 7 percentage points


Historical Trends in U.S. Funding for Global Health

Published: May 27, 2021

Key Findings

  • The U.S. is the largest donor to global health in the world, and funding for global health has grown over time. To provide context for the release of the first, full budget request from the Biden administration, this brief provides an overview of trends in U.S. global health funding. It examines both regular as well as supplemental, or emergency, appropriations over time, changes in funding for major program areas, and trends in the distribution between bilateral and multilateral support.
  • U.S. funding for global health, through regular appropriations, has grown significantly over the past two decades, rising from $1.7 billion in FY 2001 to $11.4 billion in FY 2021, with the steepest increase occurring in the earlier decade. Most of the increase ($8.3 billion or 85%) was provided between FY 2001–FY 2011, a decade which marked the creation of PEPFAR, the Global Fund to Fight AIDS, Tuberculosis and Malaria, and the President’s Malaria Initiative.
  • Since FY 2011, funding increases have been more modest. Between FY 2011 and 2021, funding rose by $1.4 billion, most of which has come in recent years. There were also fluctuations over the period, including some declines.
  • Funding for most global health program areas has increased since FY 2011, particularly the Global Fund and global health security; funding was flat for PEPFAR and declined for family planning and reproductive health. All other program areas – tuberculosis, malaria, maternal and child health, nutrition, vulnerable children, and neglected tropical diseases – increased over the period.
  • Most global health funding has been provided bilaterally (ranging from 79-85% between FY 2011 and 2021), but the amount and share of funding for multilateral organizations has increased at a faster rate. Bilateral funding increased by 8% over the period while multilateral funding increased by 48%. Funding for multilateral organizations now makes up a fifth (20%) of the global health budget, up from 15% in FY 2011.
  • Emergency funding, provided to respond to specific disease threats, has become a more prominent part of the global health budget in recent years. Since FY 2011, the U.S. has provided $11.8 billion in emergency funding for global health (9% of overall global health funding over the period). Most of this funding (90%) has been provided for COVID-19. Emergency funding has also been provided to respond to Ebola and Zika outbreaks.

Issue Brief

Introduction

On April 9, 2021, the Biden administration released an initial, discretionary FY 2022 budget request to Congress, kicking off the annual budget process (see Appendix). While a full budget request is expected at the end of May, the initial proposal includes $10 billion for global health activities (see Box 1), with a heavy focus on and significant increase for ($800 million above FY 2021 levels) global health security. Although Congress ultimately determines funding levels each year, the president’s budget request serves as an important indication of the administration’s priorities. The President’s first budget request is especially significant as it will provide an important signal for the administration’s broader approach to and priorities for U.S. global health engagement. Indeed, COVID-19 has elevated global health security in particular to the top of U.S. domestic and international agendas, and the President has already taken steps to bolster U.S. global health engagement, including rejoining the World Health Organization (WHO) and joining COVAX, the global mechanism to secure and deliver COVID-19 vaccines. To provide context for the release of the administration’s first, full budget request for FY 2022, this brief provides an overview of historical trends in U.S. global health funding, including changes in program-specific funding over time, the distribution between bilateral and multilateral support, and in the increasing use of emergency supplemental funding in response to outbreaks, which has become a more prominent part of the U.S. global health budget.

Box 1: Overview of U.S. Global Health Funding

Major program areas that receive U.S. global health funding: PEPFAR (HIV), Tuberculosis (TB), Malaria, Global Fund to Fight AIDS, Tuberculosis, and Malaria (Global Fund), Neglected Tropical Diseases (NTDs), Maternal and Child Health (MCH) (including polio), Nutrition, Family Planning and Reproductive Health (FP/RH), Vulnerable Children program, Global Health Security, Other Public Health Threats.

Departments and agencies that provide U.S. global health funding:The majority of U.S. government funding for global health is captured under the Global Health Programs (GHP) account at the U.S. Agency for International Development (USAID) and the Department of State (State). Additional funding for global health is provided through the Economic Support Fund (ESF), Development Assistance (DA), and Assistance for Europe, Eurasia and Central Asia (AEECA) accounts at USAID, the International Organizations and Programs (IO&P) and the Contributions to International Organizations (CIO) accounts at State, and through the Centers for Disease Control (CDC), National Institutes of Health (NIH), and Department of Defense (DoD). Congress specifies funding levels for global health areas (e.g. HIV, TB, MCH, GHS, etc.) under the GHP, CIO and IO&P accounts at USAID and State as well as for global health programs at CDC. Congress does not specify global health funding amounts under the ESF, AEECA, and DA accounts or at NIH and DoD and instead provides this authority to the administration; as a result, global health funding under these accounts and at NIH and DoD has fluctuated over the period.

Global health represents the largest share of U.S. international development aid,1  and funding for global health through regular appropriations has grown significantly since FY 2001. Between FY 2001, when funding was $1.7 billion, and FY 2021, funding for global health increased by almost $10 billion, most of which ($8.3 billion or 85%) was provided between FY 2001–FY 2011, marking the creation of PEPFAR, the Global Fund to Fight AIDS, Tuberculosis and Malaria, and the President’s Malaria Initiative. Funding increases slowed in the years after the global financial crisis that began in 2008, and even declined slightly in the early part of the next decade. While it somewhat recovered, increases over the past decade have been more modest, rising by $1.4 billion between FY 2011 and FY 2021, driven primarily by increases to the Global Fund and global health security.2  In FY 2021 U.S. funding for global health through regular appropriations totaled $11.4 billion, its highest level to date.3  Additional funding has also been provided through emergency, supplemental funding (see below).

U.S. Global Health Funding through Regular Appropriations, FY 2001- FY 2021

While funding for most global health program areas increased over the last decade, funding for PEPFAR (bilateral HIV) remained flat and funding for family planning and reproductive health (FP/RH) declined; overall funding, as well as funding for all program areas, fluctuated over the period. The biggest increases were for the Global Fund (which represented the largest dollar amount increase) and global health security (which represented the largest percentage increase) (see Figure 2).

Percent Change in Funding Comparing FY 2021 to FY 2011, by Program Area

Key program area trends over the past decade include the following:

  • PEPFAR (Bilateral HIV). PEPFAR funding has ranged between $4.7 billion and $5.5 billion since FY 2011, though current levels are about the same as funding a decade ago (see Figure 3). There was a significant dip in funding after FY 2012 (of more than $400 million), and funding did not rebound until FY 2019, where it has remained since. While funding for bilateral HIV programs has historically accounted for the largest share of the U.S. global health budget, its share has declined over time, dropping from 54% in FY 2011 to 48% in FY 2021 (see Figure 4). Bilateral HIV funding is provided through the GHP account at USAID and State, the ESF account at USAID, and through CDC, NIH, and DoD. Additional funding for PEPFAR was recently provided through emergency COVID-19 funding (see below).
  • The Global Fund. The U.S. has been the largest donor to the Global Fund since its inception. U.S. contributions to the Global Fund in FY 2021 ($1,560 million) were $514 million (49%) above the FY 2011 level ($1,046 million), the largest increase of any global health program, although funding fluctuated over the period (see Figure 2 and 3). The Global Fund has represented the second largest share of the U.S. global health budget, and that share has increased somewhat, from 10% to 14% over the period (see Figure 4). U.S. funding for the Global Fund is provided through the GHP account at State. In the past, some funding has also been channeled through NIH as well. Additional funding for the Global Fund was recently provided through emergency COVID-19 funding (see below).
  • Maternal and Child Health (MCH). MCH funding, which includes funding for polio, Gavi, the Vaccine Alliance (Gavi), and the United Nations Children’s Fund (UNICEF), in FY 2021 was $261 million (27%) above FY 2011 level ($974 million), although there was fluctuation over the period (see Figures 2 and 3). Increases in funding are largely due to increases in funding for polio efforts and for Gavi. When polio and Gavi amounts are removed, other MCH funding in FY 2021 ($703 million) was $47 million (-6%) below the FY 2011 level ($751 million). MCH funding has accounted for the third largest share of the U.S. global health budget over the decade and is provided through the GHP, ESF, AEECA, and DA accounts at USAID, as well as through the State Department and CDC (see Figure 4). Additional funding for Gavi was recently provided through emergency COVID-19 funding (see below).
  • Malaria. Global malaria funding, most of which is provided through the President’s Malaria Initiative, in FY 2021 was $179 million (22%) above the FY 2011 level ($800 million), with the largest increase occurring between FY 2016 and FY 2017 (see Figures 2 and 3) Funding for global malaria efforts has represented the fourth largest share of the U.S. global health budget and is provided through the GHP account at USAID, as well as through CDC, NIH, and DoD (see Figure 4).
  • Family Planning and Reproductive Health (FP/RH). Funding for international FP/RH in FY 2021 ($608 million) was $25 million (-4%) below the FY 2011 level ($633 million), representing the only global health program area that decreased over the period (see Figure 2). FP/RH funding, which has represented the fifth largest share of the global health budget, fluctuated slightly during the earlier part of the decade and has remained flat at $608 million in recent years (see Figures 3 and 4). Funding is provided through the GHP, ESF, and AEECA accounts at USAID, as well as through contributions to UNFPA provided through the State Department. From FY 2017- FY 2020, the Trump administration invoked the Kemp-Kasten amendment, withholding funding for UNFPA and reallocating it to USAID’s family planning, maternal, and reproductive health activities (see the KFF Kemp-Kasten explainer).
  • Global Health Security. Global health security funding in FY 2021 ($670 million) was $273 million (69%) above the FY 2011 level ($397 million), representing the largest percentage increase compared to all other program areas (see Figure 2). Despite these overall increases, there was some fluctuation over the decade (see Figure 3). Global health security has represented the sixth largest share of the U.S. global health budget, and that share has increased somewhat (from 4% in FY 2011 to 6% in FY 2021). Funding is provided through the GHP and ESF accounts at USAID, as well as through CDC and DoD. Much of the growth in global health security funding occurred in recent years in response to specific disease outbreaks, leading to more attention to pandemic preparedness and global health security (see later section on emergency supplemental funding for more details on funding for Ebola, Zika, and COVID-19).
  • Tuberculosis (TB). Global TB funding in FY 2021 ($332 million) was $94 million (39%) above the FY 2011 level ($238 million) (see Figure 2). Most of this growth has occurred in recent years (see Figure 3). Funding is provided through the GHP and ESF accounts at USAID, as well as through CDC.
  • Nutrition. Global nutrition funding in FY 2021 ($150 million) was $57 million (62%) above the FY 2011 level ($93 million), with much of the increase occurring in the earlier part of the decade and flattening in recent years (see Figures 2 and 3). Funding is provided through the GHP, ESF, and DA accounts at USAID.
  • Neglected Tropical Diseases (NTDs). Global NTD funding in FY 2021 ($103 million) was $26 million (34%) above the FY 2011 level ($77 million), with much of the increase occurring earlier in the decade and flattening in recent years (see Figures 2 and 3). Funding is provided through the GHP account at USAID.
  • Vulnerable Children. Funding for the vulnerable children program, the smallest global health program, in FY 2021 ($25 million) was $10 million (67%) above the FY 2011 level ($15 million), with funding growing steadily throughout the period (see Figures 2 and 3). Funding is provided through the GHP account at USAID.
  • Other. Funding for global health is also provided to the World Health Organization (WHO) and Pan American Health Organization (PAHO) (see more details for these organizations in the multilateral funding section below), as well as the Fogarty International Center (FIC) at NIH and an “Emergency Reserve Fund” at USAID, which was created in FY 2017.4  Together, this funding increased slightly when comparing FY 2021 to FY 2011 levels (see Figures 2 and 3).
U.S. Funding for Global Health by Program Area, FY 2011 - FY 2021
Share of U.S. Global Health Funding by Program Area, FY 2011 - FY 2021

U.S. global health funding is provided through two types of channels: bilateral (i.e. country-to-country) and multilateral (i.e. multi-country, pooled support directed through an international organization; see Box 2). While the vast majority of U.S. funding for global health is provided bilaterally (ranging from 79-85% of the global health budget from FY 2011 to FY 2021), both the amount and share of funding for multilateral organizations has increased at a faster rate. Bilateral funding increased by 8% over the period while multilateral funding increased by 48%. The multilateral share, which increased over the decade (and experienced fluctuations throughout the period), now represents about a fifth (20%) of U.S. global health funding in FY 2021, up from 15% in FY 2011 (see Figure 5 and 6).5 

Box 2: Multilateral health organizations supported by the U.S., including FY 2021 funding amounts though regular appropriations

  • Gavi, the Vaccine Alliance (Gavi): $290 million
  • Global Fund to Fight AIDS, Tuberculosis and Malaria (Global Fund): $1,560 million
  • Joint United Nations Programme on HIV/AIDS (UNAIDS): $45 million
  • Pan-American Health Organization (PAHO): $65.8 million*
  • TB Global Drug Facility (at Stop TB Partnership): $15 million
  • United Nations Children’s Fund (UNICEF): $139 million
  • United Nations Family Planning Agency (UNFPA): $32.5 million
  • World Health Organization (WHO): $122.7 million*

* Funding amounts for PAHO and WHO are not yet known and for comparison purposes, are assumed to remain at the FY 2020 level.

U.S. Funding for Global Health, Bilateral and Multilateral Share, FY 2011 - FY 2021
Multilateral U.S. Global Health Funding, FY 2011 - FY 2021

Funding for most multilateral organizations increased in FY 2021 compared to FY 2011 levels, with the exception of the TB Global Drug Facility, which remained flat, and UNFPA, which decreased overall and did not receive funding in some years due to the Kemp Kasten amendment (see Figure 7). 6   While Gavi increased by the greatest percentage amount (223%) compared to other multilateral organizations, the Global Fund increased by the largest dollar amount ($514 million compared to Gavi’s $200 million increase). The Global Fund has represented 67-75% of multilateral funding for global health each year over the past decade. Funding for the Global Fund, while rising overall, fluctuated over the past decade, in contrast to all other multilateral organizations, which either increased or remained essentially flat over the period, except for UNFPA (see Figure 8).

Percent Change in Funding Comparing FY 2021 to FY 2011, by Multilateral Organization
Multilateral U.S. Global Health Funding by Organization, FY 2011 - FY 2021

In addition to global health funding provided through regular appropriations, emergency funding, appropriated in response to outbreaks, has become a more prominent part of the budget. Since FY 2011, the U.S. has provided $11.8 billion in emergency supplemental funding (representing 9% of overall global health funding over the period) to address outbreaks, almost all of which (90%) has been provided in response to COVID-19 (see Figure 9). Global health funding through emergency appropriations over the past decade includes:

  • $909 million in FY 2015 to address Ebola.7 
  • $145.5 million in FY 2016 to address Zika.8 
  • $10.6 billion to address COVID-19 ($1.2 billion in FY 2020 and $9.4 billion in FY 2021).9  Of this, $4 billion was provided to COVAX, $250 million to PEPFAR, and $3.5 billion to the Global Fund.
U.S. Global Health Funding, including Emergency Supplemental Funding, FY 2011 - FY 2021

Looking Ahead

The U.S. government is the largest donor to global health in the world.10  As this analysis demonstrates, U.S. funding for global health has grown significantly over time, marking the start of major new programs. However, the vast majority of that growth occurred from FY 2001 to 2010, with the creation of PEPFAR. In the last decade, funding for most program areas within the global health budget has increased, but only quite modestly. In addition, the U.S. has provided a significant amount of emergency supplemental funding on top of regular appropriations for global health to respond to disease outbreaks in recent years. While the Biden administration has already taken steps to bolster U.S. global health engagement, largely in response to the COVID-19 pandemic, the forthcoming release of his first, full budget request for FY 2022 will provide an important window into the administration’s further priorities for global health.

Appendix

U.S. Annual Budget Process11 

The U.S. annual budget process starts when the President submits a detailed budget request to Congress for the upcoming fiscal year, which begins on October 1 and ends on September 30. Signaling the administration’s priorities, the request, which is developed through an interactive process between federal agencies and the President’s Office of Management and Budget (OMB), includes recommendations to Congress on funding levels for federal programs. The request is usually submitted by the first Monday in February, but sometimes the submission is delayed, particularly when a new administration takes office, as is the case today. In addition, when a new administration takes office, sometimes the President submits an initial, abbreviated budget, as was done this year (this was also done at the beginning of both the Obama and Trump administrations), and a fuller more detailed budget later. Once the President submits the detailed budget request to Congress, the House and Senate develop a budget plan, or a “budget resolution,” through their budget committees. After both the House and Senate pass these budget resolutions, a process that generally takes place in March or April, the bills go to the floor, where a conference between the House and Senate resolves any differences within the budget resolution and an agreement between the two houses is made. The budget resolution serves as a blueprint for the actual appropriations process, where House and Senate Appropriations committees set spending totals for federal agencies and programs. Once each appropriations committee sets these amounts and allocations, the bills are considered by the House and Senate, where a conference agreement, which resolves any differences between the two bills, is made. Once a conference bill is passed by both the House and Senate, it goes to the President and is signed into law.

Endnotes

  1. KFF analysis of OECD DAC CRS database, May 2021. ↩︎
  2. In FY 2013, sequestration occurred, resulting in cross the board cuts in funding to all global health program areas. ↩︎
  3. Represents U.S. regular appropriations only. ↩︎
  4. The Emergency Reserve Fund at USAID was created in the FY 2017 Omnibus bill to respond to contagious infectious disease outbreaks and would be made available if there is an “emerging health threat that poses severe threats to human health.” The only year the Emergency Reserve Fund received funding through regular appropriations was in FY 2017. ↩︎
  5. U.S. multilateral funding includes support to the Pan-American Health Organization (PAHO), Joint United Nations Programme on HIV/AIDS (UNAIDS), United Nations Children’s Fund (UNICEF), United Nations Family Planning Agency (UNFPA), World Health Organization (WHO), Gavi, the Vaccine Alliance, the Global Fund to Fight AIDS, Tuberculosis and Malaria, and the TB Global Drug Facility. ↩︎
  6. While Congress provided funding for UNFPA each year between FY 2011 and FY 2021, President Trump invoked the Kemp-Kasten amendment to withhold funding from the organization (see KFF explainer on UNFPA funding & Kemp-Kasten amendment). President Biden has directed the U.S. Secretary of State to take the necessary steps to resume funding to UNFPA. ↩︎
  7. KFF. The U.S. Response to Ebola: Status of the FY2015 Emergency Ebola Appropriation; December 2015. ↩︎
  8. KFF. The Status of Funding for Zika: The President’s Request, Congressional Proposals, & Final Funding; October 2016. ↩︎
  9. KFF. Global Funding Across U.S. COVID-19 Supplemental Funding Bills; March 2021. ↩︎
  10. KFF. Donor Funding For Health in Low-& Middle-Income Countries, 2002-2013. November 2015. https://modern.kff.org/global-health-policy/report/donor-funding-for-health-in-low-middle-income-countries-2002-2013/. ↩︎
  11. U.S. government, “Budget of the U.S. Government” webpage, October 2019. Accessed: https://www.usa.gov/budget. Congressional Research Service, “Introduction to the Federal Budget Process”, February 26, 2020. Center on Budget and Policy Priorities, “Policy Basics: Introduction to the Federal Budget Process” webpage, April 2020. Accessed: https://www.cbpp.org/research/introduction-to-the-federal-budget-process ↩︎
News Release

Ahead of Biden’s Budget Proposal, A New KFF Analysis Takes a Closer Look at Historical Trends in the Global Health Budget

Published: May 27, 2021

On May 28th, President Biden will release his first detailed budget proposal, covering the fiscal year starting in October 2021. As the largest global health donor in the world, the new budget proposal will provide a glimpse into what the Biden administration will be prioritizing for global health. In preparation for the budget release, KFF released a new brief looking at the historical trends in US funding for global health.

Since FY 2001, US global health funding provided through regular appropriations increased by almost $10 billion. However, most of the increase ($8.3 billion) occurred between FY 2001 – FY 2011, largely due to the creation of PEPFAR, the Global Fund, and the President’s Malaria Initiative. Since FY 2011, funding increases for global health have been more modest ($1.4 billion). In addition, while most areas (TB, malaria, etc.) increased over the last decade, funding for PEPFAR remained stagnant and family planning and reproductive health funding decreased.

Within the last decade, the US has also provided $11.8 billion in emergency supplemental funding in response to infectious diseases, with 90% of that funding coming within the last year as a result of the COVID-19 pandemic. While the Biden administration has already taken steps to bolster US global health engagement, largely in response to COVID-19, the release of his first full budget request for FY 2022 could provide an important window into the administration’s further priorities for global health.

Expanding Medicare to Adults at Age 60 Years—Medicare-for-More?

Author: Larry Levitt
Published: May 27, 2021

In this column for the JAMA Health Forum, Larry Levitt examines the implications of lowering Medicare’s age of eligibility, which is emerging as a potential pathway toward Medicare-for-all or a public option among single-payer advocates. He explores the implications for costs, industry, people and broader reform efforts.

A Closer Look at the Uninsured Marketplace Eligible Population Following the American Rescue Plan Act

Authors: Daniel McDermott and Cynthia Cox
Published: May 27, 2021

Issue Brief

The American Rescue Plan Act (ARPA) was passed by Congress and signed into law by President Biden in March 2021. The ARPA includes provisions that increase subsidies for Marketplace shoppers who were already eligible for financial assistance and removes the upper income cap on subsidy eligibility, eliminating what was known as the “subsidy cliff.” As a result, KFF estimated that roughly 3.7 million more Americans, more than a third of whom are uninsured, are newly eligible for financial assistance to buy their own coverage on the exchanges, and millions more are eligible for increased financial assistance.

As of April 30, nearly 1 million people had enrolled in a HealthCare.gov plan during the ongoing special enrollment period, which lasts through August 15. The Centers for Medicare and Medicaid Services (CMS) announced an outreach campaign to inform people about Marketplace enrollment opportunities and the enhanced financial assistance. For 2021 and 2022, CMS released over $80 million in grants to Navigators and related organizations that help consumers enroll in coverage and provide outreach and educational services. The Trump administration had made substantial cuts to ACA marketing activities and Navigator programs, which received just $10 million in grants in both 2018 and 2019.

In this analysis, we examine key demographic characteristics of the 10.9 million uninsured people who are eligible for Marketplace subsidies, including 6 million uninsured individuals eligible for tax credits that cover the full cost of a Marketplace plan. We exclude people who are eligible for Medicaid, Medicare, or affordable employer coverage, as well as those who are undocumented immigrants. We also exclude people who fall into the Medicaid coverage gap, since Marketplace coverage is generally unaffordable to people with incomes below poverty.

We find that relatively large shares of uninsured people eligible for significant assistance to buy Marketplace coverage are young adults without college educations, Hispanic, non-native English speakers, and working in the fields of entertainment, recreation, and construction. Most people eligible for free Marketplace coverage are concentrated in a handful of states (Texas, Florida, North Carolina, and Georgia). These findings can inform marketing, outreach, and enrollment assistance activities as the 2021 special enrollment period continues and consumers begin shopping for 2022 coverage later this year.

Findings

We estimate there are approximately 12.1 million1  uninsured potential Marketplace shoppers, of whom the vast majority (10.9 million) are eligible for subsidies under the ACA and ARPA to help lower the cost of coverage.

Nationally, certain groups are overrepresented among the uninsured who are eligible for Marketplace subsidies following the enactment of the ARPA. We find that 30% of uninsured people eligible for Marketplace subsidies are Hispanic (compared to 20% of non-elderly people in the U.S.), 59% have a high school diploma or less (compared to 36% of non-elderly adults in the U.S.), and 42% are young adults ages 19 to 34 (compared to 25% of non-elderly people in the U.S.). In total:

  • 10.9 million uninsured people could purchase Marketplace coverage for a reduced premium. Although subsidies for this group may not cover the full premium, they can significantly lower the premium and/or out-of-pocket liability. Even so, some people in this group may still find Marketplace coverage unaffordable or unattractive due to high deductibles.
  • At least 6.0 million uninsured people could get a free Marketplace plan (with a $0 premium payment, after accounting for subsidies). As explained in our earlier brief and in some detail below, people in this group would clearly benefit from getting Marketplace coverage rather than continuing to go without coverage.
  • Of uninsured people who are eligible for $0 premium plans, 1.3 million have incomes below 150% of poverty, which makes them eligible for a free benchmark silver plan and substantial cost-sharing reductions (CSRs) that would make their plan more similar to platinum level coverage (which an average deductible of $177 in 2021). Some people with incomes just above 150% of poverty may also qualify for zero-premium silver plans depending on the gap in price between the benchmark (second-lowest cost) silver plan and the lowest-cost silver plan in their area.
  • In addition, under the ARPA, any person who qualifies to purchase a Marketplace plan and receives unemployment compensation in 2021 is similarly eligible for a benchmark silver plan with a $0 premium and cost-sharing assistance. Therefore, our estimate of the number of uninsured people eligible for zero-premium plans is likely an undercount.

Subsidy ELigible uninsured: key characteristics

We estimate that 10.9 million non-elderly uninsured people in the U.S. are eligible for some level of subsidy to help purchase a Marketplace plan. Relative to the general non-elderly population in the U.S., uninsured people eligible for Marketplace subsidies are more likely to be:

  • High school educated: 59% of subsidy eligible adults have a high school education or less, compared to 36% of non-elderly adults in the U.S.
  • Young Adults: 42% of subsidy eligible uninsured people are ages 19-34, compared to 25% of the non-elderly U.S. population.
  • Hispanic: 30% of subsidy eligible uninsured people are Hispanic, compared to 20% of the non-elderly U.S. population.
  • Living in rural areas: 16% of subsidy eligible uninsured people live in non-metro areas, compared to 13% of the non-elderly U.S. population.
  • Lacking internet access: 11% of subsidy eligible uninsured people do not have internet access at home, compared to 6% of the non-elderly U.S. population.
Table 1: Characteristics of the Uninsured Marketplace Eligible Population, by Subsidy Eligibility in 2021 
Uninsured Eligible Marketplace SubsidiesUninsured Eligible for Free Plan*Uninsured Eligible for Free Platinum-Like Silver PlanNationwide Non-Elderly Total (%)
Total10,933,6006,034,3001,297,600
Hispanic3,344,600 (30%)1,937,800 (32%)525,800 (41%)20%
Young Adults (Age 19-34)4,618,200 (42%)2,536,300 (42%)645,900 (49%)25%
High School Education or Less6,507,200 (59%)3,736,300 (62%)846,100 (65%)36%
Non-Metro Resident1,755,700 (16%)1,073,300 (18%)188,200 (15%)13%
Work in Arts / Entertainment / Construction3,326,100 (30%)1,872,900 (32%)425,000 (33%)22%
No Internet Access at Home1,223,600 (11%)788,300 (13%)200,100 (15%)6%
Language Other Than English Spoken at Home3,670,570 (33%)2,119,000 (35%)602,300 (46%)23%
Income
< 200% FPL**4,589,700 (42%)4,307,600 (71%)1,297,600 (100%)29%
200% – 400% FPL5,055,100 (46%)1,681,200 (28%)-***29%
> 400% FPL1,244,346 (11%)45,700 (1%)-***41%
NOTES: *The Uninsured Eligible for Free Plan category includes people who would also qualify for a Free Platinum-Like Silver Plan. **FPL stands for Federal Poverty Level ($12,760 for individual in 2020). ***Estimates do not account for unemployment insurance received in 2021, which would qualify Marketplace eligible individuals for free benchmark silver plans. Uninsured Marketplace eligible population does not include people with incomes below poverty who fall into the Medicaid coverage gap. People age 65 and over are excluded from this analysis. Estimates may not add to 100% due to rounding.SOURCE: KFF analysis of 2019 American Community Survey.  

uninsured eligible for Zero premium plans: key characteristics

We estimate that at least 6.0 million uninsured people in the U.S. could get a bronze or silver plan on the ACA Marketplace with a $0 premium contribution, after accounting for their subsidy. Compared to the total subsidy-eligible uninsured population and the general U.S. population, uninsured people eligible for free Marketplace plans are more likely to be:

  • High school educated: 62% of free bronze eligible uninsured adults and 65% of the free silver eligible uninsured people have a high school education or less, compared to 59% of all subsidy-eligible uninsured people and 36% of all non-elderly adults in the U.S.
  • Hispanic: 32% of free bronze eligible uninsured people and 41% of the free silver eligible uninsured people are Hispanic, compared to 30% of all subsidy eligible uninsured people and 20% of the total non-elderly population.
  • Lacking internet access: 13% of the free bronze eligible uninsured people and 15% of free silver eligible uninsured people do not have internet access at home, compared to 11% of all subsidy eligible uninsured people and 6% of the total non-elderly population.
  • Non-English speaker at home: 35% of free bronze eligible uninsured people and 46% of free silver eligible uninsured people speak a language other than English at home, compared to 23% of the U.S. non-elderly population.

In addition to the 1.3 million uninsured people who qualify for zero-premium benchmark silver plans because their income is less than 150% of poverty, there are likely many more uninsured people who qualify for free silver plans because the ARPA ensures that any enrollee receiving unemployment insurance at some point in 2021 is eligible for zero-premium platinum-like coverage. As noted above, there are also some uninsured people with incomes just above 150% of poverty who would have to pay a small premium for a benchmark silver plan, but may receive enough in subsidies to cover the full cost of the lowest-cost silver plan in their area. Further, there are many counties in the U.S. where the lowest-cost gold plan is cheaper than the lowest-cost silver plan. Lower-income Marketplace shoppers in these areas could potentially purchase a free gold plan with lower cost-sharing and more financial protection than plans in lower metal levels.

As we have explained in earlier analyses, many people who are eligible for a free bronze plan are also eligible for a low-cost silver plan with a substantially lower deductible due to CSRs. The average annual deductible for people with incomes between 150-200% of poverty who choose to enroll in a silver plan with a CSR is $800. Many people in this group, therefore, could be better off buying a silver plan with a small premium than a zero-premium bronze plan.

Even so, all of the uninsured eligible for a free bronze or a free silver plan would be better off taking advantage of that $0 premium coverage instead of remaining uninsured. People in this group may need help understanding the tradeoff between silver and bronze coverage (i.e. affordability of the premium and deductible), as well as help understanding the benefits that even a high-deductible bronze plan offers over being uninsured (i.e. free preventive care, limited out-of-pocket liability, lower negotiated payment rates to providers, and often at least some covered benefits before having to meet the deductible).

Almost half of the uninsured who could get a free bronze plan live in Texas, Florida, North Carolina, or (Figure 1). A detailed table in the appendix provides demographic characteristics of people eligible for free Marketplace coverage in each state.

Discussion

The findings of this analysis can inform government agencies, insurers, or Navigators tasked with outreach and marketing responsibilities, helping them to target specific groups that are more likely to be uninsured but eligible for significant financial assistance. The Department of Health and Human Services has announced concerted efforts to reach historically uninsured communities during the ongoing special enrollment period. Relatively large shares of uninsured people eligible for significant assistance to buy Marketplace coverage are young adults without college educations, Hispanic, non-native English speakers, and working in the fields of entertainment, recreation, and construction. Most people eligible for free bronze or silver coverage are concentrated in a handful of states (including Texas, Florida, Georgia, and North Carolina).

In addition to the findings highlighted above, the appendix of this brief provides detailed demographics about the uninsured population eligible for fully-subsidized coverage in each state.

Methodology

2021 Premiums come from KFF analysis of premium data from Healthcare.gov and state rating filings. Data on population, income, and eligibility for subsidies come from KFF analysis of the Census Bureau’s 2019 American Community Survey (ACS). The ACS includes a 1% sample of the US population and allows for precise state-level estimates. The ACS asks respondents about their health insurance coverage at the time of the survey. Respondents may report having more than one type of coverage; however, individuals are sorted into only one category of insurance coverage. The 2019 ACS collected income and coverage data from respondents before the pandemic, but there are various reasons that the data are still a reasonable basis for current uninsured eligibility analyses. First, the national uninsured rate has stabilized in recent years and expectations are that it has remained relatively flat thus far during the pandemic. Second, at least prior to enhanced subsidies outlined in the ARPA, the number of uninsured people eligible and ineligible for subsidies have also stayed generally consistent. Under the previous ACA subsidy structure, KFF estimated the number of uninsured people eligible for free bronze plans had fluctuated between 4.0 and 4.7 million the past three years.

This analysis does not include individuals who are over the age of 65, who are eligible for Medicaid in 2021, who have incomes below poverty, or are undocumented immigrants. We exclude individuals who are uninsured but have an affordable offer of employer-based coverage. Under the current ACA structure, workers and their family members are ineligible for tax credits if any worker in the household is offered “affordable” health insurance through their employer. Employer coverage is considered affordable if the worker’s premium contribution for self-only amounts to less than 9.83% of household income.

Unsubsidized premiums used in this analysis are the full price of plans, rather than specifically the portion that covers essential health benefits (EHB). Since premium tax credits can only be used to cover the EHB portion of premiums, some of the individuals denoted as having access to a “free” bronze plan might actually have to pay a very small premium for non-essential health benefits if they enrolled in a bronze plan with added benefits. The ACA does not permit federal subsidies to pay for abortion coverage and requires plans to collect no less than $1.00 per month for this coverage. In CA, IL, NY, ME, OR, and WA, state law requires that that all state regulated plans include abortion coverage. Policyholders who live in these states must pay the abortion surcharge even though they may qualify for subsidies that provide the full cost of premiums if they select a bronze plan. Providence Health Plans in OR and WA have a religious exemption allowing them to exclude abortion coverage.

Appendix

Appendix Table 1:  Characteristics of the Uninsured Population Eligible for Zero Premium Bronze Marketplace Plan, by State, 2021
StateTotalHispanicYoung Adults(Age 19-34)High School Education or LessNon-Metro
US Total6,034,3001,937,800 (32%)2,536,300 (42%)3,736,300 (62%)1,073,300 (18%)
Alabama158,30012,200 (8%)71,900 (45%)103,900 (66%)41,500 (26%)
Alaska20,6004,700 (23%)12,500 (61%)11,100 (54%)4,000 (19%)
Arizona108,10049,100 (45%)39,400 (36%)68,500 (63%)9,900 (9%)
Arkansas32,1001,900 (6%)11,400 (35%)19,500 (61%)12,400 (39%)
California323,100196,500 (61%)134,100 (42%)192,600 (60%)12,000 (4%)
Colorado38,20012,800 (33%)16,400 (43%)19,300 (50%)6,000 (16%)
Connecticut35,80010,900 (30%)13,800 (38%)20,000 (56%)1,300 (4%)
Delaware11,300900 (8%)4,900 (43%)7,000 (62%)
Florida798,200277,900 (35%)332,600 (42%)477,700 (60%)37,900 (5%)
Georgia357,00056,900 (16%)154,400 (43%)227,900 (64%)79,800 (22%)
Hawaii6,100700 (12%)2,100 (34%)1,500 (25%)700 (12%)
Idaho40,4008,800 (22%)16,000 (40%)24,100 (60%)14,100 (35%)
Illinois95,50020,400 (21%)36,900 (39%)47,200 (49%)20,900 (22%)
Indiana70,2007,800 (11%)26,900 (38%)43,300 (62%)16,300 (23%)
Iowa34,4002,500 (7%)14,500 (42%)20,600 (60%)15,200 (44%)
Kansas69,10015,000 (22%)27,500 (40%)41,200 (60%)25,600 (37%)
Kentucky56,9005,800 (10%)22,000 (39%)34,300 (60%)23,300 (41%)
Louisiana70,8008,800 (12%)25,100 (35%)47,300 (67%)10,400 (15%)
Maine16,600700 (4%)5,300 (32%)11,200 (67%)9,300 (56%)
Maryland43,3008,400 (19%)21,100 (49%)23,300 (54%)900 (2%)
Massachusetts15,6002,200 (14%)8,100 (52%)7,800 (50%)600 (4%)
Michigan86,6008,100 (9%)30,700 (35%)51,200 (59%)27,200 (31%)
Minnesota4,500500 (12%)1,000 (22%)2,700 (60%)200 (5%)
Mississippi79,8003,900 (5%)33,500 (42%)51,300 (64%)45,200 (57%)
Missouri104,2007,600 (7%)43,300 (42%)68,200 (65%)32,300 (31%)
Montana16,400700 (4%)6,100 (37%)9,100 (56%)9,800 (60%)
Nebraska37,2006,600 (18%)14,700 (39%)17,500 (47%)12,800 (35%)
Nevada44,20020,000 (45%)16,200 (37%)25,600 (58%)4,400 (10%)
New Hampshire16,9003,400 (20%)5,900 (35%)10,900 (65%)6,600 (39%)
New Jersey78,50033,500 (43%)34,700 (44%)48,100 (61%)00 (%)
New Mexico32,60014,900 (46%)11,500 (35%)15,900 (49%)15,700 (48%)
New York68,80023,300 (34%)31,300 (46%)37,600 (55%)4,100 (6%)
North Carolina368,60066,300 (18%)159,100 (43%)222,000 (60%)95,300 (26%)
North Dakota12,000200 (2%)3,200 (27%)7,600 (64%)7,500 (62%)
Ohio126,8008,300 (7%)48,600 (38%)82,700 (65%)31,900 (25%)
Oklahoma123,40019,700 (16%)48,000 (39%)78,800 (64%)61,000 (49%)
Oregon50,10012,200 (24%)21,900 (44%)27,300 (55%)12,400 (25%)
Pennsylvania136,60014,600 (11%)54,600 (40%)81,900 (60%)22,500 (16%)
Rhode Island5,0001,300 (26%)2,300 (47%)2,800 (57%)
South Carolina172,70015,400 (9%)70,900 (41%)115,300 (67%)18,900 (11%)
South Dakota31,2002,300 (7%)14,300 (46%)19,600 (63%)15,100 (48%)
Tennessee210,10029,500 (14%)85,000 (40%)142,700 (68%)48,000 (23%)
Texas1,443,800855,200 (59%)644,600 (45%)946,300 (66%)162,200 (11%)
Utah63,90014,200 (22%)26,700 (42%)33,800 (53%)12,500 (20%)
Vermont5,500400 (7%)2,400 (44%)3,800 (69%)4,400 (80%)
Virginia117,40026,400 (22%)44,600 (38%)70,400 (60%)20,100 (17%)
Washington71,30017,900 (25%)29,800 (42%)39,200 (55%)7,100 (10%)
West Virginia9,600400 (4%)2,200 (23%)5,800 (61%)2,700 (29%)
Wisconsin84,40020,100 (24%)39,300 (47%)52,800 (63%)31,000 (37%)
Wyoming30,7005,900 (19%)12,900 (42%)16,000 (52%)20,200 (66%)
NOTES: * Education category is among adults age 25 to 64. Industry category is among working adults age 18 to 64. Counts are rounded to the nearest 100. This analysis does not include individuals who are over the age of 65, who are eligible for Medicaid, who have incomes below poverty, or are undocumented immigrants. DC is not included due to an insufficient sample size in the ACS. Cells with less than 1,000 observations are suppressed.SOURCE: 2021 Premiums come from KFF analysis of premium data from Healthcare.gov and review of state rating filings. Data on population and eligibility for subsidies come from KFF analysis of the American Community Survey (ACS) for 2019.

Endnotes

  1. This estimate includes people who are subsidy eligible and people who are ineligible for subsidies because their premiums are too low relative to their incomes. It excludes people who are eligible for Medicare, Medicaid, or affordable employer coverage, as well as those who are undocumented immigrants. People who fall into the Medicaid coverage gap are also excluded because Marketplace coverage is generally unaffordable for people with incomes below poverty. If we include people with affordable employer offers of coverage, there are approximately 15 million uninsured people who are eligible to purchase ACA Marketplace plans. ↩︎