Rapid Home Tests for COVID-19: Issues with Availability and Access in the U.S.

Published: Nov 4, 2021

Executive Summary

While rapid home COVID-19 tests have been identified as an important component of controlling the spread of SARS-CoV-2, the virus that causes COVID-19, there have been ongoing supply challenges in the U.S. Challenges in accessing rapid home tests became more acute as the Delta variant took hold, vaccination rates stagnated, and cases, hospitalizations, and deaths surged. In addition, some workplaces began reopening, millions of school age children returned to in-person school and colleges and universities began the fall semester. Home test supply and access challenges in the U.S. contrast with the experience in several peer countries which have made rapid home tests widely available and at little or no cost. The Biden administration has taken recent steps to address these challenges, including a new announcement that it would work to identify manufacturers of high quality tests to encourage them to bring them to the U.S. market and to streamline the regulatory review pathway for authorization of over-the-counter at-home tests, though it is unclear if or how quickly these measures will fully resolve the issues.

In this brief, we examine the various interrelated factors that have contributed to rapid home test scarcity in the U.S. The five factors we identify include:

  • The regulatory framework: The FDA regulatory framework and process are central to the availability of COVID-19 testing, including for home testing. However, some argued the framework for evaluating rapid home tests was initially too stringent, creating challenges for manufacturers seeking authorization and hampering test availability.  While the FDA took steps to modify the process, some suggested that the regulatory environment was still too strict. The new announcement that the FDA aims to further streamline the process is likely to address some of these issues.
  • Supply chain and the unpredictability of demand: The COVID-19 pandemic has led to supply chain disruptions worldwide, including for tests and their components, negatively impacting test supply. This, coupled with the unpredictability of the pandemic, have made it difficult for manufacturers to gauge demand and at times limited their willingness to scale up production due to perceived business risk, again impacting test availability. Recent steps taken by the administration are designed to increase supply.
  • Federal investment: While this may be beginning to shift, the lack of up-front federal investment in testing, including pre-purchasing of tests, is another factor that appears to have impacted testing availability and affordability, and contrasts with the federal government’s approach to vaccines.
  • Federal messaging and guidance: Evolving federal messaging and guidance related to the role of testing over the course of the pandemic and limited messaging about home testing may have led to confusion about its importance and impacted public understanding of home testing specifically.
  • Cost and coverage: While COVID-19 tests are generally covered by insurance, as required by emergency COVID-19 legislation passed by Congress, and are also available free of charge at many locations in the U.S., this is not the case for over-the-counter rapid home tests. Instead, consumers must pay out of pocket for these tests which can be costly, limiting access and potentially contributing to existing pandemic disparities. Recently, the federal government accelerated purchasing of rapid tests for use in certain community-based settings and negotiating with retailers to lower store prices, albeit for a time-limited period.

Taken together, we identify a number of barriers that have contributed to the scarcity of rapid home COVID-19 tests in the U.S. Recent actions taken by the Biden administration, including steps expected to result in an increase in home test production and to further streamline the authorization process, may alleviate some of these barriers, but others may persist.

Issue Brief

Introduction

While diagnostic testing is an important tool for helping to reduce the spread of COVID-19, there have been challenges in scaling up testing in the U.S. throughout the pandemic, and these have been particularly acute in the case of rapid home tests. Rapid home tests, some of which can provide results in as little as 15 minutes, have been identified  as an important public health intervention for controlling COVID-19 transmission because of their ability to be used at home by an individual, provide results quickly, and to identify infection when someone is “likely to be most contagious.” Challenges in accessing rapid home tests became more acute as the Delta variant took hold, vaccination rates stagnated, and cases, hospitalizations, and deaths surged. In addition, some workplaces began reopening, millions of school age children returned to in-person school, and colleges and universities began the fall semester. These challenges contrast with the experiences of several other peer countries which have made rapid home tests widely available and at little or no cost. The UK government, for example, provides up to seven tests per day to those who cannot get tests from work or school and recommends each individual screen themselves twice weekly. Providing up to 7 tests per person allow one individual to collect tests for a whole household.  Germany, until recently, made rapid antigen tests freely available as well (and tests can still be purchased for a few dollars in grocery stores).

President Biden announced early support for rapid tests. The Biden campaign said that if elected it would “Invest in next-generation testing, including at home tests and instant tests, so we can scale up our testing capacity by orders of magnitude.”  The White House National Strategy for COVID-19, released on January 22, 2021, underscored the importance of rapid testing particularly to help “Safely reopen schools, businesses, and travel, while protecting workers” and funding was awarded in February to increase production of at-home tests. But ongoing supply shortages, particularly in the context of Delta, prompted more recent actions. On September 9, the President released a COVID-19 action plan that included, among other elements, the intent to use the Defense Production Act to increase the production of rapid tests; an investment of $2 billion to purchase 280 million rapid point-of-care and OTC at-home COVID-19 tests to be made available in a variety of community settings and long-term care facilities; and an agreement with several top retailers to sell rapid home tests at cost for a three month period. An additional $1 billion investment was announced on October 6 to further mobilize testing production, as well as agreements from some manufacturers to increase production. As a result, the administration expects to double rapid test capacity by the end of the year, from 100 million tests per month to 200 million, rising to 300 million by February 2022.  As part of this effort, in late October, the administration announced additional measures, including a new program which aims to identify manufacturers of high quality tests to encourage them to bring them to the U.S. market, as well as a streamlining of the FDA regulatory pathway. It is not yet clear, however, if these recent actions will fully resolve rapid home test supply and access issues, particularly if there is another surge in cases at some point.

In this brief, we examine the various interrelated factors that have contributed to rapid home test scarcity in the U.S.

Background

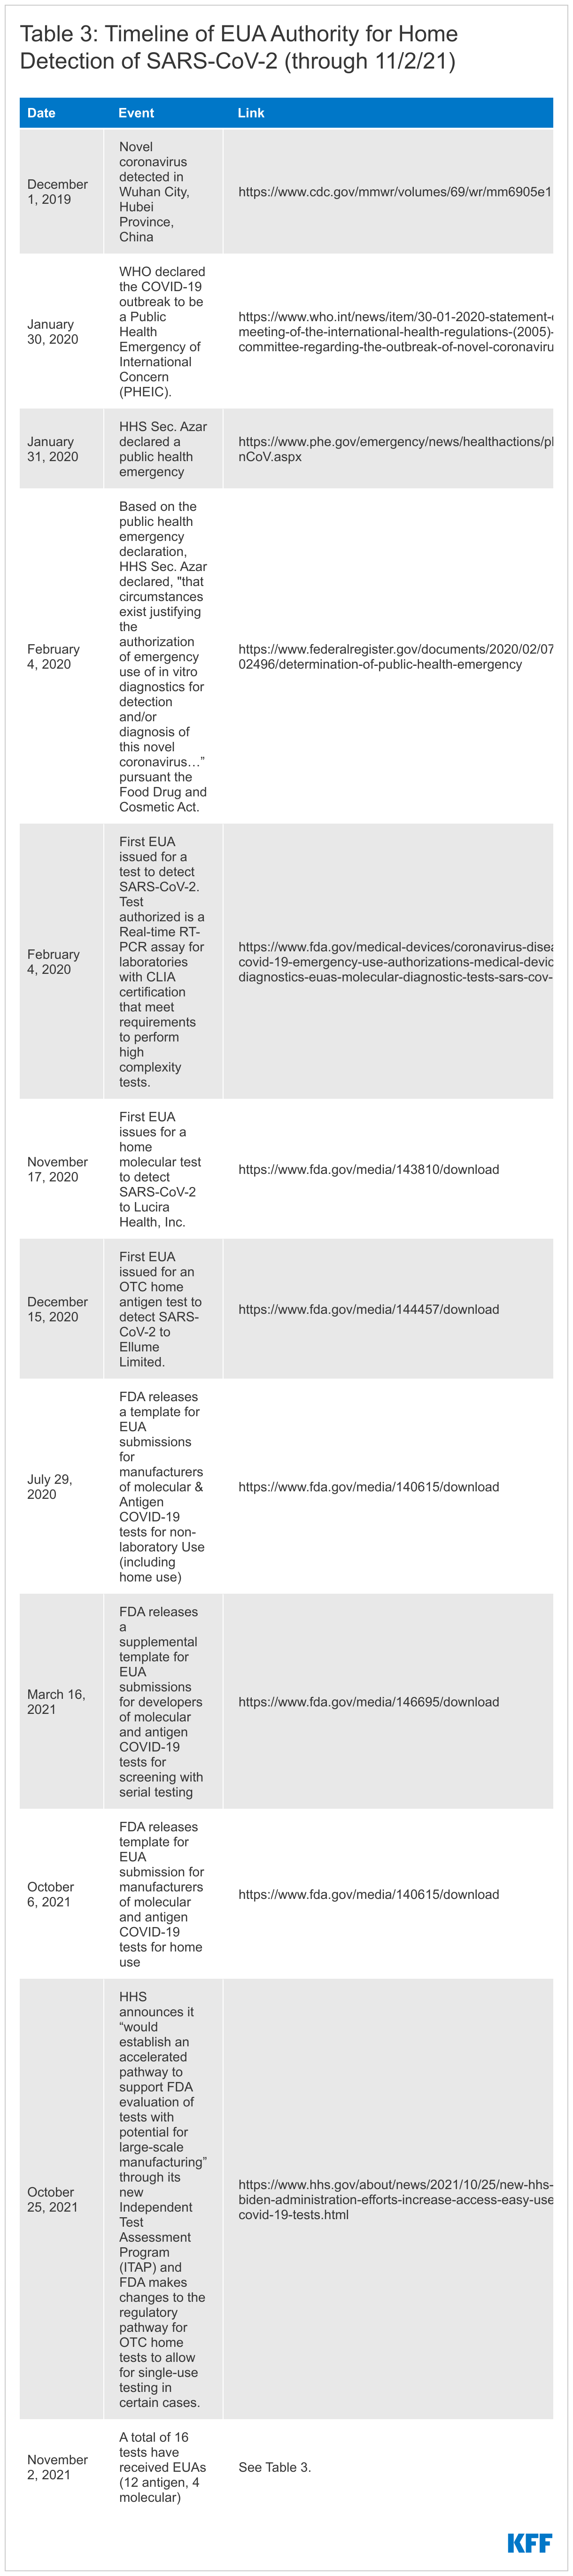
The declaration of a public health emergency due to COVID-19, first on January 20, 2020 and renewed every three months since (six times as of October 11, 2021), paved the way for the Food and Drug Administration (FDA) to exercise its expedited emergency use authorization (EUA) process for medical devices, including COVID-19 diagnostics.

To date, the FDA has authorized 16 home tests (several receiving revised EUAs over time) to 11 companies (see Table1). In several cases, one manufacturer has received multiple EUAs for essentially the same product but has different indications in terms of prescription vs. over-the-counter use or with revisions to labeling. Of the 16 tests with EUAs, 12 are OTC while four require a prescription.

Table 1: Diagnostics with EUAs for at home detection of SARS-cov-2 (as of 11/2/2021)

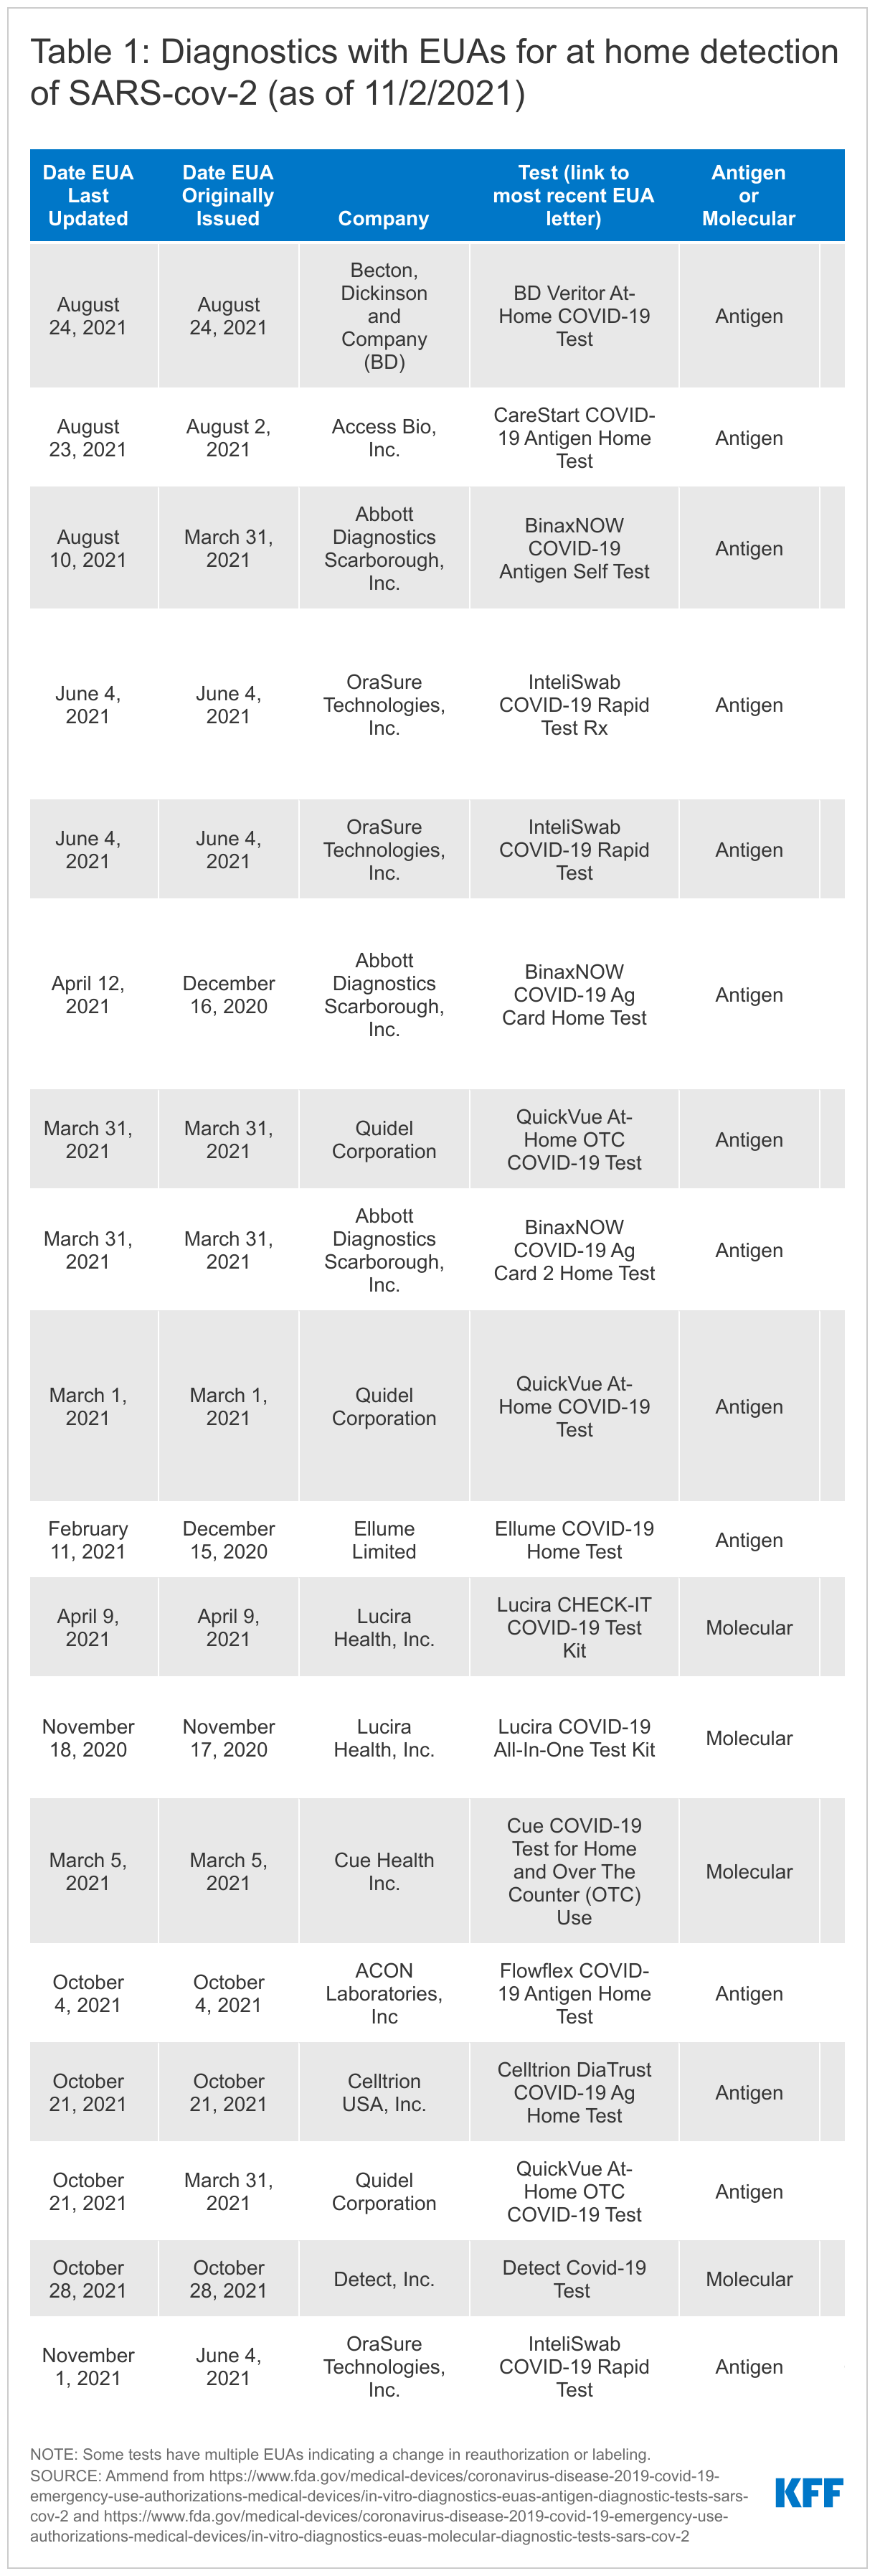
The 16 authorized home diagnostics include two types of tests: antigen tests (12 of the 16) and molecular tests (4 of the 16). Antigen tests detect specific viral antigens indicative of SARS-CoV-2, the virus that causes COVID-19. Molecular tests, including polymerase chain reaction (PCR) tests, detect the virus' genetic material (see Table 2). Antigen tests tend to be highly specific (the ability to accurately diagnose negative cases) but are typically less sensitive (the ability to accurately diagnose positive cases) compared with molecular tests. However, antigen tests demonstrate “comparable performance to” molecular tests in “symptomatic persons and/or if culturable virus present, when the person is presumed to be infectious.” They have advantages as well; they have a more simple design and are less expensive than molecular tests, potentially reducing both manufacturing and access barriers, and are available at the point-of-care, including in the home.  Of the 12 authorized antigen tests, 9 appear to have been marketed directly to consumers, while none of the molecular tests have.

Table 2. Differences in Home COVID-19 Testing Options
Test Type
Antigen – Antigen tests detect specific viral antigens indicative of SARS-CoV-2, the infection that causes COVID-19. Antigen tests tend to be highly specific but are typically less sensitive than molecular tests.
Molecular or Nucleic acid amplification tests (NAAT) - Detects the virus' genetic material (RNA), highly sensitive and highly specific. Polymerase chain reaction (RT-PCR or PCR) is one type of NAAT.
Prescription or Over-the-counter
Prescription - Some home tests with an EUA require a prescription from a medical provider. In certain cases, tests can be prescribed and ordered online (e.g. http://www.emed.com)
Over-the-counter (OTC) - Some tests have been authorized for OTC use, meaning they can be purchased in a store or online without a prescription.
Collection, Results, and Reporting
Home - The test is conducted at home and the results are returned to the user within a short window, often 15 minutes. The individual is responsible for reporting results to a public health authority/provider or an app is used during the home test process and the app/manufacturer reports results to the appropriate public health authority.
Self-collection - The user collects a sample and places it into a home collection kit which is the sent to a lab for results interpretation. The lab reports results to appropriate public health authorities.

The first EUA for a COVID-19 diagnostic test, a laboratory-based PCR, was issued on February 4, 2020. Nine months later, on November 17, 2020, the first EUA for a home COVID-19 test, in this case a molecular test, was issued and the first EUA for a home antigen test was issued December 15, 2020. (See Table 3 for a more detailed timeline of authorization events).

Table 3: Timeline of EUA Authority for Home Detection of SARS-CoV-2 (through 11/2/21)

Factors impacting availability of home COVID-19 tests

There are several interrelated factors that impact the availability of rapid home COVID-19 tests. These range from the regulatory environment to the supply chain to federal investment and messaging to affordability. Each is explored below.

The Regulatory Framework

The FDA regulatory framework and process are central to the availability of COVID-19 testing, be that in the home, community, clinic, or laboratory. All tests for COVID-19, including home tests, must go through regulatory review. Recognizing the importance of making safe and effective COVID-19 tests available and to facilitate and streamline the EUA process, the FDA provides manufactures with application templates. Though manufacturers are not required to use these templates, they can expedite the process and they provide agency recommendations for test performance and other elements.

There have been several templates and updates released since the beginning of the pandemic, targeting different types of tests, settings, and strategies. The first template was released in January 2020 for laboratory-based tests, with a template for non-laboratory-based tests, including for home use, coming in July 2020, and one for screening with serial testing (e.g. testing multiple times in a short window to improve chances of detecting infection) in March 2021. Most recently, the first template specifically for home tests was released in early October and then revised at the end of the month in 2021. (See Table 2 for a more detailed timeline.)

The recommendations for test performance continue to evolve over time. Earlier templates for use for rapid home tests set a high bar for efficacy, with FDA generally recommending efficacy quite similar to an “authorized high sensitivity molecular test.” Over time, FDA has changed its recommended benchmarks or created new pathways (e.g. for serial testing for use with asymptomatic individuals) and these changes have coincided with increased home test approval.

Despite these changes in the regulatory framework, however, some have argued that the comparison of antigen test performance to PCR test performance still sets the benchmark too high, making it overly difficult for developers to meet. One rationale behind this critique is that the focus on antigen test efficacy should be on its ability to detect infectious individuals to quickly interrupt onward transmission. Others disagree and suggest that while antigen tests perform well at detecting infectious individuals, they should not be used for assessing infectiousness on their own. CDC has found that Abbott’s antigen, “BinaxNow [test] performs better at identifying rRT-PCR–positive specimens with lower Ct (suggestive of higher viral loads) and positive viral cultures” but it warns “these factors are not precise proxies for infectiousness.”

Indeed, the U.S. recommendations are higher compared to standards in some peer countries, such as  the UK. To the extent that FDA regulatory requirements are a barrier for companies to submit requests for EUAs, fewer tests with authorization could lead to decreased competition in the marketplace, potentially impacting both cost and availability. On the other hand, whether a lower standard would negatively impact test quality, and by association the ability to control the pandemic, is unknown.

While the FDA has not suggested it will lower the recommended threshold for tests, on October 25, 2021, HHS announced that the NIH “would establish an accelerated pathway to support FDA evaluation of tests with potential for large-scale manufacturing” through its new Independent Test Assessment Program (ITAP), an extension of its Rapid Acceleration of Diagnostics (RADx) initiative. HHS states the program, which will be a collaboration of NIH, FDA, and CDC and other HHS experts will “identify manufacturers of high quality tests and encourage them to bring those tests to the U.S. market, increasing options for people and overall supply and potentially lowering costs.” Companies will receive support to “help ensure they are providing the best submissions possible for FDA’s regulatory review” and scalable OTC tests will be prioritized. In addition, FDA made changes to the regulatory pathway for OTC home tests currently authorized only for serial testing by revising recommendations to allow for single-use testing for symptomatic individuals. This reduces the amount of data developers would need to submit and allows them to sell certain tests currently sold as two-packs as singles, potentially leading to more individual tests being available for sale at a lower price.

Finally, just because a test has an EUA does not mean that it will circulate widely in the consumer market, as we have seen with some of the antigen and all of the molecular tests with EUAs for home use, suggesting that regulatory issues alone are not the only factors in test availability.

Supply Chain and the Unpredictability of Demand

The COVID-19 pandemic has led to supply chain disruptions across the world, and this has, in some cases, included the raw materials needed to manufacture COVID-19 diagnostics. Certainly that both the Trump and Biden Administrations have leveraged the Defense Production Act (DPA) to support testing, including Biden’s use of the DPA for home tests, and address other supply shortages, such as for personal protective equipment, is suggestive of challenges in the production and availability of these essential goods.

Additionally, a review of testing manufacturer Securities and Exchange Commission (SEC) filings reveals concerns about supply chain with respect to raw materials and diagnostic components:

“As a result of the COVID-19 pandemic, we have seen delays in receipts for certain raw materials and components for our products. Such delays can result in disruption to our business operations….We cannot currently predict the frequency, duration or scope of these government actions and any supply disruptions, and the availability of various products is dependent on our suppliers, their location and the extent to which they are impacted by the COVID-19 pandemic, among other factors. …Our inventory levels may fluctuate due to supply chain variability in conjunction with larger and more frequent customer orders.” - Quidel Q2 2021 10-Q SEC filing

 “Due to the significant uncertainty that exists relative to the duration and overall impact of the COVID-19 pandemic, our future operating performance, particularly in the short-term, may be subject to volatility. In this regard, we continue to see challenges posed by the pandemic to global transportation channels and other aspects of our supply chain, including the cost and availability of raw materials. As noted above, the pandemic continues to impact demand for certain of our products. The U.S. and other governments may enact or use laws and regulations, such as the Defense Production Act or export restrictions, to ensure availability of needed COVID-19 testing and vaccination delivery devices. Any such action may impact our global supply chain network.” - Becton, Dickinson and Company (BD) Q2 2021 10-Q SEC filing

Further, as manufacturers began securing EUAs for their at-home diagnostics, the pandemic appeared to be shifting, at least domestically. Vaccines were becoming more widely available, soon places of business and entertainment would start opening up, and the Delta variant had not yet taken hold in the United States. However, the landscape quickly reversed as vaccination rates stagnated and the more infectious Delta variant become the dominant strain in the U.S., resulting in increased cases, hospitalizations, and deaths. Investor calls and SEC filings by manufactures regarding testing overall, as well as home testing specifically, discussed this uncertainty, noting how an inability to predict the arc of the pandemic made assessing future testing demand difficult.

“Our financial performance and results of operations will depend on future developments and other factors that are highly uncertain, continuously evolving and cannot be predicted, including the duration of the COVID-19 outbreak, the severity and continuation of outbreak surges, actions to contain the spread of the virus such as mask wearing, social distancing and vaccination efforts globally, and the impact of these and other factors on testing demand.” – Quidel Q2 2021 10-Q SEC filing

“The real… factor here becomes COVID testing...that’s really the question here. How will testing play itself out in the second half here whether its variants, whether its vaccination rates, etc so that’s just something we are paying attention to…that’s why our guidance rage was pretty wide, to really account for that.” – Abbott Q2 2021 earning call

Indeed, Abbott’s decision to pull back on COVID-19 test production leading into the summer has been widely publicized and SEC filings indicate that this was related, at least in part, to a belief that the course of the pandemic had shifted and there was a reduced need for tests.

“On May 27, 2021, Abbott management approved a restructuring plan related to its Diagnostic Products segment to align its manufacturing network for COVID-19 diagnostic tests with changes in projected testing demand driven by several factors, including significant reductions in cases in the U.S. and other major developed countries, the accelerated rollout of COVID-19 vaccines globally and the U.S. health authority’s updated guidance on testing for fully vaccinated individuals.” - Abbott  Q2 2021 10-Q SEC filing

As a result, by the time the demand for rapid home tests began to increase, due to rising cases, hospitalizations and deaths, re-opening workplaces, and the return to in-person schooling for millions of elementary school students, the supply was not there. The new federal ITAP effort is designed to help increase supply by seeking additional manufacturers to bring tests to the U.S, market and could help to address some of these barriers.

Federal Investment

The lack of up-front federal investment in testing, including advance purchasing of tests, is another factor that appears to have impacted testing availability and affordability. Whereas the federal government channeled billions of dollars into accelerating vaccine development and advance purchasing of millions of doses, which helped to mitigate manufacturer risk and allowed for vaccines to be provided at no cost to all in the United States, no similar strategy was undertaken for testing. Without such up-front investment, the risk and cost of scale up was largely placed on manufacturers, who might be reticent to do so in the face of uncertainty given their fiduciary responsibility to shareholders. As noted, this differs from the experience in the UK and Germany where governments simultaneously supported vaccination and home testing efforts.

The Biden Administration’s use of the DPA in September to spur more domestic production of rapid tests and its procurement of additional rapid tests injected new investments in this area.  Since then, HHS announced contracts with Abbott, Celltrion, OraSure, Quidel, and Acon Laboratories. And, on October 6, 2021, the White House committed another $1 billion towards rapid tests to “further mobilize testing manufacturers…to expand production of tests…based on the United States government’s commitment to procure an additional 180 million rapid tests over the course of the next year.” Much of these new procurements will provide free and increased rapid testing to community sites and long-term care facilities, designed to reach high needs populations in specific settings, but not necessarily increase supply for consumers.

As mentioned above, this additional investment is expected to result in a supply of 200 million rapid antigen tests per month by December, and 300 million by February 2022.  Some experts recommend, however, that rapid antigen testing be conducted once twice or even three times per week to optimally help to identify those who are infectious and interrupt onward transmission. In response to a recent study, an NIH official stated that “Rapid antigen testing at home, two to three times per week, is a powerful and convenient way for individuals to screen for COVID-19 infection,” further noting that “With schools and businesses reopening, an individual’s risk of infection can change from day to day. Serial antigen testing can help people manage this risk and quickly take action to prevent spread of the virus.” Indeed, many colleges and universities have adopted this approach to curb spread. Yet, the new U.S. investment, even if resulting in 300 million rapid tests per month, would be less than one test per month per person in the U.S. For two times per week testing, it would cover less than 40 million individuals. If everyone older than 11 were tested twice per week per the UK’s recommendation, we would need 2.3 billion tests per month. If just half the U.S. population tested weekly, that would translate to a need for more than 150 million tests per week, around 600 million per month. The recent announcement of the new federal ITAP effort invests an additional $70 million and could help to increase supply in the U.S. market, though how quickly is uncertain.

Federal Guidance and Messaging

One other challenge has been federal messaging and changing guidance related to the role of testing as part of the U.S. COVID-19 response over the course of the pandemic. This included mixed messages and changing recommendations during the Trump administration, including down-playing of the importance of testing and shifting guidance from the CDC during vaccine roll-out.

Before vaccine roll-out, in late 2020 CDC’s testing guidance was that “people who have had close contact (within 6 feet for a total of 15 minutes or more) with someone with confirmed COVID-19” should get tested. Then, as of  March 17th 2021, when vaccines were starting to become more widely available to all adults in the United States, case rates were down, and Delta had not yet taken hold, CDC stated that “fully vaccinated people with no COVID-19 symptoms do not need to be tested following an exposure to someone with COVID-19.” Just a few months later, however, in early August 2021, the CDC again changed its guidance to recommend testing for fully vaccinated people following exposure: “fully vaccinated people should be tested 3-5 days following a known exposure to someone with suspected or confirmed COVID-19.” While this shift in messaging was responding to a rapidly changing pandemic and new evidence on an emerging and evolving disease, industry communications indicate that it had an impact on manufacturing:

“While we expect to close more accounts with employers and have several promising partnerships in the pipeline, they involve a good deal of blocking and tackling and are very hard to predict or value especially when guidance from CDC and the landscape of COVID testing seem to evolve daily. Recently the warning from public health officials that vaccinated people can become infected and spread the highly contagious delta variant of COVID-19 appears to be a near term driver for more masking and testing especially as schools and office look to reopen in the fall.” – Quidel Q2 2021 investor call

And as noted above:

“…changes in projected testing demand [are] driven by several factors, including significant reductions in cases in the U.S. and other major developed countries, the accelerated rollout of COVID-19 vaccines globally and the U.S. health authority’s updated guidance on testing for fully vaccinated individuals.” - Abbott  Q2 2021 10-Q SEC filing

Beyond impact on industry, shifting messaging could have affected public understanding of testing and confidence in agency recommendations. More broadly, the CDC has provided limited guidance on the role of home or routine testing, as a public health tool in addressing the pandemic and how it may differ from testing in other settings. Guidance on preventing COVID-19 has focused on vaccination and the CDC page on COVID-19 testing is aimed at those who are at risk for infection, symptomatic or are traveling with no information on testing routinely or as a public health practice. In the How to Protect Yourself and Others factsheet (last updated in August 2021), there is no mention of how testing may be a tool in the pandemic response. Similarly, the home testing page focuses on testing among those who may be at risk for having COVID-19, and suggests that home testing may be something to pursue if you cannot get tested by a provider: “If you need to be tested for COVID-19 and can’t get tested by a healthcare provider, you can consider using either a self-collection kit or a self-test that can be performed at home or anywhere else.” CDC guidance on testing in schools and workplaces is more comprehensive in its discussion of tests as a public health or screening tools but is limited to those settings. The limited information on home tests and little explanation of their role as a public health tool for home use may impact public understanding of home testing and willingness to use rapid test kits. However, a recent FDA press release for a newly authorized home antigen test states that the agency “considers at-home COVID-19 diagnostic tests to be a high priority and we have continued to prioritize their review given their public health importance.”

Cost and Insurance Coverage Considerations

Cost may also be a barrier to accessing OTC rapid home tests. Domestically available OTC tests typically range from $14 for two tests, or $7 per test, to $38.99 per test.1   If a consumer wanted to test regularly, even the least expensive test ($14 for two tests) used twice a week would amount to $728 per year, assuming they could get tests in this quantity. The more typical (non-discounted) price would cost an individual more than $1,000 per year, and the most expensive test used twice a week would amount to over $4,000 per year. Elsewhere, outside the U.S., home tests are about a dollar and in some cases, like in the UK, Israel, and Singapore, free to all or many people.

While federal COVID-19 legislation ensures that a range of tests are available free of charge through insurance, federal guidance indicates that home tests are only required to be covered if “ordered by an attending health care provider who has determined that the test is medically appropriate for the individual based on current accepted standards of medical practice and the test otherwise meets the statutory criteria.” Further, if OTC home tests were covered by commercial insurance, it could be logistically cumbersome for an individual testing regularly to seek reimbursement each time.

The new ITAP aims to bring more tests to market which could increase competition and decrease costs. In addition, the revisions to the FDA pathway to allow for the sale of certain single use, rather than serial, tests could decrease the purchase price for some consumers. However, the real impact of these changes is yet to be realized.

Finally, even if supply problems are solved, cost could remain a barrier for some. Unless there is widespread scale up with multiple access points and free or truly inexpensive tests, disparities in terms of diagnosis and community transmission that already exist could be exacerbated. Some of these issues may be alleviated by recent federal investments to provide free rapid testing to certain community sites but that has yet to be proven.

Looking Ahead

Taken together, there are multiple interrelated factors that have contributed to the lack of availability of rapid home tests in the U.S., including the regulatory framework, supply chain and demand issues, federal investment, federal messaging, and affordability. Recent actions by the Biden administration are likely to help alleviate some of these challenges though it is not yet clear if they can fully resolve the issues. Even if scale-up hits the projected increase in supply to 300 million rapid tests per month by early next year, this would translate into less than one test per individual per month, not enough to test most people weekly as some recommend. Additionally, even with scale up and more widespread retail availability, cost will likely persist as a barrier for many people, and could run the risk of exacerbating existing inequities in the pandemic. It will also be important to monitor whether the growing vaccination or testing requirements from employers and other places of business/entertainment will generate more demand for tests and stress the already limited supply. As has been the case since the early days of the pandemic, the future of COVID-19 in the United States, from case load to vaccination to testing is hard to predict. More widespread use of testing, and home testing in particular, could help to address the pandemic in the face of ongoing uncertainty.

Endnotes

  1. Prices come from searches for OTC COVID tests conducted twice a day over a week period (between September 21 and 27, 2021) on Amazon, Walgreens, CVS, Kroger, Target, and Walmart websites. ↩︎

10 Years of Hospital Readmissions Penalties

Author: Jordan Rau
Published: Nov 4, 2021

Preventable rehospitalization of the nation’s older adults has proved a persistent health and financial challenge for the U.S., costing Medicare hundreds of millions of dollars each year. Various analyses have found many readmissions within a month of discharge might have been avoided through better care and more attention paid to the patients after they left the hospital. The federal government’s campaign to reduce the frequency of these readmissions by applying financial disincentives has entered its 10th year with Medicare’s decision to lower payments to 2,499 hospitals throughout the current fiscal year, which began last month and runs through September 2022.

The Hospital Readmissions Reductions Program (HRRP), created as part of the Affordable Care Act, punishes general acute-care hospitals when more Medicare patients return for a new admission within 30 days of discharge than the government decides is appropriate. The average penalty this fiscal year is 0.64%, with 39 hospitals losing the maximum of 3% of reimbursements.

Over the lifetime of the program, 2,920 hospitals have been penalized at least once. That’s 93% of the 3,139 general acute hospitals subject to HRRP evaluation, and 55% of all hospitals. Moreover, 1,288 have been punished in all 10 years. Only 219 eligible hospitals have avoided any payment reductions since the program’s start in 2013, though more than 2,000 hospitals are automatically exempt from penalties because they have specialized functions: those that focus on children, psychiatric patients, veterans, rehabilitation and long-term care or those that serve as the only hospital in an area.

Hospital readmissions have become less frequent since before the ACA was enacted, and most experts attribute that partly to the financial threat of the penalties, though other factors likely contributed to the improvements. Less debatable is that the penalties have saved the government billions of dollars since their inception. The Centers for Medicare & Medicaid Services estimates that because of the HRRP, Medicare will keep an extra $521 million this fiscal year. You can look up individual hospital penalties using KHN’s interactive tool.

Source

Medicare Punishes 2,499 Hospitals for High Readmission

Rebuilding Title X: New Regulations for the Federal Family Planning Program

Published: Nov 3, 2021

On October 4, 2021, the Biden Administration released new final regulations for the federal Title X family planning program. The new regulations replace those issued by the Trump Administration in 2019,  which made significant and well documented changes to the Title X program leading to a significant reduction in the size of the Title X network and the number of low-income and uninsured clients served by the program. This brief presents new state-level data on the status of the Title X network on the eve of the implementation of the new regulations and summarizes the impact of Trump era regulations on the number of clients served and status of participation by clinics across the country.

The Impact of the 2019 Trump Regulations

The 2019 Trump Administration regulations substantially diminished the Title X family planning network by disqualifying family planning clinics with co-located abortion services and disallowing the provision of abortion referrals to clients that wanted them. In its 2020 Family Planning Annual Report, the federal Office of Population Affairs (OPA) documented the impact of both the Trump Administration’s regulations and the pandemic on the number of clients they served, as well as the change in the number of grantees and clinic sites from 2018 to 2020 (Table 1). In this two-year period, the number of clients served fell from 3.9 million to 1.5 million people. The report estimated that the Trump Administration’s final rule accounted for nearly two-thirds (63%) of the precipitous reduction in the number of family planning clients served while the COVID-19 pandemic accounted for one third of the falloff (Figure 1).

Table 1: Changes in the Title X Network from 2018 to 2020
201820192020
Clients served3.9 million3.1 million1.5 million
Family planning visits6.5 million4.7 million2.7 million
Grantees (receive funding from HHS OPA)9910075
Sub-recipients (receive funding from grantees and can distribute to clinic sites or provide services themselves)1,1281,060867
Clinic sites (receive funding from grantees or sub-recipients)3,9543,8253,031
SOURCE: Title X Family Planning Annual Report 2020 National Summary
Impact of Trump Regulations and COVID-19 Pandemic on Title X Program

With the large exodus of clinics from the Title X program in summer of 2019, there are still five states without any Title X funded clinic sites: Oregon, Washington, Vermont, Maine, and Hawaii, while New York currently has only two sub-recipient sites (Table 2). Another seven states, including New York, have Title X clinic networks that are currently operating at less than 25% of their original capacity. Based on our analysis of OPA’s Title X Family Planning Directories, 36 states have experienced a decrease in participating Title X clinics from June 2019 to August 2021, while OPA’s Family Planning Annual Reports between 2018 and 2020 show 49 states and DC have seen a reduction in clients ranging from 2%-100%, with a median reduction in clients of 52%.

A small number of entities have rejoined the Title X network in the past year. One of Utah’s two grantees, Utah Navajo Health System, rejoined the Title X program in July 2020 as a sub-recipient under Arizona’s grantee, Arizona Family Health Partnership. Maryland Department of Health rejoined the program in October 2020 after the State of Maryland was granted a permanent injunction against enforcing the 2019 Title X Final Rule. Most of the Planned Parenthood clinics left the Title X Program after the Trump Administration’s Rule became final though few are now in the program, including those in Maryland, Washington D.C., and Missouri.

The Trump Administration Final Rule allowed “non-traditional” Title X grantees to join the network and some of these grantees are no longer part of the program under the Biden Administration. The Trump Administration regulations extended federal family planning funds to organizations that only offered their clients fertility awareness or abstinence options. The new regulations do not qualify them to participate as grantees if they do not offer a broader range of contraception methods to their clients. Notably, the Obria Group, Inc., a Christian organization based in Southern California that did not provide contraceptive services based on religious objections to hormonal contraception, left the Title X program in April 2021. Another Christian-based organization, Beacon Christian Community Health Center, which joined the Title X network as a New York grantee in October 2018, left the Title X program in April 2021 as well. Two of the three new Title X grantees that joined the Title X program under the Trump Administration that are not religiously based, City of El Paso in Texas and Osceola Community Health Services in Florida, remain in the program.

Key Aspects of the Final Biden Administration’s Title X Regulations

The new Biden regulations restore many aspects of the program that were removed through the Trump Administration regulations, including:

  • Allowing co-located abortion services and abortion referrals
  • Requiring clinics that are not able to provide clients with a broad range of family planning methods to provide a prescription or referral to the client if requested
  • Added confidentiality protections for adolescents— clinics may not require consent of a parent or guardian for the provision of services and cannot notify a parent or guardian before or after provision of any services

The regulations have also added new provisions to the program, including:

  • Adding telehealth as an option for providing medical services in addition to in-person care
  • Requiring family planning projects to provide services in a matter that is client-centered, culturally and linguistically appropriate, inclusive, and trauma-informed; protects the dignity of the individual; and ensure equitable and quality service delivery consistent with a nationally recognized standard of care
  • Adding a new funding criterion - the ability of the applicant to advance health equity

The final rules will be effective November 8, 2021, and clinics will once again be able to provide their clients with the care that meets the quality standards established by the CDC and OPA, including providing non-directive pregnancy options counseling with referrals for prenatal care, adoption services, or abortion services and confidential services for adolescents, but it will take time to restore the network of providers. On October 25, 2021, the state of Ohio, joined by 11 other states (AL, AZ, AK, FL, KS, KY, MO, NE, OK, SC, WV), filed a lawsuit in the US District Court for the Southern District of Ohio against HHS  to block the implementation of the Biden Administration’s regulations. These states claim the final regulations violate Section 1008 of the Public Health Service Act that says none of the funds appropriated under Title X can be used in programs where abortion is a method of family planning. The litigants claim that by reinstating the regulations that allow co-located abortion services and require participating providers to offer referrals for abortions to clients who seek them, that HHS is not in compliance with the intent of the law. The States are requesting a ruling as soon as practicable and no later than December 31, 2021. If the Court does not rule before November 8th, the Biden regulations will become effective.

If the final regulations remain in effect, additional funding that can be extended to grantees that left the network is not anticipated until Spring of 2022 after the grant applications due January 11, 2022 are reviewed and approved. Funding will likely be awarded by April 1, 2022. Grantees that are still part of the Title X program can bring clinics back into their network if they have current funding available. Current grantees’ three-year grant cycle ends March 31, 2022.

In response to Texas’ S.B. 8 law banning most abortions, HHS will award additional funding to Texas’ largest Title X grantee to meet an increased demand for emergency contraception and family planning services. OPA is also planning to award an additional $10 million through a new funding opportunity entitled “Funding to Address Dire Need for Family Planning Services” that will provide grants to Title X entities that can demonstrate a need for additional funding for family planning services due to either an influx of clients as a result of Texas’ S.B. 8 abortion ban or some other reason. A second funding opportunity that OPA is planning on releasing will provide $45 million in Spring 2022 to Title X grantees to expand and enhance their telehealth infrastructure and capacity, which will be particularly important given the ongoing COVID-19 pandemic and increased demand for telehealth services.

Looking Forward

The final Biden Administration Title X regulations will make significant changes to sites across the nation and allow clinics like Planned Parenthood, which were formerly disqualified because they have co-located abortion services or provide abortion referrals for individuals who want them, to once again apply for federal support to provide family planning services to low-income and uninsured individuals. These regulations are being challenged by several states by litigation that could take years to resolve. If fully implemented, however, the real impact of the revised regulations will be when federal funds become available to grantees and clinics to rejoin the program and allow more low-income people to receive health services from Title X sites. While many grantees and clinics that left the network are anticipated to resume participation in the safety net program, it remains to be seen whether all those grantees and providers that left the program will apply to return. Some were able to obtain state-level funding to bridge the loss of federal support. These decisions will likely depend on whether states will continue to subsidize their family planning providers or whether additional federal funds will be needed to maintain and strengthen state family planning networks and services in communities that have historically been served by these providers.

Table 2: Changes in Title X Clients and Clinics by State, 2018–2020
News Release

Rebuilding the Title X Family Planning Network Will Take Time, Despite Biden Administration Actions Issuing New Regulations and Additional Funding

Published: Nov 3, 2021

A new KFF analysis highlights state-level data on the status of the Title X family planning program on the eve of the implementation of the new Biden Administration regulations for the program.

To date, five states still have no Title X clinics, and seven states are still operating with less than 25% of their clinic network. Overall, 39 states experienced a drop in the number of participating clinics since 2018. The Trump Administration’s Department of Health and Human Services had issued regulations that essentially disqualified family planning clinics, such as Planned Parenthood, that also provided abortion services from participating in the program and prohibited clinics from offering referrals to abortion providers. These regulations resulted in a dramatic reduction in the number of sites participating and in the number of people served by the program.

The new Biden Administration regulations also include new provisions in addition to restoring many aspects of the program that existed prior to the Trump Administration rule. New provisions also include telehealth as an option for providing medical services, a service option widely used during the COVID-19 pandemic, as well as a focus on advancing health equity.

The final rule will be effective November 8, 2021, with funding for grantees anticipated in Spring 2022. The analysis provides additional information on the new regulations and state by state changes in Title X clients and clinics between 2018-2020.

News Release

A Record 3,834 Medicare Advantage Plans Will be Available in 2022, Up 8 Percent From 2021, While the Number of Medicare Part D Stand-Alone Plans is Decreasing Mainly Due to Firm Consolidations

Published: Nov 2, 2021

A record 3,834 Medicare Advantage plans will be available across the country as alternatives to traditional Medicare for 2022, a new KFF analysis finds. That’s an increase of 8 percent from 2021, and the largest number of plans available in more than a decade.

At the same time, the number of Medicare Part D stand-alone prescription drug plans that will be offered in 2022 is decreasing by 23 percent to 766 plans, primarily the result of firm consolidations leading to fewer plan offerings sponsored by Cigna and Centene, according to another new KFF analysis.

These findings are featured in two briefs released by KFF today that provide an overview of the Medicare Advantage and Medicare Part D marketplace for 2022, including the latest data and key trends over time. Medicare’s open enrollment period began Oct. 15 and runs through Dec. 7.

Medicare Advantage

More than 26 million Medicare beneficiaries – 42 percent of all beneficiaries – are currently in Medicare Advantage plans, which are mostly HMOs and PPOs offered by private insurers that are paid to provide Medicare benefits to enrollees.

In 2022, a typical beneficiary will have 39 plans to choose from in their local market. But the number of Medicare Advantage plans available varies greatly across the country, with an average of 42 plans in metropolitan areas and 25 plans in non-metropolitan areas. In 2022, 25 percent of beneficiaries live in a county where they can choose among 50 Medicare Advantage plans.

Most Medicare Advantage plans (89%) include prescription drug coverage. Fifty-nine percent of these plans do not charge any additional premium beyond Medicare’s standard Part B premium. More than 90 percent of non-group Medicare Advantage plans offer some vision, telehealth, hearing, or dental benefits.

Despite the average beneficiary having access to plans offered by nine different firms, Medicare Advantage enrollment is concentrated in plans operated by UnitedHealthcare, Humana, and Blue Cross Blue Shield affiliates. Together, UnitedHealth and Humana account for 45 percent of Medicare Advantage enrollment in 2021.

Part D

As a result of consolidations in the stand-alone drug plan market, the typical Medicare beneficiary will have a choice of 23 stand-alone drug plans next year, seven fewer than in 2021. Beneficiaries receiving low-income subsidies (LIS) will also have fewer premium-free plan choices in 2022, which could make it more difficult for some enrollees to find a premium-free plan that covers all their prescription medications. In the stand-alone drug plan market, 8 out of 10 enrollees next year are projected to be in stand-alone plans operated by just four firms: CVS Health, Centene, UnitedHealth, and Humana.

The estimated average monthly premium for Medicare Part D stand-alone drug plans is projected to be $43 in 2022, based on current enrollment, while average monthly premiums for the 16 national stand-alone drug plans available in 2022 are projected to range from $7 to $99.

Nearly three-fourths, or 10 million, of the 13.3 million stand-alone drug plan enrollees who don’t qualify for low-income subsidies will have to pay higher premiums next year if they stick with their current plan, and many will also face higher deductibles and cost sharing for covered drugs. While the average weighted monthly PDP premium is increasing by $5 between 2021 and 2022 (from $38 to $43), nearly 4 million non-LIS enrollees (28%) will see a premium increase of $10 or more per month. Substantially fewer non-LIS enrollees (0.2 million, or 2%) will see a premium reduction of the same magnitude.

In addition to these two new analyses, KFF has updated its collection of frequently asked questions about Medicare Open Enrollment to help beneficiaries understand their options during the annual open enrollment period. A recent KFF analysis found that 7 in 10 Medicare beneficiaries say they did not compare their options during a recent open enrollment period. Comparing and choosing among the wide array of Part D plans can be difficult, given that plans differ from each other in multiple ways, beyond premiums, including cost sharing, deductibles, covered drugs, and pharmacy networks. Comparing Medicare Advantage drug plans may be made more difficult by the fact that not only drug coverage varies but also other features, including cost sharing for medical benefits, provider networks, and coverage and costs for supplemental benefits.


Medicare Advantage 2022 Spotlight: First Look

Authors: Meredith Freed, Anthony Damico, and Tricia Neuman
Published: Nov 2, 2021

Data Note

Over the last decade, Medicare Advantage, the private plan alternative to traditional Medicare, has taken on a larger role in the Medicare program. In 2021, more than 26 million Medicare beneficiaries are enrolled in a Medicare Advantage plan. This brief provides an overview of the Medicare Advantage plans that are available for 2022 and key trends over time. (A separate overview of the 2022 Medicare Part D marketplace is also available.)

Plan Offerings in 2022

Number of Plans

Number of Plans Available to Beneficiaries. For 2022, the average Medicare beneficiary has access to 39 Medicare Advantage plans, more than double the number of plans per person in 2017, and the largest number of options available in more than a decade (Figure 1). These numbers exclude employer or union-sponsored group plans, Special Needs Plans (SNPs) and PACE plans, which are only available to select populations.

The average Medicare beneficiary has access to 39 Medicare Advantage plans in 2022, an increase from prior years

Among the 39 Medicare Advantage plans generally available for individual enrollment to the average Medicare beneficiary, 31 of the plans include prescription drug coverage (MA-PDs).

Total Number of Plans. In total, 3,834 Medicare Advantage plans are available nationwide for individual enrollment in 2022 – an 8 percent increase (284 more plans) from 2021 and the largest number of plans available in more than a decade (Figure 2; Appendix Table 1). The vast majority (89 percent) of all Medicare Advantage plans offered include prescription drug coverage in 2022.

More Medicare Advantage plans are available in 2022 than in any other year

HMOs account for about six in ten (59%) of all plans offered in 2022, a slight decline from prior years where they accounted for about two-thirds of all plans offered. The availability of local PPOs has increased rapidly over recent years. In 2022, more than one-third of plans (37%) offered are local PPOs, compared to a quarter in 2018. Between 2021 and 2022, the number of regional PPOs has remained constant, while the number of private fee-for-service plans has continued to decline.

The growth in number of plans varies across states and counties, with the preponderance of the growth occurring in Texas and Florida (41 more and 32 more plans, respectively; data not shown). Alaska has two plan offerings for the first time since 2010. Arkansas has 8 fewer plans available for 2022 than in 2021, while Kentucky has 6 fewer plans, Washington and Ohio each have three fewer plans, and Tennessee has two fewer plans available in 2022 than in 2021.

While many employers and unions also offer Medicare Advantage plans to their retirees, no information about these 2022 plan offerings is made available by CMS to the public during the Medicare open enrollment period because these plans are not available to the general Medicare population.

In 2021, people with end-stage renal disease (ESRD) became eligible to enroll in Medicare Advantage plans. Prior to this change, people with ESRD were not able to enroll in most Medicare Advantage plans, subject to limited exceptions, such as C-SNPs for people with ESRD. In 2021, only about 4,800 Medicare Advantage enrollees were in a C-SNP for people with ESRD.

Availability of Insulin Demonstration Plans. In 2022, beneficiaries in each state will have the option to enroll in a Part D plan participating in an Innovation Center model in which enhanced drug plans cover insulin products for non-LIS enrollees at a monthly copayment of $35 in the deductible, initial coverage, and coverage gap phases of the Part D benefit. In 2022, a total of 2,159 Part D plans will participate in this model, including 1,901 MA-PDs (38% of MA-PDs, including segmented plans).

Special Needs Plans (SNPs). More SNPs are available for 2022 than in any year since they were authorized, increasing from 975 plans in 2021 to 1,156 plans in 2022, a 19 percent increase (Figure 3).

The Number of Special Needs Plans Offered Increased Again for 2022

The rise in SNPs for people who require an institutional-level of care (I-SNPs) has been particularly notable, more than doubling from 83 plans in 2017 to 184 plans in 2022 (an increase of 10 plans since 2021). I-SNPs may be attractive to insurers because they tend to have much lower marketing costs than other plan types since they are often the only available option for people who require an institutional level-of-care, such as those who have been in skilled nursing facilities or nursing homes for 90 days or longer. The number of SNPs for people dually eligible for Medicare and Medicaid (D-SNPs) has also increased sharply over the past five years, nearly doubling from 373 dual SNPs in 2017 to 700 dual SNPs in 2022, suggesting insurers’ continue to be interested in managing the care of this high-need population.

The number of SNPs offered for people with chronic conditions (C-SNPs) is also increasing in 2022 (272 plans), more than doubling from 2017 (122 plans), most of which focus on people with diabetes, heart disease, or lung conditions, as has been the case since the inception of C-SNPs. For 2022, three firms are offering C-SNPs for people with dementia (the same as 2021), four firms are offering C-SNPs for people with mental health conditions (up two from 2021), four firms are offering C-SNPs for people with end-stage renal disease (up one from 2021) and two firms are offering C-SNPs for people with HIV/AIDS (same as 2021).

Variation in the Number of Plans, by Geographic Area. On average, beneficiaries in metropolitan areas can choose from many more Medicare Advantage plans than beneficiaries in non-metropolitan areas (42 plans versus 25 plans, respectively).

In the top 25 counties in terms of plan offerings, beneficiaries can choose from 66 or more Medicare plans, including 14 counties in Ohio and 7 counties in Pennsylvania. Summit County in Ohio offers the most Medicare Advantage plans in 2022, at 82 (Figure 4).

In the 25 counties with the most plans available, Medicare beneficiaries can choose among 66 or more plans

In 5 percent of counties (accounting for 25% of beneficiaries), beneficiaries can choose among more than 50 Medicare Advantage plans, including 51 counties with more than 60 plans (Figure 5). In contrast, in 4 percent of counties (accounting for 1% of beneficiaries), beneficiaries can choose from three or fewer Medicare Advantage plans. The number of counties with no Medicare Advantage plans for 2021 is 65, a slight decrease compared to 2021 (82). For the first time since 2010, two Medicare Advantage plans are being offered in 15 counties in Alaska. Additionally, no Medicare Advantage plans are available in territories other than Puerto Rico. In Puerto Rico, beneficiaries can choose from an average of 26 plans for individual enrollment and an average of 24 D-SNPs.

In 5 percent of counties (accounting for 25% of beneficiaries), beneficiaries can choose among more than 50 Medicare Advantage plans, including 51 counties with more than 60 plans

Access to Medicare Advantage Plans, by Plan Type

As in recent years, virtually all Medicare beneficiaries (99.7%) have access to a Medicare Advantage plan as an alternative to traditional Medicare, including almost all beneficiaries in metropolitan areas (99.99%) and the vast majority of beneficiaries in non-metropolitan areas (98.4%). In non-metropolitan counties, a smaller share of beneficiaries have access to HMOs (91% in non-metropolitan versus 99% in metropolitan counties) or local PPOs (93% in non-metropolitan versus 98% in metropolitan counties), and a slightly larger share of beneficiaries have access to regional PPOs (77% in non-metropolitan counties versus 72% in metropolitan counties).   

Number of Firms

The average Medicare beneficiary is able to choose from plans offered by 9 firms in 2022, one more than in 2021 (Figure 6). Despite most beneficiaries having access to plans operated by several different firms, enrollment is concentrated in plans operated by UnitedHealthcare, Humana, and Blue Cross Blue Shield affiliates. Together, UnitedHealthcare and Humana account for 45 percent of MA enrollment in 2021.

More

More than one-third of beneficiaries (35%) are able to choose from plans offered by 10 or more firms or other sponsors. Sixteen firms are offering Medicare Advantage plans in five counties: Maricopa and Pima counties in Arizona, Fort Bend and Montgomery counties in Texas, and Miami-Dade, Florida. In contrast, in 87 counties, most of which are rural counties with relatively few Medicare beneficiaries (less than 1% of total), only one firm will offer Medicare Advantage plans in 2022. Over the past several years, the number of counties with a single firm offering Medicare Advantage plans has fallen substantially. As recently as 2019, there was a single firm offering plans in nearly 200 counties.

Availability of Plans by Firm and County. UnitedHealthcare and Humana, the two firms with the most Medicare Advantage enrollees in 2021, have large footprints across the country, offering plans in most counties. Humana is offering plans in 85 percent of counties and UnitedHealthcare is offering plans in 74 percent of counties in 2022 (Figure 7). About 9 in 10 (89%) Medicare beneficiaries have access to at least one Humana plan and 90 percent have access to at least one UnitedHealthcare plan.

Interactive DataWrapper Embed

Most major Medicare Advantage firms have also expanded the number of counties where they are offering plans. Humana is offering plans in 2,737 counties in 2022, an increase of 29 from 2021, while UnitedHealthcare is offering plans in 2,377 counties in 2022, an increase of 259 from 2021. Blue Cross Blue Shield Affiliates are offering plans in 2,190 counties in 2022, an increase of 285 plans from 2021. CVS Health is offering plans in 1,840 counties, an increase of 81 counties since 2021; Centene is offering plans in 1,525 counties, an increase of 396 counties; and Cigna is offering plans in 477 counties, an increase of 108 counties. Kaiser Permanente had the smallest growth and is offering plans in 116 counties, an increase of 7 counties.

Multiple Plan Offerings by Firms in the Same County. Many Medicare Advantage firms are also offering more than one plan option in each county. In 585 counties (accounting for 34% of beneficiaries), at least one firm is offering 10 or more plans. In 82 of those counties, two firms are offering 10 or more plans, and in 12 counties, three firms are offering 10 or more plans. Blue Cross Blue Shield Affiliates are offering the most plan options in a county, with 18 different plan options in six counties. Humana is offering the next highest number of plan choices with 14 in five counties, followed by Centene and CVS, which are offering 13 plan options in four counties and two counties, respectively. United Healthcare is offering 10 plan options in two counties.

New Market Entrants and Exits

Medicare Advantage continues to be an attractive market for insurers, with 20 firms entering the market for the first time in 2022, collectively accounting for about 19 percent of the growth in the number of plans available for general enrollment and about 6 percent of the growth in SNPs (Appendix Table 2). Thirteen new entrants are offering HMOs available for individual enrollment. Nine of the new entrants are offering SNPs; seven firms are offering D-SNPs for people dually eligible for Medicaid, one firm is offering a C-SNP for people with select chronic conditions, and one firm is offering an I-SNP.

Three of the new firm entrants are offering plans in Massachusetts, two are offering plans in California, Florida, North Carolina, South Carolina, and Utah, and the remainder are offering plans in at least one of thirteen other states (Arizona, Indiana, Louisiana, Maryland, Michigan, Minnesota, Montana, New Hampshire, North Dakota, South Dakota, Oklahoma, Rhode Island, and Texas).

Seven firms that previously participated in the Medicare Advantage market are not offering plans in 2022. Six of the firms had very low enrollment in 2021, while one firm (Sunrise Advantage Plan) had no enrollment in 2021. Two of the seven exiting firms offered plans in California.

Premiums

The vast majority of Medicare Advantage plans for individual enrollment (89%) will include prescription drug coverage (MA-PDs), and 59 percent of these plans will charge no premium, other than the Part B premium, somewhat higher than 2021 (54 percent). More than nine out of ten beneficiaries (98%) have access to a MA-PD with no monthly premium in 2022. However, in Alaska and Wyoming, beneficiaries do not have access to a zero-premium MA-PD.

In 2021, 65 percent of enrollees in MA-PD plans pay no premium other than the Medicare Part B premium of $148.50 per month. Based on enrollment in March 2021, 15% of enrollees pay at least $50 a month, including 5 percent who pay $100 or more. CMS announced that the average monthly plan premium among all Medicare Advantage enrollees in 2022, including those who pay no premium for their Medicare Advantage plan, is expected to decrease from 2021 to $19 a month.

Extra Benefits

Medicare Advantage plans may provide extra benefits that are not available in traditional Medicare, are considered “primarily health related,” and can use rebate dollars (including bonus payments) to help cover the cost of these extra benefits. Beginning in 2019, CMS expanded the definition of “primarily health related” to allow Medicare Advantage plans to offer additional supplemental benefits. Medicare Advantage plans may also restrict the availability of these extra benefits to certain subgroups of beneficiaries, such as those with diabetes or congestive heart failure, making different benefits available to different enrollees.

Availability of Extra Benefits in Plans for General Enrollment. Historically, the extra benefits offered most often were fitness, dental, vision, and hearing. More than 90% of individual plans offer access to vision, fitness, telehealth, hearing or dental benefits in 2022. Though these benefits are widely available, the scope of specific services varies. For example, a dental benefit may include cleanings only or more comprehensive coverage, often subject to an annual cap on the amount covered by the plan. (Figure 8).

More than 90% of Medicare Advantage plans provide access to vision, fitness, telehealth, hearing, or dental benefits

As of 2020, Medicare Advantage plans have been allowed to include telehealth benefits as part of the basic benefit package – beyond what was allowed under traditional Medicare prior to the COVID-19 public health emergency. These benefits are shown in the figure above, even though their cost are built into the bid, and are not covered by either rebates or supplemental premiums. Additionally, Medicare Advantage plans may offer supplemental telehealth benefits via remote access technologies and/or telemonitoring services, which can be used for those services that do not meet the requirements for coverage under traditional Medicare or the requirements for the telehealth benefits as part of the basic benefit package (such as the requirement of being covered by Medicare Part B when provided in-person). The vast majority (95%) of Medicare Advantage plans are offering telehealth in 2022.

Other extra benefits that are frequently offered for 2022 include over the counter items, such as adhesive or elastic bandages (81%), meal benefits, such as a cooking class, nutrition education, or meal delivery (67%), and transportation benefits (38%). Less than 10 percent of plans provide bathroom safety devices (8%) or telemonitoring services (3%), and support for caregivers of enrollees (3%). This is not an exhaustive list of extra benefits that plans offer, and plans may provide other services such as home-based palliative care, therapeutic massage, and adult day health services, among others.

Access to Extra Benefits. Virtually all Medicare beneficiaries live in a county where at least one Medicare Advantage plan available for general enrollment has some extra benefits not covered by traditional Medicare, with 99% having access to some dental, fitness, vision, and hearing benefits for 2022. The vast majority of beneficiaries also have access to telehealth benefits (99%), over the counter items (99%), a meal benefit (99%), transportation assistance (97%) and but fewer have access to in-home support services (76%) or bathroom safety devices (63%).

Availability of Extra Benefits in Special Needs Plans. SNPs are designed to serve a disproportionately high-need population, and a somewhat larger percentage of SNPs than plans for other Medicare beneficiaries provide their enrollees with over the counter items (93%), transportation benefits (87%) and in-home support services (25%). Similar to plans available for general enrollment, a relatively small share of SNPs provide bathroom safety devices (12%) or telemonitoring services (5%).

Availability of Special Supplemental Benefits for the Chronically Ill (SSBCI). Beginning in 2020, Medicare Advantage plans have also been able to offer extra benefits that are not primarily health related for chronically ill beneficiaries, known as Special Supplemental Benefits for the Chronically Ill (SSBCI). Information on the availability of SSBCI for 2022 has not yet been published by CMS, but we include data on the availability of benefits in 2021.

The vast majority of plans do not yet offer these benefits, but a larger share of SNP plans tend to offer SSBCI benefits than plans for individual enrollment. Some of the most frequently offered SSBCI benefits include food and produce (6.6% for individual plans and 20.5% for SNPs), meals (beyond a limited basis) (6.0% in individual plans and 12.3% for SNPs), and pest control (5.1% for individual plans and 14.6% for SNPs) (Figure 9).

As of 2021, the vast majority of plans do not offer Special Supplemental Benefits for the Chronically Ill (SSBCI)

Discussion

More Medicare Advantage plans are being offered for 2022 than in any other year. Twenty insurers are entering the Medicare Advantage market for the first time, and seven insurers are exiting the market, suggesting that Medicare Advantage remains an attractive, profitable market for insurers. Overall, more than 99 percent of beneficiaries will have access to one or more Medicare Advantage plans in 2022, similar to prior years. With more firms offering SNPs and the number of SNPs rapidly growing, there may be greater focus on how well high-need, vulnerable beneficiaries are being served by Medicare Advantage plans, including SNPs as well as plans for general enrollment. As Medicare Advantage enrollment continues to grow, insurers seem to be responding by offering more plans and choices to the people on Medicare.

Meredith Freed and Tricia Neuman are with KFF.Anthony Damico is an independent consultant.

Methods

This analysis focuses on the Medicare Advantage marketplace in 2022 and trends over time. The analysis includes more than 26 million enrollees in Medicare Advantage plans in 2021.

Data on Medicare Advantage plan availability, enrollment, and premiums were collected from a set of data files released by the Centers for Medicare & Medicaid Services (CMS):

  • Medicare Advantage plan landscape files, released each fall prior to the annual enrollment period
  • Medicare Advantage plan and premium files, released each fall
  • Medicare Advantage plan crosswalk files, released each fall
  • Medicare Advantage contract/plan/state/county level enrollment files, released on a monthly basis
  • Medicare Advantage plan benefit package files, released quarterly
  • Medicare Enrollment Dashboard files, released on a monthly basis

KFF’s plan counts may be lower than those reported by CMS and others because KFF uses overall plan counts and not plan segments. Segments generally permit a Medicare Advantage organization to offer the “same” local plan, but may vary supplemental benefits, premium and cost sharing in different service areas (generally non-overlapping counties).

Appendix

Appendix Table 1: Availability of Medicare Advantage Plans and Insurers, by State, 2022
Appendix Table 2: Entrants and Exiting Insurers in Medicare Advantage Markets, by Plan Type and Plan Locations, 2022

Medicare Part D: A First Look at Medicare Prescription Drug Plans in 2022

Authors: Juliette Cubanski and Anthony Damico
Published: Nov 2, 2021

Issue Brief

During the Medicare open enrollment period from October 15 to December 7 each year, beneficiaries can enroll in a plan that provides Part D prescription drug coverage, either a stand-alone prescription drug plan (PDP) as a supplement to traditional Medicare, or a Medicare Advantage prescription drug plan (MA-PD), which covers all Medicare benefits, including drugs. In 2021, 48 million Medicare beneficiaries, or more than three-quarters (77%) of all Medicare beneficiaries, are enrolled in Medicare Part D plans, with half (50%) enrolled in stand-alone PDPs and the other half (50%) enrolled in Medicare Advantage drug plans. This issue brief provides an overview of the Medicare Part D marketplace in 2022 and key trends over time, focusing primarily on stand-alone PDPs. (A separate overview of the 2022 Medicare Advantage market is also available.) Unless otherwise noted, weighted estimates are based on August enrollment (see Methods box for additional details).

Highlights for 2022

  • The average Medicare beneficiary has a choice of 54 Medicare plans with Part D drug coverage in 2022, including 23 Medicare stand-alone drug plans and 31 Medicare advantage drug plans.
  • A total of 766 Medicare Part D stand-alone prescription drug plans will be offered in 2022, a 23% decrease from 2021, primarily the result of consolidations of PDP offerings sponsored by Cigna and Centene resulting in three fewer PDPs from each firm in each region.
  • The estimated average monthly premium for Medicare Part D stand-alone drug plans is projected to be $43 in 2022, based on current enrollment, while average monthly premiums for the 16 national PDPs are projected to range from $7 to $99 in 2022. Among the 16 national PDPs, average monthly premiums are increasing for 12 PDPs, including 5 PDPs with increases exceeding $10.
  • Most Part D PDP enrollees who remain in the same plan in 2022 will be in a plan with the standard (maximum) $480 deductible.
  • Most PDP enrollees will face much higher cost sharing for brands than for generic drugs, including coinsurance for non-preferred drugs between 40% and 50% (the maximum coinsurance rate allowed for the non-preferred drug tier) in 12 of the 16 national PDPs.
  • In 2022, 198 PDPs will be premium-free for enrollees receiving the Low-Income Subsidy (LIS) (benchmark plans), a smaller number than in any year since Part D started in 2006. The decrease between 2021 and 2022 is due to plan consolidations by Cigna and Centene, which offered benchmark PDPs in 2021 that will not be offered in 2022.

Part D Plan Availability

The Average Medicare Beneficiary Has a Choice of More Than 50 Medicare Plans with Part D Drug Coverage in 2022

The average Medicare beneficiary will have a choice of 23 stand-alone PDPs in 2022, 7 fewer PDP options than in 2021, a 24% decrease (Figure 1). Although the number of PDP options in 2022 is far lower than the peak in 2007 (when there were 56 PDP options, on average), beneficiaries in each state continue to have numerous stand-alone drug plan options.

In 2022, beneficiaries will also have access to 31 MA-PDs, on average, a 15% increase in MA-PD options since 2021. (This average excludes Medicare Advantage plans that do not offer the drug benefit; overall, an average of 39 Medicare Advantage plan options will be available in 2022, excluding plans not available to all beneficiaries, such as Special Needs Plans and group plans).

The Average Medicare Beneficiary Has a Choice of More Than 50 Medicare Plans Offering Drug Coverage in 2022, Including 23 Stand-alone Drug Plans and 31 Medicare Advantage Drug Plans

A Total of 766 Medicare Part D Stand-Alone Prescription Drug Plans Will Be Offered in 2022, a 23% Decrease From 2021 Primarily Due to Plan Consolidations

In 2022, a total of 766 PDPs will be offered by 16 firms in the 34 PDP regions (plus another 10 PDPs in the territories), a decrease of 230 PDPs (-23%) from 2021 (Figure 2). The relatively large decrease in the number of PDPs for 2022 is primarily the result of consolidations of plan offerings sponsored by Cigna and Centene resulting in the market exit of three national PDPs from each firm in each region (all three of Cigna’s Express Scripts PDPs and three of Centene’s six Wellcare PDPs). (Part D sponsors are limited to offering no more than three PDPs in each region.) This accounts for just over 200 PDPs offered in 2021 that will no longer be offered in 2022. Enrollees in these consolidated plans will be automatically switched to other plans offered by the same plan sponsor, although they can choose to switch into a different plan during the annual open enrollment period.

A Total of 766 Medicare Part D Stand-Alone Prescription Drug Plans Will Be Offered in 2022, a 23% Decrease From 2021 Mainly Due to Plan Consolidations

Despite the reduction in PDP availability for 2022, beneficiaries in each state will have a choice of multiple stand-alone PDPs, ranging from 19 PDPs in New York to 27 PDPs in Arizona, plus multiple MA-PDs offered at the local level (Figure 3, Table 1).

Medicare Part D Stand-Alone Prescription Drug Plan Availability in 2022, by State

The number of firms sponsoring stand-alone drug plans has declined steadily over time, from more than 40 firms in 2010 and earlier years, dropping below 25 firms beginning in 2015, and at 16 firms in 2022, is lower than in any other year since Part D started. PDP enrollment is expected to be concentrated in a small number of firms in 2022, as it has been every year. Based on August 2021 enrollment, 8 out of 10 PDP enrollees (80%) in 2022 are projected to be in PDPs operated by just four firms: CVS Health, Centene, UnitedHealth, and Humana. All four firms offer PDPs in all 34 PDP regions in 2022.

Availability of Insulin Demonstration Plans

In 2022, beneficiaries in each state will have the option to enroll in a Part D plan participating in an Innovation Center model in which enhanced drug plans cover insulin products for non-LIS enrollees at a monthly copayment of $35 in the deductible, initial coverage, and coverage gap phases of the Part D benefit. In 2022, a total of 2,159 Part D plans will participate in this model (a 32% increase over 2021, including 258 PDPs (33% of all PDPs) and 1,901 MA-PDs (38% of MA-PDs, including segmented plans). Between 7 and 10 PDPs in each region are participating in the model, in addition to multiple MA-PDs (Table 1). Based on August 2021 enrollment, 45% of non-LIS enrollees are in PDPs that will participate in the insulin model in 2022.

Part D Premiums

Average Monthly Premiums for the 16 National PDPs Are Projected to Range from $7 to $99 in 2022

The estimated national average monthly PDP premium for 2022 is projected to be $43, a 15% increase from $38 in 2021, weighted by August 2021 enrollment (Table 2). It is likely that the actual average weighted premium for 2022, after accounting for enrollment choices by new enrollees and plan changes by current enrollees, will be lower than this estimated average. CMS reported that the average premium for basic Part D coverage offered by PDPs and MA-PDs will be an estimated $33 in 2022. Our premium estimate is higher because it is based on PDPs only (excluding MA-PDs) and includes PDPs offering both basic and enhanced coverage (enhanced plans, which account for 60% of all PDPs in 2022, have higher premiums than basic plans, on average).

PDP premiums will vary widely across plans in 2022, as in previous years. Among the 16 PDPs available nationwide, average premiums will range from a low of $7 per month (or $85 annually) for SilverScript SmartRx to a high of $99 per month (or nearly $1,200 annually) for AARP MedicareRx Preferred (Figure 4, Table 2). In other words, among the 16 national PDPs, there is an $1,100 difference in annual premiums between the highest-premium PDP and the lowest-premium PDP.

Average Monthly Premiums for the 16 National Part D Stand-alone Drug Plans Are Projected to Range from $7 to $99 in 2022

Changes to premiums from 2021 to 2022, averaged across regions and weighted by 2021 enrollment, also vary widely across PDPs, as do the absolute amounts of monthly premiums for 2022. Among the 16 national PDPs, average monthly premiums are increasing for 12 PDPs, including 5 PDPs with increases exceeding $10: Wellcare Medicare Rx Value Plus (+$23, a 52% increase), Cigna Extra Rx (+$21, a 54% increase), Cigna Essential Rx (+$12, a 49% increase), Humana Premier Rx Plan (+$12, an 18% increase), and AARP Medicare Rx Preferred (+$11, a 12% increase).

Monthly premiums are increasing in 2 of the top 3 PDPs by enrollment:

  • The 1.6 million non-LIS enrollees in the largest PDP, CVS Health’s SilverScript Choice (which has a total of 3.4 million enrollees in 2021, including those receiving low-income subsidies) will see a $3 increase (+9%) in their average monthly premium, from $28 in 2021 to $31 in 2022.
  • The 1.6 million non-LIS enrollees in the second largest PDP, AARP MedicareRx Preferred, will see an $11 increase (+12%) in their average monthly premium between 2021 and 2022 from $89 to $99. This is the highest average monthly premium among the national PDPs in 2022. Part D enrollees who have been enrolled in AARP MedicareRx Preferred since 2016 and stay enrolled in 2022 will be paying nearly $40 more than in 2016, when the average monthly premium for this PDP was $61.
  • The 1.6 million non-LIS enrollees in the third largest PDP, Wellcare Value Script, will see a $4 decrease (-25%) in their monthly premium, from $16 in 2021 to $12 in 2022.

Average Monthly Premiums Are Higher for PDPs Offering Enhanced Benefits, Including Insulin at a $35 Monthly Copay, and Lower or No Deductibles

Most Part D stand-alone drug plans in 2022 (60% of PDPs) will offer enhanced benefits for a higher average monthly premium, and most non-LIS PDP enrollees (72%) are enrolled in enhanced plans, based on August 2021 enrollment. Enhanced benefits can include a lower (or no) deductible, reduced cost sharing, or a higher initial coverage limit than under the basic benefit design. The average premium in 2022 for enhanced benefit PDPs is $51, which is 44% higher than the monthly premium for PDPs offering the basic benefit ($35). For the subset of enhanced PDPs participating in the $35 copay insulin model, the average monthly premium ($63) is nearly twice as high as the monthly premium for PDPs that are not participating in the model ($34) (Figure 5).

In 2022, most PDPs (82%) will charge a deductible, including 7 in 10 PDPs (71%) charging the standard (maximum) amount of $480 in 2022. Across all PDPs, the average deductible in 2022 will be $384. The average monthly premium in 2022 for PDPs that charge no deductible is $90, nearly three times the monthly premium for PDPs that charge the standard deductible ($33) and twice as much as the monthly premium for PDPs charging a partial deductible ($45).

Average Monthly Premiums Are Higher for PDPs Offering Enhanced Benefits, Including Insulin at a $35 Monthly Copay, and Lower or No Deductibles

Nearly Three-Fourths of Part D Stand-alone Drug Plan Enrollees Without Low-income Subsidies Will Pay Higher Premiums in 2022 If They Stay in Their Current Plan

Most Part D stand-alone plan enrollees – nearly 10 million of the 13.3 million Part D PDP enrollees who are responsible for paying the entire premium (which excludes Low-Income Subsidy (LIS) recipients) (73%) – will see their monthly premium increase in 2022 if they stay in their same plan, while 3.5 million (27%) will see a premium reduction if they stay in their same plan (Figure 6).

While the average weighted monthly PDP premium is increasing by $5 between 2021 and 2022 (from $38 to $43), nearly 4 million non-LIS enrollees (28%) will see a premium increase of $10 or more per month. Substantially fewer non-LIS enrollees (0.2 million, or 2%) will see a premium reduction of the same magnitude. More than one-third (35%) of non-LIS enrollees (4.7 million) are projected to pay monthly premiums of at least $60 if they stay in their current plans, including 1.3 million (9% of non-LIS enrollees) projected to pay monthly premiums of at least $100. This group includes enrollees in the AARP MedicareRx Preferred PDP in several regions, along with enrollees in several Blue Cross/Blue Shield PDPs and other PDPs that are offered in selected regions but not nationwide.

Nearly Three-Fourths of Part D Stand-alone Drug Plan Enrollees Without Low-income Subsidies Will Pay Higher Premiums in 2022 If They Stay in Their Current Plan

Part D Cost Sharing

Part D Enrollees Pay Much Higher Cost Sharing for Brands and Non-preferred Drugs Than for Generic-Tier Drugs, and a Mix of Copays and Coinsurance for Different Formulary Tiers

In 2022, as in prior years, Part D enrollees will face much higher cost-sharing amounts for brands and non-preferred drugs (which can include both brands and generics) than for drugs on a generic tier, and a mix of copayments and coinsurance for different formulary tiers. The typical five-tier formulary design in Part D includes tiers for preferred generics, generics, preferred brands, non-preferred drugs, and specialty drugs.

Among all PDPs, median standard cost sharing in 2022 is $0 for preferred generics and $5 for generics, $42 for preferred brands (an increase from $40 in 2021), 40% coinsurance for non-preferred drugs (the same as in 2021; the maximum allowed is 50%), and 25% coinsurance for specialty drugs (the same as in 2021; the maximum allowed is 33%) (Figure 7, Table 3).

Figure 7: In 2022, Part D Enrollees Will Pay Much Higher Cost-Sharing Amounts for Brands and Non-preferred Drugs than for Drugs on a Generic Tier, and a Mix of Copays and Coinsurance for Different Formulary Tiers

Plans are implementing a mix of cost-sharing changes for 2022, with both increases and decreases in cost-sharing amounts on various formulary tiers. Of note, however, are cost-sharing increases for non-preferred drugs in 6 of the 16 national PDPs (while decreasing in only 2 of the 16). In 12 of the 16 national PDPs, coinsurance amounts for non-preferred drugs will range from 40% to 50% (the maximum allowed for this tier) in 2022. In addition, enrollees in the top PDP by enrollment, SilverScript Choice, will see their cost sharing for preferred brands shift from a $35 flat copayment to a 17% coinsurance rate, which could mean higher out-of-pocket costs for drugs priced over $206 per 30-day supply, since 17% of this amount or more would exceed the flat $35 copayment. And paying coinsurance rather than flat copayments makes it more difficult to know in advance what actual out-of-pocket costs will be, since that depends on the underlying list price of the drug.

Low-Income Subsidy Plan Availability

In 2022, a Smaller Number of Part D Stand-Alone Drug Plans Will Be Premium-Free to Enrollees Receiving the Low-Income Subsidy (Benchmark Plans) Than in Any Other Year

Through the Part D LIS program, enrollees with low incomes and modest assets are eligible for assistance with Part D plan premiums and cost sharing. As of March 2021, approximately 13 million Part D enrollees are receiving LIS, including 6.8 million (53%) in MA-PDs and 6.0 million (47%) in PDPs.

In 2022, a smaller number of PDPs will be premium-free benchmark plans – that is, PDPs available for no monthly premium to Medicare Part D enrollees receiving the Low-Income Subsidy (LIS) – than in any year since Part D started in 2006, with 198 premium-free benchmark plans, or roughly a quarter of all PDPs in 2022 (Figure 8). The reduction in benchmark plan availability between 2021 and 2022 is the result of plan consolidations by Cigna and Centene; one of Cigna’s Express Scripts PDPs and one of Centene’s Wellcare PDPs that will not be offered in 2022 were benchmark PDPs in all regions in 2021.

In 2022, 198 Part D Stand-Alone Drug Plans Will Be Available Without a Premium to Enrollees Receiving the Low-Income Subsidy (“Benchmark” Plans), a Substantial Reduction from 2021

On average (weighted by Medicare enrollment), LIS beneficiaries have six benchmark plans available to them for 2022, which is about one-fourth the average number of PDP choices available overall and the lowest average number of benchmark plan options in any year since Part D started. All LIS enrollees can select any plan offered in their area, but if they enroll in a non-benchmark plan, they must pay some portion of their chosen plan’s monthly premium. In 2022, 13% of all LIS PDP enrollees who are eligible for premium-free Part D coverage (0.8 million LIS enrollees) will pay Part D premiums averaging $27 per month unless they switch or are reassigned by CMS to premium-free plans.

The number of benchmark plans available in 2022 will vary by region, from four to nine (Table 1). In 2022, 91% of the 6.0 million LIS PDP enrollees are projected to be in PDPs operated by five firms: CVS Health, Centene, Humana, UnitedHealth, and Cigna (based on August 2021 enrollment).

Discussion

Our analysis of the Medicare Part D stand-alone drug plan landscape for 2022 shows that millions of Part D enrollees without low-income subsidies will face premium and other cost increases in 2022 if they stay in their current stand-alone drug plan. There are somewhat fewer stand-alone PDP options available nationwide in 2022, but still dozens of drug plan choices available to beneficiaries in each area during this year’s open enrollment period, including both PDPs (23 plans, on average) and Medicare Advantage drug plans (31 MA-PD plans, on average). There are also fewer benchmark plan options for Part D enrollees receiving Low-Income Subsidies. A narrower set of benchmark plan options could make it more difficult for some LIS enrollees to find a premium-free plan that covers all their prescription medications.

Some Part D stand-alone drug plan enrollees who choose to stay in their current plans may see lower premiums and other costs for their drug coverage, but nearly three-fourths of non-LIS PDP enrollees will face higher premiums if they remain in their current plan, and many will also face higher deductibles and cost sharing for covered drugs. Most Part D PDP enrollees who remain in the same plan in 2022 will be in a plan with the standard (maximum) $480 deductible and will face much higher cost sharing for brands than for generic drugs, including as much as 50% coinsurance for non-preferred drugs. Some beneficiaries could see overall cost savings, including the monthly premium, deductible, and cost sharing, if they switched to a lower-premium plan, while for other beneficiaries, a higher-premium plan might better meet their needs at a lower overall total cost.

Despite these year-to-year changes in plan coverage and costs, as well as changes in beneficiaries’ health needs, other KFF analysis finds that most Medicare beneficiaries did not compare plans during a recent open enrollment period, and most Part D enrollees did not compare the coverage offered by their drug plan to other drug plans. Comparing and choosing among the wide array of Part D plans can be difficult, given that plans differ from each other in multiple ways beyond premiums, including cost sharing, deductibles, covered drugs, and pharmacy networks. Comparing Medicare Advantage drug plans may be made more difficult by the fact that not only drug coverage varies but also other features, including cost sharing for medical benefits, provider networks, and coverage and costs for supplemental benefits. Because Part D plans differ in several ways that can have a significant effect on an enrollee’s access to medications and out-of-pocket drug spending, all Part D enrollees could benefit from the opportunity to compare plans during open enrollment.

Juliette Cubanski is with KFF. Anthony Damico is an independent consultant.

Methods

This analysis focuses on the Medicare Part D stand-alone prescription drug plan marketplace in 2022 and trends over time. The analysis focuses on the 19.5 million enrollees in stand-alone PDPs, as of March 2021. The analysis excludes 21.3 million MA-PD enrollees (non-employer), and another 4.4 million enrollees in employer-group only PDPs and 2.8 million in employer-group only MA-PDs for whom plan premium and benefits data are unavailable.

Data on Part D plan availability, enrollment, and premiums were collected from a set of data files released by the Centers for Medicare & Medicaid Services (CMS):

  • Part D plan landscape files, released each fall prior to the annual enrollment period
  • Part D plan and premium files, released each fall
  • Part D plan crosswalk files, released each fall
  • Part D contract/plan/state/county level enrollment files, released monthly
  • Part D Low-Income Subsidy enrollment files, released each spring
  • Medicare plan benefit package files, released each fall

In this analysis, premium and deductible estimates are weighted by August enrollment unless otherwise noted. Percentage increases are calculated based on non-rounded estimates and in some cases differ from percentages calculated based on rounded estimates presented in the text.

Tables

Table 1: Medicare Part D Stand-alone Prescription Drug Plans, Benchmark Plans, Insulin Model Plans, and Monthly Premiums, 2021 and 2022
Table 2: National Medicare Part D Stand-alone Prescription Drug Plans in 2022
Table 3: Median Standard Cost-Sharing Amounts in National Medicare Part D Stand-alone Prescription Drug Plans, 2021 and 2022
News Release

Dobbs v. Jackson Women’s Health: State Asks Supreme Court to Overturn Roe v. Wade

New KFF Explainer Explores Potential Rulings and Impact

Published: Nov 2, 2021

On December 1, the Supreme Court will hear their first abortion case that could overturn Roe v. Wade, with a solid conservative majority. The case, Thomas E. Dobbs, State Health Officer of the Mississippi Department of Health v. Jackson Women’s Health Organization, involves a Mississippi law banning nearly all abortions over 15 weeks gestational age. Mississippi is asking the Supreme Court to overturn Roe v. Wade, and therefore overturn the constitutional right to abortion that was established in the 1973 decision.

A new KFF assessment explains the origins of the case, addresses the intersections with the litigation that has arisen from S.B. 8, the Texas 6-week abortion ban, and explores the potential outcomes of the Mississippi case and how it could impact access to abortion in states across the nation.

Ten Changes to Watch in Open Enrollment 2022

Author: Karen Pollitz
Published: Oct 29, 2021

Even as the ninth annual Open Enrollment period gets underway, the Affordable Care Act (ACA) Marketplaces continue to evolve and important changes are expected.  Keep an eye on:

1. Open enrollment dates are changing

In most states, the Open Enrollment period will be longer this time.  In recent years, in the HealthCare.gov states, it has lasted only 6 weeks; but now it will run from November 1, 2021 through January 15, 2022.  That said, people should still sign up by December 15 if they want coverage to take effect on January 1.  Signing up later generally means coverage will start February 1. State-run marketplaces have flexibility to hold even longer OE periods and some will do so.

2. Plan choices and premiums will change in 2022

As happens every year, premiums for marketplace plans will change somewhat in 2022.  In HealthCare.gov states, the average benchmark plan premium will be about 3% lower than in 2021, while in some state-based marketplaces, qualified health plan premiums will increase modestly, on average.

In addition, the number of insurers participating in the marketplace will increase in 2022.  In HealthCare.gov states, 32 additional insurers will offer marketplace coverage, bringing the total to 213.  Competition by insurers can sometimes change the so-called benchmark plan (the second-lowest cost silver plan, on which marketplace subsidies are based) if a new silver plan earns this designation in 2022.  On average, consumers in HealthCare.gov states will have a choice of nearly 83 qualified health plans in 2022, compared to an average of 46 plans in 2021.

3. Improved marketplace subsidies continue and will reduce net premiums for most consumers

Expanded marketplace premium subsidies, enacted under the American Rescue Plan Act (ARPA), took effect in 2021 and remain in effect for 2022.  The dollar amount of premium tax credits increased and now fully cover the cost of enrolling in the benchmark silver plan for consumers with income up to 150% FPL.  Before, consumers at 150% FPL had to pay more than 4% of household income for the benchmark plan. For people up to 150% FPL, cost sharing subsidies also substantially reduce deductibles and copays under zero-premium silver plans, making them similar to platinum plans.

ARPA also extended eligibility for premium tax credits to reach people with income over 400% FPL ($51,520 for a single person in 2022, $87,840 for family of 3).  Now these consumers must contribute no more than 8.5% of income toward the benchmark silver plan.  Before, for older consumers, the age-rated premium for benchmark plans could easily cost more than 20% of household income.  ARPA premium tax credit changes are temporary, ending after 2022, although legislation to make them permanent is pending in Congress.

The KFF subsidy calculator helps people estimate the amount of financial assistance based on their age, income, family size, and zip code.

In most states, if enrollees have not updated their application and plan selection for 2022, the marketplace may auto-re-enroll them in their current plan or a similar plan for the coming year.  Over the last three Open Enrollment periods, about 40% of returning marketplace participants were auto-re-enrolled. However, passively renewing can sometimes put consumers at a disadvantage.  For example, if the benchmark plan changes from one year to the next (e.g., due to entrance of new insurers), the dollar value of tax credits, which are tied to the cost of the benchmark plan, can also change.  That means someone now enrolled in the 2021 benchmark plan who is passively renewed could see unexpected monthly premium cost increases if another plan gains benchmark status in 2022 and costs less.

Enrollees who did not take advantage of new ARPA subsidies when those subsidies came online this year could also miss out if they don’t actively renew.  While the marketplace automatically adjusted subsidies for many current enrollees at the end of the COVID-SEP, it could not apply more help to people already in zero-premium bronze plans.  More than 800,000 HealthCare.gov enrollees were in zero-premium bronze plans at the end of Open Enrollment for 2021, and many of them would be better off in silver plans with the new ARPA subsidies.  All marketplace enrollees are encouraged to update their application during Open Enrollment, even if personal circumstances have not changed, so they can see all current plan and financial assistance options. Otherwise, the extended Open Enrollment will leave a short window (until January 15) when consumers can still make changes.

5. People with very low income will have added time to enroll

Starting in 2022, HealthCare.gov will allow enrollment throughout the year for people with income up to 150% of the federal poverty level (or FPL, which is $19,320 per year for a single person in 2022, $32,940 for family of 3).  A new special enrollment opportunity will be offered each month, and as noted above, plan choices will include zero-premium plans with vastly reduced deductibles.  To sign up during the year, people can attest to having 2022 income at or below 150% FPL, then continue with their application.  The marketplace will conduct real-time income verification, as it does for all applicants, and might ask for additional documentation to be submitted within 90 days.  This year, HealthCare.gov will ask for documentation when consumers estimate their 2022 income will be substantially lower (by 50% or $12,000, whichever is greater) than the amount reported on their most recent federal income tax return.

Extended enrollment could benefit millions of people.  At the end of the last Open Enrollment, roughly 1/3 of marketplace participants had income at or below the 150% FPL threshold; and during the recent COVID enrollment opportunity in 2021, 45% of people signing up in HealthCare.gov states (22% in state marketplaces) had incomes at or below this threshold. Open Enrollment remains the best time to sign up for year-long coverage, but the added enrollment opportunities will make it easier for people to sign up for premium-free plans with low cost-sharing throughout the year.

6. More enrollment help will be available

In HealthCare.gov states, funding for Navigators has been restored following years of substantial funding cuts averaging 84%.  Navigators are trained enrollment experts, certified by the marketplace, who provide free help to individuals shopping for marketplace coverage and subsidies, or help signing up for Medicaid and CHIP. Twice as many programs will be available in 2022, with more resources to serve consumers, including extended hours, remote assistance, and language translation services.  The “Find Local Help” link on HealthCare.gov provides contact information and hours of operation for the nearest programs.

7. Three new state-run marketplaces will open

This fall 3 states – Kentucky, Maine, and New Mexico – are launching state-based marketplaces.  Some 173,000 residents of these states already enrolled in plans through HealthCare.gov will have their data transferred to the new state marketplace and receive instructions for accessing their accounts and enrolling in 2022 coverage.

8. New surprise medical bills protection will take effect

Most marketplace plans are HMOs or EPOs with closed provider networks, meaning they generally will not cover non-emergency care from an out-of-network provider; and even when plans do cover out-of-network claims, consumers can face “balance billing” charges in excess of what their plan will pay. That will change next year when a new federal law starts protecting consumers from surprise medical bills.  Beginning January 1, all insurance plans, including marketplace plans, must cover emergency services (other than ground ambulance) at the in-network rate, and out-of-network emergency room facilities and doctors will not be allowed to bill patients more than the in-network cost sharing amount under their plan.  These protections will also apply for non-emergency care received by patients while at in-network hospitals, ambulatory surgery centers, or other facilities.

9. Some recent changes have changed back

This year, it will again be important for consumers to carefully estimate their 2022 income when they apply for marketplace subsidies.  Thanks to a temporary repayment holiday enacted as part of pandemic relief legislation, people who filed their 2020 tax return this spring did not have to repay any excess 2020 premium tax credit; but the repayment requirement is now back in force.  Marketplace consumers who under-estimate their 2022 income risk owing more taxes if they claim excess premium tax credits during the year.  If people do experience a significant change in their 2022 income after they’ve signed up, they should update their marketplace account as soon as possible to avoid receiving excess subsidies.

Another key change this year reversed Trump Administration revisions to the “public charge” rule that would have made it harder for immigrants to enter or stay in the U.S. if they needed public assistance to obtain health coverage.  That action deterred many people from applying for or remaining enrolled in health coverage for fear this could impact their immigration status.  This year the Biden Administration rescinded the Trump Administration changes to the public charge rule.  Now, under current rules, immigration officials will not consider enrollment in Marketplace, CHIP, or Medicaid coverage as part of a public charge test when people apply for a green card.

10. Will New Enrollment Records Be Set?

Marketplace enrollment reached a record high of 12.2 million people as the special COVID enrollment period ended in most states in August 2021.  Affordability gains due to expanded subsidies, as well as outreach and enrollment assistance, likely contributed to this result.  Even so, an October 2021 KFF poll found that only 1 in 4 people who are uninsured or who buy their own health insurance checked to see if they qualified for more help once the ARPA subsidy improvements became available.  Shortly after ARPA’s enactment, KFF estimated nearly 11 million uninsured Americans were eligible for but not enrolled in subsidized marketplace plans, including 1.4 million who became newly eligible for marketplace subsidies.  These uninsured individuals, including those eligible for zero-premium plans, disproportionately have a high school education or less, are Hispanic, young adults, live in rural areas, or lack Internet access at home. It remains to be seen during this next Open Enrollment whether additional time and enrollment help, and expanded financial help yields even more signups.