KFF designs, conducts and analyzes original public opinion and survey research on Americans’ attitudes, knowledge, and experiences with the health care system to help amplify the public’s voice in major national debates.
The share of nursing home staffers who have been fully vaccinated against COVID-19 varies considerably by state, from 70 percent in Ohio to 99 percent in Maine, Rhode Island, New York and Massachusetts, a new KFF analysis finds. The national average is 84 percent.
The analysis of federal nursing home data for the week ending Jan. 30 comes as providers strive to comply with a federal mandate that health care workers whose employers participate in Medicare or Medicaid be vaccinated against the novel coronavirus. Although some states have sued to challenge this rule, the Supreme Court recently let it go into effect.
Facilities in different states have different deadlines to comply with the mandate, in part due to ongoing state litigation challenging the federal rule. Deadlines for workers to have received their first dose ranged from January 27 to February 21, depending on the state. States with earlier deadlines generally reported higher completed staff vaccination rates than states with later deadlines.
Facilities won’t face enforcement action from the Centers for Medicare and Medicaid Services if more than 80 percent of their staff receive their first dose by their deadline, and they have a plan to achieve a 100 percent single-dose staff vaccination rate within 60 days.
The analysis is based on 10,627 nursing homes reporting complete vaccination data, or about 70 percent of all nursing homes nationally.
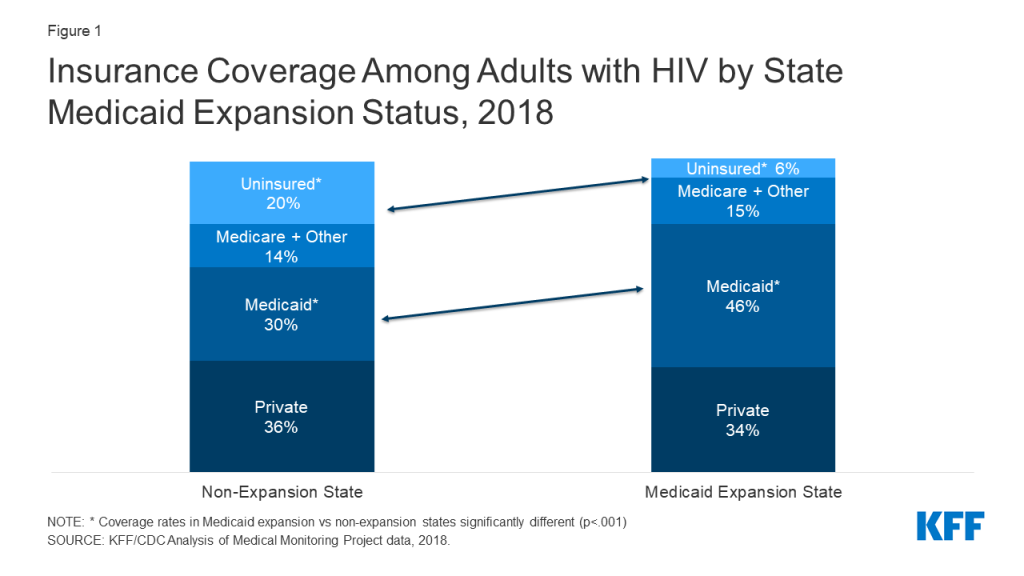
People with HIV living in the 12 states that have not adopted the Medicaid expansion face limited access to health coverage. In 2018, across sampled states, 20% of people with HIV living in non-expansion states were uninsured compared to 6% in expansion states, and those in expansion states were more likely to have Medicaid coverage (46% v 30%). Moreover, some adults with incomes below 100% of the federal poverty level (FPL) in non-expansion states fall into the “coverage gap”, where they do not qualify for Medicaid through an existing pathway and are not eligible for marketplace subsidies.
Figure 1: Insurance Coverage Among Adults with HIV by State Medicaid Expansion Status, 2018
One provision in the Build Back Better Act (BBBA), as passed by the House of Representatives, aims to temporarily close the coverage gap, although its prospects are uncertain as negotiations continue in the Senate. It would temporarily create new coverage opportunities, including by providing a low-cost (with zero premiums) marketplace alternative for those with incomes below 100% FPL who are not otherwise eligible for Medicaid. The BBBA includes a provision to encourage states that have already expanded to maintain that status. In addition, the BBBA would also enhance cost-sharing subsidies provided under the American Rescue Plan Act (ARPA) to those with incomes between 100-138% FPL.
In this analysis, we explore the implications of the BBBA’s current coverage provisions for people with HIV in select non-expansion states. We estimate the size of the population that could gain eligibility as well as their socio-demographic characteristics and examine their affordability barriers, compared to people with HIV overall. We also discuss the implications of such policy changes for the Ryan White HIV/AIDS Program, the nation’s HIV safety-net program. To do so, we used data from the Centers for Disease Control’s and Prevention’s (CDC) Medical Monitoring Project (MMP), a surveillance system which produces national and state-level representative estimates of behavioral and clinical characteristics of adults with diagnosed HIV in the United States. The MMP sample includes five of the twelve non-expansion states – Florida, Georgia, Mississippi, North Carolina, and Texas – which together account for about 84% of people living with diagnosed HIV in non-expansion states.
We defined the group who could benefit from key BBBA coverage provisions as non-elderly adults with HIV with incomes below 139% FPL who were either uninsured or had health coverage other than from Medicaid or Medicare. Notably, this is the same population that could gain eligibility for coverage if their states expanded their Medicaid programs. (See Methodology for detail.)
Findings
Overall, we find that an estimated 55,132 (or 23%) of non-elderly individuals with HIV in sampled non-expansion states could gain eligibility for new or enhanced subsidies under the BBBA. This is also the population that could gain Medicaid eligibility, if these states expanded their programs. The share ranges by state, from an estimated 18% in both North Carolina and Georgia to 28% in Texas. (See Table 1.)
Table 1: Estimated Percent and Number of People with HIV Who Could Gain Coverage Eligibility, by State
State
Percentage
Estimated Number
Florida
22%
20,561
Georgia
18%
8,556
Mississippi
22%
1,783
North Carolina
18%
4,328
Texas
28%
19,905
Overall
23%
55,132
How this 23% could be impacted by BBBA is as follows. As noted, the BBBA would provide those with incomes below 100% FPL, including uninsured people in the coverage gap, with marketplace subsidies and cost-sharing assistance, making private insurance premiums free and cost-sharing minimal. We estimate that approximately 47,078 (or 16%) of non-elderly adults with HIV in the sampled non-expansion states would become eligible for this provision. BBBA would also enhance subsidies for those 100-138% FPL and we estimate beyond this 16%, an additional 7% of non-elderly people with HIV in non-expansion states would be eligible for these enhanced subsidies. Notably, BBBA provisions are temporary, and set to expire in 2025 unless renewed. Under a scenario where all sampled states expanded their Medicaid program, the full 23% of non-elderly people with HIV could gain Medicaid eligibility.
Characteristics of people with HIV who could gain eligibility for new or enhanced coverage
Non-elderly people with HIV in these states who could gain new coverage eligibility, including enhanced subsidies under the BBBA or through Medicaid expansion, are more likely to be under 50 years old, people of color, and uninsured compared to non-elderly people with HIV overall (Table 2):
66% are under 50 years old (compared to 52% of all non-elderly people with HIV)
86% are non-White, including 55% who are Black/African American (compared to 72% and 42% of all non-elderly people with HIV)
59% are uninsured (compared to 26% of all people with HIV), 26% have any private insurance, of which 32% have marketplace coverage (compared to 61% and 18%, respectively, of all non-elderly people with HIV) and 15% have other coverage (similar to the 13% among all non-elderly people with HIV)
Table 2: Characteristics of Non-elderly People with HIV Who Could Gain New or Enhanced Coverage Eligibility and Characteristics of All Non-elderly People with HIV
Characteristic
Potentially Eligible People with HIV in Non-expansion States
All Non-elderly People with HIV
Age: Under 50
66%
52%
Race/ethnicity: BIPOC
86%
72%
Insurance Coverage: Uninsured
59%
26%
Insurance Coverage: Any private
Of which is Marketplace
26%
32%
61%
18%
Insurance Coverage: Other coverage apart from Medicare
15%
13%
Addressing Affordability Barriers
Potentially eligible people with HIV in sampled non-expansion states are more likely to face certain affordability barriers compared to people with HIV overall. Approximately one in three (31%) of those in this potentially eligible group report being unable to pay health care bills during the past 12 months and 30% say they currently have unpaid medical bills. By comparison, 20% of non-elderly adults with HIV overall report being unable to pay health care bills during the past 12 months and 23% report they currently have unpaid medical bills. Smaller but comparable shares of those potentially eligible and people with HIV overall say they have taken the following measures to save money on medication: Skipped doses (8% v 6%), took less medicine than prescribed (7% v 6%), delayed filling a prescription (11% v 8%), asked a doctor for lower cost medication (10% for both), or used alternative therapies (6% v 4%). (Table 3.)
Table 3: Health Care Affordability Challenges Among People with HIV Who Could Gain New or Enhanced Coverage Eligibility and Characteristics of All Non-elderly People with HIV
Characteristic
Potentially Eligible People with HIV in Non-expansion States
All Non-elderly People with HIV
Inability to pay healthcare bills
31%
20%
Currently have unpaid medical bills
30%
23%
Skipped doses to save money
8%
6%
Took less medicine to save money
7%
6%
Delayed filling prescription to save money
11%
8%
Asked doctor for lower cost medication to save money
10%
10%
Used alternative therapies to save money
6%
4%
The Ryan White HIV/AIDS Program
The Ryan White HIV/AIDS Program plays a key role in the lives of about half of all people with HIV in the U.S., and an especially important role in providing HIV care and treatment for those in non-expansion states in the coverage gap. We find that seventy percent (70%) of those who could gain new coverage opportunities under BBB or Medicaid expansion currently receive support from Ryan White, compared to 46% of non-elderly people with HIV overall, with Ryan White supporting a range of outpatient HIV services including medications although it cannot pay for non-HIV care. As such, if this group gains coverage, it could mean that state programs could shift limited Ryan White resources to expand support services that were not possible to finance in the past. In fact, people with HIV with all insurance coverage types and Ryan White experience higher rates of sustained viral suppression (an indicator for health and preventing transmission) than those with only insurance coverage and no support from the program, in large part due to these supportive, wrap around services.
Discussion
We estimate that if the BBBA, as passed by the House, was enacted almost a quarter (23%) of non-elderly people with HIV in select non-expansion states could become eligible for these new coverage opportunities. This is the same share estimated to become eligible through Medicaid expansion which could be a potentially more stable coverage pathway given the currently time limited nature of the BBBA. Given high rates of uninsurance among people with HIV in non-expansion states and the prevalence of problems with medical bills, coverage gains could improve health access and affordability. And since people with HIV in non-expansion states are disproportionally people of color, new coverage opportunities could also help to address health disparities at the intersection of HIV and race/ethnicity. Coverage expansions through either pathway (the BBBA or Medicaid expansion) may also relieve the Ryan White Program from financing HIV care and treatment, allowing it to provide more robust support services, which could lead to improved care outcomes for people with HIV. In addition, a shift to coverage could mean that those previously in without affordable insurance could access care for non-HIV care needs that in the past would have not been addressed through the Ryan White Program.
Acknowledgments
The authors wish to thank Dr. Sharoda Dasgupta, Dr. Linda Beer, Tamara Carree, and Stacy Crim of the Centers for Disease Control and Prevention (CDC), who were instrumental in this work in providing access to data, guidance, and conducting statistical analysis.
This work was supported in part by the Elton John AIDS Foundation. We value our funders. KFF maintains full editorial control over all of its policy analysis, polling, and journalism activities.
Methodology
Data on people with HIV are based on 2018 and 2019 data cycles from the Medical Monitoring Project (MMP), a Centers for Disease Control and Prevention (CDC) surveillance system which produces national and state-level representative estimates of behavioral and clinical characteristics of adults with diagnosed HIV in the United States.
MMP employs a two-stage, complex sampling design. First, jurisdictions are selected from all U.S. states, the District of Columbia, and Puerto Rico using a probability proportional to size sampling strategy based on AIDS prevalence at the end of 2002, such that areas with higher prevalence had a higher probability of selection. Next, adults (aged 18 years and older) with diagnosed HIV were sampled from selected jurisdictions from the National HIV Surveillance System (NHSS), a census of US persons with diagnosed HIV. During 2018 and 2019, data come from: California (including the separately funded jurisdictions of Los Angeles County and San Francisco), Delaware, Florida, Georgia, Illinois (including the separately funded jurisdiction of Chicago), Indiana, Michigan, Mississippi, New Jersey, New York (including the separately funded jurisdiction of New York City), North Carolina, Oregon, Pennsylvania (including the separately funded jurisdiction of Philadelphia), Puerto Rico, Texas (including the separately funded jurisdiction of Houston), Virginia, and Washington.
Data used in this analysis were collected via telephone or face-to-face interviews and medical record abstractions during the following periods:
2018 data was collected between June 1, 2018 – May 31, 2019
2019 data was collected between June 1, 2019–May 31, 2020
The response rate was 100% at the first stage, and was 45% for each of the 2 cycles included in this analysis. Data were weighted based on known probabilities of selection at state or territory and patient levels. In addition, data were weighted to adjust for non-response using predictors of person-level response, and post-stratified to NHSS population totals by age, race/ethnicity, and sex at birth. This analysis includes information on 7,037 non-elderly adults (those under 65 years of age) with HIV. Data presented on non-expansion states are representative of only those states sampled.
Analysis
For all non-elderly respondents in MMP, we examined self-reported insurance coverage. Response options included insurance programs (Medicaid, Medicare, private insurance – employer and marketplace -, Ryan White HIV/AIDS Program – Ryan White or the AIDS Drug Assistance Program-, Veteran’s Administration, Tricare or CHAMPUS coverage, other public insurance, and other unspecified insurance). “Other specify” responses were recoded to reflect the most accurate coverage type when possible.
We estimated weighted percentages of individuals with the following types of health care coverage: no coverage (uninsured), private insurance (with breakouts for employer coverage and marketplace coverage), Medicaid, Medicare, and other. Because respondents in MMP may indicate more than one type of coverage, we relied on a hierarchy to group people into mutually exclusive coverage categories. After removing people with any Medicaid or Medicare coverage, we categorized people into coverage according to the following hierarchy:
Private coverage overall (with non-mutually exclusive breakouts for employer coverage and marketplace coverage)
Other public coverage, including Tricare/CHAMPUS, Veteran’s Administration, or city/county coverage
Uninsured
In most cases, this hierarchy classified individuals according to the coverage source that served as their primary payer. People who did not report any of the sources of insurance coverage were classified as uninsured.
Medicaid expansion status was identified based on KFF data. While Virginia was a non-expansion state during half of the 2018 cycle, it expanded its program and coverage became effective January 2019. Virginia was coded here as an expansion state given the forward-looking nature of this analysis.
People with HIV in non-expansion states were identified as potentially eligible for BBB assistance or Medicaid based on their state of residence, if they were under the age of 65, had incomes between 0-138% FPL, and had insurance other than Medicare or Medicaid or were uninsured. Build Back Better eligibility was also assessed to capture the estimated number and share in the coverage using the same criteria but with the poverty threshold being 0-99% FPL.
Limitations
Although MMP is based on a probability sample that allows for reporting of nationally representative estimates of characteristics among people with HIV, people were not sampled with respect to Medicaid expansion status of their state of residence. Therefore, the Medicaid expansion and non-expansion coverage data presented here are representative only of the subset of states sampled that fell into each group. Insurance coverage data is self-reported by respondents and not verified. Receipt of Ryan White support is also self-reported. By relying on a hierarchy to group individuals into coverage categories, it is possible individuals were grouped into a coverage category that was not their dominant payer over the course of a year. We were unable to identify immigrants who would be ineligible for Medicaid based on immigration status but previous work suggests this percentage is likely small and would not have substantially impacted estimates. In addition, some people who are currently uninsured may already be eligible for Medicaid or other coverage. However, we expect that share to be low for several reasons. First, even prior to Medicaid expansion opportunities becoming available, the disability pathway was the most common way people with HIV became eligible for Medicaid coverage. All five states sampled use autoenrollment for people with SSI therefore limiting those eligible but not enrolled in the program. Second, Ryan White acts of payer of last resort and grantees are required to regularly assess clients for eligibility for health coverage. Given that 82% of uninsured people receive Ryan White support and the majority of the potentially eligible group identified here are uninsured, the program would likely have already identified potential coverage opportunities and assisted with enrollment, including through Medicaid, where possible. It is also important to note that respondents may not be aware of all the services they receive that are paid for by the Ryan White HIV/AIDS Program (the program provides funding directly to service organizations in many cases) and therefore, the estimates of the number of individuals who receive Ryan White HIV/AIDS Program services is likely an underestimate.
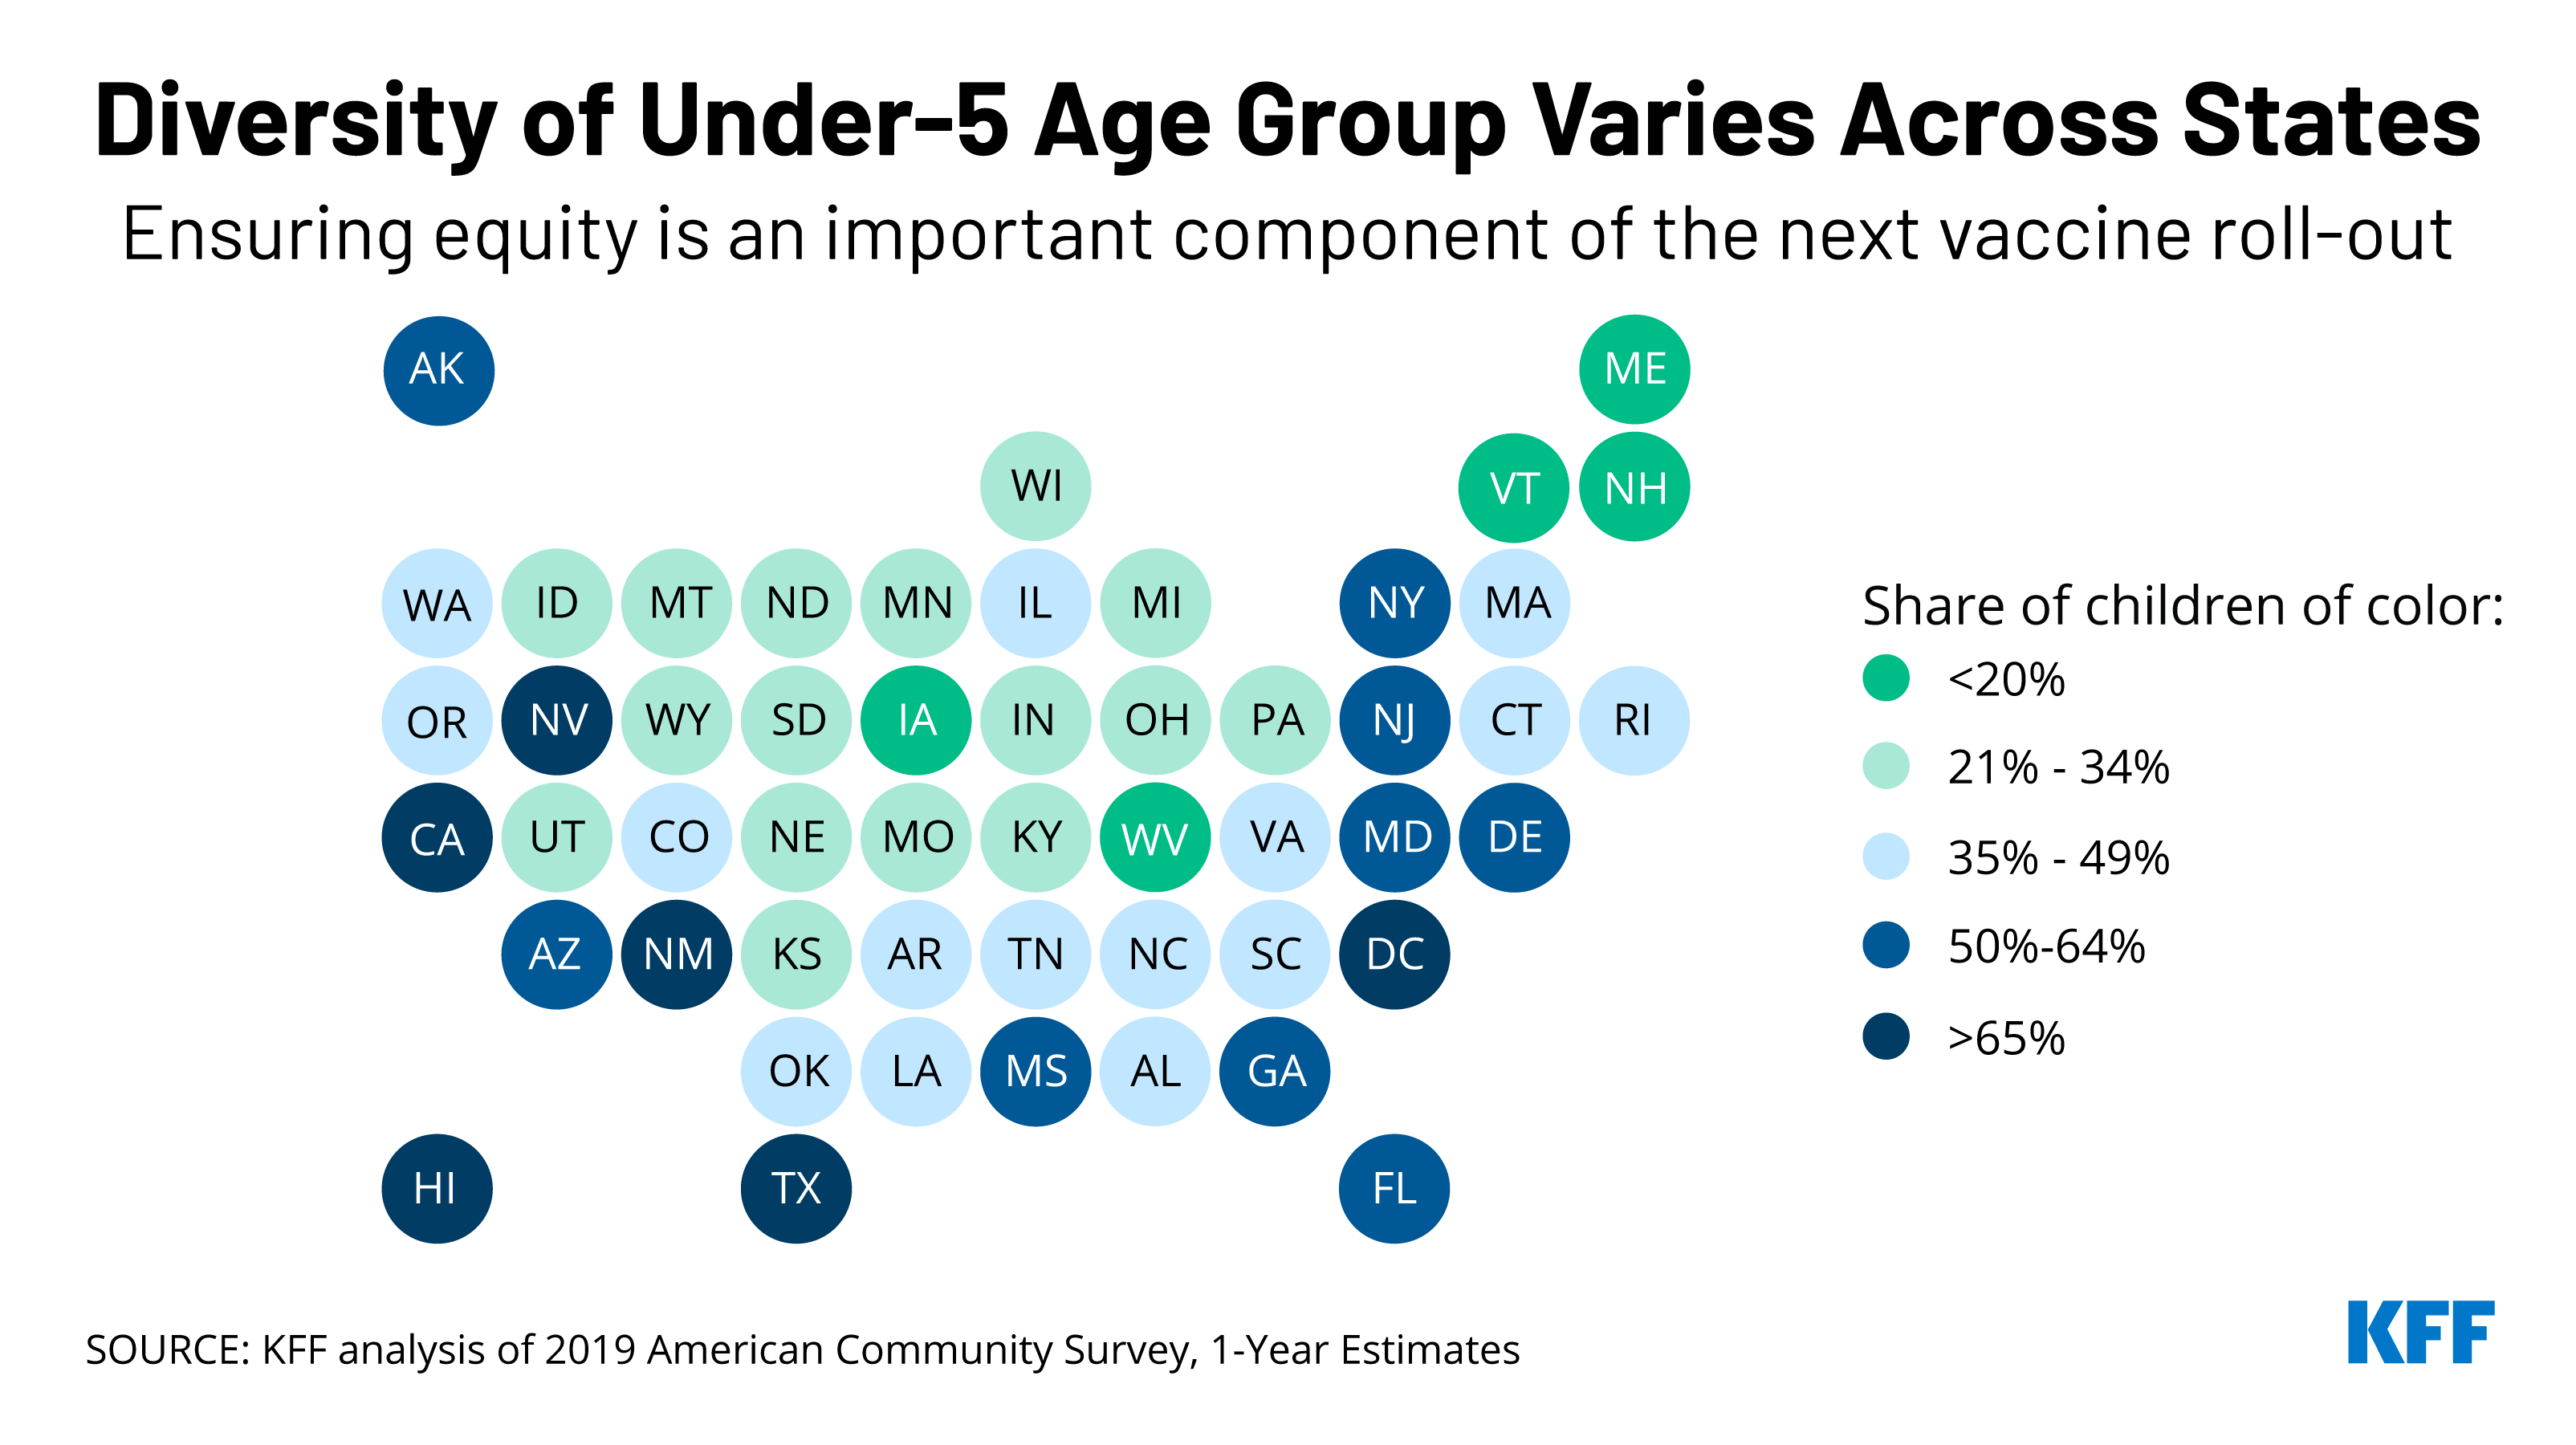
Prioritizing equity will be a key component of the anticipated rollout of Pfizer’s COVID-19 vaccine to children under 5 years old, which could be authorized as early as next week. Of the 19 million children under 5 in the United States, half are children of color, making this group more diverse than the U.S. population overall (40%).
There is also significant variation across the country. In five states and Washington, DC, children of color account for at least two-thirds of all children in this age group: Hawaii, New Mexico, California, Texas, and Nevada. In eight other states, the share is above half: Arizona, Florida, Maryland, Georgia, New Jersey, New York, Delaware, and Mississippi.
While Black and Hispanic people during the pandemic have been less likely than their White counterparts to have received a COVID-19 vaccine, racial disparities in vaccination rates have narrowed over time and have closed for Hispanic people. Our recent brief on the upcoming vaccination roll-out to young children discusses the importance of addressing potential access barriers and enlisting trusted community messengers to mitigate similar disparities in vaccination rates among this group.
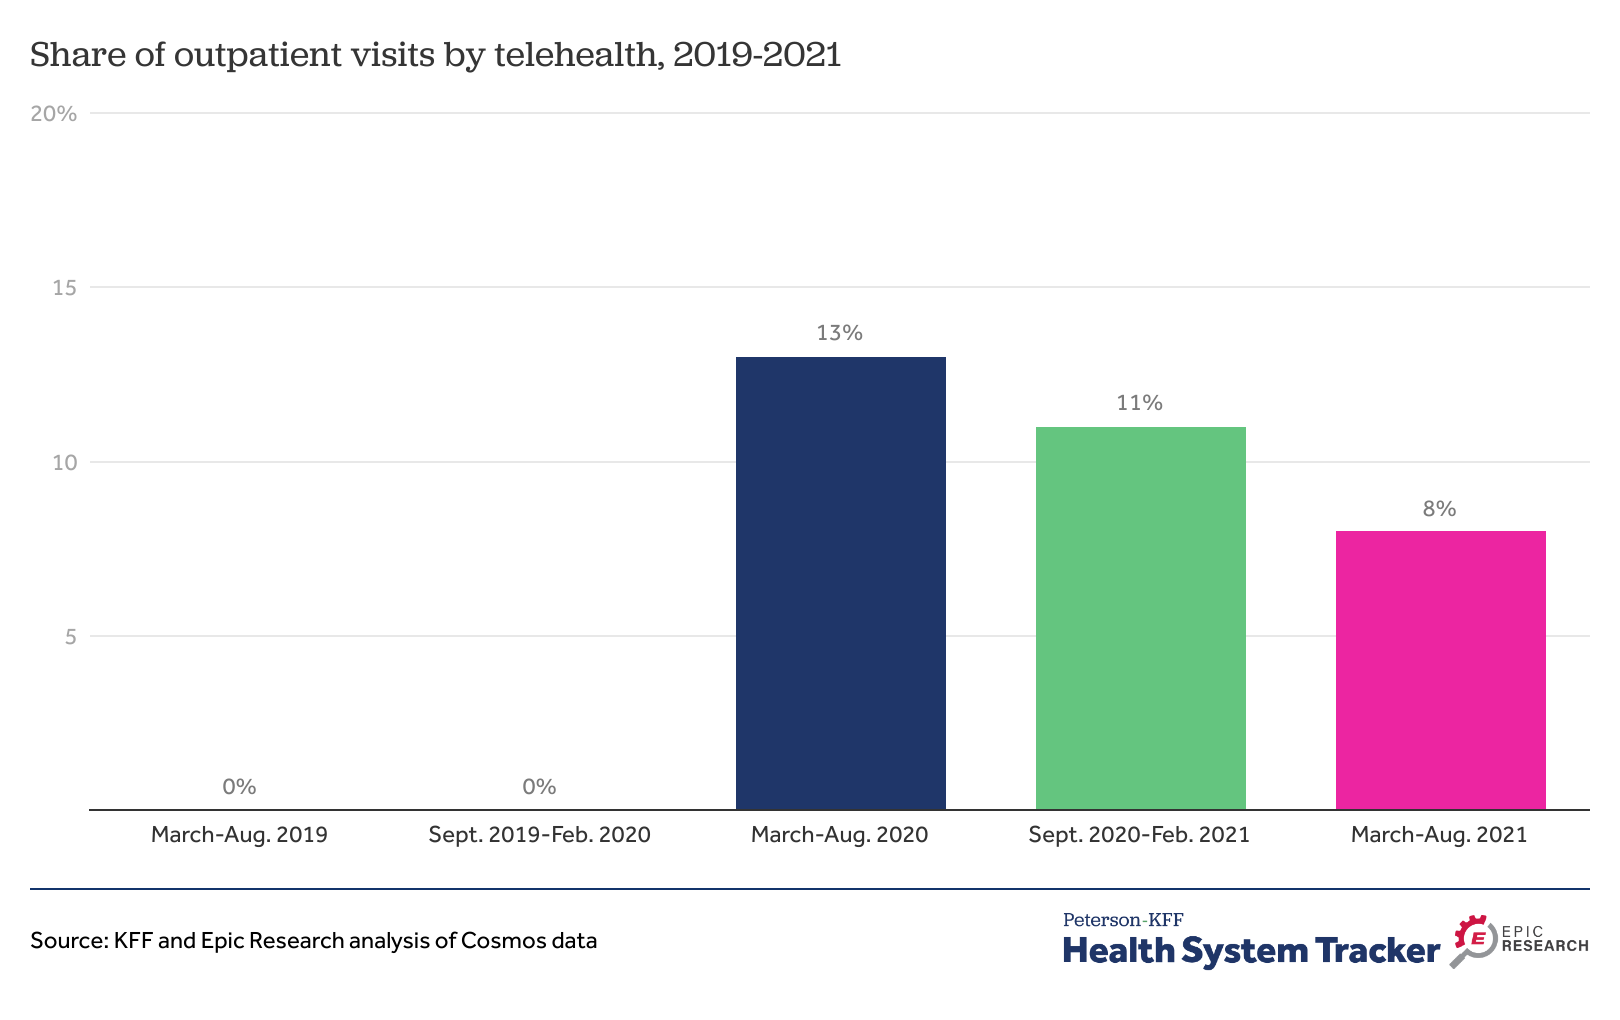
Telehealth use skyrocketed during the early months of the pandemic. While it has since decreased somewhat from that high, it still represents a much more substantial share of health care than before COVID, this KFF-Epic Research analysis finds.
From March through August 2021, 8% of all outpatient visits were conducted via telehealth– down from 13% in the first six months of the pandemic, but well above pre-pandemic levels, when telehealth accounted for a negligible share of outpatient visits.
The report also looks at telehealth use by chronic condition and by gender and summarizes potential implications for expanded telehealth use for access, costs and quality of care, as well as the regulatory environment likely to affect telehealth in the future.
The analysis can be found on the Peterson-KFF Health System Tracker, an information hub dedicated to monitoring and assessing the performance of the U.S. health system.
Telehealth Accounted for 8% of Outpatient Visits More Than a Year into COVID-19 Pandemic, Suggesting a More Permanent Shift in How Patients Receive Care
Telehealth use skyrocketed during the early months of the pandemic. While it has since decreased somewhat from that high, it still represents a much more substantial share of health care than before COVID, a new KFF-Epic Research analysis finds.
From March through August 2021, 8% of all outpatient visits were conducted via telehealth – down from 13% in the first six months of the pandemic, but well above pre-pandemic levels, when telehealth accounted for a negligible share of outpatient visits (rounding to 0%).
The analysis examines data from Cosmos, Epic’s HIPAA-defined limited data set of more than 126 million patients from hospitals and clinics across the country. Other findings include:
Adults ages 65 and older relied on telehealth for a smaller share (5%) of outpatient visits between March and August 2021 than younger adults (8%) and children (11%).
Patients in rural and urban areas used telehealth at similar rates during the six-month period (10% and 8%, respectively).
The report also looks at telehealth use by chronic condition and by gender and summarizes potential implications for expanded telehealth use for access, costs and quality of care, as well as the regulatory environment likely to affect telehealth in the future.
The report is available through the KFF-Peterson Health System Tracker, an online information hub that monitors and assesses the performance of the U.S. health system.
The U.S territories – American Samoa, the Commonwealth of the Northern Mariana Islands (CNMI), Guam, Puerto Rico, and the U.S. Virgin Islands (USVI) – have faced an array of longstanding fiscal and health challenges that were exacerbated by recent natural disasters and the COVID-19 pandemic. Over time, Congress has provided additional federal funding often to address emergencies and additional financing needs beyond the Medicaid allotments set in law. Recent funding increases were set to expire at the end of FY 2021, but administrative action helped to avoid a sharp decline in federal Medicaid financing at the end of FY 2021. The Build Back Better Act (BBBA) includes a permanent statutory increase to the territories’ Medicaid allotments and match rates. This policy watch examines how Medicaid funding for the territories works, the current allotments, and how BBBA would change Medicaid funding for the territories going forward. While a version of BBBA has passed the house, its fate in the Senate remains uncertain.
Unlike in the 50 states and D.C., annual federal funding for Medicaid in the U.S. territories is subject to a statutory cap and fixed matching rate. Both the capped federal allotment (known as the Section 1108 allotment) and the territories’ federal matching rate (known as the federal medical assistance percentage, or FMAP) are fixed in statute. This funding arrangement is unlike federal Medicaid funding for states where federal dollars are uncapped and the FMAP is adjusted annually based on a state’s relative per capita income. Once a territory exhausts its capped federal funds, it no longer receives federal financial support for its Medicaid program during that fiscal year.
Over time, Congress has provided increases in federal funds for the territories broadly and in response to specific emergency events. Most recently, the Further Consolidated Appropriations Act of 2020 and the Families First Coronavirus Response Act (FFCRA) significantly increased the allotments for each of the territories for FY 2020 and FY 2021 (seven to nine times the statutory levels) and also raised the FMAP rates from the statutory level of 55% to 76% for Puerto Rico and 83% for the other territories. These statutory changes to the allotments and the match rate expired at the end of September. However, like other states, the territories are also eligible to receive a 6.2 percentage point increase to the statutory Medicaid match rate through the end of the quarter in which the public health emergency (PHE) expires if certain maintenance of eligibility requirements are met.
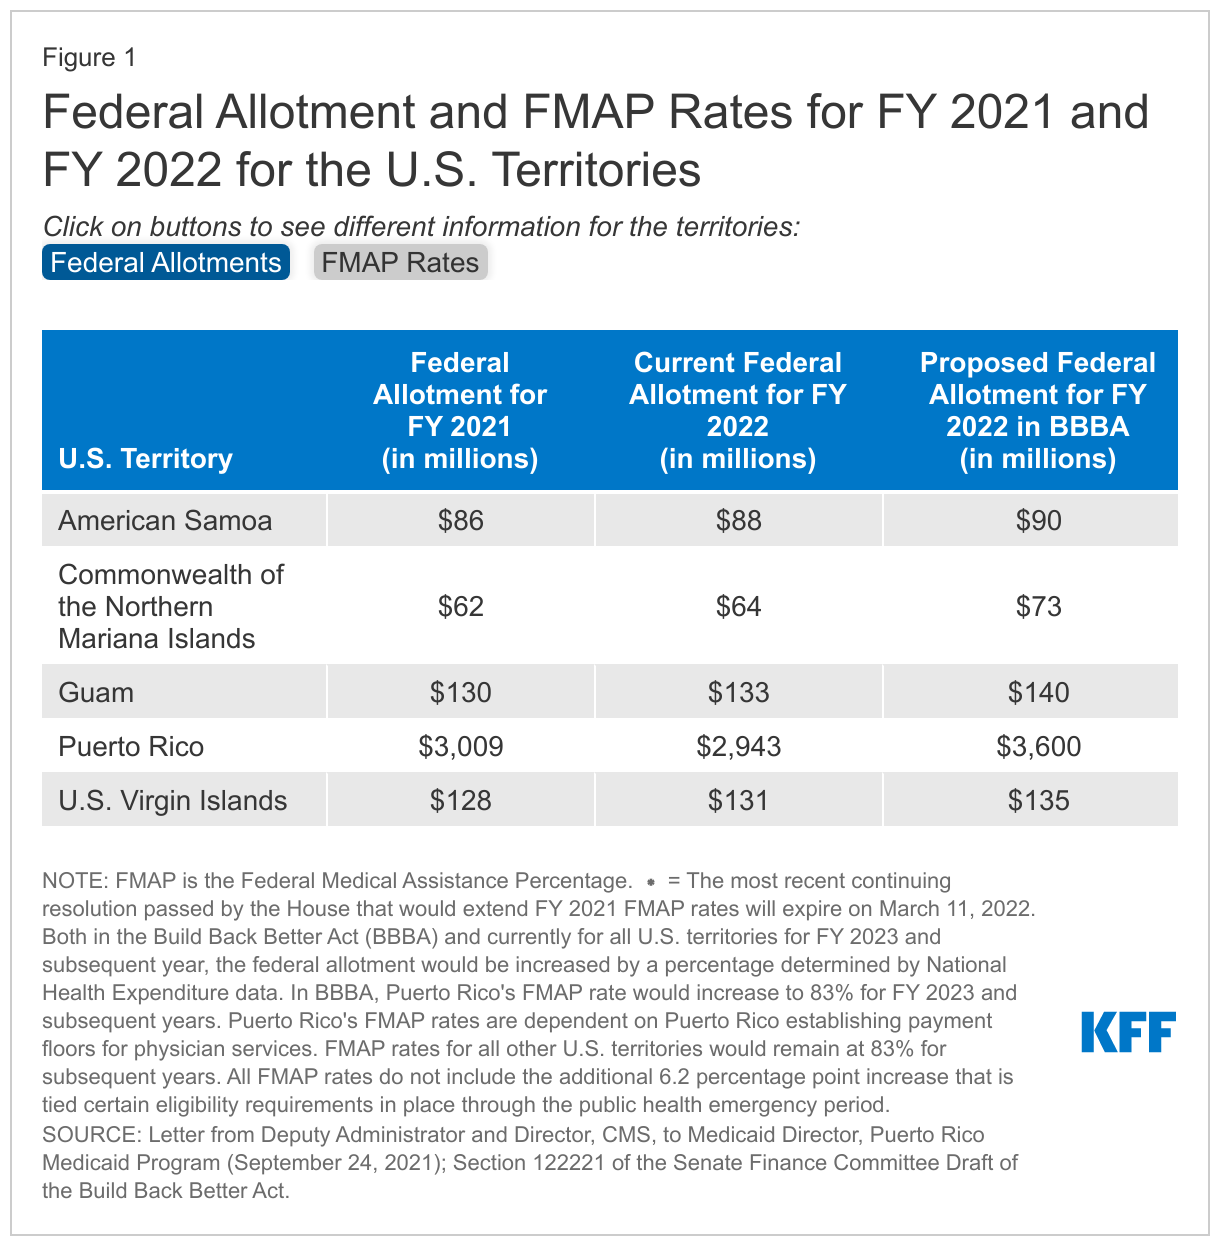
At the end of September 2021, CMS calculated FY 2022 allotments for the territories based on allotments for FY 2021 (except for Puerto Rico where calculations were based on allotments for FY 2020). These calculations helped to avoid a fiscal cliff in federal Medicaid funding for the territories that could have resulted in significant reductions to eligibility levels and benefits. These calculations represent increases of around 3% for all territories compared to their FY 2021 allotment except for Puerto Rico, which would see a decrease of around 2% from FY 2021 (Figure 1). In November 2021, the GAO released a non-binding legal opinion that CMS did not have the authority to adjust the base for the FY 2022 federal allotment for Puerto Rico based on the FY 2020 allotments, but President Biden recently stated that Puerto Rico will receive $2.9 billion in Medicaid funding. CMS noted the calculations related to the allotments would not affect the FMAP rates that would return to the statutory 55% (with an additional 6.2 percentage points available under the public health emergency) on October 1, 2021. However, a prior continuing resolution maintained FMAP rates of 76% for Puerto Rico and 83% for the rest of the U.S. territories through December 3, 2021. The most recent continuing resolution passed by the House would extend these FMAP rates for all territories (except Puerto Rico) through March 11, 2022. Puerto Rico’s current FMAP rate is 55%.
The Build Back Better Act (BBBA) proposed permanent increases in federal allotments and matching rates for the U.S. territories. The BBBA that passed the House and the draft released by the Senate Finance Committee both include provisions to increase the capped federal allotment and fixed matching rates for the U.S. territories (Figure 1). Compared to their FY 2021 allotments these proposed allotments represent modest increases of 5 – 8% for American Samoa, USVI, and Guam and more significant increases of 17% and 20% for CNMI and Puerto Rico, respectively. Additionally, FMAP rates would increase to 83% for all territories except Puerto Rico. Puerto Rico would receive an FMAP rate of 76% in FY 2022 and a rate of 83% in subsequent years dependent on Puerto Rico establishing a reimbursement floor for provider payments.
The passage of the BBBA would provide Puerto Rico and the territories with more certainty in their federal funding and FMAP rates. The BBBA provides a permanent increase in the federal allotments and match rates for all territories. Without the BBBA, the FY 2022 allotment for Puerto Rico will remain slightly lower relative to FY 2021. In addition, the continuing resolution that would extend the enhanced match rate for the territories (except Puerto Rico) will expire on March 11, 2022. When this happens, all territories would see lower FMAP rates resulting in the territories needing to contribute more local funds to draw down federal funds.
In 2019, the U.S. spent more than $1,000 per person on prescribed medicines, an amount higher than any peer nation. This chart collection examines what we know about prescription drug spending and use in the U.S. and comparably large and wealthy countries, using data from the Organization for Economic Cooperation and Development (OECD).
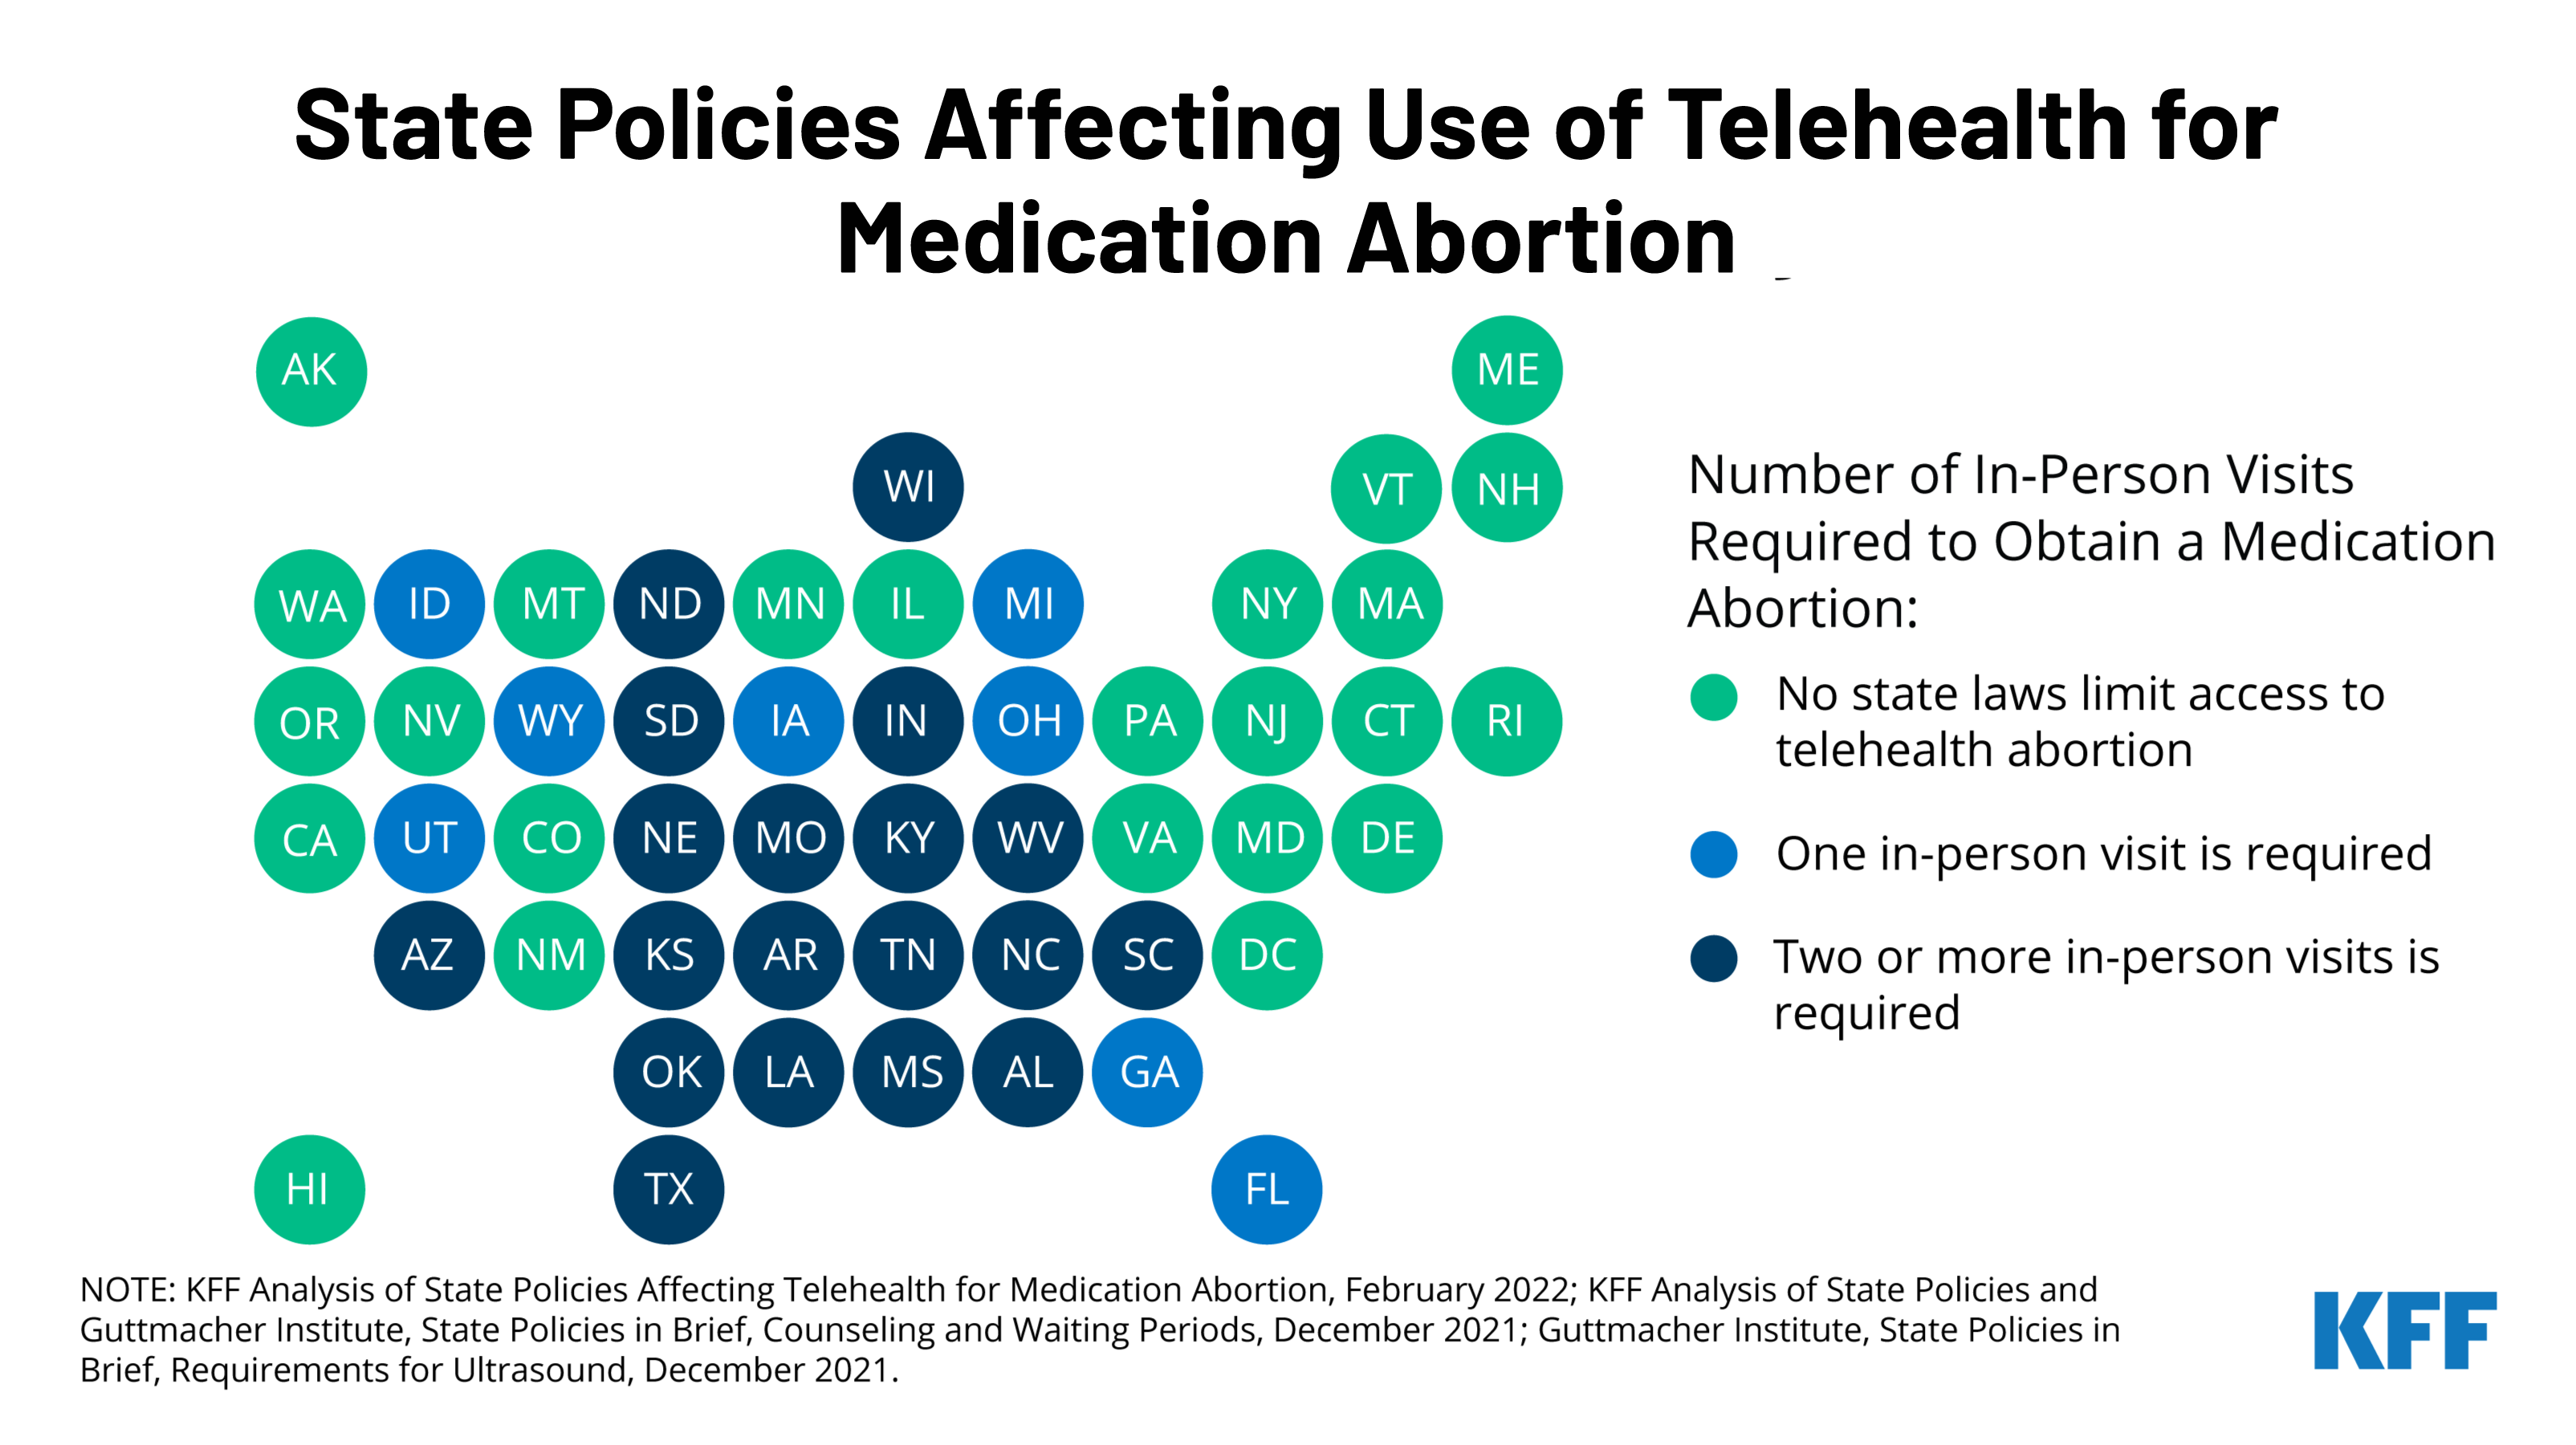
With the country waiting on the Supreme Court’s decision on Dobbs v. Jackson Women’s Health Organization, the case that could overturn Roe v. Wade, many are looking towards telehealth as an alternative to expand access to medication abortion. A new KFF issue brief explains the newly revised Food and Drug Administration (FDA) policy on medication abortion and the differential impact this could have on states by assessing the intersection of federal policy regarding dispensing medication abortion pills with state laws regulating the provision of abortion services.
Prior to the COVID-19 pandemic, dispensing medication abortion via telehealth was limited by a FDA requirement which allowed only certified clinicians to dispense mifepristone, the medication abortion pill, at a health care setting. After temporarily suspending the enforcement of the requirement during the pandemic public health emergency, the FDA permanently lifted the requirement on December 16, 2021. While this change will likely expand access to medication abortion in some states, many states have other policies that will still restrict medication abortion via telehealth.
The new brief reviews state requirements and regulations that affect the availability of medication abortion via telehealth, including which states have directly banned telehealth abortions already. To learn more about the latest news on abortion, visit www.kff.org/womens-health-policy/.
Adoption of evidence-based guidelines, laws, and policies is important for improving HIV-related health outcomes. While PEPFAR’s primary focus is on HIV service delivery, it also aims to create conditions within countries that can contribute to successful implementation of HIV programs, which includes helping to foster policy environments through both operational guidance and diplomacy.
We examined the policy environments in PEPFAR countries to assess alignment with international HIV-related standards, looking at four main categories (clinical care and treatment, testing and prevention, structural, and health systems). We also compared PEPFAR countries to other low- and middle-income countries (LMICs).
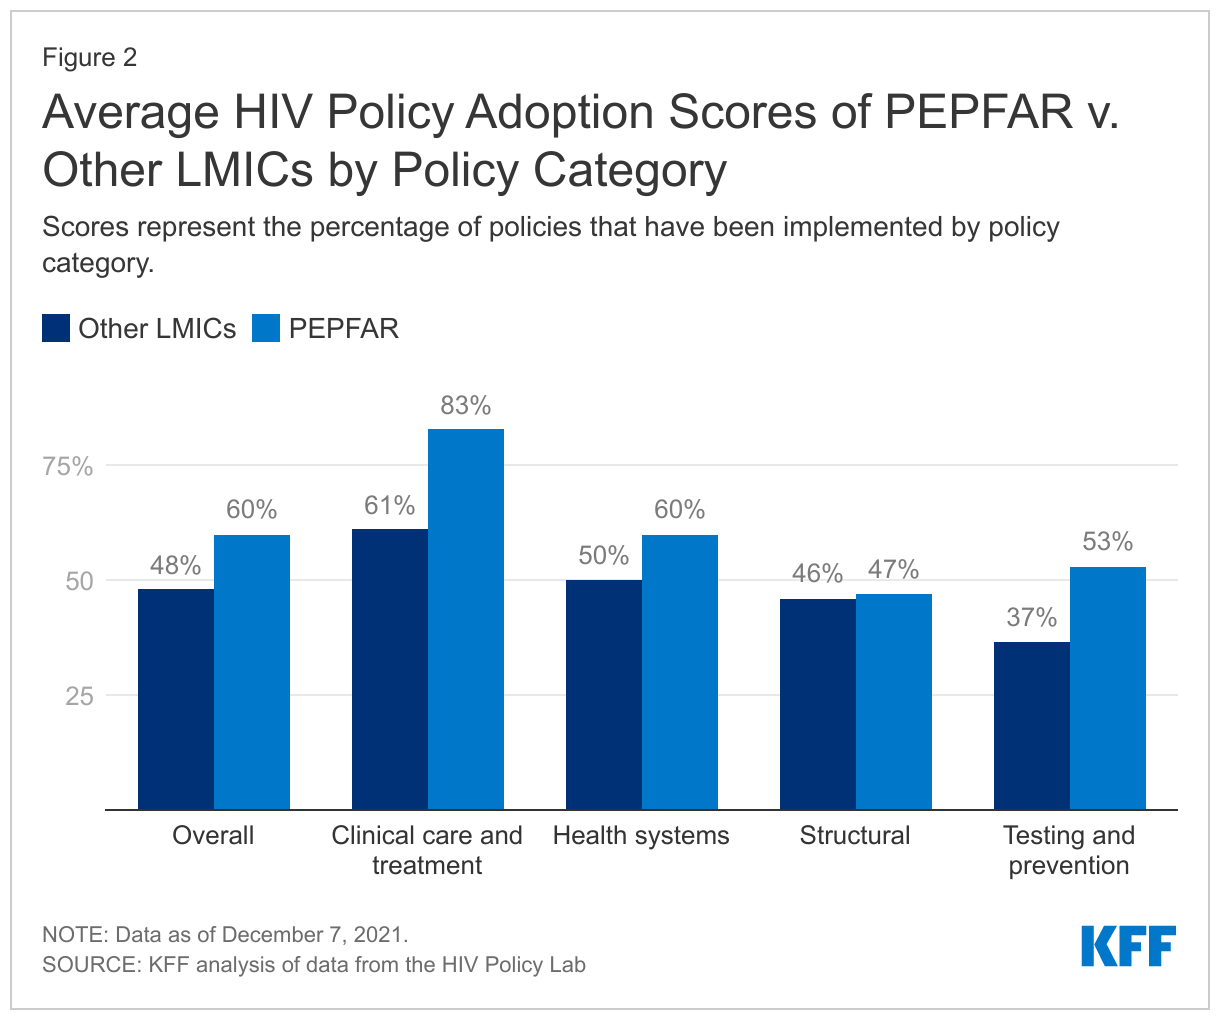
Overall, we find that PEPFAR countries have stronger policy alignment than other LMICs – PEPFAR countries as a group have adopted 60% of recommended policies, compared with 48% among other LMICs, and PEPFAR countries have higher alignment scores than other LMICs in three of the four categories.
Policy alignment was particularly strong, including relative to other LMICs, in areas in which PEPFAR directly focuses and supports. PEPFAR countries scored highest (81%) in the area of clinical care and treatment, which includes policies related to early treatment initiation, treatment regimens, and viral load testing, and scored 20 percentage points higher than other LMICs. While the overall score on testing and prevention was lower than that of clinical care and treatment, there was still a large differential compared to other LMICs (57% compared to 37%). Scores were lowest and similar for both groups on policies and laws related to structural factors, such as HIV-related non-criminalization policies.
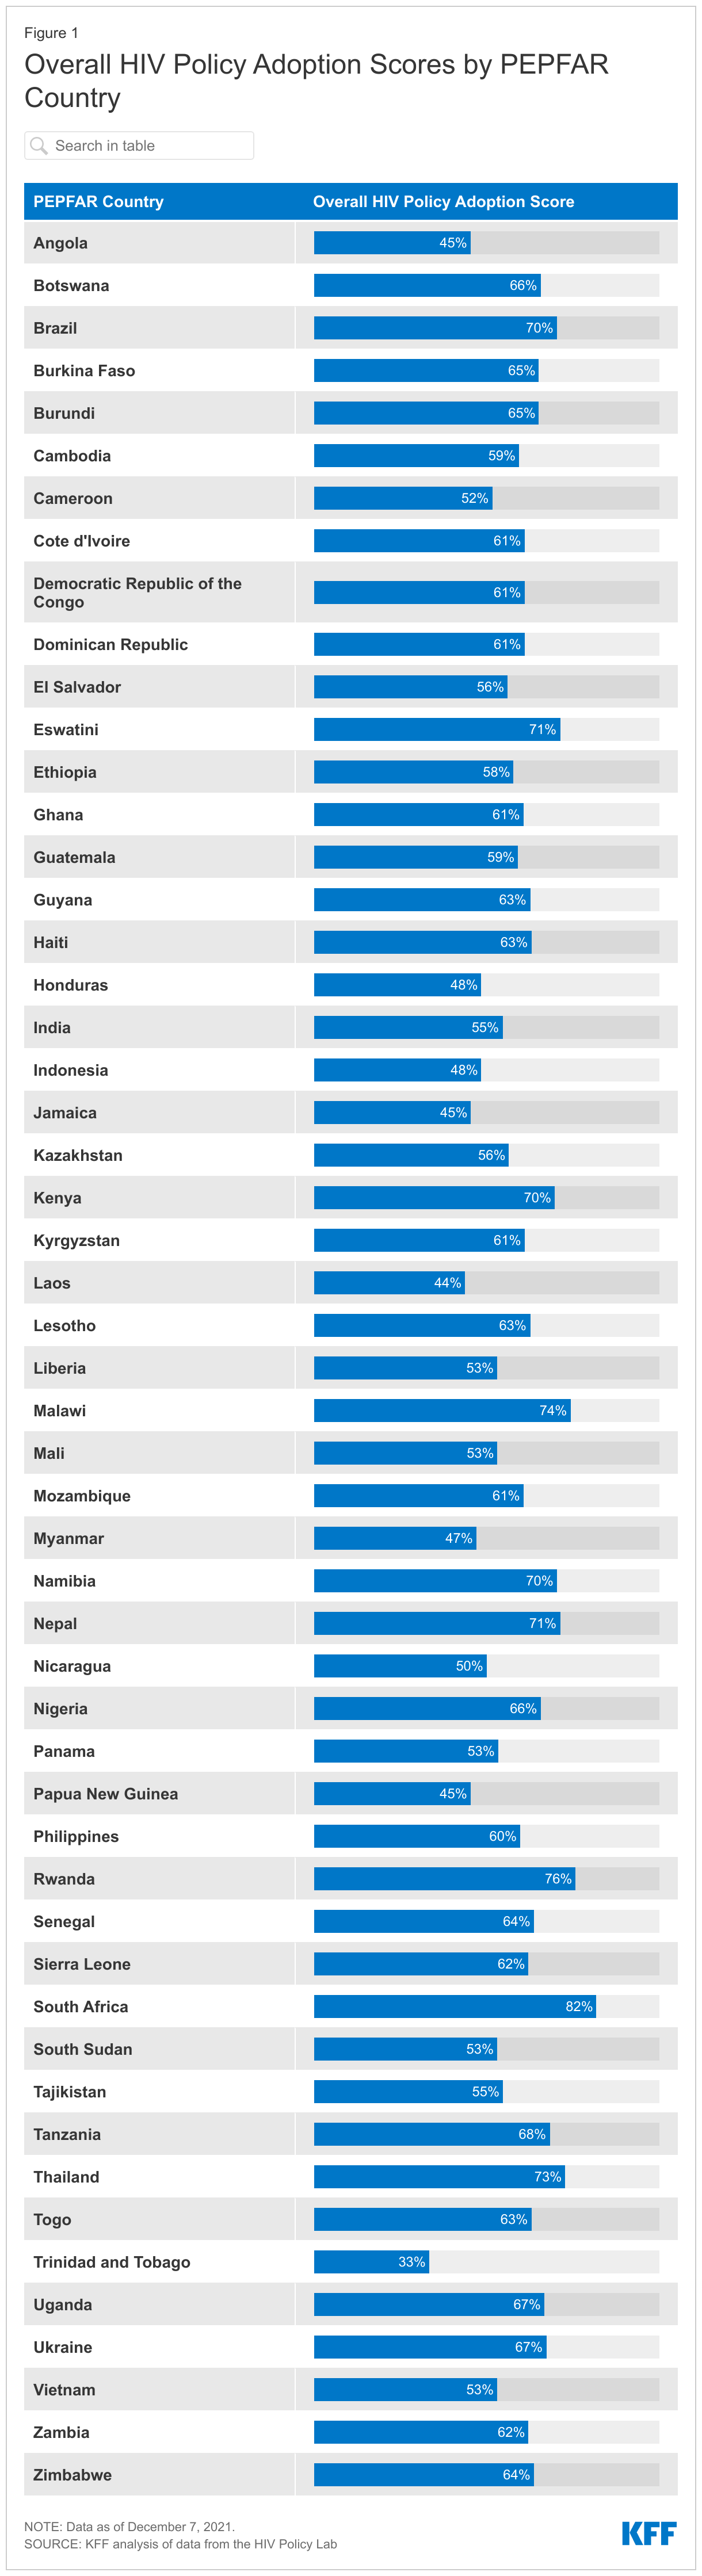
Policy alignment across PEPFAR countries varies substantially – overall policy adoption scores range from 33% in Trinidad & Tobago to 82% in South Africa and there is also variation within each main category – for instance, while no PEPFAR country has adopted policies related to drug use non-criminalization (structural), all 53 PEPFAR countries have fully aligned viral load testing policies (clinical care and treatment) with international standards.
While PEPFAR countries scored higher than other LMICs overall, a significant share of recommended policies have yet to be adopted in PEPFAR countries, particularly in the area of structural barriers, which may be the most difficult to affect at the country level, given that they often require national legal changes and/or reach beyond HIV. Going forward, these findings may serve as a baseline for targeting and assessing future PEPFAR efforts as the program seeks to further improve HIV outcomes in the countries within which it works.
Introduction
The U.S. government’s President’s Emergency Plan for AIDS Relief (PEPFAR), the world’s largest commitment by any nation to address a single disease, has played a significant role in addressing HIV/AIDS in the hardest-hit countries around the world and is credited with helping to shift the trajectory of the epidemic.1 While most of PEPFAR’s efforts are focused on providing services to those with and at risk for HIV, PEPFAR also aims to create conditions that can contribute to the successful implementation of HIV programs. 2,3,4 This includes working to foster the adoption of normative, evidence-based guidance and policies developed by international bodies aimed at improving HIV-related health outcomes.5,6,7
Through its operational guidance and direct diplomatic engagement,8 PEPFAR has worked to encourage and in some cases require that country programs adopt certain policies, such as new antiretroviral treatment guidelines; differentiated service delivery9 – including multi-month dispensing of antiretrovirals (ARVs) to reduce the need for frequent refills, which has become particularly important to ensure continuity of treatment during COVID-19; and the removal of user fees that can serve as obstacles to HIV service access; as well as increase domestic budgets for HIV.10,11,12,13,14 PEPFAR also has emphasized the importance of addressing stigma and a human rights approach, particularly for reaching key populations that some societies have historically shunned.15,16,17,18 As a result, the program has been found to have played an important role in helping to shape the HIV policy environments in the countries in which it operates.19,20,21,22,23,24
We sought to assess policy alignment with international HIV standards in PEPFAR countries. We included PEPFAR countries that were required to develop Country or Regional Operating Plans (COPs or ROPs), which are used for approval of funding and serve as annual strategic plans for U.S. HIV/AIDS efforts in host countries in 2020.25,26,27 In addition to assessing how PEPFAR COP/ROP countries align with international standards, we also compared this group to other LMICs.28,29
Because we looked only at a point-in-time snapshot, findings cannot necessarily be attributed to PEPFAR. Rather, they may serve as a baseline for targeting and assessing future PEPFAR efforts, as the program seeks to further improve HIV outcomes in the countries within which it works. It is possible that policies may have changed in PEPFAR countries since we completed the analysis. For instance, according to a presentation by PEPFAR headquarters staff to stakeholders on August 2, 2021, numerous PEPFAR countries have been making modifications to their polices or guidelines related to multi-month dispensing of antiretrovirals during the COVID-19 pandemic.30
We analyzed data from the HIV Policy Lab, a joint project of Georgetown University’s O’Neill Institute and other academic, civil society, and multilateral partners, with the support of PEPFAR, which compiles and measures the HIV-related policies of the 194 World Health Organization (WHO) member states against international normative guidance. The policies that the HIV Policy Lab uses as benchmarks are those recommended by internationally-recognized authorities, including the WHO, UNAIDS, the U.N. Development Programme, the Global Commission on HIV and the Law, and others based on current science and evidence and aimed at improving HIV-related outcomes. The HIV Policy Lab database uses information reported by governments through the National Commitments and Policy Instrument (NCPI) housed on UNAIDS’ Laws and Policies Analytics platform,33 and collects additional data from official countries sources, reports from U.N. member states, and other partner organizations.
We used the most recent year of data available (through 2020) on policies by country to assess their status in 53 PEPFAR countries required to submit a COP and ROP in 2020, and 85 other LMICs that either did not receive PEPFAR support (82 countries) or received some U.S. HIV support, but were not required to submit a COP or ROP in 2020 (3 countries).34,35,36 We included the full set of 33 indicators – along with more than 30 sub-indicators – across the four categories that the HIV Policy Lab tracks: clinical care and treatment; testing and prevention; health systems; and structural barriers (see Table 1 and the Appendix; more detailed explanations of each indicator can be found in the HIV Policy Lab’s Codebook).
For each indicator where data are available, the HIV Policy Lab assigns points based on adoption status – “Adopted” (1 point), “Partially Adopted” (0.5), and “Not Adopted” (0). For indicators with sub-indicators, the HIV Policy Lab assigns a full point if all sub-indicators are adopted, a half point (0.5) if some are adopted, and 0 if none are adopted. The points for all indicators are added to obtain a raw score for each country. Adoption percentages are calculated by dividing the raw scores by the total possible scores; indicators for which there are no data available are excluded. Scores for groups (e.g., PEPFAR countries, regions) were calculated by averaging country scores at the overall- and category-level. Scores presented in the text are for the main indicators unless otherwise noted. Countries without data were excluded.
Our analysis is based on data downloaded on December 7, 2021.
Table 1: Policy Indicators Included in Analysis, by Category
Clinical Care and Treatment
Testing and Prevention
Health Systems
Structural
Treatment Initiation
Self-testing
Task Shifting
Same-sex Sex Non-Criminalization
Same-day Treatment Start
Partner Notification/Index Testing
Healthcare Financing
Sex Work Non-Criminalization
Treatment Regimen
Compulsory Testing
Universal Health Coverage
Drug Use Non-Criminalization
Differentiated Service Delivery
Age Restrictions on Testing & Treatment
User Fees
HIV Exposure Non-Criminalization
Viral Load Testing
PrEP
Access to Medicines (TRIPS)
Non-discrimination Protections
Pediatric Diagnosis & Treatment
Harm Reduction
Unique Identifiers with Data Protections
National Human Rights Institutions
Migrant Access to Healthcare
Comprehensive Sexuality Education
Data Sharing
Constitutional Right to Health
Tuberculosis Diagnosis
Prisoners Prevention
Girls Education
Gender-based Violence
Civil Society
Findings
PEPFAR countries, as a group, have greater policy alignment, than other LMICs.
Overall, PEPFAR countries have an average adoption score of 60% for the recommended policies, compared to 48% for other LMICs. Policy adoption scores in PEPFAR countries range from 33% in Trinidad & Tobago to a high of 82% in South Africa (see Figure 1).
PEPFAR countries score higher on three of the four policy categories tracked, with an average score 22 percentage points greater than that of other LMICs for clinical care and treatment indicators; 16 percentage points higher for testing and prevention indicators; and 10 points higher for health systems indicators. The score for the fourth category — structural indicators – was similar to that of other LMICs (see Figure 2).
PEPFAR countries have the strongest policy alignment in the area of clinical care and treatment and the weakest on structural indicators.
On average, PEPFAR countries have an adoption score of 83% for policies related to clinical care and treatment (see Figure 2), ranging from a low of 31% (Nicaragua) to a high of 100% in eight countries (Eswatini, Ethiopia, Haiti, Malawi, Papua New Guinea, South Sudan, Uganda, and Zimbabwe).
For testing and prevention indicators, PEPFAR countries have an average adoption score of 53%, ranging from 0% (Trinidad and Tobago) to 94% (Nigeria).
PEPFAR countries scored an average of 60% for health systems indicators, ranging from 14% (Laos) to 93% in three countries (Eswatini, South Africa, and Thailand).
PEPFAR countries have the weakest alignment for policies related to structural indicators (47%), with Lesotho scoring the lowest in this category at 11%, and Rwanda and South Africa scoring the highest at 70%.
There is also significant variation in policy alignment within each main category– for instance, while no PEPFAR country has adopted policies related to drug use non-criminalization (structural), all 53 PEPFAR countries have fully aligned viral load testing policies (clinical care and treatment) with international standards.
Clinical Care and Treatment
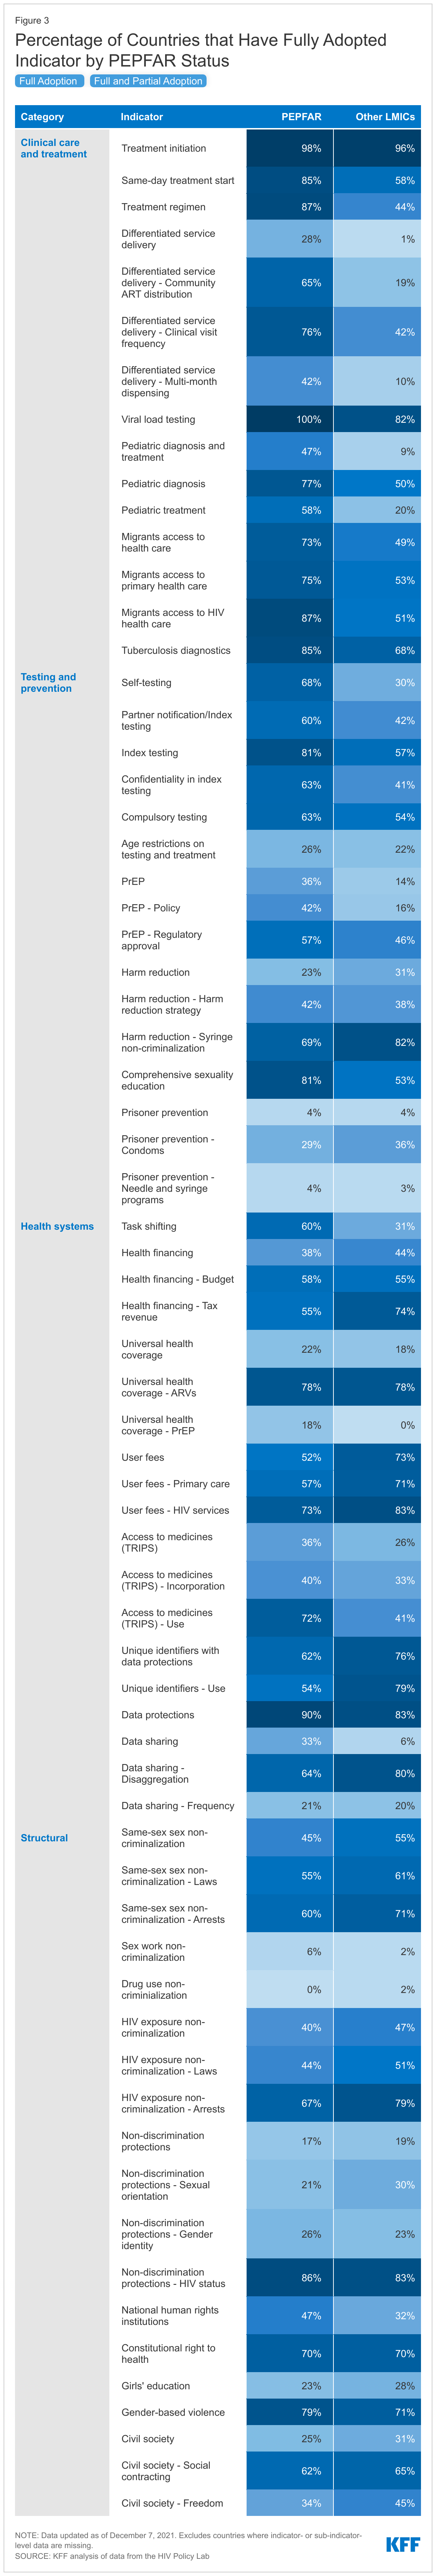
All PEPFAR countries in this analysis (53) have fully adopted viral load testing policies aligned with international standards (whether a national policy is in place to monitor viral load in people with HIV at least once a year). This was the only indicator among the 33 for which 100% of countries have fully aligned policies. Treatment initiation policies (whether a national policy is in place that states that people with HIV, regardless of CD4 count, are eligible to start treatment) followed closely with 52 of the 53 PEPFAR countries fully adopting.
Differentiated service delivery (DSD) policies (whether national policy allows for differentiated HIV treatment services such as multi-month dispensing and community antiretroviral therapy) had the smallest share of PEPFAR countries fully adopting – 15 of the 53 PEPFAR countries, although an additional 36 had adopted some DSD policies.
Testing and Prevention
Adoption of prevention policies is greatest for comprehensive sexuality education (whether national policies require curriculum that meets international standards be taught in primary and secondary schools), with 42 PEPFAR countries fully adopting (out of 52 with available data).
Policies related to HIV prevention among prisoners (whether national policy stipulates that prevention tools, such as condoms, lubricants, and syringe access/exchange programs available to prisoners) were the least likely to be aligned, with just two countries (Kyrgyzstan and Tajikistan) fully adopting policies aligned with international standards (out of 52 with available data), although an additional 13 had adopted some policies in this area.
Health Systems
Within this category, PEPFAR countries are most aligned on policies related to unique identifiers with data protections (whether the country utilizes unique identifiers for continuity of care across multiple facilities and has legally-enforceable data privacy protections) – 33 of 53 PEPFAR countries have policies fully aligned with international standards and an additional 17 countries had some national policy related to patient data protection.
More than half of PEPFAR countries (27 of 52 with available data) have fully aligned policies related to user fees (whether national policy stipulates that public primary care and HIV services are available without user fees) and an additional 20 have adopted some policies in this area.
PEPFAR countries are least likely to be aligned on policies related to universal health coverage of HIV treatmentand PrEP (whether national health coverage includes medications for HIV treatment and PrEP) – 11 PEPFAR countries (out of 51 with available data) have fully aligned policies with international standards, with an additional 22 having adopted some policies related to universal health coverage of HIV treatment and PrEP.
Structural
PEPFAR countries have the strongest alignment on policies related to gender-based violence – an indicator that assesses whether or not countries have laws that explicitly address domestic violence with enforceable penalties (42 of 53 countries).
On the other end of the spectrum, no PEPFAR country has adopted policies related to drug use non-criminalization (whether national policy avoids criminalizing personal possession of drugs). Additionally, only three of 53 PEPFAR countries have policies related to sex work non-criminalization (whether national policy avoids criminalizing the buying, selling, and organizing of sex work) that are fully aligned with international standards (Haiti, Honduras, and Panama).
Discussion
While no PEPFAR country has fully aligned its laws and policies with international standards, this analysis shows that they have, on average, greater alignment than other LMICs and this differential is greatest in areas in which PEPFAR focuses most of its direct support, such as treatment and testing policies. As noted above, PEPFAR has actively worked toward changing local policies in countries, principally with regard to the adoption of treatment guidelines, the removal of user fees for HIV services, and the implementation of differentiated service delivery strategies, such as the multi-month dispensing of antiretrovirals – which has become critically important during the COVID-19 pandemic – and increasing domestic budgets for HIV. Further, PEPFAR has played a role in spotlighting the need for countries to address HIV among some of the most vulnerable populations, which have been historically shunned by some countries. At the same time, as this analysis demonstrates, there is still a significant share of recommended policies that have yet to be adopted in PEPFAR countries, particularly in the area of structural barriers, such as policies related to non-discrimination of marginalized groups and decriminalization of activities including sex work and drug use, which may be the most difficult to affect at the country level given that they often require national legal changes and/or reach beyond HIV.
While the data included in this analysis do not measure the extent or quality of implementation, policy adoption can be viewed as a step in the direction of evidence-based practices and indicate a country’s commitment to addressing HIV and creating a foundation that can facilitate and optimize HIV/AIDS efforts. This is especially important in PEPFAR countries, which include those that have been hardest hit by the HIV/AIDS epidemic. Indeed, PEPFAR’s most recent draft guidance to COP and ROP countries for 2022 places an even greater premium on policy change, including requiring country programs to either ensure change in some areas as a condition of receiving funding, or submit a detailed description of existing barriers and proposed plan to be able to meet these requirements.
Looking ahead, there are important questions surrounding PEPFAR’s role, beyond service delivery, in countries, especially as the program awaits the confirmation of a new coordinator, is expected to release a new five-year strategy, and is due for reauthorization in two years, all of which could provide openings for strengthening PEPFAR even further. The findings presented here, while not necessarily attributable to PEPFAR, may serve as a baseline for targeting and assessing future PEPFAR efforts, as the program seeks to further improve HIV outcomes in the countries within which it works and policymakers consider PEPFAR’s next phase.
Appendix
Appendix 1: Policy Indicators and Sub-Indicators Included in Analysis, by Category
Category
Name
Indicator or Sub-Indicator
Clinical care and treatment
Treatment initiation
Indicator
Same-day treatment start
Indicator
Treatment regimen
Indicator
Differentiated service delivery
Indicator
Differentiated service delivery – Community ART distribution
Sub-indicator
Differentiated service delivery – Clinical visit frequency
Sub-indicator
Differentiated service delivery – Multi-month dispensing
Sub-indicator
Viral load testing
Indicator
Pediatric diagnosis and treatment
Indicator
Pediatric diagnosis and treatment – Pediatric diagnosis
Sub-indicator
Pediatric diagnosis and treatment – Pediatric treatment
Sub-indicator
Migrants’ access to health care
Indicator
Migrants’ access to health care – Primary health care
Sub-indicator
Migrants’ access to health care – HIV health care
Sub-indicator
Tuberculosis diagnostics
Indicator
Testing and prevention
Self-testing
Indicator
Partner notification/Index testing
Indicator
Partner notification/Index testing – Index testing
Sub-indicator
Partner notification/Index testing – Confidentiality in index testing
Sub-indicator
Compulsory testing
Indicator
Age restrictions on testing and treatment
Indicator
PrEP
Indicator
PrEP – Policy
Sub-indicator
PrEP – Regulatory approval
Sub-indicator
Harm reduction
Indicator
Harm reduction – Harm reduction strategy
Sub-indicator
Harm reduction – Syringe non-criminalization
Sub-indicator
Comprehensive sexuality education
Indicator
Prisoner prevention
Indicator
Prisoner prevention – Condoms
Sub-indicator
Prisoner prevention – Needle and syringe exchange program
Sub-indicator
Health systems
Task shifting
Indicator
Health financing
Indicator
Health financing – Budget
Sub-indicator
Health financing – Tax revenue
Sub-indicator
Universal health coverage
Indicator
Universal health coverage – ARVs
Sub-indicator
Universal health coverage – PrEP
Sub-indicator
User fees
Indicator
User fees – Primary care
Sub-indicator
User fees – HIV services
Sub-indicator
Access to medicines (TRIPS)
Indicator
Access to medicines (TRIPS) – Incorporation
Sub-indicator
Access to medicines (TRIPS) – Use
Sub-indicator
Unique identifiers with data protections
Indicator
Unique identifiers with data protections – Unique identifiers use
Sub-indicator
Unique identifiers with data protections – Data protections
Sub-indicator
Data sharing
Indicator
Data sharing – Disaggregation
Sub-indicator
Data sharing - Frequency
Sub-indicator
Structural
Same-sex sex non-criminalization
Indicator
Same-sex sex non-criminalization – Laws
Sub-indicator
Same-sex sex non-criminalization – Arrests
Sub-indicator
Sex work non-criminalization
Indicator
Drug use non-criminalization
Indicator
HIV exposure non-criminalization
Indicator
HIV exposure non-criminalization – Laws
Sub-indicator
HIV exposure non-criminalization – Arrests
Sub-indicator
Non-discrimination protections
Indicator
Non-discrimination protections – Sexual orientation
Specific examples of normative, evidence-based guidance and policies developed by international bodies include the WHO’s Consolidated guidelines on HIV prevention, testing, treatment, service delivery and monitoring: recommendations for a public health approach (see: https://www.who.int/publications/i/item/9789240031593) and Key Considerations for Differentiated ART Delivery for Specific Populations jointly produced by the WHO, U.S. Centers for Disease Control and Prevention, PEPFAR, USAID, and the International AIDS Society (see: https://www.who.int/publications/i/item/WHO-HIV-2017.34), among others. All guidelines and policies that the HIV Policy Lab uses as benchmarks with which to assess countries are included in their codebook (see: https://hivpolicylab.org/codebook). ↩︎
PEPFAR is administered through the Office of the U.S. Global AIDS Coordinator and Health Diplomacy within the U.S. Department of State, led by a Senate-confirmed coordinator with the rank of ambassador, and is housed within U.S. diplomatic missions under the oversight of the U.S. ambassador in country. ↩︎
O’Neill Institute for National and Global Health Law at Georgetown University Law Center, Reorganization and the Future of PEPFAR; Implications of State and USAID Reform, 2018. ↩︎
The COP/ROP documents serve as annual strategic plans for U.S. HIV/AIDS efforts in host countries, as well as serve as the basis for the approval of U.S. funding. Each COP focuses on PEPFAR’s efforts in one county in most cases, whereas the ROPs focus on a group of countries. Most, but not all, COP countries receive a greater level of investment than ROP countries. ↩︎
PEPFAR’s 2020 Country Operational Plan Guidance for all PEPFAR Countries includes a list of 55 countries that were required to submit a COP or ROP that year. This list served as the basis for our “PEPFAR countries” group. Two countries on this list (Barbados and Suriname) were excluded from our analysis following communication with staff in the Office of the Global AIDS Coordinator that confirmed that direct bilateral support had been discontinued to those countries in recent years. ↩︎
According to the U.S. government database www.foreignassistance.gov, three countries that were not required to develop a COP or ROP received some HIV funding in FY 2020 – Colombia, Peru, and Venezuela. These countries were not included in the PEPFAR group. ↩︎
U.S. Department of State, “PEPFAR Update – Stakeholder Townhall,” presentation delivered on August 2, 2012. ↩︎
O’Neill Institute for National and Global Health Law at Georgetown University Law Center, HIV Policy Lab, accessed: https://hivpolicylab.org/. ↩︎
Kavanagh M, et al, “Understanding and comparing HIV-related law and policy environments: cross-national data and accountability for the global AIDS response,” BMJ Global Health, 2020, accessed: https://gh.bmj.com/content/5/9/e003695. ↩︎
PEPFAR’s 2020 Country Operational Plan Guidance for all PEPFAR Countries includes a list of 55 countries that were required to submit a COP or ROP that year. This list served as the basis for our “PEPFAR countries” group. Two countries on this list (Barbados and Suriname) were excluded from our analysis following communication with staff in the Office of the Global AIDS Coordinator that confirmed that direct bilateral support had been discontinued to those countries in recent years. ↩︎
According to the U.S. government database www.foreignassistance.gov, three countries that were not required to develop a COP or ROP received some HIV funding in FY 2020 – Colombia, Peru, and Venezuela. These countries were not included in the PEPFAR group. ↩︎
The toll the COVID-19 pandemic has exacted on the global economy has been significant, with the International Monetary Fund (IMF) estimating that median global GDP dropped by 3.9% from 2019 to 2020, making it the worst economic downturn since the Great Depression. While the global economy was estimated to have recovered in 2021, recovery has been uneven and disparities in vaccine access and coverage could threaten improvement in much of the world.
Among other priorities, the White House’s U.S. COVID-19 Global Response and Recovery Framework seeks to bolster the economies of countries that have suffered due to the pandemic. This will be especially important in countries where the U.S. has major investments in other health areas, such as PEPFAR, the U.S. global HIV program. The economic impacts of COVID-19 on the HIV response could be as consequential as the direct health impacts, and as such, may significantly affect U.S. efforts in these countries. To inform such efforts, we examined the current and projected economic impact of COVID-19 in 53 PEPFAR countries.
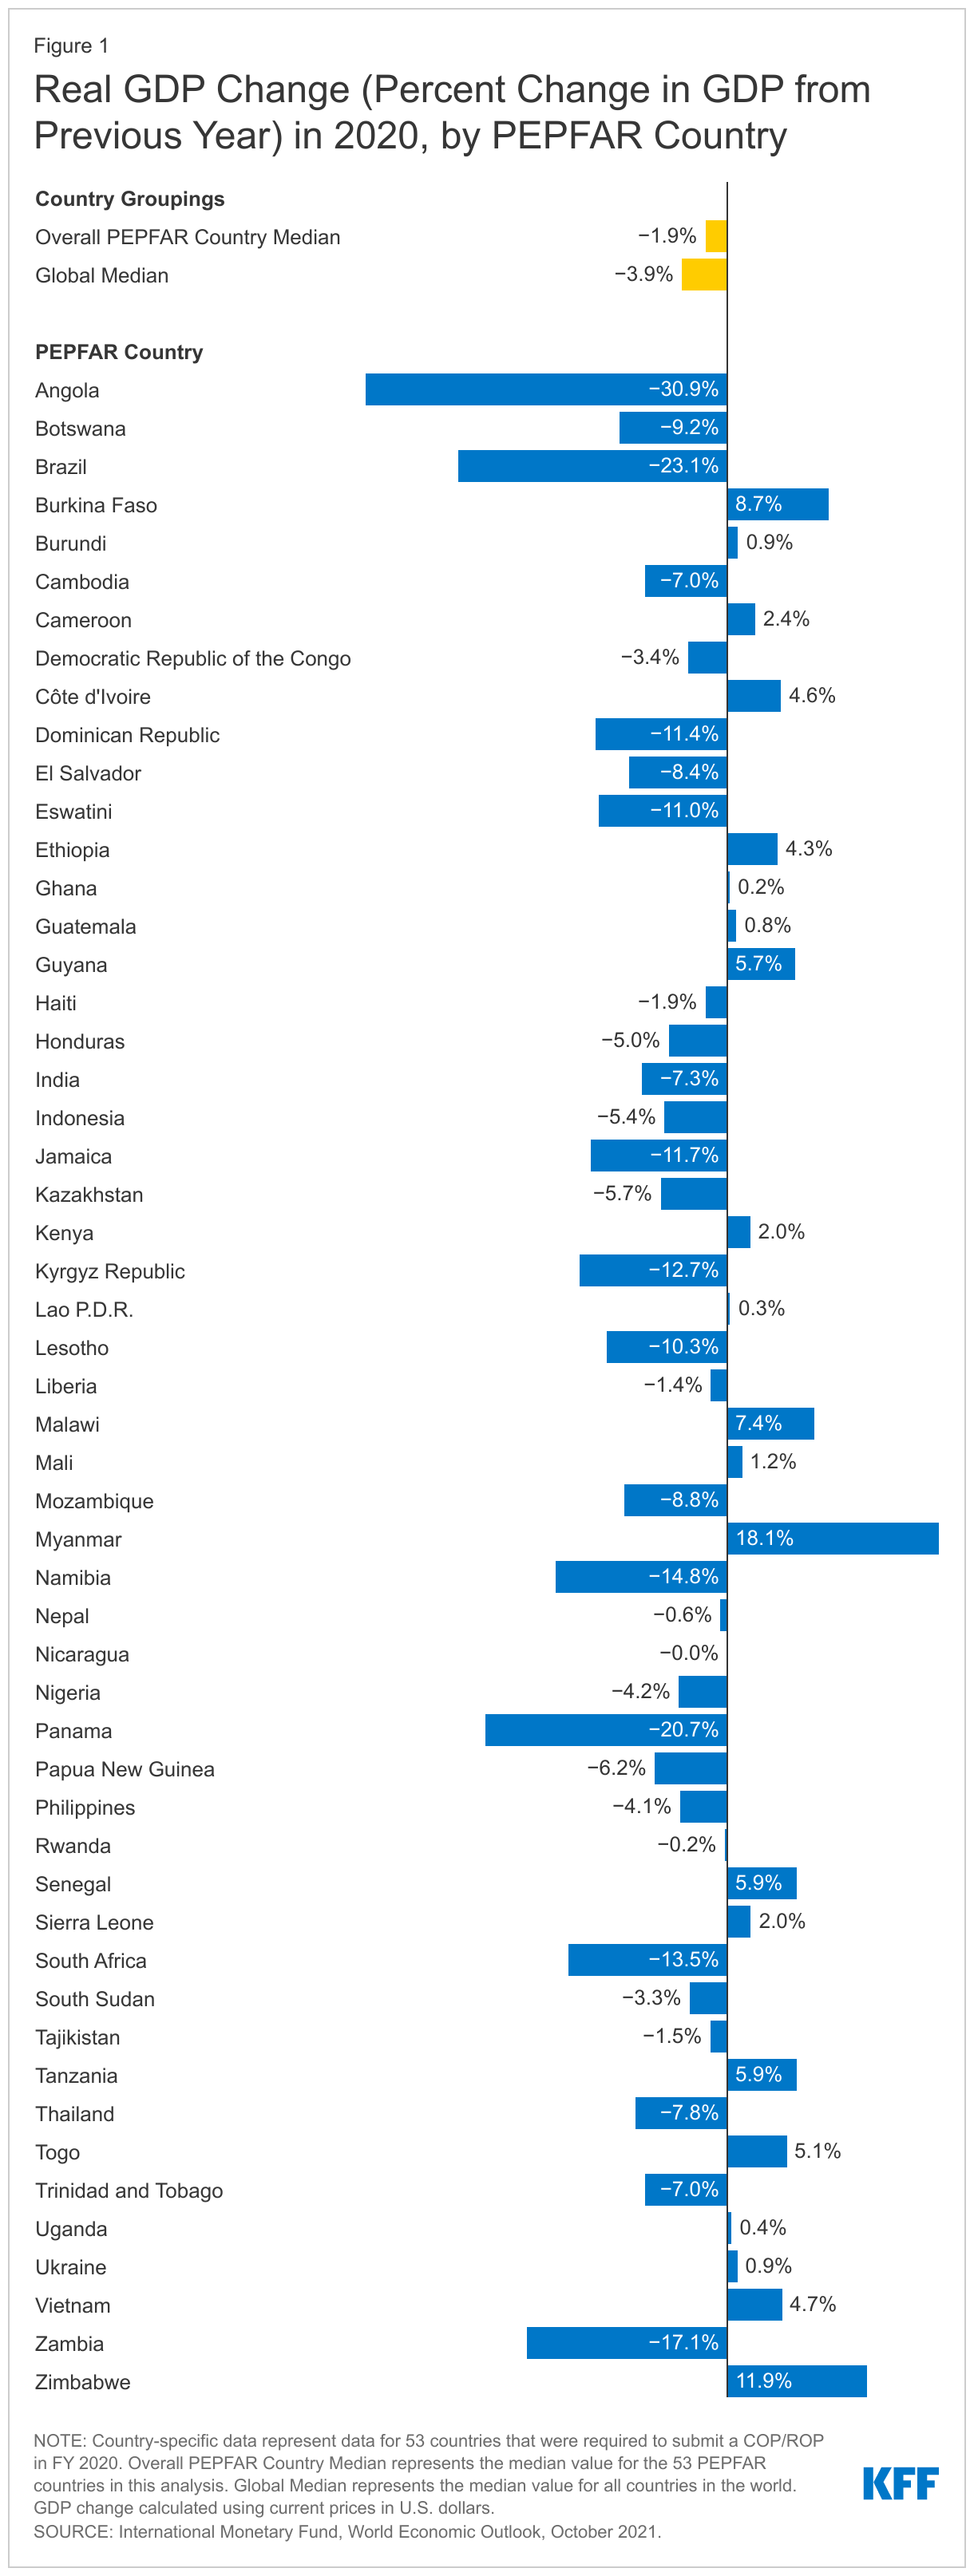
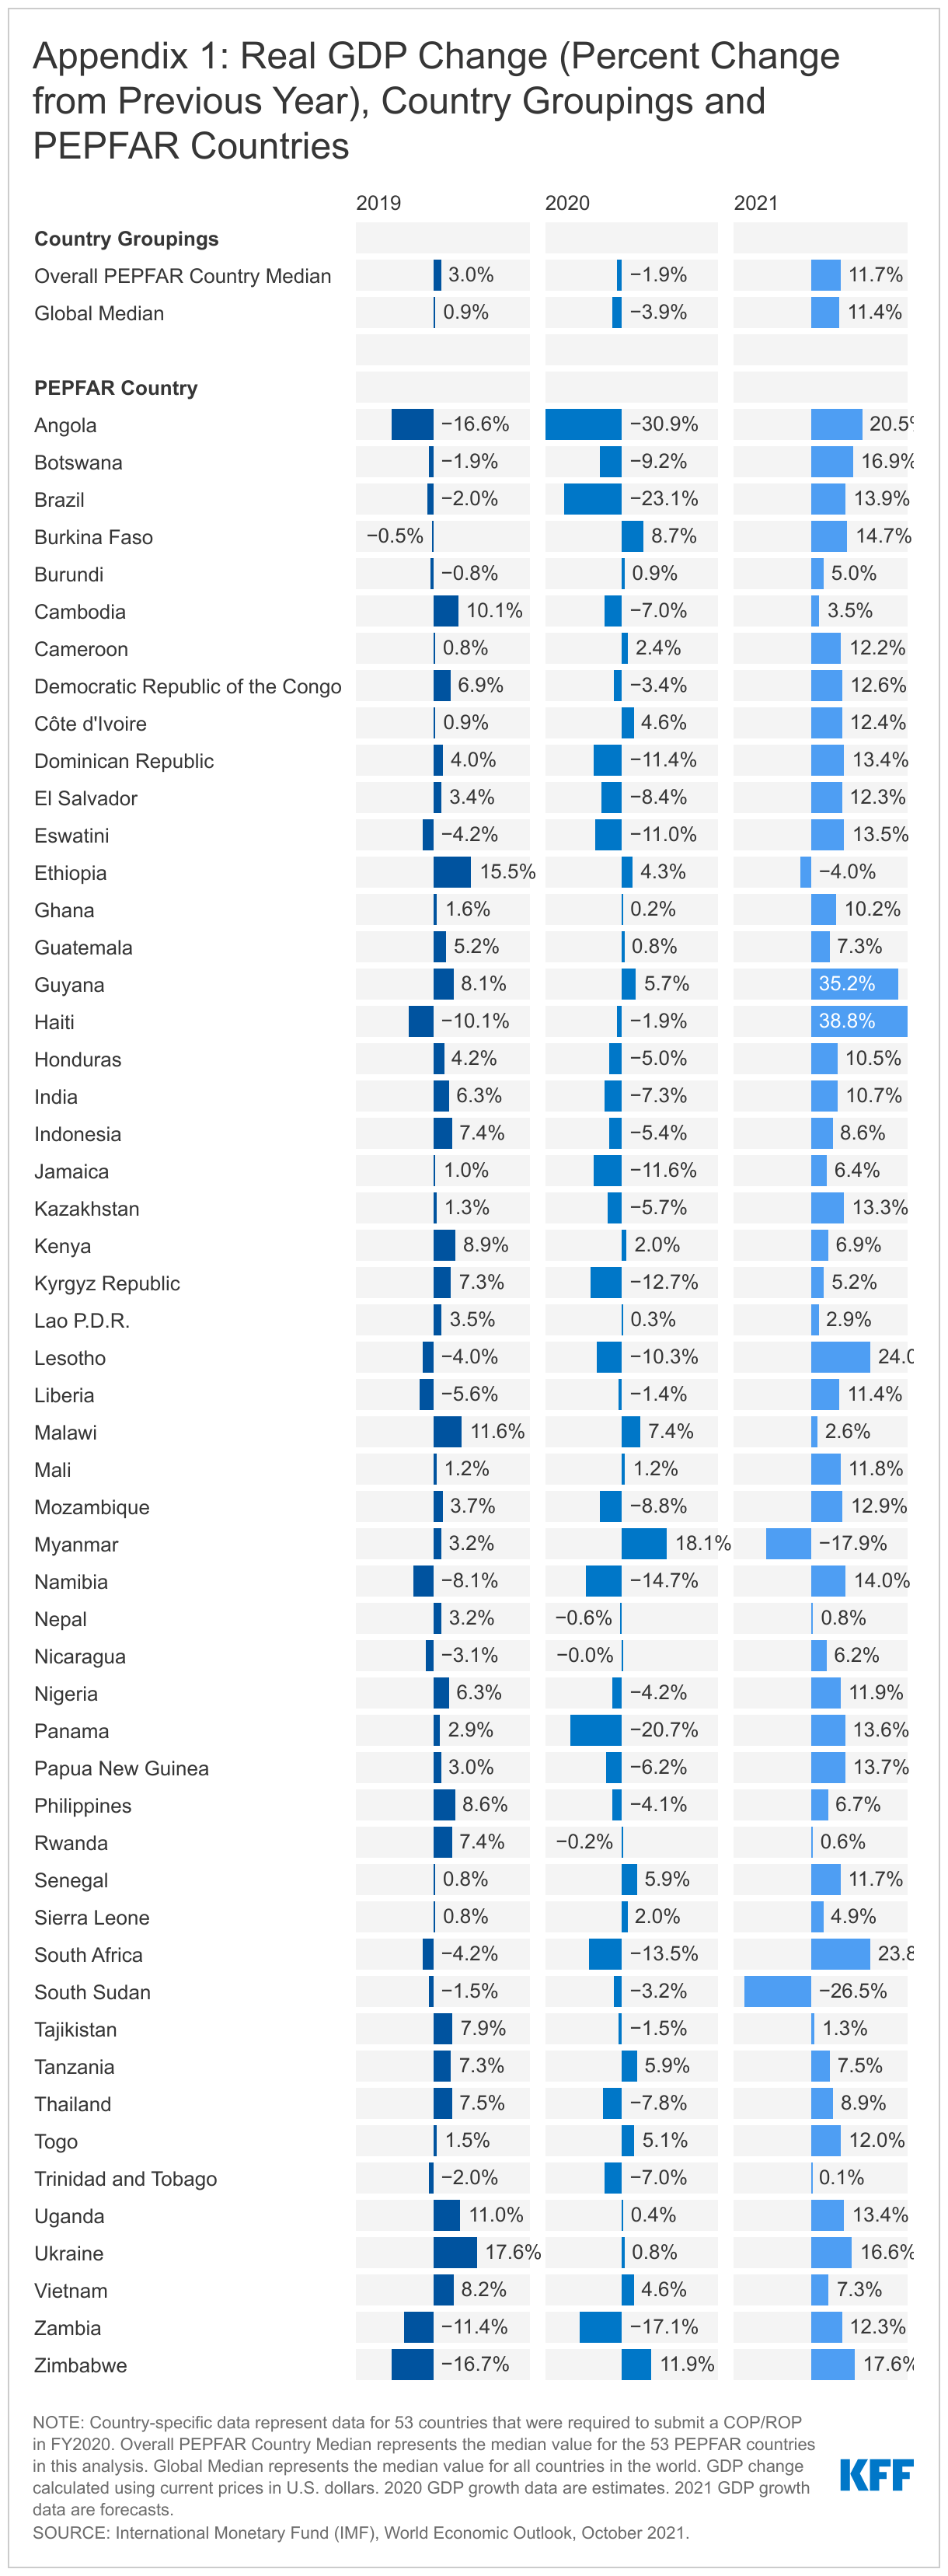
Overall, we find that in the majority of PEPFAR countries, GDP fell in 2020, the year the pandemic emerged, compared to 2019. In 11 countries, the contraction was greater than 10%. While PEPFAR countries experienced less of a median GDP drop than the global economy overall in 2020 (1.9% compared to 3.9%), they generally fared worse than their economic and regional peers.
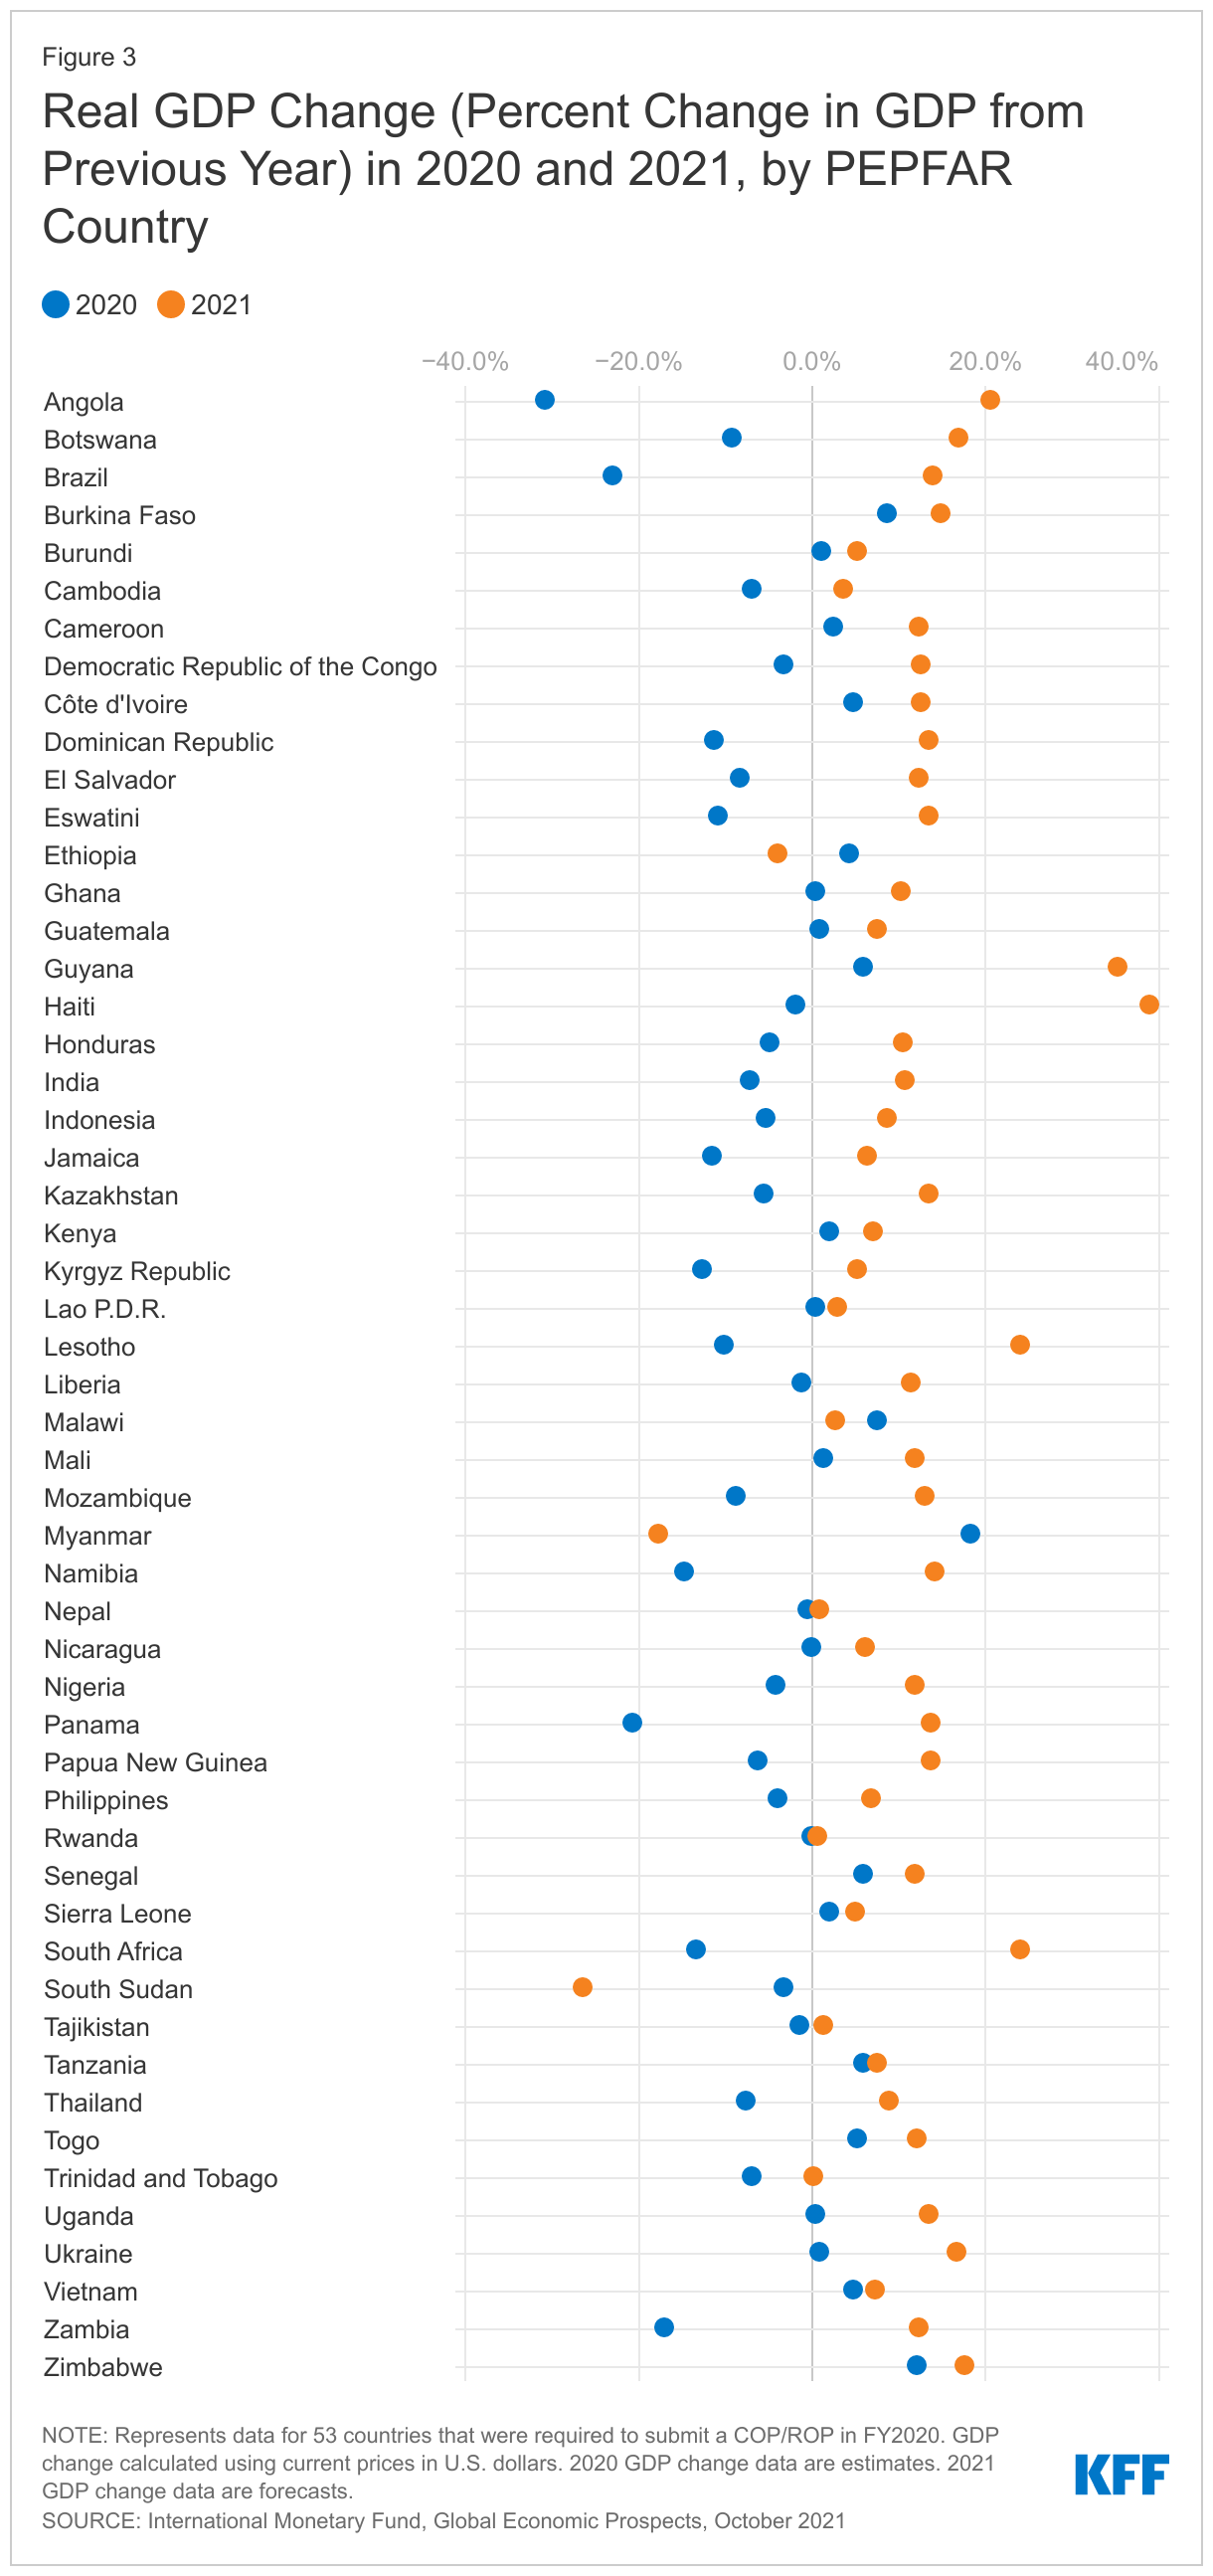
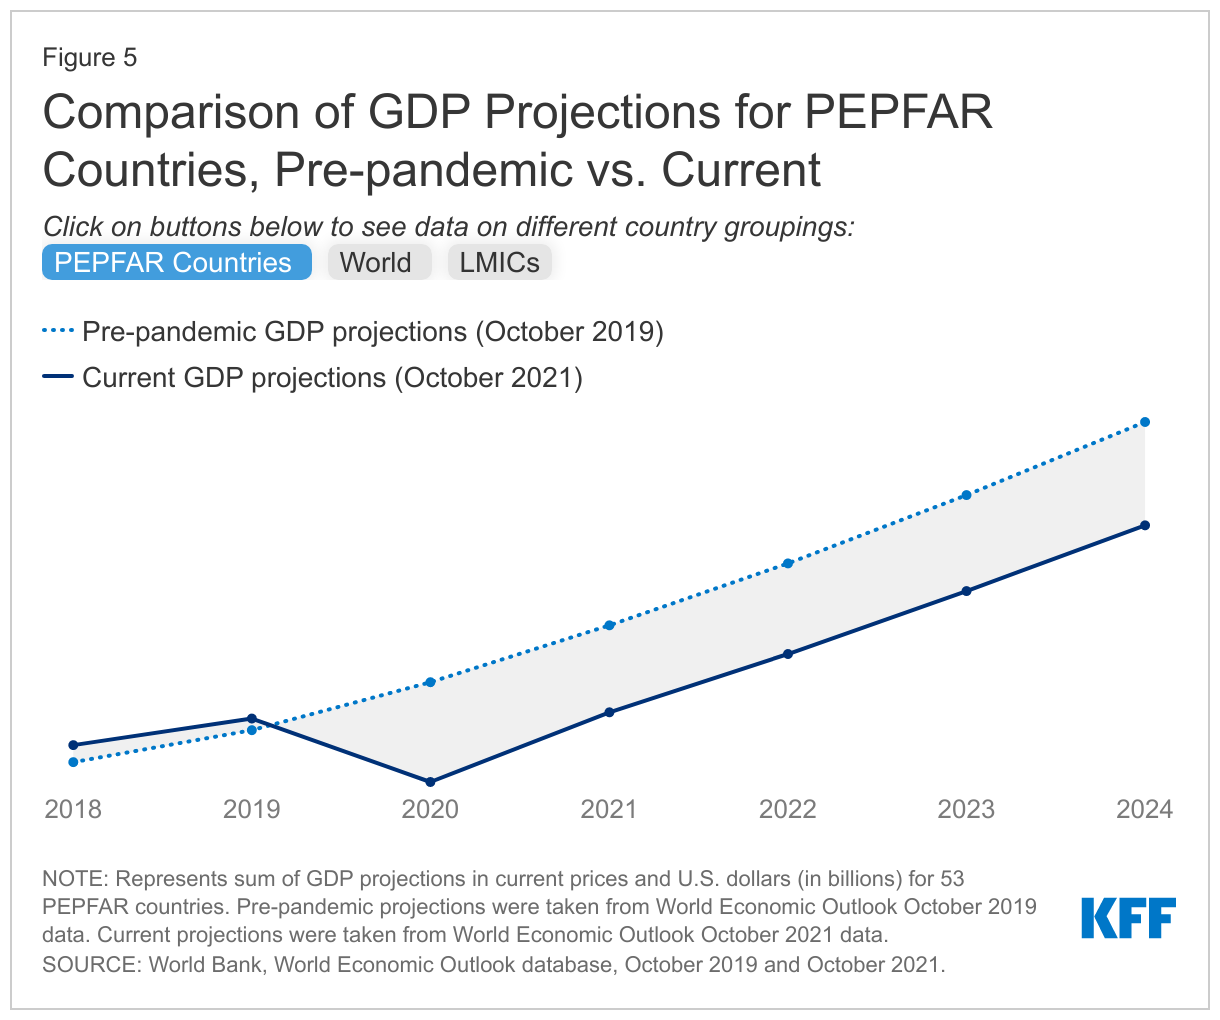
While the global economy was estimated to have recovered in 2021, this was not the case in PEPFAR countries. While almost all PEPFAR countries were estimated to have experienced some GDP growth in 2021, the projected growth, at least through 2024, remains below pre-pandemic projections (10-13% below). By contrast, the current projections of global GDP exceed the pre-pandemic projections. In addition, the challenges facing the global economy are likely to continue, particularly in low and middle-income countries, as the strong rebound in 2021 is expected to decelerate in 2022.
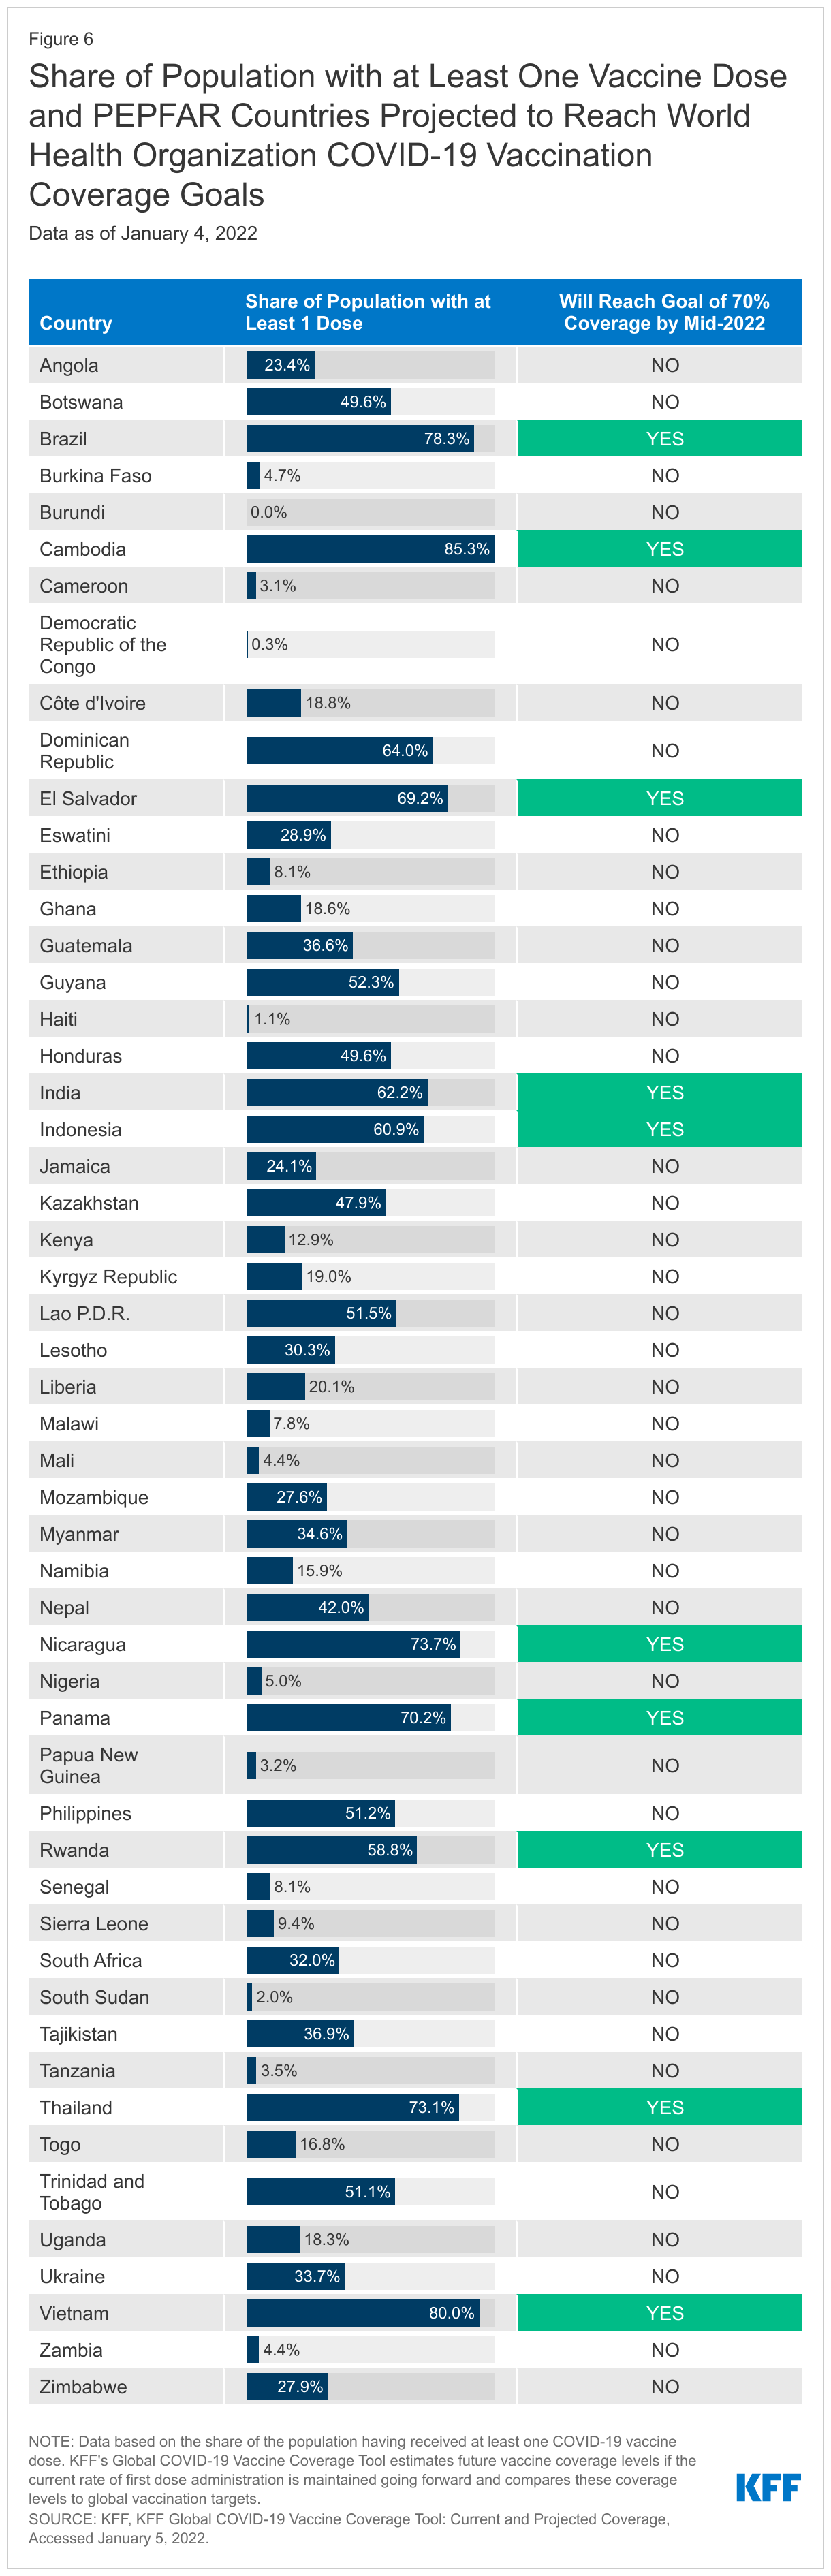
Finally, there is significant uncertainty facing economic recovery in PEPFAR countries, which will be highly dependent on the future course of the COVID-19 pandemic, economic relief efforts, and vaccine roll-out. Currently, in 30 of the 53 PEPFAR countries, less than a third of the population has received at least one vaccine dose and only 10 are on track to meet global COVID-19 vaccine targets this year.
Introduction
The toll the COVID-19 pandemic has exacted on the global economy has been significant, with the International Monetary Fund (IMF) estimating that global median GDP dropped by 3.9% from 2019 to 2020, making it the worst downturn since the Great Depression. Last year, in 2021, as countries started to reopen and vaccines became available, the global economy was estimated to grow, though still below pre-pandemic projections, and recovery has been uneven across countries and regions. In addition, the IMF has warned that vaccine access is the economic recovery “fault line”, as some countries look to resume normal activity and others continue to face new waves of infections and rising deaths. Indeed, vaccine coverage in low-income countries is well below all others and, at current rates, many are unlikely to reach global vaccine targets.
The White House U.S. COVID-19 Global Response and Recovery Framework includes an objective to “bolster economies and other critical systems under stress due to COVID-19 to prevent backsliding and enable recovery.” This will be especially important in countries where the U.S. has major investments in other health areas, such as PEPFAR, the U.S. global HIV/AIDS program. Because HIV is also an infectious disease, but one without a vaccine or cure, the economic impacts of COVID-19 on the HIV response could be as consequential as and exacerbate the direct health impacts.
This brief examines the current and projected economic impact of COVID-19 in PEPFAR countries. We used data from the International Monetary Fund’s (IMF) World Economic Outlook (WEO),1 on GDP and GDP growth projections2 for 53 countries3 that were required by PEPFAR to submit a Country Operational Plan or Regional Operational Plan (COP/ROP) in FY 2020.4 We also compared the IMF’s WEO pre-pandemic and current data projections to better understand the estimated economic impact. Pre-pandemic projections were taken from the October 2019 WEO database, and current data projections were taken from the October 2021 WEO database. The appendix contains WEO 2019-2021 GDP growth data, as of October 2021 for all 53 PEPFAR countries as well as the world median aggregate.
Key Findings
Economic Impact of COVID-19 in 2020
Almost all PEPFAR countries experienced GDP contractions in 2020 compared to 2019, and many fared worse than their economic and regional peers. Still, as a group, PEPFAR countries experienced less of a contraction than the global economy in 2020.
32 of the 53 PEPFAR countries (60%) were estimated to have experienced contractions in GDP in 2020. In 11 countries, the contraction was greater than 10%. Of the top five countries with the largest estimated contractions, three were in Sub-Saharan Africa (Angola, Zambia, and Namibia); the other 2 (Brazil and Panama) were in the Western Hemisphere. The contractions ranged from -0.04% (Nicaragua) to -30.9% (Angola) (see Figure 1).
21 PEPFAR countries experienced positive GDP growth in 2020 (see Figure 1), although in 11 of these countries, growth was lower than in 2019 (see Appendix 1).
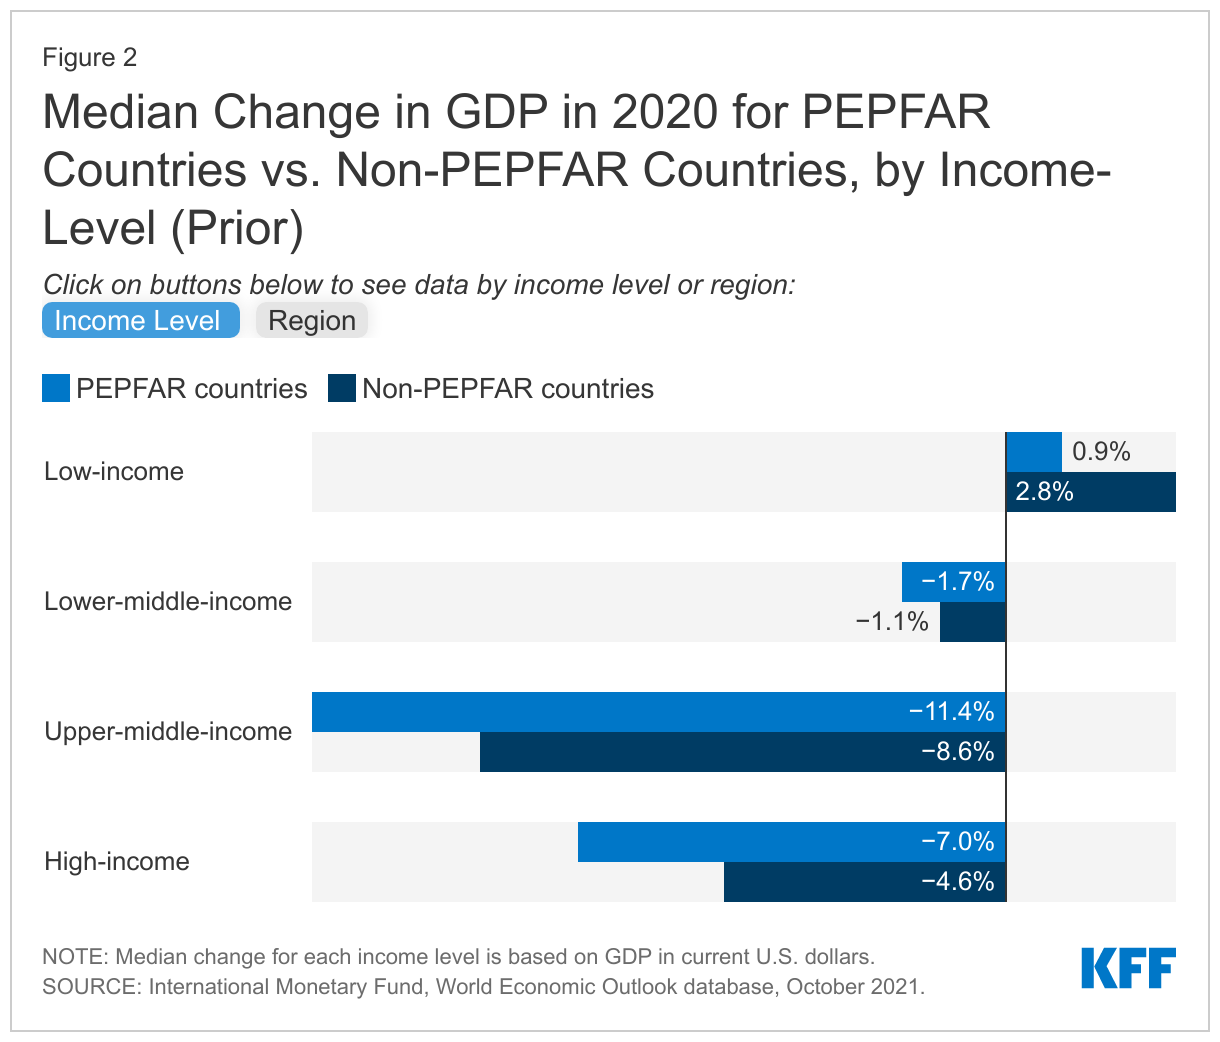
Compared to the global economy, PEPFAR countries as a group experienced less of a contraction in 2020 (1.9% median drop in PEPFAR countries compared to a 3.9% median drop globally) (see Figure 1), though compared to their economic and regional peers, PEPFAR countries generally lagged behind non-PEPFAR countries (see Figure 2).
Economic Impact in 2021 and Beyond
While almost all PEPFAR countries were estimated to see GDP grow in 2021, growth remains below pre-pandemic projections, in contrast to the global economy overall which is estimated to have fully recovered. In addition, there is future uncertainty.
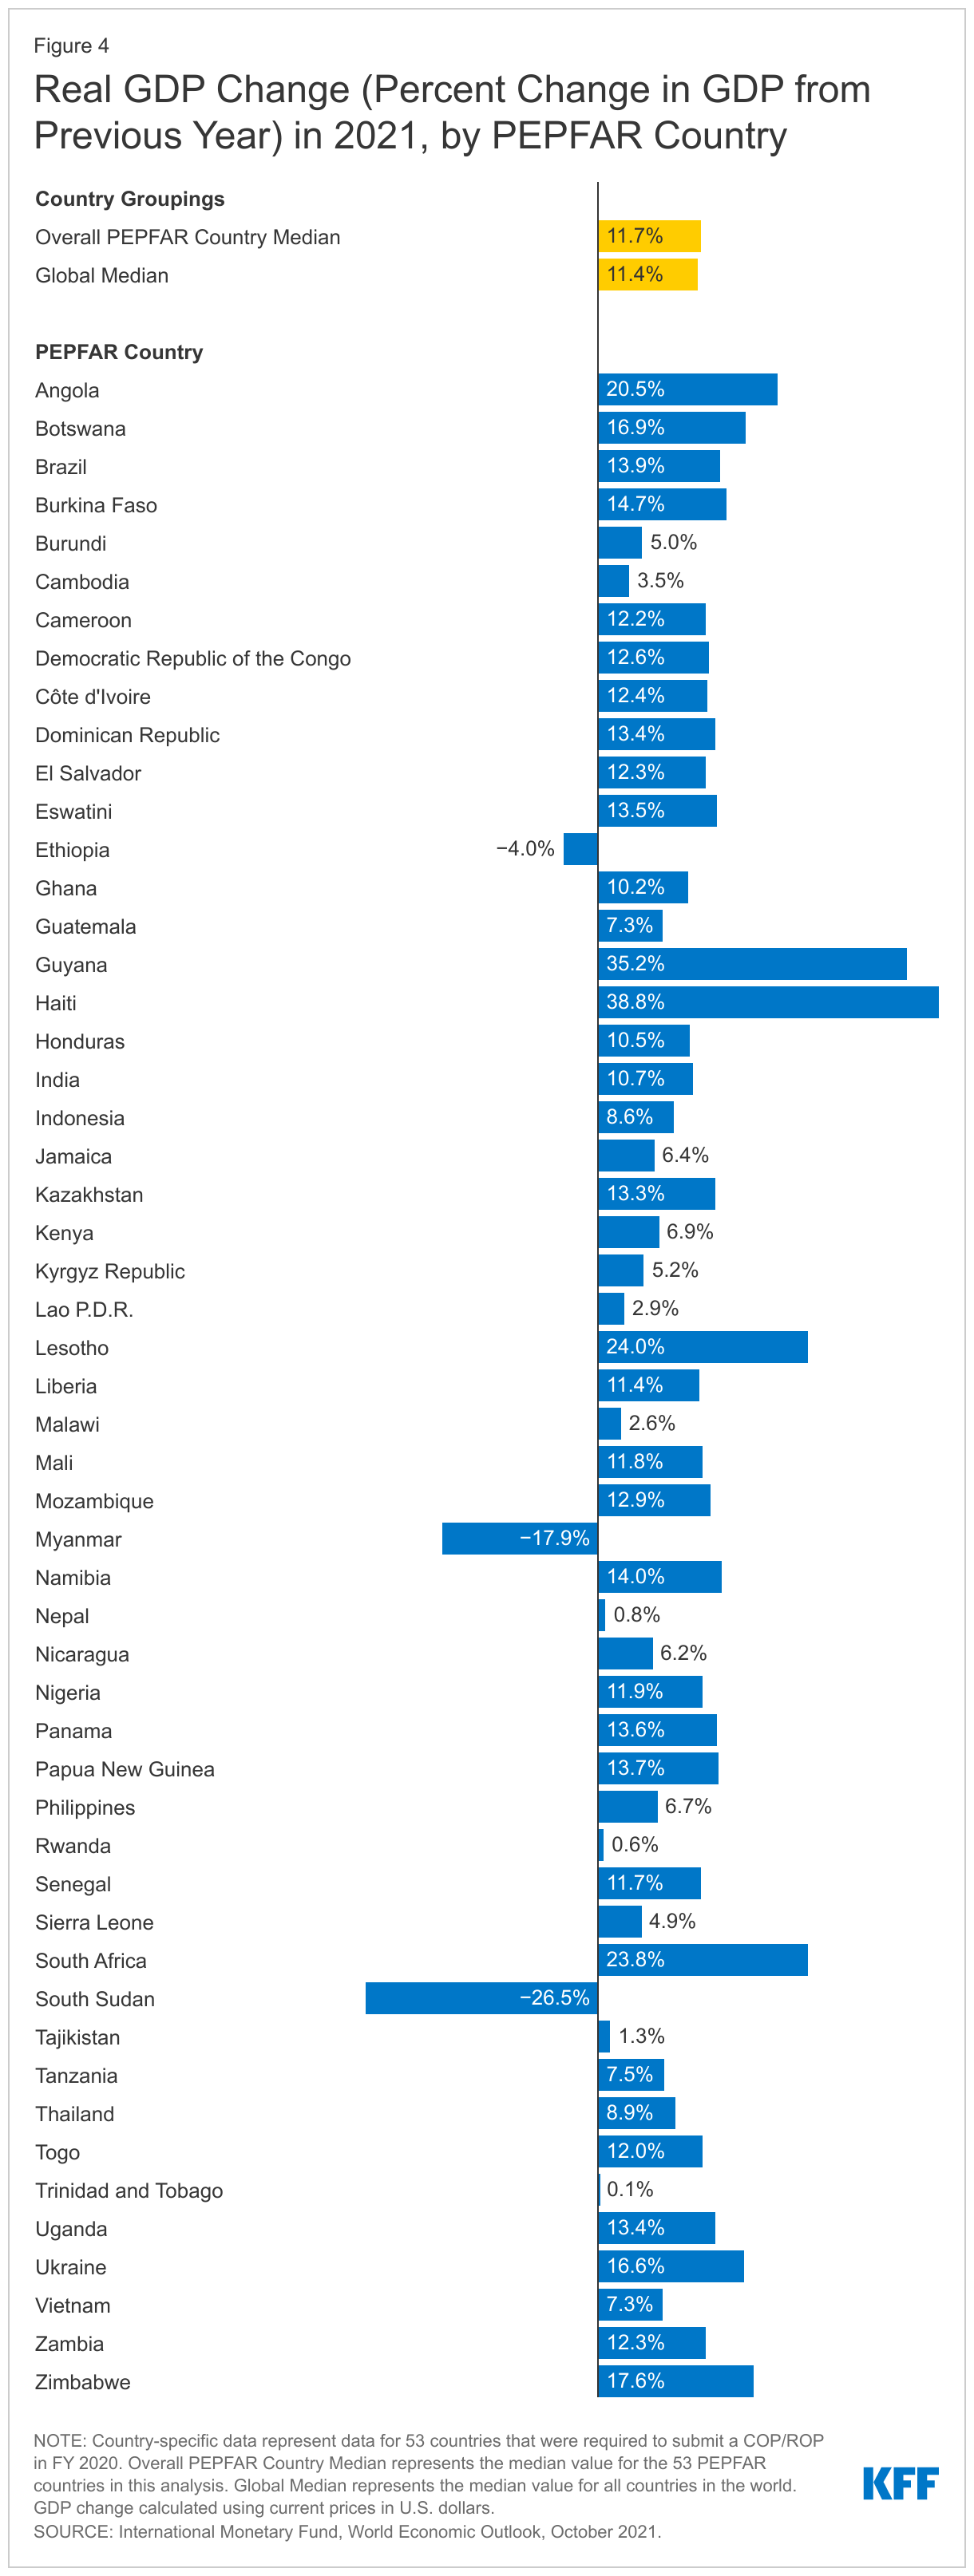
Almost all PEPFAR countries (49 countries or 92%) were estimated to have experienced some economic recovery in 2021, with higher GDP growth compared to 2020 (see Figure 3). Of the top five with the largest estimated GDP growth in 2021, two were in the Western Hemisphere (Haiti and Guyana); the other three were in Sub-Saharan Africa (Lesotho, South Africa, and Angola). GDP growth ranged from 0.06% (Rwanda) to 39% (Haiti) (see Figure 4). On the other hand, negative growth, or contractions, occurred for Ethiopia, Myanmar, and South Sudan.
Still, projected GDP of the 53 PEPFAR countries, as a group, is expected to remain below pre-pandemic projections, at least through 2024 (at 10-13% lower than the pre-pandemic outlook) (see Figure 5), as it does for 34 of the 53 countries.
By contrast, global GDP5 is not only estimated to have returned to its pre-pandemic projections in 2021, it is projected to exceed these as of 2022 and beyond. This largely reflects the strong and rebounding economies in high-income countries which have greater access to vaccines and a larger share of their populations vaccinated.6 And even though LMICs7 as a group are still projected to see lower GDP growth than their pre-pandemic projections (2-4% lower through 2024), they are anticipated to outperform PEPFAR countries over this period (see Figure 5). In addition, following the strong rebound in 2021, global economic growth is likely to decelerate putting further pressures on the recovery in low and middle-income countries.8
Future recovery in PEPFAR countries is uncertain and highly dependent on the future course of the COVID-19 pandemic, economic relief efforts, and, ultimately, vaccine roll-out. Currently, in 30 of the 53 PEPFAR countries, less than a third of the population has received at least one vaccine dose and only 10 PEPFAR countries (18%) are on target to reach the WHO goal of 70% vaccine coverage by mid-2022 (see Figure 6).9
Looking Ahead
It is clear that COVID-19 has set back economic progress worldwide and in PEPFAR countries. While PEPFAR countries, most of which are LMICs, did not appear to be as hard hit economically in the first year of the pandemic compared to the global economy, their current economic outlook is worse and recovery is slower compared to pre-pandemic estimates. This reflects several factors, including the challenges faced by many low-income countries, compared to hic-income counterparts, in providing fiscal relief to address the domestic effects of COVID-19 as well as the variation in the severity of pandemic-related disruptions and now, vaccine access. Moreover, this situation is unstable. Several PEPFAR countries are experiencing a significant increase in COVID-19 cases due to the emergence of the Omicron variant, and most are on the other side of the “vaccine fault line”, not expected to obtain significant vaccine access until well into this next year or beyond. The ongoing effects of COVID-19 and the fluidity of the global environment make it difficult to predict what the ultimate impact will be on PEPFAR countries’ economies and their HIV responses in the future. Recent PEPFAR data also show that economic problems are worse in countries with high HIV prevalence.10 This combination of factors may have particular implications for the U.S. role in supporting the HIV response, including the extent to which the U.S. seeks to provide broader economic relief or additional health funding to PEPFAR countries and/or focus additional efforts on their vaccine roll-out, some of which has already been piloted in select PEPFAR countries.11
Appendix
Endnotes
International Monetary Fund (IMF), World Economic Outlook, October 2021. ↩︎
GDP growth represents annual percentage change calculated using current prices in U.S. dollars. ↩︎
While 55 countries are included in the COP FY20 Guidance, activities in two of these countries – Barbados and Suriname—were discontinued over the past several years; as such, these countries are not included in the analysis. ↩︎
PEPFAR, PEPFAR 2020 Country Operational Plan Guidance for all PEPFAR Countries. ↩︎
Global estimate includes data for 196 countries and territories. ↩︎
KFF, KFF Global COVID-19 Vaccine Coverage Tool: Current and Projected Coverage, Accessed December 13, 2021. ↩︎
LMICs estimate includes data for 81 low- and lower-middle-income countries and territories. ↩︎
World Bank, Global Growth to Slow through 2023, Adding to Risk of ‘Hard Landing’ in Developing Economies, January 2022. ↩︎
KFF, KFF Global COVID-19 Vaccine Coverage Tool: Current and Projected Coverage, Accessed December 13, 2021. ↩︎
PEPFAR, PEPFAR 2022 Country Operational Plan Draft Guidance for all PEPFAR-Supported Countries. ↩︎