KFF designs, conducts and analyzes original public opinion and survey research on Americans’ attitudes, knowledge, and experiences with the health care system to help amplify the public’s voice in major national debates.
The growth in Medicare spending is a federal budget issue and also a pocketbook issue for beneficiaries. The rise in Medicare spending has contributed to a rise in Medicare premiums and deductibles as a share of Social Security income over the past two decades. Between 2002 and 2022, Medicare Part B premiums alone increased from 6% to 10% of the average Social Security benefit. Adding in Part A and Part B deductibles for hospital and physician services, these costs combined have increased from 15% of the average Social Security benefit in 2002 to 19% in 2022.
The Medicare Trustees project that Medicare premiums and cost sharing will account for an increasing share of Social Security benefits in the future. While most beneficiaries have other sources of income in addition to Social Security that are not factored into these estimates, they also incur additional out-of-pocket costs for other health-related expenses, such as prescription drugs, cost sharing for physician visits, and costs for services not covered by Medicare, such as dental care and long-term services and supports.
There are persistent disparities in health and health care for people of color, which reflect structural and systemic inequities rooted in racism and discrimination. Inadequate, incomplete, and inconsistent race/ethnicity data is a longstanding challenge across many areas of health care. High-quality comprehensive data are key to enabling policymakers, community leaders, and other key stakeholders to identify and address these inequities and measure progress over time.
Medicaid and the Children’s Health Insurance Program (CHIP) provide health care coverage to low-income adults and children, and play a disproportionately large role in covering people of color, people experiencing poverty, individuals with limited English proficiency, and those who live at intersections of these characteristics. Medicaid/CHIP administrative data, also known as Transformed Medicaid Statistical Information System (T-MSIS) or TAF (T-MSIS Analytic File), hold the potential to inform disparities research through detailed demographic, service utilization, and spending data of Medicaid and CHIP beneficiaries —but there are current limitations. Key demographic variables, particularly race and ethnicity, vary in completeness and quality, raising questions about data usability and reliability. These quality issues may impede T-MSIS analytic file users’ abilities to understand racial and ethnic disparities and advance health equity among Medicaid and CHIP beneficiaries. In this issue brief, we use the Medicaid DQ Atlas and T-MSIS analytic files to examine the data quality of race/ethnicity and other demographic variables in calendar year (CY) 2019 T-MSIS data.
What is T-MSIS?
T-MSIS Analytic Files (TAF) provide beneficiary-level data including health care use, demographics, and enrollment data for Medicaid and CHIP enrollees in all 50 states, District of Columbia, Puerto Rico, Guam, and Virgin Islands. T-MSIS replaced the Medicaid Statistical Information System (MSIS) by 2016 and analytic files became available to researchers in Fall 2019. T-MSIS builds on data collected in MSIS to include: enhanced information about beneficiary eligibility; beneficiary demographics; provider data; fee-for-service and managed care service utilization; expenditure data for Medicaid and CHIP; and more. However, quality issues limit its full potential.
Variation of state data collection, naming, and categorization procedures, as well as state-specific data challenges contribute to T-MSIS quality issues. While federal requirements mandate some aspects of coverage and operation of Medicaid and CHIP programs, states have a great deal of flexibility in implementation and administration of their state’s program. This variation is reflected in state data systems, with each state collecting, categorizing, and storing data somewhat differently. For example, states vary in the number of categories they use to collect race/ethnicity data, as well as how these variables are named and combined to create aggregated race/ethnicity categories that conform to federal Office of Management and Budget (OMB) racial and ethnic data reporting standards. Furthermore, each state may individually have its own data quality problems, which, if left unnoticed or unresolved, may affect T-MSIS data quality unless they are caught by CMS’s efforts to improve data quality.
How do states collect race/ethnicity and how are these data presented in T-MSIS analytic files?
All Medicaid/CHIP agencies ask applicants to self-report their race and ethnicity, but it is not mandatory for applicants to do so. During Medicaid or CHIP eligibility determinations, race and ethnicity are not considered, and data not being used in Medicaid determinations must remain optional for applicants to report. States must indicate that submitting race/ethnicity data is optional, but this can lead to missing data, particularly if the instructions and rationale for providing race/ethnicity data are unclear, if the applicant has concerns or questions about how the data may be used, or if they do not feel they fit into one of the options provided.
The categories of race and ethnicity variables on Medicaid applications vary considerably across states. At a minimum, states are required to comply with 1997 OMB guidelines for race (5 categories) and ethnicity (2 categories) reporting standards, but can opt to collect more detailed data if it can be consolidated into the minimum reporting categories. An audit of state Medicaid enrollment applications conducted by State Health Access Data Assistance Center (SHADAC) revealed substantial variation in the number and type of race/ethnicity categories used by states, ranging from 5 to 37 race categories and 2 to 8 ethnicity categories. Since some states presented one set of categories in the online version of the application and a different set in the paper applications, the audit identified 62 unique race categories across the 50 states included in the analysis.
States also vary in the instructions and rationale provided to beneficiaries for reporting race/ethnicity data. Below, we highlight select examples of these instructions from SHADAC’s review of Medicaid applications:
You don’t have to answer this question. In most cases, your answer won’t be used to make a decision. But, if this person is American Indian or Alaska Native, telling us here may help this person get the most help possible.” – Florida’s Medicaid application instructions
“Providing your race and ethnicity can be helpful since it can speed up the application process. It may be used to automatically create your case.” – Delaware’s Medicaid application instructions
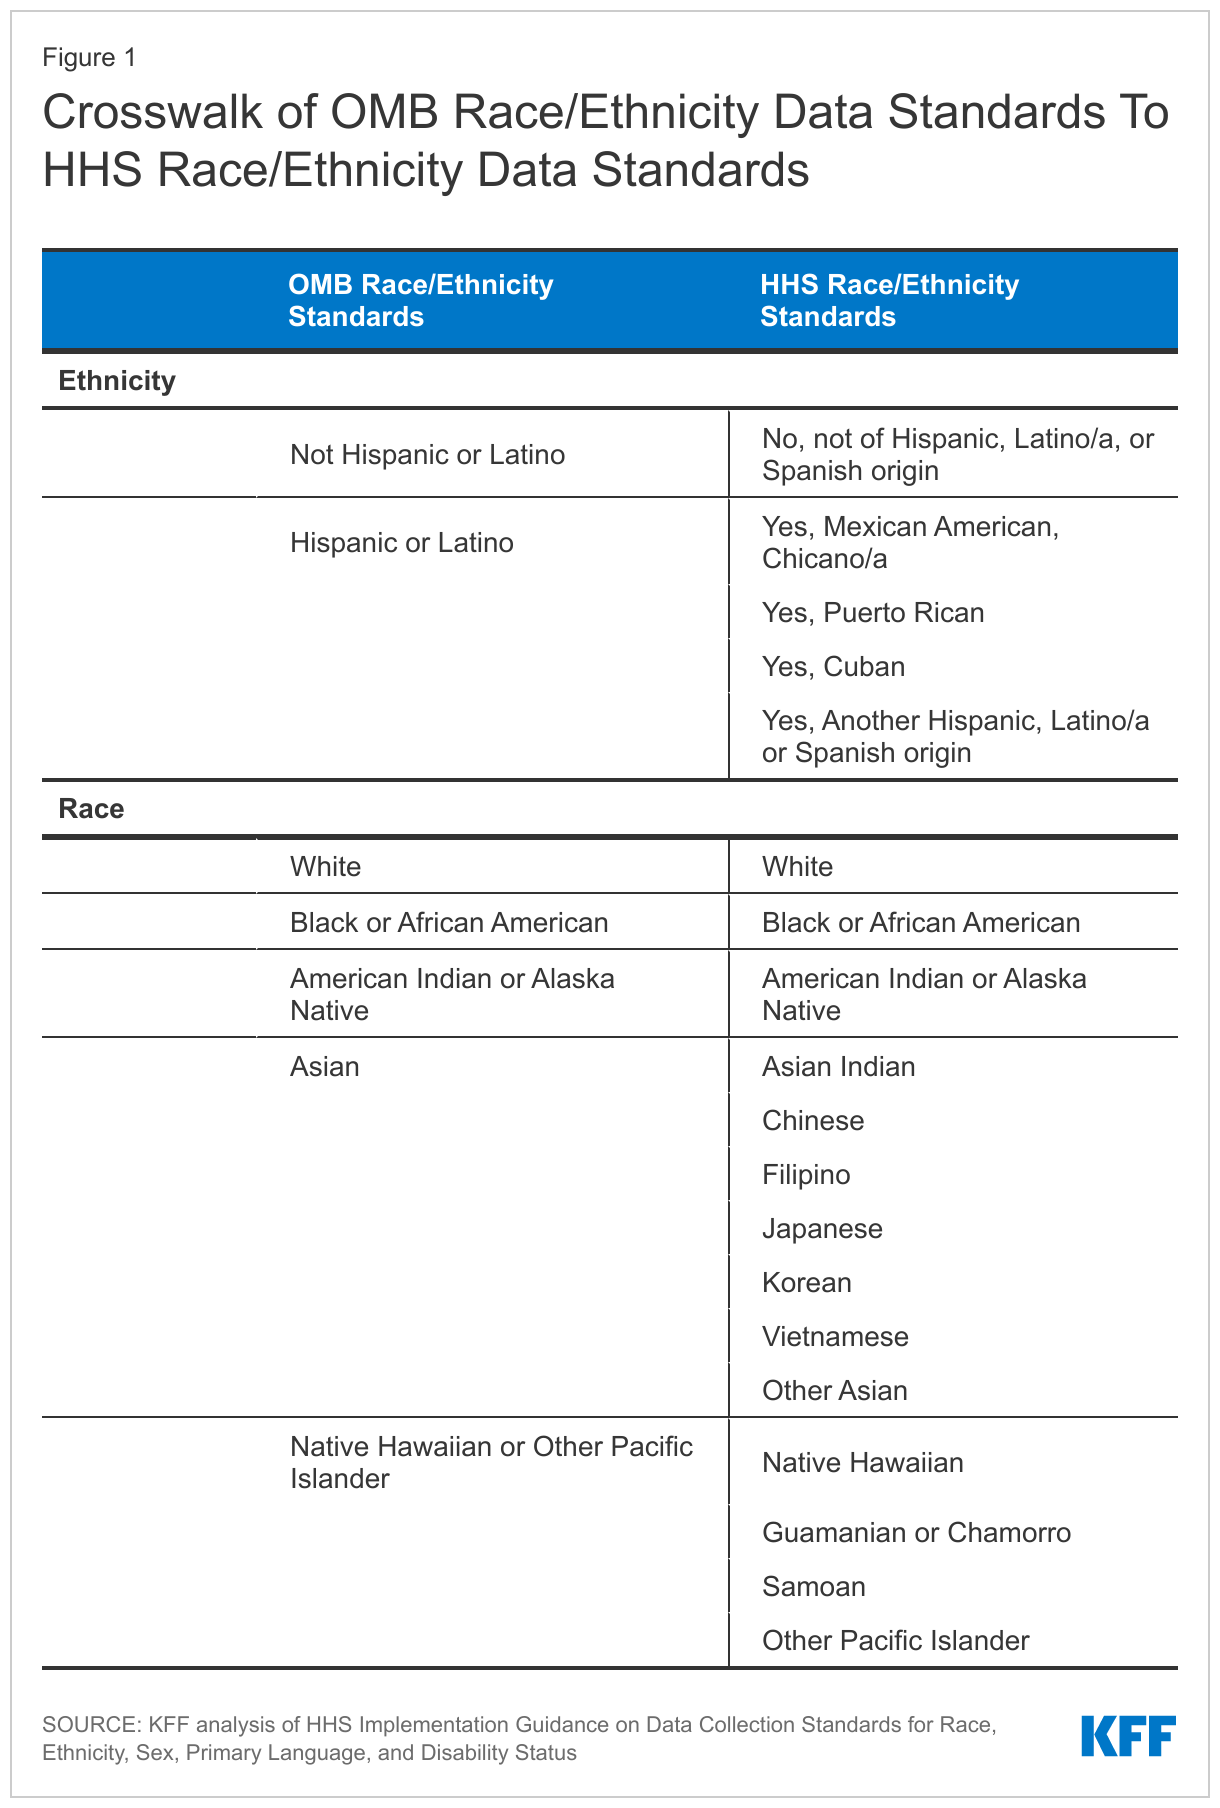
Given the substantial differences in how states collect data on race and ethnicity, CMS provides technical instructions to states about reporting race and ethnicity when submitting T-MSIS data. T-MSIS race and ethnicity data elements align with the 2011 HHS data standards. These categories may be more granular than some states’ Medicaid applications since states are only required to collect the less granular OMB standard values, though that is not always the case. Current OMB guidelines define ethnicity in two categories and race in five categories. The more detailed HHS standards reports race in 14 categories and ethnicity in five categories (Table 1).
The race and ethnicity data that states submit to T-MSIS are then converted into several key race and/or ethnicity variables available to researchers in the T-MSIS analytic files (TAF). Variables available to TAF users include: 1) a constructed seven-category combined race and Hispanic ethnicity variable (White, non-Hispanic; Black, non-Hispanic; Asian, non-Hispanic; American Indian and Alaska Native (AIAN), non-Hispanic; Hawaiian/Pacific Islander; Multiracial, non-Hispanic; Hispanic, all races); 2) a six-category Hispanic ethnicity variable; and 3) a disaggregated, constructed 20-category combined race and ethnicity variable, which includes seven ethnic categories for people of Asian descent, and four ethnic categories for Native Hawaiian and Pacific Islander people, in addition to the broader race and Hispanic ethnicity categories. The TAF does not include a variable that reports race solely.
How reliable are the T-MSIS race/ethnicity data?
To help TAF users evaluate the data quality of various measures, the Data Quality Atlas (DQ Atlas) was developed as a companion to T-MSIS data. The DQ Atlas, which is available for each year and release of data, provides data quality information about some, but not all, of the variables available in T-MSIS analytic files. One key data element the DQ Atlas provides is usability measures on race/ethnicity data. The DQ Atlas evaluates the completeness of race and ethnicity information in the T-MSIS analytic files and compares the T-MSIS estimates to the U.S. Census Bureau’s American Community Survey (ACS). Substantial missing data and/or data that do not line up with ACS estimates raise red flags about data quality. The DQ Atlas combines these two indicators of data quality to generate an overall rating system to alert researchers about the level of data concern. States are grouped into the following categories: low concern, medium concern, high concern, unusable, and unclassified. While many data elements in the DQ Atlas are evaluated using external benchmarks, some are only evaluated on the basis of missingness since not all measures have an external benchmark.
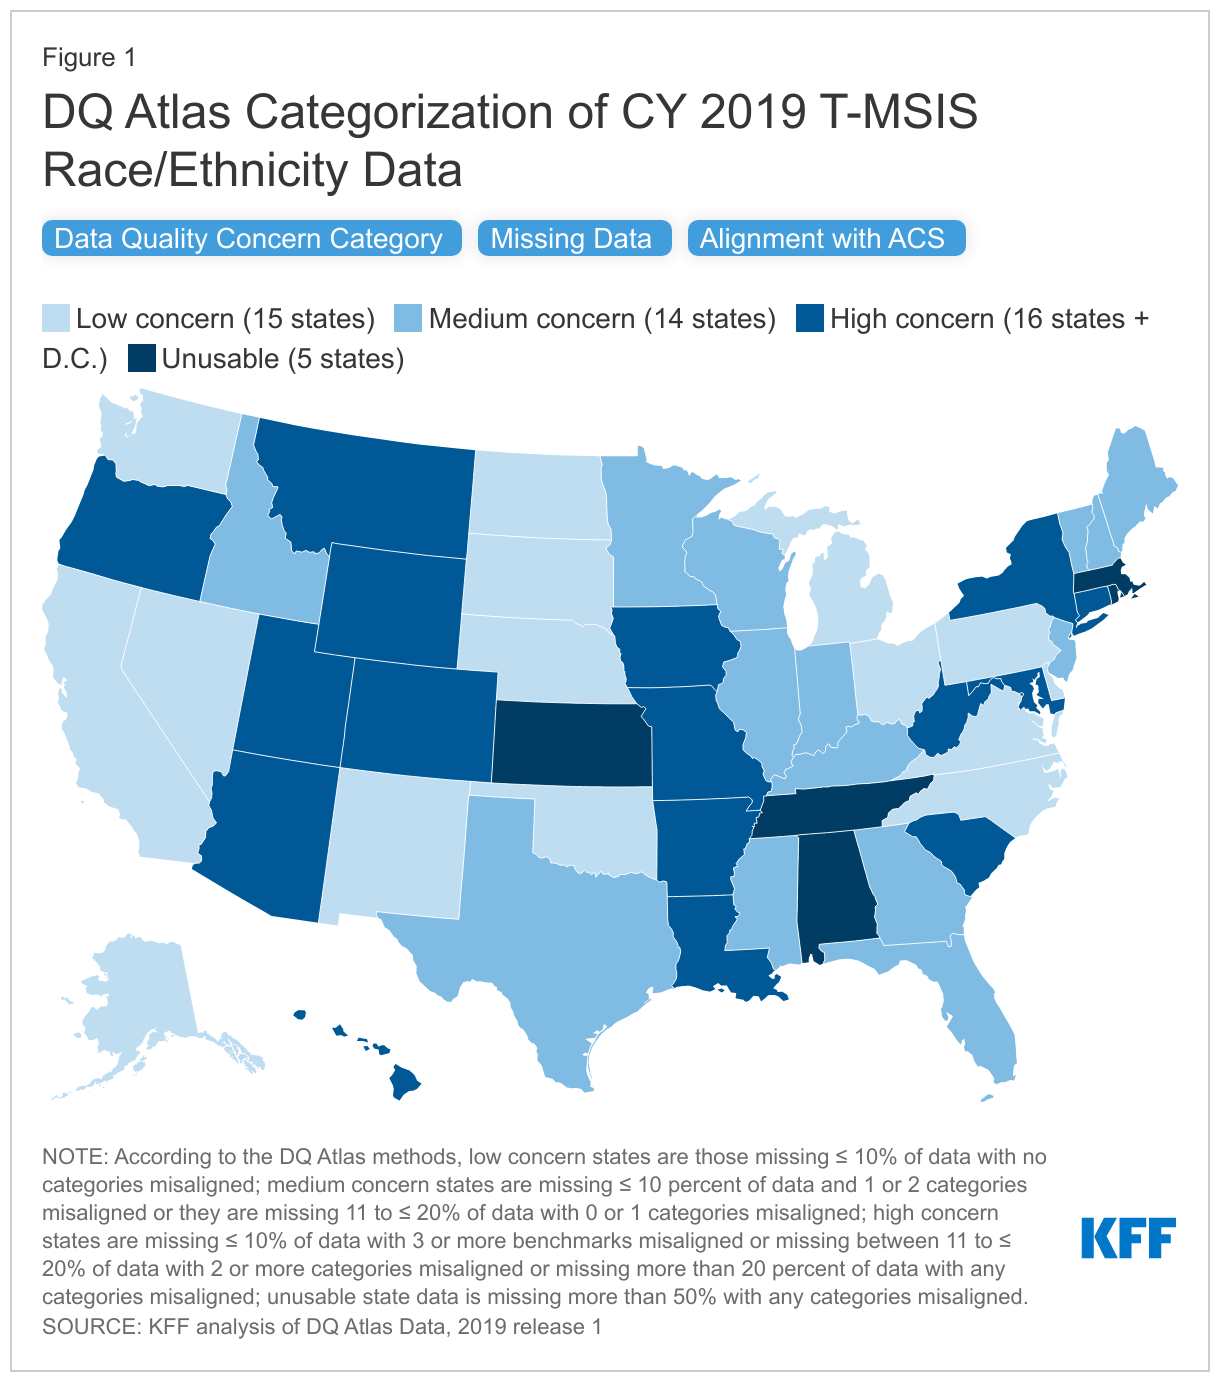
In the 2019 T-MSIS analytic file, over 70% of states (36 of 50 states plus D.C.) had race/ethnicity data categorized as medium concern, high concern, or unusable in the DQ Atlas(Figure 1). Only 15 states’ race/ethnicity data in T-MSIS analytic files were categorized as “low concern” in 2019. The DQ Atlas combines two measures to categorize states into concern categories: 1) missingness of the race/ethnicity variable and 2) alignment with ACS race/ethnicity estimates.
When examining missingness separately, the DQ Atlas finds that missing race/ethnicity data varies widely by state, ranging from 0% to 100% missing, with a national average of 22% missing. Over half of all states, including D.C., (63%) are missing more than 10% of race and ethnicity data (Figure 1).
When comparing separately to the ACS race/ethnicity benchmarks, the DQ Atlas finds that over half of states (55%) have one or more categories of race/ethnicity that are not aligned with race/ethnicity estimates from the American Community Survey (Figure 1). When T-MSIS race/ethnicity differs more than 10 percentage points from ACS race/ethnicity data, it is considered not aligned.
Similar analyses have been conducted by Medicaid and CHIP Payment and Access Commission (MACPAC), one of which identified race and ethnicity data as an area with “ongoing analytical challenges.”
CMS technical instructions note that there may be additional challenges when individuals select multiple races or ethnicity categories. Growing numbers of people are reporting they are “some other race” or “multiracial,” but some states only allow beneficiaries to report a single “multiracial” or “other” category instead of selecting multiple races. People who report more than one race are often grouped into a “multiracial” or “other’ category in reporting, limiting the ability to meaningfully interpret the data. States may also have technical challenges with reporting data to T-MSIS in cases when applicants select multiple races or ethnicities.
Are there other options for evaluating quality of T-MSIS race/ethnicity data?
Researchers can use the DQ Atlas’ categorizations to identify states with low data quality. In some cases, however, this may restrict sample sizes. For example, 15 states, representing approximately 37 million Medicaid beneficiaries, reported race/ethnicity data that were considered of low concern in CY 2019, according to the DQ Atlas (Figure 1). There are several other options to evaluate the quality of T-MSIS race/ethnicity and, in some cases, increase the analytic sample.
Increasing the threshold for missingness for states where T-MSIS data match ACS benchmarks. It may be possible to include states where missing data is slightly above 10% but all race/ethnicity estimates align with ACS reporting. There are eight states with an average of 12% of data missing whose race/ethnicity estimates are considered aligned with the ACS benchmarks (i.e., estimates within 10 percentage points). These states are currently categorized as “medium concern” because their missingness is just above the 10% threshold. However, including data from these states would add 8 additional states, and 17.4 million additional beneficiaries.
Adjusting alignment thresholds for ACS and T-MSIS race and ethnicity estimates. Although some states’ race and ethnicity data are closely aligned with ACS data, they are just above DQ Atlas’ threshold for allowable percentage point difference between estimates (i.e. estimates within 10 percentage points). State-level percent differences in estimate between ACS and T-MSIS vary from 0% to 61.8%, with an average misalignment of 5.6% overall. Slight increases to the allowable thresholds may result in increases to the usable sample. For example, increasing the allowable percentage point difference to 11.0 (from 10 percentage points) would result in four additional states where all race/ethnicity data match ACS benchmarks.
Broadening the definition of usable data. MACPAC, for example, cites that the DQ Atlas data quality categorizations of ‘low concern’ or ‘medium concern’ meet MACPAC’s minimum data standards for analysis. By adopting this approach to include states with low and medium concern data, the number of states that can be included in analyses using disaggregated race/ethnicity data increases to 29 and represents about 63.8 million Medicaid beneficiaries, when using 2019 Release 1 TAF data (users with access to more recent T-MSIS data may show a higher number of states categorized as low or medium concern). For researchers who adopt MACPAC’s approach, it may be helpful to consider the level of misalignment on a state-by-state basis. Specifically, DQ Atlas categorizes states with less than 10% of missing data and two or less misaligned race/ethnicity groups as medium concern. Aside from the definition of misalignment (that is, estimates that differ by at least 10 percentage points), the DQ Atlas does not account for the level of race/ethnicity group misalignment, which varies by up to 61 percentage points.
What information is available for other variables important for disparities and equity research?
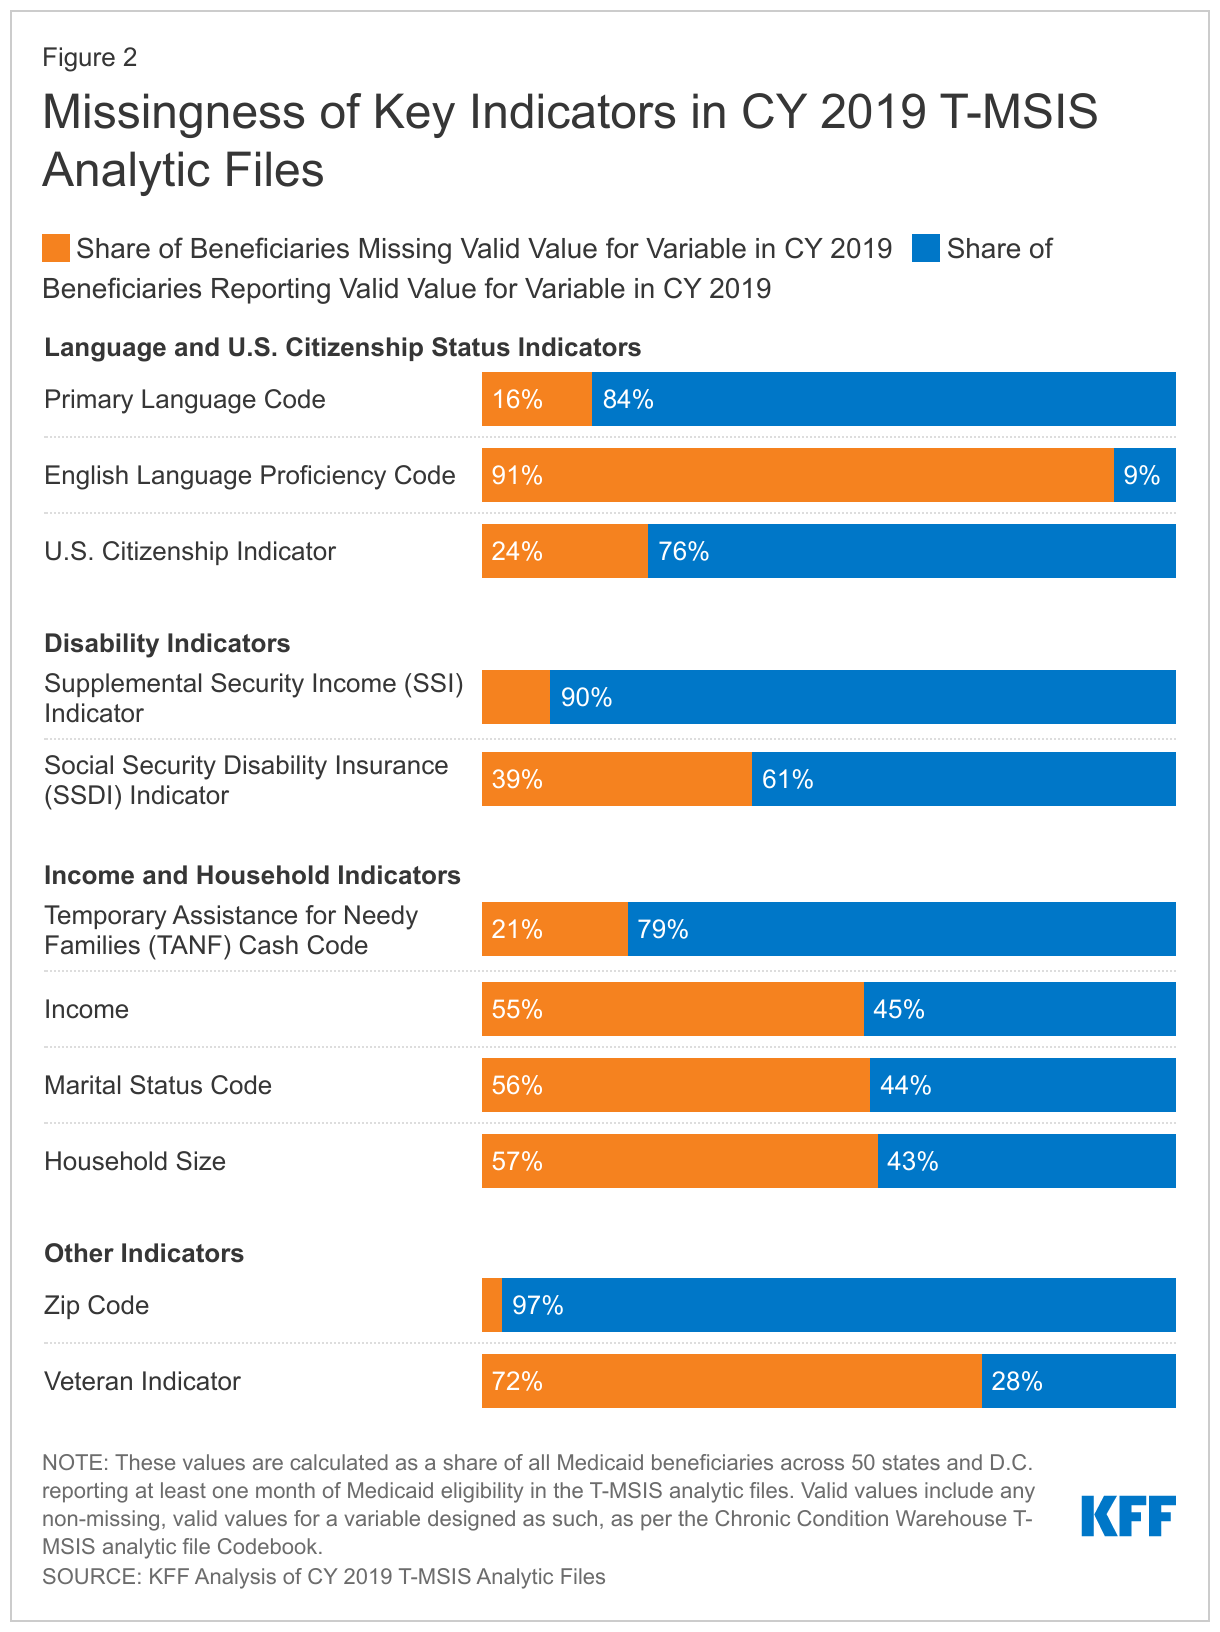
T-MSIS analytic files include additional variables that are important for disparities and equity research, though less information is available about state data collection methods. In addition to race and ethnicity, T-MSIS includes beneficiary-level metrics on income, gender, age, primary language, English language proficiency, citizenship, receipt of Supplemental Security Income or Temporary Assistance for Needy Families, zip code, veteran status, and indicators of disability. While information on state data collection procedures for these other variables is more limited, a recent audit of state applications found most states collect primary language information on their applications, and some states also inquire separately about written language.
KFF analysis of CY 2019 T-MSIS analytic files finds wide variation in the magnitude of missing data across key indicators that are also important for equity research (Figure 2). Across all 50 states and D.C., zip code and SSI indicator have relatively low levels of missing data (3% and 10% missing, respectively), whereas other variables, such as English language proficiency and veteran status have very high levels of missing data (91% and 72% complete, respectively).
Looking Ahead
As a major source of health coverage for people of color, Medicaid can play a significant role in helping to address racial and ethnic health disparities. Prioritizing comprehensive and high-quality data on race and ethnicity is important to these efforts. Inadequate data can result in the failure to identify disparities or the implementation of policies that may exacerbate disparities and reinforce structural racism and inequities across the health care system. Most states are engaged in Medicaid initiatives to address racial and ethnic disparities, with some states focusing on racial and ethnic disparities in specific outcomes, like maternal/infant health and behavioral health. High quality and complete data, including measures of health equity, will be key for implementing and assessing the impacts of these efforts.
CMS has identified T-MSIS priority items to guide data quality improvement efforts, some of which include race/ethnicity and other variables. Other federal agencies, such as the Office of Inspector General, are taking notice and launching their own inquiries into data quality issues. States can also take action to improve data quality. An NORC analysis highlighted state efforts that resulted in better data quality and completeness, including expanding race, ethnicity, and language categories; making applications available in various languages and formats (online, phone, paper); using the Medicaid application instructions as an opportunity to explain how the state will use race, ethnicity, and language data to advance health equity to encourage completion of these sections; and linking race, ethnicity, and language data collection to equity-based performance measures. Some states, like California, require that managed care plans participate in filling gaps in race/ethnicity data by requiring health plans to obtain a minimum of 80 percent of enrollee race/ethnicity data. California’s enhanced reporting requirements are tied to financial incentives and penalties, which have resulted in improved race/ethnicity data.
Improvements to the quality of race/ethnicity data and other variables will take time. In the interim, researchers can explore other potential options to increase the usable sample of enrollees in the currently available T-MSIS analytic files. However, each analysis will require thoughtful discussions around data quality, limitations, and whether the data is sufficient for presentation at the state or national level.
A new KFF interactive provides essential facts and trends about spending on Medicare, the federal health insurance program that covers 65 million seniors and people with disabilities, or nearly 1 in 5 Americans.
In 2020, Medicare spending accounted for 12 percent of the federal budget and 20 percent of national health care spending. Given its size and importance, the program is often part of discussions about how to better manage total federal government spending, health care spending in the U.S., and the affordability of health care costs.
The new interactive, The Facts About Medicare Spending, provides the most current information available to help frame these discussions, based on the latest data from Medicare’s actuaries, the Congressional Budget Office, and other government sources. The interactive features information on Medicare enrollment growth, Medicare spending trends overall and per person, growth in Medicare spending relative to private insurance, spending on Medicare benefits and Medicare Advantage, Medicare Part A trust fund solvency challenges, and growth in out-of-pocket spending.
Among the highlights:
In 2020, Medicare benefit payments totaled $769 billion, up from just under $200 billion in 2000. Spending is projected to increase to nearly $1.5 trillion in 2031, due to growth in the Medicare population and increases in health care costs.
The number of Medicare beneficiaries is projected to grow from around 65 million people in 2020 to nearly 93 million people in 2060. The aging population is one factor contributing to higher Medicare spending, since spending per person is higher among older beneficiaries.
Medicare Advantage plans accounted for nearly half of all Medicare spending in 2021, up from just over a quarter in 2011, and the share is expected to keep growing. Payments to Medicare Advantage plans nearly tripled from $124 billion to $370 billion over that timeframe. That number is expected to rise to $801 billion by 2030.
Beneficiaries’ out-of-pocket spending has increased with the rise in Medicare spending. The amount that beneficiaries spend on certain Medicare premiums and deductibles has increased from 15 percent of the average Social Security benefit in 2002 to 19 percent in 2022.
The Medicare Trustees project that there will be enough money in the Part A trust fund to pay for hospital benefits in full until 2026, after which Medicare will be able to pay 91 percent of such costs, unless Congress takes action.
To see the interactive, as well as other data and analyses related to Medicare, visit kff.org
The public health and economic effects of the pandemic continue to affect the well-being of many people living in the United States. Over the course of the pandemic, millions have lost jobs or income and have faced difficulty paying for expenses including basic needs like food and housing. These social and economic challenges affect people’s health and well-being. Federal legislation has provided billions in funding to address the public health crisis of the pandemic and to provide economic support to many low-income people struggling to make ends meet. This brief provides an overview of how adults are faring across an array of measures of social determinants of health as of March 2 – March 14, 2022 based on data from the Census Bureau’s Household Pulse Survey, which was designed to quickly compile data about how people’s lives have been impacted by the coronavirus pandemic. For this analysis, we looked at a range of measures over the course of the pandemic. Unfortunately, the Household Pulse Survey does not provide pre-pandemic measures for comparison. While we have tracked data over time and there have been fluctuations at various points since March 2020, patterns of hardship remain largely consistent and changes in measures do not necessarily follow economic indicators or pandemic trends.
What are social determinants of health?
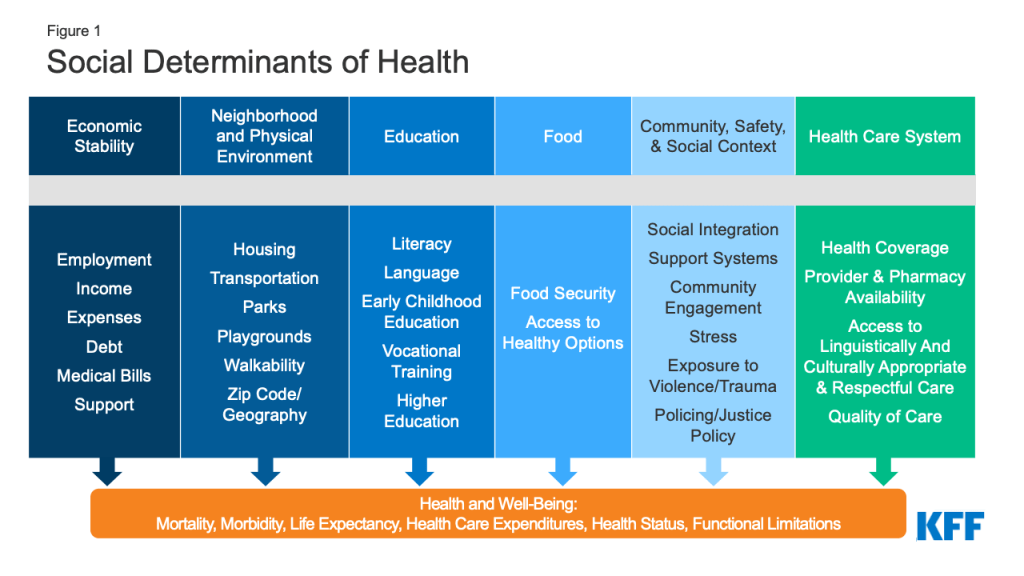
Social determinants of health are the conditions in which people are born, grow, live, work, and age.1 They include factors like socioeconomic status, education, neighborhood and physical environment, employment, and social support networks, as well as access to health care (Figure 1).
Figure 1: Social Determinants of Health
Though health care is essential to health, research shows that health outcomes are driven an array of factors outside the health care system may play an even larger role in shaping health. Extensive research concludes that addressing social determinants of health is important for improving health outcomes and reducing health disparities.2 Prior to the pandemic there were a variety of initiatives underway to address social determinants of health both in health and non-health sectors. The COVID-19 pandemic has not only disproportionately affected the health of people of color and other high-need groups, but also had disproportionate impacts on economic and social factors.
How are adults faring across a range of social determinants of health during the pandemic?
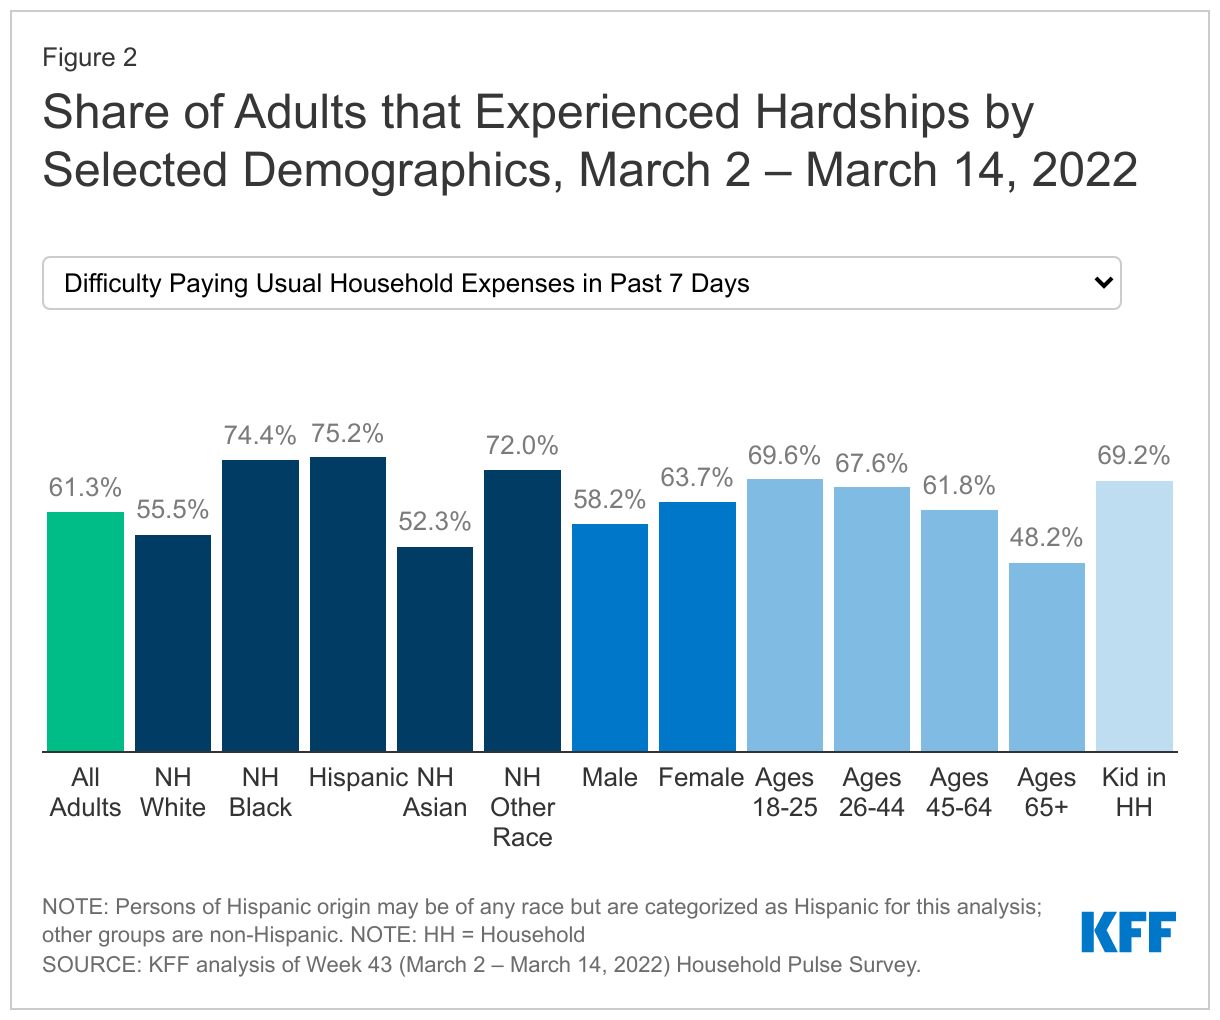
Across a wide range of metrics, large shares of people are experiencing hardship. Data for the most recent period, March 2 – March 14, 2022, show that (Figure 2):
More than one in eight adults (13.6%) reported that they or someone in their household had experienced a loss of employment income in the past four weeks;
More than six in ten (61.3%) of adults reported at least a little difficulty paying for usual household expenses in the past 7 days, and 31.8% used credit cards or loans to meet household spending needs;
7% of adults had no confidence in their ability to make next month’s housing payment (across renters and owners), and 10.3% reported food insufficiency in their household;
Nearly one in three (31.4%) adults reported symptoms of depression or anxiety.
Black and Hispanic adults fare worse than White adults across nearly all measures, with large differences in some measures. In early March 2022, three quarters of Black and Hispanic adults (74.4% and 75.2%, respectively) reported difficulty paying household expenditures compared to 55.5% of White adults; 9.6% of Black adults and 8.4% of Hispanic adults reported no confidence in their ability to make next month’s housing payment compared to 4.0% of White adults; and 20.4% of Black adults and 16.2% of Hispanic adults reported food insufficiency in the household compared to 7.1% of White adults. Furthermore, nearly a fifth of Black adults, and about one in four Hispanic adults reported living in a household that experienced a loss of employment income in the last four weeks (17.1% and 23.0%, respectively) compared to 10.2% of White adults.
Patterns of hardship over time indicate both the effects of the pandemic and related policies as well as longstanding disparities in social determinants of health. Data indicate that the share of people experiencing depression or anxiety, food insufficiency, loss of employment income, and having no confidence in paying for their housing peaked in December 2020 but have otherwise remained largely stable (data not shown). Notably however, the share of adults having at least a little difficulty paying usual household expenses in the past 7 days has risen significantly from 50.9% in early September to 61.3%. This could potentially be due to rising prices for many household goods. However, differences in rates of hardship among certain populations have been evident throughout the pandemic and to some extent reflect longstanding disparities that existed even before the pandemic.
While variation across age and gender was not as stark, younger adults (ages 18 to 44) fared worse on many measures compared to older adults. For example, higher shares of younger adults reported symptoms of anxiety and depression as well as having a little difficulty paying for usual household expenses. In addition, higher shares of women reported symptoms of depression or anxiety and difficulty paying usual household expenses in the past seven days compared to men.
Across most measures, adults with children in their household fared worse compared to overall adults. For example, 17.5% of adults with children in the household experienced loss of employment income in the household in the last four weeks compared to 13.6% of adults overall, and over two thirds (69.2%) of adults with children in the household reported difficulty paying for household expenses in the past week compared to the overall population of 61.3%. Adults in households with children were also more likely to report food insufficiency, symptoms of depression or anxiety, having no confidence in ability to make next month’s housing payment than the general population, and borrowing from friends or family to meet household spending.
What to watch going forward
Federal legislation provided billions of dollars to help address the ongoing health and economic effects of the pandemic, including direct economic support for individuals. This federal support may have contributed to some improvements in metrics since peaks early in the pandemic. However, some federal funding has expired, and the trajectory and duration of the pandemic is not clear with new variants and surges despite the availability of vaccines. Congress may consider broader legislative proposals that had been part of the Build Back Better Act which could expand health coverage and help to address health disparities across different demographic groups, but the status and outcome of that legislation is uncertain.
The authors thank former KFF Vice President Rachel Garfield and former KFF Senior Data Analyst Kendal Orgera for their role as authors of previous versions of this report.
This updated analysis estimates that nationally at least 234,000 deaths from COVID-19 between June 2021 and March 2022 could have been prevented with a primary series of vaccinations. These vaccine-preventable deaths represent 60% of all adult COVID-19 deaths since June 2021, when vaccines first became widely available to adults across the country, and a quarter (24%) of the nearly 1 million COVID-19 deaths since the pandemic began.
While it is clear that vaccine effectiveness increases with booster shots, the analysis does not estimate the potential effect of booster protection here on COVID-19 deaths. If it had, it likely would have found additional deaths among unvaccinated adults, as well as some deaths among vaccinated, could have been prevented.
The analysis can be found on the Peterson-KFF Health System Tracker, an information hub dedicated to monitoring and assessing the performance of the U.S. health system.
Medicare beneficiaries with low incomes and modest assets can qualify for additional financial help with Medicare premiums and cost sharing through both the Medicare Savings Programs and Medicare’s Part D Low-Income Subsidy for prescription drug coverage.
A new analysis and collection of interactive profiles highlight variations across states in the number and characteristics of beneficiaries who receive this additional financial assistance, including race and ethnicity, gender, and age. These findings reflect differences between states such as varying poverty rates among Medicare beneficiaries and higher asset thresholds for the Medicare Savings Program in some states.
Each profile highlights state-level eligibility requirements for the Medicare Savings Programs, which are administered by state Medicaid programs that can choose to adopt more generous income and asset requirements. Eligibility for the Part D Low-Income Subsidy program does not vary by state because it is run by the federal Medicare program.
Key takeaways include:
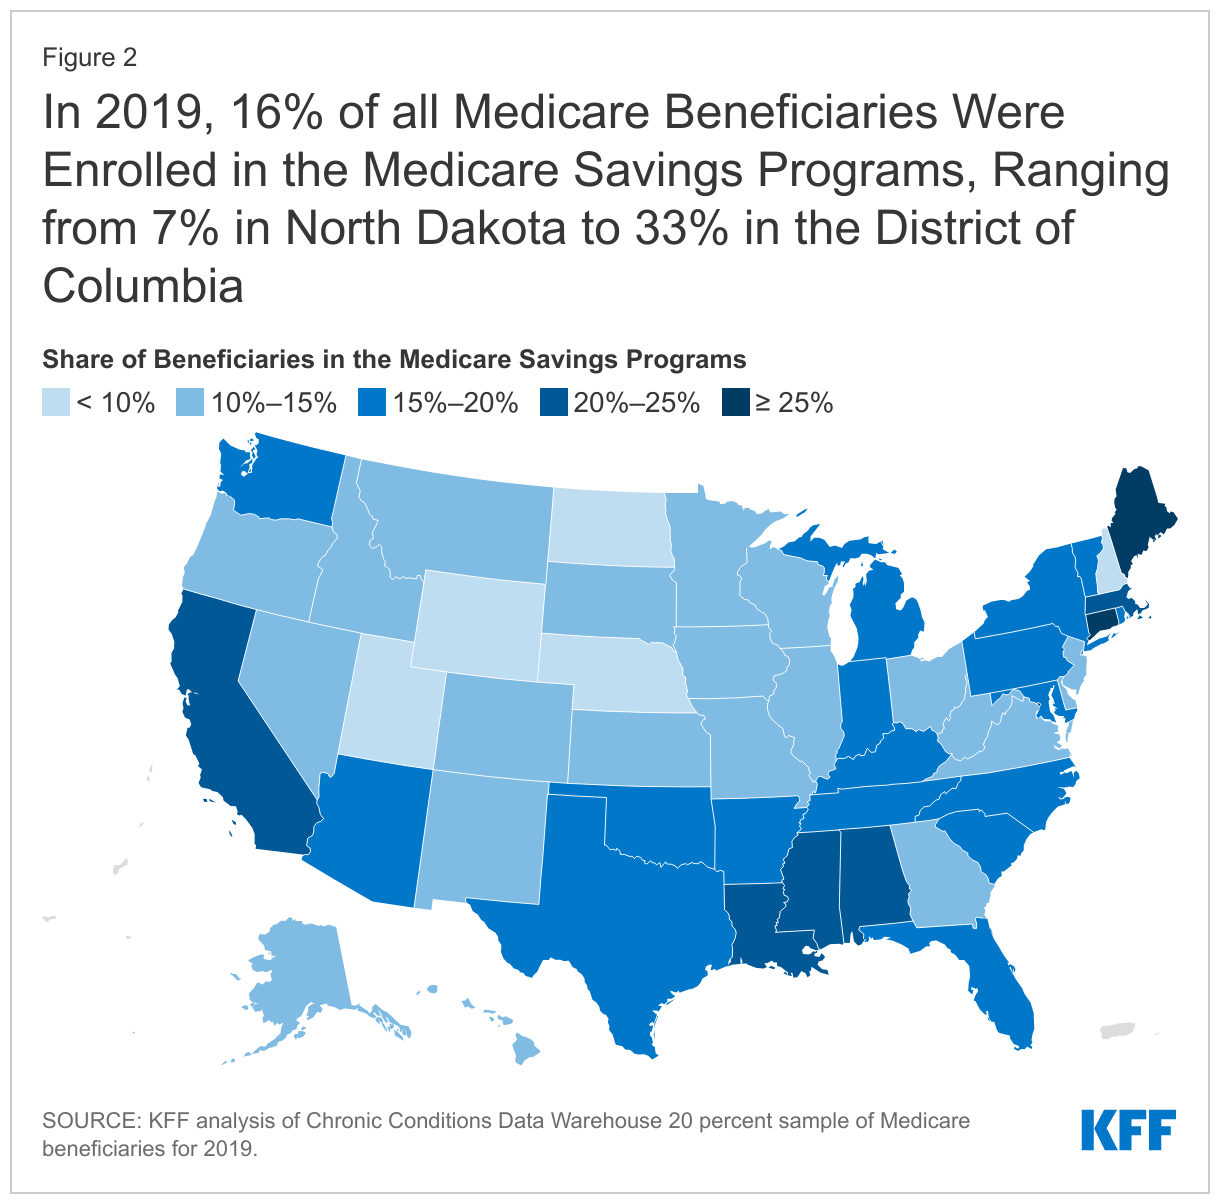
More than 10 million Medicare beneficiaries (16% of beneficiaries) were enrolled in the Medicare Savings Programs. The share of Medicare beneficiaries enrolled in the Medicare Savings Programs varies from a low of 7% in North Dakota to a high of 33% in the District of Columbia.
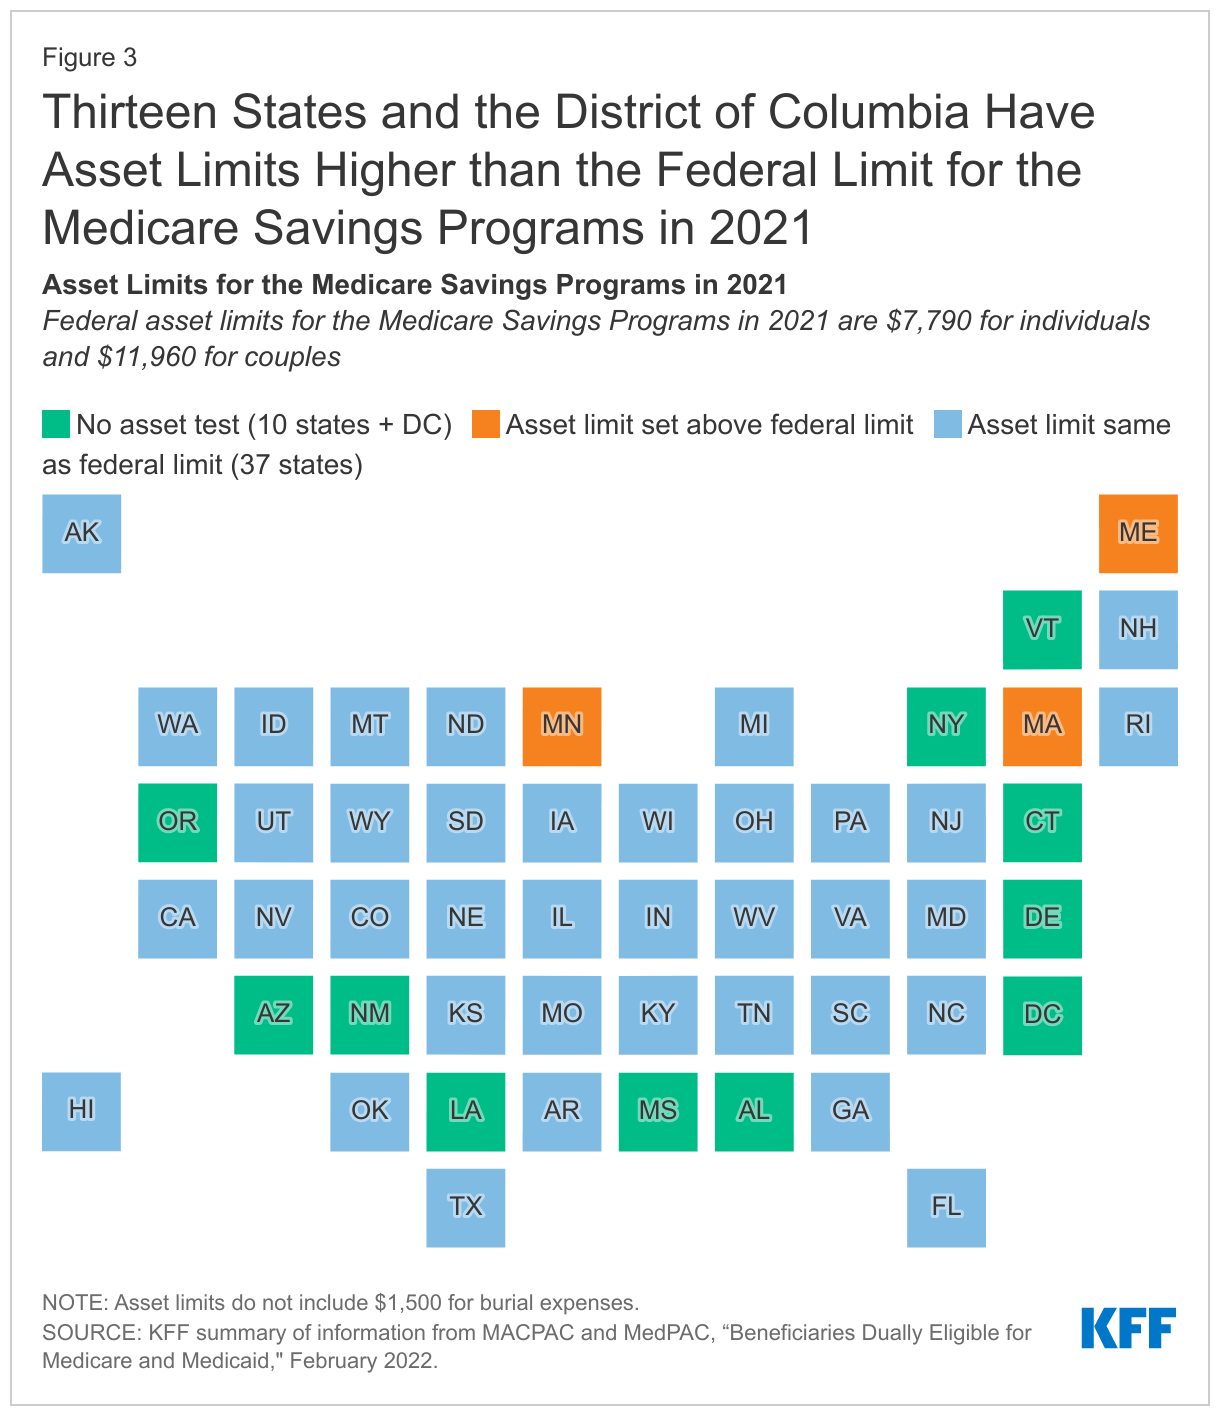
Among the nine states and the District of Columbia that have the highest share of Medicare beneficiaries enrolled in the Medicare Savings Programs, eight either do not have an asset test to qualify or have a higher asset limit than the federal guidelines.
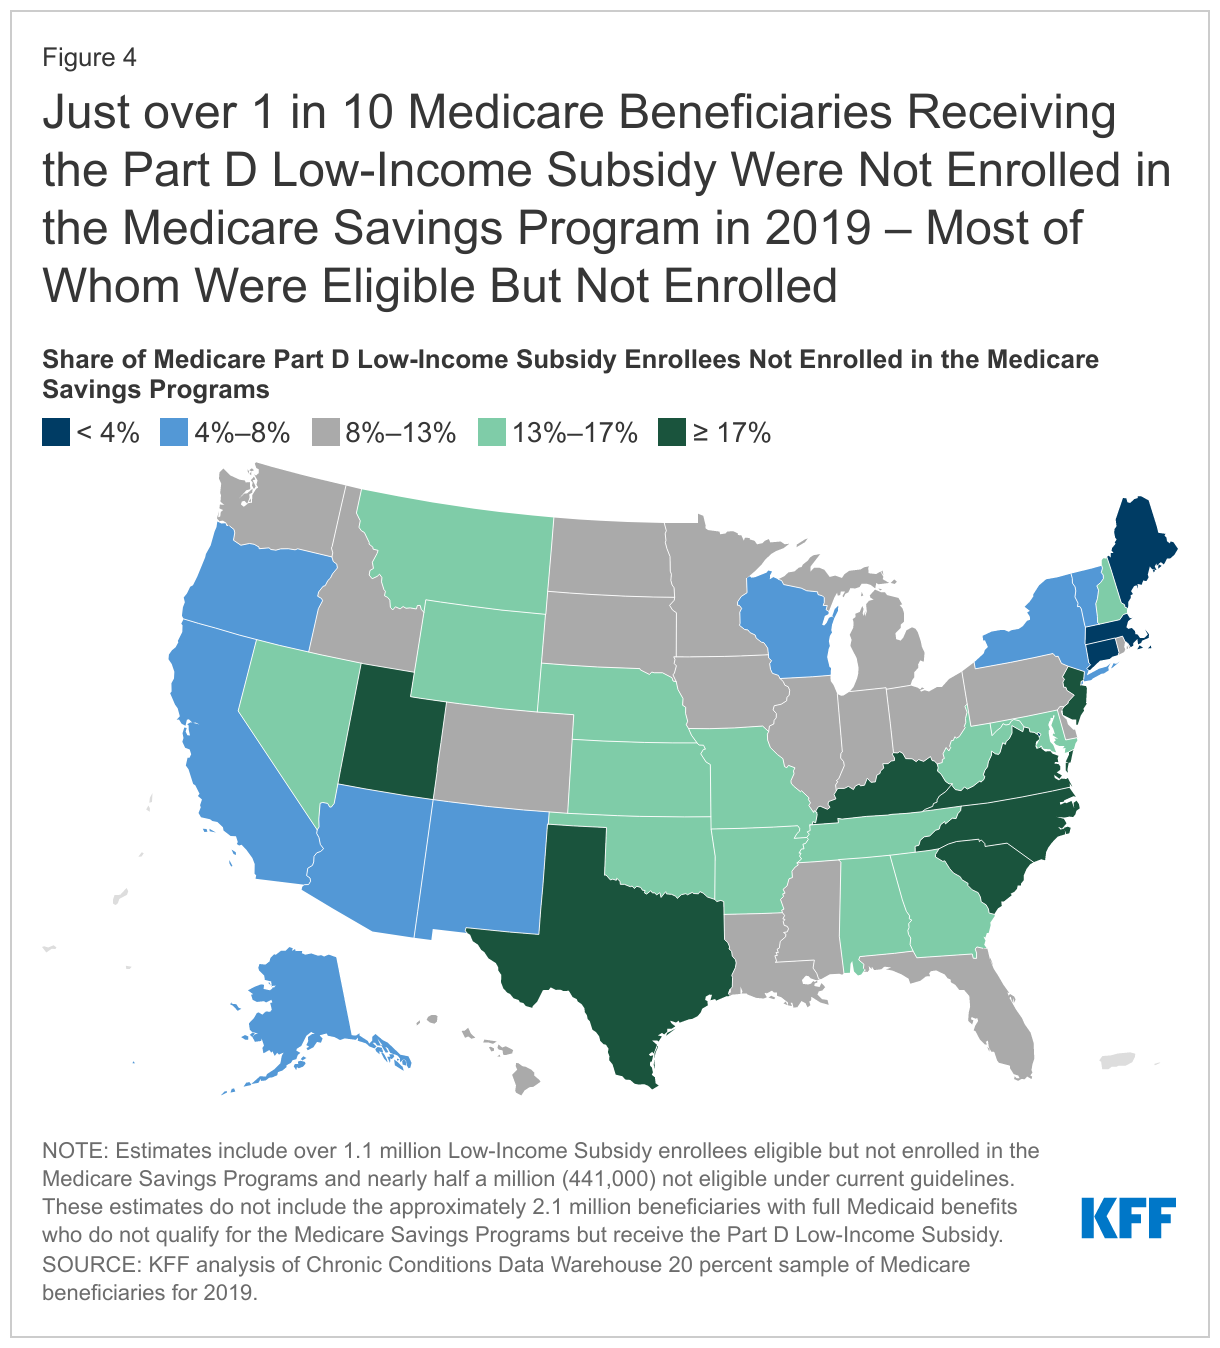
About 14.1 million Medicare beneficiaries were enrolled in the Part D Low-Income Subsidy in 2019, including 1.6 million who didn’t receive full Medicaid benefits and weren’t enrolled in the Medicare Savings Programs. About 1.1 million met the eligibility requirements for the Medicare Savings Programs, but were not enrolled, due in part to the administrative enrollment policies that vary from state to state.
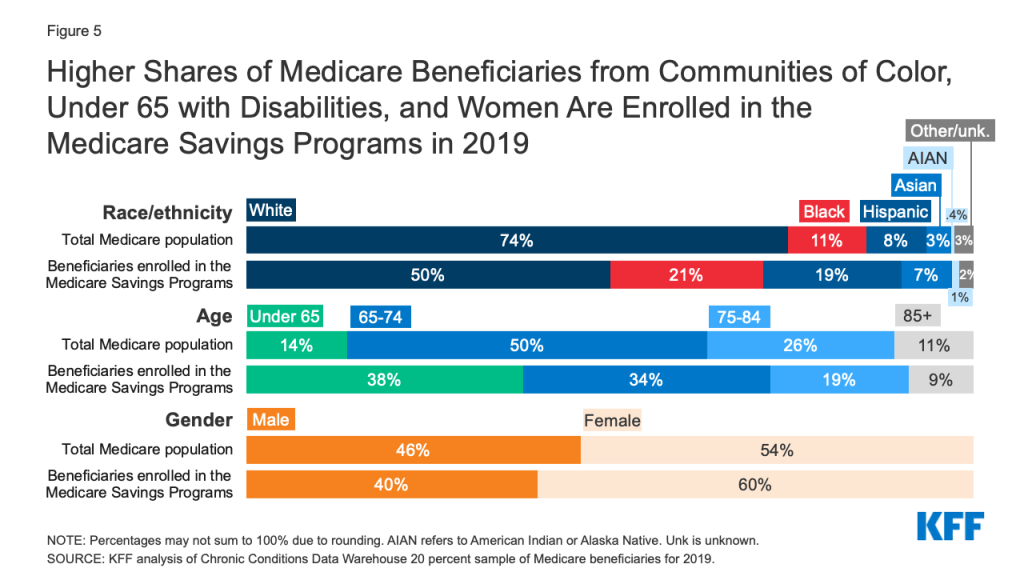
Compared to Medicare beneficiaries overall, the Medicare Savings Programs and Part D Low-Income Subsidy disproportionately serve beneficiaries in communities of color, beneficiaries under 65 with disabilities, and women, who tend to have lower incomes and modest savings.
While Medicare provides health and financial protections to more than 64 million Americans ages 65 and older and younger adults with long-term disabilities, gaps in coverage and high cost-sharing requirements can make health care difficult to afford, particularly for people with modest incomes. Medicare beneficiaries are responsible for Medicare’s premiums, deductibles, and other cost-sharing requirements unless they have private supplemental coverage, a Medicare Advantage plan that covers some of the cost-sharing, or have incomes and assets low enough to qualify for the Medicare Savings Programs (which provide assistance with Medicare Part A and Part B premiums and/or cost sharing) and the Part D Low-Income Subsidy (LIS) (which helps with Medicare Part D drug plan premiums and cost sharing). The Biden Administration has promotedawareness of these programs for low-income beneficiaries in an effort to increase enrollment.
To provide greater insight into the number and characteristics of beneficiaries enrolled in these programs in the U.S. overall and in each state, KFF created profiles of each state showing enrollment of Medicare beneficiaries in the Medicare Savings Programs and the Part D Low-Income Subsidy, and their demographic characteristics including race/ethnicity, age, and gender. (The profiles are now updated with 2020 data.) This data note provides an overview of these programs and highlights findings from the state-level profiles.
Takeaways
In 2019, 10.3 million Medicare beneficiaries, or 16% of all beneficiaries, were enrolled in the Medicare Savings Programs. The share of state Medicare populations enrolled in the Medicare Savings Programs varies from 7% in North Dakota to 33% in the District of Columbia, due in part to differences across states in eligibility criteria for these programs and poverty rates among the Medicare population.
Among the nine states and the District of Columbia that have the highest share of Medicare beneficiaries enrolled in the Medicare Savings Programs, eight either have eliminated the asset test or have asset limits higher than the federal limit (District of Columbia, Connecticut, Maine, Louisiana, Mississippi, Alabama, Massachusetts, New York).
While Medicare beneficiaries enrolled in the Medicare Savings Programs automatically qualify to receive assistance through the Part D Low-Income Subsidy, the opposite is not true, in part because the income threshold to qualify for the Part D Low-Income Subsidy is higher. In 2019, nearly 1.6 million Medicare beneficiaries were enrolled in the Part D Low-Income Subsidy but not receiving premium or cost-sharing assistance through the Medicare Savings Programs, including just over 1.1 million beneficiaries who were eligible but not enrolled and nearly half a million (441,000) who did not meet eligibility criteria.
Compared to Medicare beneficiaries overall, the Medicare Savings Programs and Part D Low-Income Subsidy disproportionately serve beneficiaries in communities of color, beneficiaries under 65 with disabilities, and women, who tend to have lower incomes and modest savings.
Overview of the Medicare Savings Programs and the Part D Low-Income Subsidy
Medicare Savings Programs
Under the Medicare Savings Programs, state Medicaid programs help pay for premium and/or cost-sharing assistance for Medicare beneficiaries who have income and assets below specified levels, up to 135% FPL under federal guidelines ($18,347 for individuals and $24,719 for couples annually in 2022) and limited assets (below $8,400 for individuals and $12,600 for couples in 2022). Beneficiaries may receive help with Medicare’s premiums ($2,041 in 2022 for Part B), deductibles ($1,156 for Part A, $233 for Part B) and other cost-sharing requirements. Most low-income Medicare beneficiaries who qualify for Medicare premium and cost-sharing assistance also qualify for full Medicaid benefits, which can include long-term services and supports and other services such as dental and vision; these beneficiaries are referred to as full-benefit Medicare-Medicaid beneficiaries.
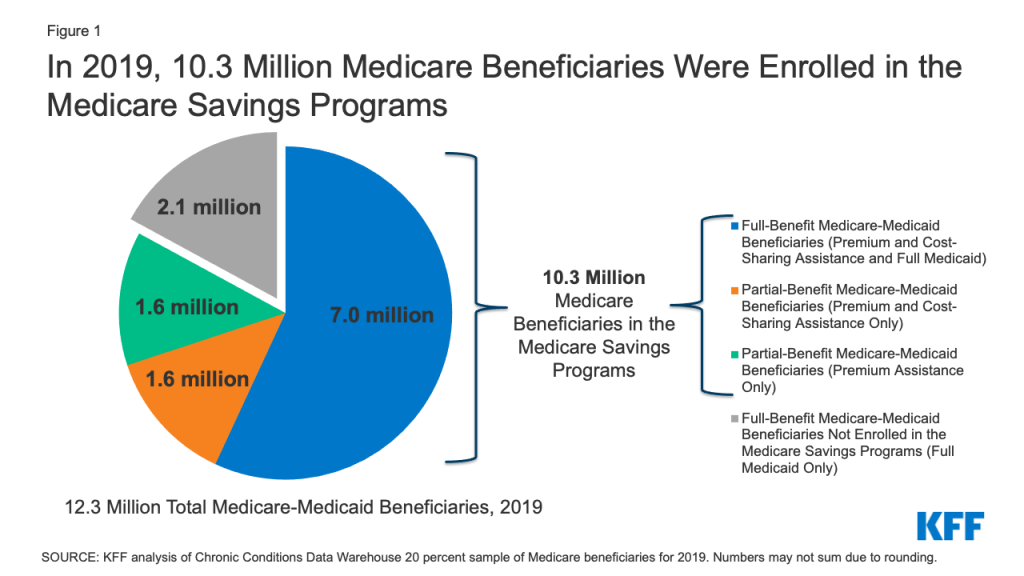
In 2019, 12.3 Medicare beneficiaries were enrolled in both Medicare and Medicaid. Of these beneficiaries, 9.1 million received full Medicaid benefits, including 7 million who also received financial assistance through the Medicare Savings Programs, and 2.1 million with full Medicaid benefits who do notqualify for the Medicare Savings Programs, though some states may choose to pay for Part B premiums for these beneficiaries.
In total, 10.3 million beneficiaries received financial assistance through the Medicare Savings Programs in 2019. This total includes the aforementioned 7 million beneficiaries who also receive full Medicaid benefits and 3.3 million beneficiaries who only receive premium and/or cost sharing assistance (Figure 1).
Figure 1: In 2019, 10.3 Million Medicare Beneficiaries Were Enrolled in the Medicare Savings Programs
Low-income beneficiaries who receive only financial assistance through the Medicare Savings Programs – meaning they qualify for payment of Medicare Part A and/or B premiums and, in some cases, Part A and Part B cost sharing but not full Medicaid benefits – are referred to as partial-benefit Medicare-Medicaid beneficiaries. (See MedPAC MACPAC Data Book: Beneficiaries Dually Eligible for Medicare and Medicaid — February 2022 for a full discussion of the different types of Medicare Savings Programs.)
Of the 3.3 million Medicare beneficiaries who received financial assistance through the Medicare Savings Programs, but not full Medicaid benefits, half (about 1.6 million) received assistance with Part B premium and cost-sharing assistance, while the other half received assistance with Part B premiums but did not qualify for help with Medicare Part A and B deductibles or cost-sharing requirements for covered services, despite having incomes below 135% of poverty.
Part D Low-Income Subsidy
Under the Medicare Part D Low-Income Subsidy (LIS), the federal government subsidizes premiums, deductibles, and cost sharing for the Part D prescription drug benefit, providing varying levels of assistance to beneficiaries at different income and asset levels up to 150% FPL ($20,385 for individuals and $27,465 for couples in 2022) and limited assets (below $14,010 for individuals and $27,950 for couples in 2022). The 150% FPL income threshold for LIS is higher than the 135% FPL threshold for the Medicare Savings Program. Unlike the Medicare Savings Programs, the Part D Low-Income Subsidy is a federal program and not part of the Medicaid program, nor is it administered by the states, so states do not have the option of setting higher income or asset thresholds for the Part D Low-Income Subsidy.
In 2019, 14.1 million (22% of all beneficiaries) were enrolled in the Part D Low-Income Subsidy. The vast majority (97%) of beneficiaries enrolled in the Part D Low-Income Subsidy receive full LIS benefits, while only 3% receive partial LIS benefits.
Both full-benefit and partial-benefit Medicare-Medicaid enrollees automatically receive full Medicare Part D LIS benefits, meaning they pay no Part D premium or deductible and only modest copayments for prescription drugs until they reach the catastrophic threshold, when they face no cost sharing. Beneficiaries who receive partial LIS benefits pay a reduced Part D premium and deductible and 15% coinsurance for drugs until they reach the catastrophic threshold, when they face modest copayments.
Individuals who do not automatically qualify for LIS because they are not enrolled in the Medicare Savings Programs can enroll if they meet income and asset requirements set by the federal government. Depending on their income and assets, they could receive full or partial LIS benefits. However, even if their income and assets meet Medicare Savings Program requirements, individuals who qualify for Part D LIS are not automatically enrolled in Medicare Savings Programs. While states are statutorily required to initiate Medicare Savings Programs applications for beneficiaries who apply for Part D LIS to help facilitate enrollment, CMS has noted that not all states are meeting these standards.
Box 1: Medicare Savings Programs and Part D Low-Income Subsidy Benefit Groups
Full-Benefit Medicare-Medicaid: Full Medicaid benefits; Premium and cost-sharing assistance through the Medicare Savings Programs; Full Low-Income Subsidy
Full-Benefit Medicare-Medicaid Beneficiaries Not Enrolled in the Medicare Savings Programs: Full Medicaid benefits only; Full Low-Income Subsidy
Partial-Benefit Medicare-Medicaid: Premium and cost-sharing assistance through the Medicare Savings Programs; Full Low-Income Subsidy
Partial-Benefit Medicare-Medicaid: Premium Assistance only through the Medicare Savings Programs; Full Low-Income Subsidy
Full Low-Income Subsidy: Part D premium and cost-sharing assistance; May be enrolled in the Medicare Savings Programs depending on income and assets
Partial Low-Income Subsidy: Part D premium and cost-sharing assistance
Findings
In 2019, 10.3 million Medicare beneficiaries, or 16% of all beneficiaries, were enrolled in the Medicare Savings Programs, but the share of state Medicare populations enrolled in the Medicare Savings Programs varies by state, from 7% in North Dakota to 33% in the District of Columbia (Figure 2).
States that have adopted more generous income and asset thresholds – as well as states with higher poverty rates among older adults – tend to have larger shares of beneficiaries enrolled in the Medicare Savings Programs.
The federal government sets minimum income and asset eligibility requirements for the Medicare Savings Programs, but states can expand eligibility to beneficiaries with higher incomes and/or assets. As of 2021:
Four states and the District of Columbia have raised the qualifying federal poverty limits (Connecticut, Indiana, Maine, and Massachusetts) above the federally defined minimum level. For example, for the Qualified Medicare Beneficiary program where the income limit is typically 100% of the federal poverty level ($12,880 for individuals and $17,420 for couples in 2021), Indiana’s income limit is 150% ($19,320 for individuals and $26,130 for couples), while Connecticut’s is 211% ($25,760 for individuals and $34,840 for couples).
These expanded income and asset limits only apply to Medicare premium and cost-sharing assistance through the Medicare Savings Programs. Beneficiaries still are required to meet state-defined eligibility criteria to receive full Medicaid benefits, including nursing home coverage and other long-term services and supports, in their state.
The variation across states in the share of Medicare beneficiaries receiving premium and cost-sharing assistance through the Medicare Savings Programs could be due to a number of reasons. One reason might be the higher asset limits in some states: eight of the nine states and the District of Columbia with the highest share of Medicare beneficiaries enrolled in the Medicare Savings Programs either have eliminated the asset test or have asset limits higher than the federal limit (District of Columbia, Connecticut, Maine, Louisiana, Mississippi, Alabama, Massachusetts, New York). This is not universally true, however; there are a few states with no asset limit or higher asset limits, which have relatively lower shares of enrollment, including Delaware, New Mexico, Oregon, and Minnesota.
Poverty rates among Medicare beneficiaries also vary across states, although the relationship between poverty and Medicare Savings Program enrollment rates is less clear. While some states with high poverty rates (e.g., more than 25% of beneficiaries below 150% of poverty) among the Medicare population have a relatively high share of beneficiaries enrolled in the Medicare Savings Programs, (e.g., more than 20% enrolled: District of Columbia, Louisiana, Mississippi, and Alabama), a handful of states with high poverty rates have a relatively low share of beneficiaries enrolled in the Medicare Savings Programs (e.g., West Virginia: 11%, New Mexico: 14%, Georgia: 14%).
In addition to these factors, variations across states in Medicare Savings Program enrollment may be related to differences in the application process via state Medicaid agencies, which could make it more difficult for beneficiaries in some states to apply, or beneficiaries’ lack of awareness of the Medicare Savings Programs.
In 2019, nearly 1.6 million Medicare beneficiaries (or 11%) received some help through the Part D Low-Income Subsidy, but no premium and/or cost-sharing assistance from the Medicare Savings Programs (Figure 4).
This includes more than 1.1 million people who were not enrolled in the Medicare Savings Programs, even though they were eligible, and another half a million beneficiaries (441,000) who did not qualify for the Medicare Savings Programs because either their incomes and/or assets were too high. These estimates do not include the approximately 2.1 million beneficiaries with full Medicaid benefits who do notqualify for the Medicare Savings Programs but receive the Part D Low-Income Subsidy.
The share of beneficiaries who received assistance through the Part D Low-Income Subsidy Program, but were not enrolled in the Medicare Savings Programs, ranged from 1% in Connecticut to 21% in South Carolina. Variations across states may be due to differences in the administrative complexity of enrolling in the Medicare Savings Programs across states (in contrast to the Low-Income Subsidy where beneficiaries apply through the Social Security Administration), differences in methodologies in how eligibility is determined for the Low-Income Subsidy versus the Medicare Savings Programs in many states, and lack of awareness of the Medicare Savings Programs, which may result in some beneficiaries applying for the Part D Low-Income Subsidy but not the Medicare Savings Programs.
The Medicare Savings Programs and Part D Low-Income Subsidy disproportionately serve beneficiaries in communities of color, beneficiaries under 65 with disabilities, and women, who tend to have lower incomes and modest savings than beneficiaries who are White, 65 or older, or men (Figure 5).
Figure 5: Higher Shares of Medicare Beneficiaries from Communities of Color, Under 65 with Disabilities, and Women Are Enrolled in the Medicare Savings Programs in 2019
Race/ethnicity. One in five (21%) of beneficiaries enrolled in the Medicare Savings Programs are Black, nearly double the share of Black beneficiaries (11%) in the total Medicare population. Similarly, 19% of beneficiaries enrolled in the Medicare Savings Programs are Hispanic, more than double the share of Hispanic beneficiaries (8%) in the total Medicare population.
There are differences in the characteristics of beneficiaries who are enrolled in these programs across states, which may be due to state-level variation in the composition of the Medicare population, as well as variation in the factors mentioned above, such as eligibility thresholds and methods of determining eligibility, poverty rates, and the characteristics of enrollees who have lower incomes. For example, in Alabama, South Carolina, Maryland, and Georgia, Black beneficiaries comprise about a quarter of each state’s Medicare population, but about half of Medicare Savings Program enrollees in the state, ranging from 44% to 50%.
The share of Hispanic beneficiaries enrolled in the Medicare Savings Programs also varies by state. In New Jersey, Colorado, New York, and Nevada, Hispanic beneficiaries comprise one in ten of all Medicare beneficiaries, but about a quarter of Medicare Savings Programs enrollees in the state, ranging from 24% to 27%.
Age. The Medicare Savings Programs also reach a disproportionate share of beneficiaries under age 65 who qualify for Medicare due to long-term disabilities. For example, 38% of Medicare beneficiaries who are under age 65 due to disability are enrolled in the Medicare Savings Programs, nearly three times the share of under age-65 beneficiaries as their share of the total Medicare population (14%).
The share of Medicare beneficiaries who are under age 65 with long-term disabilities enrolled in the Medicare Savings Programs also varies by state, ranging from 23% in California to 59% in New Hampshire.
Gender. Women represent 60% of those beneficiaries enrolled in the Medicare Savings Programs but 54% of the Medicare population overall. There is somewhat less variation across states in enrollment by gender, with the share of women enrolled in these programs varying from 52% in Alaska to 63% in Alabama, Georgia, and Wyoming.
Overall enrollment patterns in the Part D-Low Income Subsidy by race/ethnicity, age, and gender are similar to the Medicare Savings Programs in large part due to the overlap of enrollment in these programs.
Despite the important financial protections the Medicare Savings Programs and Part D Low-Income Subsidy provide to low-income people on Medicare, many low-income beneficiaries are not receiving these benefits. Historically these programs have had lowparticipation, despite some state and federal efforts to increase enrollment. Based on prior KFF work, the share of Medicare beneficiaries with incomes below 150% FPL who are enrolled in the Part D Low-Income Subsidy is estimated to be between 55% and 70%, while 50% to 65% are estimated to be enrolled in the Medicare Savings Programs (lower because beneficiaries with incomes between 135%-150% FPL are not eligible for these programs under federal guidelines) – though not everyone with incomes at or below this level are eligible for either of these programs due to the asset tests.
Additionally, certain groups of low-income beneficiaries are less likely than others to be receiving assistance from the Medicare Savings Programs, which could expose them to higher health care costs. For example, based on our analysis of data from the Medicare Current Beneficiary Survey, in 2019, nearly one in five Black and Hispanic Medicare beneficiaries (19% and 17%, respectively) had incomes below 150% of poverty but were not enrolled in the Medicare Savings Programs, compared to 11% of White beneficiaries.
One reason for relatively low participation rates overall in these programs could be the asset test used to determine eligibility for both the Medicare Savings Programs and the Part D Low-Income Subsidy, requiring beneficiaries to have countable resources, such as money in savings and checking accounts, stocks, and bonds, below a certain limit. This contrasts with eligibility requirements established under the Affordable Care Act that use income, but not assets, to determine eligibility for Medicaid expansion or Marketplace coverage. This means individuals living in states that expanded Medicaid up to 138% FPL would be subject to an asset test when they turn 65 or qualify for Medicare based on having a long-term disability in order to get help from the Medicare Savings Programs with Medicare premiums and cost sharing (unless they live in a state that has eliminated the asset test). This “Medicare cliff” can result in low-income people losing access to valuable financial protections that they qualified for prior to becoming eligible for Medicare.
Discussion
In 2019, 10.3 million Medicare beneficiaries received help through the Medicare Savings Programs. Enrollment in these programs varies by state, due to differences in income and asset eligibility criteria and administrative requirements across states. While 14.1 million beneficiaries received help through the Part D Low-Income Subsidy, nearly 1.6 million of these beneficiaries did not receive premium or cost-sharing help through the Medicare Savings Programs, because either they were ineligible or did not enroll. Both programs disproportionately serve communities of color, adults under 65 with disabilities, and women on Medicare, who tend to have relatively low incomes and modest savings.
There has been some discussion among policymakers of improving financial protections for low-income Medicare beneficiaries, for example, by expanding income eligibility thresholds for both the Medicare Savings Programs and Part D Low-Income Subsidy, aligning eligibility criteria between these two programs, and by raising or eliminating the federal asset test for the Medicare Savings Programs, as some states have done. Such changes could provide stronger financial protections to low-income beneficiaries living just above current eligibility income and asset levels who are now responsible for payment of full Medicare premiums, deductibles, and cost sharing. They would also increase government spending, and do not appear to have strong prospects for passage in the current political environment.
Methods
This analysis uses data from the Chronic Conditions Data Warehouse 20 percent sample of Medicare beneficiaries for 2019. For this analysis, we use an ever-enrolled approach for counting beneficiaries enrolled in the Medicare Savings Program beneficiaries and the Part D Low-Income Subsidy, rather than an average monthly measure, which may explain differences in our estimates compared to other published estimates. This analysis excludes beneficiaries living in Puerto Rico and the territories.
This work was supported in part by AARP Public Policy Institute (PPI). We value our funders. KFF maintains full editorial control over all of its policy analysis, polling, and journalism activities.
Meredith Freed, Juliette Cubanski, and Tricia Neuman are with KFF.Anthony Damico is an independent consultant.
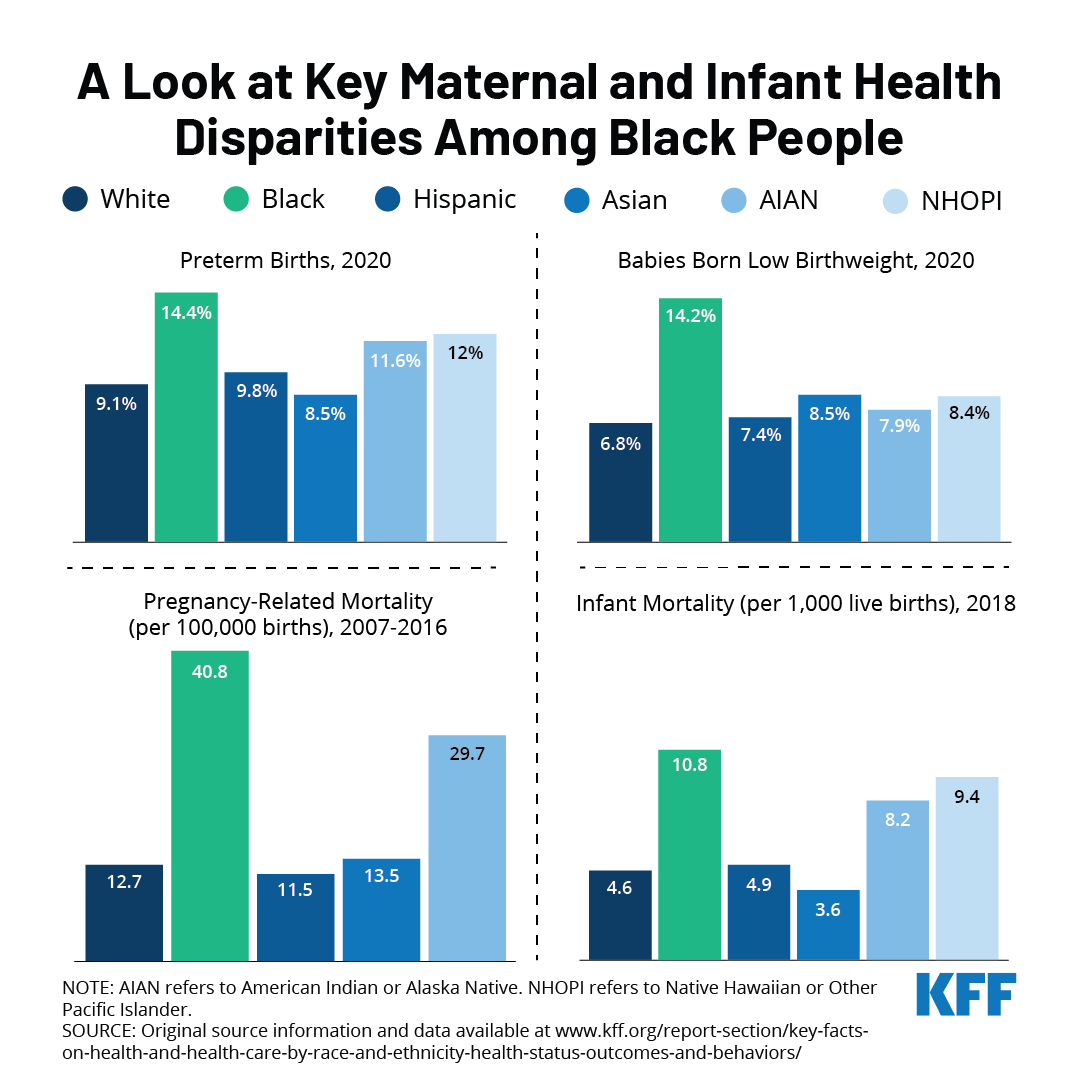
This week marks the fifth annual Black Maternal Health Week, a campaign started by the Black Mamas Matter Alliance that was formally recognized by the Biden administration last year. This week is dedicated to celebrating Black motherhood and raising awareness about the state of Black maternal health in the United States.
Due to systemic and overt discrimination, Black people are disproportionately affected by high maternal and infant morbidities and mortality. A recent KFF analysis found that Black people fared worse than other racial and ethnic groups in all maternal health indicators measured. They were more likely to have preterm births and have low birthweight babies compared to other racial/ethnic groups. Black infants were twice as likely to die as White infants, and Black people were more likely to die while pregnant or within a year of giving birth compared to all other groups.
These disparities were exacerbated during the pandemic, with Black people experiencing maternal death rates at more than twice the national average, a significant increase from pre-pandemic rates, according to a recent CDC report. The Build Back Better Act (BBBA) includes several provisions to address the social determinants of maternal health, increase funding for the perinatal workforce, improve access to quality maternity care, improve data collection, and mitigate the impacts of the pandemic and climate change on maternal outcomes. The BBBA expands the American Rescue Plan Act’s voluntary postpartum coverage provision by requiring states to expand their Medicaid postpartum coverage from 60 days to 12 months. It also seeks to close the coverage gap by making low-income people in states that have not expanded Medicaid eligible for subsidized coverage in the ACA marketplace. Both provisions facilitate continuity of coverage and care for people at all life stages, including pregnancy and parenthood. However, the fate of the BBBA and its health provisions remains uncertain while the legislation remains stalled.
In addition to legislation, addressing systemic discrimination, implicit bias and racism will be integral to achieving equity in maternal health outcomes.
The Biden Administration recently issued a proposed rule to make it easier for family members of workers offered health insurance at their jobs to qualify for premium tax credits for Marketplace coverage. The proposal aims to address what has been called the “family glitch”. Under the ACA, an individual enrolling in a Marketplace plan is not eligible for a premium tax credit if they are eligible for job-based coverage that is considered affordable and provides minimum value (i.e., covers at least 60% of health expenses on average). Current regulations provide that job-based coverage is considered affordable to a worker and their dependents if the cost of self-only coverage for the worker is less than 9.6 percent of family income, without regard to the cost of adding family members. The proposal would revise that interpretation by assessing the affordability of job-based coverage available for the family members of a worker by comparing the total cost for the whole family (including the worker) to the 9.6 percent threshold. This assessment would measure affordability for members of the family other than the worker. Affordability for the worker himself or herself would continue to be based on the cost of self-only coverage.
The proposed rule explains that the current interpretation leads to cases where family members are considered to have an affordable offer even when they face very high contribution amounts if they want to enroll in that coverage, which the agencies assert is not consistent with the ACA’s purpose of providing access to affordable coverage for everyone. We previously estimated that 5.1 million people are currently caught in this ‘family glitch’.
In this analysis, we use the KFF Employer Health Benefits Survey (EHBS) to look at the shares of workers that might pay significant amounts to enroll families and how these shares vary across firms. These are the workers most likely to benefit from a fix to the family glitch.
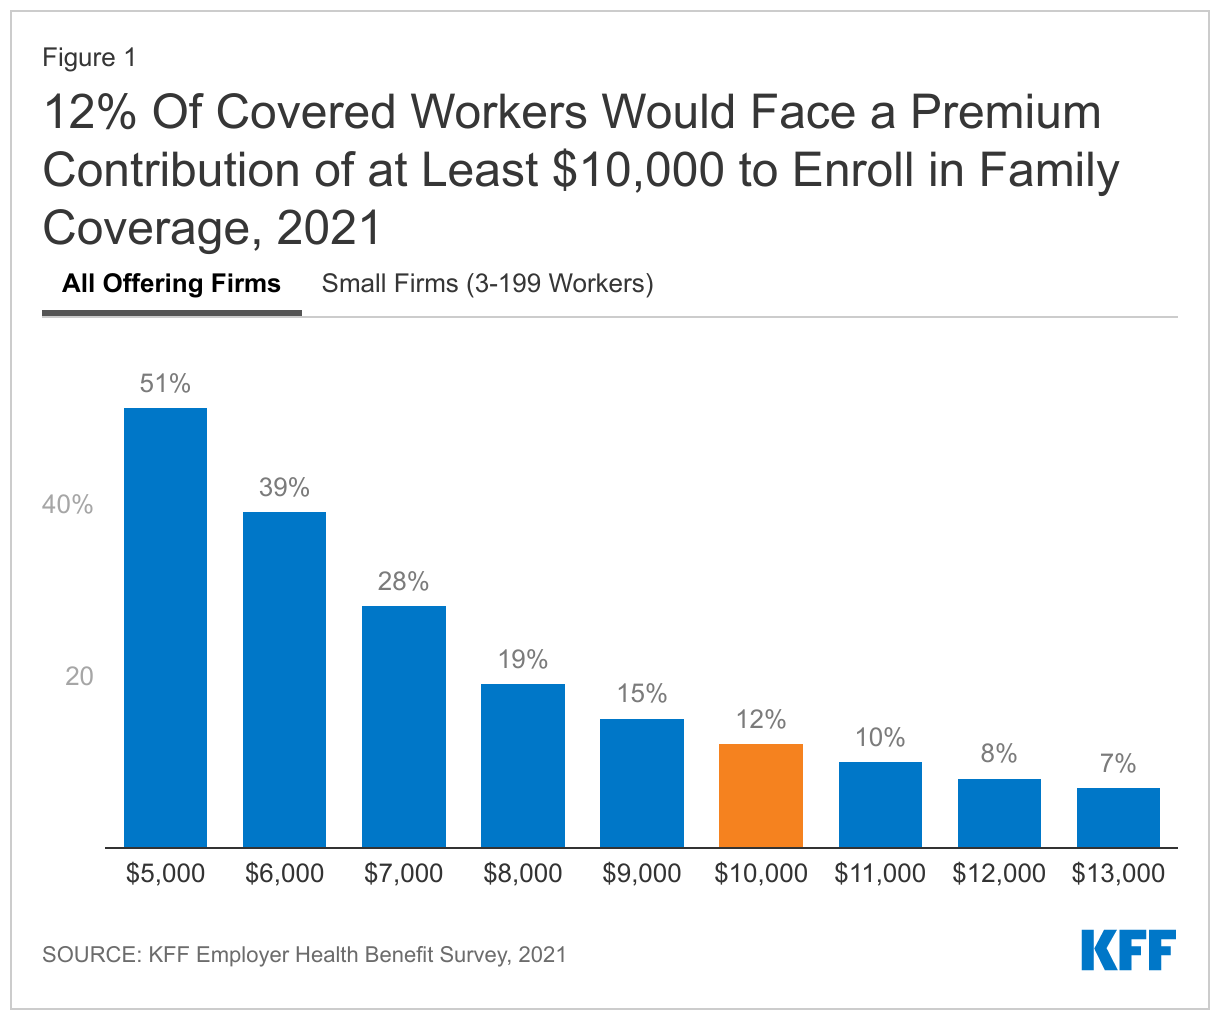
Health insurance is expensive. The average premiums in 2021 were $7,739 for single coverage and $22,221 for a family of four. The average contribution amounts for covered workers were $1,299 for single coverage and $5,969 for a family of four. Importantly, there was considerable variation around these averages: for example, ten percent of covered workers were enrolled in a plan with a premium of more than $29,000 for family coverage; and 12% of covered workers were enrolled in a plan with a contribution of at least $10,000 for family coverage. It is the family members of workers in firms with high contributions that are most likely to benefit from the proposed rule change.
Before looking at some of the characteristics of these firms and workers, we should be clear about what these percentages mean. When we say that 12% of covered workers are in a plan that has a worker contribution of at least $10,000, we are not saying that 12% of covered workers actually enroll in family coverage and pay those amounts. Instead, we are saying that 12% of covered workers work at firms where the contribution for a family of four for their largest health plan (or sometimes an average of several plans) is at least $10,000. Surveys do not collect information about all of the health plans each employer may offer, nor are they able to account for potential adjustments that might affect individual workers or families (smoking surcharges, discounts for filling out a health risk assessment, surcharge if spouse is offered coverage at another job). So, while these surveys cannot give precise results on actual costs, they give a pretty good picture of the magnitude of the costs workers face to enroll in the plans that most workers choose.
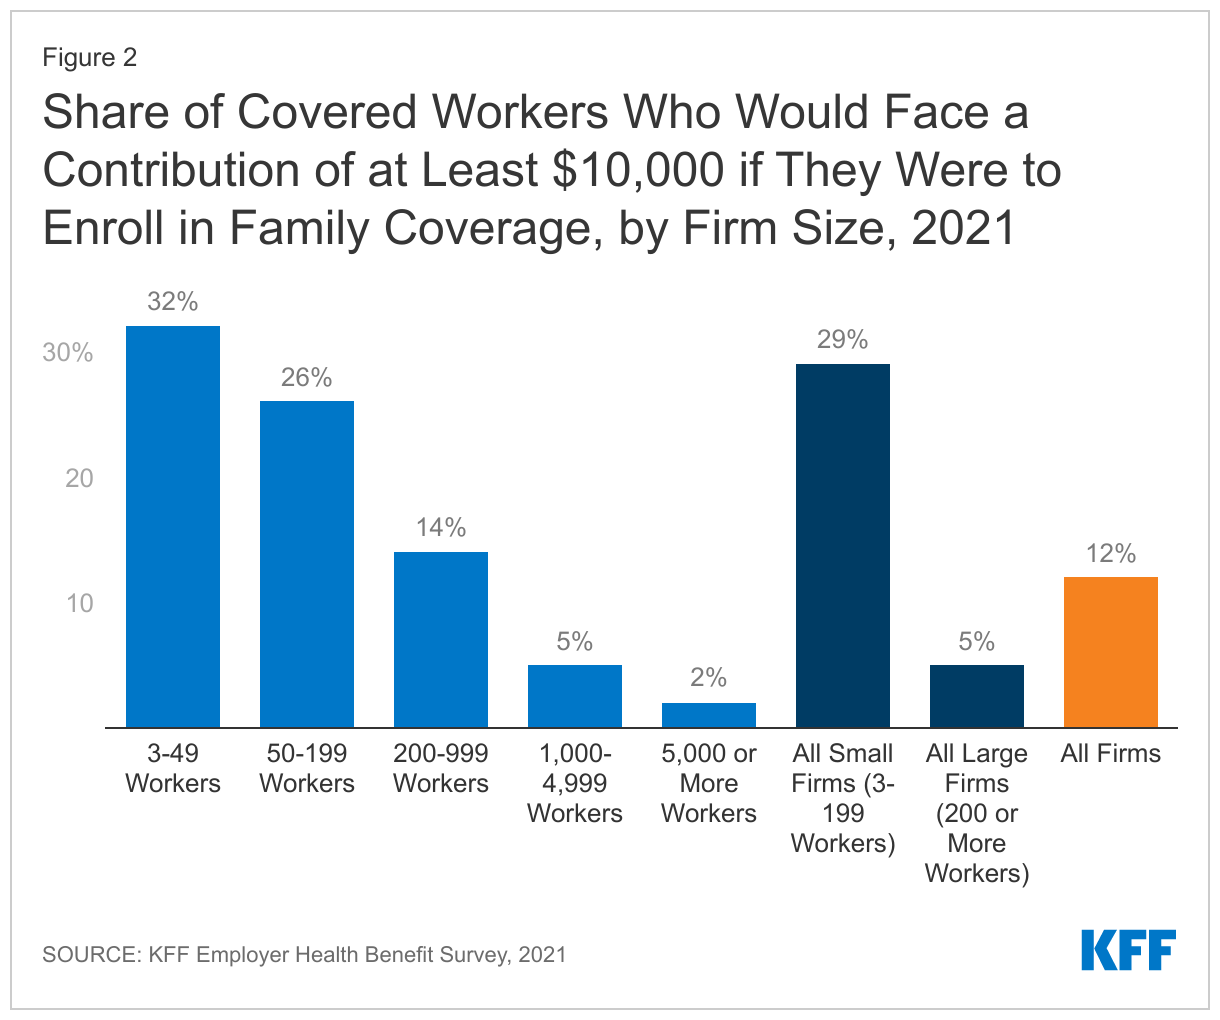
Workers in small firms face higher contributions for family coverage. Workers in small firms (3-199 workers) on average face higher contributions to enroll in family coverage and are more likely to face very high contribution amounts. The average contribution for a family of four in 2021 was $7,710 for workers in small firms, compared to $5,269 for workers in larger firms. Twenty-nine percent of covered workers in small firms faced a contribution of at least $10,000 for family coverage, compared to only 5% of covered workers in larger firms.
One reason family contributions may be higher in smaller firms is that some small employers only make a contribution toward the cost of self-only coverage, leaving the worker to pay the entire difference between the premium for self-only coverage and the premium for family coverage. Even in firms selecting less comprehensive coverage, this difference can be many thousands of dollars. We estimate that 19% of small firms offering health benefits make little or no additional contribution towards the cost of family coverage. These firms employ about 17% percent of the covered workers enrolled at small firms (3-199 workers).
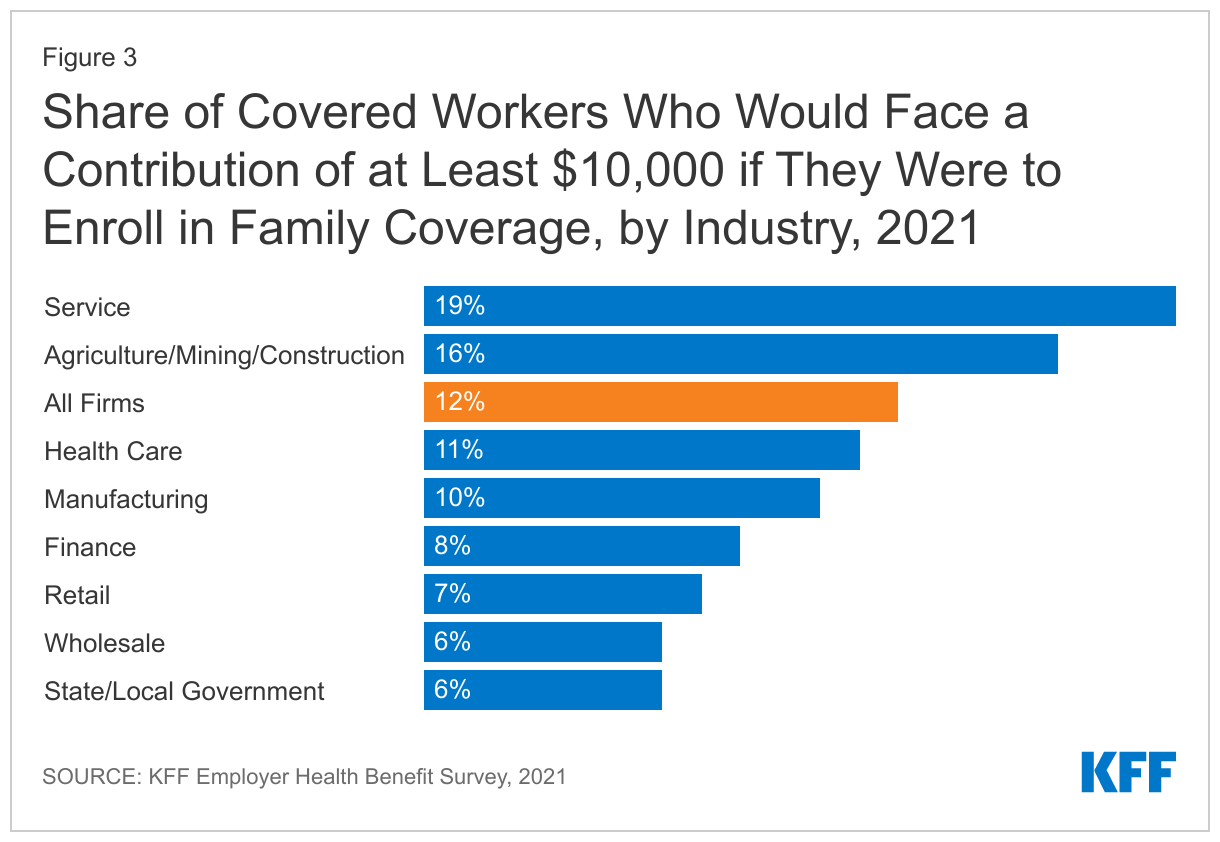
Workers in the service industry are more likely to face high contributions for family coverage. Contributions for family coverage vary significantly by industry. Covered workers in certain industries are more likely to face high contributions for family coverage while covered workers in other industries (wholesale, transportation, communications, utilities, state and local government) are less likely.
The proposed rule addresses the eligibility for premium tax credits in situations where workers face unaffordable contribution amounts to enroll their family members in job-based coverage. Data from the KFF Employer Health Benefits Survey demonstrates that some workers face very high contribution amounts for family coverage, with 12% facing a contribution of at least $10,000 for a family of four. Workers with coverage through small firms are particularly at risk of high contributions for family coverage, and would therefore benefit from the family glitch fix.
Methods
The annual KFF Employer Health Benefits Survey (EHBS) for 2021 was conducted between January and July of 2021, and included almost 1,700 randomly selected, non-federal public and private firms with three or more employees. The full EHBS, including a detailed methodology section, is available at ehbs.kff.org. EHBS collects information from employers about how much employers and employees contribute in their largest health plans.
Ending COVID-19 Emergency Declarations Will Bring an End to Flexibilities that Aided Patients, Providers, Insurers, and Public Programs in Responding to the Pandemic
When the federal government ends COVID-19 emergency declarations that were declared in the early days of the pandemic, it will bring to a close several changes that were enacted temporarily to enable the U.S. health care system to better deal with the crisis.
A new KFF resource details a number of those flexibilities and lays out what it will mean for people, providers and federal health programs when they go away. One of the key declarations, the COVID-19 Public Health Emergency, is slated to expire on April 16, though it is expected to be renewed by the Biden administration. The end of the emergency declarations also will bring about a ramping down of heightened federal spending related to the pandemic, which was always intended to be temporary.
The changes will eliminate a pathway through Medicaid to free COVID-19 testing, treatment and vaccines for people without health insurance and could trigger higher out-of-pocket costs for tests for people with private insurance. Millions of people could lose Medicaid coverage when the continuous enrollment requirement ends and the federal government shuts off pandemic-related enhanced federal Medicaid funding.
Most Medicare beneficiaries would lose access to coverage of nearly all telehealth services within a few months, with some exceptions, and hospitals would no longer receive a special pandemic-related 20 percent increase in Medicare payments for treatment of patients diagnosed with COVID-19. In addition, any COVID tests, vaccines, or therapeutics that were granted emergency authorization for use but have not been approved by the FDA could no longer be used.The new KFF resource addresses flexibilities adopted during the COVID-19 pandemic and implications of their drawing to a close in the following areas:
Coverage, costs, and payment for COVID-19 testing, treatments, and vaccines
Medicaid coverage and federal match rates
Telehealth
Other Medicaid and CHIP flexibilities
Other Medicare payment and coverage flexibilities
Other private insurance coverage flexibilities
Access to medical countermeasures (vaccines, tests, and treatments) through FDA emergency use authorization (EUA)
Liability immunity to administer medical countermeasures
For more COVID-19-related analyses and data, visit kff.org.