A Preview of the Role Health Care May Play in the 2026 Election

Published: Apr 2, 2026

KFF has long examined the role of health care in U.S. elections, tracking how the issue ranks among voters’ top concerns, which political party or candidate voters’ trust, and how health care issues might motivate voter turnout. This issue brief summarizes the role health care has historically played in elections using KFF polls, exit polls, and other data to show how health care, especially the issue of health care costs, may play a role in the upcoming 2026 midterm elections.

Key Takeaways

  • Historically, health care has often been among the most important issues to voters: In most presidential and midterm election year polling since 1992, health care ranked among voters’ top concerns, with “the economy” taking the top spot in most elections. While these polls usually ask voters to choose between health care and the economy as separate issues, KFF polling has long shown how health care costs are an important factor in people’s economic concerns. On its own, health care rose to the top spot in the 2018 midterm exit poll, immediately after the failed attempt to repeal and replace the Affordable Care Act (ACA). In almost all recent elections, Democratic voters have consistently been more likely than Republican voters to say that health care is a top electoral issue.
  • Partisan advantages on health care and the economy: Historically, Democrats have held an advantage over Republicans on who voters trust to handle health care issues, while Republicans have usually been seen as stronger on the economy. Health care costs sit at the intersection of these issues, raising questions about which party voters will trust more to address the affordability of health care. Recent KFF polling data suggests that heading into the 2026 election, the Democratic Party has the advantage on health care costs, but notably, about a quarter of voters, rising to four in ten independent voters, say they trust neither party on this issue.
  • Implications for the 2026 Midterms: Looking ahead to the 2026 midterm elections, the issue of health care affordability may help candidates motivate their bases. As of March 2026, Democrats maintain an advantage over Republicans in voter trust to address the cost of health care and prescription drugs, and majorities say health care costs are important to their vote. Who voters will ultimately trust to handle the affordability of health care, and whether the issue will be enough to translate into turnout and votes, remains an open question.

Health Care Has Been Among the Top Electoral Issues, Especially Following Periods of National Debate

National exit polls from elections over the past several decades show that voters ranked health care among their top concerns, but “the economy” was the number one issue in most elections. While exit polls usually ask voters to choose between health care and the economy as separate issues, KFF polling has long shown that health care costs are a key economic concern for the public. Analysis of exit poll data also show that health care has been more top-of-mind for voters immediately following periods of national debate on health care reform, such as in elections held during President Clinton’s presidency (1992-1998) and later during President Obama’s presidency (2008-2016) and the passage of the Affordable Care Act (ACA) in 2010. In these instances, health care costs were key health care issues, with political debate centering around affordability. But in the past three decades of exit polls, health care itself has only been ranked the number one issue by voters once, during the 2018 midterms after Republican attempts to repeal and replace the ACA failed dramatically in the Senate. Since 2020, health care has remained among the top issues, with the focus in some elections on specific health care issues such as COVID-19 or abortion access.

Figure 1

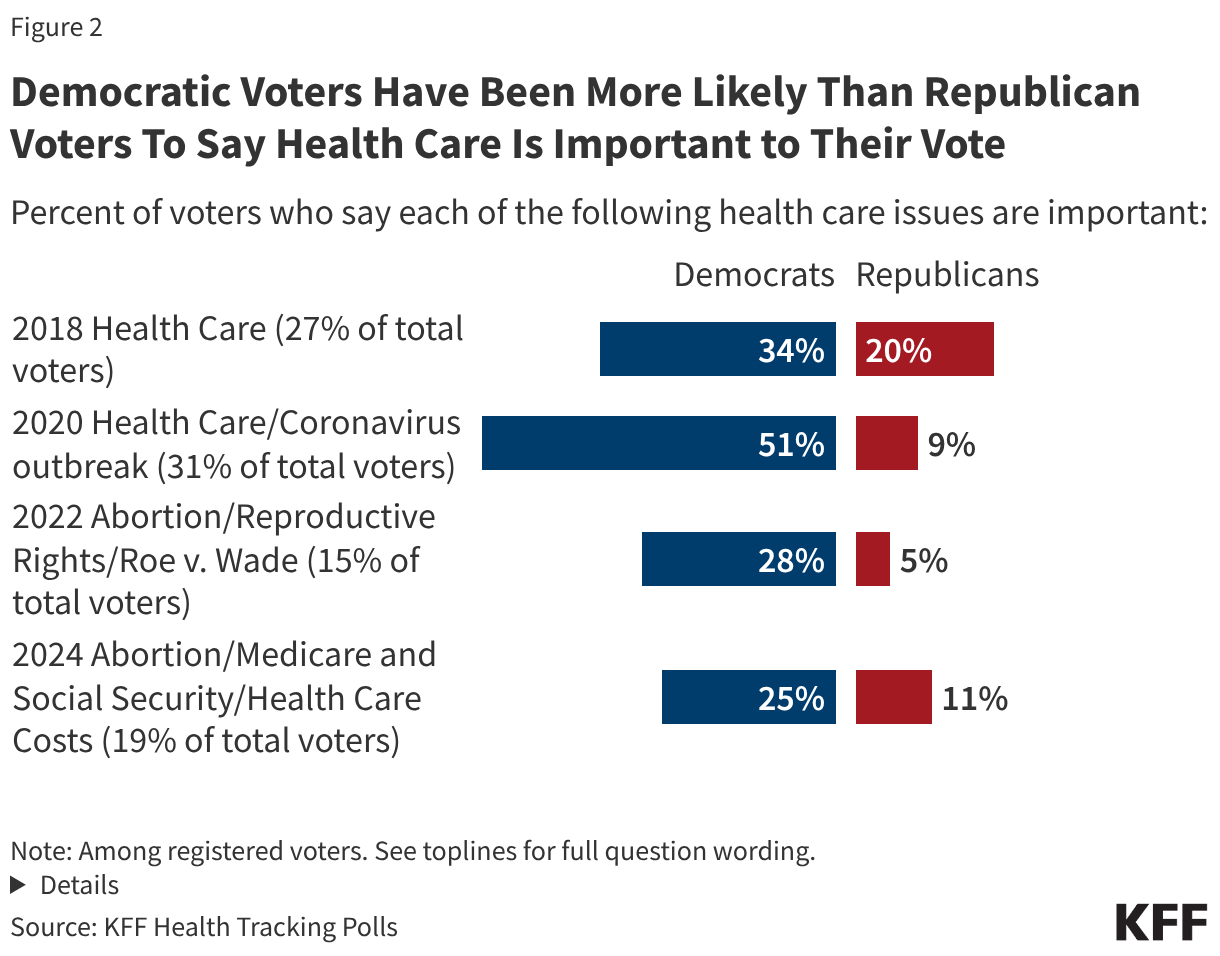
Democratic Voters Are More Likely to Say Health Care Is Important to Their Vote

Notably, Democratic voters have typically been more likely than Republican voters to cite health care issues as important in pre-election KFF Health Tracking Polls. For example, in 2018, when health care was the number one issue for all voters, about one third (34%) of Democratic voters said it was important for 2018 candidates to talk about health care, compared to one in five (20%) Republicans who said the same. In more recent elections when health care issues focused on specific topics like abortion rights and COVID-19, between a quarter and half of Democratic voters picked these issues, versus about one in ten, or fewer, Republican voters.

Split bar chart showing the share of republican and democratic voters who say each health care issue is important to their vote.

Democrats Have Historically Had Advantage on Health Care, Republicans on the Economy

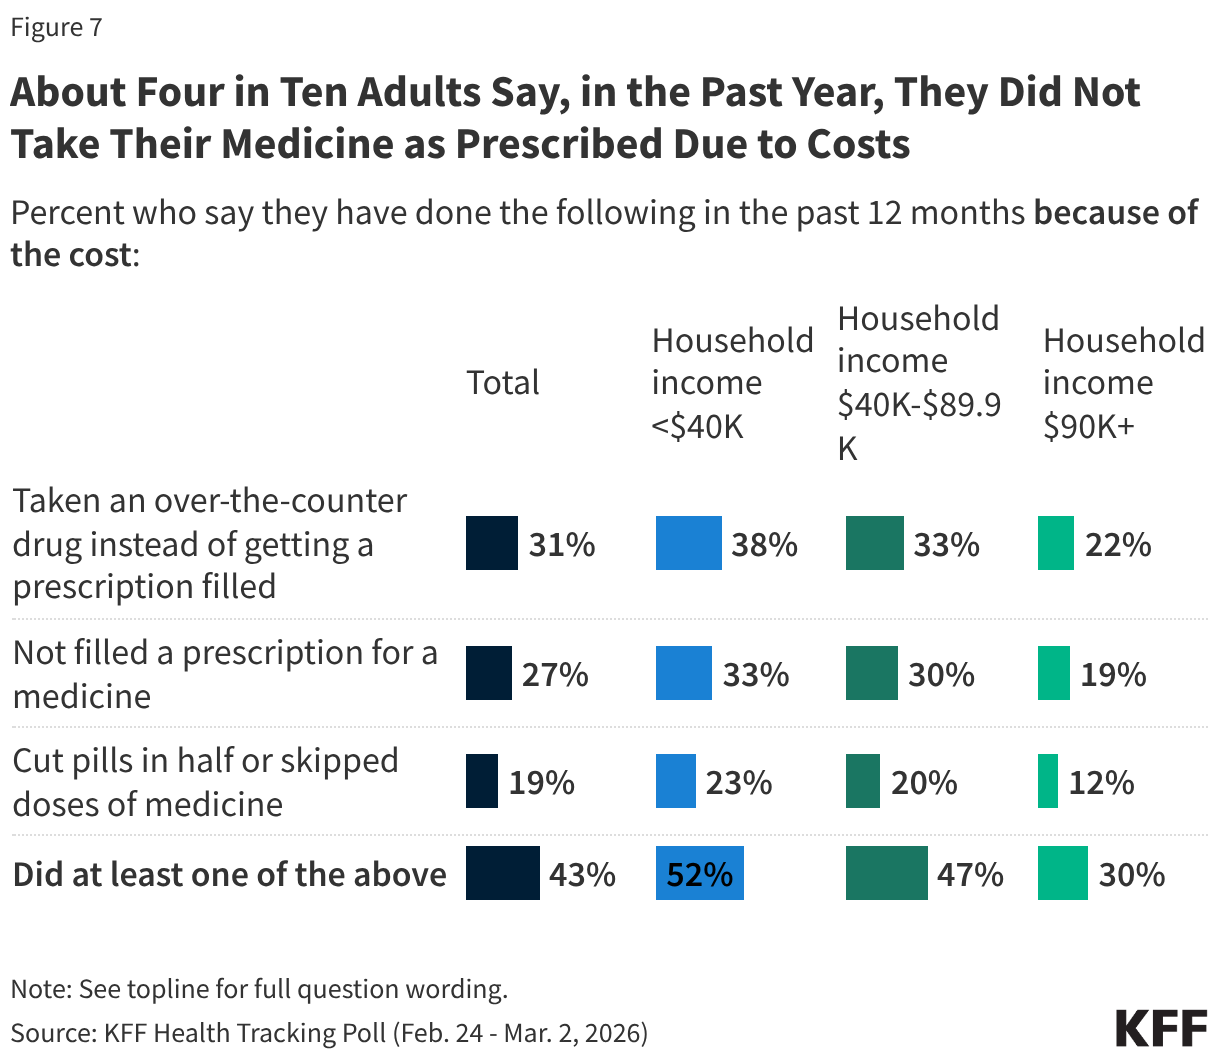
While “the economy” tends to almost always have the top billing in election poll issue rankings, KFF polls have consistently found that the cost of health care is an important part of people’s economic concerns. Indeed, recent KFF polls have found that health care costs are a top economic worry, with many adults saying they have difficultly affording these costs, they are burdened by health care debt, or that they delay or skip care due to high costs. Given that health care costs sit at the intersection of both health care and the economy, who do voters say they trust on this issue?

When it comes to presidential elections, KFF Health Tracking Polls and other polls have found that voters often say the Democratic candidate is better suited to handle health care, while the Republican candidate is better suited to handle the economy. In the 2012 and 2016 elections, President Obama and Secretary Clinton had more than 10-percentage point leads over Governor Romney and President Trump respectively in the share of voters who said they trusted each on health care. When it comes to the economy, President Obama had a 7-percentage point advantage over Governor Romney in 2012, but in subsequent elections, President Trump has had an advantage over each of his Democratic opponents. These leads were narrow over Secretary Clinton in 2016 and President Biden in 2020, but widened to a 15-percentage point lead over Vice President Harris in 2024.1

Figure 3

In an era of hyper-partisan politics, KFF Health Tracking Polls conducted in the lead up to elections find that most voters tend to trust their own party to handle the direction of key issues. But among voters overall and among independent voters, the Democratic party has typically had an advantage over the Republican party when it comes to health care costs. For example, in surveys conducted in election years from 2012 to 2023, the Democrats had an advantage of thirteen percentage-points or less over Republicans on lowering health care costs. But in 2023, about six in ten voters said they trust the Democrats on the affordability of health care, compared to about four in ten who said they trust the Republicans.
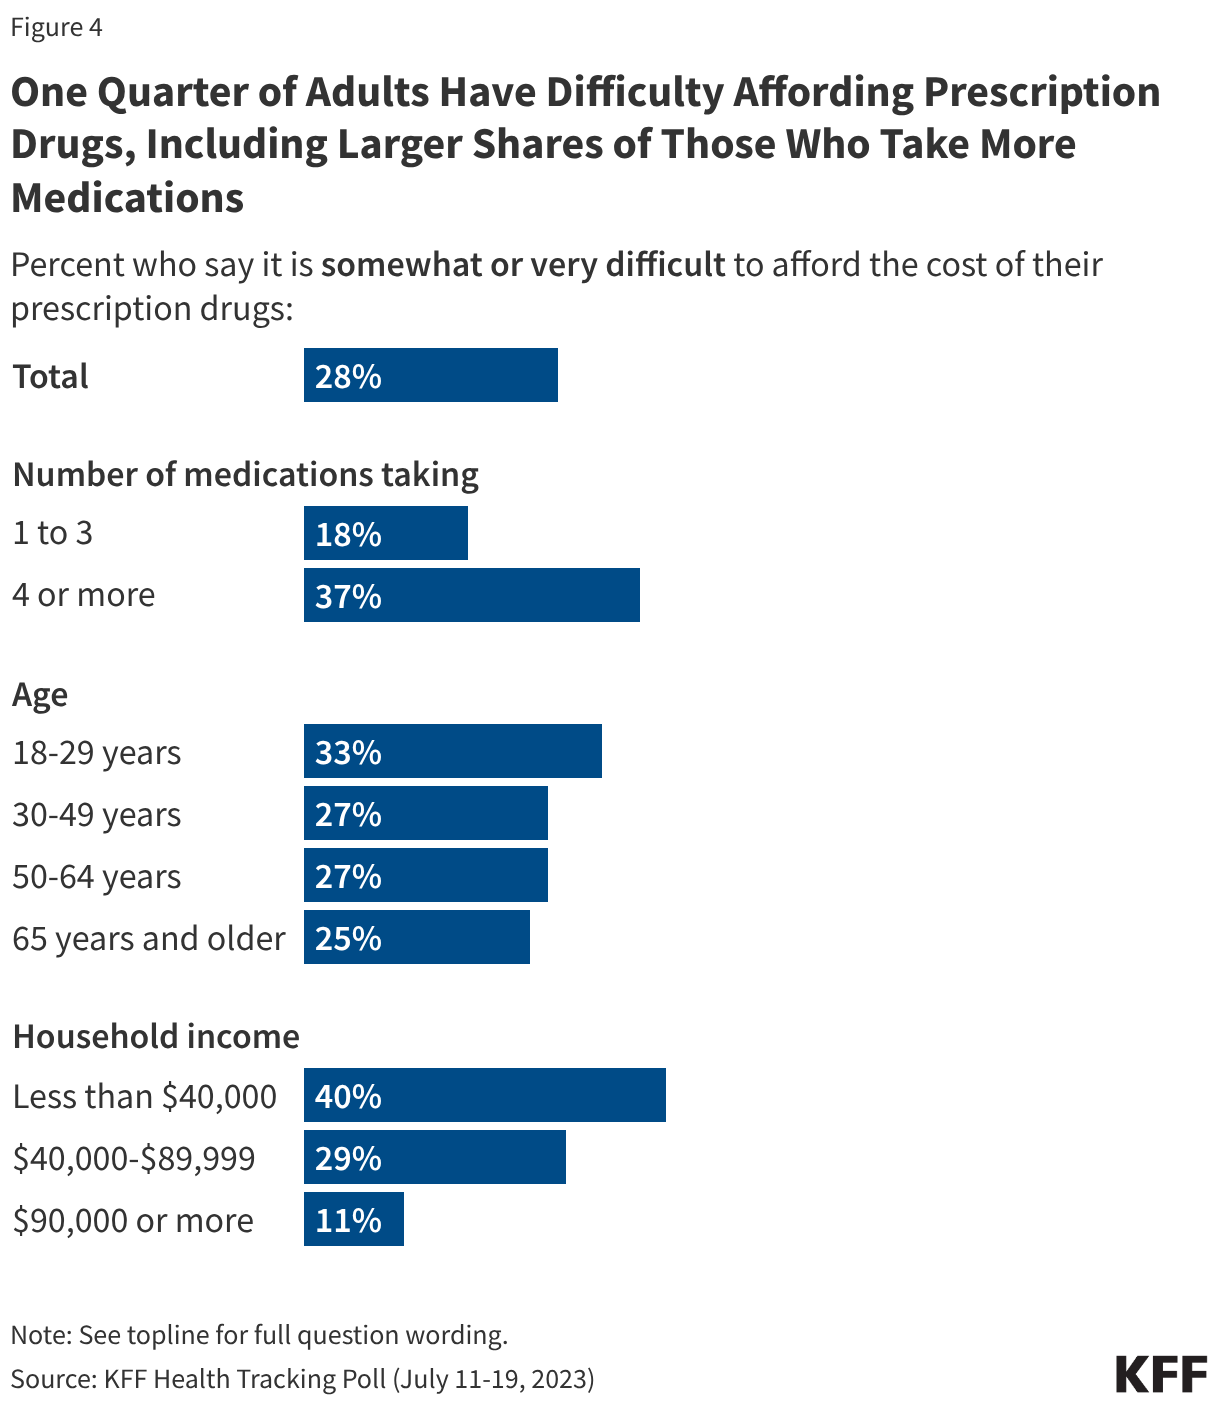
Figure 4

Implications for the 2026 Midterm Elections

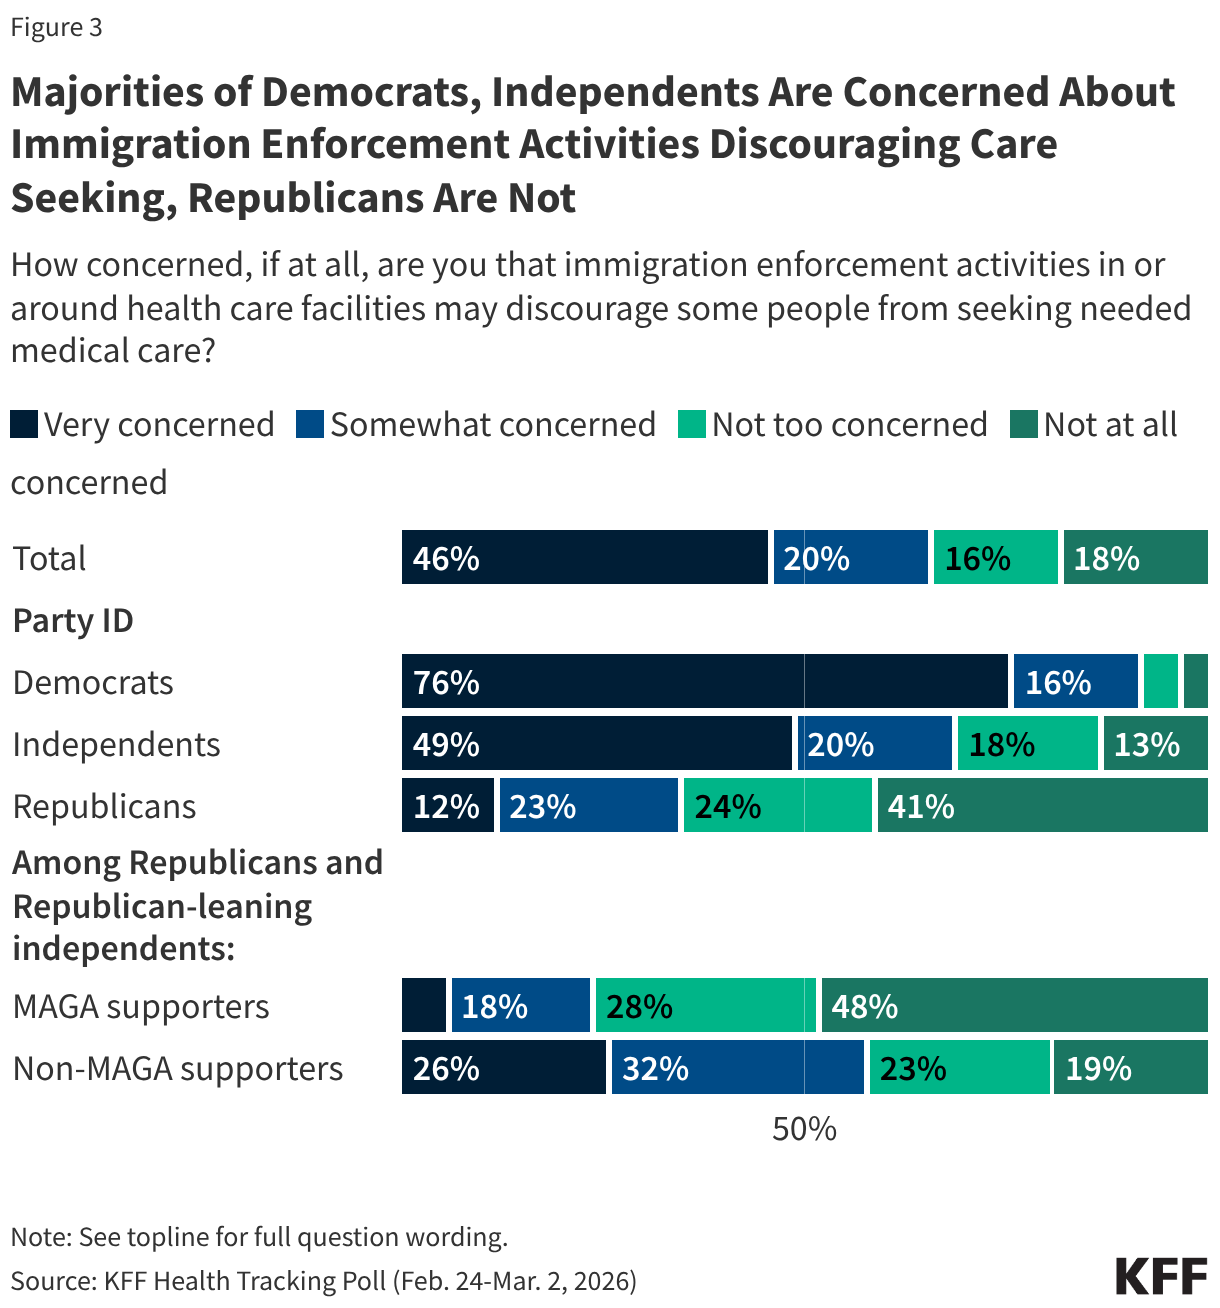
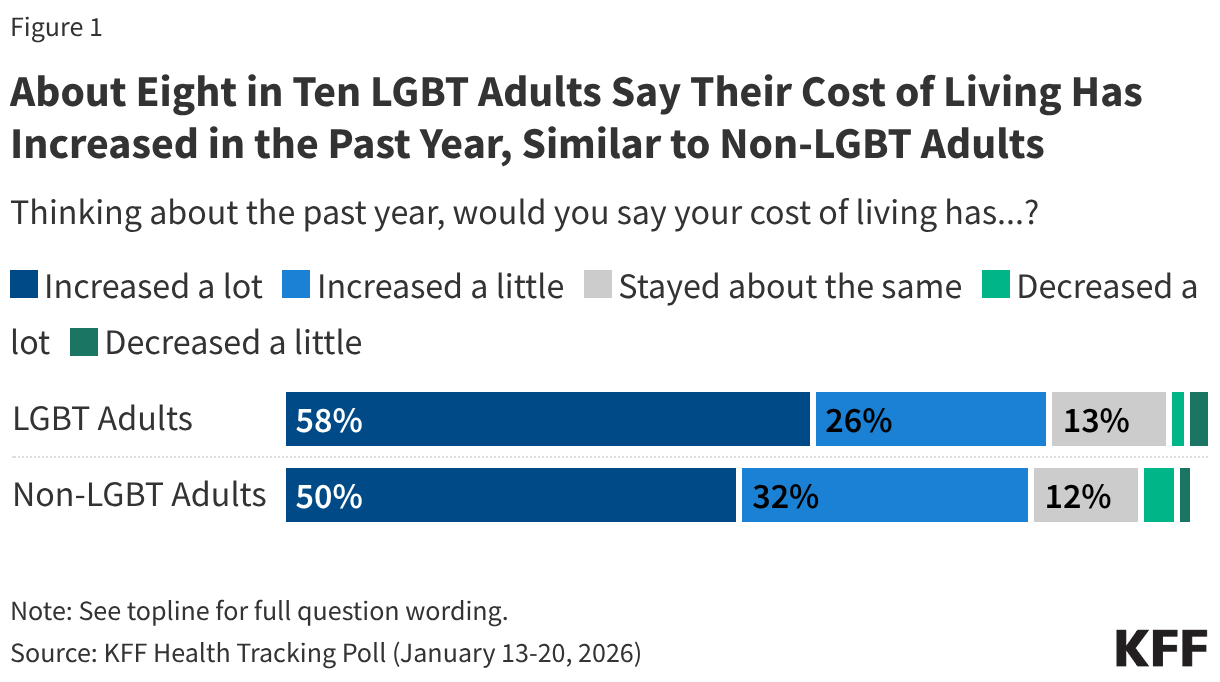
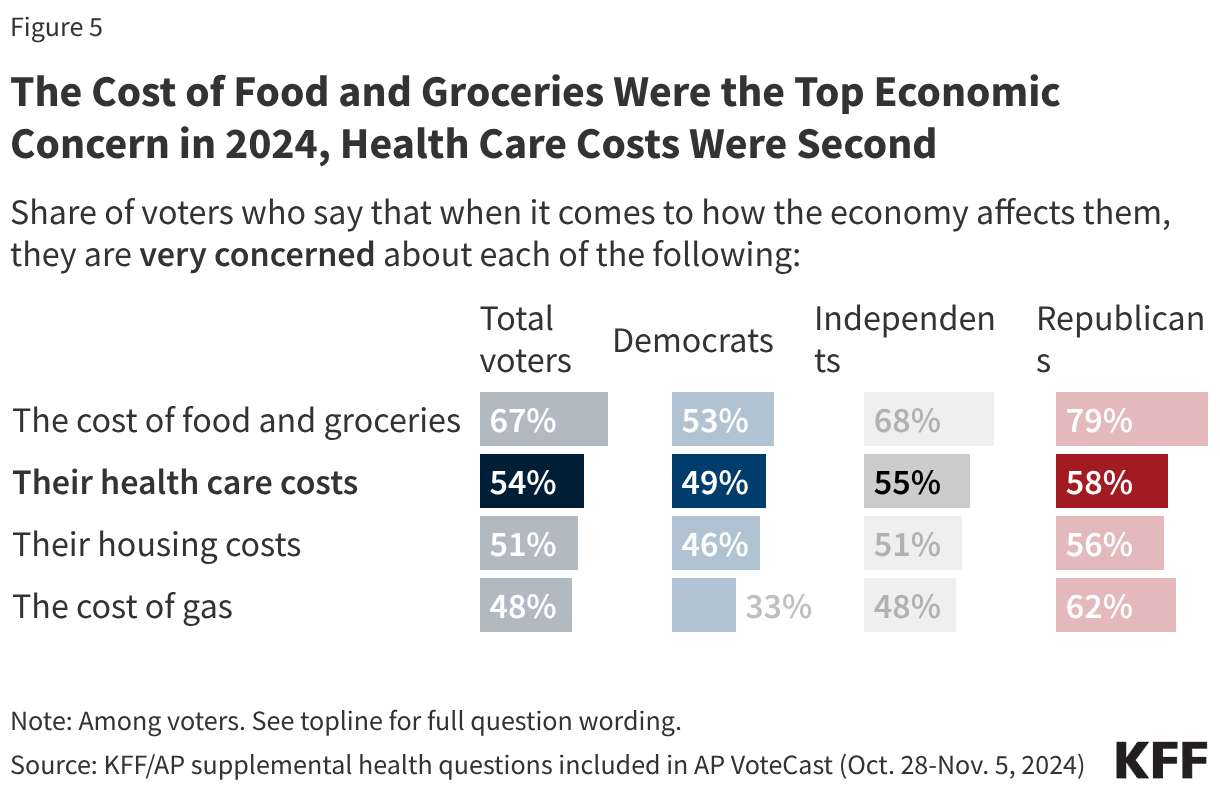
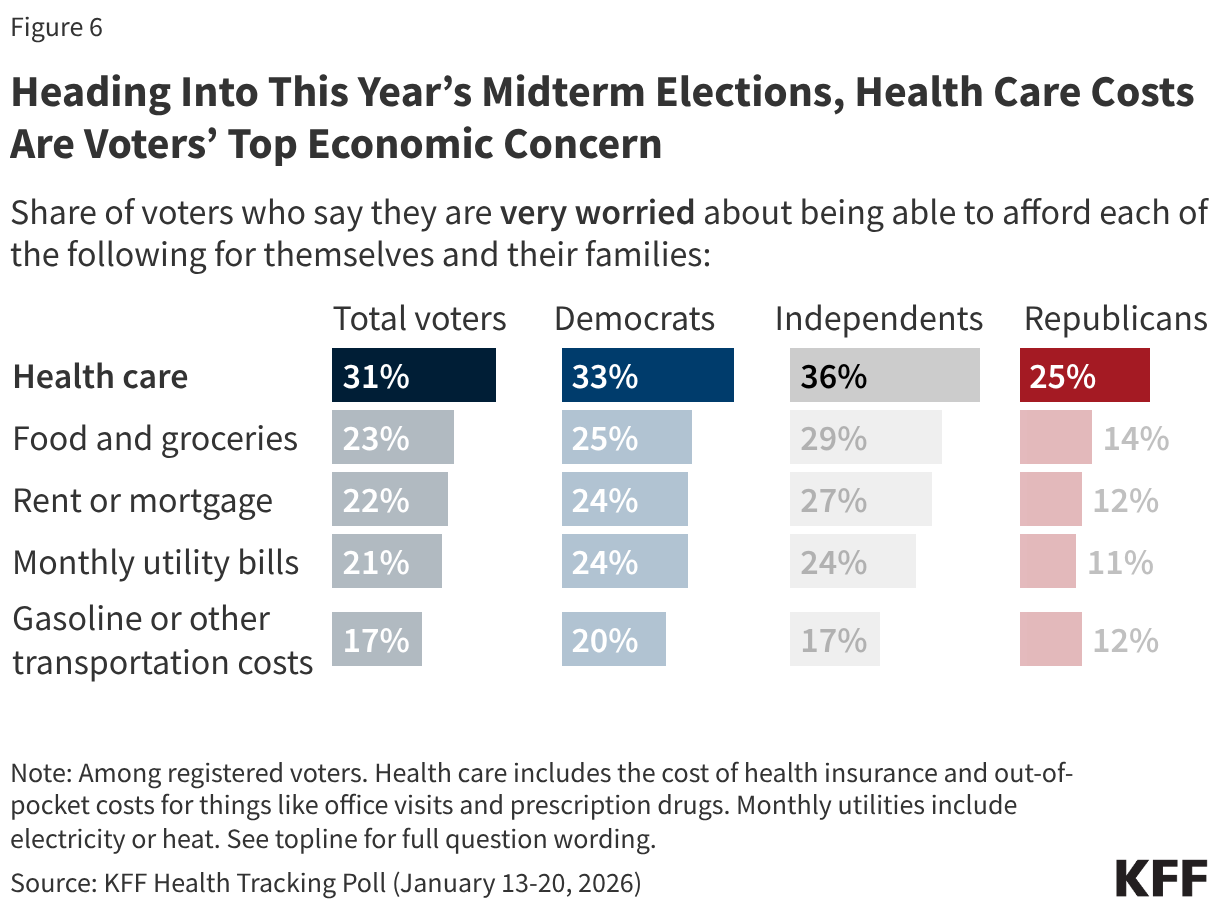
While there are many months before the midterm elections and events such as the war in Iran may shift electoral concerns, recent KFF pre-election polls show the public remains concerned about the number one issue of the 2024 election: the economy. But recent polls also suggest that the role of health care costs among voters’ economic concerns appears to be on the rise compared to previous election cycles. In 2024 polling from AP Votecast, when voters were specifically asked about which household costs they were “very concerned” about, the cost of food and groceries took the top spot across partisans (67% of total voters), and health care costs (54% of total voters) ranked second for Democratic and independent voters.

Split bar chart showing the share of partisan voters who say they are very concerned about the cost of essentials.

In more recent KFF polling from January 2026, health care costs are now voters’ top economic concern (31% of total voters say they are “very worried”). This is the case across partisanship, with substantial shares of Democrats (33%), independents (36%) and Republicans (25%) saying they are “very worried” about being able to afford health care for themselves and their families. 

Split bar chart showing the share of partisan voters who say they are very worried about being able to afford essentials for themselves and their families.

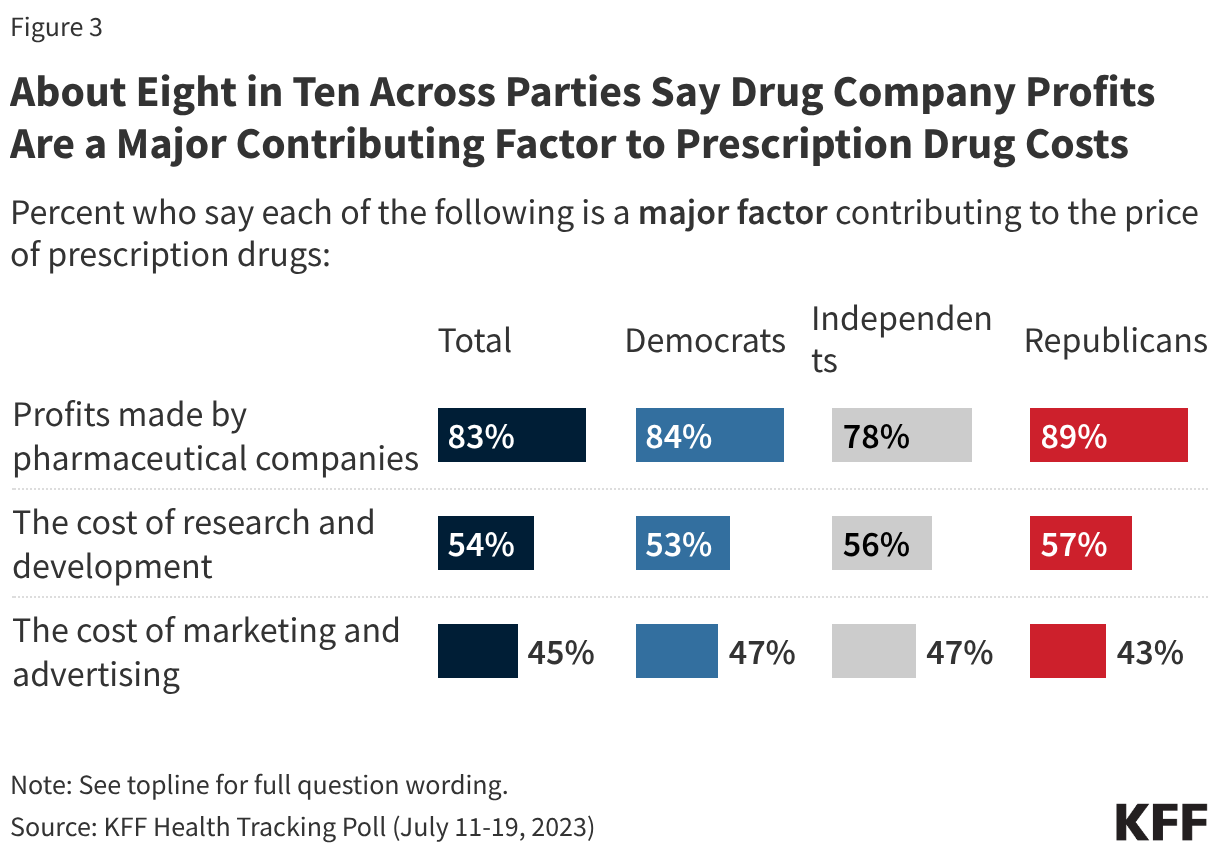
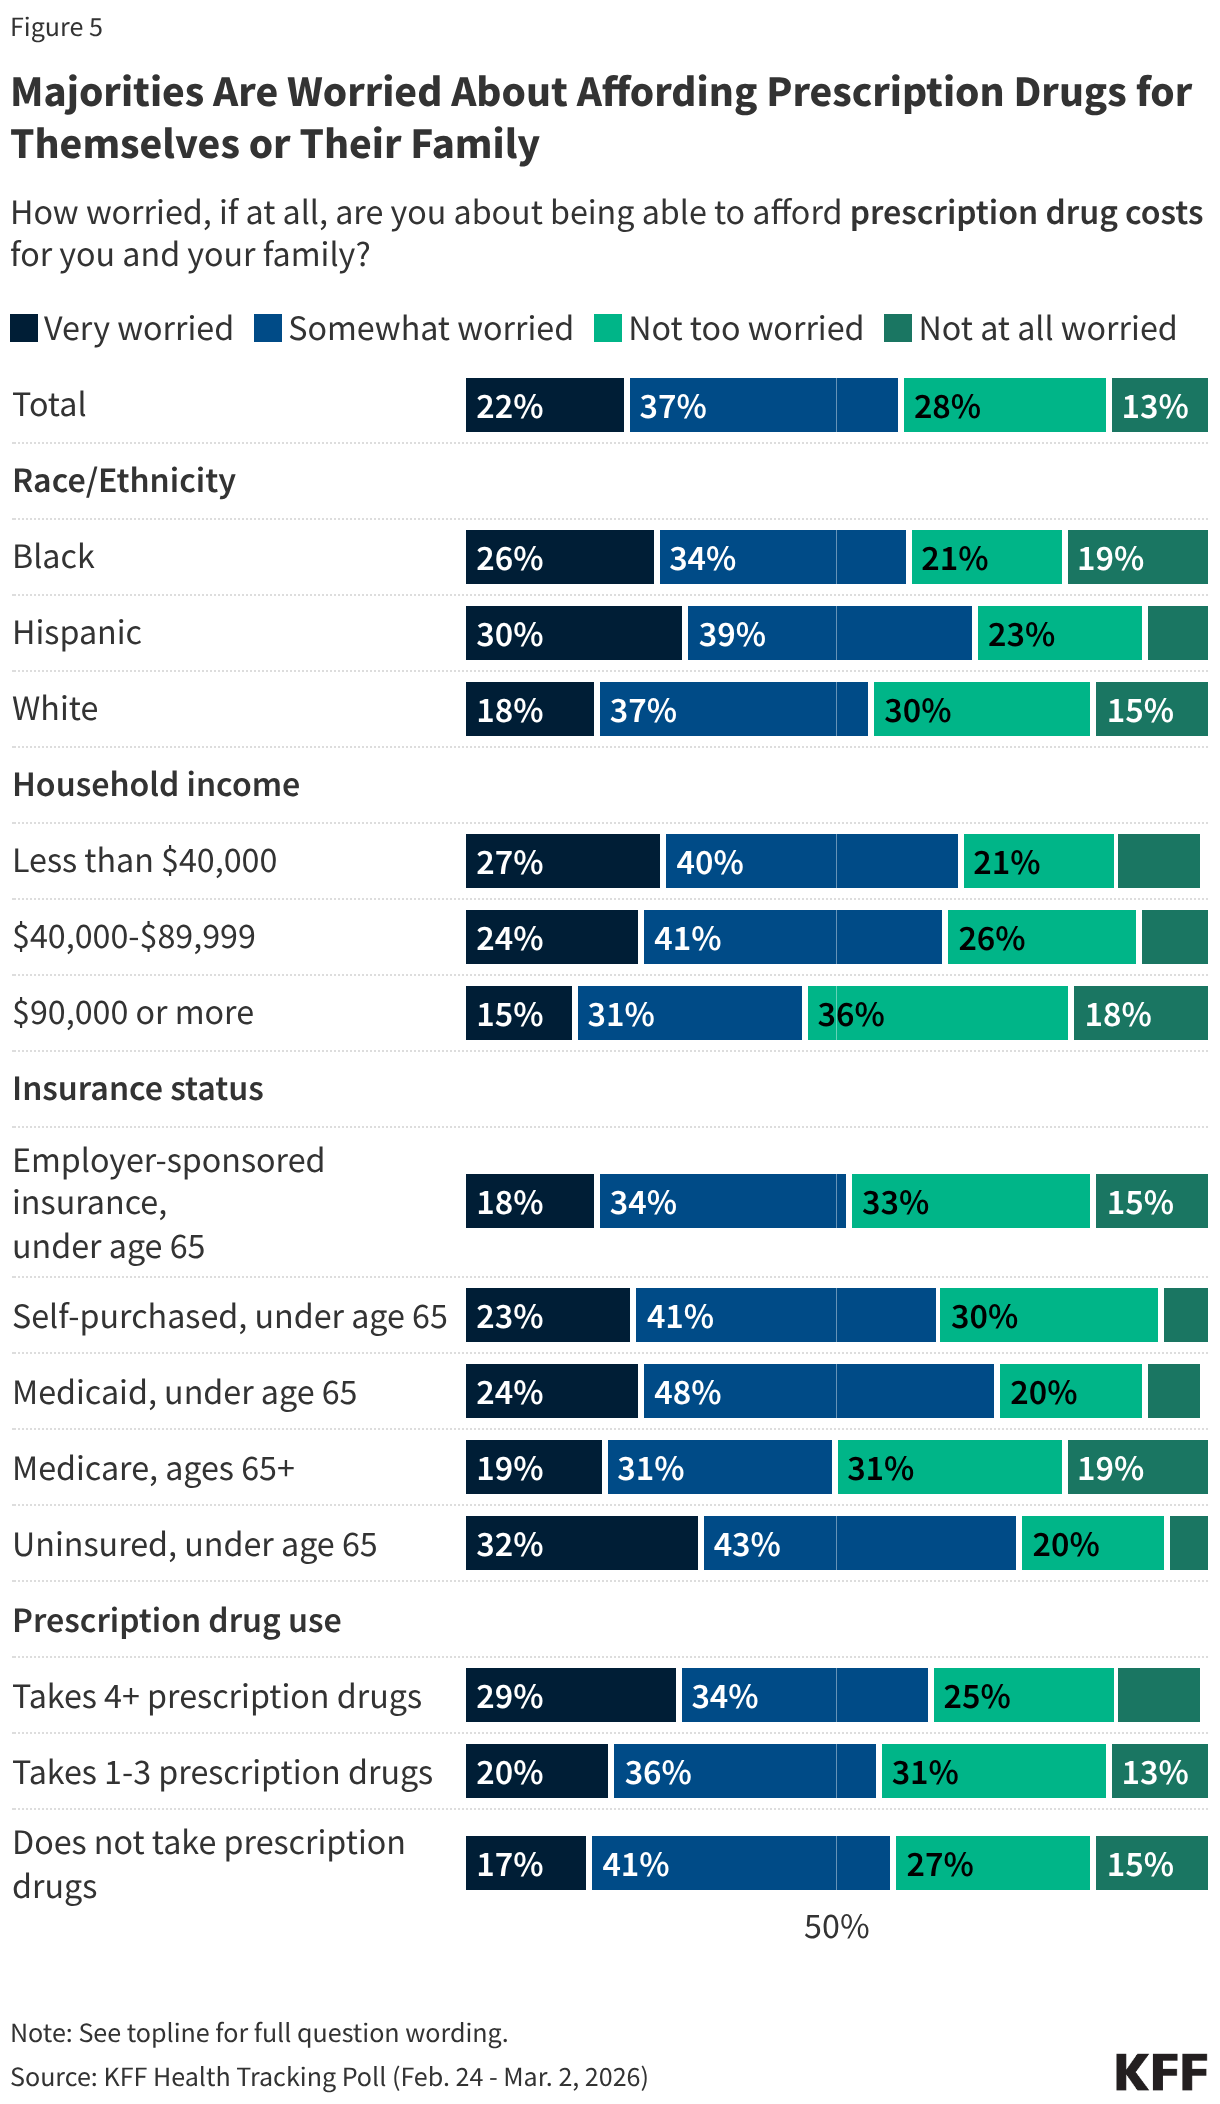
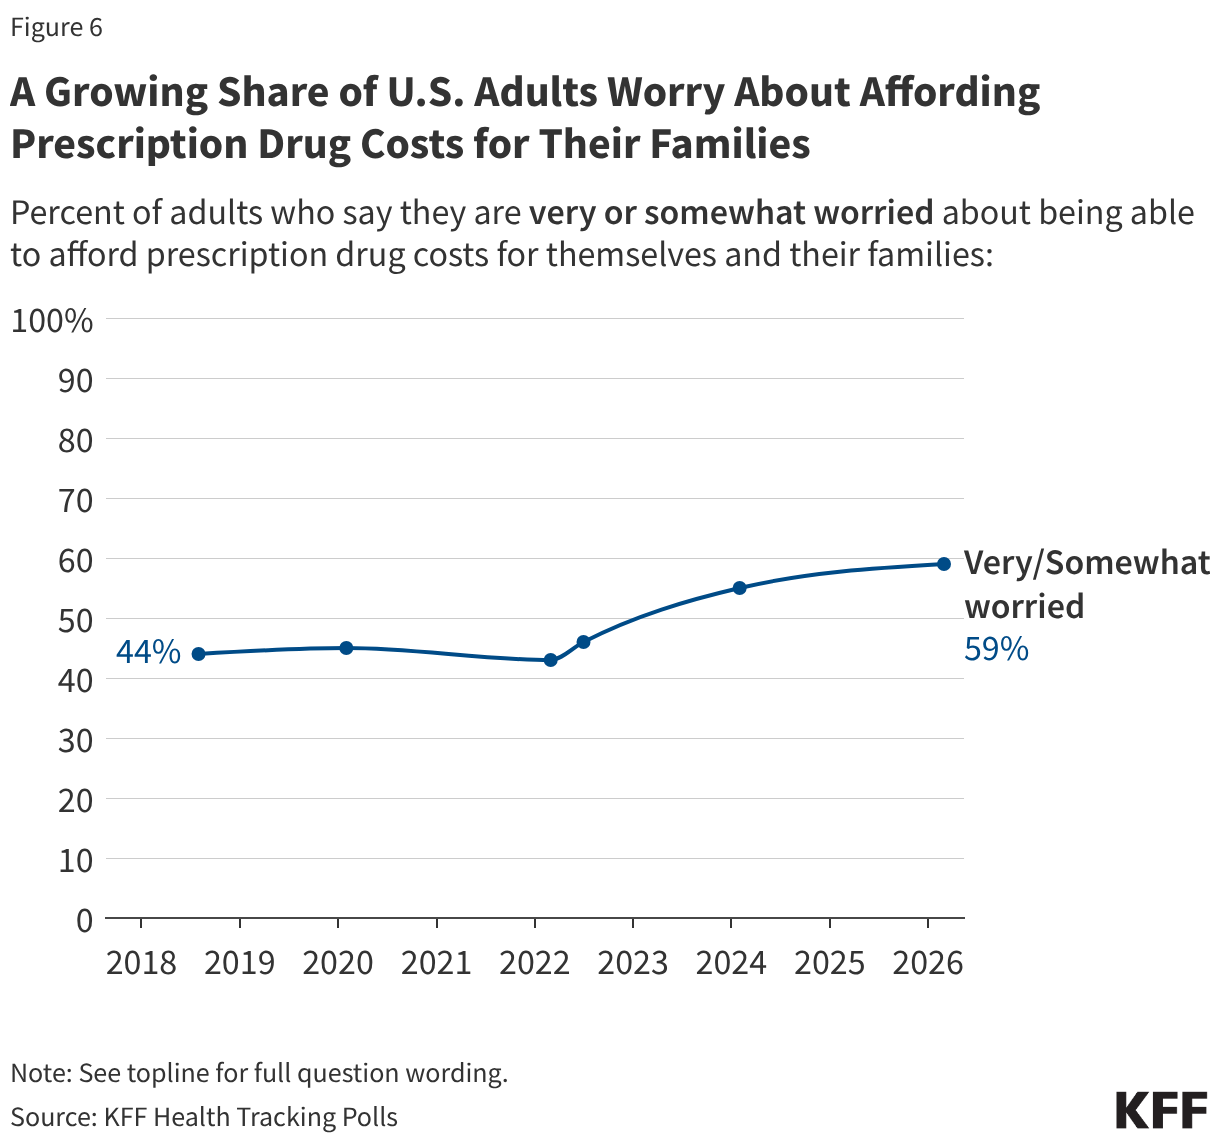
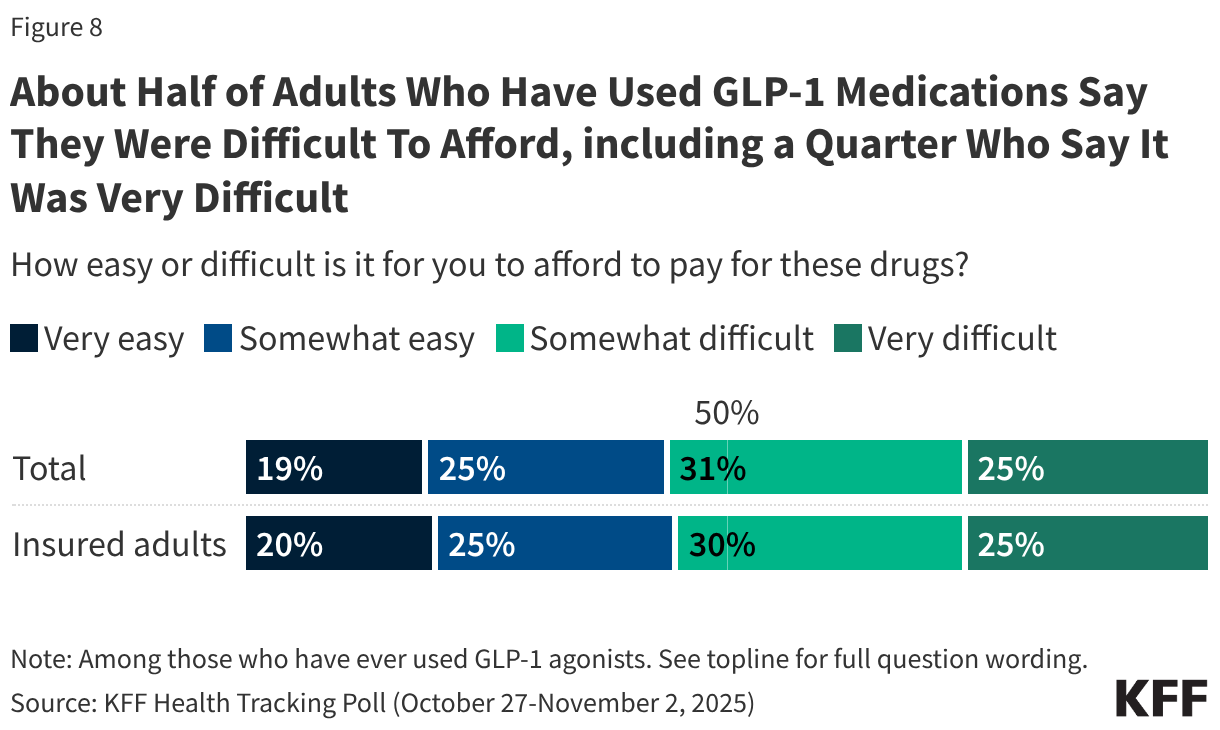
In January of this year, about one in four voters also said they feel their health care costs are increasing faster than other household expenses, such as food and utilities, and looking ahead, a majority (58%) said they expect health care costs for them and their families to become less affordable next year. In addition, in March, a majority (59% of the public; 57% of voters) say they are worried about affording prescription drugs for themselves and their families, the largest share since KFF first polled on this question in 2018.

The rising concern about health care costs has occurred at a time when health insurance premiums and cost-sharing for employer-sponsored insurance are on the rise, with the average annual premium for family health coverage rising 6% to nearly $27,000 in 2025. At the same time, the policy debate and government shutdown over the ACA enhanced tax credits have put a spotlight on increasing health care costs for ACA marketplace enrollees.

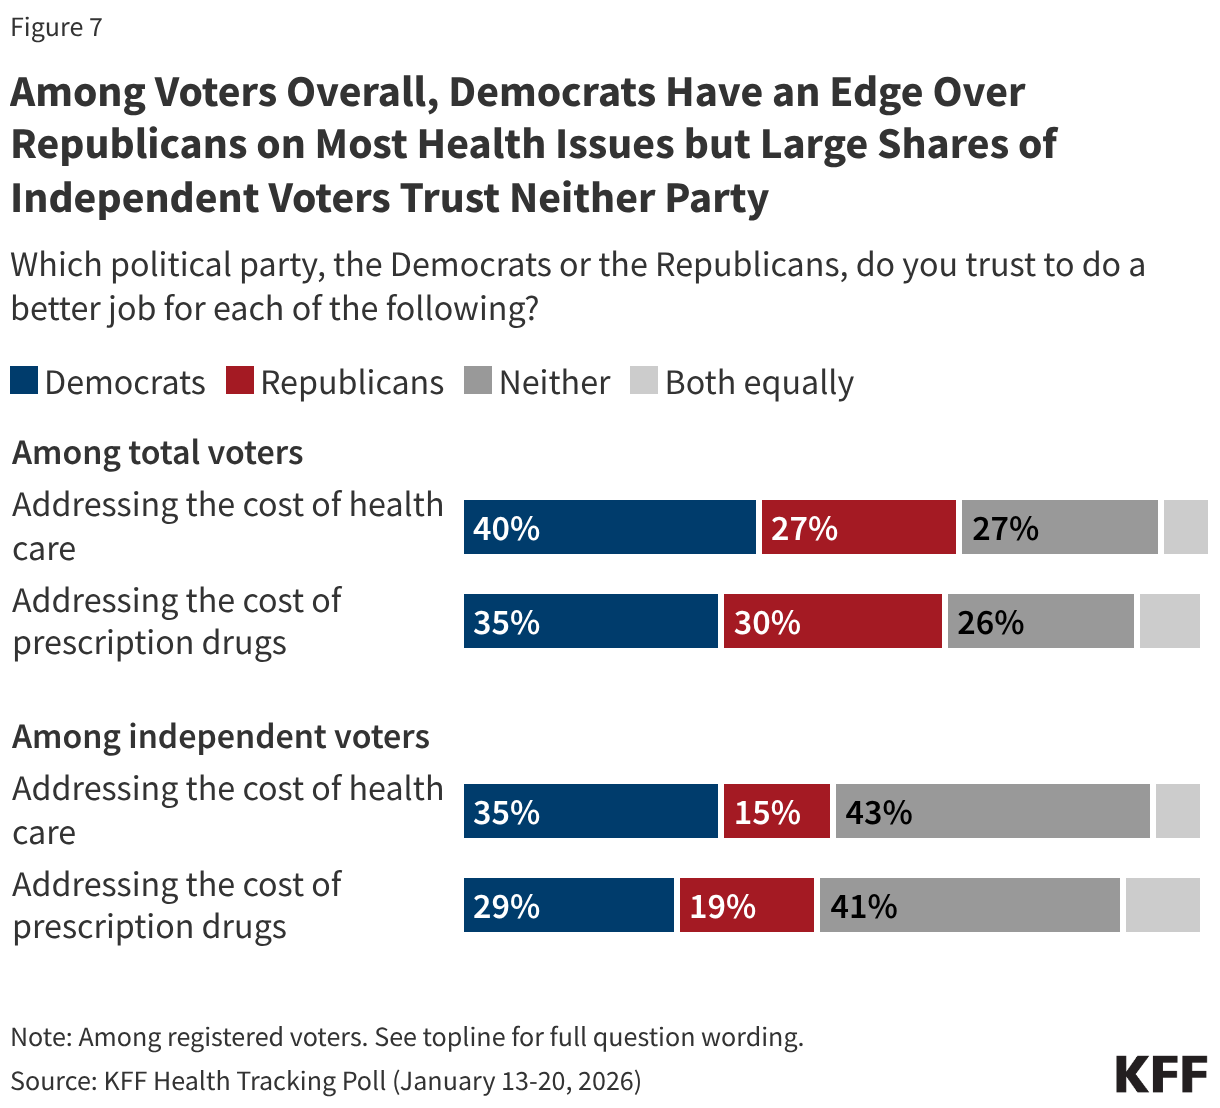
Amid this environment, there are signs that Democrats may now be viewed as more trustworthy than they were in 2024, when President Trump (the Republican candidate) won more votes than Vice President Harris (the Democratic candidate) among voters who said they were “very concerned” about health care costs (54% vs. 44%). Now, KFF polling from March 2026 finds Democrats have an advantage over Republicans for who voters trust to address the cost of health care (40% vs. 28%) and the cost of prescription drugs (38% vs. 28%), with about one in four voters saying they trust “neither party” on these issues.

Democrats maintain an advantage on health care and prescription drug costs among independent voters as well. But notably, the share saying they trust “neither party” rises to about four in ten among independent voters, larger than the shares who say they trust either the Democrats or the Republicans. The sizeable shares of independent voters, as well as voters overall, who say they trust neither party suggests that both parties may still be able to make inroads with voters on the issue of health care affordability before the midterm elections. But it also illustrates that there might be a lack of enthusiasm for candidates on this issue and may suggest that some voters may choose to stay home if they don’t feel either party can address this core issue.

Stacked bar chart showing share of registered voters who say they trust the Democrats, Republicans, or neither party to do a better job addressing key health care issues.

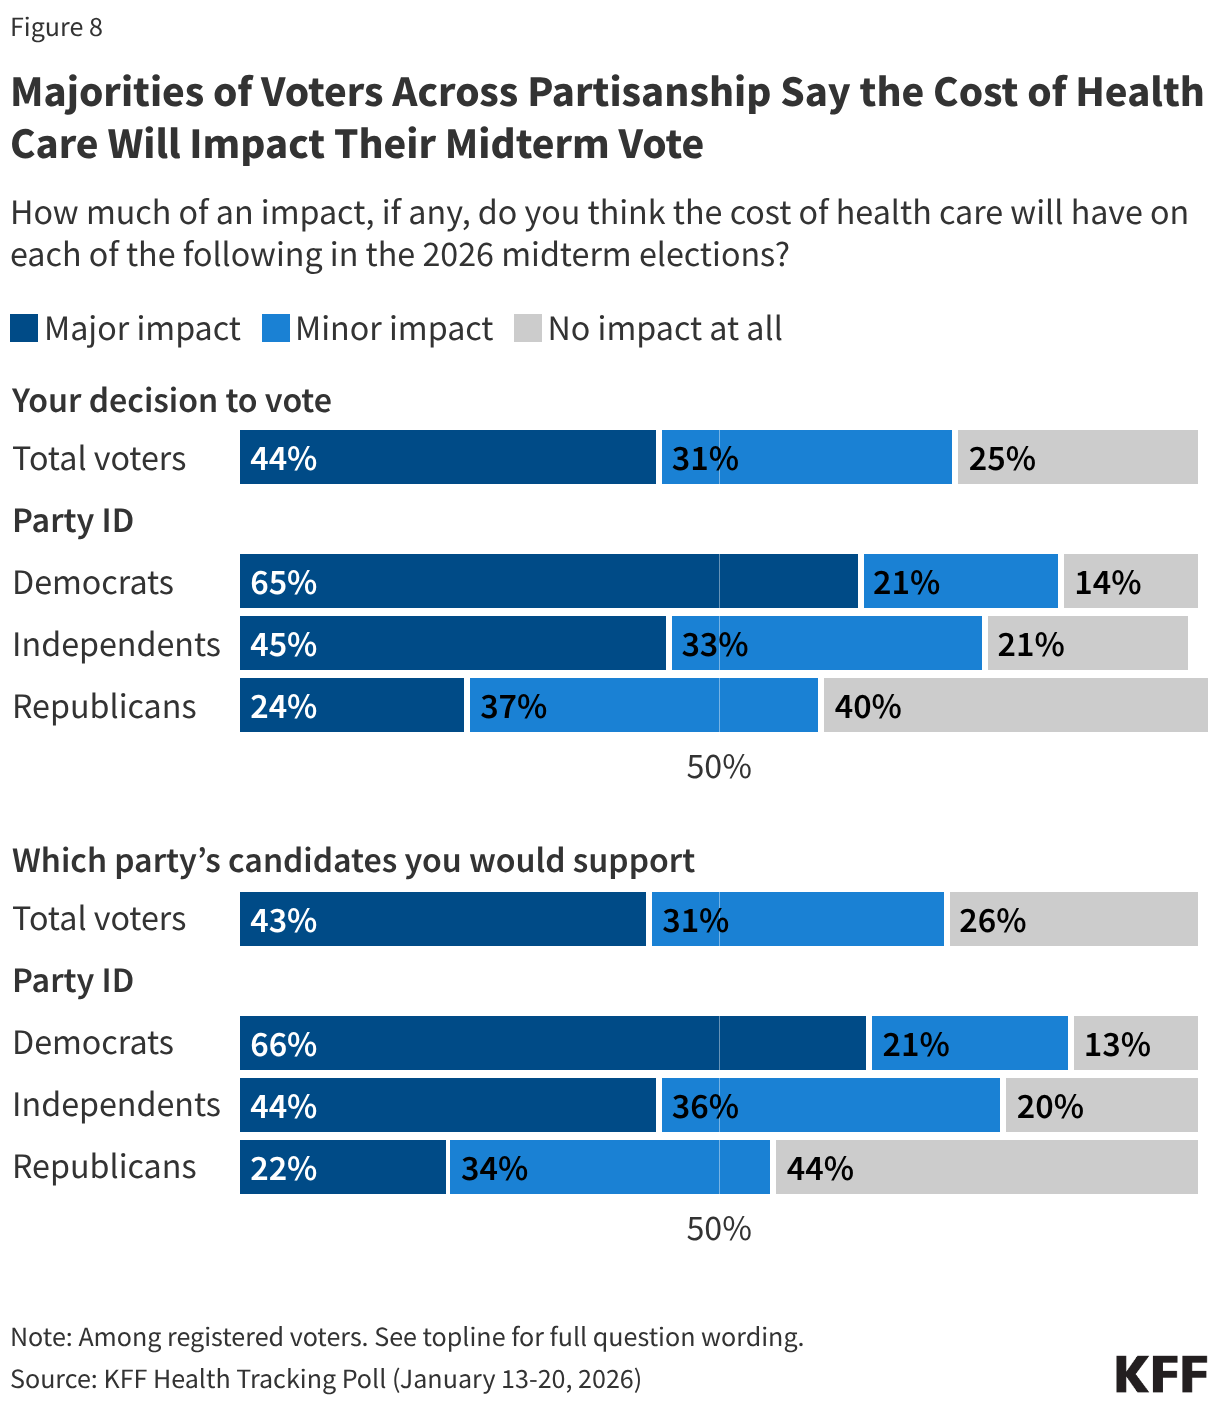
While voter trust and the perceived importance of health care costs matter for the midterm election, a key factor is how strongly the issue motivates voters to turn out. The 2026 campaigns are just beginning, but health care costs seem to be motivating voters across party lines. As of January 2026,  about two-thirds of Democratic voters and just less than half of independent voters said health care costs will have a “major impact” on both their decision to vote and which party’s candidate they will support. On the other hand, about one in four Republican voters also said health care costs will have a “major impact” on their voting choices, and an additional third said it will have a “minor impact,” suggesting the issue is motivating Republicans as well.

Stacked bar chart showing the shares of adults who say the cost of health care will have a major impact, minor impact, or no impact at all on their decision to vote or which party's candidate they would support in the 2026 midterm elections. Shown among total voters and by party identification.

  1. In 2012, question wording was, “Which presidential candidate, Barack Obama or Mitt Romney, do you trust to do a better job… lowering health costs for people like you?” and “…dealing with the economy and jobs?”
     
    In 2016, question wording was, "Thinking about the candidates for president in 2016, regardless of political party or who you intend to vote for, which candidate do you trust to do a better job dealing with access and affordability of health care, Donald Trump or Hillary Clinton?" and "Regardless of which presidential candidate you support, please tell me if you think Hillary Clinton or Donald Trump would better handle each of the following issues...The Economy."
     
    In 2020, question wording was, "Thinking about the candidates for president in 2020, regardless of political party or who you intend to vote for, which candidate do you trust to do a better job… dealing with health care, Donald Trump or Joe Biden?" and "…the economy."
     
    In 2024, question wording was, "Regardless of who you intend to vote for in the upcoming elections, which presidential candidate do you trust to do a better job dealing with each of the following?" "The economy and inflation" and "Health care costs, including prescription drug costs." ↩︎

Policy Tracker: Exceptions to State Abortion Bans and Early Gestational Limits 

Last updated on April 1, 2026

states have abortion bans or early gestational limits in effect

states have no health exception

states have no rape or incest exception 

states have no fatal fetal anomaly exception 

Abortion is currently banned in 13 states and 7 states have early gestational limits between 6 weeks and 12 weeks in effect. Nearly all of these bans include exceptions, which generally fall into four categories: to prevent the death of the pregnant person, when there is risk to the health of the pregnant person, when the pregnancy is the result of rape or incest, and when there is a lethal fetal anomaly. Almost all states with a health exception limit it to conditions affecting physical health, with some going further by explicitly excluding emotional or psychological conditions. Alabama is currently the only state with an abortion ban or early gestational limit in place that includes an exception for mental health within its broader health exception. Some states have more than one abortion ban or restriction in place. The maps below illustrate the exceptions in each state’s most restrictive gestational limit or total ban. For details hover over each state to read the rollover.  

For more information on the status of state abortion bans, please visit our Abortion in the United States Dashboard

Exceptions to State Abortion Bans and Early Gestational Limits in Effect, as of April 1, 2026 (Choropleth map)
Exceptions to State Abortion Bans and Gestational Limits in Effect, as of April 1, 2026 (Table)
Poll Finding

KFF Health Tracking Poll: The Public’s View of Immigration Enforcement Activities in Health Care Settings

Published: Apr 1, 2026

Findings

Soon after taking office, President Trump reversed longstanding policy that had protected against immigration enforcement in “sensitive locations” including health care facilities, schools, and places of worship. Following this recission, as well as an overall increase in enforcement activity, there have been reports of Immigration and Customs Enforcement (ICE) agents showing up at hospitals and other health care facilities. ICE presence at and around health care facilities has led to growing concerns among health care providers about the impacts on the health and safety of the community, including adults and children going without care. These actions sit against a backdrop of broad increased enforcement activity and policies restricting access to health coverage and care for immigrant families. Research shows that this environment has negative impacts on the mental and physical health of immigrant families, including the millions of U.S. citizen children living in them, as well as broader economic effects on communities.

KFF has conducted multiple surveys examining immigrants’ health and experiences amid the policy environment as part of its Surveys of Immigrants conducted since 2023. New data from the KFF Health Tracking Poll provides insights into how the general public views the Trump administration’s immigration enforcement polices in health care settings. Overall, it shows the public is split along partisan lines on the administration’s approach to immigration enforcement in health care facilities. Democrats and independents express concern over the administration’s tactics, whereas Republicans are largely not concerned. Majorities of Democrats and independents say they do not think ICE or Customs and Border Control (CBP) should be allowed to arrest or detain people in and around health care facilities, whereas a majority of Republicans say they should be allowed. On each of these measures, Republicans and Republican-leaning independents who support President Trump’s MAGA movement are much more likely to support these tactics or say they are not concerned than non-MAGA supporters.

A majority of the public say they are concerned about the Trump administration’s tactics and immigration enforcement activities in or around health care settings. This includes majorities of the public who say they are “very” or “somewhat” concerned about people who have been hospitalized after being detained by federal immigration officials not being allowed to contact their families (69%), ICE or CBP arresting or detaining people in health care settings (63%), and health care providers and officials sharing patients’ immigration status with ICE or CBP (59%).

While majorities of the public are concerned about each of these tactics, there are big differences by partisanship, with Democrats and independents more likely than Republicans, especially MAGA Republicans, to say they are concerned about these. For example, about nine in ten Democrats and three-quarters of independents say they are concerned about people who have been hospitalized after detainment not being allowed to contact their families, whereas four in ten Republicans express concern. There are larger divides by partisanship on the two other tactics asked about, with Democrats about three times as likely as Republicans to say they are concerned about ICE or CBP detaining people in or around hospitals, clinics, or other health care facilities (92% vs. 28%) and health officials, hospitals, or health care providers sharing patients’ immigration status with ICE or CBP (86% vs. 24%). For each of these immigration enforcement tactics, two-thirds or more of independents say they are “very” or “somewhat” concerned about them. There are also differences among Republicans and Republican-leaning independents who support MAGA versus those who do not support the MAGA movement, with non-MAGA supporters at least twice as likely to say they are concerned about these tactics than MAGA supporters.

Split bar chart showing percent who say they are very or somewhat concerned about immigration enforcement actions in health care settings. Results shown by total adults, party identification, and MAGA support.

A majority of the public (56%) says ICE and CBP should not be allowed to arrest and detain people in or around hospitals, doctors’ offices or health clinics where they are seeking care, while about three in ten (28%) say they should be allowed, and one in six (16%) are “not sure.” There are stark divides by partisanship on this tactic. Nearly nine in ten (86%) Democrats and about six in ten (59%) independents say immigration enforcement activity should not be allowed in or around health care facilities, whereas six in ten Republicans say it should be allowed. But again among Republicans on this question, MAGA supporters are much more likely than non-MAGA supporters to say this tactic should be allowed (71% vs. 32%), and four in ten (41%) non-MAGA Republicans say it should not be allowed.

Stacked bar chart showing whether adults believe immigration enforcement in health care settings should be allowed or not. Results by total adults, party identification, and MAGA support.

Two-thirds (65%) of adults say they are concerned that immigration enforcement activities in or around health care facilities may discourage some people from seeking needed medical care, while a third (34%) say they are not concerned. There are large differences by party identification on this topic, with about nine in ten Democrats (91%) and about seven in ten (69%) independents saying they are concerned about this, including three-quarters (76%) of Democrats who say they are “very concerned.” In contrast, most (65%) Republican say they are not concerned about this, including four in ten (41%) who say they are “not at all concerned.” However, there are stark divides by MAGA support among Republicans, with a majority of MAGA Republicans (76%) saying they are not concerned and a majority of non-MAGA Republicans (58%) saying they are concerned. Since the rescission of the “sensitive areas” policy and ramp up of ICE activity across the country, there have been reports of immigrants avoiding seeking medical care, which can lead to negative and costly health outcomes. Even prior to the recent uptick in public enforcement activity in areas such as Minneapolis and other parts of the country, the 2025 KFF/New York Times Survey of Immigrants found that many immigrants said they were avoiding seeking medical care due to concerns about drawing attention to someone’s immigration status. As of Fall 2025, 14% of immigrants overall said they have avoided seeking medical care since January 2025, rising to nearly half (48%) of likely undocumented immigrants.

Stacked bar chart showing how concerned adults are about immigration enforcement in health care settings discouraging people from seeking medical care. Results by total adults, party identification, and MAGA support.

Methodology

This KFF Health Tracking Poll/KFF Tracking Poll on Health Information and Trust was designed and analyzed by public opinion researchers at KFF. The survey was conducted February 24 – March 2, 2026, online and by telephone among a nationally representative sample of 1,343 U.S. adults in English (n=1,268) and in Spanish (n=75). The sample includes 1,019 adults (n=62 in Spanish) reached through the SSRS Opinion Panel either online (n=995) or over the phone (n=24). The SSRS Opinion Panel is a nationally representative probability-based panel where panel members are recruited randomly in one of two ways: (a) Through invitations mailed to respondents randomly sampled from an Address-Based Sample (ABS) provided by Marketing Systems Groups (MSG) through the U.S. Postal Service’s Computerized Delivery Sequence (CDS); (b) from a dual-frame random digit dial (RDD) sample provided by MSG. For the online panel component, invitations were sent to panel members by email followed by up to three reminder emails.

Another 324 (n=13 in Spanish) adults were reached through random digit dial telephone sample of prepaid cell phone numbers obtained through MSG. Phone numbers used for the prepaid cell phone component were randomly generated from a cell phone sampling frame with disproportionate stratification aimed at reaching Hispanic and non-Hispanic Black respondents. Stratification was based on incidence of the race/ethnicity groups within each frame. Among this prepaid cell phone component, 142 were interviewed by phone and 182 were invited to the web survey via short message service (SMS).

Respondents in the prepaid cell phone sample who were interviewed by phone received a $15 incentive via a check received by mail or an electronic gift card incentive. Respondents in the prepaid cell phone sample reached via SMS received a $10 electronic gift card incentive. SSRS Opinion Panel respondents received a $5 electronic gift card incentive (some harder-to-reach groups received a $10 electronic gift card). In order to ensure data quality, cases were removed if they failed two or more quality checks: (1) attention check questions in the online version of the questionnaire, (2) had over 30% item non-response, or (3) had a length less than one quarter of the mean length by mode. Based on this criterion, 1 case was removed.

The combined cell phone and panel samples were weighted to match the sample’s demographics to the national U.S. adult population using data from the Census Bureau’s 2024 Current Population Survey (CPS), September 2023 Volunteering and Civic Life Supplement data from the CPS, and the 2025 KFF Benchmarking Survey with ABS and prepaid cell phone samples. The demographic variables included in weighting for the general population sample are gender, age, education, race/ethnicity, region, civic engagement, frequency of internet use and political party identification. The weights account for differences in the probability of selection for each sample type (prepaid cell phone and panel). This includes adjustment for the sample design and geographic stratification of the cell phone sample, within household probability of selection, and the design of the panel-recruitment procedure.

The margin of sampling error including the design effect for the full sample is plus or minus 3 percentage points. Numbers of respondents and margins of sampling error for key subgroups are shown in the table below. For results based on other subgroups, the margin of sampling error may be higher. Sample sizes and margins of sampling error for other subgroups are available on request. Sampling error is only one of many potential sources of error and there may be other unmeasured error in this or any other public opinion poll. KFF public opinion and survey research is a charter member of the Transparency Initiative of the American Association for Public Opinion Research.

GroupN (unweighted)M.O.S.E.
Total1,343± 3 percentage points
   
Party ID  
Democrats449± 6 percentage points
Independents449± 6 percentage points
Republicans373± 6 percentage points
   
MAGA Republicans/Republican leaning independents334± 6 percentage points
   
Used AI for health information or advice in the past year458± 6 percentage points
Used for physical health information407± 6 percentage points
Used for mental health information234± 8 percentage points

How Does U.S. Life Expectancy Compare to Other Countries?

Published: Mar 31, 2026

Life expectancy at birth in the U.S. increased 0.6 years from 78.4 years in 2023 to 79.0 years in 2024, its highest-ever level. However, the average life expectancy in comparable countries was 82.7 years, about 3.7 years longer than in the U.S., reflecting a persistently wide difference in life expectancy between the U.S. and comparable countries.

This chart collection examines how life expectancy in the U.S. compares to that of other similarly large and wealthy countries in the Organisation for Economic Co-operation and Development (OECD). The countries included in the comparison are Australia, Austria, Belgium, Canada, France, Germany, Japan, Netherlands, Sweden, Switzerland, and the United Kingdom.

The analysis is available through the Peterson-KFF Health System Tracker, an information hub dedicated to monitoring and assessing the performance of the U.S. health system.

Poll Finding

Public Opinion on Prescription Drugs and Their Prices

Published: Mar 31, 2026

Editorial Note: This data note was updated on March 31, 2026, to reflect updated poll findings.

Key Takeaways

This data note summarizes KFF polling on the U.S. public’s experiences with prescription drug costs, use of GLP-1 medications, and support for policy solutions. Key takeaways include:

  • Most U.S. adults take at least one prescription drug, and many struggle or worry about affording their prescription medications. Six in ten adults say they are worried about being able to afford their prescription drug costs, a new high since KFF began asking in 2018. Four in ten say they have had to take cost-saving measures, such as skipping doses, not filling prescriptions, or taking other measures due to costs.
  • Increasing use of GLP-1 medications raises particular cost concerns. About one in five adults have ever taken a GLP-1 medication, and most users – including those with health insurance – say these drugs are difficult to afford. KFF will continue to monitor the public’s experiences with GLP-1 medications as use, regulation, and new formulations – including oral versions – continue to evolve.
  • Large majorities across party lines want the government to do more to regulate drug prices, and many support a range of policies. At least two-thirds of Democrats, independents, and Republicans say there is not enough regulation of prescription drug prices. Most support a range of policies to address costs, such as two provisions of the 2022 Inflation Reduction Act (IRA): allowing Medicare to negotiate prices and limiting how much drug companies can increase the price of drugs based on annual inflation rates.
  • The Trump administration has taken several steps to try to lower prescription drug costs in its second term, but these initiatives have limited public visibility so far. Few adults have heard much about the administration’s drug pricing deals with manufacturers or TrumpRx, the federal website that provides discount coupons for certain drugs, launched in early 2026. KFF polling from 2019 found broad support for a related approach – lowering what Medicare pays for some drugs based on amounts in other countries – suggesting the idea has public appeal even if awareness of the current initiatives and the debates around them remain low.

The Public’s Experiences with and Views of Prescription Drugs

Prescription drugs touch the lives of most people in the U.S. in some way, and the public broadly recognizes their benefits. About two-thirds (66%) of adults say they are currently taking at least one prescription drug, and three in ten (31%) say they currently take four or more prescription medications. While many adults across age groups take prescription medications, older adults are much more likely to report taking 4 or more medications.

Six in ten adults ages 65 and older report taking four or more prescription medications, compared to fewer than half of younger adults.

Bar chart showing the percent who take any number of prescription medicine, 1 prescription medicine, 2 prescription medicines, 3 prescription medicines, or 4 or more prescription medicines.

The public generally sees the benefits of these medicines. About six in ten (63%) adults believe prescription drugs developed over the past 20 years have generally made the lives of people in the U.S. better, while much smaller shares (21%) say they’ve made them worse or have not made a difference (15%).

Six in Ten Say That Prescription Drugs Developed Over the Past 20 Years Have Made the Lives of People in the U.S. Better (Stacked Bars)

Despite seeing their general benefits to society, about eight in ten adults (82%) say the cost of prescription drugs is unreasonable, and the public sees profits made by pharmaceutical companies as the largest factor contributing to these prices. More than three-quarters of adults across partisanship say profits made by pharmaceutical companies are a “major factor” in the price of prescription drugs. This is followed by more than half who say the cost of research and development is a “major factor” contributing to the price, and 45% saying the same about the cost of marketing and advertising.

Split bar chart by total and party identification, showing the percent who say each of the following is a major factor contributing to the price of prescription drugs: profits made by pharmaceutical companies, the cost of research and development, and the cost of marketing and advertising.

Struggles Affording Prescription Drugs

Many Americans face significant challenges affording their medications, including adults who take more medications or have lower incomes. KFF polling shows these challenges have grown more acute over the years. While about two-thirds (65%) of adults overall say it is “very” or “somewhat” easy to afford their prescription drug costs, affordability is a bigger issue for those who are currently taking four or more prescription medicines. Nearly four in ten (37%) of those taking four or more prescription drugs say they have difficulty affording their prescriptions, compared with one in five (18%) adults who currently take three or fewer prescription medications. Adults with an annual household income of less than $40,000 are also more likely than adults with higher incomes to report difficulty affording their prescription medications.

Bar chart showing percent who say it is difficult to afford the cost of their prescription medicine, by total, number of medications taken, age, and household income.

Overall, about six in ten adults say they are worried about being able to afford prescription drug costs for themselves or their families (59%), including about one in five (22%) who are “very worried.” Worry varies by insurance status, household income, race, and ethnicity. Substantial shares of uninsured adults under age 65 (32%), Hispanic adults (30%), Black adults (26%), and adults in households with annual incomes less than $40,000 (27%) say they are “very worried” about affording their prescription drug costs.

Among adults who take four or more prescription medications, about two-thirds (64%) report worrying about affording their medications, including about three in ten (29%) who are “very worried.” However, worry is not limited to those who take at least four medications. Most adults who take fewer prescriptions (1 to 3) worry about being able to afford their medications (56%). Even among adults who do not currently take any prescriptions themselves, a majority (57%) are “very” or “somewhat worried” about affording prescription medications, perhaps reflecting concerns about future needs or the prescription drug costs of family members.

Notably, about one in five (19%) Medicare enrollees say they are “very worried” about affording their prescription drug costs. Although older adults are more likely to take more prescription medications than younger adults, the vast majority of Medicare beneficiaries are enrolled in Medicare Part D plans, giving them prescription drug coverage that has improved with recent policies in the Inflation Reduction Act of 2022.

About one in four (24%) Medicaid enrollees under age 65 say they are “very worried” about affording their prescription drug costs. Medicaid provides comprehensive access to prescription drugs for eligible adults, with out-of-pocket costs limited to nominal amounts, which helps adults avoid cost-related prescription medication rationing or delays. However, while prescription out-of-pocket costs in Medicaid are limited, even low amounts may still be prohibitive for low-income families with Medicaid.

Majorities Are Worried About Affording Prescription Drugs for Themselves or Their Family (Stacked Bars)

Since KFF first asked about worries affording prescription drug costs in 2018, the share of adults reporting worries has increased steadily, to a new high of six in ten (59%) in 2026.

Bar chart showing the share of adults who are very or somewhat worried about being able to afford prescription drugs from August 2018 to March 2026.

About four in ten (43%) adults report that they have not taken their medication as prescribed at some point in the past year because of the cost. This includes three in ten who have taken an over-the-counter drug instead (31%), a quarter who have not filled a prescription (27%), and about one in five (19%) who have cut pills in half or skipped doses of medicine because of the cost.

The share who reports not filling a prescription, taking an over-the-counter drug instead, or cutting pills in half or skipping doses increases to about half among adults with annual household incomes less than $40,000 (52%).

About Four in Ten Adults Say, in the Past Year, They Did Not Take Their Medicine as Prescribed Due to Costs (Split Bars)

GLP-1 Use and Affordability

In recent years, KFF has been tracking the public’s use and experiences with GLP-1 medications. These medications, such as semaglutide or tirzepatide, are used for weight loss or managing chronic health conditions. As GLP-1 medications have expanded beyond their original use for treating Type 2 diabetes, their popularity, combined with their high cost and need for long-term use, poses a potential cost burden on consumers, employers, and insurers. In response, some employers have restricted or dropped coverage for weight loss in 2026. Medicare Part D currently covers GLP-1 drugs only when prescribed to treat chronic illnesses such as diabetes and sleep apnea but prohibits the coverage for weight loss alone under federal law. Under the Medicaid Drug Rebate Program (MDRP), state Medicaid programs must cover GLP-1s for conditions like diabetes, but coverage for obesity is optional under federal law.

As of March 2026, KFF Health Tracking Polls show about one in five adults have ever taken a GLP-1 medication (18%), including 12% who currently take this class of medication (an increase of 6 percentage points from May 2024).

While most GLP-1 users get their medications from a primary care doctor and have them at least partially covered by insurance, a majority, including 55% of those who have health insurance, say it is difficult to afford these drugs. KFF will continue to monitor the public's experiences with GLP-1 medications as use, regulation, and new formulations – including oral versions – continue to evolve.

Stacked bar chart showing how easy or difficult paying for GLP-1 drugs is for adults who have ever used GLP-1 drugs.

Public Support for Drug Pricing Policies

There is broad, bipartisan agreement that there should be more government regulation when it comes to prescription drug costs. The March 2026 KFF Health Tracking Poll finds about seven in ten adults (72%) say there is “not as much regulation as there should be” when it comes to limiting the price of prescription drugs, including at least two-thirds of Democrats (77%), Republicans (68%), and independents (72%).

Notably, larger shares of adults now say there is not enough regulation than five years ago, though KFF has found bipartisan agreement on this attitude since 2015.

Split bar chart by total and party identification showing percent of adults who say that there is not as much regulation as there should be when it comes to making sure prescription drugs are safe for people to use and limiting the price of prescription drugs.

For decades, lawmakers have debated and passed drug pricing legislation. For example, in 2022 the Inflation Reduction Act, or IRA, included several provisions aimed at lowering prescription drug costs. The public largely supports many of these provisions, including limiting how much drug companies can increase the price of drugs based on annual inflation rates (88%) and allowing the federal government to negotiate with drug companies to get a lower price on medications for people with Medicare (85%).

KFF polling shows the public – across partisans – is also supportive of other policy proposals that have been debated but not been put into law, such as increasing taxes on drug companies that refuse to negotiate the price of their drugs with the government, allowing Americans to buy drugs imported from Canada, making it easier for generic drugs to come to market, and expanding the IRA’s annual out-of-pocket maximum and monthly cap on insulin prices beyond people with Medicare.

Bar chart showing percent who favor specific actions to keep prescription drug costs down.

It is also notable that bipartisan support for the IRA provisions has held since its passage, and majorities across partisan lines support expanding what the law currently does. KFF polling from 2024, during the Biden administration, showed that at least eight in ten (85%) U.S. adults supported authorizing the federal government to negotiate drug prices for people with Medicare as the IRA does. This provision was supported by 90% of Democrats, 87% of independents, and 79% of Republicans.

In 2024, majorities across partisanship also supported expanding two IRA provisions beyond those covered by Medicare. Three in four adults supported a proposal to expand the $35 cap on out-of-pocket costs for insulin beyond those with Medicare, including majorities of Democrats (82%), independents (78%), and Republicans (67%). About two-thirds supported a proposal to expand the $2,000 annual limit on out-of-pocket prescription drug costs beyond those with Medicare, including 78% of Democrats, 69% of independents, and 57% of Republicans.

Bar chart showing shares of total voters, democratic voters, Independent voters, and Republican voters who say they support proposals to expand IRA provisions beyond those with Medicare.

Trump Administration Policy Actions on Prescription Drug Prices, TrumpRx and Direct Purchasing Options

President Trump first pushed to lower prescription drug costs in the U.S. to match prices in other developed nations, during his first term in 2018, an approach that later became formally known as “most-favored-nation” (MFN) pricing. While this was not put into effect during Trump’s first term, KFF polling from 2019 found broad public support for the approach, with about two-thirds (65%) of adults supporting lowering what Medicare pays for some drugs based on amounts in other countries where governments more closely control prices. This includes most Democrats (74%), independents (62%), and Republicans (54%).

Bar chart showing shares of total voters, democratic voters, Independent voters, and Republican voters who say they support proposals to expand IRA provisions beyond those with Medicare.

In the Trump administration’s second term, there have been more efforts to reduce the cost of prescription drugs. Though the details of the deals are confidential and not available to the public, the administration announced several prescription drug pricing deals with drugmakers related to what they charge state Medicaid programs for some of their drugs, and a subsequent deal with a maker of in vitro fertilization (IVF) drugs aimed at lowering the cost of these treatments. As of November 2025, awareness of these deals was limited, with three in ten adults saying they had heard a lot (6%) or some (25%) about them. Later in 2025, the president announced further developments in the MFN pricing, including deals to sell certain products directly to consumers at discounted rates.

In February 2026, amid the Trump administration's focus on lowering prescription drug costs, the administration officially launched TrumpRx, the federal government-run website where people can get discounts to buy prescription drugs directly from some manufacturers or pharmacies, without using their health insurance. As of early March 2026, few U.S. adults overall, including those who take prescription drugs, have heard much about or visited the website.

While few prescription drug users (7%) say they have visited the TrumpRx site to shop for or compare prescription prices in the month following the TrumpRx launch, this rises to about one in six (16%) among those who currently take or have ever taken a GLP-1 medication for weight loss or certain chronic conditions. The TrumpRx website features at least four major GLP-1 medications among its initial 43 listed drugs.

Split bar chart showing shares of adults who say they have heard about TrumpRx and share who say they have visited the TrumpRx website. Results shown by adults who take prescription drugs and GLP-1 use.

Prior to the launch of TrumpRx, drug discounts have been available through third-party platforms and directly from drug manufacturers. About four in ten adults who take prescription drugs say that in the past year, they have used a discount card or coupon to reduce their prescription drug costs (42%) or compared prescription drug prices online to find the lowest cost option (39%). Fewer say they have purchased a lower-cost drug from an online pharmacy without their insurance (15%) or directly from a drug manufacturer’s website (8%). 

Bar chart showing shares of adults who currently take prescription drugs and who say they have not taken their medication as prescribed because of the costs.

U.S. Global Health Country-Level Funding Tracker

Published: Mar 27, 2026

This tracker provides U.S. global health funding data by program area and country. It includes Congressionally appropriated (planned) funding amounts from FY 2006 – FY 2023, as well as obligations and disbursements from FY 2006 – FY 2025 (FY 2025 data are partially reported). Data were obtained from ForeignAssistance.gov (see About This Tracker below for more details). For examples of analyses that can be done using this tracker, please expand the section below.

Tracker

About This Tracker

The U.S. is the largest donor to global health in the world, providing bilateral (direct country-to-country) support for U.S. global health programs in over 75 countries in FY 2023 (through appropriated/planned funding), with additional countries reached through U.S. regional efforts and U.S. contributions to multilateral organizations. This tracker provides historical data on bilateral U.S. government funding for global health by country, region, and income-level. It presents data on country-specific global health funding channeled through the Department of State (State) and U.S. Agency for International Development (USAID); these agencies account for approximately 85% of all U.S. funding for global health. Funding channeled through other agencies – the National Institutes of Health (NIH), Centers for Disease Control and Prevention (CDC), and Department of Defense (DoD) – is not included, as these data are not available at the country-level. Funding directed to “regional” or “worldwide” programs, which may reach additional countries, is also not included. See our companion resource, KFF U.S. Global Health Budget Tracker, to view data on U.S. funding for global health overall, including funding channeled through these other agencies. Data in this tracker present three transaction types:

  1. Appropriated: funding amounts based on Congressional appropriations for a given fiscal year which may be obligated and disbursed over a multi-year period;
  2. Obligations: binding agreements that will result in disbursements (or outlays), immediately or in the future, and
  3. Disbursements: actual paid amounts (an outlay of funds) to a recipient in a given year.

These amounts will be updated as new data become available. Queried data can be downloaded using the button within the interactive, and the full data can be downloaded here. For questions related to this resource, or for inquiries on further analyses on U.S. global health funding, please contact globalhealthbudget@kff.org.

Sources

KFF analysis of data from the U.S. Foreign Assistance Dashboard, U.S. State Department regional classifications, and World Bank income classifications.

One or Two Health Systems Controlled the Entire Market for Inpatient Hospital Care in Nearly Half of Metropolitan Areas in 2024

Authors: Jamie Godwin, Zachary Levinson, and Tricia Neuman
Published: Mar 27, 2026

Editorial Note: This brief updates a previous analysis with more recent data, an evaluation of increases in concentration over time, and minor adjustments to the Methods.

National health spending totaled $5.3 trillion in 2024—18% of gross domestic product (GDP)—and is projected to grow faster than GDP through 2033, contributing to higher costs for families, employers, states, and the federal government. As policymakers consider a variety of strategies to make health care more affordable, they have been increasingly attentive to the effects of consolidation in health care markets and the potential implications for cost and quality of care. Hospital consolidation has been a subject of particular focus in part because spending on hospital care is the largest source of spending on health. Hospital care has also contributed more than other categories to the growth in national health spending over time, including from 2022 to 2024, when it accounted for 40% of spending growth. Consolidation may allow providers to operate more efficiently and help struggling providers keep their doors open in underserved areas, but it often reduces competition. A substantial body of evidence has found that consolidation can contribute to higher prices, with unclear effects on quality.

This analysis examines the competitiveness of markets for hospital care, based on RAND Hospital Data—a cleaned and processed version of cost reports from Medicare-certified hospitals—and American Hospital Association (AHA) survey data. The analysis examines competition among independent hospitals and health systems, referring to both as “health systems” throughout for brevity. Competition is measured in three ways: the share of metropolitan statistical areas (MSAs) controlled by a small number of health systems, the level of market concentration in MSAs based on the Herfindahl-Hirschman Index (HHI), and the share of hospitals affiliated with health systems over time. Using hospital data from 2024 (the most recent year available), this analysis focuses on general short-term or general medical and surgical hospitals depending on the dataset and excludes federal hospitals (see Methods for more details).

Key Takeaways

  • One or two health systems controlled the entire market for inpatient hospital care in nearly half (47%) of metropolitan areas in 2024.
  • In more than four of five metropolitan areas (83%), one or two health systems controlled more than 75 percent of the market.
  • Nearly all (97% of) metropolitan areas had highly concentrated markets for inpatient hospital care when applying HHI thresholds from antitrust guidelines to MSAs.
  • Most hospital markets in metropolitan areas (80%) became less competitive from 2015 to 2024 or were controlled by one health system over that entire period.

One or Two Health Systems Controlled the Entire Market for Inpatient Hospital Care in Nearly Half (47%) of Metropolitan Areas in 2024

Nearly one in five (19%) metropolitan statistical areas (MSAs) were controlled by a single health system, and more than one in four (27%) markets were controlled by two systems in 2024 (see Figure 1). In more than four of five metropolitan areas (83%), one or two health systems controlled more than 75 percent of the market. These markets all met the definition of highly concentrated markets based on thresholds in current antitrust guidelines (see below). One health system controlled at least half of the market in about three out of four MSAs (76%) and at least a quarter of the market in nearly every MSA (98%).

One or Two Health Systems Controlled the Entire Market for Inpatient Hospital Care in Nearly Half of Metropolitan Areas in 2024 (Small multiple donut chart)

The number of health systems in a given MSA tends to increase with the population of the region. For example, in 79% of MSAs with a population of less than 200,000, one or two health systems controlled the entire market for inpatient hospital care in 2024, as in the Muncie, IN; Napa, CA; and Amherst Town-Northampton, MA MSAs (Figure 2). MSAs with one or two health systems account for nearly half (47%) of all MSAs but 12% of the U.S. population living in metropolitan areas.

Conversely, virtually all (54 of 55) MSAs with a population of at least one million people had at least four health systems, as in the MSAs encompassing Detroit, Miami, and Phoenix. MSAs with four or more health systems accounted for 35% of all MSAs but 79% of the U.S. population living in metropolitan areas.

However, in fourteen of these relatively large MSAs with four or more health systems, the two largest health systems controlled at least 75% of the market, and in 44 of these areas, they controlled at least 50% of the market. For example, in the MSA encompassing Austin, TX, with 2.6 million residents, two systems (HCA Healthcare and Ascension Healthcare) controlled 89% of the inpatient hospital care market, though Austin is home to more than four health systems. The metropolitan area encompassing Portland, OR, with 2.5 million residents and more than four health systems, is a less concentrated market than Austin’s, but the two largest systems (Legacy Health and Providence) still control a combined 62% of the market. (See Methods for discussion about MSAs as geographic hospital markets).

Hospital Market Competitiveness Varied Across US Metropolitan Areas in 2024 (Symbol map)

Nearly All (97% of) Metropolitan Areas Had Highly Concentrated Markets for Inpatient Hospital Care in 2024 Based on Thresholds Used in Current Antitrust Guidelines

Another way to assess market competitiveness is to evaluate a measure of concentration known as the Herfindahl-Hirschman Index (HHI), which is based on the number of participants in a market and their respective shares. The measure runs from 0 (perfectly competitive) to 10,000 (monopoly market). Based on current merger guidelines from the Federal Trade Commission (FTC) and Department of Justice (DOJ), markets can be grouped into three categories: not concentrated (HHI < 1,000), moderately concentrated (1,000 – 1,800), and highly concentrated (HHI > 1,800). This analysis calculates HHIs for MSAs and groups these regions accordingly, though there are other ways of defining the boundaries of hospital markets (see Methods).

Nearly all (97% of) MSAs had highly concentrated markets for inpatient hospital care in 2024 based on thresholds used in current merger guidelines (Figure 3). These guidelines reflect updates in 2023 that lowered the HHI thresholds for moderately concentrated and highly concentrated markets. Based on the thresholds used in prior guidelines, a large majority but somewhat smaller share (93%) of MSAs were highly concentrated markets for inpatient hospital care in 2024, closer to an estimate from an earlier study (90%) that used data from 2016.

As was the case when looking at counts of health systems in MSAs, larger metropolitan areas tended to be less concentrated and more competitive than less populated metropolitan areas, although this was not always the case. All 10 MSAs that were identified as either not concentrated or moderately concentrated had more than one million residents, such as the MSAs encompassing Cincinnati, Los Angeles, and Miami. However, 45 MSAs with more than one million residents—including the MSAs encompassing Houston, Denver, and Atlanta—had highly concentrated hospital markets. Overall, 72% of people living in metropolitan areas lived in highly concentrated hospital markets.

Nearly All (97% of) Metropolitan Areas Had Highly Concentrated Markets for Inpatient Hospital Care in 2024 Based on Thresholds Used in Current Antitrust Guidelines (Donut Chart)

The Share of Hospitals Affiliated With Health Systems Increased From 56% in 2010 to 69% in 2024, With the Share Growing in Both Rural and Urban Areas

More than two thirds of hospitals (69%) are now part of a larger system, an increase from 56% in 2010 (Figure 4). A smaller share of rural than urban hospitals were part of a health system in 2024 (53% versus 80%), though shares have increased over time for both rural and urban regions: from 43% in 2010 to 53% in 2024 among rural hospitals and from 66% in 2010 to 80% in 2024 among urban hospitals.

Most system-affiliated hospitals in 2024 (52%) were part of a system with at least 15 hospitals, and 19% were in a system with at least 50 hospitals. Systems with at least 100 hospitals accounted for 10% of system-affiliated hospitals.

Hospitals joining larger systems may not always reduce local market competition, for example, if an independent hospital is acquired by a larger system that does not own facilities in the same market. However, mergers between hospitals that operate in different geographic markets for patient care—also known as “cross-market” mergers—may nonetheless lead to higher prices in some cases.

The Share of Hospitals Affiliated With Health Systems Increased From 56% in 2010 to 69% in 2024, With the Share Growing in Both Rural and Urban Areas (Line chart)

Most Hospital Markets in Metropolitan Areas (80%) Became More Concentrated From 2015 to 2024 or Were Controlled by One Health System Over That Entire Period

Four out of five metropolitan areas (80%) experienced an increase in hospital market concentration between 2015 and 2024 (Figure 5) or were controlled by a single hospital or health system for the duration. About two thirds of MSAs (65%) saw an increase in market concentration over this period, as measured by HHI, and the share of MSAs that were highly concentrated increased by two percentage points, from 95% to 97%. Fifteen percent of metropolitan areas were controlled by a single health system in both 2015 and 2024, meaning that concentration could not increase further in these markets. Concentration declined in only 20% of markets. In some cases, increases or decreases in concentration were very small.

Most Hospital Markets in Metropolitan Areas (80%) Became More Concentrated From 2015 to 2024 or Were Controlled by One Health System Over That Entire Period (Donut Chart)

The trend toward greater concentration was widespread across metropolitan areas of different sizes and regions. Among the 65% of MSAs that experienced increased concentration, the average HHI increased from 4,545 to 5,273, a 728 point increase. In markets that are not already controlled by one hospital or health system, market concentration may rise as a result of continued consolidation through mergers and acquisitions (Figure 4), shifts in hospital stays towards larger hospitals and health systems and away from smaller competitors, or hospital closures that reduce the number of competitors in a given market.

This work was supported in part by Arnold Ventures. KFF maintains full editorial control over all of its policy analysis, polling, and journalism activities.

Methods

Analyses of market shares and HHI (e.g., every figure except for Figure 4) were based in part on RAND Hospital Data. RAND Hospital Data are a cleaned and processed version of annual cost reports that Medicare-certified hospitals are required to submit to the federal government. Although limited to Medicare-certified hospitals, in 2024, the analysis of RAND data included the vast majority (98%) of non-federal general medical and surgical hospitals in US metropolitan areas included in the analysis of system affiliation based on the AHA Annual Survey Database (see below). Cost reports were assigned to years based on the end of the reporting period and were scaled up or down to reflect a 365-day period, as necessary. In cases where a hospital had multiple cost reports assigned to the same analysis year, the cost report covering the longer reporting period was retained. When cost reports were longer than 365 days and fully spanned a calendar year (such as one beginning 1/1/2022 and ending 7/31/2023), the cost report was assigned to both the year spanned in full (2022) and the year in which it ended (2023).

Analyses of market shares and HHI were restricted to non-federal, general short-term hospitals as identified in the RAND Hospital Data. Some general short-term hospitals in the analysis were identified as other hospital types, such as surgical hospitals, in the AHA data (6% of those that could be matched), though these represented a small share of discharges (1%). Market shares were calculated as the share of inpatient discharges in an MSA that occurred within a given health system or independent hospital. One percent of hospitals that met the other sample restrictions had missing values for inpatient discharges and were excluded. Hospitals were grouped into health systems, as applicable, based primarily on the hospital’s system affiliation in the AHA Annual Survey Database. A previous version of this analysis relied on the AHRQ Compendium of US Health Systems, but that file has not been updated to include 2024 information.

For 2024 analyses, in the small number of cases where a cost report could not be matched to the AHA Annual Survey database (2% of observations), the 2023 AHRQ Compendium was used to identify the hospital's corresponding AHA system identifier, where available. Twelve hospitals could not be matched to AHA or AHRQ records, of which 7 were manually assigned system affiliations based on internet searches. System affiliations for 40 hospitals (2% of the sample) were updated using the 2023 AHRQ Compendium when confirmed by internet searches in cases where: (1) the Compendium identified at least two hospitals in an MSA as being part of a Compendium health system that did not correspond to an AHA system and (2) at least one of those hospitals was identified as independent in the AHA data. In 3 instances (covering 11 hospitals), two AHA systems were combined into one when indicated by the AHRQ Compendium and confirmed through internet searches.

Analyses of changes in system affiliation and market structure over time (Figures 4 and 5) relied only on AHA system identifiers. When cost reports did not match to AHA data in the Figure 5 analysis, those hospitals were treated as independent.

MSAs reflect 2023 geographic definitions from the Census Bureau delineated based on data from the 2020 decennial census. HHIs were calculated as the sum of squared market shares for all health systems in a given MSA (e.g., an MSA divided evenly between two systems would have an HHI of 502 + 502 = 5,000). MSA population estimates for 2024 were obtained from the Census Bureau.

MSAs were used as a proxy for hospital markets, which is one approach used by other studies summarizing hospital market competition across the country. There are other ways of defining markets that would yield different results when calculating the level of competition. For example, one report also evaluated MSAs but focused on where residents received their care, including at hospitals outside of a given MSA. As another example, some have defined markets based on a radius around the hospital defined by distance or estimated travel time. More precise market definitions, such as those used to define competition in antitrust cases, were not feasible. This study did not exclude MSAs with populations of at least three million as some others have done, because the analysis sought to describe competition across all metropolitan areas.

The analysis of the share of hospitals affiliated with systems was based on the AHA Annual Survey Database alone. This analysis was restricted to nonfederal, general medical and surgical hospitals. Urban hospitals were defined as those operating in a metropolitan area, while rural hospitals were defined as those operating in nonmetropolitan areas. Metropolitan and nonmetropolitan designations were identified using Urban Influence Codes (UIC) data.

LGBT People Experience Widespread Concerns and Challenges When it Comes to Health Care Affordability

Published: Mar 26, 2026

Introduction

Costs associated with health care and other household expenses weigh heavily on LGBT adults and health care affordability is poised to be a significant issue for all voters as we approach the 2026 midterm elections. This data note highlights the health care affordability challenges facing LGBT adults, a growing population that faces health related disparities, including related to both mental and physical health. At the same time, LGBT adults are a lower income group compared to non-LGBT adults. Findings from KFF Health Tracking Polls show that LGBT adults face more widespread concerns with affording basic necessities, including health care, compared to non-LGBT adults.

Findings

LGBT people, like the public overall, worry about the economy, with eight in ten (83%) LGBT adults saying their cost of living has increased in the past year, including more than half (58%) who say it has increased “a lot.” These are similar to the concerns among non-LGBT adults, 82% of whom say their cost of living has increased, including half who say it has increased “a lot”. Very small shares of both groups say their cost of living has “decreased” (4% of LGBT and 5% of non-LGBT adults). About one in ten LGBT and non-LGBT adults say their living expenses have remained stable over the past year (13% and 12%, respectively).

About Eight in Ten LGBT Adults Say Their Cost of Living Has Increased in the Past Year, Similar to Non-LGBT Adults (Stacked Bars)

Large majorities of both LGBT adults and non-LGBT adults worry about being able to afford health care for themselves and their family, with health care topping the list of economic worries for non-LGBT adults. However, LGBT adults have broader and more pronounced concerns related to affording basic necessities across multiple categories. Three-quarters of LGBT adults (76%) say they worry about paying for health care, including the cost of health insurance and out-of-pocket costs for things like office visits and prescription drugs. This ranks similarly to their financial worries related to other household expenses like food and groceries (also 76%), rent or mortgage (74%), and monthly utilities (71%). In each case, these concerns are more widespread than those of non-LGBT adults, likely reflecting LGBT adults’ lower incomes. Cost-concerns related to gas and transportation were somewhat lower for LGBT adults (67%) compared to other household expenses but still outpaced worries among non-LGBT adults (51%). However, the survey was conducted prior to the recent rise in gas prices in the wake of the Iran war.

Large Shares of LGBT Adults Worry About Affording Basic Necessities, Including Health Care, With Concerns More Common Than Among Non-LGBT Adults (Bar Chart)

When asked specifically about prescription medication costs, nearly two-thirds of LGBT adults (64%) say that they are worried about being able to afford prescription drug costs for themselves and their family, similar to the share of non-LGBT adults (58%). However, LGBT adults are more likely to say they are “very worried” about these costs than non-LGBT adults (36% v. 20%).

Nearly Two-thirds of LGBT Adults Worry About Affording Prescription Medications (Stacked Bars)

In addition to reporting worries related to health care affordability, LGBT adults commonly report facing difficulty with these expenses in their day-to-day lives. Four in ten LGBT adults (43%) report problems paying for health care, and a similar share (39%) say they had problems affording prescription drugs in the past year. In both cases LGBT adults report experiencing these difficulties at higher rates than non-LGBT adults.

LGBT Adults Commonly Face Difficulty Paying for Health Care and Prescription Drugs (Bar Chart)

VOLUME 43

New KFF Tracking Poll on Health Information and Trust Finds One in Three Adults Have Used AI Chatbots for Health Advice


Highlights

KFF’s latest Tracking Poll on Health Information and Trust finds that one-third of the public report using AI chatbots for health information and advice in the past year, similar to the share who have relied on social media for health. One in five adults who use AI for health cite difficulties accessing or affording health care as reasons they turned to these chatbots, including larger shares of younger and lower income users. These findings, as well as data from dozens of past KFF polls, are also available on KFF’s Health Information and Trust Polling dashboard.

And a federal judge suspended, for now, the appointments of thirteen members of the Advisory Committee on Immunization Practices (ACIP), the federal committee responsible for recommending vaccines to Americans, halting a scheduled meeting and staying recent changes to the childhood vaccine schedule. The ruling comes as KFF polling finds that fewer than half of U.S. adults express confidence in federal agencies to make recommendations about the childhood vaccine schedule, with more adults saying recent changes will have a negative rather than positive impact on children’s health.


KFF Poll Finds One in Three Adults Have Used AI for Health Information and Advice in the Past Year, With Younger Users More Likely to Cite Difficulty Accessing or Affording Health Care as a Reason They Turned to AI

Amid the AI technology boom, KFF’s latest Tracking Poll on Health Information and Trust finds that one-third (32%) of the public says they used AI for health information and advice in the past year – rivaling the share who have sought health information from social media in the past year (29%), but less common than seeking health advice from doctors (80%) or internet search engines (68%), which may themselves include AI-generated summaries.

The share of adults who report using AI for health information in the past year includes three in ten (29%) who say they sought information or advice about their physical health and about one in six (16%) who sought information or advice about their mental health. Compared to older adults, larger shares of adults under age 30 (who are more likely to use AI in the first place) say they turned to AI for information or advice related to their physical health (36%) or mental health (28%). When it comes to use of AI for mental health advice, Black adults and Hispanic adults, as well as those who are uninsured, are more likely to say they have used the technology.

Split bar chart showing percent who say they have sought information or advice about physical or mental health from artificial intelligence tools in the past year. Results shown by total adults, age, race and ethnicity, and insurance coverage.

Public trust in AI for health information is relatively low, particularly for those who have not used these tools or chatbots for health advice. About eight in ten adults who have not used AI for health or mental health information say they trust these tools “not too much” or “not at all” to provide reliable information about health or mental health. Conversely, majorities of adults who have used AI for health or mental health information say they trust these chatbots “a great deal” or “a fair amount” to provide reliable information on health (69%) or mental health (62%), respectively. At the same time, there is some skepticism among users, with three in ten (31%) who use AI for physical health saying they don’t trust AI for reliable information on health, and nearly four in ten (38%) who use AI for mental health saying they don’t trust these tools to provide reliable mental health information.

Split bar chart showing trust in AI tools to provide reliable information about health and mental health respectively. Results shown by total adults and by use of AI for different types of health information.

What We're Watching

Court Ruling on Vaccine Schedule May Add to Confusion as Trust in Federal Recommendations Declines

A federal judge has blocked recent changes to the federal childhood vaccine schedule and suspended, for now, the appointments of some members of the advisory committee responsible for making vaccine recommendations. The lawsuit, brought by the American Academy of Pediatrics (AAP) and other medical organizations, argued that changes to the Advisory Committee on Immunization Practices’ (ACIP’s) membership and decision-making process undermined the committee’s credibility and departed from established standards. The AAP also alleged that the committee relied on what it called “spurious evidence” to make its recommendations and suggested that committee members and speakers made inaccurate or misleading claims prior to votes. The ruling does not assess the merits of the changes to vaccine recommendations, instead focusing on whether federal procedures for appointing committee members and developing recommendations were followed. The administration has indicated it is weighing its legal options, including a potential appeal, meaning the dispute could continue, but AAP’s president has framed the decision as a win for science that would bring clarity to vaccine recommendations. A KFF Quick Take provides additional detail on the ruling and what may come next.

For parents, patients, and providers, the ruling and ongoing dispute may deepen existing confusion about which vaccine guidance to trust. KFF’s January Tracking Poll on Health Information and Trust found that among adults who had heard about the recent changes to the childhood vaccine schedule (51% of all adults), twice as many said the changes would have a negative impact on children’s health (54%) as said they would have a positive impact (26%). As of early March, 29 states and Washington, D.C. had announced they would no longer fully follow the new CDC childhood vaccine schedule, creating a patchwork of vaccine guidance that varies by state.

What To Watch Out For: How will the ruling, future actions by the administration, and the growing divide between guidance from federal agencies and professional medical organizations affect vaccine-related narratives and public trust?

Polling Insights: KFF’s January Tracking Poll on Health Information and Trust, conducted shortly after changes to the federal vaccine schedule recommendations were announced, found that fewer than half of adults are confident in federal health agencies to make recommendations about childhood vaccines. Overall, just under half (44%) of adults said they have at least “some confidence” in federal health agencies to make recommendations about childhood vaccine schedules, including about half (51%) of Democrats and fewer than half of independents (45%) and Republicans (40%).

Stacked bar chart showing percent who say they have a lot, some, a little, or no confidence at all in the federal government health agencies to make recommendations about childhood vaccine schedules. Results shown by total adults, party ID, and support for the Make America Healthy Again movement.

Beyond making recommendations for childhood vaccines, fewer than half of the public expressed confidence in these agencies to ensure vaccine safety and effectiveness (46%), make decisions based on science (38%), or act independently (34%). Across partisanship, fewer than half of Democrats, independents, and Republicans are confident in these agencies to act independently or make decisions based on science.

Public Trust Higher in CDC, NIH, FDA Scientists Than Federal Health Agency Leadership

Two-thirds of Americans (67%) are confident that career scientists at federal health agencies, including the Centers for Disease Control and Prevention (CDC), National Institutes of Health (NIH), and Food and Drug Administration (FDA), are providing the public with trustworthy health information, compared to 43% who said the same of the leaders of those agencies, according to a new poll from the Annenberg Public Policy Center. This new poll gives additional context to KFF polling that has found declining public trust in agencies like the CDC and FDA since the beginning of the COVID-19 pandemic.

What To Watch Out For: The gap between trust in career scientists and trust in agency leadership may take on added significance as changes are made to the federal health workforce. The NIH, for example, has lost more than 20% of its workforce since the start of the Trump administration, according to federal data reported by KFF Health News. As thousands of career scientists leave, federal agencies may face additional challenges in maintaining capacity and public confidence.


More From KFF

About The Health Information and Trust Initiative: the Health Information and Trust Initiative is a KFF program aimed at tracking health misinformation in the U.S., analyzing its impact on the American people, and mobilizing media to address the problem. Our goal is to be of service to everyone working on health misinformation, strengthen efforts to counter misinformation, and build trust. 


View all KFF Monitors

The Monitor is a report from KFF’s Health Information and Trust initiative that focuses on recent developments in health information. It’s free and published twice a month.

Sign up to receive KFF Monitor
email updates


Support for the Health Information and Trust initiative is provided by the Robert Wood Johnson Foundation (RWJF). The views expressed do not necessarily reflect the views of RWJF and KFF maintains full editorial control over all of its policy analysis, polling, and journalism activities. The data shared in the Monitor is sourced through media monitoring research conducted by KFF.

Deaths and Health Care Issues in ICE Detention Centers Under the Second Trump Administration

Published: Mar 25, 2026

Introduction

As of March 18, 2026, Immigration and Customs Enforcement (ICE) reported that 46 people died while in their custody or detention facilities since the start of the second Trump administration in January 2025. The number of deaths of people in detention during 2025 exceeded the highest seen in over two decades, and deaths in 2026 are on track to meet or exceed that number. President Trump implemented immigration policy changes focused on increasing interior enforcement efforts to support mass deportation, which increased the number of immigrants detained by ICE to over 68,000 as of February 7, 2026, an increase of over 70% from the 39,000 immigrants held in detention at the end of the Biden administration in December 2024.

ICE is required to maintain certain basic health and safety standards in all detention facilities, which include an initial medical and mental health screening as well as comprehensive health services that include diagnoses and treatments, transfers to off-site medical care when necessary, and access to 24-hour emergency care. However, detention facilities have a history of inadequate compliance with health and safety standards, insufficient health care, shortages in health care staffing, and limited oversight, which may create health risks for those detained. The increased number of people in detention facilities and overcrowding of facilities may further increase health risks, particularly for communicable diseases like measles and people with complex medical conditions. This brief provides an overview of deaths in ICE custody and detention centers under the Trump administration based on KFF analysis of ICE detainee death reporting and news releases and reviews recent reports of health care issues in detention centers.

Deaths in ICE Custody and Detention

The number of deaths occurring among people in ICE custody or detention increased from 11 in 2024 and less than ten in earlier years to 33 in 2025 after the Trump administration took office (Figure 1). ICE is required to publish a news release with relevant details regarding custody deaths within two days, while full reports regarding custody deaths are published within 90 days of occurrence that may contain more details from investigations into the deaths. Six of the deaths that occurred between January 1, 2025 and March 18, 2026 were among people with no reported criminality or pending criminal charges. A total of 36 deaths occurred among people who spent three or fewer months in ICE detention, including those ICE transferred to a hospital for additional medical care. Thirty-eight (38) deaths occurred among people younger than age 65, and 21 were among those under age 45 (Figure 2). Twenty-two (22) deaths were among people from Mexico and Central America, while ten were among people from Asia.

Total Annual Deaths Under ICE Custody or Detention, January 2021-March 2026 (Column Chart)
Deaths in ICE Custody or Detention by Age, January 1, 2025-March 18, 2026 (Pie Chart)

A total of 32 deaths among people in ICE custody or detention between January 2025 and March 2026 were among people with existing medical conditions who appeared to experience worsening health complications contributing to their death, while the remaining share were reported as due to suicide or other causes (Figure 3). While ICE does not always report an official cause of death as determined by a medical examiner, they report the details of initial health screenings and medical history. The causes of death due to health complications and the initial severity of health conditions varied. For example, ICE detained a 68-year-old adult with reported mild blood pressure issues who experienced steadily worsening symptoms over the course of two months that led to his hospitalization and death. In contrast, a 55-year-old adult with severe physical and mental health issues was transferred one day after his arrest to a hospital, where he stayed until his death. ICE reported the remaining deaths as suicide (9) and other causes (5), such as a fatal traffic collision during arrest. ICE reporting may differ from independent assessments of deaths. For example, the El Paso County Medical Examiner’s Office in Texas ruled a death in January 2026 to be a homicide due to the actions of enforcement officers, while ICE reported it as a suicide.

ICE Reported Causes of Death for Deaths Occurring Under ICE Custody or Detention, January 1, 2025-March 18, 2026 (Pie Chart)

Reported Health Care Issues

The Trump administration’s mass deportation efforts led to a significant increase in immigrants held in detention centers, which can lead to overcrowding if deportations do not keep up with the pace of arrests as well as challenges to accessing health care due to limited capacity and resources. Moreover, ICE payments to contractors providing medical care in detention facilities lapsed after the Department of Veterans Affairs terminated a longstanding agreement to process medical reimbursement claims in October 2025, which may impact certain health care services as the new claims system may not be active until April 2026. Overcrowding as well as limited capacity and resources may also increase the risk of the spread of communicable diseases, such as measles. For example, media reports indicate that recent measles outbreaks in Arizona and Texas detention facilities may have been the result of overcrowding and delays in providing vaccinations. ICE also terminated the contract with a private company that operated the Texas detention facility in March 2026 according to a media report indicating that, despite having no prior experience, the company was selected to build and operate the largest ICE facility and that there were reports of inadequate health care.

Reports since January 2025 suggest ICE may not be maintaining health and safety standards for immigrants held in detention centers. ICE is responsible for oversight and management of health care in detention facilities, but it has a history of inadequate compliance with detention standards and provides little to no publicly available data on health care use, quality, and outcomes. A 2025 report based on an investigation launched by Democratic Senator Jon Ossoff of Georgia documented instances of lack of access to prescribed medications, mistreatment of pregnant women, malnutrition and dehydration, unsanitary conditions, sleep deprivation, and abuse in detention facilities. A report based on interviews with people held at an Arizona detention facility between July 2024 to November 2025 conducted by a nonprofit organization serving detainees found instances of medical and mental health care lapses, such as several month delays in necessary specialty treatment and people with serious mental illnesses never seeing a mental health provider. Other media reports indicate instances of lost medical treatments and prescriptions during transfers between detention facilities.

There have also been recent reports of health care issues for children and pregnant people held in detention under the Trump administration. A media report on a Texas facility, where over half of detainees during the first nine months of the Trump administration were children, identified problematic health care issues, including inadequate staffing of pediatricians and child psychologists. Additionally, although ICE policy limits the detention of pregnant, postpartum, and nursing individuals to “very limited circumstances,” ICE data shared in response to an inquiry from Democratic Senator Patty Murray of Washington showing that 121 were detained as of February 16, 2026. This stands in contrast to when most of these groups were released on parole according to the most recent publicly available ICE report on these groups from the first half of fiscal year 2024. A media report and interviews conducted by legal organizations in 2025 with pregnant, postpartum, and nursing individuals in ICE detention identified gaps in prenatal and postnatal care. Another media report based on interviews with pregnant individuals held in ICE detention between 2025 and 2026 identified reports of excessive bodily restraints, inadequate nutrition and prenatal care, delayed emergency care, and an instance where ICE attempted to deport an individual in a late-term and high-risk pregnancy.

Several legal challenges related to poor health care conditions and limited oversight have been brought against ICE, some of which resulted in court rulings requiring ICE to implement changes. In February 2026, a judge ruled that ICE was required to improve conditions in California detention facilities due to poor conditions, including by ensuring adequate health care staffing, access to medical specialists, and providing timely care and medications. ICE faces pending lawsuits alleging that they delayed providing cancer care medication for an extended period of time during transit between facilities between August and October 2025 and that they provided inadequate medical care in Illinois in October 2025. In March 2026, local officials in California filed lawsuit to gain access to ICE facilities and conduct public health inspections after being denied access, and Maryland filed a lawsuit to obtain records detailing conditions at an immigration detention facility in Baltimore after investigations revealed multiple issues, including denial of medical care. These lawsuits to increase oversight followed a previous court order for ICE to restore unannounced congressional oversight visits to DHS facilities. A court order also required the Trump administration to restore DHS oversight offices that investigated issues of neglect and mistreatment in the ICE facilities. Despite reversing their decision to close the offices, the administration faces additional legal challenges due to low staffing in the offices that may reduce their ability to investigate ICE facility health care issues. The outcomes of court orders may change due to appeals by the Trump administration.