Health and Health Care in the U.S.-Mexico Border Region

Published: Nov 21, 2022

Introduction

The four states (Arizona, California, New Mexico, and Texas) along the U.S.-Mexico border are home to over 78 million people of whom 8 million live in 44 counties that form the border area and border activity is at an all-time high.1 ,2 ,3  This year, there have been over two million encounters at the U.S.-Mexico border, which is 24% higher than the number of encounters last year. Although migrants and asylum seekers generally have short stays in border communities, this increased activity is leading to growing demands on border processing capacity and border communities that already face health and socioeconomic challenges and to some state governors busing migrants to other states.4 ,5 ,6 . Understanding of who lives in the region and their experiences, including their health and access to health care, may help inform efforts to address their needs.

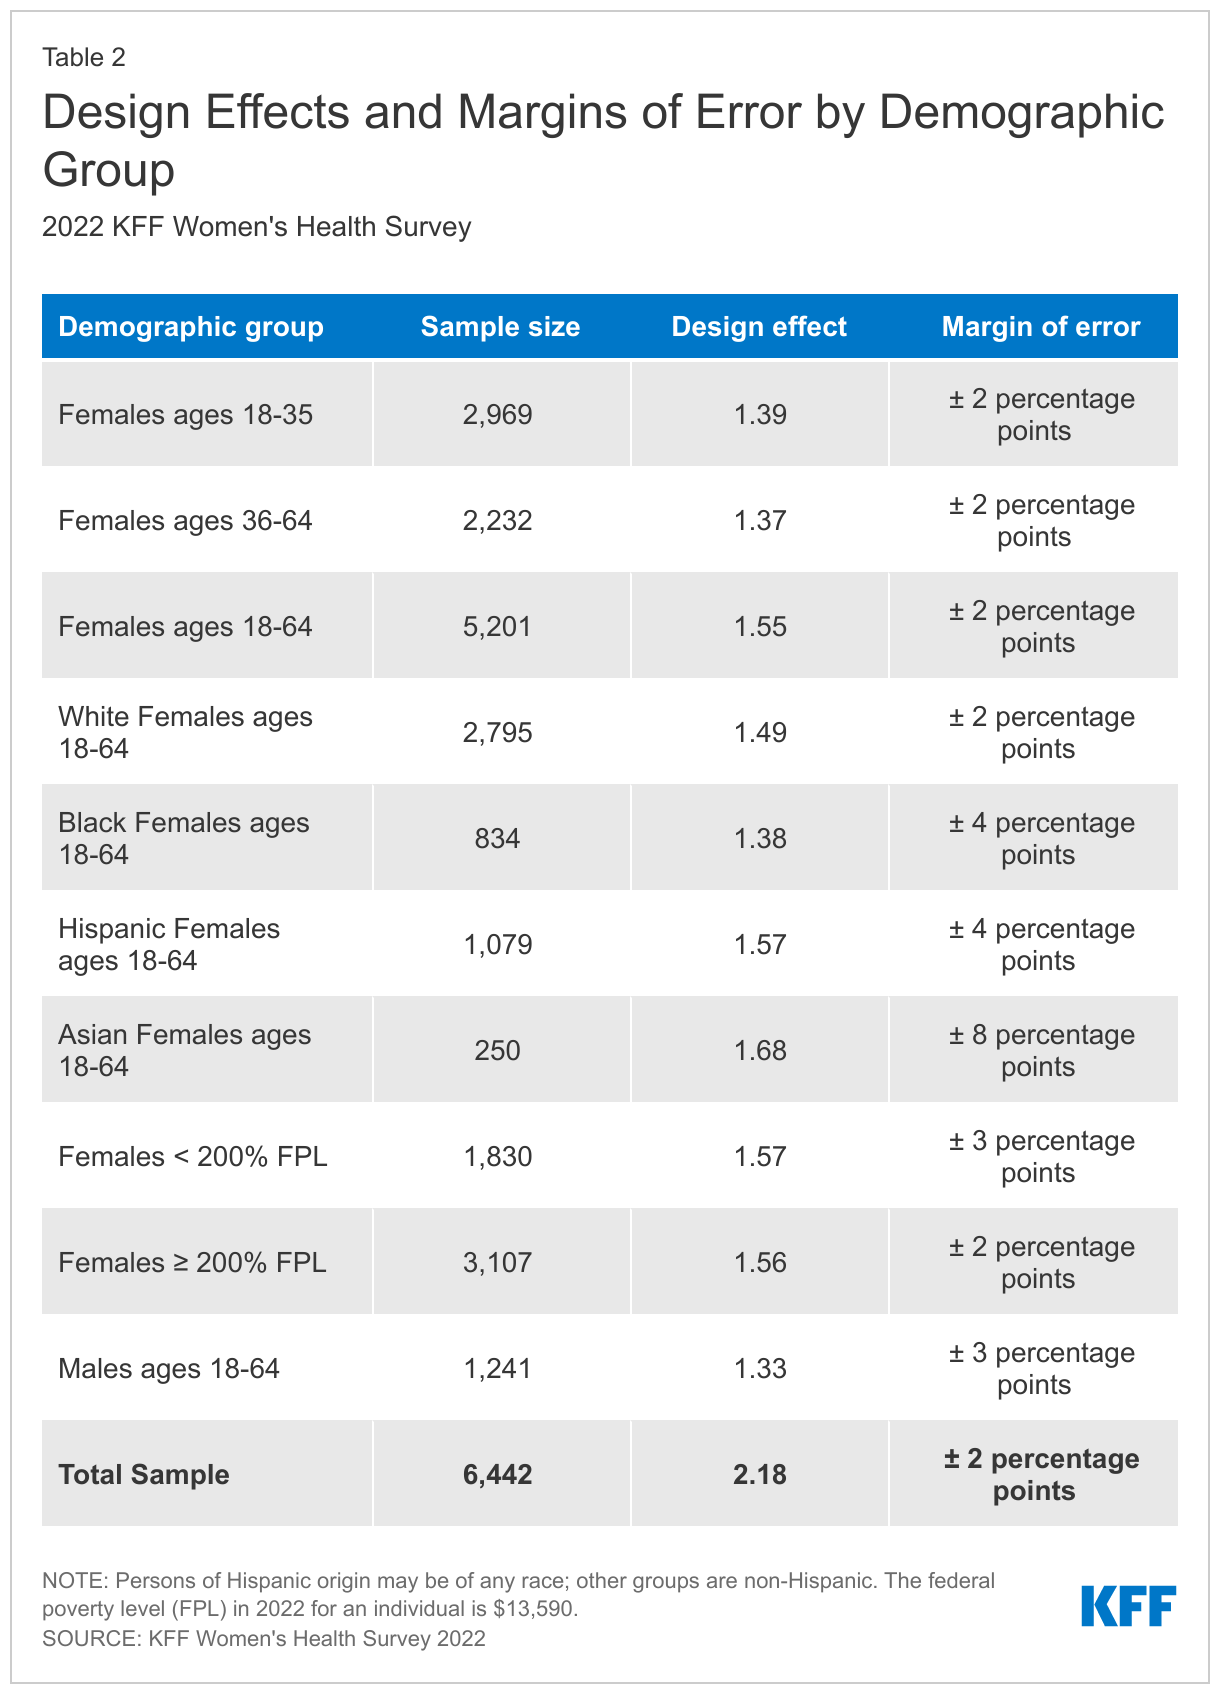
Overall, people living in the four border states generally are more likely to be Hispanic and noncitizen immigrants compared to those in other parts of the country. They also are generally more likely to be poor, and uninsured.7  This analysis further examines differences between and within border states in sociodemographic characteristics, health coverage and access to care, as well as health outcomes of people living there. It is based on KFF’s analysis of county-level data from the American Community Survey (ACS) five-year data tables, the Health Resources and Services Administration’s Area Health Resource Files (AHRF), the Centers for Disease Control and Prevention’s (CDC) WONDER database, and the Behavioral Risk Factors Surveillance System (BRFSS). Aside from 2020 mortality data from CDC, the most recent reliable available county-level data from these sources are from 2019. All differences described between border and non-border counties and between states in the text are statistically significant at the p<0.05 level. The data included in this brief are from the two years preceding the influx at the U.S.-Mexico border to provide context for the situation in the border region before the recent increase in immigration activity.

The findings show that, across many of the measures examined, Texas fared worse compared to the other border states. Moreover, within Texas, individuals in border counties faced increased challenges compared to those in non-border counties, with particularly low levels of educational attainment and income, higher shares of households with limited English proficiency (LEP) and no computer access, higher uninsured rates, and more limited access to providers. In the other border states, there are smaller differences in these measures between people living in border vs. non-border counties. In contrast to the other border states, Texas has not implemented the Affordable Care Act (ACA) Medicaid expansion to adults, contributing to lower rates of Medicaid coverage and higher uninsured rates compared with the other states, especially in border counties.

While immigration remains a contentious political issue, these findings highlight the potential benefits of providing resources and support to the border region to meet the needs of the growing number of migrants and asylum seekers in the area. Better preparedness, more job opportunities, and a greater allocation of resources to help migrants assimilate in the community may be helpful not only in improving socioeconomic and health outcomes and reducing disparities in border areas, but in improving the economy overall, particularly in these border communities.8  Policies that increase opportunities for newly arriving migrants to work, such as reducing the wait time for applying for work authorization, could also reduce overcrowding at migrant shelters.9  Although such policies could increase competition for jobs, research has found that immigrants and U.S.-born citizens in the low-skilled workforce usually fill different types of jobs as opposed to competing for the same types of jobs.10  A separate study found that immigrants in the U.S create more jobs than they take, thereby improving the economic outcomes for U.S.-born workers.11 

Funding to support organizations providing direct assistance to newly arriving migrants and asylum seekers, funding to support community health workers and Federally Qualified Health Centers in border areas, and funding to address social needs such as poverty and LEP may help improve outcomes in the border region.12  Moreover, implementation of the Medicaid expansion in Texas could help to increase overall coverage rates and provide increased financial resources to support health providers and the health care system.

What happens when migrants arrive at the U.S.-Mexico border?

Immigration activity at the border is at an all-time high, with over two million encounters in 2022, a number that is 24% higher than the year before. Historically, the U.S.-Mexico border was primarily used as an entry point by migrants from Mexico, Guatemala, Honduras, and El Salvador; however, migrants from other countries, including Venezuelans, Cubans, and Nicaraguans, accounted for 43% of border encounters in 2022, a 39 percentage point increase since 2017.13  Some migrants from European countries like Ukraine have also used the Southwestern border between the U.S. and Mexico to seek entry into the country following political turmoil.14 

U.S. Customs and Border Protection (CBP) screens and processes migrants and asylum seekers when they arrive at the border. Based on this screening, individuals may be returned to Mexico under Title 42 or other policies, detained, placed under expedited removal to return to their home country, or, if seeking asylum, released into the U.S. with a notice to appear in court or report for further processing.15 ,16 

A range of nonprofit organizations help support migrants and asylum-seekers in the border region. Individuals released from custody may seek to reunite with family and friends already living in the U.S., with many traveling on to other areas of the country outside of the border region. However, they typically have very limited or no resources available and often rely on nonprofit organizations for assistance, particularly when they first arrive in the country. While refugees are authorized to work immediately upon arrival to the U.S.,17  asylum seekers must wait at least 150 days after filing their asylum application to apply for employment authorization and are not eligible to receive employment authorization until at least 180 days post-asylum filing, limiting their opportunities to work.18  The U.S. Congress recently appropriated $150 million in funding through the Federal Emergency Management Agency to reimburse faith-based, nonprofit, and government organizations providing humanitarian assistance, such as food and housing, to migrants.

Who lives in the U.S.-Mexico border region?

Overall, there are 78 million people living in the four states (Arizona, California, New Mexico and Texas) along the U.S.-Mexico border. Within these four states, there are 44 counties that sit along the border that are home to over 8 million people. Most (32) of these counties are in Texas, while 6 are in New Mexico, 4 are in Arizona, and 2 are in California. These states also include 316 non-border counties, with Texas again accounting for the largest number of these counties (222).

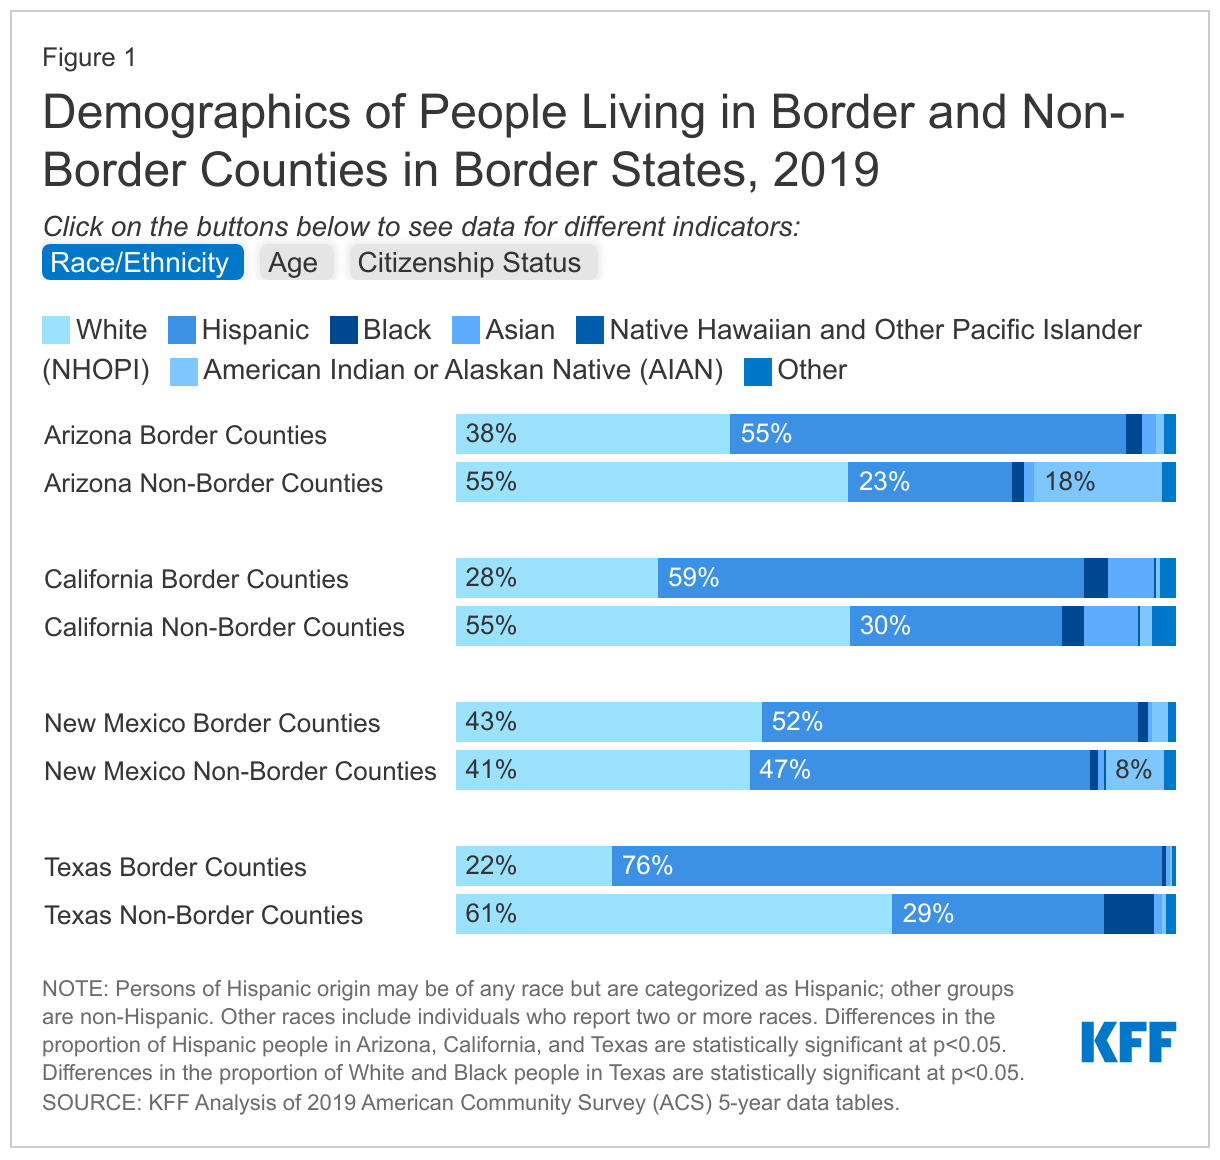
In Arizona, California, and Texas, border county residents are more likely to be Hispanic as compared with those in non-border counties (Figure 1). In Arizona, California, and New Mexico, over half of residents in border counties are Hispanic, while this share rises to over three-quarters (76%) in Texas. In contrast, Hispanic people make up less than a quarter of residents in non-border counties in Arizona (23%) and less than a third of non-border county residents in Texas (29%) and California (30%), while they account for closer to half of people in non-border counties in New Mexico (47%). The age distribution of people living in border and non-border counties is largely similar across all four states.

In Arizona and Texas, border counties include higher shares of noncitizens compared with non-border counties, but the vast majority of residents in both types of counties in all four states are U.S.-born citizens. In Arizona and Texas, roughly one in ten people in border counties is a noncitizen, which is higher than non-border counties. The share is slightly higher in California border counties (13%) and lower in New Mexico border counties (6%) with no statistically significant difference between border and non-border counties in these states. Across all four states, the large majority (over 80%) of residents in both border and non-border counties are U.S. citizens, with most being U.S.-born citizens.

Demographics of People Living in Border and Non-Border Counties in Border States, 2019

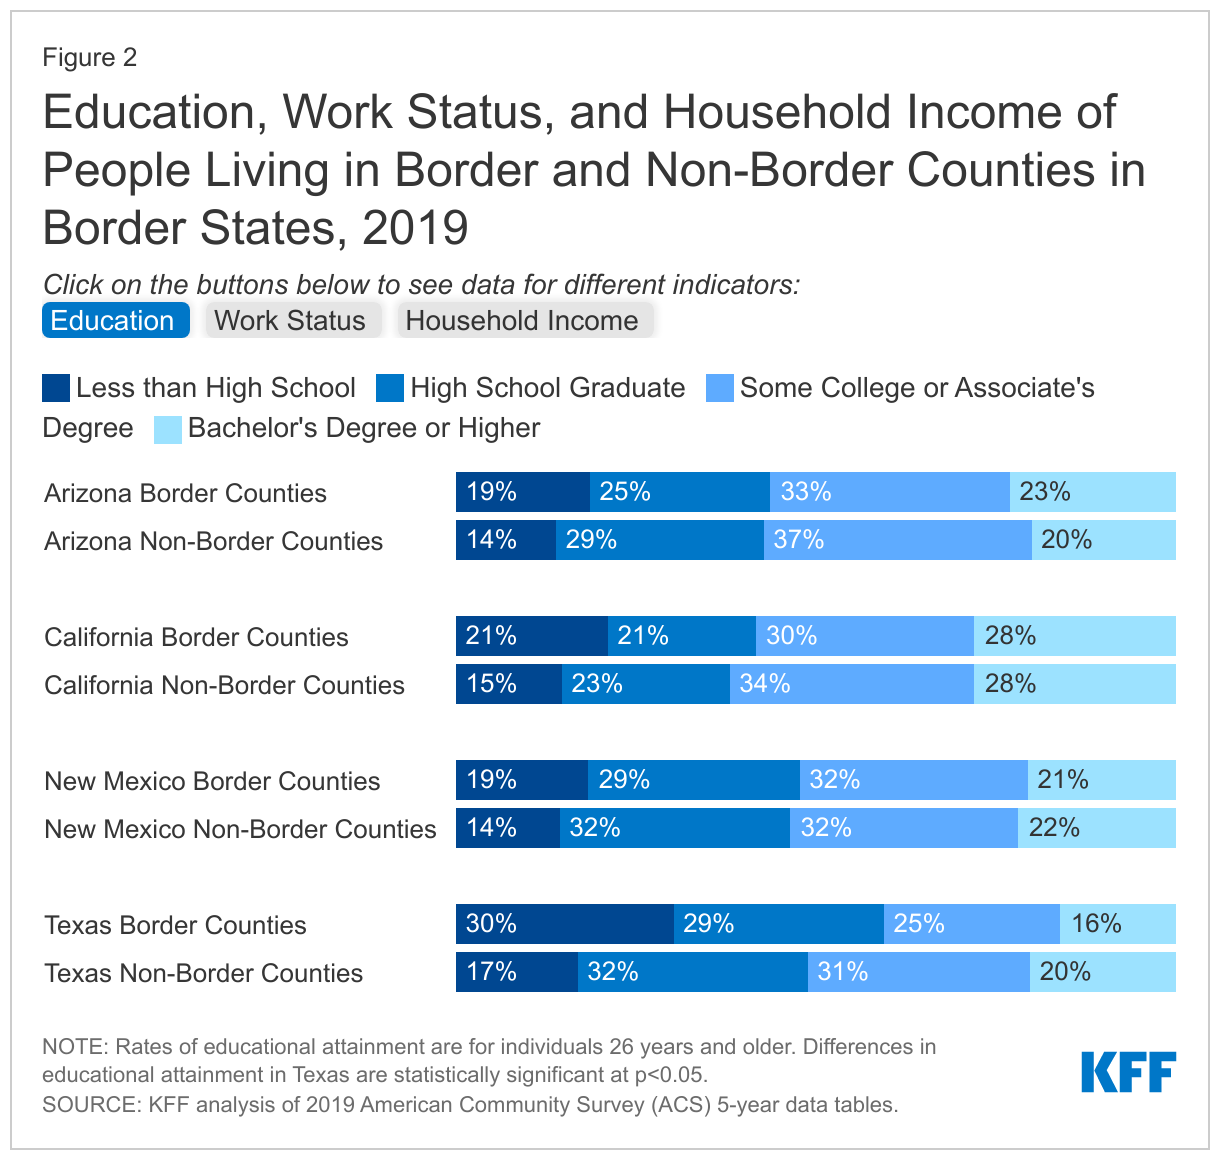
In Texas, border county residents have lower levels of educational attainment, full-time employment, and household incomes than their counterparts in non-border counties. (Figure 2). In Texas, the proportion of border county residents with less than a high school education is nearly twice as high as non-border county residents (30% vs. 17%). In contrast, the share of residents with less than a high school education is similar across border and non-border counties in the other three states. Regarding employment, the share of individuals living in border counties who are full-time workers is similar to the share in non-border counties in Arizona (48% vs. 45%), California (45% vs. 47%), and New Mexico (43% vs. 48%). However, the share of people in border counties who are full-time workers is lower than the share in non-border counties in Texas (49% vs. 55%), which has the highest share of full-time workers in non-border counties across the four states. Consistent with these findings, households in border counties in Texas are more likely than households in non-border counties to have incomes less than $25,000 (25% vs. 16%) and less likely to have incomes at or above $100,000 (18% vs. 28%). In contrast, the income distribution in Arizona, California, and New Mexico is similar between border and non-border counties. In California, over a third of residents in both border and non-border counties has household income of at least $100,000, which is higher compared to the other three states.

Education, Work Status, and Household Income of People Living in Border and Non-Border Counties in Border States, 2019

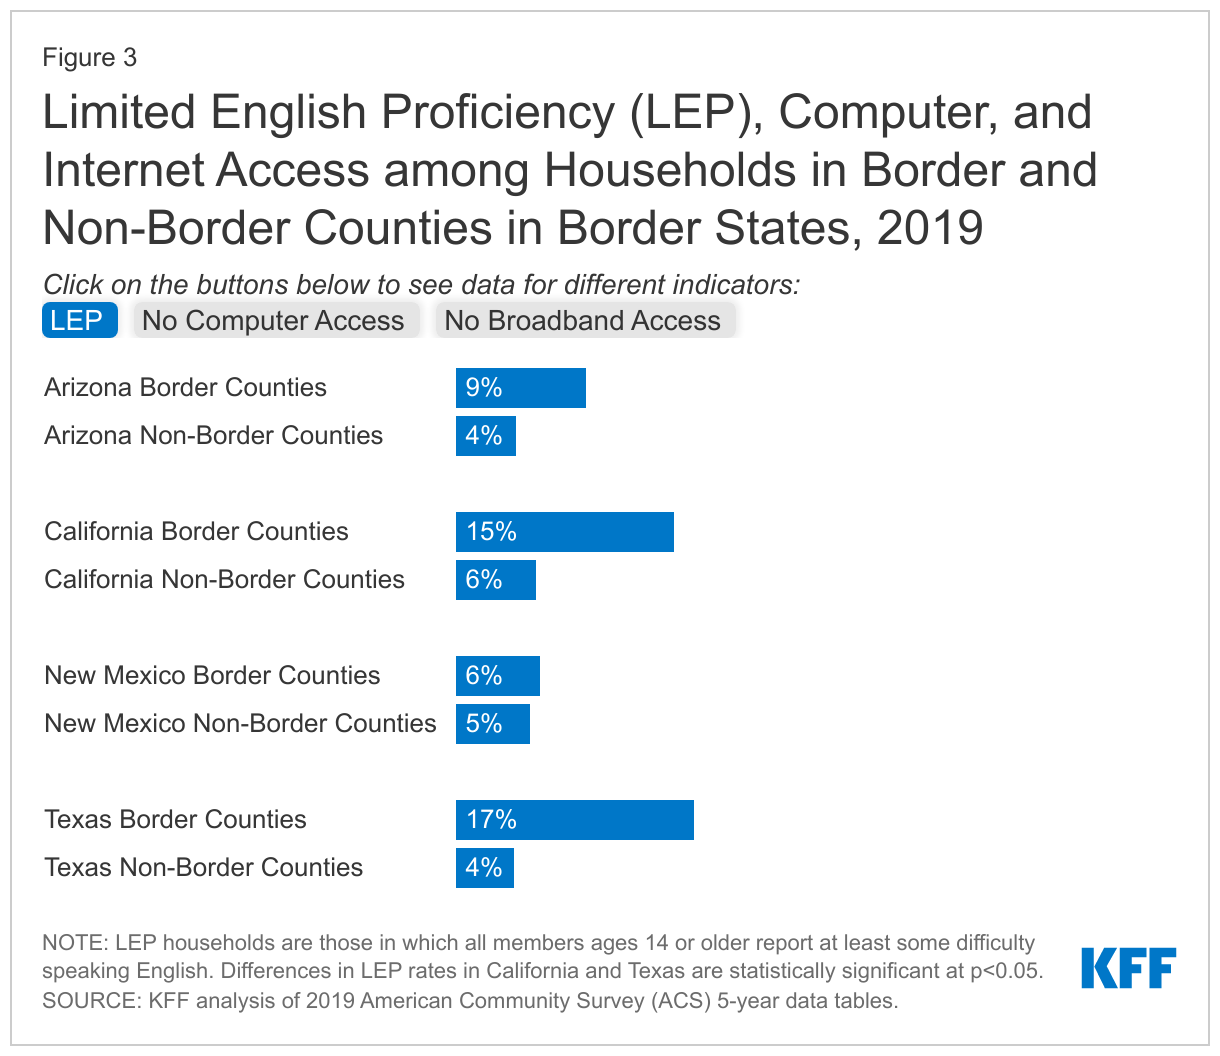
In California and Texas, households in border counties are more likely than those in non-border counties to face language barriers (Figure 3). Texas and California have the highest shares of households with limited English proficiency (LEP) in border counties (17% and 15%, respectively), which are over four and three times higher than the shares in their non-border counties (4% and 6%, respectively). In Arizona and New Mexico there are no statistically significant differences between border and non-border counties in the share of households with LEP. Access to computers and broadband access is generally similar between border and non-border counties in Arizona, California, and New Mexico. However, in Texas, nearly a quarter (23%) of households in border counties lack computer access compared to 14% of those in non-border counties. Texas also has the highest shares of households reporting no broadband access in both border and non-border counties across the four states, with lower broadband access in non-border than border counties (22% without broadband access vs. 18% without broadband access).

Limited English Proficiency (LEP), Computer, and Internet Access among Households in Border and Non-Border Counties in Border States, 2019

What is the status of health and health care in the border region?

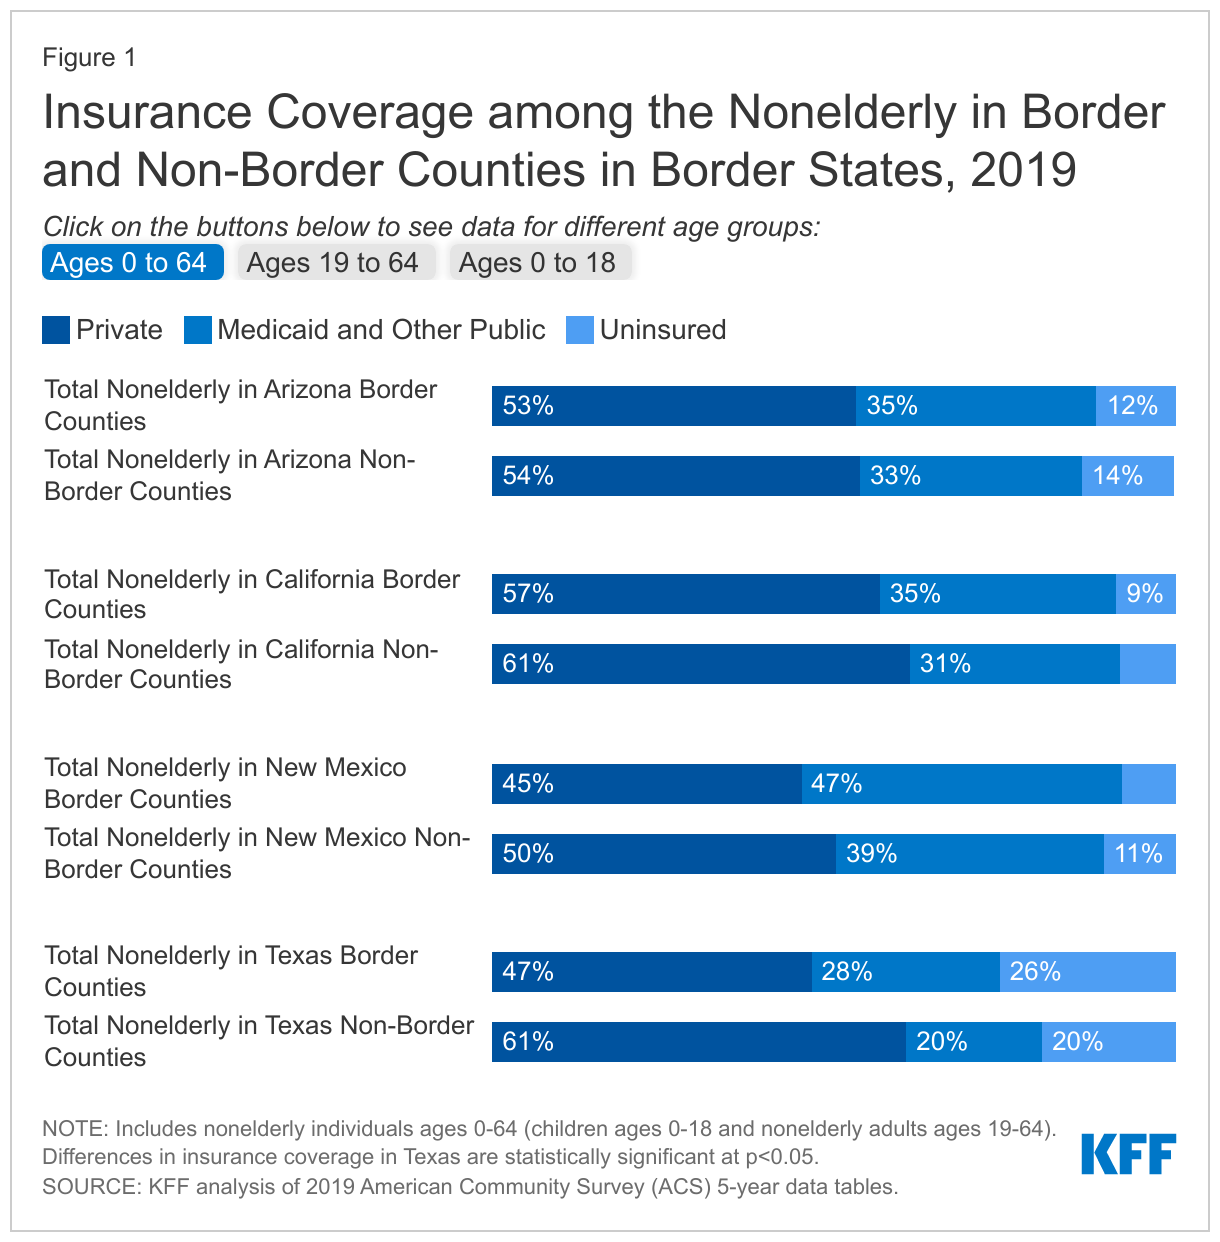
Uninsured rates among nonelderly residents in both border and non-border counties in Texas are at least twice as high as the other three border states, and nonelderly residents in its border counties are more likely to be uninsured than those in its non-border counties (26% vs. 20%) (Figure 4). In Texas, private coverage rates are lower in border counties than non-border counties. While the Medicaid coverage rate is higher in border counties than non-border counties, it does not fully offset the difference in private coverage leading to the higher uninsured rate for its residents in border counties. In the other three border states, there are no significant differences in insurance coverage patterns between border and non-border counties. The higher uninsured rates in Texas are mostly driven by higher uninsured rates for nonelderly adults, which are particularly high in border counties, where one in three adults lacked coverage. Children in Texas also have higher uninsured rates compared to the other border states, but there is little difference in uninsured rates for children in border vs. non-border counties.

In contrast to the other border states, Texas has not implemented the ACA Medicaid expansion to lower-income adults, contributing to its lower rates of Medicaid coverage and higher uninsured rates compared to the other states. Overall, over 770,000 poor adults are in the Medicaid coverage gap in Texas, accounting for over a third of all adults in the gap nationwide.19  As noted, in Texas, border county residents have lower levels of full-time employment and household incomes than their counterparts in non-border counties, which may contribute to the lower rates of private coverage in the border counties. While Medicaid coverage helps offset some of this difference, border counties also include higher shares of noncitizens compared with non-border counties, who may face eligibility restrictions for Medicaid. Specifically, those who are undocumented are not eligible to enroll in Medicaid or CHIP or to purchase coverage through the Marketplaces.

Insurance Coverage among the Nonelderly in Border and Non-Border Counties in Border States, 2019

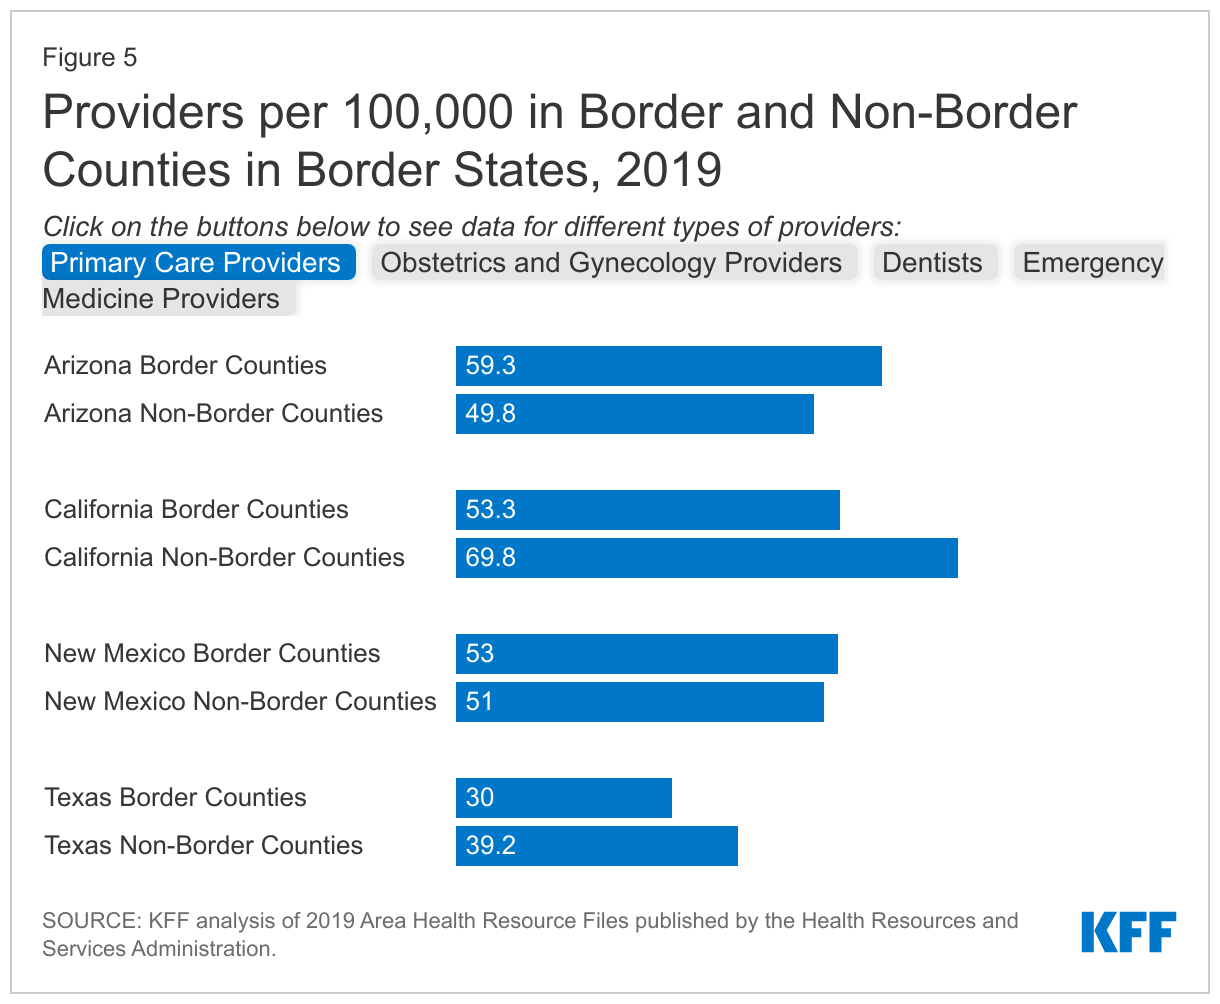
In California and Texas, border counties have a more limited supply of certain health care providers than non-border counties. Moreover, Texas has more limited availability of all four types of providers examined in both border and non-border counties compared with the other three states. In Arizona and New Mexico, the supply of providers between border and non-border counties varies based on provider type (Figure 5). For example, Arizona has fewer dentists per 100,000 people in border counties vs. non-border counties (45.3 vs. 55.1) but has more primary care providers per 100,000 in border counties vs. non-border counties (59.3 vs. 49.3).

Providers per 100,000 in Border and Non-Border Counties in Border States, 2019

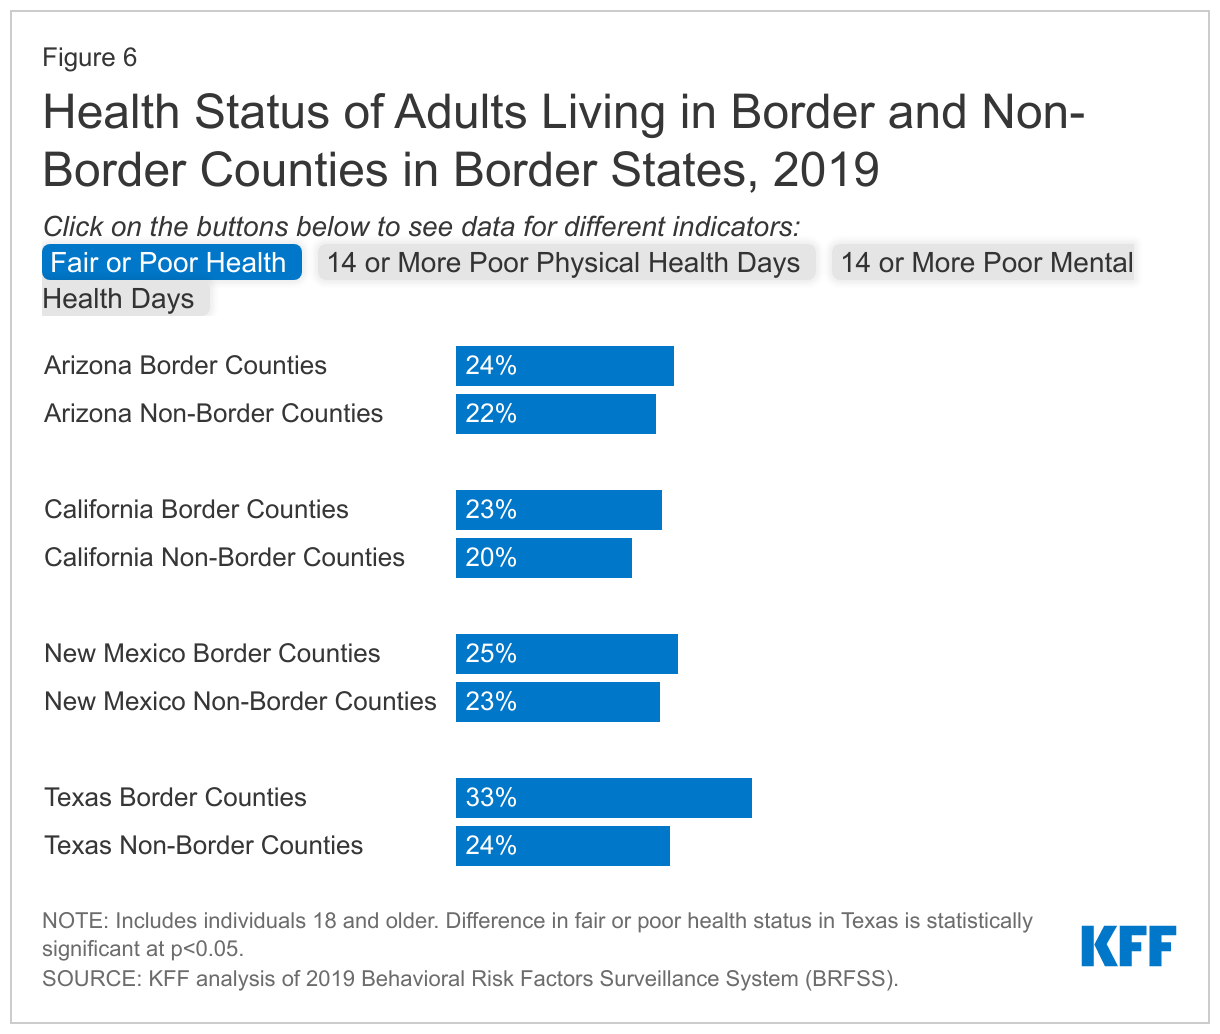
Adults in Texas border counties are more likely to report poor physical health compared to non-border counties. In Texas border counties, one-third of adults report being in fair or poor health as compared to roughly one-quarter in border and non-border counties in the other border states (Figure 6).There is limited variation in the share reporting 14 or more poor physical or mental health days in a month across border and non-border counties in the four states, however, more adults reported 14 or more poor mental health days in Texas as compared to the other three states.

Health Status of Adults Living in Border and Non-Border Counties in Border States, 2019

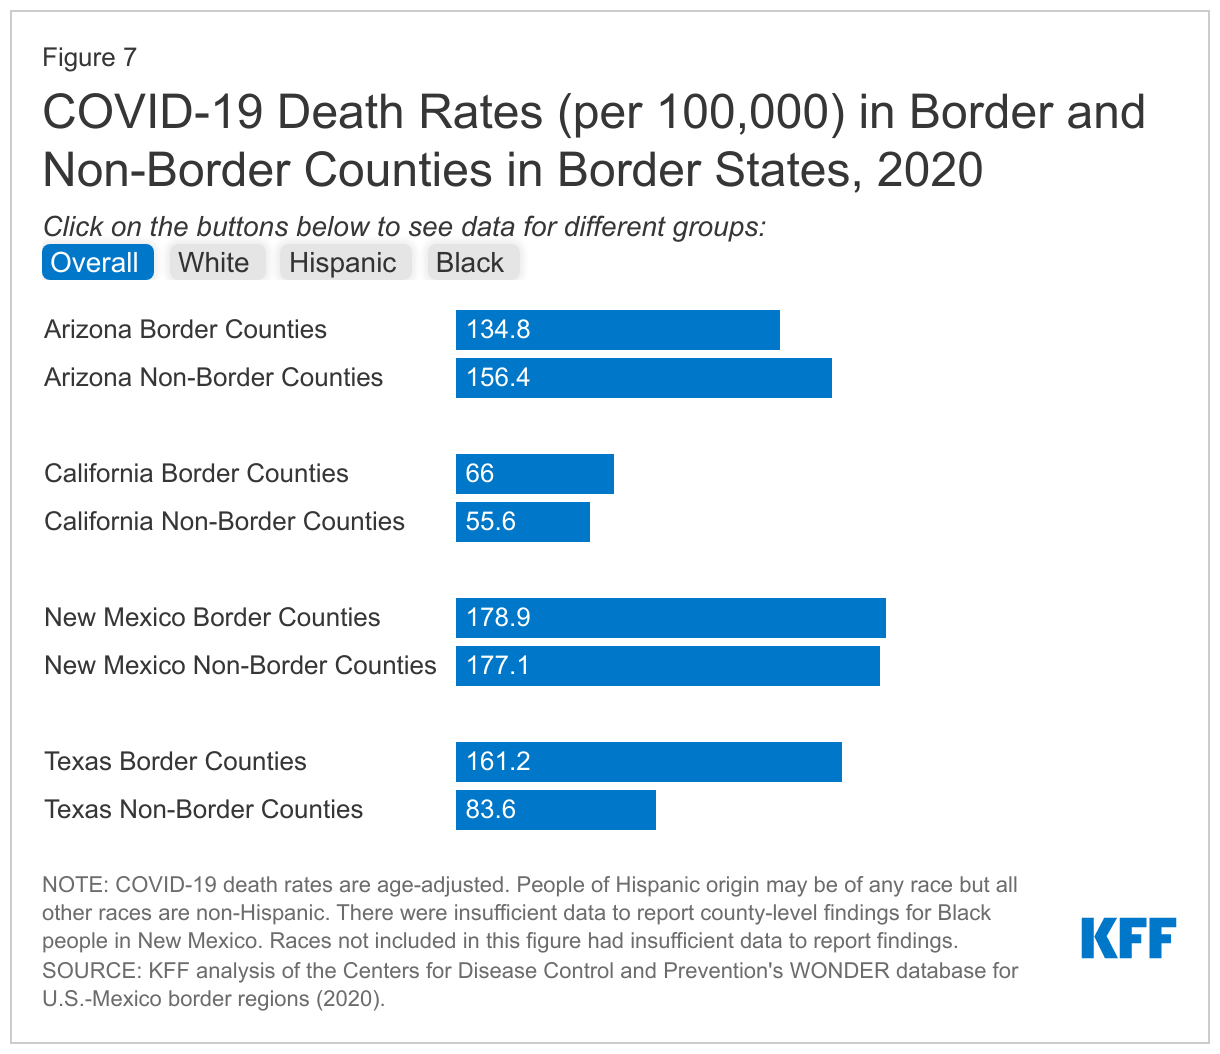
California, New Mexico, and Texas had higher rates of COVID-19 deaths in border counties vs. non-border counties overall, with the largest difference in Texas, where the border county death rate was nearly twice as high as the rate for non-border counties (161.2 vs. 83.6 per 100,000) (Figure 7). These differences are primarily driven by a higher COVID-19 death rate among Hispanic people in border counties vs. non-border counties. Across the four states, Texas had the highest death rate among Hispanic people. Moreover, within Texas, the death rate among Hispanic people was over 1.5 times higher in border counties than in non-border counties (290.9 vs. 167.1 per 100,000). The death rate for White people in Texas border counties was also higher than their counterparts in non-border counties (89.5 vs. 67.2).

COVID-19 Death Rates (per 100,000) in Border and Non-Border Counties in Border States, 2020

Implications

With the recent surge in immigration activity at the border, it is helpful to better understand who lives in the region and their experiences, including their health and access to health care. Overall, people in the four states along the U.S.-Mexico border are more likely to be Hispanic, noncitizen immigrants, poor, and uninsured than people in other areas of the country. This analysis reveals further distinctions between and within these four states. It shows that, across many of the measures examined, Texas fared worse compared to the other border states. Moreover, within Texas, individuals in border counties fare worse across many examined measures compared to those in non-border counties, with particularly low levels of educational attainment and income, higher shares of households with LEP and no computer access, higher uninsured rates, and limited access to providers. In the other border states, there are smaller differences between people living in border vs. non-border counties.

In contrast to the other border states, Texas has not implemented the ACA Medicaid expansion to adults, contributing to lower rates of Medicaid coverage and higher uninsured rates. These differences are particularly pronounced in its border counties, where over a quarter of nonelderly residents, including one in three nonelderly adults, lacked health coverage. These high uninsured rates coupled with more limited availability of providers, particularly in border counties, likely contribute to challenges accessing health care and strains on safety-net providers, which are likely exacerbated by increased social and economic challenges in these areas.

Overall, these findings highlight the potential benefits of providing resources and support to the border region to meet the needs of the growing number of migrants and asylum seekers in the area. Better preparedness, more job opportunities, and a greater allocation of resources to help migrants assimilate in the community may be helpful not only in improving socioeconomic and health outcomes and reducing disparities in border areas, but in improving the economy overall, particularly in these border communities. Policies that increase opportunities for newly arriving migrants to work, such as reducing the wait time for applying for work authorization, could also reduce overcrowding at migrant shelters. Funding to support organizations providing direct assistance to newly arriving migrants and asylum seekers, funding to support community health workers and Federally Qualified Health Centers in border areas, and funding to address social needs such as poverty and LEP may help improve outcomes in the border region. Moreover, implementation of the Medicaid expansion in Texas could help to increase overall coverage rates and provide increased financial resources to support health providers and the health care system. Immigration remains a contentious political issue, and there are other competing demands for public dollars, but this analysis shows particularly acute health and social needs along the U.S.-Mexico border.

  1. U.S. Census Bureau, “Quick Facts”, https://www.census.gov/quickfacts, accessed November 14, 2022. ↩︎
  2. U.S. Census Bureau, “County Population Totals: 2020-2021”, https://www.census.gov/data/tables/time-series/demo/popest/2020s-counties-total.html, accessed November 14, 2022. ↩︎
  3. U.S. Customs and Border Protection (2022), “Southwest Land Border Encounters”, https://www.cbp.gov/newsroom/stats/southwest-land-border-encounters, accessed October 20, 2022. ↩︎
  4. Pew Charitable Trusts (2022), “Minus the Politics, Migrants Often Use Buses, Planes to Reach Shelter”, https://www.pewtrusts.org/en/research-and-analysis/blogs/stateline/2022/10/04/minus-the-politics-migrants-often-use-buses-planes-to-reach-shelter, accessed October 26, 2022. ↩︎
  5. National Public Radio (2022), “A dramatic shift at the border as migrants converge on a remote corner of South Texas” https://www.npr.org/2022/09/23/1124561261/a-dramatic-shift-at-the-border-as-migrants-converge-on-a-remote-corner-of-south-, accessed September 23, 2022. ↩︎
  6. Migration Policy Institute (2022), “Busing and Flights of Migrants by GOP Governors Mark a New Twist in State Intervention on Immigration”, https://www.migrationpolicy.org/article/migrant-asylum-seeker-busing, accessed October 26, 2022. ↩︎
  7. Kaiser Family Foundation (KFF), “State Health Facts”, https://modern.kff.org/statedata/, accessed October 28, 2022. ↩︎
  8. The Brookings Institution (2022), “Who are the 1 million missing workers that could solve America’s labor shortages?”, https://www.brookings.edu/blog/up-front/2022/07/14/who-are-the-1-million-missing-workers-that-could-solve-americas-labor-shortages/, accessed October 26, 2022. ↩︎
  9. Press Herald (2022), “Rep. Pingree submits bill to shorten asylum seekers’ wait time for work authorization”, https://www.pressherald.com/2022/02/11/pingree-introduces-bill-to-shorten-waiting-period-for-asylum-seeker-work-authorization/, accessed October 26, 2022. ↩︎
  10. Urban Institute (2015), “Immigrants and native workers compete for different low-skilled jobs”, https://www.urban.org/urban-wire/immigrant-and-native-workers-compete-different-low-skilled-jobs, accessed November 14, 2022. ↩︎
  11. Azoulay, Pierre, Benjamin F. Jones, J. Daniel Kim, and Javier Miranda. 2022. "Immigration and Entrepreneurship in the United States." American Economic Review: Insights, 4 (1): 71-88. ↩︎
  12. Rural Health Information Hub (2019), “Rural Border Health”, https://www.ruralhealthinfo.org/topics/border-health, accessed October 21, 2022. ↩︎
  13. Migration Policy Institute (2022), “Record-Breaking Migrant Encounters at the U.S.-Mexico Border Overlook the Bigger Story”, https://www.migrationpolicy.org/news/2022-record-migrant-encounters-us-mexico-border, accessed October 26, 2022. ↩︎
  14. National Public Radio (2022), “Thousands of Ukrainian refugees arrive at U.S.-Mexico Border”, https://www.npr.org/2022/04/08/1091769484/hundreds-of-ukrainian-refugees-at-the-u-s-mexico-border-hoping-for-asylum, accessed September 23, 2022. ↩︎
  15. Kaiser Family Foundation (KFF) (2022), “Title 42 and its Impact on Migrant Families”, https://modern.kff.org/racial-equity-and-health-policy/issue-brief/title-42-and-its-impact-on-migrant-families/, accessed October 26, 2022. ↩︎
  16. U.S. Citizenship and Immigration Services (2022), “Asylum”, https://www.uscis.gov/humanitarian/refugees-and-asylum/asylum, accessed October 21, 2022. ↩︎
  17. U.S. Citizenship and Immigration Services (2022), “Refugees”, https://www.uscis.gov/humanitarian/refugees-and-asylum/refugees, accessed October 26, 2022. ↩︎
  18. U.S. Citizenship and Immigration Services (2022), “USCIS Stopped Applying June 2020 Rules Pursuant to Court Order in Asylumworks v. Mayorkas”, https://www.uscis.gov/laws-and-policy/other-resources/class-action-settlement-notices-and-agreements/uscis-stopped-applying-june-2020-rules-pursuant-to-court-order-in-asylumworks-v-mayorkas#:~:text=You%20may%20apply%20for%20employment,you%20file%20your%20asylum%20application., accessed October 21, 2022. ↩︎
  19. Kaiser Family Foundation (KFF) (2021), “The Coverage Gap: Uninsured Poor Adults in States that Do Not Expand Medicaid”, https://modern.kff.org/medicaid/issue-brief/the-coverage-gap-uninsured-poor-adults-in-states-that-do-not-expand-medicaid/, accessed October 26, 2022. ↩︎

The Typical Medicare Beneficiary Has Close to 70 Different Medicare Advantage and Medicare Part D Stand-Alone Plan Options for 2023

Published: Nov 17, 2022

The Medicare open enrollment period that runs from October 15 to December 7 each year is an opportunity for Medicare beneficiaries in traditional Medicare and Medicare Advantage to evaluate their current coverage, compare plans, and decide whether to make a change for the coming year. Beneficiaries can compare Medicare Advantage plans, mainly HMOs and PPOs, which provide all Medicare-covered benefits, typically including Part D drug coverage, and may offer other benefits such as vision, dental, and hearing benefits. Beneficiaries can also compare Part D stand-alone prescription drug plans, which add drug coverage to traditional Medicare. Costs and coverage can vary from one plan to another and can change from one year to the next.

For coverage in 2023, the typical beneficiary has close to 70 different Medicare private plan options, consisting of 43 Medicare Advantage plans, including 35 with Part D drug coverage and 8 without, and 24 Part D stand-alone drug plans. This total represents two-thirds more plan options than the typical beneficiary had six years ago, an increase driven by a substantial expansion of Medicare Advantage plan offerings.

News Release

A Fall Update on COVID-19 Cases and Deaths, Vaccinations, and Treatments by Race/Ethnicity

Published: Nov 17, 2022

KFF has updated its national analysis of race/ethnicity data of COVID-19 cases and deaths, vaccinations, and treatments as concerns grow over a potential increase in COVID-19 cases during winter and upcoming holiday gatherings and the low take-up of the COVID-19 bivalent booster vaccine among the eligible public.

Despite earlier progress narrowing disparities in COVID-19 vaccination, new disparities have emerged in take-up of boosters and treatment.

Federal data from earlier this month indicates that, among the eligible population, 10% of White people had received a COVID-19 bivalent booster dose, twice the rate of eligible Black (5%) and Hispanic (4%) people and nearly twice as high as for Native Hawaiian or Other Pacific Islander people (6%). Eleven percent of Asian people and 8% of American Indian and Alaskan Native people had received a bivalent booster dose.

The bivalent booster data stands in contrast to the vaccination rates among racial and ethnic groups for at least one dose of the primary COVID-19 vaccine. The rate for a primary COVID-19 vaccine dose among White people stood at 56% earlier this month. The primary vaccine dose rate among Black people lagged at 50%, while other racial and ethnic groups had surpassed the rates among White people. Uptake of at least one dose of the primary COVID-19 vaccine began leveling off across all racial/ethnic groups in late winter 2021.

Racial and ethnic gaps are also found in the data on the treatment of COVID-19. As of mid-2022, among COVID-19 patients aged 20 and older, people of color were less likely to have been treated with the antiviral treatment Paxlovid. While the disparities were found across all age groups, the Paxlovid treatment gap was more evident among adults aged 50 or older and those who are immunocompromised (groups more at risk for serious health outcomes).

For the full analysis including a look at the trends in racial disparities in cases and deaths which have widened and narrowed over the course of the pandemic read, COVID-19 Cases and Deaths, Vaccinations, and Treatments by Race/Ethnicity as of Fall 2022.


COVID-19 Cases and Deaths, Vaccinations, and Treatments by Race/Ethnicity as of Fall 2022

Published: Nov 17, 2022

As the United States enters its third holiday season navigating a potential increase in COVID-19 cases as well as other respiratory illnesses, federal data from the Centers for Disease Control and Prevention (CDC) show that as of November 9, 2022, 80% of the total population in the United States have received at least one dose of a COVID-19 vaccine and only 10% of eligible individuals have received the updated, bivalent booster that was authorized for use among individuals 5 years of age and older in early Fall 2022. Individuals who have not received any booster dose are at higher risk of infection from the virus, and people who remain unvaccinated continue to be at particularly high risk for severe illness and death.

Over the course of the pandemic, racial disparities in cases and deaths have widened and narrowed. However, overall, Black, Hispanic, and American Indian and Alaska Native (AIAN) people have borne the heaviest health impacts of the pandemic, particularly when adjusting data to account for differences in age by race and ethnicity. While Black and Hispanic people were less likely than their White counterparts to receive a vaccine during the initial phases of the vaccination rollout, these disparities have narrowed over time and reversed for Hispanic people. Despite this progress, a vaccination gap persists for Black people. COVID-19 outpatient treatments, which can mitigate hospitalization and death from COVID-19, are also available. However, early data suggest racial disparities in access to and receipt of these treatments.

This data note presents an update on the status of COVID-19 cases and deaths, vaccinations, and treatments by race/ethnicity as of Fall 2022, based on federal data reported by the Centers for Disease Control and Prevention (CDC).

What is the status of COVID-19 cases and deaths by race/ethnicity?

Racial disparities in COVID-19 cases and deaths have widened and narrowed over the course of the pandemic, but when data are adjusted to account for differences in age by race/ethnicity, they show that AIAN, Black, and Hispanic people have had higher rates of infection and death than White people over most of the course of the pandemic. Early in the pandemic, there were large racial disparities in COVID-19 cases. Disparities narrowed when overall infection rates fell. However, during the surge associated with the Omicron variant in Winter 2022, disparities in cases once again widened with Hispanic (4,341 per 100,000), AIAN (3,818 per 100,000), Black (2,937 per 100,000), and Asian (2,755 per 100,000) people having higher age-adjusted infection rates than White people (2,693 per 100,000) as of January 2022 (Figure 1). Following that surge, infection rates fell in Spring 2022 and disparities have once again narrowed. However, as of September 2022, the age-adjusted COVID-19 infection rates were still highest for Black and Hispanic people (192 per 100,000 for each group), followed by AIAN people at 188 per 100,000. White and Asian people had the lowest infection rates at 164 per 100,000 and 153 per 100,000, respectively. While death rates for most groups of color were substantially higher compared with White people early on in the pandemic, since late Summer 2020, there have been some periods when death rates for White people have been higher than or similar to some groups of color. However, age-adjusted data show that AIAN, Black, and Hispanic people have had higher rates of death compared with White people over most of the pandemic and particularly during surges. For example, as of January 2022, amid the Omicron surge, age-adjusted death rates were higher for Black (37.4 per 100,000), AIAN (34.7 per 100,000), and Hispanic people (29.9 per 100,000) compared with White people (23.5 per 100,000) (Figure 1). Following that surge, disparities narrowed when death rates fell. As of August 2022, age-adjusted death rates were similar for AIAN (4.9 per 100,000), Black (4.4 per 100,000), and White people (4.2 per 100,000) and lower for Hispanic (3.6 per 100,000) and Asian (2.7 per 100,000) people. Despite these fluctuations over time, total cumulative age-adjusted data continue to show that Black, Hispanic, and AIAN people have been at higher risk for COVID-19 cases, hospitalizations, and deaths compared with White people.

COVID-19 Monthly Age-Adjusted Cases in the United States per 100,000 by Race/Ethnicity, April 2020 to September 2022

What are COVID-19 vaccination and booster patterns by race/ethnicity?

While disparities in COVID-19 vaccinations have narrowed over time and have been reversed for Hispanic people, they persist for Black people. Ongoing KFF analysis shows that at both the federal and state level, there were large gaps in vaccination for Black and Hispanic people in the initial phases of the vaccination rollout, which narrowed over time and eventually reversed for Hispanic people. Despite this progress, a vaccination gap persists for Black people. According to the CDC, overall, 80% of people had received at least one COVID-19 vaccination dose as of November 9, 2022, and race/ethnicity was known for 75% of people who had received at least one dose. Based on those with known race/ethnicity, about half (50%) of Black people had received at least one dose compared with 56% of White people, two-thirds (66%) of Hispanic people, and over seven in ten Native Hawaiian and other Pacific Islander (NHOPI) (70%), Asian (72%), and AIAN (77%) people (Figure 2).

Overall, few people have received the updated bivalent booster vaccine dose, and Black and Hispanic people are about half as likely as White people to have received this booster so far. The updated bivalent boosters protect against both the original virus that causes COVID-19 and the BA.4 and BA.5 Omicron variants. These boosters became available for people ages 12 years and older on September 2, 2022, and for people ages 5-11 years old on October 12, 2022. The CDC recommends that people ages 5 years and older receive one bivalent booster at least 2 months after their last COVID-19 vaccine dose. The CDC reports that, overall, 10% of people over age five have received the updated bivalent booster vaccine dose as of November 9, 2022, with race/ethnicity data available for 88%. Based on those with known race/ethnicity, 11% of eligible Asian and 10% of eligible White people had received a bivalent booster dose, roughly twice the shares of eligible Black (5%) and Hispanic people (4%) (Figure 2). The bivalent booster dose rate was 6% for eligible NHOPI people and 8% for eligible AIAN people.

Percent of People Receiving At Least One Dose of the COVID-19 Vaccines by Race/Ethnicity, as of November 9, 2022

What are COVID-19 treatment patterns by race/ethnicity?

New data from CDC show racial disparities in receipt of COVID-19 oral antiviral treatments, including Paxlovid, the most widely prescribed antiviral. As of November 2022, there are four COVID-19 outpatient treatments, including: Paxlovid and Lagevrio, oral antivirals that were both approved in December 2021; Veklury, an IV infusion antiviral that was approved in January 2021; and Bebtelovimab a monoclonal antibody that was approved in February 2022. Outpatient COVID-19 treatments are recommended for people who have tested positive for COVID-19 with mild to moderate symptoms and who are at high risk of developing severe illness. Prior KFF analysis pointed to potential disparities in access to COVID-19 treatments for counties with the highest poverty rates and those that are majority Black, Hispanic, and AIAN. Other analyses have documented disparities in monoclonal antibody treatments by race and ethnicity as well as disparities in oral antiviral treatment by zip-code vulnerability. An October 2022 CDC Morbidity and Mortality Weekly Report adds to these findings showing that, through July 2022, people of color were less likely to receive currently available outpatient antiviral COVID-19 treatments compared with their White counterparts. Specifically, between April to July 2022, the percentage of COVID-19 patients aged 20 years and older treated with Paxlovid was lower among Black (21%) and Hispanic (21%) patients than among White (32%) and non-Hispanic (30%) patients, respectively (Figure 3). The shares of AIAN and NHOPI (25%) and Asian (26%) patients receiving prescriptions were also smaller compared to the share of White patients. These disparities were observed across all age groups and were more evident among adults ages 50 and older and immunocompromised patients. Racial and ethnic disparities existed for treatment with other medications, but differences were small given overall low levels of treatment with these other medications.

Percent of COVID-19 Patients Ages 20 Years and Older Treated with Paxlovid, by Race and Ethnicity

Discussion

While disparities in cases and deaths have widened and narrowed over the course of the pandemic, age-adjusted data show that AIAN, Black, and Hispanic people have had higher rates of cases and death compared with White people over most of the course of the pandemic and that they have experienced overall higher rates of infection, hospitalization, and death.

Data point to significantly increased risks of COVID-19 illness and death for people who remain unvaccinated or have not received an updated bivalent booster dose. During the initial vaccine rollout, Black and Hispanic people were less likely to receive vaccines than their White counterparts. However, these disparities have narrowed over time and reversed for Hispanic people, though they persist for Black people. Despite this progress in initial vaccination uptake, overall uptake of the updated bivalent booster dose has been slow so far, and there have been racial disparities in receipt of these booster doses, with eligible Black, Hispanic, and NHOPI people about half has likely to have received an updated booster than their White counterparts. Data also point to disparities in receipt of COVID-19 treatments, with patients of color less likely to receive oral antivirals, including Paxlovid, compared to White patients.

Overall, these data show that although the pandemic has contributed to growing awareness and focus on addressing racial disparities, they persist, reflecting the underlying structural inequities that drive them. The findings highlight the importance of a continued focus on equity and efforts to address inequities that leave people of color at increased risk for exposure, illness, and death as well as to close gaps in access to health care, including COVID-19 treatments. Addressing these gaps is of increasing importance as these disparities may be exacerbated when federal funding for COVID-19 vaccines, treatments, and tests runs out and some people may face increased out-of-pocket costs to access these services. Addressing these inequities is key for narrowing the disparate effects of COVID-19 going forward as well as for preventing similar disparities associated with future public health threats.

Abortion Bans May Limit Essential Medications for Women with Chronic Conditions

Authors: Brittni Frederiksen, Matthew Rae, Tatyana Roberts, and Alina Salganicoff
Published: Nov 17, 2022

The Supreme Court’s decision to overturn Roe v. Wade and send the decision to ban or permit abortion back to the states will likely have health implications beyond banning abortion in many states. There have already been reports of clinicians and pharmacists denying women access to medications like methotrexate and misoprostol to manage their chronic conditions, such as autoimmune diseases and gastric ulcers, because the drugs are also used for medication abortions and treatment of ectopic pregnancies. In these reports, pharmacists have denied or delayed filling prescriptions unless specific codes for non-pregnancy related conditions are given. Some providers are also requesting patients take a pregnancy test to confirm a non-pregnant status before they will prescribe the medications. This analysis finds that the majority of those who use these drugs are women who are not pregnant but have diagnoses for other chronic conditions and rely on these medications to manage their health. Consequently, women of reproductive age with chronic conditions will be most impacted by these actions.

Indications for Use of Methotrexate and Misoprostol

Methotrexate is indicated for treatment of rheumatoid arthritis and other autoimmune diseases that disproportionately affect women. The drug works by suppressing the immune system. Additionally, many chemotherapy regimens include methotrexate for treatment of adult and pediatric cancers, such as leukemia and breast cancer, where it works to slow or stop the growth of cancer cells. It also has some off label uses for common conditions like Crohn’s disease, lupus, and eczema. The drug is also a common treatment for ectopic pregnancies where it stops cells from dividing by interfering with the folic acid in your body.

Beyond methotrexate, another drug that may be limited because of its use in pregnancy terminations is misoprostol. Misoprostol is a prostaglandin that causes cervical softening and dilation, as well as uterine contractions. It is frequently used in obstetrics and gynecology for procedures like the medical management of miscarriage, induction of labor, cervical ripening before surgical procedures, and the treatment of postpartum hemorrhage. It is also indicated for reducing the risk of nonsteroidal anti-inflammatory drug (NSAIDs like aspirin and ibuprofen) induced gastric ulcers in patients at high risk of complications from gastric ulcers. In combination with mifepristone, misoprostol can be used to terminate an intrauterine pregnancy through 70 days gestation. Access to methotrexate and misoprostol is essential for patients, especially women, with these cross-cutting conditions. A more detailed version of Table 1 can be found in the Appendix.

Common Conditions Treated with Methotrexate and Misoprostol

Findings

We examined the gender, age, and diagnosis of people with methotrexate and misoprostol prescriptions and injections in claims from the IBM MarketScan Encounter Database in 2019, a database of claims paid on behalf of enrollees of large employer private health plans. We looked at utilization for both men and women enrollees ages 0-64, with a focus on reproductive aged women, ages 15-49, who did not have indication of a pregnancy in the year. The claims used in this analysis only reflect use under the benefit plan and do not include services for which the enrollee did not file a claim such as a medication abortion that was paid for out-of-pocket without using insurance, which could result in an underestimate of individuals using these drugs.

Methotrexate

We find that women make up the majority of people (71%) with a methotrexate prescription in the 2019 IBM MarketScan Encounter Database compared to 29% of methotrexate prescriptions going to men (Figure 1). Over a quarter (29%) of people with a methotrexate prescription are women of reproductive age, ages 18-49, while 39% are women ages 50-64.

7 in 10 People With a Methotrexate Prescription Are Women

Among reproductive-aged women with a methotrexate prescription claim, 92% had no indication of pregnancy in the measurement year (Figure 2). Among those who were not pregnant, over half (55%) of reproductive-aged women with a claim for a methotrexate prescription had a diagnosis code for rheumatoid arthritis at some point during the year. Nearly a third (33%) had a diagnosis for another autoimmune disease we looked at and just over one in five (18%) had a cancer diagnosis at some point in the year (Table 2).

Methotrexate Is Used Primarily for Conditions Unrelated to Pregnancy
Methotrexate is Commonly Used for Autoimmune Conditions and Cancer

Misoprostol

Among misoprostol prescriptions, 97% are prescribed to women compared to 3% for men. The majority of women using misoprostol are of reproductive age (80%) (Figure 3).

The Majority of People With a Misoprostol Prescription Are Women

Among reproductive-aged women with misoprostol prescription, 61% had no indication of pregnancy in the year (Figure 4). Over half (52%) of non-pregnant women of reproductive age had a diagnosis for conditions where misoprostol would be indicated for cervical ripening, such as for an IUD insertion, while another one in three (36%) had a diagnosis code for abnormal bleeding (Table 3).

Six in Ten Reproductive Age Women Who Used Misoprostol Are Not Pregnant
Misoprostol is Frequently Used for Purposes Outside of Abortion

Implications

As abortion bans are implemented in states in the South and Midwest, reproductive-aged women with autoimmune diseases or cancer could see delays or denials in receiving medications like methotrexate and misoprostol, used to manage their chronic conditions. The abortion bans also have implications for the management of a broad range of conditions that impact women. This analysis finds that limitations and barriers to these treatments will have a disproportionate impact on women, beyond limiting the availability of abortions to terminate pregnancies.

Providers and pharmacists in states where abortion is banned could refrain from prescribing or dispensing these drugs out of fear of prosecution. In response to concerns about access to these medications, on July 13, 2022, the U.S. Department of Health and Human Services issued guidance reminding retail pharmacies that as recipients of federal financial assistance, including Medicare and Medicaid payments, that they are prohibited from discriminating based on sex and other bases (i.e., race, color, national origin, age, and disability) under Section 1557 of the Affordable Care Act. The administration’s stance is that decisions to limit access to these medications could be discriminatory based on age, sex, and disability and could violate Section 1557 of the ACA. This is one of the many unanticipated consequences of the Supreme Court decision to overturn Roe v. Wade and states actions to ban abortion.

Methods

We analyzed prescription drug claims from the 2019 IBM Health Analytics MarketScan Commercial Claims and Encounters Database, which contains claims information provided by a sample of large employer plans. Non-elderly enrollees in MarketScan were included if they were enrolled for at least 6 months. This analysis used claims for almost 14,000 million non-elderly people representing about 17% of the 85,453,000 million people in large group plans (employers with a thousand or more workers) in 2019. To make MarketScan data representative of enrollment in large group plans nationally, weights were applied to match counts in the Current Population Survey for enrollees and their dependents employed by firms of a thousand or more workers by sex, age and state. Weights were trimmed at eight times the interquartile range. In total, there were claims for 3,816,000 women of reproductive age (18-49), representing 16% of those in a large group plan.

This data collects the utilization of retail prescription drugs but does not include a diagnosis associated with the prescription. ICD-10 diagnosis codes were used to classify illnesses and conditions. Individuals are classified as having a diagnosis if they had either an outpatient or inpatient claim within the year which included one of the identified diagnoses. Persons with a pregnancy claim were first identified with diagnoses including any ICD-10 diagnosis code beginning with O, Z33, Z34, Z3A, Z322, Z3201, Z36, Z39 or Z37. After excluding persons with a pregnancy claim, we identified persons with a claim for rheumatoid arthritis or cancer using the disease definitions developed by the Healthcare Cost and Utilization Project (HCUP). Persons using the drugs who had another autoimmune disease, cervical ripening, or abnormal bleeding were identified using a select group of diagnosis codes available upon request. The claims used in this analysis only reflect use under the benefit plan and do not include services for which the enrollee did not file a claim, which could result in an underestimate of individuals using these drugs.

Appendix

Pregnancy and Non-pregnancy Related Indications for Methotrexate
Pregnancy and Non-pregnancy Related Indications for Misoprostol
News Release

Abortion Bans May Limit Access to Certain Drugs Used to Treat Women with Cancer, Autoimmune Diseases, and Ulcers

Published: Nov 17, 2022

A new KFF analysis finds that women comprise the majority of patients who rely on certain drugs that may be restricted in response to state abortion bans. Following the Supreme Court decision to overturn Roe v. Wade, some women in abortion-banning states have reported that clinicians and pharmacists denied them access to medications like methotrexate and misoprostol that are used to manage chronic conditions but are also used for medication abortions and treatment of ectopic pregnancies.

Clinicians prescribe methotrexate, which is harmful to fetuses and used to treat ectopic pregnancies, to also manage autoimmune diseases including Crohn’s disease and lupus as well as certain cancers. Misoprostol is one of the drugs that is taken as part of a medication abortion typically with mifepristone, and is also prescribed for miscarriage management, to induce labor, and reduce the risk of ulcers caused by medications like aspirin and ibuprofen. 

This analysis used a large claims database of enrollees in large employer plans to look at the gender, age, and common diagnoses of people with methotrexate and misoprostol prescriptions in 2019. Key findings include the following:

  • Seven in ten people with a methotrexate prescription were women. Among women of childbearing age (ages 18-49) with methotrexate prescriptions, 92% were not pregnant in the year. Among those who were not pregnant, the vast majority had an autoimmune disease and about one in five had a cancer diagnosis at some point in the year.
  • Among women of childbearing age with misoprostol prescriptions, 97% were women and 61% were not pregnant. The majority of non-pregnant women had a diagnosis for which misoprostol would be needed in preparation for a cervical procedure such as intrauterine device (IUD) insertions, while another one in three were diagnosed with abnormal bleeding.

Read “Abortion Bans May Limit Essential Medications for Women with Chronic Conditions” to learn more.

Extra Benefits Offered by Medicare Advantage Firms Vary

Published: Nov 16, 2022

Medicare beneficiaries may choose to receive their Medicare benefits through traditional Medicare or a Medicare Advantage plan offered by a private health insurance company. Over the past 15 years, the share of Medicare beneficiaries enrolled in Medicare Advantage plans has more than doubled, approaching half of the total Medicare population. One reason for the growth in Medicare Advantage enrollment may be that virtually all plans offer extra benefits not available in traditional Medicare, including coverage of vision (eyeglasses and/or eye exams), hearing (exams and/or aids), fitness, and dental services.

Firms that sponsor Medicare Advantage plans have the ability to determine what, if any, extra benefits to offer, and these decisions may be made with the goal of attracting and retaining enrollees. Firm participation in the Medicare Advantage market is robust, with the average Medicare beneficiary able to choose from 43 plans offered by 9 firms in 2023 (similar to 2022). Despite having broad options, enrollment is highly concentrated, with UnitedHealthcare and Humana accounting for more than 40 percent of all Medicare Advantage enrollees since 2015, and a high of 46 percent in 2022.

This analysis examines how the share of enrollees in plans that offer extra benefits varies across firms, based on an analysis of CMS Medicare Advantage plan benefit and enrollment files (for additional information, see Methods box). We focus on variations across firms based on 2022 enrollment, because plan enrollment for 2023 is not yet available. In addition, we provide an overview of how the 2023 plan offerings, by firm, differ from offerings in 2022. We limited the analysis to individual Medicare Advantage plans that are generally available to all beneficiaries for enrollment (which, for example, excludes plans sponsored by employers/unions and special needs plans that are offered to a defined group of beneficiaries). We present findings for the seven firms with the largest market share in 2022, representing more than four-fifths (83%) of Medicare Advantage enrollment – UnitedHealthcare (24%), Humana (20%), Blue Cross Blue Shield (15%), CVS Health (10%), Kaiser Permanente (6%), Centene (5%), and Cigna (2%).

This analysis looks at how many enrollees are in plans that offer various extra benefits but does not examine how the scope of these benefits varies across plans or insurers. Prior KFF analysis documented substantial variation in the scope of dental benefits offered across Medicare Advantage plans, based on a detailed review of each plan’s Evidence of Coverage, that is beyond the scope of this analysis which relies on public data files. Additionally, we do not examine utilization or out-of-pocket spending associated with these extra benefits, because plans are not required to report these data for supplemental benefits.

Share of Medicare Advantage enrollees in plans with extra benefits, by firm

Across the seven largest firms in the Medicare Advantage market that together account for 83% of all enrollees, there is near universal enrollment in plans that offer vision, hearing, fitness, and dental benefits. There is more variation across firms for over-the-counter, remote access technologies, meals, acupuncture and transportation benefits. It is uncommon for plans to offer other benefits, with a relatively small share of enrollees across all firms in plans that offer in-home support services, bathroom safety, Medicare Part B premium rebates, telemonitoring or caregiver support benefits. Figure 1 shows the share of enrollees in plans that offer each of 14 different extra benefits that we examined, by firm, in 2022.

Share of Medicare Advantage Enrollees in Individual Plans with Extra Benefits by Benefit and Firm

Nearly all enrollees are in Medicare Advantage plans that offer vision, hearing, fitness and dental benefits.

Overall, virtually all Medicare Advantage enrollees are in plans that offer coverage of some vision (99%), hearing (98%), fitness (98%), and/or dental (96%) services. While coverage is nearly universal, there are some small differences across firms.

At least 95 percent of enrollees in plans sponsored by the firms we examined are offered vision, hearing and/or fitness benefits. Across all firms, there is little difference in the share of enrollees in who are offered at least some vision services, such as eye exams and/or eyeglasses, with at least 99 percent of enrollees in a plan that offers this benefit. Hearing and fitness benefits are also nearly universally offered, though a slightly smaller share of Humana enrollees (95%) are in a plan that covers hearing benefits and slightly smaller share of UnitedHealthcare enrollees (96%) are offered fitness benefits, compared to the national average.

The share of enrollees in a plan that offers dental benefits ranges from 90 percent among UnitedHealthcare enrollees to 100 percent for Humana, CVS Health, and Kaiser Permanente enrollees. Coverage of dental services is also nearly universally offered to enrollees in Centene (98%) and Cigna (99%) plans. As noted earlier, prior KFF analysis has documented wide variation in the scope of dental benefits offered by plans, ranging from preventive services exclusively to more comprehensive coverage.

The share of Medicare Advantage enrollees in plans that offer over-the-counter, remote access technologies, meal, acupuncture, and transportation benefits varies more across firms.

Overall, a majority of Medicare Advantage enrollees are in a plan that offers over-the-counter (84%), remote access technologies (72%), or meal (71%) benefits, while a somewhat smaller share are enrolled in plan with acupuncture (45%) or transportation (39%) benefits. Across firms, however, there are notable differences.

Among the two firms with the largest enrollment, a smaller share of UnitedHealthcare than Humana enrollees are in plans that offer over-the-counter, meal, acupuncture and transportation benefits. While UnitedHealthcare has the largest market share (both historically and currently), a smaller share of enrollees in plans sponsored by UnitedHealthcare than Humana (the insurer with the second highest enrollment) are offered over-the-counter (80% vs 97%), meals (60% vs 100%), acupuncture (13% vs 100%), and transportation (26% vs 49%) benefits. The one exception among benefits that vary across firms is remote access technologies, where nearly all enrollees (98%) in a UnitedHealthcare plan are offered expanded telehealth benefits that include remote access technologies, while no Humana enrollees are in a plan that offers this benefit.  

The two firms with the smallest Medicare Advantage market share, Centene and Cigna, offer transportation benefits to the largest share of enrollees. Transportation benefits are offered to 56 percent of Centene enrollees and 62 percent of Cigna enrollees. No other firm offers this benefit to a majority of enrollees, with 49 percent of Humana enrollees, 41 percent of Blue Cross Blue Shield enrollees, 26 percent of UnitedHealthcare enrollees, and just over one fifth of CVS Health (21%) and Kaiser Permanente (22%) enrollees in a plan that offers a transportation benefit.

It is uncommon for Medicare Advantage enrollees to be in plans that offer in-home support services, bathroom safety, Part B rebates, telemonitoring, or caregiver support.

A relatively small share of Medicare Advantage enrollees are in a plan that offers in-home support services (12%), bathroom safety devices (9%), a rebate toward the Part B premium (7%), telemonitoring (4%), or support for caregivers (4%).

Enrollees in Blue Cross Blue Shield plans are enrolled somewhat more often in a plan that offers in-home support services, bathroom safety, telemonitoring, or caregiver support benefits than enrollees in plans sponsored by other firms. Among enrollees in Blue Cross Blue Shield plans, 29 percent are in a plan that offers in-home support services, compared to 23 percent in Centene plans, 12 percent in Cigna plans, 10 percent in Humana plans, 7 percent in Kaiser Permanente plans, and no enrollees in UnitedHealthcare or CVS Health plans. Similarly, 36 percent of Blue Cross Blue Shield enrollees are in a plan that covers bathroom safety devices, while just 7 percent of Cigna enrollees and fewer than 2 percent of enrollees in plans sponsored by other firms are offered this benefit. Telemonitoring and caregiver support benefits are offered exclusively by Blue Cross Blue Shield among the firms examined. Among Blue Cross Blue Shield enrollees, 15 percent are in a plan that offers telemonitoring services and 11 percent are in a plan with caregiver support benefits, while no enrollees in plans sponsored by other firms are offered these benefits.

Across Medicare Advantage firms, a relatively small share of enrollees are in a plan that provides a rebate toward the monthly Medicare Part B premium. Medicare beneficiaries in both traditional Medicare and Medicare Advantage plans are responsible for paying a monthly Medicare Part B premium.  Some plans provide a rebate that reduces the premium as an extra benefit. With the exception of Kaiser Permanente, all firms have at least some enrollees in a plan that provides a rebate towards the Medicare Part B premium. Centene has a larger share than other firms, with 26 percent of enrollees in a plan with this benefit, followed by Humana (11%), Cigna (9%), CVS Health (6%), UnitedHealthcare (4%) and Blue Cross Blue Shield (4%).

Outlook for 2023

The first release of Medicare Advantage plan benefit package data for 2023 show just a few changes in what is being offered with respect to the extra benefits that we examined at the firm level. For example, UnitedHealthcare is offering meal benefits in 83 percent of its plans in 2023, compared to just over half in 2022. Both Humana and Blue Cross Blue Shield have increased the share of plans offering in-home support services (from 4% of plans in 2022 to 11% of plans in 2023 for Humana; from 20% of plans in 2022 to 27% of plans in 2023 for Blue Cross Blue Shield). Cigna is offering caregiver support services in 17 percent of plans after not offering this benefit in any individual plans open for general enrollment in 2022. Finally, Part B premium rebates are included in a somewhat larger share of plans sponsored by Cigna (30% in 2023 compared to 18% in 2022), Humana (22% in 2023 compared to 14% in 2022) and Blue Cross Blue Shield (14% in 2023 compared to 8% in 2022). Together, these changes mean that the share of Medicare Advantage enrollees in plans that offer extra benefits by firm may differ slightly in 2023, but there are unlikely to be large, broad changes.

Discussion

Nearly all enrollees in Medicare Advantage plans sponsored by the seven largest firms in the market are in a plan that offers some vision, hearing, fitness, and/or dental benefits, but other benefits vary widely across firms or are relatively uncommon. This differentiation may represent firm-level strategies to attract and retain enrollees and grow their share of the Medicare Advantage market. Firms may be looking to attract enrollees from their competitors by offering extra benefits that are considered valuable (in part, because they potentially improve health or lower costs), and tailoring those benefits to particular subgroups of beneficiaries.

Plans are able to offer additional benefits, in part because Medicare spends more per enrollee in Medicare Advantage than it spends per person in traditional Medicare. In particular, rebates paid by Medicare to plans (based on the difference between the bid and the benchmark), which are used to fund extra benefits, have increased rapidly in recent years, rising to nearly $2,000 per enrollee on average in 2022. Of that amount, plans are estimated to spend an average of $480 per enrollee on extra benefits overall, including Part B premium rebates. We do not have the data to know how that amount varies across firms, and so we cannot assess specifically whether firms with larger rebates offer more or different extra benefits. It is possible that certain plans keep more of their rebate dollars for profit (subject to meeting medical loss ratio requirements) or allocate more of their rebate dollars towards a lower out-of-pocket cap or reduced cost sharing for Medicare-covered services.

The Centers for Medicare and Medicaid Services (CMS) has said that “Medicare Advantage is a critical part of CMS’ vision to advancing health equity.” The variation in extra benefits across Medicare Advantage plans may have implications for how effective private plans are in this role. Broad differences in benefits could be consistent with the goal if firms are tailoring and providing benefits, such as transportation, to those with the greatest social or medical needs. These differences could also exacerbate disparities if the extra benefits are not sufficiently focused on high-need populations. Plans are not currently required to report information on utilization or costs associated with extra benefits, nor information about the network of providers for extra benefits, in general, or for specific subgroups. Starting with plan year 2023, some cost information will be required as part of the medical loss ratio reports. However, there will continue to be no information about how utilization of extra benefits, and associated spending, varies by race/ethnicity, income, or health status, so it will remain impossible to assess whether, and the extent to which, extra benefits are having an impact on health outcomes for those with the greatest needs.

Medicare Advantage is projected to soon become the main form of Medicare coverage. Understanding the benefits offered to Medicare Advantage enrollees, how they vary across firms, and how they differ from those available to traditional Medicare beneficiaries is important for understanding how growing enrollment in Medicare Advantage plans is redefining what it means to have Medicare coverage, as well as the effects on health equity. As more beneficiaries receive their coverage through a private plan, the variation in extra benefits offered, as well as the scope and generosity of those benefits, means that Medicare coverage could look meaningfully different for different people.

This work was supported in part by Arnold Ventures. KFF maintains full editorial control over all of its policy analysis, polling, and journalism activities.

Methods

Supplemental benefits in Medicare Advantage plans were identified using the 2022 and 2023 Quarter 1 Centers for Medicare & Medicaid Services (CMS) Plan Benefit Package data. Enrollment data are from the March 2022 Monthly Enrollment by Contract/Plan/State/County published by CMS in the Medicare Advantage (MA)/Part D Contract and Enrollment Data section. Enrollment data is only provided for plan-county combinations that have at least 11 beneficiaries; thus, we exclude any plans that do not meet this enrollment threshold. We also excluded all employer plans, cost plans, Health Care Prepayment Plans (HCPP), Program of All-Inclusive Care for the Elderly (PACE) plans, and Medicare-Medicaid plans (MMP). Employer plans are not required to submit all data necessary for the analysis. The other plans removed have different enrollment requirements, and in some cases are paid differently, than traditional Medicare Advantage plans.

We do not examine all the extra benefits that Medicare Advantage plans offer. For example, we do not examine special supplemental benefits for the chronically ill. Additionally, we do not include basic telehealth services as an extra benefit in this analysis. While these telehealth services are not routinely covered by traditional Medicare (outside the COVID-19 public health emergency), since 2019 Medicare Advantage plans are permitted to include telehealth associated costs in their bids, rather than paying for them as a supplemental benefit using rebates. The vast majority of Medicare Advantage enrollees (98%) are in a plan that offers basic telehealth services.

We define a plan as offering a benefit if it is available to enrollees as either a mandatory or optional supplemental benefit. Optional supplemental benefits require an additional premium, which we do not examine in this analysis.

News Release

Fewer than Half of Employed Women Say Their Employer Offers a Paid Parental Leave or Family and Medical Leave Benefit

Women—Particularly Working Moms—Shoulder Most of the Responsibility for Caring for Sick Children

Published: Nov 16, 2022

A new KFF analysis finds that fewer than half of employed women ages 18-64 say their employer offers a paid parental leave benefit, such as maternity or paternity leave (43%) or family and medical leave (44%). Access to these workplace benefits varies widely by employment status, income, location, and level of education. Women who work full-time and have higher incomes are more likely than their part-time or low-income counterparts to say their employer offers any paid leave benefits.

During the COVID-19 pandemic, a lack of paid leave benefits has had significant implications for employed women with children, particularly mothers with low incomes. Among working parents, women continue to be the primary caregivers when their children are sick; compared to 19% of working fathers, 56% of working mothers report they are the ones to care for children when they are ill and cannot attend school. A higher share of mothers with low incomes (61%) say they are the ones to care for sick children compared to mothers with higher incomes (53%). Among working mothers who must stay home to care for sick children, 76% of those with low incomes (below 200% of the federal poverty level) report losing pay when they miss work to care for sick children, twice the share of mothers with higher incomes (38%).

These findings come from the 2022 KFF Women’s Health Survey, which examines several topics related to women’s health and well-being. The analysis is based on a nationally representative sample of 5,145 women and 1,225 men ages 18-64. The data presented are based on survey respondents’ self-identified gender as a “woman” or “man.” Non-cisgendered people are included in the survey but are not reported here because of an insufficient sample size.

Additional findings include the following:

  • Forty-nine percent of employed women with higher incomes say their employer offers paid family and medical leave compared to 33% of women with lower incomes.
  • Seventy-three percent of women who are employed full-time report that their employer offers paid sick leave, compared to 31% who work part-time.
  • The share of fathers who say they usually take care of sick children who cannot attend school has doubled in the past two years, rising from 9% in 2020 to 19% in 2022. While the share grew, more than half of mothers (56%) said they take responsibility for the children who must stay home from school because of illness.

Learn more about these 2022 Women’s Health Survey findings in the brief “Workplace Benefits and Family Health Care Responsibilities.”


Workplace Benefits and Family Health Care Responsibilities: Key Findings from the 2022 KFF Women’s Health Survey

Published: Nov 16, 2022

Issue Brief

Key Takeaways

  • Less than half of women report that their employer offers paid parental leave such as maternity or paternity leave (43%) or paid family and medical leave which can also be used to take time off to care for a seriously ill family member (44%). A considerably higher share, nearly two-thirds, of women say that their employer offers them paid sick leave (63%). Just 7% of women work for an employer that offers on-site childcare or a childcare subsidy. These estimates are consistently lower for women who work part-time, are self-employed, are low-income, or live in rural areas.
  • Among employed parents, more than half of mothers (56%) report they are the ones to care for children when they are sick and cannot attend school, compared to about a fifth of fathers (19%). A substantial share of mothers (24%) and fathers (33%) say they share responsibility with a spouse, partner, or co-parent.
  • Compared to 2020, there has been an increase in the share of men reporting that they are usually the ones to care for children when they are sick and cannot attend school, but this activity is still largely done by mothers.
  • About half of working parents say they are not paid when they take time off to care for sick kids. Three-quarters (76%) of working mothers with low incomes (below 200% of the federal poverty level) report losing pay when they miss work to care for sick children which is twice the share of those with higher incomes (38%).

Introduction

The persistent challenges that working mothers face in balancing family and work responsibilities were intensified by the COVID pandemic, which exposed the gaps in resources to address the rise in family caregiving needs, a shift to homeschooling, and the dearth of childcare options. While children are now back in the classroom and many workers have returned to offices, the pandemic has left its mark on the challenge of balancing family and workplace responsibilities, particularly for working mothers. For many working women, economic security is strongly connected to workplace benefits such as insurance coverage, paid sick leave, and paid family leave as well as their roles as mothers and the primary managers of their children’s health care.

The 2022 KFF Women’s Health Survey (KWHS) is a nationally representative survey of 5,145 women and 1,225 men ages 18-64 conducted from May 10, 2022, to June 7, 2022. Among several topics related to women’s health and well-being, we asked respondents about employment and family health care needs. This brief highlights how workplace benefits and caring for children’s health care differ by gender and among different subpopulations of women. Data presented in this brief are based on survey respondents’ self-identified gender as “woman” or “man.” We recognize that this approach excludes people who do not identify with either of these categories. We do not have sufficient survey sample size to report on people who are not cisgender. See the Methodology section for more details.

Access to Workplace Benefits

Fewer than half of employed women say their employer offers paid parental leave or paid family and medical leave. So-called “fringe benefits” such as paid leave offer financial security to workers who must balance their personal and family care needs with their work responsibilities. However, just 43% of employed women ages 18-64 say their employer offers paid parental leave and 44% say their employer offers paid family and medical leave. Many more employed women (63%) report that their employer offers paid sick leave (Figure 1).

Fewer than one in ten employed women say their employer offers on-site childcare or a childcare subsidy. As some employers seek to provide more “family-friendly” workplaces, some now offer on-site childcare for workers’ children or subsidies to workers to pay for childcare at another location. This type of benefit may help ease the transition back to work for new parents, reduce the need for extensive commuting, and provide financial support for a service that is consuming an increasing share of workers’ paychecks. However, few (7%) employed women report that their employer offers on-site childcare or a childcare subsidy (Figure 1).

Some women do not know whether their employer offers paid leave and childcare benefits. Benefits are an important component of a worker’s total compensation package, but some women do not know if their employer offers paid parental leave (18%) or paid family and medical leave (17%) (Figure 1). Knowledge of sick leave benefits is higher, with just 7% of women saying they don’t know if their employer offers this benefit. Eleven percent do not know if their employer offers on-site childcare or a childcare subsidy. Women who are employed but don’t have kids at home are more likely than those who have kids to say they don’t know if their employer offers paid family and medical leave (19% vs. 14%, respectively), paid parental leave (22% vs. 12%), and on-site childcare or a childcare subsidy (13% vs. 7%) (data not shown).

Fewer Than Half of Employed Women Say Their Employer Offers Paid Parental Leave or Paid Family and Medical Leave

Access to these workplace benefits varies widely by employment status, income, geographic location, and educational attainment. Women who work full-time, are not self-employed, and have higher incomes are more likely than their counterparts to say their employer offers any of these paid leave or childcare benefits (Table 1).

For example, approximately seven in ten women who are employed full-time (73%) and women who are not self-employed (69%) report that their employer offers paid sick leave compared to three in ten (31%) who work part-time and about two in ten (18%) who are self-employed. Half of higher-income (>= 200% FPL) employed women (49%) say their employer offers paid family and medical leave compared to one-third (33%) of women who are low-income (< 200% FPL). Employed women with a college degree (52%) are more likely than those with lower educational attainment (36%) to report working for an employer that offers paid parental leave. Four percent of employed women in rural locations work for an employer offering on-site childcare or a childcare subsidy compared to 7% of employed women in urban and suburban areas. Overall, there are fewer differences by race and ethnicity, but a slightly higher share of Black women reported working for an employer that offers paid family and medical leave or paid parental leave.

Access to Workplace Benefits Varies Widely by Employment Status and Demographic Characteristics

Impact of Children’s Health Needs on Working Parents

Among working parents, a higher share of mothers than fathers report they are the ones that care for children when they are too sick to attend school. Workplace benefits play an important role in parents’ ability to care for their family’s health care needs while meeting workplace responsibilities. When children have to miss school because they are too sick to attend, working parents must arrange care for their children. Among mothers who work outside the home, over half (56%) say they are the ones who usually take care of children who are sick and cannot go to school, about three times the share of working fathers (19%) (Figure 2). A quarter (24%) of working mothers and one-third of working fathers (33%) say they share this responsibility equally with a spouse, partner, or co-parent. Just 6% of working mothers say their spouse, partner, or co-parent usually takes on this responsibility, whereas this is the most common response among fathers (41%), nearly seven times the rate of mothers. Roughly one in ten mothers (13%) and fathers (8%) say they can call someone else for childcare or their child can stay home alone.

Among Working Parents, Mothers More Likely Than Fathers to Care for Children When They Are Too Sick to Go to School

About half of working parents report losing pay when they miss work to care for sick children who can’t go to school. When parents miss work to take care of their sick children, 53% of mothers and 49% of fathers say they are not paid for that time (Figure 3). This has a disproportionate impact on mothers, as they are more likely to be the ones caring for children when they are sick. Considering that nearly 15% of children missed more than a week of school per year due to illness or injury before the pandemic and that the CDC recommends that people stay home for at least five days if testing positive for COVID-1, when children miss school because they are sick, it can have tangible negative economic implications for many working parents, particularly women.

When Working Parents Miss Work to Care for Children Who Are Sick and Cannot Attend School, About Half Report They Are Not Paid for That Time

Mothers who have low incomes are more likely than those with higher incomes to report they usually care for children who are sick and cannot attend school as well as lose pay for this time. A larger share of mothers with low incomes (61%) say they are the ones who usually care for children when they are sick compared to mothers with higher incomes (53%) (Figure 4). Working mothers with low incomes are also less likely to report sharing the responsibility with a spouse or partner. Additionally, 76% of mothers with low incomes report losing pay when they miss work to care for sick children, twice the share of those with higher incomes (38%). As discussed earlier, fewer women who have low incomes have a paid sick leave benefit than those who have higher incomes.

A Higher Share of Mothers Who Have Low Incomes Than Those With Higher Incomes Care for Children When They Cannot Go to School AND More Lose Pay as a Result

Across demographic groups, the majority of employed mothers report that they are usually the ones to take care of kids when they are sick and cannot go to school, and some share this work with a spouse/partner. However, there are differences between groups of women workers in the economic impact of missing work to care for sick kids. A higher share of working mothers who are Black, single, or work part-time report losing pay for this time off (Figure 5). Three-quarters of part-time workers are not paid when they take time off to care for sick kids, compared to 44% of full-time workers.

Mothers Lead on Caring for Children When They Are Sick and Cannot Go to School, but Some Mothers More Likely to Lose Pay as a Result

Since 2020, the share of fathers who say they are the ones who usually care for children when they are sick and cannot attend school has risen. While mothers are much more likely to report that they are the ones who care for young children when they are sick and cannot go to school, the share of fathers who say they are usually the ones to do so has risen in the past two years. In 2022, 19% of fathers say that they usually cared for children when they are too sick to go to school, up from 9% in 2020 (Figure 6). Among mothers however, these rates remained similar between 2020 and 2022 (61% and 56% respectively). The pandemic and the impact of the spread of COVID-19 continues to keep some children out of school and has also changed many employment patterns and workplace dynamics. Many more people work from home at least some of the time, which may have also changed the distribution of childcare responsibilities in some families, with more fathers spending more time at home.

One in Five Working Fathers Say They Care for Children When They Cannot Go to School Due to Illness, Twice the Share as 2 Years Ago

Conclusion

Women comprise at least half of the nation’s workforce, and roughly seven in ten women with children under the age of 18 are in the labor force, yet the United States remains one of the few industrialized nations that does not require paid leave for health-related events including paid parental leave and sick leave. For many women, taking even a month of unpaid leave after childbirth is unaffordable and unattainable. Gaps in these benefits are larger among women who are lower income and those who work part-time.

Absent federal legislation, guaranteed paid leave (including paid sick, family and medical, and parental leave) is at the discretion of the states. In states that do not have paid leave programs or requirements, some employers offer it voluntarily, but workers who could most benefit from it are less likely to be offered these benefits.

Among parents, women continue to be the primary caregivers when their children are sick, and the pandemic has made this issue top of mind for many parents. Some employed mothers share the responsibility of caring for their sick children with their partners, and notably, in the past two years, there has been an increase in the share of fathers who say they usually take care of sick kids who cannot go to school. However, it is still working moms who carry this responsibility in many families. The increase in people working from home since the pandemic’s start could have contributed to a change in the distribution of parental health care responsibilities, but it is too early to tell whether this trend will continue in the years to come.

For many working parents who lack paid leave benefits, caring for kids because they are sick and cannot go to school comes with an economic cost, and many of these costs are borne by working women. For some women, the system is largely working though is still challenging, but for those who are in low-wage jobs or work part-time hours, caring for their family's health without workplace supports can weaken their own and their family’s financial well-being.

Methodology

Overview

The 2022 KFF Women’s Health Survey is a nationally representative survey of 6,442 people ages 18 to 64, including 5,201 females (self-reported sex at birth) and 1,241 males, conducted from May 10, 2022, to June 7, 2022. The objective of the survey is to help better understand respondents’ experiences with contraception, potential barriers to health care access, and other issues related to reproductive health. The survey was designed and analyzed by researchers at KFF (Kaiser Family Foundation) and fielded online and by telephone by SSRS using its Opinion Panel, supplemented with sample from IPSOS’s KnowledgePanel.

This work was supported in part by Arnold Ventures. KFF maintains full editorial control over all of its policy analysis, polling, and journalism activities.

Questionnaire design

KFF developed the survey instrument with SSRS feedback regarding question wording, order, clarity, and other issues pertaining to questionnaire quality. The survey was conducted in English and Spanish. The survey instrument is available upon request.

Sample design

The majority of respondents completed the survey using the SSRS Opinion Panel (n=5,202), a nationally representative probability-based panel where panel members are recruited in one of two ways: (1) through invitations mailed to respondents randomly sampled from an Address-Based Sample (ABS) provided by Marketing Systems Group through the U.S. Postal Service’s Computerized Delivery Sequence. (2) from a dual-framed random digit dial (RDD) sample provided by Marketing Systems Group.

In order to have large enough sample sizes for certain subgroups (females ages 18 to 35, particularly females in the following subgroups: lesbian/gay/bisexual; Asian; Black; Hispanic; Medicaid enrollees; low-income; and rural), an additional 1,240 surveys were conducted using the IPSOS KnowledgePanel, a nationally representative probability-based panel recruited using a stratified ABS design.

Data collection

Web Administration Procedures

The majority of surveys completed using the SSRS Opinion Panel (n=5,056) and all of the surveys completed using the KnowledgePanel (n=1,240) were self-administered web surveys. Panelists were emailed an invitation, which included a unique passcode-embedded link, to complete the survey online. In appreciation for their participation, panelists received a modest incentive in the form of a $5 or $10 electronic gift card. All respondents who did not respond to their first invitation received up to five reminder emails and panelists who had opted into receiving text messages from the SSRS Opinion Panel received text message reminders.

Overall, the median length of the web surveys was 13 minutes.

Phone Administration Procedures

In addition to the self-administered web survey, n=146 surveys were completed by telephone with SSRS Opinion Panelists who are web reluctant. Overall, the median length of the phone surveys was 28 minutes.

Data processing and integration

SSRS implemented several quality assurance procedures in data file preparation and processing. Prior to launching data collection, extensive testing of the survey was completed to ensure it was working as anticipated. After the soft launch, survey data were carefully checked for accuracy, completeness, and non-response to specific questions so that any issues could be identified and resolved prior to the full launch.

The data file programmer implemented a “data cleaning” procedure in which web survey skip patterns were created in order to ensure that all questions had the appropriate numbers of cases. This procedure involved a check of raw data by a program that consisted of instructions derived from the skip patterns designated on the questionnaire. The program confirmed that data were consistent with the definitions of codes and ranges and matched the appropriate bases of all questions. The SSRS team also reviewed preliminary SPSS files and conducted an independent check of all created variables to ensure that all variables were accurately constructed.

As a standard practice, quality checks were incorporated into the survey. Quality control checks for this study included a review of “speeders,” reviewing the internal response rate (number of questions answered divided by the number of questions asked) and open-ended questions. Among all respondents, the vast majority (97%) answered 96% or more of the survey questions they received, with no one completing less than 91% of the administered survey (respondents were informed at the start of the survey that they could skip any question).

Weighting

The data were weighted to represent U.S. adults ages 18 to 64. The data include oversamples of females ages 18 to 35 and females ages 36 to 64. Due to this oversampling, the data were classified into three subgroups: females 18 to 35, females 36 to 64, and males 18 to 64. The weighting consisted of two stages: 1) application of base weights and 2) calibration to population parameters. Each subgroup was calibrated separately, then the groups were put into their proper proportions relative to their size in the population.

Calibration to Population Benchmarks

The sample was balanced to match estimates of each of the three subgroups (females ages 18 to 35, females ages 36 to 64, and males ages 18 to 64) along the following dimensions: age; education (less than a high school graduate, high school graduate, some college, four-year college or more); region (Northeast, Midwest, South, West); and race/ethnicity (White non-Hispanic, Black non-Hispanic, Hispanic-born in U.S., Hispanic-born Outside the U.S., Asian non-Hispanic, Other non-Hispanic). The sample was weighted within race (White, non-Hispanic; Black, non-Hispanic; Hispanic; and Asian) to match population estimates. Benchmark distributions were derived from 2021 Current Population Survey (CPS) data.

Weighting summaries for females ages 18 to 35, females ages 36 to 64, and males ages 18 to 64 are available upon request.

Finally, the three weights were combined, and a final adjustment was made to match the groups to their proper proportions relative to their size in the population (Table 1).

Combined Weights, Sex by Age

Margin of Sampling Error

The margin of sampling error, including the design effect for subgroups, is presented in Table 2 below. It is important to remember that the sampling fluctuations captured in the margin of error are only one possible source of error in a survey estimate and there may be other unmeasured error in this or any other survey.

Design Effects and Margins of Error by Demographic Group

KFF Analysis

Researchers at KFF conducted further data analysis using the R survey package, including creating constructed variables, running additional testing for statistical significance, and coding responses to open-ended questions. The survey instrument is available upon request.

Rounding and sample sizes

Some figures in the report do not sum to totals due to rounding. Although overall totals are statistically valid, some breakdowns may not be available due to limited sample sizes or cell sizes. Where the unweighted sample size is less than 100 or where observations are less than 10, figures include the notation “NSD” (Not Sufficient Data).

Statistical significance

All statistical tests are performed at the .05 confidence level. Statistical tests for a given subgroup are tested against the reference group (Ref.) unless otherwise indicated. For example, White is the standard reference for race/ethnicity comparisons and private insurance is the standard reference for types of insurance coverage. Some breakouts by subsets have a large standard error, meaning that sometimes even large differences between estimates are not statistically different.

A note about sex and gender language

Our survey asked respondents which sex they were assigned at birth, on their original birth certificate (male or female). They were then asked what their current gender is (man, woman, transgender, non-binary, or other). Those who identified as transgender men are coded as men and transgender women are coded as women. While we attempted to be as inclusive as possible and recognize the importance of better understanding the health of non-cisgendered people, as is common in many nationally representative surveys, we did not have a sufficient sample size (n >= 100) to report gender breakouts other than men and women with confidence that they reflect the larger non-cisgender population as a whole. The data in our reproductive health reports use the respondent’s sex assigned at birth (inclusive of all genders) to account for reproductive health needs/capacity (e.g., ever been pregnant) while the data in our other survey reports use the respondent’s gender.

News Release

KFF’s Kaiser Health News Investigates Private Equity’s Stealth Takeover of Health Care in the United States

Published: Nov 14, 2022

A new investigation by KFF’s Kaiser Health News (KHN) lays bare the sizeable efforts by private equity investors to take over large and lucrative parts of the U.S health care system in recent years. KHN found that private equity firms have invested nearly $1 trillion through thousands of deals to acquire hospitals and specialized medical practices during the last decade alone.

The deals, many of them unnoticed by federal regulators, typically result in a ratcheting up of providers’ pursuit of profits – and higher prices for patients, lawsuits, and complaints about quality of care.

The investments range widely and include the acquisitions of physician practices, dental clinic management companies, companies that treat autism, drug addiction and other behavioral health care, and ancillary services such as diagnostic and urine testing labs and software for medical billing. Through other deals, companies tied to private equity have come to dominate specialized medical services such as dermatology, gastroenterology, and anesthesiology in certain markets around the country. All of it has come on top of better-publicized takeovers of hospital emergency room staffing firms as well as the buying up of entire rural hospital systems.

Federal regulators have been almost blind to the incursion. KHN found that more than 90 percent of private equity takeovers or investments fell below the $100 million threshold that triggers an antitrust review by the Federal Trade Commission and the Justice Department.

Whistleblowers and injured patients, however, have turned to the courts to press allegations of misconduct or other improper business dealings. KHN found that companies owned or managed by private equity have agreed to pay fines of more than $500 million since 2014 to settle at least 34 lawsuits filed under the False Claims Act. Most of the time, the private equity owners have avoided liability.

The latest story, published today in USA Today, is part of a broader ongoing series, “Patients for Profit: How Private Equity Hijacked Health Care” in which KHN has examined a wide range of private equity’s forays into the health care system. They include the marketing of America’s top-selling abortion pill, the establishment of “obstetric emergency departments” at some hospitals, investments in the booming hospice care industry and even takeovers of funeral homes and cemeteries. The series includes a video primer, “How Private Equity Is Investing in Health Care”.

KHN collaborates with many editorial partners, and media outlets can publish these and other KHN stories at no charge. KHN also will publish the stories on kffhealthnews.org and promote them through its social media platforms. KHN journalists also are available for interviews about their stories. News organizations interested in working with KHN should contact the news service at KHNPartnerships@kff.org, and those interested in helping to expand and improve health journalism around the country should contact KFF at healthjournalism@kff.org.

About KFF and KHN

KHN (Kaiser Health News) is a national newsroom that produces in-depth journalism about health issues. Together with Policy Analysis, Polling and Survey Research and Social Impact Media, KHN is one of the four major operating programs at KFF (Kaiser Family Foundation). KFF is an endowed nonprofit organization providing information on health issues to the nation.