News Release

Benchmark Survey: Annual Family Premiums for Employer Coverage Rise 7% to Nearly $24,000 in 2023; Workers Contribute $6,575 on Average Now, But Potentially More Soon

Amid Changing Abortion Laws, 1-in-10 Large Firms Say Their Largest Plan Doesn’t Cover Legally Provided Abortions Under Any Circumstances

Published: Oct 18, 2023

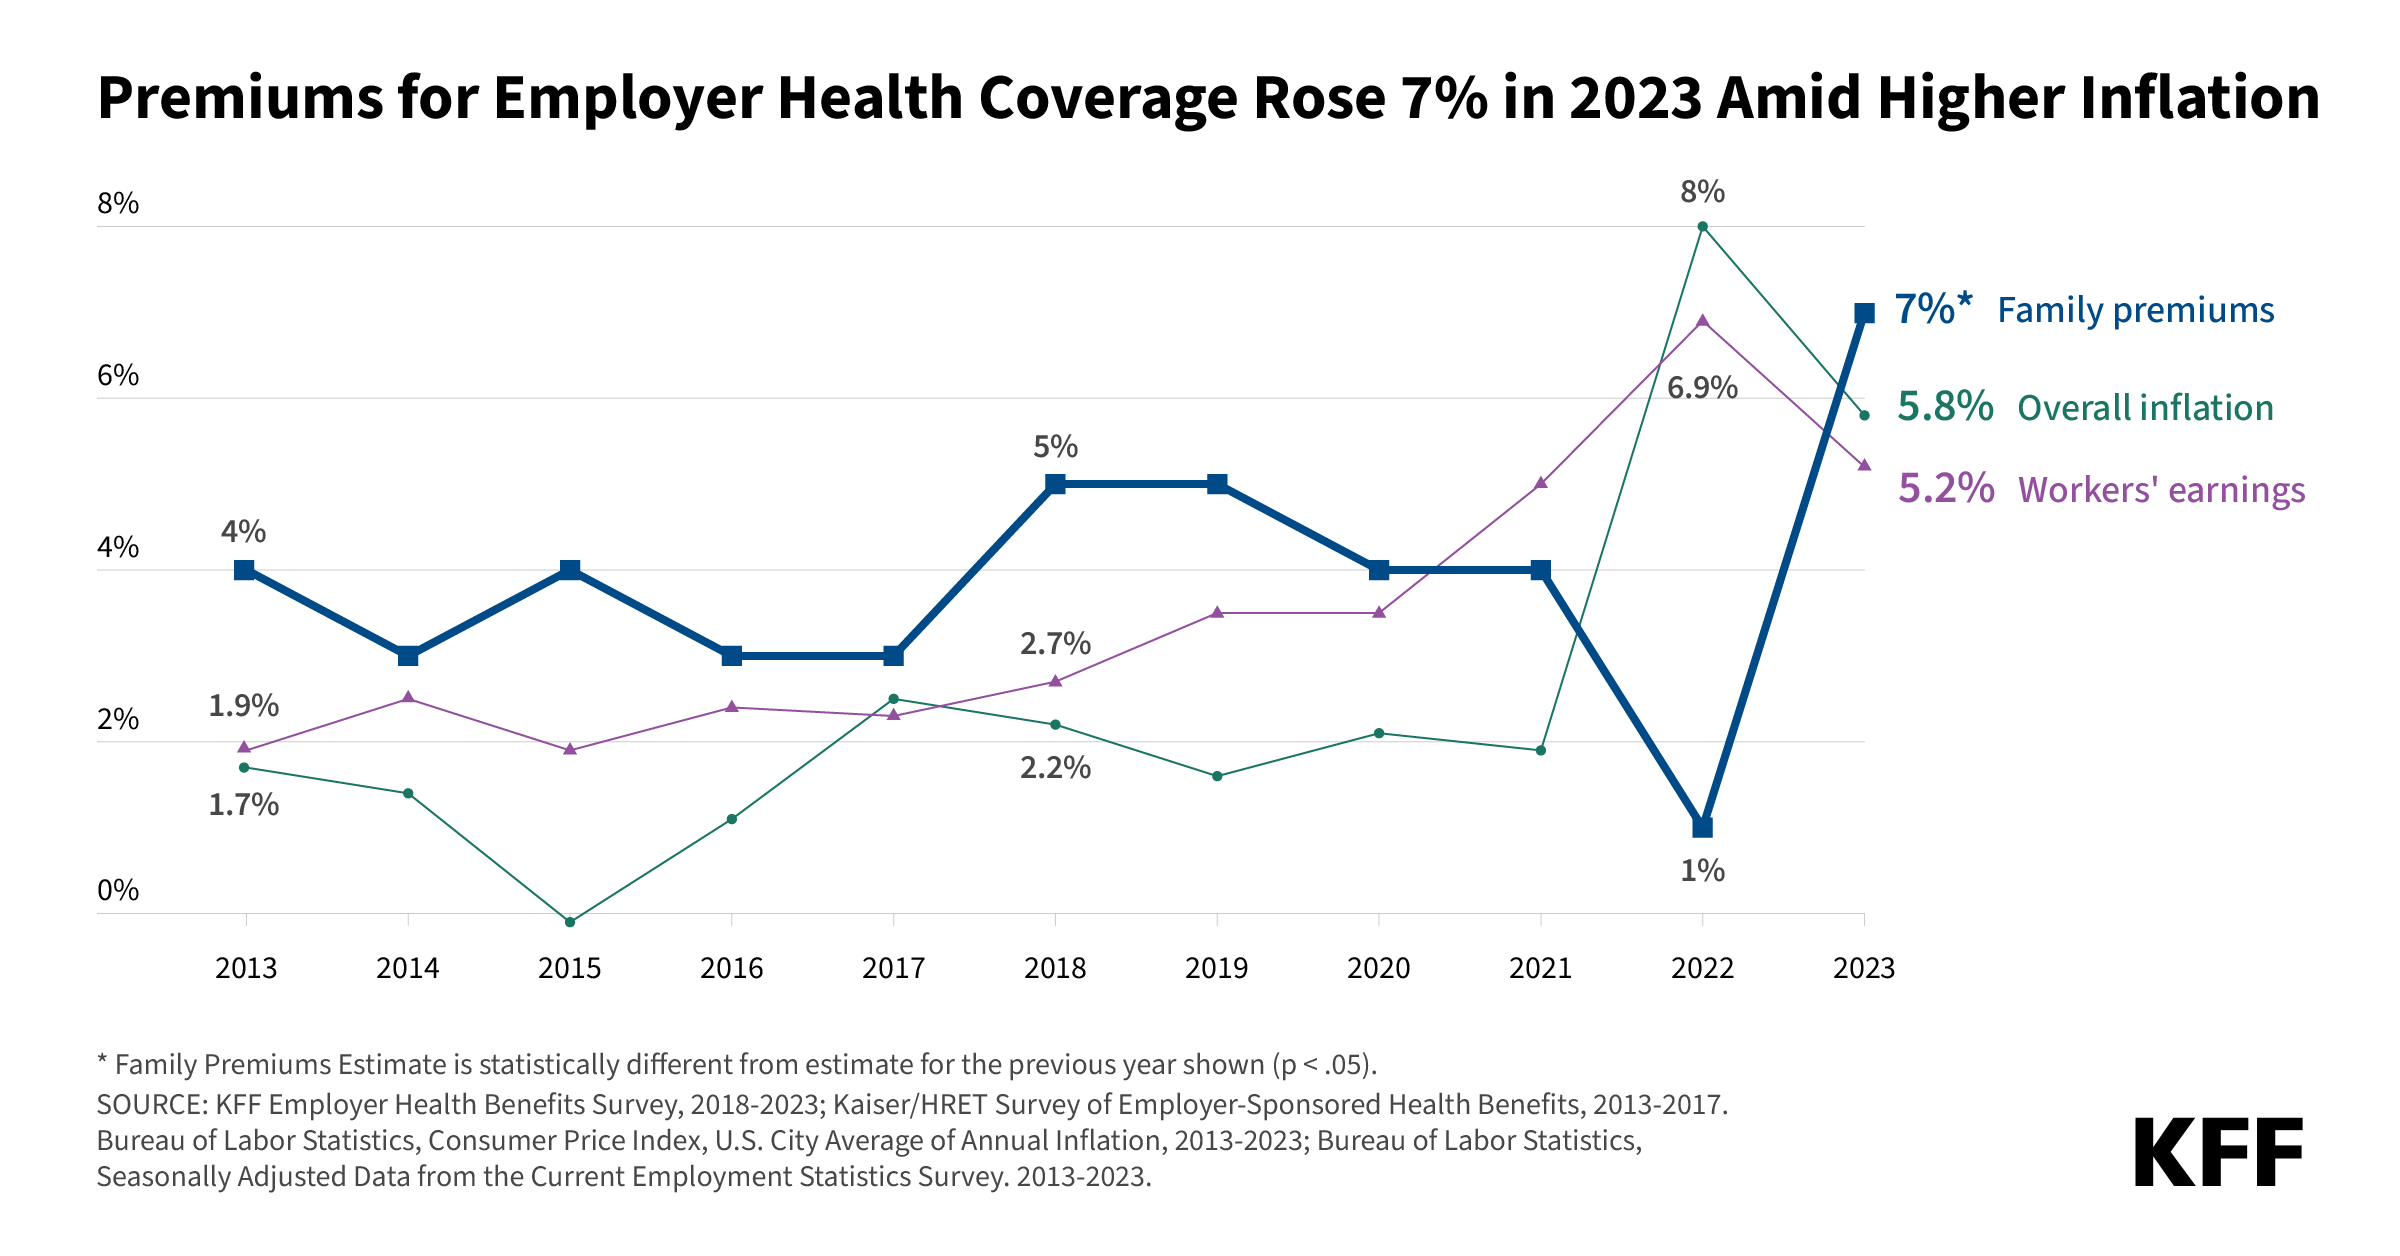
Amid rising inflation, annual family premiums for employer-sponsored health insurance climbed 7% on average this year to reach $23,968, a sharp departure from virtually no growth in premiums last year, the 2023 benchmark KFF Employer Health Benefits Survey finds.

On average, workers this year contribute $6,575 annually toward the cost of family premium, up nearly $500 from 2022, with employers paying the rest. Future increases may be on the horizon, as nearly a quarter (23%) of employers say they will increase workers’ contributions in the next two years.

Workers at firms with fewer than 200 workers on average contribute nearly $2,500 more toward family premiums than those at larger firms ($8,334 vs. $5,889). In fact, a quarter of covered workers at small firms pay at least $12,000 annually in premiums for family coverage.

This year’s 7% increase in average premiums is similar to the year-over-year rise in workers’ wages (5.2%) and inflation (5.8%). Over the past five years, premiums rose 22%, in line with wages (27%) and inflation (21%).

Among workers who face an annual deductible for single coverage, the average this year stands at $1,735, similar to last year. The average deductible amount has increased 10% over the last five years and 53% over the last ten years.  Workers at small firms (under 200 workers) on average face much larger deductibles than workers at larger firms ($2,434 vs. $1,478).

The modest rise in deductibles may reflect employers’ perceptions about the burden of cost-sharing on workers.  More than half (58%) of employers say that their workers have at least a moderate level of concern about the affordability of their plan’s cost-sharing requirements.  

“Rising employer health care premiums have resumed their nasty ways, a reminder that while the nation has made great progress expanding coverage, people continue to struggle with medical bills, and overall the nation has no strategy on health costs,” KFF President and CEO Drew Altman said.

Almost 153 million Americans rely on employer-sponsored coverage, and the 25th annual survey of more than 2,100 small and large employers provides a detailed picture of the trends affecting it. In addition to the full report and summary of findings released today, the journal Health Affairs is publishing an article with select findings online. The article will also appear in its November issue.

Some Large Firms Do Not Cover Legal Abortions; Others Do But with Restrictions

In the wake of the Supreme Court’s June 2022 decision that ended the federal constitutional right to abortion, states have adopted a range of new laws to prohibit or severely restrict access to abortion, creating challenges for large employers with workers in multiple states.

Among all large firms (with at least 200 workers), one in ten (10%) say that their largest plan does not cover legal abortions under any circumstances. An additional 18% say they only cover legal abortions under limited circumstances, such as in cases involving rape, incest, or health or life endangerment.

In contrast, nearly a third (32%) of large firms say they cover legal abortions in most or all circumstances. Another four in ten (40%) say they were unsure of their plan’s abortion coverage, potentially because their policies were in flux or they were unaware of the details.

With abortion banned or severely limited in some states, 7% of large employers say that they provide, or plan to provide, financial assistance for travel expenses for enrollees who have to go out of state to obtain a legal abortion. Very large employers (with at least 5,000 workers) are most likely to provide, or plan to provide, such travel reimbursements (19%).

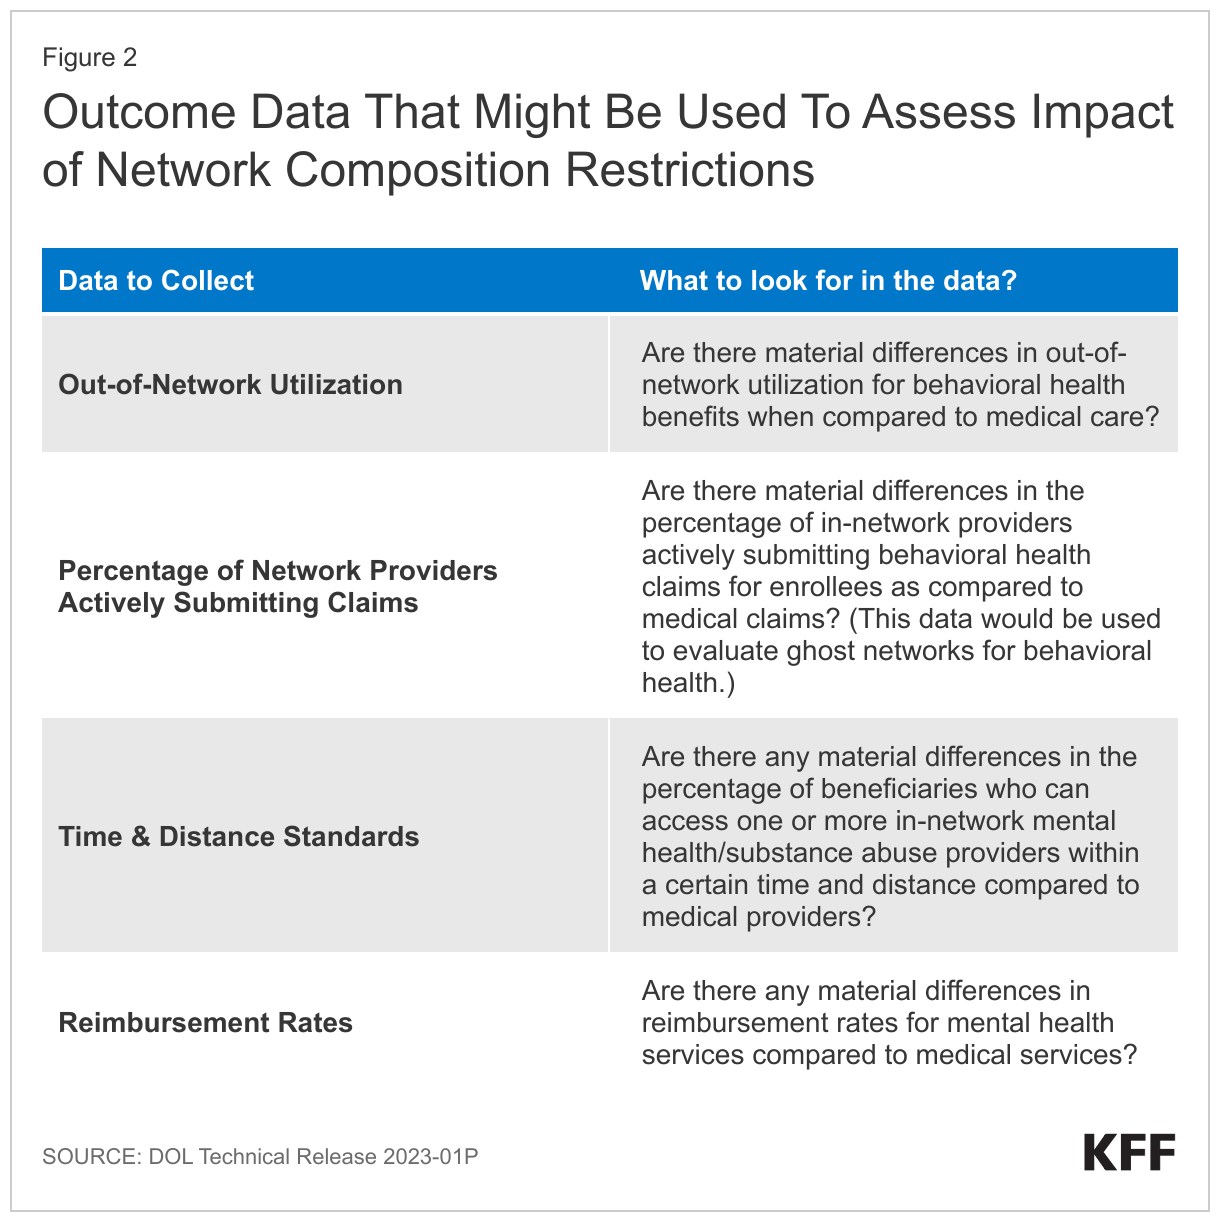
Concerns Persist About Adequacy of Mental Health and Substance Use Networks

Among large employers (with at least 200 workers) that offer health benefits to at least some workers, the vast majority (88%) say their plan has enough primary care doctors to provide timely access for enrollees. Substantially fewer say the same about their mental health (59%) and substance use condition (58%) networks.

Nearly one in five (18%) of large offering firms say that they took steps in the past year to increase the number of mental health providers in their largest plan’s network. This includes 44% of the largest employers (with at least 5,000 workers).

On the other hand, one in five (21%) of large offering employers say their plan has limits on the number of covered mental health services, potentially restricting access for enrollees with long-term needs.

“For several years now, the survey has shown that many large employers do not believe that their networks have enough mental health providers to provide timely access to care. In 2023, many large employers, including nearly half of the largest employers, say that they are taking steps to better meet enrollees’ needs,” said Gary Claxton, a KFF senior vice president and director of the Health Care Marketplace Project, the lead author of the study and also of the Health Affairs article.

Other findings include: 

  • Offer rate. Nearly all employers with at least 200 workers offer health benefits to at least some workers, though smaller firms are increasingly less likely to offer health benefits as they get smaller. For example, 83% of firms with 10 to 199 employees offer health benefits to at least some of their workers, while just 42% of firms with three to nine workers do so.
  • Dental, vision and long-term care insurance. Among firms offering health benefits, most also offer separate dental coverage (91%) – double the share that did so in 2010 (46%). Most also offer vision (82%) insurance, also up sharply since 2010 (17%). Fewer offer long-term care insurance (26%).
  • Coverage for gender-affirming surgery. Among employers with at least 200 workers, 23% cover gender-affirming survey in their largest health plan. More than a third (37%) say they do not cover such surgeries, while a large share (40%) are not sure about such coverage. Among the largest firms (at least 5,000 workers), nearly two thirds (62%) cover gender-affirming surgery, many of which expanded the benefit in the past two years.
  • Centers of Excellence. About one in five (19%) offering employers with at least 200 workers say their plan includes a “center of excellence” program for specific services, either limiting enrollees to a narrower group or providers or offering lower cost-sharing for doing so. Among these firms, 22% have introduced a new center of excellence program within the last two years. Among firms with a center of excellence program, 45% had a program for joint replacement, 42% for back or spine surgery, 31% for bariatric surgery, 30% for mental health, and 28% for substance use disorders.

Methodology

KFF conducted the annual employer survey between January and July of 2023. It included 2,133 randomly selected, non-federal public and private firms with three or more employees that responded to the full survey. An additional 2,759 firms responded to a single question about offering coverage. For more information on the survey methodology, see the Survey Design and Methods Section.

ABOUT KFF:

KFF is the independent source for health policy research, polling and news.

ABOUT HEALTH AFFAIRS:

Health Affairs is the leading peer-reviewed journal at the intersection of health, health care, and policy. Published monthly by Project HOPE, the journal is available in print and online. Late-breaking content is also found through healthaffairs.org, Health Affairs Today, and Health Affairs Sunday Update.

Project HOPE is a global health and humanitarian relief organization that places power in the hands of local health care workers to save lives across the globe. Project HOPE has published Health Affairs since 1981.

Six Months into the Medicaid Unwinding: What Do the Data Show and What Questions Remain?

Authors: Robin Rudowitz, Jennifer Tolbert, Bradley Corallo, Patrick Drake, and Sophia Moreno
Published: Oct 17, 2023

Six months into the unwinding of the Medicaid continuous enrollment provision, KFF tracking shows states are reporting outcomes for over 28 million renewals, accounting for three in ten people who were enrolled as of March 2023 when continuous enrollment ended. This policy watch examines the latest data and key questions as the unwinding continues to unfold.

What do the data show?

Nationally, states have reported renewal outcomes for three in ten of all people who were enrolled in Medicaid in March 2023 and for whom states will need to redetermine eligibility during the unwinding period. KFF tracking shows that, to date, an estimated 16.0 million people have had their coverage renewed, representing 17% of all Medicaid enrollees who were enrolled at the start of the unwinding period and 8.8 million or 9% of all Medicaid enrollees have been disenrolled (Figure 1).

To date, states have reported renewal outcomes for three in ten people who were enrolled in Medicaid/CHIP prior to the start of the unwinding.

States started the unwinding in different months contributing to significant variation in where they are in the process of renewing coverage for all enrollees. The data show significant variation across states in the share of renewals they have processed, ranging from 69% in Arkansas to 10% in Massachusetts (Arkansas announced in early October that, as required by state law, it had completed renewals for all enrollees whose coverage had been extended because of the continuous enrollment provision but that leaves 31% of enrollees who still need to undergo a redetermination) (Figure 2). Although some of this variation is because of limited available data on renewal outcomes for some states, it also reflects that some states began processing renewals earlier than others. While some states began disenrollments in April or May, the majority of states did not start disenrolling people until June or July, including a number of states with a large share of Medicaid enrollees (like California, Illinois, New York, and Texas). But, even among states that resumed disenrollments in the same month, the pace of processing renewals differs. Some states are processing renewals more rapidly, while other states are starting more slowly and are processing fewer renewals in the first few months of unwinding.

Cumulative Medicaid Renewal Outcomes Reported as a Share of March 2023 Medicaid/CHIP Enrollment

The variation in the share of people being disenrolled across states reflects differences in both timing as well as state approaches to the unwinding. Some states have prioritized renewals of individuals they had flagged as likely ineligible. While this factor alone does not explain all the variation, it may contribute to higher disenrollment rates early in the process for some states. Another factor is how states have responded to high procedural disenrollment rates (a procedural disenrollment occurs when a renewal could not be completed to confirm ongoing eligibility). Nationally, nearly three in four of all disenrollments are due to procedural reasons. States adopted a range of strategies to help reduce procedural disenrollments and some states have paused procedural disenrollments for one or more months, while others have extended deadlines for enrollees to respond to renewal notices, which has slowed the timeframe for making final eligibility determinations in these states. KFF and other national estimates from last year anticipated an overall disenrollment rate of about 18% nationally, but also expected significant variation across states.

What questions remain?

How will mitigation strategies to address unwinding problems affect the overall pace of completing renewals and the number of people renewed and disenrolled in the months ahead? On September 21 CMS announced that 30 states would need to reinstate coverage for about 500,000 individuals (mostly children) who were erroneously disenrolled due to an issue in processing ex parte renewals. These states are also required to pause procedural disenrollments for individuals who may be affected by the problem until a mitigation strategy is in place. It is unclear how reinstatements of coverage will affect the overall numbers of renewals and disenrollments states have reported, but it is clear that pausing procedural disenrollments will affect the pace of unwinding going forward. CMS has already acknowledged that the process of completing redeterminations of all Medicaid enrollees may take longer than the anticipated 14 months, at least in some states.

What will unwinding mean for overall Medicaid enrollment? While data on disenrollments during the unwinding period tell part of the story, the net change to Medicaid enrollment will differ because total enrollment changes reflect not just people who are disenrolled but also people newly enrolling in the program as well as some people who reenroll after losing Medicaid, a process often referred to a “churn.” Consequently, monitoring overall Medicaid enrollment data and trends in conjunction with the data on unwinding renewal outcomes will provide a more complete picture of the effect of unwinding on Medicaid enrollment nationally and at the state level.

What will unwinding mean for broader coverage trends? There is also limited data about transitions in coverage and how the unwinding will affect the number of people who are uninsured. In September, data for 2022 showed the national uninsured rate had dropped to 7.9%, the lowest level on record. While the unwinding is likely to contribute to increases in the number of people who are uninsured and the uninsured rate, it is unclear what the magnitude of that increase will be. Federal survey data will not be available to understand these trends until at least one year after the unwinding period ends, and surveys that rely on self-reported health insurance status have significantly undercounted Medicaid enrollment. In the meantime, state and national administrative data on Medicaid and Marketplace enrollment can help to inform what is happening with coverage. While the data lag by several months, national Medicaid and CHIP enrollment data from June 2023 show that total enrollment declined by 1.6%, or 1.5 million people, compared to March 2023, the month in which Medicaid continuous enrollment ended. During the same time period, just over 400,000 people previously enrolled in Medicaid newly enrolled in Marketplace or Basic Health Plan coverage.

Understanding Medicaid Ex Parte Renewals During the Unwinding

Authors: Bradley Corallo and Jennifer Tolbert
Published: Oct 2, 2023

As states unwind the Medicaid continuous enrollment provision, they must comply with federal renewal requirements, including the requirement to conduct ex parte or automated renewals. Ex parte renewals can help to reduce administrative burdens for state eligibility workers and enrollees. Ex parte can also help to address longstanding issues with Medicaid enrollees losing coverage at renewal despite still being eligible by simplifying the process and eliminating the need for enrollees to complete and return a renewal form. States have taken steps to increase the share of ex parte renewals; however, with heightened focus on state renewal policies and procedures, the Centers for Medicare and Medicaid Services (CMS) identified a problem that led to hundreds of thousands of enrollees, many of whom are children, being inappropriately disenrolled from Medicaid. This policy watch explains what ex parte renewals are, examines variation in ex parte renewal rates across states, and discusses current issues as well as actions states are taking to increase ex parte rates.

What are ex parte renewals and how do ex parte renewal rates differ across states?

When conducting a renewal, states are required to first attempt an automated, or ex parte, renewal by checking data available to the state to verify eligibility before requesting enrollees complete a renewal form. States have access to several databases that can be used to verify eligibility. For example, to check financial eligibility requirements, states can access a state wage or tax database, information from other means-tested programs like the Supplemental Nutrition Assistance Program (SNAP), or federal data from the Internal Revenue Service (IRS). Ex parte renewals lessen the administrative burden on both enrollees and Medicaid staff by reducing the amount of paperwork that must be completed and processed. Strong ex parte processes also lower the risk of eligible people losing Medicaid if they do not receive or otherwise do not complete renewal paperwork (also known as procedural disenrollments).

Ex parte rates vary widely across states (Figure 1). Among individuals who have had their coverage renewed to date during the continuous enrollment provision unwinding process, 55% of people had their coverage renewed automatically via ex parte renewal. However, ex parte rates vary widely, ranging from 99% in North Carolina to 3% in Wyoming. Several factors contribute to differences in ex parte rates across states, including which data sources states use in ex parte reviews and the process states establish for reviewing data from multiple sources. Also, some states lack the system capability to conduct ex parte renewals for certain populations, particularly for Medicaid enrollees who qualify based on age or disability and have more complex criteria for determining eligibility.

Overall, 55% of people who retained Medicaid coverage were renewed through ex parte processes, as of October 2, 2023

What are current issues with ex parte renewals?

The focus on state renewal processes during the unwinding period has shed light on longstanding challenges with ex parte renewals. According to a recent report from the Medicaid and CHIP Payment and Access Commission (MACPAC), states face challenges conducting ex parte renewals related to the data sources they can access as well as competing priorities and resource constraints that delay needed systems upgrades. In addition, as noted above, some populations, particularly those that require verification of assets or functional assessments, can be more difficult to renew on an ex parte basis. While these challenges are not new, new reporting requirements have made data on ex parte rates available and led to greater scrutiny of state ex parte renewal processes.

Most states have adopted new policies or flexibilities to increase the number of ex parte renewals. Leading up to the start of the unwinding period, states implemented policies to increase ex parte rates, such as adding new data sources to their ex parte processes. Nevertheless, as of March 31, 2023, about half of states (26) were out of compliance with federal rules and were not conducting ex parte renewals for at least some enrollees. In most cases, states were not conducting ex parte renewals for some or all enrollees who qualify based on disability or age. CMS required these states to implement mitigation plans while making system fixes that would eventually bring the states into full compliance. In addition, nearly all states (47) have adopted 1902(e)(14)(A) waivers made available by CMS during the unwinding period to streamline ex parte renewals, and in some cases were used as mitigation strategies.

In September 2023, federal officials announced that 30 states had been incorrectly processing ex parte renewals. Federal rules require states to process ex parte renewals at the individual level and not the household level. However, if these states were not able to renew everyone in the household via ex parte, the states were sending renewal forms to all family members and then disenrolling everyone if the forms were not returned, even if the states had information to renew coverage for some family members, most often children. Income eligibility thresholds for children are generally higher than for adults. In total, states estimated that roughly 500,000 people were inappropriately disenrolled. States with this issue are required to pause additional procedural disenrollments until a mitigation plan is put in place and must reinstate coverage for affected individuals. While it is unclear how long the process will take, states are working quickly to reinstate coverage. Several states, including Nevada and Virginia, announced they have already reinstated coverage.

Despite recent challenges with ex parte renewals, steps taken by states to increase ex parte renewals will likely have a lasting effect on renewal processes and promote continuity of coverage for eligible Medicaid enrollees. Although most states have so far been identified as out of compliance with federal rules (either because they were not conducting ex parte renewals for all enrollees or because they were not processing ex parte renewals at the individual level), it is possible additional issues will be uncovered. There is also room for improvement in many states, particularly those with low ex parte rates, even in states meeting federal requirements. Many states have used the unwinding as an opportunity to implement new strategies for increasing ex parte rates, which may improve Medicaid renewal long-term, particularly if some temporary flexibilities like waivers prove effective and are extended beyond the unwinding or are made permanent.

News Release

KFF Health News, NPR, and CBS News Win Loeb Award for Series on Medical Debt in America

Published: Sep 29, 2023

KFF Health News won the 2023 Loeb Award in the personal finance and consumer reporting category for its in-depth coverage of consumer medical debt in its “Diagnosis: Debt” series.

In partnership with NPR and CBS News, KFF Health News examined the stories behind the more than 100 million people in America who have been pushed into debt by the nation’s health care system, revealing the epidemic of medical debt that has become a defining feature of the American system. In personal stories, “Diagnosis: Debt” documented the suffering and sacrifices this burden forces on patients and their families.

“This series is a great example of our people-focused health policy journalism, and part of our long-standing focus on how health care costs impact people’s lives which we continue to pursue across our research, polling, and journalism programs.” said KFF President and CEO Dr. Drew Altman, who is founding Publisher of KFF Health News.

“Diagnosis: Debt” was a project led by Noam N. Levey, a senior correspondent at KFF Health News, and his editor, Kelly Johnson, and included work by Aneri Pattani, a correspondent at KFF Health News; Yuki Noguchi, a correspondent on the Science Desk at NPR; Anna Werner, a consumer investigative national correspondent for CBS News; Juweek Adolphe, a web developer and designer; Bram Sable-Smith, a Midwest correspondent at KFF Health News; Megan Kalata, a writer at KFF Health News; Terry Byrne, copy chief at KFF Health News; and Lydia Zuraw, a producer at KFF Health News.

KFF’s recent work in this area include its “Survey of Consumer Experiences with Health Insurance,” which found that four-in-10 insured adults say they skipped or delayed some type of care in the past year due to cost. Other analyses include “The Burden of Medical Debt in the United States,” which found that roughly 23 million people owe more than $250 in health costs – as well as “Americans’ Challenges with Health Care Costs” and “Could Consumer Assistance Be Helpful to People Facing Medical Debt?” The ongoing Bill of the Month series by KFF Health News conducted with NPR and CBS also highlights consumers’ experiences with medical bills. 

The Loeb Awards, established in 1957 and considered the most prestigious honor in business and financial journalism, are administered by The G. and R. Loeb Foundation Inc. and the University of California at Los Angeles’s Anderson School of Management. This is KFF Health News’ fourth Loeb Award.

KFF Health News was also recognized earlier this year by the National Institute for Health Care Management (NIHCM) Foundation in its 2023 Awards in Journalism and Research for the series. “Diagnosis: Debt” won first place in the digital media category, which included more than 70 entries from news organizations, including The Washington Post, ProPublica, and NBC News. 

About KFF and KFF Health NewsKFF is the independent source for health policy research, polling, and journalism. Our mission is to serve as a nonpartisan source of information for policymakers, the media, the health policy community, and the public.

KFF Health News is a national newsroom that produces in-depth journalism about health issues and is one of the core operating programs at KFF. Other major KFF programs include Policy Analysis; KFF Polling and Survey Research; and KFF Social Impact Media, which conducts specialized public health information campaigns. A new program on health Misinformation and Trust is under development. 

About KFF Health News’ Partnership with NPR and CBS NewsThe reporting in “Diagnosis: Debt” was done in partnership with NPR and CBS News to explore the scale, impact, and causes of medical debt in America. Reporters from KFF Health News and NPR conducted hundreds of interviews with patients, physicians, health industry leaders, consumer advocates, and others.

Proposed Mental Health Parity Rule Signals New Focus on Outcome Data as Tool to Assess Compliance

Published: Sep 29, 2023

New proposed updates to the regulations under the Mental Health Parity and Addiction Equity Act (MHPAEA) seek to strengthen the law’s implementation by employer plan sponsors and insurers in the group and individual insurance market. If finalized as proposed, it would establish a new three-part framework for plans and insurers (collectively, “plans”) to show that certain treatment limits on behavioral health coverage comply with the parity law. The proposal would require plans to apply a new mathematical test to determine whether certain limits on behavioral health coverage are no more restrictive than limits on medical coverage. In addition, plans have to document that the “processes, strategies, evidentiary standards and other factors” used to design and apply specific limits on behavioral health are comparable and not more stringent than those used to design and apply limits on medical benefits. The third part of the framework would require plans to take affirmative steps to collect, evaluate and analyze specific types of “outcome data.” This is data designed to show the impact of certain restrictions on coverage (such as prior authorization rules and provider networks limitations) that apply to both behavioral health and medical care. Disparities in this data that show more restrictive limits on behavioral health than medical care would serve as an indicator of a possible violation of parity and trigger requirements on plans to take action to address the problem.

The focus on use of data analysis for compliance and enforcement represents an effort to look beyond just written plan descriptions of coverage, provider directories, and insurer marketing materials to see how coverage works in practice—for example, how claims are actually processed and evaluated, the results of that process, and how these affect insured individuals.

Background

Setting up a mechanism in MHPAEA rules to easily compare behavioral health coverage to medical coverage has been difficult, especially when comparing limits on coverage beyond cost sharing amounts, where it is relatively simple to evaluate parity. Much agency guidance has focused on how to compare so-called nonquantitative treatment limits (NQTLs), such as prior authorization, for behavioral health coverage to those for medical care. The Consolidated Appropriations Act (CAA) of 2021 requires plans and issuers to document that all NQTLs on behavioral health benefits meet parity standards through a written “comparative analysis” submitted to federal or state authorities upon request (and—for some plans—to consumers upon request).

The agencies are looking to revamp ways to measure compliance with parity—and make the required comparative analysis more useful—by requiring plans to conduct quantitative analyses of certain coverage features, including ways to measure the impact of NQTLs on actual consumer access to behavioral health care.

The recent KFF Survey of Consumer Experiences with Health Insurance found 17% of insured adults indicated that even with health coverage, they did not get mental health care that they thought they needed in the past year. Of these individuals, more than 4 in 10 (44%) indicated that one of the reasons they did not get needed mental health care was that they could not afford the cost. Additionally, about a third of insured adults who did not get needed mental health services in the past year say their insurance not covering the services was a reason they did not get the care.

Many Adults Who Did Not Get Needed Mental Health Services Say Cost Or Lack Of Coverage Were Reasons They Did Not Get Care

A recent Peterson-KFF Health System Tracker study also highlighted the affordability burden. That study looked at commercial claims data from a sample of large employer plans and found that enrollees treated for depression and/or anxiety pay a larger share out-of-pocket for mental health services than for other services.

How are the agencies proposing to use outcome data for mental health parity?

Insurers and group health plans would be required to collect and evaluate data deemed relevant to assess the impact of the use of each NQTL on access to behavioral health care versus medical care. The agencies would specify in future guidance the type of data, as well as the form and manner of collection. At a minimum all plans would collect data on “the number and percentage of claim denials” as part of its review and assessment of each NQTL.

If analysis of the data shows material differences in access to behavioral health treatment when compared to medical, the agencies will consider this a strong indicator that there is a violation of the parity law. Plans would then need to take “reasonable action” to mitigate these material differences to avoid violating the parity law. The CAA-required comparative analysis would have to include the data results and actions taken to address the material difference (actions might include increased reimbursement of providers or enhanced use of behavioral telehealth). The agencies seek information about how to define “material difference” in a tangible quantitative manner using statistical tools.

An exception applies for the use of independent professional medical or clinical standards. Plans can avoid having to do this outcome analysis for an NQTL, if it “impartially” applies independent professional medical or clinical standards when designing and applying an NQTL. Plans sometimes use clinical criteria that they develop internally to make decisions about whether a service or medication is medically necessary and covered by insurance. Challengers to use of certain internal criteria claim that the criteria are inconsistent with generally accepted standards of care, create a financial conflict of interest for a plan or are not transparent to patients. This rule might give plans an incentive to use independently developed clinical criteria to avoid having to conduct an outcome analysis.

Special rules would apply to NQTLs that affect network composition. The agencies note a particular concern about NQTLs that limit access to in-network behavioral health providers and subject these to a higher level of scrutiny than all other NQTLs. The agencies note studies that indicate lower provider reimbursement rates and higher levels of use of out-of-network providers for behavioral health services when compared to medical. Where outcomes data show disparities in access to in-network behavioral care when compared to in- network medical care, the plan would automatically violate the parity law under the new proposed rule. The DOL issued Technical Release 2023-01P that requests comment on four types of data it might collect as relevant outcomes data for NQTLs that involve network composition.

Outcome Data That Might Be Used To Assess Impact of Network Composition Restrictions

What are the key issues to watch?

The proposal’s data-informed approach to compliance would essentially require all plans to take action to audit the possible impact of certain coverage limits on behavioral health if they want to continue to use those limits. Some states have started approaches that go beyond disclosure of outcome data upon request but instead involve ongoing plan reporting of similar metrics such as claim denials, though those requirements do not extend to self-insured employer plans as the federal regulations would.

The parity proposal would for the first time specifically require private self-insured employers to review and document the status of their behavioral health networks. These plans would also have to disclose, upon request, claim denial information.

Expect questions on what data is a good indicator or benchmark for spotting a potential parity violation. The cost, complexity, and value of plans having to collect and evaluate this data are also issues for consideration, as well as the relative legal responsibilities of insurers and employers to know how their coverage is working on the ground. Enhanced enforcement of these rules will continue to be the focus as some advocates point to plan use of medical management techniques to improperly deny behavioral health claims, while plans point to provider shortages beyond their control as limiting access to behavioral health care.

This work was supported in part by a grant from the Robert Wood Johnson Foundation. KFF maintains full editorial control over all of its policy analysis, polling, and journalism activities.

Consumer Survey Highlights Problems with Denied Health Insurance Claims

Authors: Karen Pollitz, Kaye Pestaina, Lunna Lopes, Rayna Wallace, and Justin Lo
Published: Sep 29, 2023

Introduction

A KFF survey of adults with health insurance found that roughly 6 in 10 insured adults experience problems when they use their insurance. Problems studied include denied claims, network adequacy issues, preauthorization delays and denials, and others. The survey also explored how often consumers can successfully resolve health insurance problems when they arrive and the consequences of insurance problems. This Data Note takes a closer look at insured adults who said that in the past year, insurance did not pay for care that they received and thought was covered, which we will refer to as “denied claim.”

People with private insurance are more likely to have denied claims than people with public coverage

The KFF Survey of Consumer Experiences with Health Insurance found that 18% of insured adults say they experienced denied claims in the past year. This problem was somewhat more common among people with employer-sponsored insurance (21%) and marketplace insurance (20%), less so among people with Medicare (10%) or Medicaid (12%).

Denied Claims Were Somewhat More Common Among Those With Employer-Sponsored or Marketplace Insurance

People who use more health services are also more likely to experience denied claims. Among high utilizers – patients who had more than 10 provider visits in the past year – 27% experienced a denied claim, while similar shares of moderate utilizers – who had 3-10 visits in a year – experienced a denied claim (21%).  By contrast, smaller shares of patients who had fewer than 3 provider visits in a year experienced a denied claim (14%).

Percent of Insured Adults Who Say In the Past 12 Months Their Health Insurance Did Not Pay For Care They Received, That They Thought Was Covered

About one in five insured adults who used emergency room services (22%) or mental health services (22%) say they had a denied claim, though there is no way to tell from the survey if the denials were for claims related to these specific services. Finally, people who identify as LGBT are nearly twice as likely to experience denied claims compared to other consumers (30% vs. 17%).

People with denied claims report more difficulty understanding coverage

Difficulty understanding aspects of their health coverage was reported more often among consumers who experienced denied claims compared to others. A majority of consumers who experienced denied claims report difficulty understanding what their health insurance covers (65%), what they’ll owe out of pocket (57%), and their EOBs (52%). It is not clear whether these challenges understanding coverage contribute to claims being denied, or whether denied claims compound the confusion consumers otherwise experience understanding their coverage.

People With Denied Claims Had More Difficulty Understanding Coverage

Consumers with denied claims were more likely to experience other types of insurance problems

Consumers who experienced denied claims were much more likely to have also encountered other problems using their coverage in the past year. On average, insured adults with denied claims experienced about 4 different types of insurance problem in a year. Compared to insured adults who did not experience denied claims, those who did were at least twice as likely to have experienced other insurance problems asked about in the survey (such as reaching the limit on covered services, not being able to find or access an in-network provider including a mental health provider, and prior authorization problems).

Consumers With Denied Claims Were More Likely to Experience Other Types of Insurance Problems

Consumers often cannot resolve problems satisfactorily

Among insured adults who report insurance problems in the past year, half (50%) say the biggest problem they had with their insurance was solved to their satisfaction. The survey did not ask consumers to specify which of their insurance problems was the “biggest.” However, consumers whose problems included a denied claim were half as likely to say their biggest problem was resolved satisfactorily compared to those whose problems did not include a denied claim (29% vs 59%), suggesting that denied claims may be especially challenging for consumers to solve on their own, though it may not be for lack of trying.

Consumers Whose Problems Did Not Include a Denied Claim Were More Likely To Resolve Their Biggest Insurance Problem

About eight in ten (84%) consumers with denied claims took some action to try to resolve the biggest problem they had with their insurance – such as calling the insurance company or asking their doctor or a friend or family member for help – and 15% filed a formal appeal.

Even so, like insured consumers overall, most of those who experienced denied claims do not know whether they have appeal rights (69%) or what government agency to call for help (86%).

The Affordable Care Act established Consumer Assistance Programs (CAPs) whose duties include helping consumers answer insurance questions, resolve insurance problems, and file appeals.  By law, private insurance plan denial statements must include a notice with contact information for the CAP (if one is available) and indicating this program can help consumers file an appeal. Only 3% of adults who experienced insurance problems said they contacted a CAP for help, though 79% of all insured adults said they would be at least somewhat likely to seek help from a CAP for help with insurance problems.   

Serious health and financial consequences can result from insurance problems, including denied claims

The survey asked insured adults about the consequences of their insurance problems – whether needed care was delayed or not received, health status declined, and/or out-of-pocket costs increased. Because some people with denied claims also experienced multiple other types of insurance problems in the same year, there is no way to link consequences to a single type of problem. However, comparing consequences for adults whose problems did or did not include denied claims, those with denied claims were about twice as likely to have problems in the past year accessing care or to have health status decline, and more than three times as likely to have unexpectedly higher out-of-pocket costs.

Consumers Whose Problems Included Denied Claims More Often Experience Serious Consequences

Discussion

Nearly 1 in 5 insured adults (18%) said they experienced a denied claim in the past year.  Among people who use the most health care, 27% experienced a denied claim. Claims denials appear to be connected to the complexity of insurance for consumers; while half of all insured adults find some aspect of insurance difficult to understand, among those who experience claims denials it is nearly 8 in 10. In addition, consumers whose problems include a denied claim are far less likely to have resolved their biggest insurance problem satisfactorily compared to those whose problems do not include denied claims.  Serious health and financial consequences arise as a direct result of insurance problems, and consumers whose problems include denied claims are far more likely to have needed care delayed or denied, to experience a decline in health status, and to face higher out-of-pocket costs.

Most consumers with denied claims (69%) do not know that they have appeal rights, and the vast majority (85%) do not file formal appeals. Appeal rights vary depending on the type of coverage as do rules or filing appeals and the process can be complicated. Strategies to simplify the appeals process and make consumer notices about how to appeal more prominent and easy to understand might help. Even so, because people who need to appeal health insurance decisions will most often be those who use a lot of health services – and who may be too sick to advocate effectively for themselves – assistance navigating the insurance claims and appeals process is also important.

Congress authorized establishment of Consumer Assistance Programs (CAPs) to help people resolve their insurance problems and file appeals, though consumers with denied claims rarely call on CAPs for help.  Connecticut recently implemented a requirement on health insurers to place a prominent, plain-language notice about CAP assistance on the front page of all health insurance denials, which has led to an increase in case referrals to that office. About eight in ten insured adults (79%) say they would likely call on such a program for help with insurance problems. CAPs do not exist in all states, however, and Congress has not appropriated funds for CAPs since 2010.

The KFF survey cannot tell how often claims denials are incorrect, or the extent to which consumer difficulties understanding the complexity of health coverage may contribute to denials. Increased oversight could help supply this information.  A federal law requiring private plans to disclose data on denied claims remains largely unimplemented. Such data could be an important tool to monitor trends and differences in denial rates, and to hold insurers accountable to meet legal standards, such as requirements to provide mental health parity and coverage for surprise medical bills.

This work was supported in part by a grant from the Robert Wood Johnson Foundation. The views and analysis contained here do not necessarily reflect the views of the Foundation. KFF maintains full editorial control over all of its policy analysis, polling, and journalism activities.

Consumer Problems with Prior Authorization: Evidence from KFF Survey

Authors: Karen Pollitz, Kaye Pestaina, Lunna Lopes, Rayna Wallace, and Justin Lo
Published: Sep 29, 2023

Introduction

A KFF survey of adults with health insurance found that roughly 6 in 10 insured adults experience problems when they use their insurance. Problems examined include denied claims, network adequacy issues, preauthorization delays and denials, and others. This Data Note takes a closer look at insured adults who said that in the past year, their health insurance denied or delayed prior approval for a treatment, service, visit or drug before they received it, which we will refer to as “prior authorization” problems. A separate Data Note looks at survey findings specific to the denial of health insurance claims.

Characteristics of consumers who experience prior authorization problems

The survey found that 16% of all insured adults in the past year experienced prior authorization problems; and consumers with certain characteristics are more likely to encounter such problems:

Enrolled in Medicaid: About one in four (22%) adults insured under Medicaid experienced prior authorization problems in the past year, compared to 11% with Medicare, and 15% with employer sponsored coverage.

Use more health care services: Among adults who had more than 10 physician visits in the past year, 31% experienced prior authorization problems. This compares to smaller shares of moderate users of health services (3-10 visits) and low users (2 or fewer visits), who experienced prior authorization problems at rates of roughly 20% and 10%, respectively.

In addition, consumers with certain health conditions or who use certain types of health services are more likely to experience prior authorization problems; although importantly, survey data cannot identify whether prior authorization was applied specifically to these conditions and services:

Mental health conditions: 26% of people who sought treatment for or took prescription medication for a mental health condition in the past year (e.g., depression, anxiety) experienced prior authorization problems in the past year, compared to 13% of insured adults who did not seek mental health treatment.

Diabetes: 23% of insured adults who sought treatment or took prescription medication for diabetes experienced prior authorization problems in the past year, compared to 14% of other insured adults.

Prescription drugs: 19% of adults who currently take at least one prescription medication experienced prior authorization problems, compared to 8% of those who do not take prescription medication.

Emergency services: Insured adults who received health care in an emergency room in the past year were about twice as likely to have experienced prior authorization problems, compared to those who did not use the ER (25% vs. 13%). Federal law prohibits private plans from requiring prior authorization for emergency services.

Characteristics of Consumers Who Reported Prior Authorization Problems

Consumers with prior authorization problems tend to experience other insurance problems

Consumers who experienced prior authorization problems were much more likely to have also encountered other problems using their coverage.

In addition to prior authorization, the survey asked about specific types of health insurance problems, such as reaching the limit on covered services, not being able to find or access an in-network provider,  and denied claims. Insured adults overall said they experienced an average of 1.5 different types of insurance problems in the past year, while those who had prior authorization problems experienced about 4 different types of problems, on average. Only 9% of people with prior authorization problems said this was the only type of problem they experienced in the past 12 months.

Consumers With Prior Authorization Problems Also Tend to Experience Other Insurance Problems

Health and financial consequences when insurance problems include prior authorization

The survey asked people whether their insurance problems directly resulted in adverse outcomes such as delayed or denied access to needed care, a decline in health status, or having to pay higher out-of-pocket costs.  Because people often reported experiencing multiple problems, the data cannot associate specific types of insurance problems with specific consequences. However, people whose problems included prior authorization were far more likely to experience serious health and financial consequences compared to people whose problems did not include prior authorization.

People whose problems include prior authorization were about 3 times more likely to report being unable to receive medical care or treatment recommended by a medical provider as a direct result of their health insurance problems compared to those whose problems did not include prior authorization (34% vs 10%), and about 3 times more likely to report significant delays in receiving medical care or treatment as a direct result of their problems (32% vs 11%). In addition, people whose problems included prior authorization were about twice as likely to say their health declined as a direct result. (26% v 11%). Finally, more than a third (37%) whose problems included prior authorization said they had to pay more out of pocket for care.

Consumers Whose Insurance Problems Include Prior Authorization Are More Likely To Experience Serious Consequences

Discussion

Prior authorization is a tool intended to control spending and promote cost-effective care. While there is no way to tell from the survey whether or not prior authorization denials were clinically appropriate, one-quarter of adults whose insurance problems included prior authorization problems said their health status declined as a direct result of problems they had with their health insurance, while one-third said access to needed care was delayed or denied, and more than one-third said it resulted in higher out-of-pocket costs. Other studies indicate concerns about the use of prior authorization by health plans.

Survey results suggest that prior authorization problems are more prevalent among insured adults with certain characteristics.  The more health services people use in a year, the more likely they are to encounter prior authorization problems.  Such problems also are experienced disproportionately by people diagnosed with certain conditions, including about 1 in 4 insured adults who sought treatment for diabetes (23%) and mental health disorders (26%).  Prior authorization problems also arise more often among people who use certain services, including emergency services (25%) and prescription drugs (19%).  Importantly, the survey data do not identify which services or conditions were the subject of prior authorization requirements.

Current law authorizes federal regulators to collect from private health plans and make publicly available data on which services are subject to prior authorization and how often it is granted or denied.  However, this law remains largely unimplemented, with only partial data on certain in-network services collected from some Affordable Care Act marketplace plans.  Recent proposed federal regulations related to compliance with the Mental Health Parity and Addition Equity Act (MHPAEA) would require private health plans to internally collect and evaluate data on whether certain practices, including prior authorization requirements, are being used comparably for behavioral health and medical/surgical benefits. Such data would not be readily transparent to the public as plans would only be required to report data or results to the Secretary or to certain plan beneficiaries upon request.

With respect to public coverage, Medicare enrollees experience the lowest rate of prior authorization problems (11%). However, a recent Inspector General audit of this practice in Medicare Advantage (MA) plans found 13% of prior authorization denials were for benefits that should otherwise have been covered under Medicare. (Traditional Medicare generally does not use prior authorization). The Inspector General recommended Medicare should take a closer look at the appropriateness of criteria used by MA plans in making coverage determinations. This year CMS finalized new standards for prior authorization and coverage decisions in Medicare Advantage plans.

Nearly one in four adults insured under the Medicaid program say they experienced a prior authorization problem (22%). A recent report by the Inspector General of the Department of Health and Human Services reviewed data on more than 17 million prior authorization request to Medicaid managed care organizations (MCOs) and found more than 2 million had been denied. It also found substantial variation in denial rates across parent firms of MCOs, ranging from 7% to 41%. The IG recommended stronger state monitoring of denials and automatic external medical reviews when such denials are appealed (which happens infrequently). The Biden Administration has proposed new regulations around prior authorization that would apply to Medicaid and other coverage types. These rules focus mostly on streamlining processes and reducing approval wait times and have not yet been finalized.

A range of state regulatory actions have also focused on prior authorization practices. New state laws or updates to existing ones have passed in states such as Georgia, Illinois, Washington state, Arkansas and Texas. State requirements include: new reporting on prior authorization standards and claims denials, shortened time frames for decision-making, allowing providers to bypass prior authorization to limit delays (e.g. “gold carding”), and restrictions on the use of clinical criteria developed by insurers to make coverage decisions. While states have the authority to regulate insured plans purchased by employers or individuals, they lack authority to regulate self-insured employer plans, which cover the majority of those with health benefits through a job.

This work was supported in part by a grant from the Robert Wood Johnson Foundation. The views and analysis contained here do not necessarily reflect the views of the Foundation. KFF maintains full editorial control over all of its policy analysis, polling, and journalism activities.

House Approves the FY 2024 State and Foreign Operations (SFOPs) Appropriations Bill

Published: Sep 28, 2023

The House approved its FY 2024 State, Foreign Operations, and Related Programs (SFOPs) appropriations bill on September 28, 2023 (the House Committee on Appropriations released the bill on June 22, 2023 and accompanying report on July 11, 2023). The SFOPs bill includes funding for U.S. global health programs at the State Department and the U.S. Agency for International Development (USAID). Funding for these programs, through the Global Health Programs (GHP) account, which represents the bulk of global health assistance, totaled $10 billion, a decrease of $542 million (-5%) below the FY 2023 enacted level and $909 million (-8%) below President Biden’s FY 2024 request. All of the decrease is due to reduced funding in the bill for both family planning and reproductive health (FP/RH) and global health security (GHS); all other global health areas either remained flat or increased compared to the FY 2023 enacted levels and the President’s FY 2024 Request.

Policy provisions in the bill include the Helms amendment (see the KFF fact sheet here) and the expanded Mexico City Policy that was put in place by President Trump and rescinded by President Biden (see the KFF explainer here). The bill also prohibits funding to the United Nations Population Fund (UNFPA) and the World Health Organization (WHO). Also, as part of the Manager’s Amendment adopted on July 12, 2023 by the full House Committee on Appropriations, the bill extends PEPFAR’s expiring provisions for one more year (see the KFF brief here). See the table below (downloadable version here) for additional detail. See other budget summaries and the KFF budget tracker for details on historical annual appropriations for global health programs.

Table: KFF Analysis of Global Health Funding in the FY24 House State, Foreign Operations, and Related Programs (SFOPs)Appropriations Bill
Department / Agency / AreaFY23 Omnibus(millions)FY24 Request(millions)FY24Housei(millions)Difference:FY24 House – FY23 OmnibusDifference: FY24 House – FY24 Request
State, Foreign Operations, and Related Programs (SFOPs) – Global Healthii
HIV/AIDSiii –$4,700.0 – – –
Global Health Programs (GHP) account$4,725.0$4,700.0$4,725.0$0(0%)$25(0.5%)
State Department$4,395.0$4,370.0$4,395.0$0(0%)$25(0.6%)
USAID$330.0$330.0$330.0$0(0%)$0(0%)
of which Microbicides$45.0$45.0Not specified – –
Economic Support Fund (ESF) accountNot specified$0.0Not specified – –
Global Fund$2,000.0$2,000.0$2,000.0$0 (0%)$0 (0%)
Tuberculosisiii –$358.5 – – –
Global Health Programs (GHP) account$394.5$358.5$394.5$0(0%)$36(10%)
Economic Support Fund (ESF) accountNot specified$0.0Not specified – –
Malaria$795.0$780.0$800.0$5(0.6%)$20(2.6%)
Maternal & Child Health (MCH)iii –$1,082.5 – – –
Global Health Programs (GHP) account$910.0$910.0$910.0$0(0%)$0(0%)
of which Gavi$290.0$300.0$300.0$10(3.4%)$0(0%)
of which Polio$85.0$85.0$85.0$0(0%)$0(0%)
United Nations Children’s Fund (UNICEF)$142.0$145.0Not specified – –
Economic Support Fund (ESF) accountNot specified$27.0Not specified – –
of which PolioNot specified$0.0Not specified – –
Assistance for Europe, Eurasia, and Central Asia (AEECA) accountNot specified$0.5Not specified – –
Nutritioniii –$164.8 – – –
Global Health Programs (GHP) account$160.0$160.0$172.5$12.5(7.8%)$12.5(7.8%)
Economic Support Fund (ESF) accountNot specified$4.0Not specified – –
Assistance for Europe, Eurasia, and Central Asia (AEECA) accountNot specified$0.8Not specified – –
Family Planning & Reproductive Health (FP/RH)iii, iv, v$607.5$677.2$461.0$-146.5(-24.1%)$-216.2(-31.9%)
Bilateral FP/RHiv, v$575.0$619.7$461.0$-114(-19.8%)$-158.7(-25.6%)
Global Health Programs (GHP)  accountiv$524.0$600.0Not specified – –
Economic Support Fund (ESF) accountiv$51.1$19.3Not specified – –
Assistance for Europe, Eurasia, and Central Asia (AEECA) accountviNot specified$0.4Not specified – –
United Nations Population Fund (UNFPA)vii$32.5$57.5$0.0$-32.5(-100%)$-57.5(-100%)
Vulnerable Children$30.0$30.0$32.5$2.5(8.3%)$2.5(8.3%)
Neglected Tropical Diseases (NTDs)$114.5$114.5$114.5$0(0%)$0(0%)
Global Health Securityiii, v –$1,260.3 – – –
Global Health Programs (GHP) account$900.0$1,245.0Not specified – –
State Departmentviii$500.0Not specified – –
of which Pandemic Fund$500.0Not specified – –
USAID$900.0$745.0Not specified – –
of which bilateralNot specified$435.0Not specified – –
of which multilateralNot specified$220.0Not specified – –
of which the Coalition for Epidemic Preparedness Innovations (CEPI)ix$100.0Not specified$100.0$0(0%) –
of which Emergency Reserve Fundx$90.0x – –
Economic Support Fund (ESF) accountNot specified$13.3Not specified – –
Assistance for Europe, Eurasia, and Central Asia (AEECA) accountNot specified$2.0Not specified – –
Emergency Reserve Fundxxx – –
Health Reserve Fundxi$8.0$10.0Not specified – –
Global Health Worker InitiativeNot specified$20.0Not specified – –
SFOPs Total (GHP account only)$10,561.0$10,928.0$10,018.7$-542.2(-5.1%)$-909.3(-8.3%)
Notes:
i – The FY24 House bill text states that up to $200 million of the funds approrpiated by this Act through various accounts “may be made available to combat such infectious disease of public health emergency.”
ii – Unless otherwise specified, funding amounts listed under the “State, Foreign Operations, and Related Programs (SFOPs) – Global Health” heading are provided through the Global Health Programs (GHP) account.
iii – Some HIV, tuberculosis, MCH, nutrition, family planning and reproductive health, and global health security funding is provided under the ESF and AEECA accounts, which is not earmarked by Congress in the annual appropriations bills and is determined at the agency level.
iv – The FY23 Omnibus bills states that “not less than $575,000,000 should be made available for family planning/reproductive health.” The FY24 House bill text states that “of the funds appropriated by this Act, not more than $461,000,000 may be made available for family planning/reproductive health.”
v – The explanatory statement accompanying the House FY24 SFOPs appropriations bill does not provide specific funding amounts for FPRH or GHS under the GHP account. After the funding amounts specified for all other areas (e.g., HIV, TB, MCH, etc.) are removed, $869.71 million remains under the GHP account at USAID, which is funding that could be used for FPRH and GHS (or other areas as determined by the Administration). Since the House FY24 bill text states that “of the funds appropriated by this Act, not more than $461,000,000 may be made available for family planning/reproductive health” without specifying an account, it is possible the Administration could fund all or a portion of this amount through the GHP account with the remainder directed to GHS (or other areas as determined by the Administration).
vi – It is possible additional funding for FPRH might be provided through the AEECA account in FY23, but these amounts, if any, will not be available until late 2024.
vii – The FY23 Omnibus bills state that if this funding is not provided to UNFPA it “shall be transferred to the ‘Global Health Programs’ account and shall be made available for family planning, maternal, and reproductive health activities.”
viii – The FY24 Request states that this amount is for the Pandemic Fund to “strengthen global health security and pandemic preparedness and help make the world safer from infectious disease threats.”
ix – The explanatory statement accompanying the House FY24 SFOPs appropriations bill directs that $50 million in unobligated balances from previous fiscal years should be made available to CEPI in addition to the $100m provided through the bill matching the FY23 enacted level.
x – The FY23 Omnibus bill states that “up to $90,000,000 of the funds made available under the heading ‘Global Health Programs’ may be made available for the Emergency Reserve Fund.” The FY24 Request includes funding for the Emergency Reserve Fund under Global Health Security. The FY24 House bill states that “up to $50,000,000 of the funds appropriated by this Act under the heading ‘Global Health Programs’ may be made available for the Emergency Reserve Fund.”
xi – The explanatory statement accompanying the FY23 Omnibus states that these funds are “to support cross-cutting health activities, including health service delivery, the health workforce, health information systems, access to essential medicines, health systems financing, and governance, in challenging environments and countries in crisis.” The FY24 Request states that these funds are to “support cross-cutting global health activities in challenging environments or countries emerging from crisis. It will provide flexible, no year funding to ensure basic health services are accessible to those most in need and to build more resilient health services and systems. Activities will focus on six key areas: support for health service delivery, the global health workforce, health information systems, access to essential medicines, health systems financing, and governance.”

What Do Medicaid Unwinding Data by Race and Ethnicity Show?

Authors: Sophia Moreno, Patrick Drake, and Jennifer Tolbert
Published: Sep 28, 2023

During the unwinding of the pandemic continuous enrollment provision in Medicaid, states are required to report monthly data on renewal outcomes. While these required data are valuable for tracking how many people are renewed and disenrolled, they lack the detail required to assess renewal outcomes for different populations. Additional demographic data can shed light on who is losing coverage, which can help to identify areas for potential outreach, assistance, or systems solutions to address issues that may be disproportionately affecting certain groups. Because people of color are more likely to be covered by Medicaid, there has been particular interest in the effects of unwinding by race and ethnicity. While data on renewals by race and ethnicity are limited, this policy watch examines which states are posting data and presents findings on disenrollment patterns by race and ethnicity based on available data.

As of September 2023, nine states are reporting data that allow for analysis of disenrollment patterns by race and ethnicity. Five states (Arizona, California, Indiana, Minnesota, and Oregon) provide data on disenrollment rates by race and ethnicity. Four states (Nevada, Oklahoma, Virginia, and Washington) report the distribution of disenrollments by race and ethnicity that can be compared to the distribution of overall Medicaid enrollment in each state by race and ethnicity. An additional two states (New York and North Dakota) provide data on redeterminations that have been completed by race and ethnicity but do not break out the share of people who were disenrolled or had their coverage renewed, preventing analysis of disenrollment patterns by race and ethnicity. In addition to differences in the metrics states are reporting, the number of months of reported data differ across states, as does data quality, with the share of data with unknown or not reported race and ethnicity ranging from 7% in Oklahoma and Washington to 37% in Oregon. Higher shares of data with unknown race and ethnicity can affect the validity of the findings. States also vary in their racial and ethnic classifications, and while all states report data for Hispanic people, some states report Hispanic and non-Hispanic ethnicity separately from race.

States Reporting Medicaid Disenrollment Data by Race/Ethnicity and Type of Data Reported

Across the five states reporting disenrollment rates by race and ethnicity, there are not large differences in disenrollment rates by race and ethnicity. Although the overall disenrollment rates vary from 12% in Oregon to 51% in Arizona, within states, the disenrollment rates for people of color are similar to those of White people (Figure 2). (Note: Arizona reports data for its COVID override population—enrollees who were flagged as potentially no longer eligible.) Overall, there are no consistent trends across states that point to disparities for certain groups of color. However, in some states, some groups have higher rates of disenrollment compared to their White counterparts. For example, in Minnesota, disenrollment rates for AIAN, Black, and Hispanic enrollees are higher than those for White and non-Hispanic enrollees.

Medicaid Disenrollment Rates by Race and Ethnicity

In the four states that are reporting the distribution of disenrollments, the racial and ethnic composition of people losing coverage generally mirrors that of the overall Medicaid population. The share of disenrollments people of color make up varies across states from 36% in Oklahoma to 64% in Nevada, reflecting state differences in the overall share of Medicaid enrollees who are people of color. In general, the share of disenrollments for people of color is within one or two percentage points of their share of total Medicaid enrollment, suggesting that they are not being disproportionately disenrolled (Figure 3). For example, in Oklahoma, people of color account for 36% of disenrollments and represent 35% of total Medicaid enrollment. However, in Virginia, people of color are less likely to be disenrolled than White people; people of color comprise 46% of total Medicaid enrollment but account for only 41% of total disenrollments.

Distribution of Medicaid Disenrollments and Overall Medicaid Enrollment by Race and Ethnicity in Oklahoma

While available data on Medicaid disenrollments by race/ethnicity suggest people of color are not at greater risk of being disenrolled, the data reported to date are limited, and the experiences of people of color in the reporting states may not be similar to those of people in non-reporting states. Compared to the national average, these states have a higher share of Medicaid enrollees who are people of color, including a higher share of Hispanic people but a lower share of Black people. Data from a larger number of states, including more states in the South and Midwest, would provide a more complete picture of disenrollment patterns by race and ethnicity and would show whether some groups are being disenrolled at disproportionate rates. In addition, more standardization of reporting of race and ethnicity data would allow for better comparisons of disenrollment patterns across states.

Continued monitoring of disenrollment data, including by race and ethnicity, will be important to identify shifts in current trends and other potential issues. While states are not required to report demographic data on Medicaid renewal outcomes during the unwinding period, these data provide valuable insights into who is losing coverage and whether certain groups are at greater risk of being disenrolled, both within and across states. This information can help focus outreach efforts where needed or suggest strategies to address disparate impacts. In the absence of state reporting during the unwinding period, Medicaid claims data and survey data that could provide similar information will not be available for years. Overall, 60% of Medicaid enrollees are people of color, and the large number of disenrollments to date, particularly procedural disenrollments, has led to millions of people of color losing Medicaid coverage. Consequently, the unwinding of the Medicaid continuous enrollment provision is likely to have a greater impact on changes in health coverage for people of color, which, in turn, has important implications for their ability to access care and their health outcomes.

Trans People in the U.S.: Identities, Demographics, and Wellbeing

Published: Sep 28, 2023

The recently released KFF/Washington Post Trans Survey, the most in-depth, representative survey of transgender adults living in the U.S., was aimed at providing a deeper understanding of trans people’s experiences in the U.S. over the life span including during childhood, through gender transition, and present wellbeing. Building on that report, and using the survey data, this analysis provides the most comprehensive representative profile of trans Americans ever complied, while also offering insights on their experiences in the health care system. While some federal surveys include a representative share of trans people, demographic questions tend to be fairly general and do not allow for more in depth analysis of the experiences and identities of trans people, particularly related to health access. At a time when issues around LGBTQ rights, including in health care, are at the forefront of national conversations, understanding trans people’s experiences and wellbeing is especially timely.

The survey included interviews with 515 trans and gender non-conforming individuals and a comparison sample of 823 cisgender adults. Trans adults include those who identify as transgender or as a trans adult; cisgender (non-trans) adults include those do not identify as trans and their gender is the same as their sex assigned at birth. For more information about sampling and method of recruitment, see the methodology section in the full report.

Identities

Gender Identity. Gender identity is based on one’s intrinsic sense of who they are, be that male, female, transgender, non-binary, or some other identity. When one’s gender identity aligns with their sex assigned at birth they are considered cisgender. When one’s gender identity does not align with sex assigned at birth, they are often described as being transgender, though many people use other terms to describe themselves, including being gender nonconforming or nonbinary, among others.

When asked how they think of themselves, a plurality of trans adults identify as non-binary (40%), with about one in five identifying as trans women (22%) or gender non-conforming (22%), and a smaller share identifying as trans men (12%). Others say they identify in some other way (2%). Some use one term and others use multiple terms. Those who described themselves in “some other way” commonly described themselves as agender or genderfluid when asked to specify. Those aged 18 to 34 are more likely to identify as non-binary than those aged 35 or older (47% v 32%).

When Asked to Describe Themselves, Trans People Are More Likely to Say They Are Non-binary Than a Trans Man or Woman

Sex assigned at birth. Sex assigned at birth differs from gender identity because it is based on phenotypic sex characteristics and is the sex stated on an individual’s birth certificate. It may or may not align with gender identity. Trans and non-trans adults are equally likely to have been assigned either male or female at birth.

Trans and Non-trans Adults Have Similar Sexes Assigned at Birth

Sexual orientation. Sexual orientation is separate from sex assigned at birth (being biologically male, female, or intersex) and gender identity (which is based on an internal sense of being such as being cisgender or transgender, among other identities). Sexual orientation refers to the gender or genders someone experiences sexual, emotional, or romantic attraction or attachment to. Heterosexual/straight, lesbian, gay, bisexual, and queer are examples of sexual orientations. Most (70%) trans adults considered themselves to be lesbian, gay, bisexual or queer while just 8% of non-trans adults did so. However, three in ten (29%) trans adults do not identify as lesbian, gay, bisexual, or queer.

The Majority of Trans Adults Consider Themselves to Be Gay, Lesbian, Bisexual, or Queer But Nearly One-Third Do Not.

Pronoun use. Pronouns are a shorthand way of referring to an individual without using their name. Often, pronouns connote gender as is the case with he/him or she/her. Some adults, especially LGBTQ adults, and trans or nonbinary adults in particular, use a pronoun that would not traditionally be associated with their sex assigned at birth or does not reflect the historic gender binary (male/female), such as they/them. In addition, some adults use multiple pronouns or are comfortable with any pronouns.

Nearly half (48%) of trans adults use they/them pronouns, with those ages 18-34 being more than twice as likely to use these terms than those 35+ (64% vs. 28%). About half of trans adults use she/her (49%) pronouns and almost four in ten (37%) use he/him pronouns. About one-third of trans adults say they use a combination of they/them and she/her or he/him pronouns. (Note: Percentages do not sum to 100% as respondents could select multiple genders).

About Half of Trans Adults Use They/Them Pronouns, Sometimes Alongside Others

General Demographics

Age. Trans adults are a younger population than non-trans adults. Over half (53%) of trans adults are under 35 years old compared to just over a quarter of non-trans adults (28%). Just a small share (8%) of trans adults are seniors, those over the age of 65, compared to 22% of non-trans adults (not shown in chart).

Over Half of Trans Adults Are Under the Age of 35, Compared to About One-quarter of Non-Trans Adults

Race/Ethnicity. Similar shares of trans and non-trans adults are White, Hispanic, Black, and other races/ethnicities.

About Four in Ten Trans Adults Are People of Color, Similar to the Share Among Non-Trans Adults

Income. A larger share of trans adults have incomes below $50,000 per year than non-trans adults (57% v. 45%), potentially reflecting younger age, lower levels of education, and higher unemployment (see below).

Larger Shares of Trans Adults Live on Incomes Below $50,000 Per Year Than Non-Trans Adults

Education. Trans adults have lower levels of education when compared to non-trans adults. More than 8 in 10 (84%) have less than a college degree compared to 65% of non-trans adults. Non-trans adults are more than twice as likely to have graduated college than trans adults (35% vs. 15%). This finding held true even when controlling for age, and despite having similar incomes at most levels.

Trans Adults Have Lower Education Levels Than Non-Trans Adults with 8 in 10 Having Less Than a College Degree

Employment. A larger share of trans adults report being unemployed (14% vs. 8%) or being students (8% vs. 4%) than non-trans adults and smaller shares report being retired, likely due the fact that the trans adult population is younger in age than the non-trans adult population. Similar shares report being employed, being on disability, or being a stay at home parent/home maker.

The Share of Trans Adults Who Are Unemployed is Nearly Double That of Non-trans Adults

Partisan identification. Four in ten trans adults (42%) identify as a Democrat, a larger share than non-trans adults (29%) and few, just one in ten (10%), identify as a Republican compared to almost one-third (31%) of non-trans adults. Trans adults are also more likely to say their political identity is something other than Republican, Democrat, or independent (20% vs. 14%).

About Four in Ten Trans Adults Are Democrats; Just Ten Percent Are Republican

Marital Status. Trans adults are about half as likely to be currently married than non-trans adults (26% vs. 49%) and also less likely to have ever been married (25% vs. 38% ) which likely reflects, at least in part, their younger age. However, they are twice as likely to be living with an unmarried partner (20% vs. 10%). The share of trans adults who are widowed or divorced is similar to that of non-trans adults.

Trans Adults Are About Half As Likely as Non-Trans Adults to be Married But are Twice as Likely to Be Living With a Partner

Parenthood. Overall, similar shares of trans adults are a parent or guardian to a child under the age of 18 living in their household (27% vs 26%). However, looking at younger adults, there are significantly fewer trans parents under the age of 40 than non-trans parents under 40 (23% vs. 40%).

Just Over One-Quarter of Both Trans and Non-Trans Adults Are the Parent/Guardian to a Child Under the Age of 18 in the Household

Healthcare Access

Insurance Coverage. Larger shares of trans adults report being uninsured than non-trans adults (15% vs. 10%). The share of trans adults who report not having health insurance is similar across age groups and racial and ethnic identities, but larger among those with lower household incomes compared to those with higher incomes.

About half of both trans adults and non-trans adults report having private insurance (55% vs. 51%), although trans adults are three times as likely to report having such coverage through a parent (10% vs. 3%), likely reflecting their younger age. Smaller shares of trans adults have Medicare (6% vs. 25%), likely reflecting the younger age of the population, and about one in four have Medicaid (21%), a larger share than non trans-adults (14%).

One in Five Trans Adults Receive Insurance Coverage Through Medicaid, Though Most Have Private Coverage

Care location. Trans adults use different types of health care settings to access care than non-trans adults. They are more likely to get their usual care at clinics including health centers, pharmacies, and urgent care (36% vs. 21%) and less likely to get this care at a doctor’s office (48% vs. 64%). Trans adults of color, those under age 35, and those earning less than $40,000 per year were more likely to say their usual source of care is the ER than White, older, or higher income trans adults. Among trans adults, those ages 35 and older and those earning more than $40,000 per year are more likely to receive care at a doctor’s office than trans adults who are younger or who have lower incomes. Like non-trans adults, about one in ten have no place they get care.

About Half of Trans Adults Receive Usual Health Care From a Doctor's Office; One in Ten Use Urgent Care; One in Ten Have No Place

Health and Well-being

Physical Health. Despite being a younger population, trans adults report poor physical health more so than non-trans adults. Looking back across the past 30 days, on average, trans adults had more days when their physical health, including physical illness and injury, was “not good”. Smaller shares of trans adults than non-trans adults had zero days when their physical health was not good in the preceding 30 days (27% vs. 41%) and nearly double the share of trans adults said their health had not been good for 21-30 days (17% vs. 9%). Among trans adults, there were minimal differences when looking across demographic factors including, race/ethnicity, age, and income.

Trans Adults Report More Frequent Days of Poor Physical Health Than Non-Trans Adults, Though Over One-Quarter Report No Poor Health Days in the Past Month

Mental Health. Similarly, while four in ten (39%) non-trans adults say there were zero days in the past month when their mental health, including stress, depression, and problems with emotions, was not good, just about one-in-ten trans adults (13%) said so. Conversely, nearly one quarter of trans adults (23%) say their mental health had been not good 21-30 days in the preceding 30. Notably, trans adults who reported having had a happy childhood reported fewer not good mental health days. Among trans adults, there were minimal differences when looking across demographic factors including, race/ethnicity, age, and income. In our main report on this survey, we find specifically that trans adults report higher rates of anxiety, depression, and loneliness than non-trans adults.

Overall Trans Adults Reported Their Mental Health Was "Not Good"  More Often Than Non-Trans Adults