The Affordable Care Act and Insurance Coverage in Rural Areas

Authors: Vann Newkirk and Anthony Damico
Published: May 29, 2014

Introduction

Almost 50 million people, or about 16 percent of the population of the United States, live in rural areas. These rural areas are defined as those outside of Metropolitan Statistical Areas (MSAs). MSAs are urban areas with more than 50,000 residents and surrounding suburbs. The populations of rural areas have different demographics, health needs and insurance coverage profiles than their urban counterparts, which means that Medicaid and Marketplace coverage reforms in the Affordable Care Act (ACA) may affect the two populations differently. In particular, rural populations tend to have high shares of low-to-moderate-income individuals, those who are in the target population for ACA coverage reforms. However, nearly two-thirds of uninsured people in rural areas live in a state that is not currently implementing the Medicaid expansion, meaning they are disproportionally affected by state decisions about ACA implementation. As a result, uninsured rural individuals may have fewer affordable coverage options moving forward. This brief examines these differences in populations and coverage patterns and assesses how ACA coverage reforms will affect rural and metropolitan areas in different ways.

The Challenge of Extending Health Insurance Coverage in Rural Areas

Compared to populations in metropolitan areas, the rural population has lower income (Figure 1). One-quarter of the nonelderly rural population has family income below the federal poverty level (FPL, about $19,790 for a family of 3 in 2014) compared to about one-fifth of the nonelderly population in metropolitan areas. Conversely, a greater share of the nonelderly population in metropolitan areas is in families with incomes over 400% FPL than rural families. Lower incomes make it difficult for people to afford coverage on their own, since health insurance coverage is expensive.
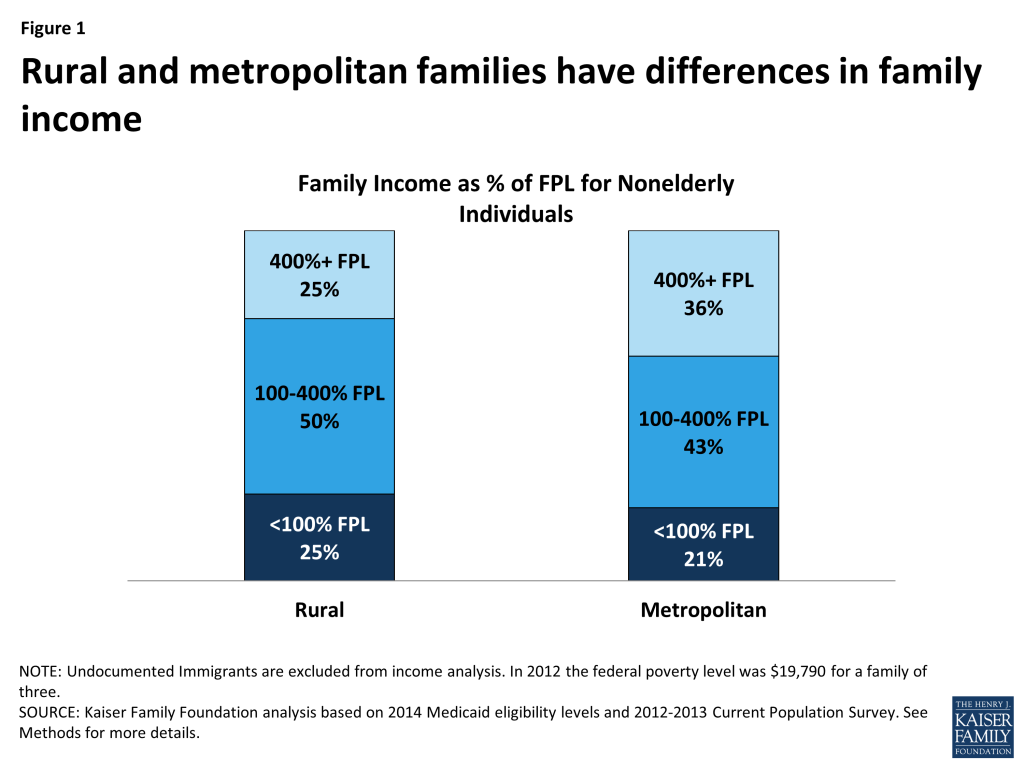
Figure 1: Rural and metropolitan families have differences in family income

In addition, individuals in rural areas are less likely than their urban counterparts to have access to coverage through a job. The nonelderly population in rural areas is more likely than metropolitan counterparts to live in family without either a full-or part-time worker (17% versus 14%). Further, among workers, those in rural areas are more likely to work in blue collar jobs (jobs outside of managerial, business, and financial occupations) than workers in metropolitan areas (71% versus 63%). Blue-collar workers tend to earn less and have fewer overall benefits than white-collar workers.1 Half of all rural workers work in “Low ESI industries,” or industries in which less than 80% of workers are covered by employer-sponsored insurance coverage.

These differences in income and access to coverage through a job are reflected in different coverage patterns in rural and urban areas. Only slightly more than half (51%)  of the rural population was enrolled in employer-sponsored coverage between 2012 and 2013 a significantly lower proportion than the 57% of the metropolitan population with employer coverage. However, before ACA implementation, the rural population was significantly more likely to be covered by Medicaid (21%) or other public insurance (4%) than the metropolitan population (16 and 3 percent, respectively). Because Medicaid made up some of the gap in employer-sponsored coverage in rural areas, the uninsured rate was similar across rural and metropolitan populations prior to the ACA (Figure 2).
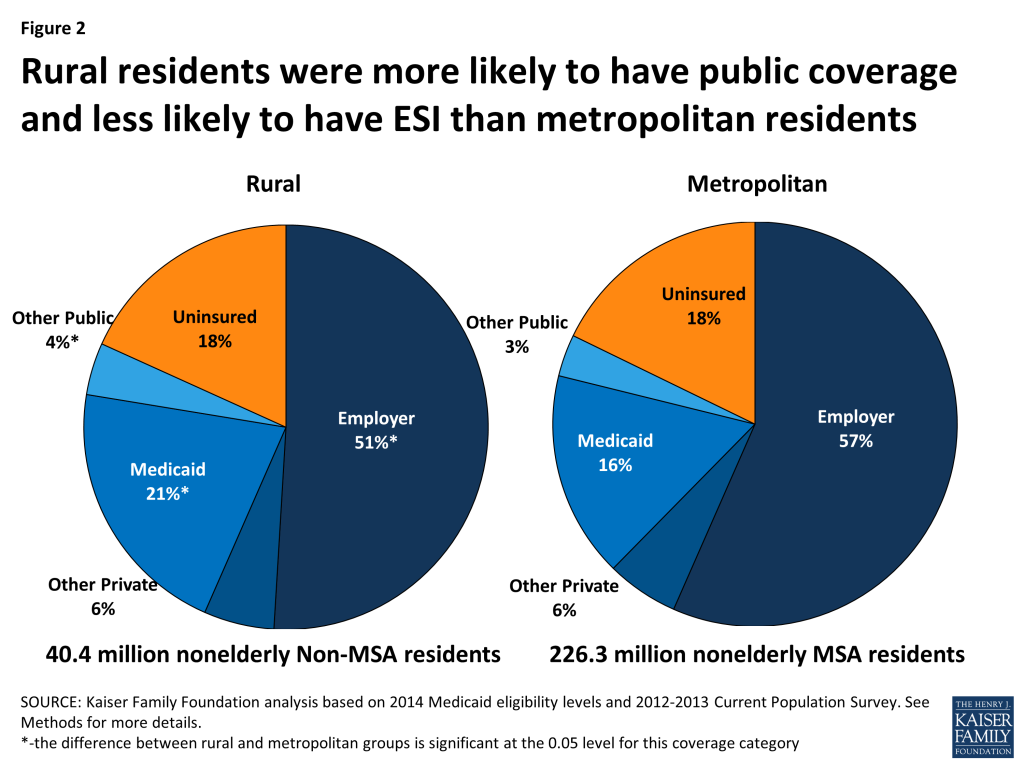
Figure 2: Rural residents were more likely to have public coverage and less likely to have ESI than metropolitan residents

Like the uninsured population nationally, uninsured individuals in rural areas are likely to live in low-income working families, are primarily adults (who were historically ineligible for public coverage), and are generally unable to afford coverage on their own. Compared to their urban counterparts, however, rural uninsured may face particular challenges in accessing health care services when needed due to more limited supply of providers who can provide low-cost or charity care. Thus, there is a particular need to extend coverage in rural areas.

The Impact of ACA Coverage Expansions in Rural Areas

The ACA offers the opportunity to expand health coverage among the rural population through the expansion of Medicaid for people with incomes at or below 138% of poverty and the availability of premium tax credits for the purchase of private insurance through the Health Insurance Marketplaces for moderate income families (those with incomes between 100% and 400% of poverty). Among the rural uninsured population, about three in four are in the income range (and meet the immigration requirements) for these coverage provisions.

However, with the Supreme Court ruling in June 2012, the Medicaid expansion became essentially optional for states, and as of May 2014, 24 states were not implementing the Medicaid expansion. In states that do not expand Medicaid, some individuals with incomes between 100% FPL and 138% FPL will be eligible for premium tax credits in the Marketplace.  However, many uninsured individuals under poverty will be left in a “coverage gap” in which their incomes are above Medicaid eligibility levels but below eligibility levels for tax credits.2  As a result, many will be left without an affordable insurance option. State decisions about expanding Medicaid have a disproportionate effect on coverage options for uninsured individuals in rural areas. Almost two-thirds of the rural uninsured population lives in states that are not expanding Medicaid at this time (Figure 3).
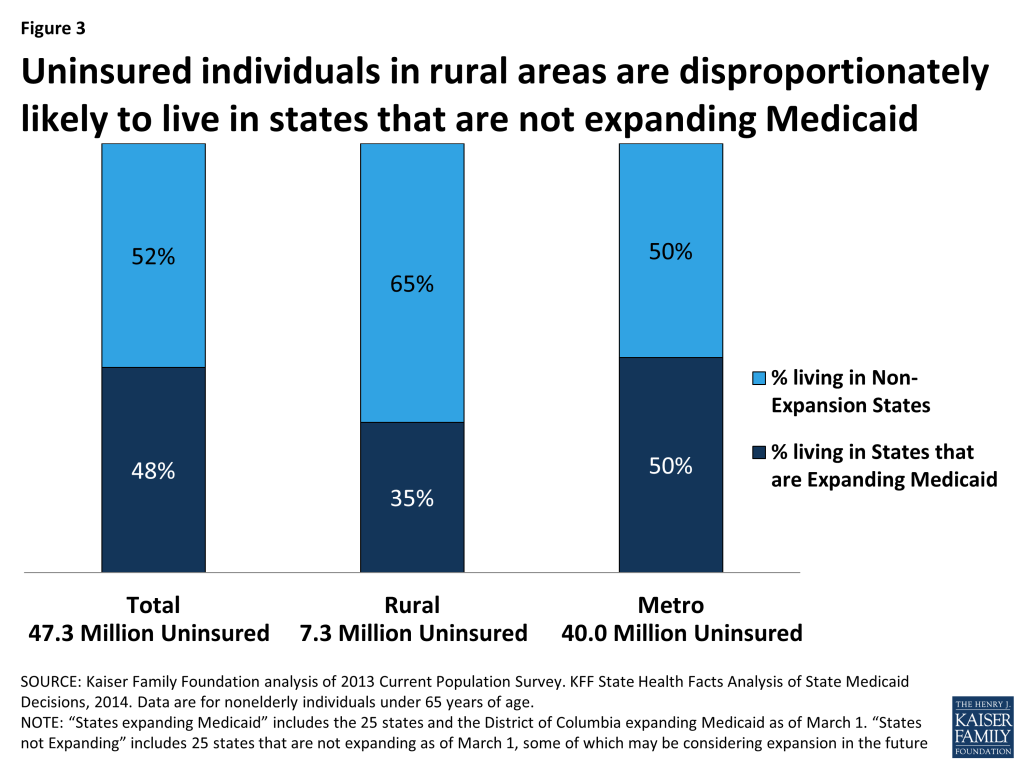
Figure 3: Uninsured individuals in rural areas are disproportionately likely to live in states that are not expanding Medicaid

As a result of state decisions, rural individuals are much more likely than their urban counterparts to fall into the “coverage gap.” Among uninsured rural individuals, about 15% – over a million people – are estimated to fall into the coverage gap compared to 9% of the uninsured in metropolitan areas (Figure 4). About equal shares of rural and urban (30%) uninsured individuals may be eligible for Medicaid or CHIP, but a greater share (37%) of uninsured rural individuals than metropolitan uninsured (32%) are within the income range to be eligible for premium tax credits in the marketplaces than are metropolitan individuals.3  Immigration status for the uninsured is less a factor barring coverage in rural areas compared to metropolitan areas, with only 6% vs 14% ineligible due to immigration status. Adequate outreach and consumer assistance are key to reaching individuals who are eligible for coverage under the ACA, particularly in rural areas where resources to help with enrollment may require traveling long distances.
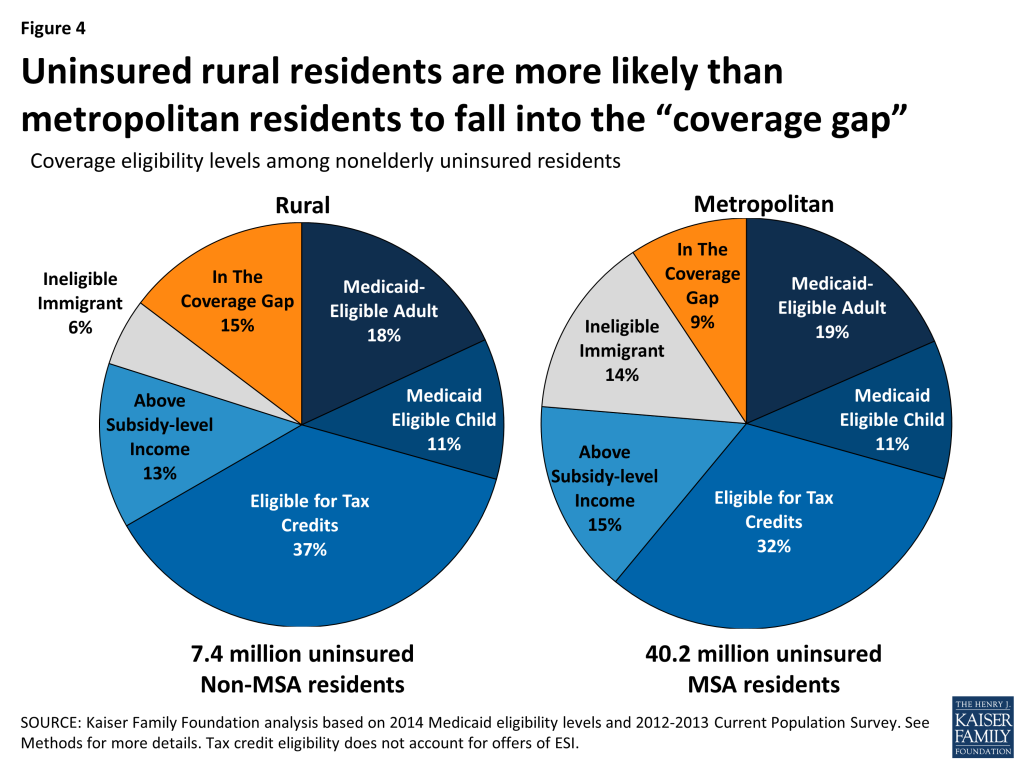
Figure 4: Uninsured rural residents are more likely than metropolitan residents to fall into the “coverage gap”


Conclusion

The rural population is poorer and less likely to be covered by employer-based insurance than the metropolitan population. Prior to the ACA, rural individuals were more likely to receive coverage through public insurance than metropolitan individuals. Many uninsured people in rural areas will be eligible for Medicaid coverage or tax credits to purchase coverage under the ACA. While the uninsured population in rural areas is less likely than their metropolitan counterparts to be ineligible for coverage due to their immigration status or incomes, they are more likely to fall into the “coverage gap” due to state decisions not to expand Medicaid coverage. People in rural areas may face particularly high barriers to accessing coverage, such as transportation barriers or limited provider availability and may also continue to face financial barriers to accessing needed care.

This Issue Brief was prepared by Vann Newkirk from the Kaiser Family Foundation and Anthony Damico, an independent consultant.


Appendix: Methods

This analysis uses pooled data from the 2012 and 2013 Current Population Survey (CPS) Annual Social and Economic Supplement (ASEC). The CPS ASEC provides socioeconomic and demographic information for the United Sates population and specific subpopulations. Importantly, the CPS ASEC provides detailed data on families and households, which we use to determine income for ACA eligibility purposes (see below for more detail). We merge two years of data in order to increase the precision of our estimates.Medicaid and Marketplaces have different rules about household composition and income for eligibility. For this analysis, we calculate household membership and income for both Medicaid and Marketplace premium tax credits for each person individually, using the rules for each program.  For more detail on how we construct Medicaid and Marketplace households and count income, see the detailed technical Appendix A available here.Immigrants who are undocumented are ineligible for Medicaid and Marketplace coverage. Since CPS data do not directly indicate whether an immigrant is lawfully present, we impute documentation status for each person in the sample. To do so, we draw on the methodology in the State Health Access Data Assistance Center (SHADAC) paper, “State Estimates of the Low-Income Uninsured Not Eligible for the ACA Medicaid Expansion.”4   This approach uses the Survey of Income and Program Participation (SIPP) to develop a model that predicts immigration status; it then applies the model to CPS, controlling to state-level estimates of total undocumented population from Department of Homeland Security. For more detail on the immigration imputation used in this analysis, see the technical Appendix B available here.As of January 2014, Medicaid financial eligibility for most nonelderly adults will be based on modified adjusted gross income (MAGI). To determine whether each individual is eligible for Medicaid, we use each state’s MAGI eligibility level that will be effective as of 2014.5  Some nonelderly adults with incomes above MAGI levels may be eligible for Medicaid through other pathways; however, we only assess eligibility through the MAGI pathway.6  

An individual’s income is likely to fluctuate throughout the year, impacting his or her eligibility for Medicaid. Our estimates are based on annual income and thus represent a snapshot of the number of people in the coverage gap at a given point in time. Over the course of the year, a larger number of people are likely to move in and out of the coverage gap as their income fluctuates.

Marketplace premium tax credit eligibility determination is most accurately established by modeling the employment status and likelihood of an ESI offer, since tax credit eligibility requires the absence of an affordable ESI offer. This analysis did not account for this “offer rate reduction” so the tax credit eligibility is overestimated by about 17% and likely to include about 2.7 million metro and rural area residents who will have affordable ESI offers.

Endnotes

  1. Duckett, Philethea, and Samantha Artiga. “Health Coverage for the Black Population Today and Under the Affordable Care Act.” Kaiser Family Foundation. https://modern.kff.org/disparities-policy/fact-sheet/health-coverage-for-the-black-population-today-and-under-the-affordable-care-act/. ↩︎
  2. Kaiser Family Foundation. “The Coverage Gap: Uninsured Poor Adults in States that Do Not Expand Medicaid.” https://modern.kff.org/health-reform/issue-brief/the-coverage-gap-uninsured-poor-adults-in-states-that-do-not-expand-medicaid/. ↩︎
  3. See Methods section ↩︎
  4. State Health Access Data Assistance Center. 2013. “State Estimates of the Low-income Uninsured Not Eligible for the ACA Medicaid Expansion.” Issue Brief #35. Minneapolis, MN: University of Minnesota. Available at: http://www.rwjf.org/content/dam/farm/reports/issue_briefs/2013/rwjf404825. ↩︎
  5. Kaiser Commission on Medicaid and the Uninsured. Fact Sheet: Medicaid Eligibility for Adults as of January 1, 2014.  (Washington, DC: Kaiser Family Foundation), October 1, 2014. Available at: http://modern.kff.org/medicaid/fact-sheet/medicaid-eligibility-for-adults-as-of-january-1-2014/. ↩︎
  6. Non-MAGI pathways for nonelderly adults include disability-related pathways, such as SSI beneficiary; Qualified Severely Impaired Individuals; Working Disabled; and Medically Needy. We are unable to assess disability status in the CPS sufficiently to model eligibility under these pathways. However, previous research indicates high current participation rates among individuals with disabilities (largely due to the automatic link between SSI and Medicaid in most states, see Kenney GM, V Lynch, J Haley, and M Huntress. “Variation in Medicaid Eligibility and Participation among Adults: Implications for the Affordable Care Act.” Inquiry. 49:231-53 (Fall 2012)), indicating that there may be a small number of eligible uninsured individuals in this group. Further, many of these pathways (with the exception of SSI, which automatically links an individual to Medicaid in most states) are optional for states, and eligibility in states not implementing the ACA expansion is limited. For example, the median income eligibility level for coverage through the Medically Needy pathway is 15% of poverty in states that are not expanding Medicaid, and most states not expanding Medicaid do not provide coverage above SSI levels for individuals with disabilities. (See: O’Mally-Watts, M and K Young.  The Medicaid Medically Needy Program: Spending and Enrollment Update.  (Washington, DC: Kaiser Family Foundation), December 2012. Available at: http://modern.kff.org/medicaid/issue-brief/the-medicaid-medically-needy-program-spending-and/. And Kaiser Commission on Medicaid and the Uninsured, “Medicaid Financial Eligibility: Primary Pathways for the Elderly and People with Disabilities,” February 2010. Available at: http://modern.kff.org/medicaid/issue-brief/medicaid-financial-eligibility-primary-pathways-for-the-elderly-and-people-with-disabilities/. ↩︎
The U.S. Government and Global LGBT Health: Opportunities and Challenges in the Current Era

Author: Jennifer Kates
Published: May 28, 2014

Executive Summary

In recent years, the U.S. government has paid increasing attention to the health and human rights of lesbian, gay, bisexual and transgender (LGBT) individuals around the world, utilizing both multilateral and bilateral channels, including through a 2011 Presidential Memorandum on “International Initiatives to Advance the Human Rights of Lesbian, Gay, Bisexual, and Transgender Persons” and diplomatic engagement at the United Nations (UN) and World Health Organization (WHO). Most of these efforts have been broadly cast as part of the U.S. government’s human rights policy, rather than through its global health strategies and programs, although they have included health elements. Still, however, many LGBT individuals continue to face stigma, discrimination, and violence, both within and outside of the health sector, which compromise their ability to access needed health services and can adversely affect health status. Moreover, in many countries, the barriers faced by LGBT individuals include discriminatory laws and policies. Indeed, in 81 countries, same sex behavior is criminalized; 7 of those countries impose the death penalty. Many of these countries receive U.S. global health assistance and/or are key strategic partners of the U.S., raising complex questions about how best to address the health needs of LGBT individuals within them. Recent actions to further criminalize same sex behavior and/or restrict the rights of LGBT persons and their supporters by the governments of Nigeria, Uganda, India, and Russia (and worries that other countries may soon follow suit), have heightened concerns about the safety of LGBT individuals as well as those who work to provide them services, raising the stakes in the conversation and introducing a greater sense of urgency. While the U.S. government has begun to respond to some of these recent cases, many questions and challenges remain about how it should chart a course forward, both in the short and long term.

To explore opportunities and challenges facing the U.S. government in this arena, the Kaiser Family Foundation convened two roundtable discussions (in October 2013 and March 2014) of high-level experts working on global LGBT health and rights as well as those working more broadly on global health. Participants included representatives from the U.S. government, multilateral institutions, non-governmental organizations, think tanks, and academia. This issue brief summarizes the main points of discussion raised by roundtable participants, focusing on opportunities, challenges, and potential next steps for the U.S. government to consider in addressing the health needs of LGBT individuals around the world (see Table 1). It also provides an overview of global LGBT health issues, and reviews U.S. government efforts to address global LGBT health to date.

Table 1: Summary of Key Challenges, Opportunities, and Next Steps
Challenges
Participants identified several significant challenges in addressing global LGBT health in the short and long term, including:
  • Lack of a proactive and/or coordinated U.S. strategy.
  • Reaching LGBT individuals with health interventions when they are criminalized by their State.
  • Addressing the immediate needs of those in danger.
  • Limited capacity of LGBT civil society.
  • Addressing claims of Western imperialism.
  • Managing the move toward increased “country ownership” of U.S. global health programs.
  • Ongoing data gaps and research needs.
Opportunities
Participants also recognized a number of opportunities for U.S. engagement, including:
  • More conducive U.S. policy environment for addressing LGBT human rights around the world.
  • Potential to augment a focus on global LGBT health within U.S. global health policy.
  • Increasing coordination between broader human rights, LGBT, and health groups on LGBT health issues.
  • Elevating LGBT voices in-country to help inform the U.S. policy response.
  • Using the Post-2015 framework.
  • Growing evidence base.
Looking Forward: Potential Next Steps
Participants outlined a number of concrete steps that could be taken in the short and long term to address global LGBT health issues, including:
  • Review U.S. health and development portfolios.
  • Develop proactive strategy for moving forward.
  • Consider appointing a U.S. “Special Envoy” or other high-level point person on LGBT issues.
  • Expand efforts to help LGBT individuals facing violence, arrest, and threats due to their sexual orientation or gender identity.
  • Articulate importance of continuing U.S.-funded health services.
  • Bolster PEPFAR’s focus on LGBT health access and safety.
  • Use Global Health Diplomacy.
  • Coordinate with other donor governments and multilateral organizations.
  • Engage the private sector.
  • Engage the faith community.
  • Build LGBT civil society.
  • Support data collection, analysis, and research on global LGBT health.

Introduction

LGBT individuals around the world face considerable challenges and barriers to accessing needed health services, and as a result, may experience poorer health outcomes.1 ,2 ,3 ,4 ,5 ,6 ,7 ,8 ,9 ,10  Barriers can range from stigma, discrimination, rejection by families and communities, receipt of substandard care or outright denial of care, to violence, even killings, because of one’s sexual orientation, gender identity, and/or gender expression.11 ,12 ,13 ,14 ,15 ,16  Moreover, in many countries, the barriers faced by LGBT individuals include discriminatory laws and policies.17  Indeed, as of April 2014, 81 countries (77 countries and 4 entities/territories18 ) criminalized19  same sex behavior. Seven of these countries impose the death penalty (2 of which do so in parts of the country).20 ,21  While such laws are not necessarily enforced in every country, their presence can serve to reinforce stigma and legitimize violence and police brutality.22 ,23  And, in addition to the direct health consequences of violence towards LGBT people, there is a growing body of evidence documenting the health effects of criminalization laws, discrimination, and stigma.24 ,25 ,26 ,27 ,28 ,29 ,30 ,31 ,32 ,33  These include increased stress and depression, fear to seek care, increased risk behaviors, and greater prevalence of some diseases, perhaps most notably HIV, which continues to have a significant and disproportionate impact on men who have sex with men (MSM) and transgender individuals around the world.34 ,35 ,36 ,37  In addition to the negative effects on the health and health-care seeking behavior of LGBT individuals, such laws can impact health care providers and NGOs as well, as they can become targets or experience discrimination themselves for working with and providing services to LGBT populations.38 ,39 

In recent years, the U.S. government has paid increasing attention to the health and human rights of LGBT individuals around the world, through both multilateral and bilateral channels. Of note, in 2011, President Obama issued a Presidential Memorandum on “International Initiatives to Advance the Human Rights of Lesbian, Gay, Bisexual, and Transgender Persons40  in U.S. diplomatic and foreign assistance efforts, and the U.S. helped lead an effort resulting in the passage of the first-ever UN resolution on sexual orientation and gender identity.41 ,42 

At the same time, many of the countries that criminalize same sex behavior receive U.S. global health assistance and/or are key strategic partners of the U.S., raising complex questions about how best to address the health needs of LGBT individuals within them. Recent actions by the governments of Nigeria, Uganda, India, and Russia, have brought new scrutiny to these issues, and have heightened concern about the safety and well-being of LGBT individuals and the organizations that serve or employ them. There are also worries that other countries may soon follow suit.43 ,44 ,45 ,46 ,47  While the U.S. government has begun to lay the groundwork to enhance a focus on LGBT human rights and health in its foreign assistance programs, many questions and challenges remain about how it should chart a course forward in both the short and long term.


Issue Brief: U.s. Government Efforts To Address Global Lgbt Health To Date

Most U.S. government efforts to address the health and human rights of LGBT individuals have been broadly cast as part of the U.S. government’s human rights policy and approach48 ,49 ,50  rather than through its global health strategies and programs, although they have included health elements. A few have been health-specific, primarily in the context of HIV, particularly related to addressing the impact of the epidemic among men who have sex with men (MSM) and transgender individuals. An overview of these developments and activities follows.

Broader Human Rights & Foreign Policy Efforts

Early on during President Obama’s first term, then-Secretary of State Hillary Clinton signaled the Administration’s intent to include LGBT issues as part of its human rights agenda, working to address violence and discrimination against people based on sexual orientation or gender identity.51 ,52  Advancing LGBT human rights has since been identified as a State Department foreign policy priority.53  This has included U.S. engagement at the UN, such as a June 2011 effort at the UN Human Rights Council, led by the U.S. and several other governments, that resulted in the passage of the first-ever UN resolution on sexual orientation and gender identity.54 ,55  Shortly thereafter, in his annual speech to the UN General Assembly, President Obama spoke of the need to include LGBT individuals in global efforts to protect rights.56 

Perhaps most notably, in December of 2011, the White House issued a Presidential Memorandum on International Initiatives to Advance the Human Rights of Lesbian, Gay, Bisexual, and Transgender Persons, calling for “all agencies engaged abroad to ensure that U.S. diplomacy and foreign assistance promote and protect the human rights of LGBT persons.”57 ,58  These themes were reinforced that same day in a speech by Secretary Clinton in Geneva.59  The Presidential Memorandum directs agencies to:

  • Combat the criminalization of LGBT status or conduct abroad;
  • Protect vulnerable LGBT refugees and asylum seekers;
  • Leverage foreign assistance to protect human rights and advance non-discrimination;
  • Ensure swift and meaningful U.S. responses to human rights abuses of LGBT persons abroad; and
  • Engage international organizations in the fight against LGBT discrimination.

Among the main agencies and programs carrying out efforts to address LGBT human rights broadly are:

DRL

The State Department’s Bureau of Democracy, Human Rights, and Labor (DRL) leads U.S. efforts to protect human rights globally, working to protect populations at risk, including LGBT individuals. DRL is responsible for preparing the State Department’s annual Country Reports on Human Rights Practices, as required by Congress. Discussion of LGBT human rights issues in these reports has been significantly expanded by the Obama Administration, and they now include a specific section on LGBT rights by country. In addition to these ongoing activities, and timed with the President’s Memorandum, the Administration announced the creation of the Global Equality Fund (GEF), a public-private partnership,60  to be managed by DRL. The GEF is intended to advance LGBT human rights by providing emergency and long term assistance to civil society organizations around the world.61  To date, the GEF has allocated over $7.5 million to more than 50 countries.62 

PRM

The State Department’s Bureau of Population, Refugees, and Migration (PRM) works to address the needs of refugees, migrants, and victims of conflict, including those who are LGBT, through its efforts with the UN High Commissioner for Refugees (UNHCR) as well as through the provision of assistance to individuals.63  In addition, PRM has worked with the Department of Homeland Security (DHS) to expedite refugee processing for LGBT individuals and developed guidance for adjudicating LGBT refugee and asylum claims.64 

USAID

The U.S. Agency for International Development (USAID), the main development assistance arm of the U.S. government, has moved to include LGBT issues within its broader development agenda. Specifically, the Agency has created an LGBT Senior Coordinator position to coordinate implementation of the 2011 Presidential Memorandum. It has also included reference to the importance of addressing the rights of LGBT individuals in many of its main policy and guidance documents, including its Policy Framework for 2011-2015,65  Strategy on Democracy, Human Rights and Governance,66  Youth in Development Policy,67  and Country Development Cooperative Strategy (CDCS) Guidance,68  and Global Health Strategic Framework for FY 2012-2016.69  USAID has also added language to its award provisions encouraging, but not requiring, all implementing partners to add non-discrimination provisions that include sexual orientation and gender identity.70  Beyond incorporating LGBT rights into its broader development frameworks, USAID recently released a draft document, the USAID Vision for Action: Promoting and Supporting the Inclusion of Lesbian, Gay, Bisexual, And Transgender Individuals,71 to more directly articulate its work in this area, and includes reference to health barriers as a key challenge facing LGBT people worldwide. Other efforts include the launch of the LGBT Global Development Partnership in April 2013, a public-private partnership72  designed to strengthen capacity of LGBT organizations, provide training, and conduct research on the economic impact of discrimination on LGBT individuals, with health access included as one of the areas to be assessed and monitored. The agency has also begun undertaking an internal effort to raise awareness of LGBT human rights at the agency and field levels, including through the provision of sensitivity training and technical assistance at country missions and by instructing embassies and missions to meet with the LGBT community in their host countries.73 ,74  Where USAID has undertaken health-specific efforts focused on LGBT individuals and civil society, they have been part of its HIV response under PEPFAR (see discussion below).

MCC

The Millennium Challenge Corporation (MCC) is an independent U.S. agency that provides development assistance in order to promote economic growth and reduce poverty through country-compacts in eligible low- and middle-income countries. As part of its assessment of country eligibility for compacts, MCC selection criteria include measures related to civil liberties and human rights.75  In recent years, the MCC has moved to include LGBT rights in its broader assessment of human rights protections when considering country eligibility for assistance as well as continuation of assistance during a compact. For example, the MCC suspended a compact to Malawi due to a “a pattern of actions inconsistent with good policy performance in the areas measured by the Political Rights, Civil Liberties, and Rule of Law indicators,” actions that included “legal changes affecting media freedom, lesbian, gay, bisexual and transgender human rights, and citizens’ access to justice” (the compact has since been reinstated).76 

Global Health-Specific Efforts

While efforts to address LGBT rights within the broader foreign policy and development work of the U.S. government have included health in some cases, they have generally not been health-specific or an explicit part of the U.S. global health agenda. Rather, health-specific activities that address LGBT individuals have primarily been undertaken as part of the U.S. global HIV response, through the President’s Emergency Plan for AIDS Relief (PEPFAR). Beyond HIV, U.S. government engagement on global LGBT health issues has largely been carried out through diplomatic engagement at the World Health Organization (WHO) and Pan American Health Organization (PAHO).

PEPFAR

PEPFAR is the largest component of the U.S. global health portfolio, overseen by the Office of the Global AIDS Coordinator at the State Department and implemented by several U.S. agencies including USAID, the Centers for Disease Control and Prevention (CDC), and the Department of Defense (DoD). While PEPFAR has included efforts to address the impact of HIV among MSM since it was launched,77  it has only more recently begun to increase its programmatic focus on LGBT individuals, primarily MSM and, to a lesser extent, transgender individuals, in its bilateral HIV work. In May 2011, PEPFAR released its first programmatic guidance on addressing the HIV prevention needs of MSM.78  The guidance is intended to address “the urgent need to strengthen and expand HIV prevention for MSM and their partners and to improve MSM’s ability to access HIV care and treatment”79  and to inform the development of Country Operational Plans (COPs), which document annual U.S. government investments and anticipated results in HIV by country. PEPFAR’s 2014 Gender Strategy discusses how gender norms concerning sexual behavior, sexual orientation, and gender identity can place individuals at increased risk for HIV and/or present barriers to care, and includes LGBT individuals as vulnerable populations to be considered in PEPFAR’s gender programming. More generally, PEPFAR’s Blueprint, its roadmap for achieving an AIDS-Free Generation released in November 2012, includes the importance of improving access to and uptake of HIV services by key populations, including MSM and transgender individuals.”80 

Three, smaller-scale PEPFAR initiatives are focused on creating more civil society capacity to help scale up access to PEPFAR’s HIV programs among key populations, including LGBT individuals:

  • The “Key Populations Challenge Fund”, a $20 million fund launched in June 2012 to support the expansion of interventions and services for key populations, including MSM, at the country level, focusing in 6 countries and two regions;81 ,82 
  • The “Robert Carr Civil Society Network Fund,” also launched in June 201283  by the U.S. along with the United Kingdom, Norway, and the Gates Foundation84  to support civil society organizations in scaling up access for key populations including LBGT individuals. The U.S. is providing $2 million to this effort; and
  • The “Local Capacity Initiative Fund,” which provides funding to PEPFAR country and regional teams to support local civil society organizations that advocate for key populations to work to reduce legal and policy structural barriers and stigma and discrimination.85 

USAID, PEFPAR’s largest implementing agency, has been addressing the impact of HIV among MSM since it first began carrying out international HIV activities in the 1980s.86  USAID efforts, funded under PEPFAR, to address the health of key populations have included its AIDSTAR2 and Health Policy Projects, both of which have supported MSM civil society capacity building, as well as its Research to Prevention (R2P) project, which included research to document and measure stigma and discrimination. Most recently, in December 2013, to support PEPFAR’s Blueprint, USAID put out a Request for Application (RFA) for a new five year, $72 million cooperative agreement to address key populations.87  This RFA, Linkages Across the Continuum of HIV Services for Key Populations Affected by HIV, marks the first PEPFAR central procurement dedicated to addressing the needs of key populations. It is intended to strengthen the capacity of governments and civil society in PEPFAR partner countries to “implement high quality, sustainable, evidence-based and comprehensive HIV and AIDS prevention, care and treatment services with key populations at scale,” including gay men and other MSM and transgender individuals.

In addition, over the next year, PEPFAR is planning on rolling out workshops for PEPFAR country staff focused on: U.S. policies regarding sexual orientation and gender identity; workplace expectations regarding diversity; facilitating engagement with civil society and community organizations working with LGBT populations; and implementation of emergency response guidelines and protocols during hostile situations that directly involve LGBT populations.88 

In addition to PEPFAR’s bilateral HIV programming, the U.S. is the largest donor to the Global Fund to Fight AIDS, Tuberculosis and Malaria (Global Fund) which itself first approved a strategy to address sexual orientation and gender identity several years prior (in 2009),89  and recently strengthened its focus on promoting human rights for key populations by integrating human rights concerns into its grant-making process90  and launching a pilot initiative to help increase the participation of and “create “safe spaces” for key affected populations, especially those who are criminalized and marginalized.91 

WHO and PAHO

Beyond its HIV-focused programming, U.S. government engagement on global LGBT health issues more broadly has taken place in the international, diplomatic arena. Specifically, the U.S. has led efforts to raise LGBT health at the WHO, the directing and coordinating authority for health within the United Nations system.92  In May 2012, the U.S. convened a panel discussion on LGBT health at the sidelines of the World Health Assembly, the annual meeting of the WHO attended by all WHO Member States. The U.S., with a handful of other countries, subsequently petitioned to have the topic of LGBT health included on the agenda of the WHO Executive Board (which determines the broader WHA agenda). The WHO staff prepared a summary report on LGBT health93  to be considered at the May 2013 Executive Board meeting, but several countries petitioned to remove the agenda item for future consideration; it was again not adopted at a January 2014 Executive Board meeting and, while the WHO Director-General has been personally involved in trying to get it back on the agenda, it is unclear when it will be reconsidered. Importantly, this is the first time in the history of WHO that an agenda item has been removed, a fact that reflects the incredible political sensitivity of this issue at the health body.

Despite the continued uncertainty about the inclusion of LGBT health on the WHO agenda, in October 2013, PAHO, the regional body of the WHO representing the Americas, unanimously passed a resolution that had been presented by the U.S. addressing LGBT health including discrimination in the health sector, marking the first time any UN body had adopted a resolution specifically addressing these issues.94 ,95 ,96 

U.S. Global Health Assistance & the Presence of Anti-LGBT Laws by Country

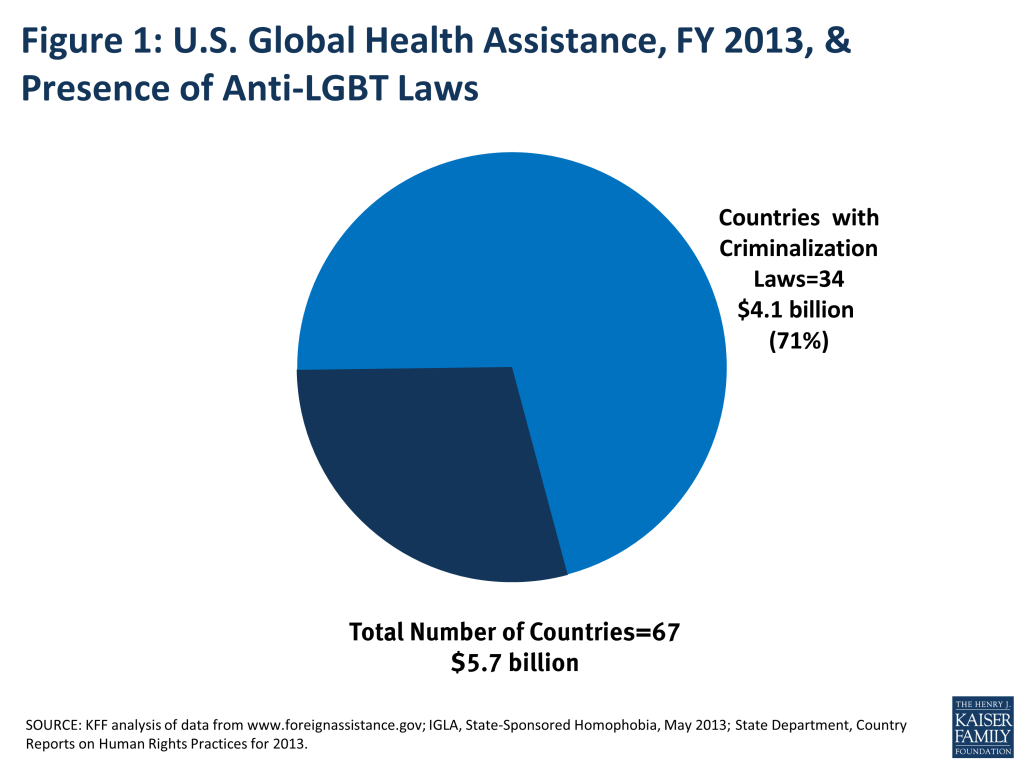
As a backdrop for understanding the legal climate regarding LGBT individuals in countries in which the U.S. government provides global health assistance, the Kaiser Family Foundation analyzed U.S. funding data for FY 2013 and information on criminalization laws by country. This analysis finds that in FY 2013, of the 67 countries that received U.S. global health assistance (totaling $5.7 billion):

  • Thirty-four criminalize same-sex behavior, including 3 which impose the death penalty.
  • These 34 countries accounted for 71% of U.S. global health assistance ($4.1 billion); eight are among the top 10 recipients of U.S. global health assistance.97 
  • Most (23) are in Africa; 9 are in Asia and one, each, is in the Oceanic and Latin American/Caribbean regions, respectively. None are in the European/Eurasia region.
  • They range in in the number of U.S.-supported global health programs (of 7 major program areas).98  Eleven receive funding from just a single program area while 8 receive funding from all 7 programs; nineteen countries receive funding from 4 or more program areas.
  • Twenty-six receive PEPFAR (HIV bilateral) funding, accounting for 71% of PEPFAR funding.
  • Countries receiving U.S. global health assistance include India, Nigeria and Uganda, which have recently moved to further criminalize same sex behavior, and several others where such steps are being considered.

Also see Figure 1. Table 2 provides a detailed breakdown of these data and sources (additional information is provided in an appendix).

Table 2: U.S. Global Health Assistance, FY 2013, & Presence of Anti-LGBT Laws by Country
CountryCriminalizes HomosexualityCountryTotalU.S. Global HealthAssistanceNumber of U.S. Global Health ProgramsRegion
YesAfghanistan169,937,0006Asia
YesAngola49,557,0004Africa
Armenia2,868,0004Europe/Eurasia
YesBangladesh96,883,0006Asia
Benin23,466,0003Africa
YesBotswana61,294,0001Africa
Brazil1,081,0001LAC
Burkina Faso11,571,0002Africa
YesBurma20,848,0004Asia
YesBurundi40,100,0005Africa
Cambodia37,914,0007Asia
YesCameroon25,325,0001Africa
Chad500,0002Africa
China2,977,0001Asia
Cote d’Ivoire135,269,0001Africa
DRC166,018,0007Africa
Djibouti1,800,0001Africa
Dominican Republic13,824,0002LAC
YesEgypt2,893,0001Africa
YesEthiopia329,754,0007Africa
Georgia3,664,0003Europe/Eurasia
YesGhana73,014,0006Africa
Guatemala26,846,0003LAC
YesGuinea17,880,0003Africa
YesGuyana8,866,0001LAC
Haiti162,882,0004LAC
Honduras3,578,0002LAC
YesIndia77,560,0004Asia
Indonesia48,924,0004Asia
Jordan49,000,0003Asia
Kazakhstan2,234,0001Asia
YesKenya356,030,0007Africa
Kyrgyz Republic4,282,0001Asia
YesLebanon11,993,0001Asia
Lesotho26,165,0001Africa
YesLiberia53,932,0006Africa
Madagascar52,930,0005Africa
YesMalawi138,657,0007Africa
YesMaldives955,0001Asia
Mali64,241,0006Africa
YesMozambique273,804,0007Africa
YesNamibia77,877,0001Africa
Nepal40,489,0005Asia
Niger4,200,0003Africa
Yes*Nigeria625,974,0006Africa
YesPakistan31,349,0003Asia
YesPapua New Guinea4,853,0001Oceania
Philippines36,632,0004Asia
Rwanda136,694,0006Africa
YesSenegal64,416,0006Africa
YesSierra Leone5,500,0003Africa
Yes*Somalia1,911,0001Africa
South Africa489,576,0003Africa
YesSouth Sudan64,371,0006Africa
YesSwaziland26,054,0001Africa
Tajikistan7,500,0004Asia
YesTanzania443,442,0007Africa
Thailand1,000,0001Asia
Timor-Leste2,013,0002Asia
YesUganda409,244,0007Africa
Ukraine29,587,0003Europe/Eurasia
YesUzbekistan3,045,0001Asia
Vietnam65,676,0001Asia
West Bank & Gaza1,929,0001Asia
Yes*Yemen11,689,0003Asia
YesZambia363,207,0007Africa
YesZimbabwe123,263,0007Africa
Total (all countries)67 countries$5,722,807,000
Subtotal (w/laws)34 countries$4,065,477,000
NOTES: *Imposes the death penalty (in Nigeria, this applies to 12 northern states). Represents FY 2013 enacted amounts. Does not include additional funding that may be provided to individual countries through regional programs or funding for “other” global health of $10,489,000 that was provided to Afghanistan in 2013.LAC = Latin America & the Caribbean.SOURCES: KFF analysis of data from www.foreignassistance.gov; IGLA, State-Sponsored Homophobia, May 2013; State Department, Country Reports on Human Rights Practices for 2013.

U.S. RESPONSE TO RECENT ACTIONS IN NIGERIA, UGANDA, AND ELSEWHERE

The U.S. has had varying responses to the recent actions to further criminalize homosexuality and/or restrict LGBT rights taken by the governments of Russia, India, Nigeria and Uganda. These responses have ranged from statements of concern by Administration officials and Members of Congress, to diplomatic meetings, requests for assurances about protections of individuals seeking health services and, in the case of Uganda, the review and even suspension of some U.S. health and other development assistance. The range in responses reflects several factors including U.S. bilateral relations more broadly with each of these countries, the unique context of each country, the nature of the recent change in the law and any related enforcement, and the extent to which the country receives health and other development assistance from the United States. Russia, for example, receives no development assistance from the U.S. government and the USAID mission has been closed, and current U.S.-Russia bilateral relations are primarily focused on addressing the crisis in Ukraine. India receives health (and some other development) assistance from the U.S., although this has diminished over time as the country has moved into middle income status; in addition, as described below, the recent change to Indian law was made by the Indian Supreme Court and is still being challenged by several parties including the central Indian government. Nigeria and Uganda, on the other hand, have been seen as important partners in responding to HIV and other health challenges. Both are among the top 10 recipients of health assistance from the U.S. government and were among the original 15 PEPFAR focus countries, and still are top PEPFAR recipients.99  They are also focus countries under the President’s Malaria Initiative (PMI) and priority countries for USAID’s family planning, maternal and child health, and TB programs. In addition, while each has long had laws criminalizing same sex behavior, they had, until recently, rarely been enforced.

Figure 1: U.S. Global Health Assistance, FY 2013, & Presence of Anti-LGBT Laws

An overview of U.S. responses to recent developments in these four countries is provided below.

Russia

While Russia decriminalized same sex behavior in 1993,100  President Putin, in June 2013, signed into law an amendment to an existing federal law On Protecting Children from Information Harmful to Their Health and Development, extending it to include the propaganda of “nontraditional sexual relations to minors”.101  The law includes administrative fines for individuals, organizations, and foreigners for such propaganda, and further subjects foreigners to prison and deportation from Russia. The law was met by international criticism,102  including by the U.S. government, in part because it was passed just months before the Winter Olympics was to be held in Sochi, Russia and most of the international response centered on concerns about Sochi. The U.S. government issued a travel warning for LGBT travelers, which remains in effect today.103  More than 80 Members of Congress sent a letter to Secretary Kerry expressing their concern about the implications of the law for the safety and well-being of LGBT and LGBT-supporting individuals involved in or attending the Olympics and requesting information about diplomatic and other actions the State Department intended to take.104  President Obama and other administration officials have criticized the law105 ,106  and the State Department’s Human Rights Country Report on Russia describes the law as limiting the rights of free expression and assembly for citizens who wish to publicly advocate for LGBT rights or express the opinion that homosexuality is normal including materials that “directly or indirectly approve of people who are in nontraditional sexual relationships.”107 

India

In December 2013, a two-person bench of the Indian Supreme Court reinstated a colonial-era law (Section 377 of the Penal Code) that described homosexual acts as ��against the order of nature” and punishable by up to life in prison. The ruling overturned a 2009 ruling by the Delhi High Court, which had found the law unconstitutional, with the Supreme Court stating that only Parliament could make such changes.108  Many have spoken out109 ,110  against this ruling including the Indian government, which filed a petition challenging the ruling that has since been rejected.111 ,112  Other avenues for addressing the ruling are being pursued, including requesting a curative petition (for the Court to hear the case even after a petition has been dismissed) and legislative action.113  The State Department has expressed its “deep concern” about the ruling.114  The ruling is noted in the State Department’s Human Rights Country Report on India and in its travel advisory.115 

Nigeria

Nigeria has long criminalized same sex behavior (including penalty of death in some northern states of the country) but a recent bill signed into law by President Jonathan further criminalizes LGBT people and groups. The law mandates a 14-year prison sentence for anyone entering a same-sex union and a 10-year term for “a person or group of persons who supports the registration, operation and sustenance of gay clubs, societies, organizations, processions or meetings”. The law also states that “a person or group of persons who … supports the registration, operation and sustenance of gay clubs, societies, organizations, processions or meetings in Nigeria commits an offence and is liable on conviction to a term of 10 years imprisonment.”116 ,117  Incidents of violence and criminalization following the passage of the law have been documented.118 ,119  Many in the international community have spoken out about this law including the UN Secretary General;120  the UN Human Rights Council;121  UNAIDS122  and the Global Fund, which issued a joint statement of concern;123  President Obama, Secretary Kerry, and the U.S. Ambassador to Nigeria. Secretary Kerry has said, for example, that “Beyond even prohibiting same sex marriage, this law dangerously restricts freedom of assembly, association, and expression for all Nigerians.”124  The State Department’s Human Rights Country Report on Nigeria critiques the law125  and the State Department’s travel advisory for Nigeria warns LGBT travelers about its potential implications.126  While some have called for a review of the U.S. government’s development assistance portfolio in Nigeria, particularly through PEPFAR, such a review has not yet been announced.

Uganda

Like Nigeria, Uganda has also long had a law criminalizing homosexuality. However, in February 2014, Uganda’s President Museveni signed a bill, originally proposed in 2009 (the original version included the death penalty), that imposes further criminal sanctions on LGBT individuals and those who support them.127  Since the signing of the bill, increased incidents of targeting and criminalization have been reported.128 ,129 ,130 The signing of the bill was largely unexpected, particularly due to earlier successful attempts to prevent passage and some indications by President Museveni that he would not sign it. The response by the U.S. and others to Uganda has been the most pronounced. Several donors, including the United Kingdom, Norway, Denmark,131  and the World Bank132  have stated that they are examining, redirecting, and/or suspending aid to the country, or indicated that their aid does not go to directly to the Ugandan government. UNAIDS133 ,134  and the Global Fund135  have expressed their strong concern. President Obama,136  Secretary Kerry,137  other Administration officials, and Members of Congress138  have issued strong statements and the Administration announced it would undertake a review of its portfolio (health and non-health) in Uganda. The USAID Mission Director in Uganda issued a memo to inform implementing partners that all external events, ribbon cuttings, workshops, launches, and/or program close-outs would require prior-approval.139  Recently, the Administration announced several additional steps it was taking to respond to the situation, including: shifting some funding away from the Inter-Religious Council of Uganda (IRCU), an organization that receives PEPFAR support but one that has also spoken out in favor of the law ($2.3 million in treatment funding will continue to be provided to the IRCU but $6.4 million will be redirected to other organizations); suspension of a CDC study of MSM due to concern about staff and survey respondents’ safety; redirection of U.S. funding to Uganda for tourism; and relocation of several Department of Defense events that were scheduled to take place in Uganda.140  The State Department’s travel advisory to LGBT travelers states that the “Embassy advises all U.S. citizens who are resident and those visiting Uganda to carefully consider their plans in light of this new law” 141  (the State Department’s Human Rights Country Report was published before the passage of the new law).

Despite these actions, and assurances by the Ugandan government that health services for LGBT individuals would not be affected, on April 3, a U.S.-funded health clinic and medical research facility, the Makerere University Walter Reed Project (MUWRP), was raided by Ugandan authorities and an employee arrested for conducting “unethical research” and “recruiting homosexuals.” In its response, the State Department wrote, “[w]hile that individual was subsequently released, this incident significantly heightens our concerns about respect for civil society and the rule of law in Uganda, and for the safety of LGBT individuals” and has temporarily suspended the MUWRP operations to ensure the “safety of staff and beneficiaries, and the integrity of the program”.142  A recent statement by the new U.S. Global AIDS Coordinator, Ambassador Deborah Birx, underscored PEPFAR’s intention to continue serving those in need in countries in which they faced violence or other legal action due to their sexual orientation, gender identity or other factors, recognizing the PEPFAR has long operated in such environments and will “not back down” now.143 


Issue Brief: Key Challenges, Opportunities, And Potential Next Steps

While collectively, U.S. efforts to date have served to bring new attention to the human rights and health needs of LGBT individuals, they are still relatively nascent, and operate within a larger context that includes complex discussions about the appropriate role of foreign aid and U.S. diplomacy in promoting health in other countries and multi-faceted bilateral relationships beyond health. Recent actions by the governments of Nigeria and Uganda, as well as others, and concerns that other countries may soon follow suit, have raised the stakes in the conversation and introduced a greater sense of urgency. Participants at two KFF roundtables discussed these topics and identified several key opportunities, challenges, and potential next steps for consideration by the U.S. in addressing the health needs of LGBT populations in the short and long terms. While there was considerable discussion of the difficulty in and sensitivity around identifying the most appropriate steps and leverage points to use at this time – in part because some of the changes at country-level are still being debated and interpreted – there was general agreement that the U.S. government should take action. Ultimately, participants felt that an overriding principle guiding any U.S. response should be to “do no harm” to LGBT individuals, that health services supported by the U.S. should be continued, and that there should be a focus on public health outcomes and program effectiveness. There was also recognition of the importance of considering the specific context and culture of each country and that growing acceptance of LGBT individuals in the U.S. took a long time, with rapid change only coming more recently. The key points from those discussions are summarized below.

Challenges

Roundtable participants raised and discussed several challenges to addressing global LGBT health in the short and long term. Specific challenges raised include:

  • Lack of a proactive and/or coordinated U.S. strategy. While participants recognized that the U.S. government had generally bolstered the importance of addressing LGBT human rights in its foreign policy efforts, they felt that the developments in Nigeria and Uganda were not met with a proactive or coordinated response. Without an organized response, participants were concerned about the potential for adverse health outcomes for individuals and the compromising of the effectiveness of U.S. health investments. Such a response was identified as particularly important given growing concerns that several other countries are moving in the direction of increased criminalization of same sex behavior and/or LGBT rights.
  • Reaching LGBT individuals with health interventions when they are criminalized by their State. A fundamental challenge that underscored much of the discussion was how best to ensure the effectiveness of U.S. supported health programs and reach LGBT individuals with essential health interventions, including for HIV, when they are criminalized by their State. Such situations pose challenges for recipients of services and program implementers, both of whom may be at risk for seeking and providing health services (as raised by the recent raid of the MUWRP by the Ugandan police), which could have adverse effects on health outcomes. Participants felt that there was an immediate need in Uganda and Nigeria, as well as a longer term need more generally, for the U.S. government to develop policies and protocols for addressing such situations. Some suggested that there were lessons to be learned from other countries where such laws have been in effect and even enforced144 ,145  but services have been successfully provided, as well as in cases where U.S.-supported health interventions have been provided to other populations who may be criminalized by their State, such as sex workers and injecting drug users.
  • Addressing the immediate needs of those in danger. While the U.S. and others have developed mechanisms for helping LGBT individuals facing violence and other threats in their countries, including the GEF, participants felt that many still faced numerous challenges to accessing such services, and would benefit from a more organized effort by the U.S. government and its missions in-country to provide assistance, including asylum where needed. They pointed to complex cases where LGBT individuals were leaving their country of origin to escape violence or arrest due to their sexual orientation or gender identity only to arrive in neighboring countries where similar challenges were encountered or assistance was not available.
  • Limited capacity of LGBT civil society. Despite some U.S. government and other efforts to build LGBT civil society capacity, it still remains minimal in many parts of the world, in part due to the presence of criminalization laws and laws restricting LGBT organizing. As such, civil society organizations have not always been equipped to respond to changes in local laws or enforcement of those laws. Participants stated that this represented a key challenge to dealing with the immediate situation in some countries and an important long term challenge ahead, and that bolstering LGBT civil society was critically needed.
  • Addressing claims of Western imperialism. A key challenge raised by participants was how to address and be sensitive to claims that the U.S. and other donors are imposing western values on other countries when they critique criminalization laws. This point was recognized as being a thorny and complicated issue for the U.S. and other Western governments, as well as NGOs, to address. Discussants felt that the U.S. and others would be well served by remaining sensitive to such claims, but also firm in expressing its position. Overcoming this perception could be helped through several approaches, such as: ensuring that any U.S./Western responses make the case for a broad vision of human rights and not focus on LGBT rights alone; emphasizing concerns about the health and safety of individuals and the success of U.S. health investments; fostering local and regional voices of authority to make statements against such discrimination; and engaging other sectors, including the private sector and faith community.
  • Managing the move toward increased “country ownership” of U.S. global health programs. Beyond the immediate concerns about the health and safety of LGBT individuals in countries that are further criminalizing same sex behavior, participants discussed the challenges related to the longer term move by the U.S. government toward greater country ownership of U.S. health and development programs. As described by the U.S. government, the ultimate goal of country ownership is to support “host country partners (including local stakeholders) in planning, overseeing, managing, delivering and eventually financing a health program responsive to the needs of their people to achieve and sustain health goals.”146  As such, concerns have been raised about how the rights and health needs of those who are most marginalized will be assured and monitored during and after transitions to more country-led programs, particularly in countries that criminalize their behavior and otherwise discriminate against them in the provision of health services; this is an especially acute concern now given what has is occurring in Nigeria and Uganda.147  Roundtable participants talked about the need to be cognizant of the trade-offs that accompany decreased U.S. government involvement in such settings and discussed the importance of ensuring the health status and human rights of LGBT individuals, as well as identifying metrics for measuring their health, during such transitions. A key theme stressed was the need to include civil society in the definition of country ownership and to further build capacity of LGBT civil society organizations going forward. The recent statement by the U.S. Global AIDS Coordinator addressed this issue, stating, “PEPFAR will not transition responsibility for its assistance to host governments without a well-defined and mutually-negotiated plan in place regardless of the context.”148 
  • Ongoing data gaps and research needs. Despite increased awareness of and studies on LGBT health (including a growing evidence base documenting the links between criminalization, discrimination, stigma and health), more data on the extent of the health needs and barriers faced by the LGBT population in low and middle income countries are needed. This includes a need for better metrics on MSM and transgender services and epidemiology by PEPFAR, as a way to help identify needs and calibrate the response. As has been pointed out by experts on LGBT health and human rights, there is a paradox at work where we often know the least those who are most hidden and stigmatized.149  Additional research and analysis would be important for informing U.S. and broader global efforts. Indeed, roundtable participants noted that where data and evidence have been available, there has been movement to resolve challenges and create programs. At the same time, while emphasizing the importance of data, participants also stressed the need to ensure that the way in which data are collected and used does not undermine the rights and safety of LGBT individuals and those who support them.

Opportunities

Despite these challenges, roundtable participants pointed to several opportunities for the U.S. government to further engage on global LGBT, including:

  • More conducive U.S. policy environment for addressing LGBT human rights around the world. Participants discussed how the increased attention to the human rights of LGBT individuals by the U.S. government in recent years – particularly the Presidential Memorandum and related agency efforts – and growing support for LGBT rights among the American public, provide a much more conducive policy environment for addressing the current, more urgent situations facing LGBT individuals in some countries, and for building a longer term, sustainable response. The response to date provides an important base from which to grow and build efforts that are still in their infancy. Participants underscored the need for ongoing leadership on LGBT human rights by U.S. government officials.
  • Potential to augment a focus on global LGBT health within U.S. global health policy. While there has been increased attention to LGBT human rights by the Administration and other global actors, there has been less explicit focus on LGBT health in U.S. global health strategies and agency plans. Where there has been inclusion of LGBT health, it has primarily been through the HIV-lens and could be expanded. Participants noted that the current discussions and concern about increased criminalization provided new opportunities to enhance the focus on LGBT health by emphasizing the real and growing concerns both for the effectiveness of U.S. health programs and the health of LGBT individuals. Moreover, several participants felt that a focus on the public health impacts of criminalization laws, discrimination, and stigma, provided a needed and important way in which to frame the U.S. response and concern.
  • Increasing coordination between broader human rights, LGBT, and health groups on LGBT health issues. One development noted by participants is increasing coordination and collaboration between constituencies that have not always worked together including human rights, LGBT, HIV, and broader global health groups. This presents new opportunities to build synergies and inform the U.S. response on LGBT health and address complex challenges on the ground. Human rights experts spoke, for example, about how the recent trends towards further criminalization of LGBT individuals often took place in the context of other violations of human rights. Global health groups with large footprints around the world also spoke about their ability to more directly engage on LGBT health issues.
  • Elevating LGBT voices in-country to help inform the U.S. policy response. Many participants talked about the critical importance of elevating in-country LGBT voices, particularly from the global south, in informing U.S. policy and responses and speaking about the impacts of criminalization laws and health needs they face. There are positive examples of this already happening – for example, LGBT communities in Nigeria and Uganda, respectively, have provided guidance on how other governments and organizations can respond to the recent criminalization in their countries150 ,151  and more opportunities could be sought by the U.S. government and NGOs for such engagement, opportunities that would also help to build civil society and ensure that responses are grounded in the realities facing LGBT individuals on the ground. This could include funding for civil society advocacy and other work. At the same, time, participants spoke about the risks associated with this visibility and the need to ensure safety of individuals and groups willing to speak out.
  • Using the post-2015 framework. As the global community approaches the 2015 deadline set to achieve the Millennium Development Goals (MDGs), agreed to by all Member States of the United Nations, it is moving toward finalizing a new, “post-2015” global development framework and attendant goals. Because of its significance in setting global goals and direction, participants saw the post-2015 framework as an important opportunity for addressing LGBT development and health needs. Discussions about the post-2015 framework have included human rights, inequality, and, more recently, non-discrimination, although discussion of LGBT rights has been minimal and primarily introduced by NGOs through external consultations. While it is unclear if LGBT health and rights will be explicitly addressed in the new framework, participants felt that it was an important process to monitor and be part of going forward.
  • Growing evidence base. Despite data gaps that remain, there is a growing evidence base regarding barriers to accessing health services, health disparities, and the health effects of these barriers, including criminalization laws, on LGBT individuals. These data underscore the importance of the need to support health access in order to achieve key global goals, including achieving universal access and reaching an AIDS-free Generation. As noted above, where data and evidence have been available, there has been movement to resolve challenges and create programs. There are some recent examples of efforts to support more data collection, including the recent approval by the Global Fund’s Board of funding to support research on size estimation and surveys of key populations.152 

Looking Forward: Potential Next Steps

Participants outlined a number of concrete steps that could be taken in the short and long term to facilitate the U.S. response to current, urgent situations and bolster a longer term effort to address global LGTB health. All felt that additional actions by the U.S. government were needed. These included:

  • Review U.S. health and development portfolios. Several NGOs and Members of Congress have called on the State Department to review its health and development portfolios in countries that criminalize same sex behavior, beyond Uganda. While most participants echoed this view, they recognized that a more realistic, short term effort could at least be focused on those countries that have already taken steps to further criminalize same sex behavior or restrict LGBT rights (whether through law or enforcement) and others that appear to be moving in this direction now. Such efforts should include a strong emphasis on the health implications of these laws, including where they could compromise access and safety and whether they were consistent with U.S. programmatic goals.
  • Develop proactive strategy for moving forward. In addition to a current review of U.S. government portfolios in select countries, participants felt strongly that a proactive strategy and greater coordination internally were needed, particularly given concerns that several other countries are moving to further criminalize same sex behavior. A proactive strategy could include development of clear protocols, guidelines and procedures and training of U.S. personnel and implementers (building on what is already starting through PEPFAR for example). The U.S. could look to other countries and organizations for best practices in this regard.
  • Consider appointing a U.S. “Special Envoy” or other high-level point person on LGBT issues. Several participants spoke about the importance of having a high-level USG point person, such as a Special Envoy, on LGBT issues who could lead the government’s response in this area. Such an individual could help to ensure coordination and ongoing attention to LGBT issues in foreign policy, particularly when there was a situation that needed more urgent attention and required multi-agency responses, but also for longer term progress. It was noted that a new position of this sort would need to have sufficient seniority and authority to be successful.
  • Expand efforts to help LGBT individuals facing violence, arrest, and threats due to their sexual orientation or gender identity. While it was noted that the U.S. has more broadly worked to address the needs of LGBT individuals facing violence, arrest, and other threats, many felt that the current situation in Uganda, Nigeria, and elsewhere required a stepped-up response and plan. Concerns were raised that it was still not clear where LGBT individuals in such situations could go for assistance and how quickly such assistance could be provided.
  • Articulate importance of continuing U.S.-funded health services. Participants felt that it was critically urgent for the U.S. government to articulate its support for and the importance of continuing health services in countries where increased discrimination and criminalization might be occurring. They raised concern that some signals have been sent suggesting that health services support could be suspended and noted that even such a suggestion could negatively affect the health-seeking behavior of individuals needing services and was unlikely to have any effect on government laws and actions. In the wake of the recent raid by the Ugandan police on the MUWRP, the new U.S. Global AIDS Coordinator reaffirmed PEPFAR’s intention to continue services, stating that PEPFAR would not “ take actions that harm the very individuals for whom we have a responsibility to serve – such as curtailing their access to core HIV services solely because the political, cultural, or security space in which we operate gets rough.”153 
  • Bolster PEFPAR’s focus on LGBT health access and safety. Because PEPFAR is the largest component of the U.S. global health response and HIV has such a disproportionate impact on MSM and transgender individuals, many felt that while PEPFAR has increased its efforts to help key populations, such efforts could be expanded. In particular, participants felt that among all USG programs, the review of PEPFAR’s in-country portfolio was most urgent and that guidance from the Office of the Global AIDS Coordinator on how best to address the current situation and potential future challenges was needed, in addition to broader USG guidance.
  • Use Global Health Diplomacy. In addition to foreign assistance, roundtable participants discussed the importance of using bilateral and multilateral global health diplomacy – which the U.S. has recently emphasized more generally154 ,155  – to address LGBT  issues with country leaders, both in the short term but also longer term, given the recognition that changing views toward LGBT individuals and protections will take time. This could include a more explicit role for U.S. Ambassadors, some of whom have already been outspoken about protecting LGBT rights and health. One potential new asset that the USG has to promote health through diplomatic channels is the recently created Office of Global Health Diplomacy at the State Department which “guides diplomatic efforts to advance the United States’ global health mission to improve and save lives and foster sustainability through a shared global responsibility.”156    A key aspect of the work of this office is to support the role of U.S. Ambassadors in promoting and discussing the importance of health. This office could play a more prominent role in raising the health challenges faced by LGBT people and how violence, discrimination, and stigma affect their health and compromise the potential to reach agreed upon global health goals. Beyond bilateral diplomacy, participants underscored the important and ongoing work the U.S. government has done to raise LGBT health issues at the WHO.
  • Coordinate with other donor governments and multilateral organizations. Coordinating the U.S. response with that of other donors, including governments and multilateral actors was seen as very important in this work, both to address short term needs of LGBT individuals seeking health services but also for longer term efforts. The World Bank, the Global Fund, and UNAIDS in particular were identified by participants as key organizations for the U.S. to work with more explicitly on LGBT rights, given that each has been directly involved in responding to the situation in Uganda and Nigeria as well as other countries. Some of this coordination is already underway but participants felt it could be increased and should clearly be part of any response going forward.
  • Engage the private sector. The role of the private sector in responding to HIV, and other global health challenges, has been significant157  and was seen as a potential untapped resource for addressing LGBT rights and health globally (as it has also been in the U.S. domestic context158  and in response to Russia’s recent law).159  Participants discussed the possibility of finding ways to engage the private sector with business assets in countries that have been moving to further criminalize same sex behavior or restrict LGBT rights to discuss why such laws can be harmful to their employees, customers, and the broader climate for business.
  • Engage the faith community. The faith community has long provided HIV and other global health services in low and middle income countries,160  including with support from the U.S. government. At the same time, some faith organizations have been directly linked to the introduction of criminalization laws and anti-gay sentiment in some countries.161  Others have spoken out against discrimination and such laws. Given the importance of the faith community in providing health services and dialoguing with country leaders, participants felt it was critically important to engage them on LGBT issues, focusing on health needs and services.
  • Build LGBT Civil Society. Given the critical role played by civil society in both providing services to and advocating for individuals, and for monitoring government programs and policies, participants felt that an important next step was for the U.S. government to find new ways to build LGBT civil society capacity in low and middle income countries, beyond its current efforts. This would include additional support from PEPFAR but also from the State Department and USAID.
  • Support data collection, research, and analysis on global LGBT health. Participants felt that the U.S. government was uniquely situated to support further data collection and analysis on LGBT health in low and middle income countries, including developing short term systems for documenting what is happening on the ground in countries where further criminalization is occurring and more systematically cataloguing the evidence, particularly related to the relationship between stigma, discrimination, and criminalization and health outcomes.

Conclusion

This is an important and challenging time for addressing the health and human rights of LGBT individuals around the world. While there have been tremendous gains in some countries, there is a rising trend in others to further criminalize same sex behavior and/or discriminate against LGBT people, activities which have been shown to have an adverse effect on health. The U.S. government has already begun to enhance its focus on LGBT rights and health through its foreign policy work, and to address recent cases in some countries, yet these efforts are nascent and most are not health-specific. Participants in two roundtables convened by the Kaiser Family Foundation felt that more could be done in both the short and long term. Key aspects of any response should include a guiding principle of “do no harm” to LGBT individuals; the continuation of U.S. supported health services; a focus on public health outcomes and program effectiveness; and a recognition of the specific context of countries where the U.S. supports health programs. Beyond identifying opportunities for addressing the immediate needs of LGBT individuals in countries where they may face harm, there are also opportunities for the U.S. to further enhance its efforts to address the health needs – in addition to the human rights – of LGBT individuals, and to build the capacity of civil society organizations on LGBT health.

Appendix

U.S. Global Health Assistance, FY 2013, by Program Area & Presence of Anti-LGBT Laws by Country

Country Criminalizes HomosexualityCountryTotalU.S. Global Health AssistancePEPFAR (HIV)(26)TB(15) Malaria(17)MNCH(23)FPRH(21)Nutrition(15)Water(21)
YesAfghanistan169,937,000250,0008,000,000101,100,00021,700,0002,310,00036,577,000
YesAngola49,557,00015,691,00028,548,0001,312,0004,006,000
Armenia2,868,0001,425,000200,000761,000482,000
YesBangladesh96,883,0001,000,00013,008,00028,547,00026,644,00024,406,0003,278,000
Benin23,466,00016,653,0003,806,0003,007,000
YesBotswana61,294,00061,294,000
Brazil1,081,0001,081,000
Burkina Faso11,571,0009,421,0002,150,000
YesBurma20,848,00010,000,0001,427,0006,566,0002,855,000
YesBurundi40,100,00018,860,0009,229,0002,004,0003,007,0007,000,000
Cambodia37,914,00013,745,0006,185,0003,997,0007,018,0005,005,0001,009,000955,000
YesCameroon25,325,00025,325,000
Chad500,000250,000250,000
China2,977,0002,977,000
Cote d’Ivoire135,269,000135,269,000
DRC166,018,00048,733,00013,008,00041,869,00034,354,00016,177,0003,808,0008,069,000
Djibouti1,800,0001,800,000
Dominican Republic13,824,00012,872,000952,000
YesEgypt2,893,0002,893,000
YesEthiopia329,754,000181,698,00013,008,00043,773,00037,111,00030,450,00013,204,00010,510,000
Georgia3,664,0001,430,000804,0001,430,000
YesGhana73,014,00012,170,00028,547,0008,003,00013,008,0006,509,0004,777,000
Guatemala26,846,0005,710,0006,566,00014,570,000
YesGuinea17,880,00012,370,0002,503,0003,007,000
YesGuyana8,866,0008,866,000
Haiti162,882,000129,865,00014,007,0009,002,00010,008,000
Honduras3,578,0002,151,0001,427,000
YesIndia77,560,00026,650,0009,992,00019,032,00021,886,000
Indonesia48,924,0008,000,00013,512,00020,002,0007,410,000
Jordan49,000,00010,000,00015,000,00024,000,000
Kazakhstan2,234,0002,234,000
YesKenya356,030,000269,585,0004,501,00034,257,00011,419,00025,140,0003,007,0008,121,000
Kyrgyz Republic4,282,0004,282,000
YesLebanon11,993,00011,993,000
Lesotho26,165,00026,165,000
YesLiberia53,932,0003,500,00012,370,00013,038,0007,004,0004,000,00014,020,000
Madagascar52,930,00026,026,0009,982,00014,007,0001,375,0001,540,000
YesMalawi138,657,00073,513,0001,504,00024,075,00015,804,00012,704,0009,146,0001,911,000
YesMaldives955,000955,000
Mali64,241,0004,352,00025,008,00013,655,00011,010,0004,006,0006,210,000
YesMozambique273,804,000207,212,0005,006,00029,023,00012,085,00012,846,0005,005,0002,627,000
YesNamibia77,877,00077,877,000
Nepal40,489,0003,001,00015,501,00013,893,0006,661,0001,433,000
Niger4,200,0001,750,000700,0001,750,000
Yes*Nigeria625,974,000455,746,00013,008,00073,271,00045,676,00033,496,0004,777,000
YesPakistan31,349,00017,500,00012,500,0001,349,000
YesPapua New Guinea4,853,0004,853,000
Philippines36,632,00012,304,0002,502,00018,004,0003,822,000
Rwanda136,694,00092,100,00018,004,0009,016,00012,370,0003,007,0002,197,000
YesSenegal64,416,0004,538,00024,123,0008,469,00014,654,0004,511,0008,121,000
YesSierra Leone5,500,000500,0002,500,0002,500,000
Yes*Somalia1,911,0001,911,000
South Africa489,576,000477,335,00012,009,000232,000
YesSouth Sudan64,371,00016,349,0001,503,0006,947,00020,078,0008,003,00011,491,000
YesSwaziland26,054,00026,054,000
Tajikistan7,500,0003,475,0002,008,0001,008,0001,009,000
YesTanzania443,442,000340,670,0004,501,00046,056,00012,622,00025,702,0007,203,0006,688,000
Thailand1,000,0001,000,000
Timor-Leste2,013,0001,004,0001,009,000
YesUganda409,244,000316,140,0005,005,00033,781,00012,416,00026,549,00011,054,0004,299,000
Ukraine29,587,00024,363,0004,006,0001,218,000
YesUzbekistan3,045,0003,045,000
Vietnam65,676,00065,676,000
West Bank & Gaza1,929,0001,929,000
Yes*Yemen11,689,0005,490,0002,855,0003,344,000
YesZambia363,207,000301,461,0004,501,00024,027,00011,826,00013,008,0003,607,0004,777,000
YesZimbabwe123,121,00088,355,0006,005,00015,035,0003,530,0002,008,0007,564,000766,000
Total67 countries$5,722,807,0003,596,491,000167,884,000592,976,000549,342,000451,071,000159,579,000205,464,000
Subtotal (w/laws)34 countries$4,065,977,0002,548,157,00094,014,000451,998,000394,920,000320,177,000111,026,000145,185,000

NOTES: *Imposes the death penalty (in Nigeria, this applies to 12 northern states). Represents FY 2013 enacted amounts. Does not include additional funding that may be provided to individual countries through regional programs, or funding for “other” global health of $10,489,000 that was provided to Afghanistan in 2013.SOURCES: KFF analysis of data from www.foreignassistance.gov; IGLA, State-Sponsored Homophobia, 2013; State Department, Country Reports on Human Rights Practices for 2013.

Endnotes

  1. Ilan H Meyer, “Why Lesbian, Gay, Bisexual, and Transgender Public Health?,” American Journal of Public Health 91 (2001):856-859. ↩︎
  2. Simon Lewin and Ilan H Meyer, “Torture, Ill-treatment, and Sexual Identity,” Lancet 358 (2001): 1899 – 1900. ↩︎
  3. Nils Daulaire, “The Importance of LGBT Health on a Global Scale,” LGBT Health 1 (2013): 8-9. ↩︎
  4. World Health Organization, “Improving the Health and Well-being of Lesbian, Gay, Bisexual and Transgender Persons,” EB133/6 (2013). http://apps.who.int/gb/ebwha/pdf_files/EB133/B133_6-en.pdf. ↩︎
  5. Institute of Medicine, The Health of Lesbian, Gay, Bisexual, and Transgender People: Building a Foundation for Better Understanding. Washington, DC: National Academies Press, 2011. http://www.iom.edu/Reports/2011/The-Health-of-Lesbian-Gay-Bisexual-and-Transgender-People.aspx. ↩︎
  6. USAID, The USAID Vision for Action: Promoting and Supporting the Inclusion of Lesbian, Gay, Bisexual, and Transgender Individuals, Draft (2013). http://www.usaid.gov/sites/default/files/Draft_USAID_LGBT_Vision_for_Public_Comment.pdf. ↩︎
  7. State Department, Country Reports on Human Rights Practices for 2013, (2014). http://www.state.gov/j/drl/rls/hrrpt/humanrightsreport/index.htm#wrapper. ↩︎
  8. UN General Assembly, Human Rights Council, “Discriminatory Laws and Practices and Acts of Violence against Individuals Based on their Sexual Orientation and Gender Identity”, A/HRC/19/41 (2011). http://www2.ohchr.org/english/bodies/hrcouncil/docs/19session/A.HRC.19.41_English.pdf. ↩︎
  9. UNAIDS, “Overcoming Discriminatory Barriers to Health Services”, March 14, 2014. http://www.unaids.org/en/resources/presscentre/featurestories/2014/march/20140314discriminationbarriers/. ↩︎
  10. Rachel L. Kaplan, Glenn J. Wagner, Simon Nehme, Frances Aunon, Danielle Khouri and Jacques Mokhbat, “Forms of Safety and their Impact on Health: An Exploration of HIV/AIDS-related Risk and Resilience among Trans Women in Lebanon.” Health Care for Women International, epub ahead of print (2014). ↩︎
  11. Sexual orientation is defined as “an enduring pattern of or disposition to experience sexual or romantic desires for, and relationships with, people of one’s same sex, the other sex, or both sexes” (see, Institute of Medicine, 2011).  This definition incorporates elements of attraction, behavior, and identity. Gender Identity refers to “an individual’s internal sense of being male, female, or something else.  Since gender identity is internal, one’s gender identity is not necessarily visible to others” (see, National Center for Transgender Equality. Transgender Terminology, 2014). Gender expression refers to how “a person represents or expresses one’s gender identity to others, often through behavior, clothing, hairstyles, voice or body characteristics” see, National Center for Transgender Equality. Transgender Terminology, 2014). Transgender refers to individuals whose “gender identity, expression or behavior is different from those typically associated with their assigned sex at birth” see, National Center for Transgender Equality. Transgender Terminology, 2014). ↩︎
  12. UN General Assembly, Human Rights Council, “Discriminatory Laws and Practices and Acts of Violence against Individuals Based on their Sexual Orientation and Gender Identity”, A/HRC/19/41 (2011). http://www2.ohchr.org/english/bodies/hrcouncil/docs/19session/A.HRC.19.41_English.pdf. ↩︎
  13. UNAIDS, “Homophobia and Punitive Laws Continue to Threaten HIV Responses and Human Rights,” August, 28, 2012. http://www.unaids.org/en/resources/presscentre/featurestories/2012/august/20120828punitivelaws/. ↩︎
  14. Pew Research Center, A Survey of LGBT Americans Attitudes, Experiences and Values in Changing Times, June 13, 2013. http://www.pewsocialtrends.org/2013/06/13/a-survey-of-lgbt-americans/. ↩︎
  15. Mikel L. Walters, Jieru Chen, and Matthew J. Breiding, The National Intimate Partner and Sexual Violence Survey (NISVS): 2010 Findings on Victimization by Sexual Orientation. Atlanta, GA: National Center for Injury Prevention and Control, Centers for Disease Control and Prevention, 2013. http://www.cdc.gov/violenceprevention/pdf/nisvs_sofindings.pdf. ↩︎
  16. State Department, Country Reports on Human Rights Practices for 2013, (2014). http://www.state.gov/j/drl/rls/hrrpt/humanrightsreport/index.htm#wrapper. ↩︎
  17. ILGA, State-Sponsored Homophobia-A World Survey of Laws: Criminalisation, Protection and Recognition of Same-Sex Love, 8th Edition (2013). http://ilga.org/ilga/en/article/o5VlRM41Oq. ↩︎
  18. This includes the 76 countries identified by ILGA, as of May 2013 (see, ILGA, State-Sponsored Homophobia,2013), as well as India, whose Supreme Court reinstated a law criminalizing consensual same sex behavior between adults in December 2013. Not included in the total is Russia which decriminalized same sex behavior between consenting adults in 1993, but criminalized “the propaganda of nontraditional sexual relations to minors” in June 2013. (See, State Department, Country Reports on Human Rights Practices for 2013 for additional information on India and Russia). ↩︎
  19. Defined as laws which criminalize same-sex activity between consenting adults. ↩︎
  20. These laws vary by country, ranging in terms of the severity of sentence (e.g., length of imprisonment), whether they are part of the penal code or common law, whether regularly enforced, and other factors. For more information see, IGLA, State-Sponsored Homophobia (2013). ↩︎
  21. ILGA, State-Sponsored Homophobia-A World Survey of Laws: Criminalisation, Protection and Recognition of Same-Sex Love, 8th Edition (2013). http://ilga.org/ilga/en/article/o5VlRM41Oq. ↩︎
  22. UN General Assembly, Human Rights Council, “Discriminatory Laws and Practices and Acts of Violence against Individuals Based on their Sexual Orientation and Gender Identity”, A/HRC/19/41 (2011). http://www2.ohchr.org/english/bodies/hrcouncil/docs/19session/A.HRC.19.41_English.pdf. ↩︎
  23. Council for Global Equality and Human Rights First, How to Protect LGBTI Persons around the World from Violence: Blueprint For the Next Administration, (2012).  http://www.globalequality.org/storage/documents/pdf/hrf_lgbti_blueprint.pdf. ↩︎
  24. Institute of Medicine, The Health of Lesbian, Gay, Bisexual, and Transgender People: Building a Foundation for Better Understanding. Washington, DC: National Academies Press, 2011. http://www.iom.edu/Reports/2011/The-Health-of-Lesbian-Gay-Bisexual-and-Transgender-People.aspx. ↩︎
  25. Gregorio A Millett, William L Jeffries 4th, John L Peterson, David J Malebranche, Tim Lane, Stephen A Flores, Kevin A Fenton, Patrick A Wilson, Riley Steiner, and Charles M Heilig, “Common Roots: A Contextual Review of HIV Epidemics in Black Men who have Sex with Men Across the African Diaspora,” Lancet 380(2012):411-23. ↩︎
  26. Stefan Baral, Gift Trapence, Felistus Motimed, Eric Umar, Scholastika Iipinge, Friedel Dausab, and Chris Beyrer, “HIV Prevalence, Risks for HIV Infection, and Human Rights among Men Who Have Sex with Men (MSM) in Malawi, Namibia, and Botswana,” PLoS ONE 4(2009): e4997. ↩︎
  27. Stefan Baral, Darrin Adams, Judith Lebona, Bafokeng Kaibe, Puleng Letsie, Relebohile Tshehlo, Andrea Wirtz and Chris Beyrer, “A Cross-sectional Assessment of Population Demographics, HIV Risks and Human Rights Contexts Among Men who have Sex with Men in Lesotho,” Journal of the International AIDS Society 14 (2011):36. ↩︎
  28. Heather Fay, Stefan D. Baral, Gift Trapence, Felistus Motimedi, Eric Umar, Scholastika Iipinge, Friedel Dausab, Andrea Wirtz, and Chris Beyrer, “Stigma, Health Care Access, and HIV Knowledge Among Men Who Have Sex With Men in Malawi, Namibia, and Botswana,” AIDS and Behavior 15 (2011):1088–1097. ↩︎
  29. Tonia Poteat, Daouda Diouf, Fatou Maria Drame, Marieme Ndaw, Cheikh Traore, Mandeep Dhaliwal, Chris Beyrer, and Stefan Baral, “HIV Risk among MSM in Senegal: A Qualitative Rapid Assessment of the Impact of Enforcing Laws That Criminalize Same Sex Practices,” PLoS ONE 6(2011): e28760. ↩︎
  30. Stefan Baral Paul Semugoma, Daouda Diouf, Gift Trapence, Tonia Poteat, Marieme Ndaw, Fatou Maria Drame, Mandeep Dhaliwal, C. Traore, N Diop, S. Bhattacharya, T. Sellers, Andrea Wirtz, and Chris Beyrer, “Criminalization of same sex practices as a structural driver of HIV risk among men who have sex with men (MSM): The cases of Senegal, Malawi, and Uganda,” Paper presented at the International AIDS Conference, Vienna, Austria, July 18-23, 2010. ↩︎
  31. Wolfgang Hladik, Joseph Barker, John M. Ssenkusu, Alex Opio, Jordan W. Tappero, Avi Hakim, and David Serwadda, “HIV Infection among Men Who Have Sex with Men in Kampala, Uganda–A Respondent Driven Sampling Survey among Men who have Sex with Men in Kampala, Uganda–A Respondent Driven Sampling Survey,”  PLoS ONE 7(2012), e38143. ↩︎
  32. UNAIDS, Global Report: UNAIDS Report on the Global AIDS Epidemic 2013, Geneva: UNAIDS, 2013. ↩︎
  33. Chris Beyrer, Stefan D Baral, Frits van Griensven, Steven M Goodreau, Suwat Chariyalertsak, Andrea L Wirtz, and Ron Brookmeyer, “Global Epidemiology of HIV Infection in Men who have Sex with Men”, Lancet 380 (2012): 367-377. ↩︎
  34. Chris Beyrer, Stefan D Baral, Frits van Griensven, Steven M Goodreau, Suwat Chariyalertsak, Andrea L Wirtz, and Ron Brookmeyer, “Global Epidemiology of HIV Infection in Men who have Sex with Men”, Lancet 380 (2012): 367-377. ↩︎
  35. Chris Beyrer, Patrick Sullivan, Jorge Sanchez, Stefan D. Baral, Chris Collins, Andrea L. Wirtz, Dennis Altman, Gift Trapence and Kenneth Mayer, “Global Epidemiology of HIV Infection in Men who have Sex with Men, AIDS 27 (2013): 2665–2678. ↩︎
  36. Stefan D Baral, Ashley Grosso, Claire Holland, and Erin Papworth, “The Epidemiology of HIV among Men who have Sex with Men in Countries with Generalized HIV Epidemics,” Current Opinion in HIV and AIDS 9 (2014): 156–167. ↩︎
  37. UNAIDS, Global Report: UNAIDS Report on the Global AIDS Epidemic 2013, Geneva: UNAIDS, 2013. ↩︎
  38. Tonia Poteat, Daouda Diouf, Fatou Maria Drame, Marieme Ndaw, Cheikh Traore, MandeepDhaliwal, Chris Beyrer, and Stefan Baral, “HIV Risk among MSM in Senegal: A Qualitative Rapid Assessment of the Impact of Enforcing Laws That Criminalize Same Sex Practices,” PLoS ONE 6(2011): e28760. ↩︎
  39. State Department, Press Statement by Marie Harf, “Raid on the Makerere University Walter Reed Project by Ugandan Authorities”, April 4, 2014. http://www.state.gov/r/pa/prs/ps/2014/04/224431.htm. ↩︎
  40. White House, Office of the Press Secretary, Presidential Memorandum, “International Initiatives to Advance the Human Rights of Lesbian, Gay, Bisexual, and Transgender Persons,” December 6, 2011. http://www.whitehouse.gov/the-press-office/2011/12/06/presidential-memorandum-international-initiatives-advance-human-rights-l. ↩︎
  41. UN General Assembly, Human Rights Council, “Human Rights, Sexual Orientation and Gender Identity”, A/HRC/RES/17/19 (2011). http://daccess-dds-ny.un.org/doc/UNDOC/GEN/G11/148/76/PDF/G1114876.pdf?OpenElement. ↩︎
  42. State Department, Fact Sheet, “The Department of State’s Accomplishments Promoting the Human Rights of Lesbian, Gay, Bisexual and Transgender People,” December 6, 2011. http://www.state.gov/r/pa/prs/ps/2011/12/178341.htm. ↩︎
  43. Tristan McConnell, “Uganda’s New Anti-Gay Law: Part of a Broader Trend in Africa,” National Geographic, February 28, 2014. http://news.nationalgeographic.com/news/2014/02/140228-uganda-anti-gay-law-smug-homophobia-africa-world/. ↩︎
  44. Gabe Joselow, “After Uganda, Kenya Gears up for Gay Rights Debate,” Voice of America, March 5, 2014. http://www.voanews.com/content/after-uganda-kenya-gears-up-for-gay-rights-debate/1864600.html. ↩︎
  45.  Valérie Bah, “Congo-Kinshasa: DRC Looks to Follow in Uganda’s Footsteps With Anti-Gay Bill,” Think Africa Press, March 11, 2014. http://allafrica.com/stories/201403111646.html?viewall=1. ↩︎
  46. Emmanuel Muga, “Dar plans to introduce tougher anti-gay Bill,” East African, March 29, 2014. http://www.theeastafrican.co.ke/news/Dar-plans-to-introduce-tougher-anti-gay-Bill–/-/2558/2262374/-/iq7xix/-/index.html. ↩︎
  47. J. Lester Feder, “Russian-Style “Gay Propaganda” Law Introduced In Kyrgyzstan,” Buzzfeed, March 27, 2014. http://www.buzzfeed.com/lesterfeder/russian-style-gay-propaganda-law-introduced-in-kyrgyzstan. ↩︎
  48. White House, Office of the Press Secretary, Presidential Memorandum, “International Initiatives to Advance the Human Rights of Lesbian, Gay, Bisexual, and Transgender Persons,” December 6, 2011. http://www.whitehouse.gov/the-press-office/2011/12/06/presidential-memorandum-international-initiatives-advance-human-rights-l. ↩︎
  49. State Department, Bureau of Public Affairs, Fact Sheet, “Advancing the Human Rights of Lesbian, Gay, Bisexual and Transgender Persons Worldwide: A State Department Priority,” June 28, 2013. http://www.state.gov/r/pa/pl/2013/211478.htm. ↩︎
  50. USAID, Press Office, “USAID Announces New Partnership to Promote LGBT Human Rights Abroad,” April 8, 2013. http://www.usaid.gov/news-information/press-releases/usaid-announces-new-partnership-promote-lgbt-human-rights-abroad ↩︎
  51. State Department, Press Statement, Hillary Rodham Clinton, “In Recognition of Gay and Lesbian Pride Month 2009,” June 1, 2009. http://www.state.gov/secretary/20092013clinton/rm/2009a/06/124176.htm. ↩︎
  52. State Department, Remarks by Hillary Rodham Clinton, “Remarks on the Human Rights Agenda for the 21st Century,” December 14, 2009. http://www.state.gov/secretary/20092013clinton/rm/2009a/12/133544.htm. ↩︎
  53. State Department, Bureau of Public Affairs, Fact Sheet, “Advancing the Human Rights of Lesbian, Gay, Bisexual and Transgender Persons Worldwide: A State Department Priority,” June 28, 2013. http://www.state.gov/r/pa/pl/2013/211478.htm. ↩︎
  54. UN General Assembly, Human Rights Council, “Human rights, sexual orientation and gender identity,” A/HRC/RES/17/19, July 14, 2011. http://daccess-dds-ny.un.org/doc/UNDOC/GEN/G11/148/76/PDF/G1114876.pdf?OpenElement. ↩︎
  55. State Department, “The Department of State’s Accomplishments Promoting the Human Rights of Lesbian, Gay, Bisexual and Transgender People,” December 6, 2011. http://www.state.gov/r/pa/prs/ps/2011/12/178341.htm. ↩︎
  56. White House, Office of the Press Secretary, “Remarks by President Obama in Address to the United Nations General Assembly”, September 21, 2011. http://www.whitehouse.gov/the-press-office/2011/09/21/remarks-president-obama-address-united-nations-general-assembly. ↩︎
  57. White House, Office of the Press Secretary, Presidential Memorandum, “International Initiatives to Advance the Human Rights of Lesbian, Gay, Bisexual, and Transgender Persons,” December 6, 2011. http://www.whitehouse.gov/the-press-office/2011/12/06/presidential-memorandum-international-initiatives-advance-human-rights-l. ↩︎
  58. White House, Office of the Press Secretary, Fact Sheet, “Working to Advance the Human Rights of Lesbian, Gay, Bisexual, and Transgender (LGBT) Persons Globally,” December 6, 2011. http://www.whitehouse.gov/the-press-office/2011/12/06/fact-sheet-working-advance-human-rights-lesbian-gay-bisexual-and-transge. ↩︎
  59. State Department, Remarks by Hillary Rodham Clinton, “Free and Equal in Dignity and Rights”, December 6, 2012. http://www.humanrights.gov/2011/12/06/remarks-in-recognition-of-international-human-rights-day/. ↩︎
  60. Current GEF partners, in addition to the U.S. government, include the governments of Denmark, Finland, France, Germany, Iceland, the Netherlands, Norway, and Sweden; the Arcus Foundation, the John D. Evans Foundation, LLH: the Norwegian LGBT Organization, the M∙A∙C AIDS Fund, and Deloitte. See, http://www.state.gov/globalequality/about/index.htm. ↩︎
  61. State Department, Global Equality Fund. http://www.state.gov/globalequality/. ↩︎
  62. State Department, Media Note, “The State Department Welcomes New Private Sector Support for the Global Equality Fund,” December 10, 2013. http://www.state.gov/r/pa/prs/ps/2013/218569.htm. ↩︎
  63. State Department, Remarks by Anne C. Richard, “Strengthening Protection for LGBT Refugees,” May 17, 2012. http://www.state.gov/j/prm/releases/remarks/2012/190280.htm. ↩︎
  64. U.S. Customs and Immigration Services, “Guidance For Adjudicating Lesbian, Gay, Bisexual, Transgender, And Intersex (LGBTI) Refugee And Asylum Claims,” Training Module, December 28, 2011. http://www.uscis.gov/sites/default/files/USCIS/Humanitarian/Refugees%20%26%20Asylum/Asylum ↩︎
  65. USAID, USAID Policy Framework 2011-2015 (2011). http://www.usaid.gov/sites/default/files/documents/1870/USAID%20Policy%20Framework%202011-2015.PDF. ↩︎
  66. USAID, Strategy on Democracy, Human Rights and Governance (2013). http://www.usaid.gov/sites/default/files/documents/1866/USAID%20DRG_%20final%20final%206-24%203%20(1).pdf. ↩︎
  67. USAID, Youth in Development Policy (2012). http://www.usaid.gov/sites/default/files/documents/1870/Youth_in_Development_Policy_0.pdf. ↩︎
  68. USAID, Country Development Cooperative Strategy (CDCS) Guidance Version 3 (2013). http://www.usaid.gov/sites/default/files/documents/1870/CDCS_Guidance_V3.pdf. ↩︎
  69. USAID, Global Health Strategic Framework for FY 2012-2016 (2012). http://www.usaid.gov/sites/default/files/documents/1864/gh_framework2012.pdf. ↩︎
  70. USAID, “Award Provisions Encouraging More Comprehensive Nondiscrimination Policies by USAID Contractors and Recipients: A Mandatory Reference for ADS Chapter 302.” June 19, 2012. http://www.usaid.gov/sites/default/files/documents/1868/302mbf.pdf. ↩︎
  71. USAID, The USAID Vision for Action: Promoting and Supporting the Inclusion of Lesbian, Gay, Bisexual, and Transgender Individuals, Draft (2013). http://www.usaid.gov/sites/default/files/Draft_USAID_LGBT_Vision_for_Public_Comment.pdf. ↩︎
  72. USAID, Press Office, “USAID Announces New Partnership To Promote LGBT Human Rights Abroad”. Partners include the Swedish International Development Cooperation Agency, Astraea Lesbian Foundation for Justice, the Gay & Lesbian Victory Institute, the Williams Institute, and Olivia Companies,” April 8, 2013. http://www.usaid.gov/news-information/press-releases/usaid-announces-new-partnership-promote-lgbt-human-rights-abroad ↩︎
  73. USAID, The USAID Vision for Action: Promoting and Supporting the Inclusion of Lesbian, Gay, Bisexual, and Transgender Individuals, Draft (2013). http://www.usaid.gov/sites/default/files/Draft_USAID_LGBT_Vision_for_Public_Comment.pdf. ↩︎
  74. White House, Blog Post by Samantha Power, “US Leadership to Advance Equality for LGBT People Abroad”, December 13, 2012. http://www.whitehouse.gov/blog/2012/12/13/us-leadership-advance-equality-lgbt-people-abroad. ↩︎
  75. Millennium Challenge Corporation, Selection Indicators. http://www.mcc.gov/pages/selection/indicators. ↩︎
  76. See, for example: Millennium Challenge Corporation, Press Release, “MCC Finalizes $350 Million Compact with Malawi”, April 1, 2011, http://www.mcc.gov/pages/press/release/mcc-finalizes-350-million-compact-with-malawi; Millennium Challenge Corporation, Congressional Notification, “Report on the Determination by the Chief Executive Officer that the Government of Malawi has Engaged in a Pattern of Actions Inconsistent with the Eligibility Criteria of the Millennium Challenge Corporation”, March 26, 2012, http://www.mcc.gov/documents/cn/cn-03262012-malawi.pdf; Millennium Challenge Corporation, “Report on the Determination by the Chief Executive Officer that the Government of Malawi has Taken Sufficient Corrective Action to Address Each Condition for Which Assistance Was Suspended,” June 26, 2012, http://www.mcc.gov/documents/cn/cn-062712-malawi.pdf. ↩︎
  77. Institute of Medicine. Evaluation of PEPFAR. Washington, DC: The National Academies Press, 2013. http://www.nap.edu/catalog.php?record_id=18256. ↩︎
  78. PEPFAR, Technical Guidance: Prevention for Men Who Have Sex With Men (2011). http://www.pepfar.gov/reports/guidance/combinationprevention/combprevmsm/index.htm. ↩︎
  79. Ibid, p. 4. ↩︎
  80. PEPFAR, PEPFAR Blueprint: Creating an AIDS-free Generation (2012). http://www.pepfar.gov/documents/organization/201386.pdf ↩︎
  81. State Department, Remarks by Hillary Rodham Clinton, “Remarks at the 2012 International AIDS Conference,” July 23, 2012. http://www.state.gov/secretary/20092013clinton/rm/2012/07/195355.htm. ↩︎
  82. State Department, DipNote by Eric Goosby, “Reaching Key Populations: Essential to Achieving an AIDS-Free Generation”, June 20, 2013. http://blogs.state.gov/stories/2013/06/20/reaching-key-populations-essential-achieving-aids-free-generation. The countries and regions are: Cambodia, Ghana, Nepal, Senegal, Swaziland, and Zimbabwe – and Asia and Central America. ↩︎
  83. State Department, Remarks by Hillary Rodham Clinton, “Remarks at the 2012 International AIDS Conference,” July 23, 2012. http://www.state.gov/secretary/20092013clinton/rm/2012/07/195355.htm. ↩︎
  84. Robert Carr Fund, http://www.robertcarrfund.org/donors/donors/. ↩︎
  85. PEPFAR, PEPFAR Blueprint: Creating an AIDS-free Generation (2012). http://www.pepfar.gov/documents/organization/201386.pdf. ↩︎
  86. USAID, “Linkages Across the Continuum of HIV Services For Key Populations Affected By HIV (“Linkages”)”, Request For Application (RFA), RFA Solicitation Number: Sol-Oaa-14-000013, November 5, 2013. ↩︎
  87. Ibid. ↩︎
  88. Personal communication with Ron MacInnis, Futures Group, March 27, 2014. ↩︎
  89. Global Fund to Fight AIDS, Tuberculosis and Malaria, The Global Fund Strategy in Relation to Sexual Orientation and Gender Identities (2009). http://www.theglobalfund.org/documents/core/strategies/Core_SexualOrientationAndGenderIdentities_Strategy_en/. ↩︎
  90. Global Fund to Fight AIDS, Tuberculosis and Malaria, The Global Fund Strategy 2012-2016: Investing for Impact (2011). http://www.theglobalfund.org/en/about/strategy/. ↩︎
  91. Global Fund to Fight AIDS, Tuberculosis and Malaria, Newsflash, Issue 23, 2013. http://www.theglobalfund.org/en/blog/33316/. ↩︎
  92. Nils Daulaire, “Bringing LGBT Health Care to the World Health Organization,” Huffington Post, June 13, 2013. http://www.huffingtonpost.com/nils-daulaire/world-health-organization-lgbt_b_3430849.html. ↩︎
  93. World Health Organization, “Improving the Health and Well-being of Lesbian, Gay, Bisexual and Transgender Persons,” EB133/6, May 14, 2013. ↩︎
  94. PAHO, “Addressing the Causes of Disparities in Health Service Access and Utilization for Lesbian, Gay, Bisexual and Trans (LGBT) Persons,” September 30, 2012. http://www.paho.org/hq/index.php?option=com_docman&task=doc_download&gid=23145&Itemid=270&lang=en. ↩︎
  95. PAHO, “Health authorities pledge to improve access to health care for LGBT People,” October 3, 2013. http://www.paho.org/hq/index.php?option=com_content&view=article&id=9056&Itemid=1926. ↩︎
  96. Nils Daulaire, “A Victory for LGBT Health in the Americas,” Huffington Post, November 12, 2013. http://www.huffingtonpost.com/nils-daulaire/a-victory-for-lgbt-health_b_4262367.html. ↩︎
  97. It is important to note that preliminary analysis of USAID transaction data indicates that in most of these countries, a very small share of funding is provided directly to recipient country governments (KFF analysis of data from www.foreignassistance.gov). ↩︎
  98. The seven major program areas include: PEPFAR (HIV); malaria; TB; maternal and child health; family planning and reproductive health; nutrition; and water. ↩︎
  99. Kaiser Family Foundation analysis of data from www.foreignassistance.gov. ↩︎
  100. ILGA, State-Sponsored Homophobia-A World Survey of Laws: Criminalisation, Protection and Recognition of Same-Sex Love, 8th Edition (2013). http://ilga.org/ilga/en/article/o5VlRM41Oq. ↩︎
  101. Council on Global Equality, “The Facts on LGBT Rights in Russia,” http://www.globalequality.org/newsroom/latest-news/1-in-the-news/186-the-facts-on-lgbt-rights-in-russia. ↩︎
  102. UNAIDS, Press Release, “On the Eve of Zero Discrimination Day, UNAIDS Calls for the Protection for the Health and Human Rights of Vulnerable Populations,” February 28, 2014. http://www.unaids.org/en/resources/presscentre/pressreleaseandstatementarchive/2014/february/20140228zerodiscrimination/. ↩︎
  103. State Department, Travel Alerts & Warnings, Russia, http://travel.state.gov/content/passports/english/country/russia.html. ↩︎
  104. Office of Congressman Jerrold Nadler, Press Release. “Rep. Nadler Leads Bipartisan Letter to Protect LGBT Rights at 2014 Olympic Games in Russia,” August 2, 2013. http://nadler.house.gov/press-release/rep-nadler-leads-bipartisan-letter-protect-lgbt-rights-2014-olympic-games-russia. ↩︎
  105. White House, Office of the Press Secretary, “Remarks by the President in a Press Conference,” August 9, 2013, http://www.whitehouse.gov/the-press-office/2013/08/09/remarks-president-press-conference. ↩︎
  106. State Department, “Remarks by Ambassador Samantha Power, U.S. Permanent Representative to the United Nations, at a Roundtable Strategy Session on International LGBT Rights,” December 10, 2013. http://usun.state.gov/briefing/statements/218567.htm. ↩︎
  107. State Department, Country Reports on Human Rights Practices for 2013, (2014). http://www.state.gov/j/drl/rls/hrrpt/humanrightsreport/index.htm#wrapper. ↩︎
  108. State Department, Country Reports on Human Rights Practices for 2013, (2014). http://www.state.gov/j/drl/rls/hrrpt/humanrightsreport/index.htm#wrapper. ↩︎
  109. UNAIDS, Press Release, “UNAIDS Calls on India and all Countries to Repeal Laws that Criminalize Adult Consensual Same Sex Sexual Conduct,” December 12, 2013. http://www.unaids.org/en/resources/presscentre/pressreleaseandstatementarchive/2013/december/20131212psindia/. ↩︎
  110. UNAIDS, Press Release, “On the Eve of Zero Discrimination Day, UNAIDS Calls for the Protection for the Health and Human Rights of Vulnerable Populations,” February 28, 2014. http://www.unaids.org/en/resources/presscentre/pressreleaseandstatementarchive/2014/february/20140228zerodiscrimination/. ↩︎
  111. Faine Greenwood, “Indian government asks Supreme Court to review anti-gay law,” Global Post, December 20, 2013. http://www.globalpost.com/dispatch/news/regions/asia-pacific/india/131220/indian-government-asks-supreme-court-review-anti-g-0. ↩︎
  112. “Supreme Court Refuses Overruling its Verdict on Section 377 and Homosexuality,” IANS Biharprabha News, January 28, 2014, http://news.biharprabha.com/2014/01/supreme-court-refuses-overruling-its-verdict-on-article-377-and-homosexuality/. ↩︎
  113. Akila R. S, “Section 377: The way forward,” The Hindu, March 1, 2014. http://www.thehindu.com/features/magazine/section-377-the-way-forward/article5740242.ece. ↩︎
  114. State Department, Daily Press Briefing, Jen Psaki, Spokesperson, December 11, 2013. http://www.state.gov/r/pa/prs/dpb/2013/12/218597.htm#INDIA. ↩︎
  115. State Department, Travel Alerts & Warning, India, http://travel.state.gov/content/passports/english/country/india.html. ↩︎
  116. Nigerian Government, Same Sex Marriage (Prohibition) Act, 2013. ↩︎
  117. State Department, Travel Alerts & Warning, Nigeria, http://travel.state.gov/content/passports/english/country/nigeria.html. ↩︎
  118. Adam Nossiter, “Nigeria Tries to ‘Sanitize’ Itself of Gays”, New York Times, February 8, 2014. http://www.nytimes.com/2014/02/09/world/africa/nigeria-uses-law-and-whip-to-sanitize-gays.html. ↩︎
  119. Erika Eichelberger, “You Thought It Was Tough Being Gay in Uganda. ‘It’s Hell in Nigeria,’” Mother Jones, March 13, 2014. http://www.motherjones.com/politics/2014/03/nigeria-anti-gay-law-hiv. ↩︎
  120. UN News Center, “Nigeria: Ban Voices Concern as New Anti-homosexuality Law Takes Effect,” January 15, 2014. http://www.un.org/apps/news/story.asp?NewsID=46935&Cr=lesbian&Cr1=#.U11VVvldX4s. ↩︎
  121. United Nations, Press Office, “UN Human Rights Chief Denounces New Anti-homosexuality Law in Nigeria,” January 14, 2014. http://www.ohchr.org/FR/NewsEvents/Pages/DisplayNews.aspx?NewsID=14169&LangID=E. ↩︎
  122. UNAIDS, Press Release, “On the Eve of Zero Discrimination Day, UNAIDS Calls for the Protection for the Health and Human Rights of Vulnerable Populations,” February 28, 2014. http://www.unaids.org/en/resources/presscentre/pressreleaseandstatementarchive/2014/february/20140228zerodiscrimination/. ↩︎
  123. UNAIDS & the Global Fund, Press Release, “UNAIDS and the Global Fund Express Deep Concern about the Impact of a New Law Affecting the AIDS Response and Human Rights of LGBT People in Nigeria,” January 14, 2014. http://www.unaids.org/en/resources/presscentre/pressreleaseandstatementarchive/2014/january/20140114nigeria. ↩︎
  124. State Department, Remarks by John Kerry, “Deep Concern with Nigeria’s Enactment of the Same Sex Marriage Prohibition Act,” January 13, 2014. http://www.state.gov/secretary/remarks/2014/01/219587.htm. ↩︎
  125. State Department, Country Reports on Human Rights Practices for 2013, (2014). http://www.state.gov/j/drl/rls/hrrpt/humanrightsreport/index.htm#wrapper. ↩︎
  126. State Department, Travel Alerts & Warning, Nigeria, http://travel.state.gov/content/passports/english/country/nigeria.html. ↩︎
  127. State Department, Travel Alerts & Warning, Uganda, http://travel.state.gov/content/passports/english/country/uganda.html. ↩︎
  128. Amnesty International, Press Release, “Global Day of Action against Uganda’s Anti-Homosexuality Bill,” February 10, 2014. http://www.amnestyusa.org/news/news-item/global-day-of-action-against-uganda-s-anti-homosexuality-bill. ↩︎
  129. “Ugandan Tabloid Prints List of ‘Top 200 Homosexuals’,” The Guardian, February 25, 2014. http://www.theguardian.com/world/2014/feb/25/ugandan-tabloid-prints-list-top-200-homosexuals. ↩︎
  130. State Department, Press Statement by Marie Harf, “Raid on the Makerere University Walter Reed Project by Ugandan Authorities”, April 4, 2014. http://www.state.gov/r/pa/prs/ps/2014/04/224431.htm. ↩︎
  131. Martin Plaut, “Uganda Donors Cut Aid after President Passes Anti-gay Law,” The Guardian, February 25, 2014, http://www.theguardian.com/global-development/2014/feb/25/uganda-donors-cut-aid-anti-gay-law. ↩︎
  132. J. Lester Feder, “World Bank Delays $90 Million Loan To Uganda As Bank President Blasts Anti-Gay Laws,” Buzzfeed, February 27, 2014, http://www.buzzfeed.com/lesterfeder/world-bank-delays-90-million-loan-to-uganda-as-bank-presiden. ↩︎
  133. UNAIDS, Press Release, “UNAIDS Expresses Deep Concern Over Impact of Ugandan Bill on the Rights of Gay men,” February 18, 2014, http://www.unaids.org/en/resources/presscentre/pressreleaseandstatementarchive/2014/february/20140218psuganda/. ↩︎
  134. UNAIDS, Press Release, “On the Eve of Zero Discrimination Day, UNAIDS Calls for the Protection for the Health and Human Rights of Vulnerable Populations,” February 28, 2014. http://www.unaids.org/en/resources/presscentre/pressreleaseandstatementarchive/2014/february/20140228zerodiscrimination/. ↩︎
  135. Global Fund to Fight AIDS, Tuberculosis and Malaria, Announcement, “Global Fund Deeply Concerned over Anti-Gay Law in Uganda,” February 24, 2014. http://www.theglobalfund.org/en/mediacenter/announcements/2014-02-24_Global_Fund_Deeply_Concerned_over_Anti-Gay_Law_in_Uganda/. ↩︎
  136. White House, Office of the Press Secretary, “Statement by the President on the Anti-Homosexuality Bill in Uganda,” February 16, 2014, http://www.whitehouse.gov/the-press-office/2014/02/16/statement-president-anti-homosexuality-bill-ugandaObama. ↩︎
  137. State Department, Remarks by John Kerry, “Enactment of Ugandan Anti-Homosexuality Bill,” February 24, 2014, http://www.state.gov/secretary/remarks/2014/02/221987.htm. ↩︎
  138. See, for example: “Comments Of Senator Patrick Leahy (D-Vt., President Pro Tempore, Chairman Of The State Department And Foreign Operations Appropriations Subcommittee) On Uganda President Museveni’s Signing Of The Anti-Homosexuality Bill, February 25, 2014, http://www.leahy.senate.gov/press/comments-of-senator-patrick-leahy-d-vt-president-pro-tempore-chairman-of-the-state-department-and-foreign-operations-appropriations-subcommittee-on-uganda-president-musevenis-signing-of-the-anti-homosexuality-bill; “Senator Coons Condemns Enactment of Anti-Homosexuality Bill in Uganda,” February 24, 2014, http://www.coons.senate.gov/newsroom/releases/release/senator-coons-condemns-enactment-of-anti-homosexuality-bill-in-uganda; Congressional Black Caucus, March 18, 2014, http://lee.house.gov/sites/lee.house.gov/files/Rep.%20Lee%20CBC%20letter%20re%20Uganda%20LGBT%20law%203.18.14.pdf. ↩︎
  139. USAID Uganda, “USAID Response to Enactment of Anti-Homosexuality Bill,” Memo to USAID/Uganda Implementing Partners, February 28, 2014. ↩︎
  140. White House, Blog by Grant Harris and Stephen Pomper, “Promoting Regional Security and Protecting Human Rights in Uganda,” March 24, 2014. http://www.whitehouse.gov/blog/2014/03/24/promoting-regional-security-and-protecting-human-rights-uganda. ↩︎
  141. State Department, Travel Alerts & Warning, Uganda, http://travel.state.gov/content/passports/english/country/uganda.html. ↩︎
  142. State Department, Press Statement by Marie Harf, “Raid on the Makerere University Walter Reed Project by Ugandan Authorities”, April 4, 2014. http://www.state.gov/r/pa/prs/ps/2014/04/224431.htm. ↩︎
  143. State Department, Press Release, “Statement from Ambassador Deborah Birx, M.D., U.S. Global AIDS Coordinator, on the Principles of PEPFAR’s Public Health Approach”, April 11, 2014. http://www.pepfar.gov/press/releases/2014/224738.htm. ↩︎
  144. Tonia Poteat, Daouda Diouf, Fatou Maria Drame, Marieme Ndaw, Cheikh Traore, MandeepDhaliwal, Chris Beyrer, and Stefan Baral, “HIV Risk among MSM in Senegal: A Qualitative Rapid Assessment of the Impact of Enforcing Laws That Criminalize Same Sex Practices,” PLoS ONE 6(2011): e28760. ↩︎
  145. Michael Gerson, “Making the AIDS Crisis Worse,” Washington Post, March 13, 2014. http://www.washingtonpost.com/opinions/michael-gerson-africa-is-making-the-aids-crisis-worse/2014/03/13/274578e2-aae4-11e3-adbc-888c8010c799_story.html. ↩︎
  146. U.S. Global Health Initiative, U.S. Government Interagency Paper on Country Ownership. 2012. http://www.ghi.gov/principles/docs/ownershipInteragencyPaper.pdf. ↩︎
  147. Meeting Report, Advancing Country Ownership: Civil Society’s Role in Sustaining Public Health. 2013. http://www.amfar.org/uploadedFiles/_amfarorg/On_the_Hill/Country-Ownership-Meeting-Report-June-2013.pdf. ↩︎
  148. State Department, Press Release, “Statement from Ambassador Deborah Birx, M.D., U.S. Global AIDS Coordinator, on the Principles of PEPFAR’s Public Health Approach”, April 11, 2014. http://www.pepfar.gov/press/releases/2014/224738.htm. ↩︎
  149. Chris Beyrer and Stefan D Baral, “MSM, HIV and the Law: The Case of Gay, Bisexual and other men who have sex with men (MSM)”, Working Paper for the Third Meeting of the Technical Advisory Group of the Global Commission on HIV and the Law, 7-9 July 2011. ↩︎
  150. Civil Society Coalition on Human Rights and Constitutional Law, “Guidelines to National, Regional, and International Partners on how to Offer Support Now that the Anti-Homosexuality Law has been Assented To,” March 3, 2014. ↩︎
  151. Solidarity Alliance for Human Rights, “Advisory to Allies and Partners on Providing Support to Nigeria’s Sexual/Gender Minorities in the Aftermath of the Same-Sex Marriage [Prohibition] Act 2013,” March 28, 2014. ↩︎
  152. The Global Fund to Fight AIDS, Tuberculosis and Malaria, “Special Initiatives,” Board Decision GF/B31/08A, March 6-7, 2014. http://www.theglobalfund.org/documents/board/31/BM31_08-SpecialInitiatives_Paper_en/. ↩︎
  153. State Department, Press Release, “Statement from Ambassador Deborah Birx, M.D., U.S. Global AIDS Coordinator, on the Principles of PEPFAR’s Public Health Approach”, April 11, 2014. http://www.pepfar.gov/press/releases/2014/224738.htm. ↩︎
  154. Josh Michaud and Jen Kates, Raising the Profile of Diplomacy in the U.S. Global Health Response: A Backgrounder on Global Health Diplomacy, Menlo Park: Kaiser Family Foundation, 2012. ↩︎
  155. Josh Michaud and Jen Kates, “Global Health Diplomacy: Advancing Foreign Policy and Global Health Interests,” Global Health: Science and Practice 1 (2013):24-28. ↩︎
  156. State Department, Office of Global Health Diplomacy, http://www.state.gov/s/ghd/. ↩︎
  157. See, for example, GBC Health, http://www.businessfightsaids.org/. ↩︎
  158. See, for example: David Schwartz, “Arizona Governor Vetoes Bill Widely Criticized as Anti-gay,” Reuters, February 27, 2014, http://www.reuters.com/article/2014/02/27/us-usa-gays-arizona-idUSBREA1Q02420140227. ↩︎
  159. See, for example: Thomas Gryta, “AT&T Criticizes Russia’s Antigay Law on Eve of Olympics,” Wall Street Journal, February 4, 2014, http://online.wsj.com/news/articles/SB10001424052702303442704579363190709990288. ↩︎
  160. See, for example: Georgetown University, “HIV/AIDS Summit Draws International Faith Leaders,” July 25, 2012, http://www.georgetown.edu/news/aids-summit-faith-leaders.html; Christian Medical Fellowship, “Faith Matters – The Contribution of Faith to Health and Healthcare in the Post 2015 agenda”; CSIS, “The American Faith Community’s Contributions to Global Health,” January 31, 2012, http://www.smartglobalhealth.org/blog/entry/the-american-faith-communitys-contributions-to-global-health; The Global Fund to Fight AIDS, Tuberculosis and Malaria, Report on the Involvement of Faith-Based Organizations in the Global Fund: 2010 Update. Geneva: Global Fund, 2011, http://www.theglobalfund.org/documents/civil_society/CivilSociety_InvolvemenOfFaithBasedOrganizationsInTheGlobalFund_Report_en/ ↩︎
  161. See, for example: Fredrick Nzwili, “Uganda’s anti-gay bill refocuses attention on US evangelical influence,” Christian Science Monitor, February 25, 2014, http://www.csmonitor.com/World/2014/0225/Uganda-s-anti-gay-bill-refocuses-attention-on-US-evangelical-influence-video; Christiane Amanpour, “How American Evangelicals may be Responsible for Uganda’s Anti-gay Law,” CNN, February 24, 2014, http://amanpour.blogs.cnn.com/2014/02/24/how-american-evangelicals-may-be-responsible-for-ugandas-anti-gay-law/; Sarah Pulliam Bailey, “U.S. evangelicals on the defense over Uganda’s new Anti-Homosexuality Act,” Washington Post, March 4, 2014, http://www.washingtonpost.com/national/religion/us-evangelicals-on-the-defense-over-ugandas-new-anti-homosexuality-act/2014/03/04/e91c3b56-a3e9-11e3-b865-38b254d92063_story.html; United States District Court for the District of Massachusetts, “Sexual Minorities Uganda v. Scott Lively”, Memorandum and Order Regarding Defendant’s Motions to Dismiss, C.A. No. 12-cv-30051-MAP, August 14, 2013; Inter-Religious Council of Uganda, “ICRU Press Statement on Anti-Gay Bill”, February 19, 2014. ↩︎

Paying for Prescribed Drugs in Medicaid: Current Policy and Upcoming Changes

Authors: Brian Bruen and Katherine Young
Published: May 23, 2014

Executive Summary

Since the early 2000s, state Medicaid programs have made concerted efforts to control the cost of prescription drug spending. One crucial aspect in doing so is using a pharmacy reimbursement methodology that best reflects actual drug costs. Currently, states set pharmacy reimbursement policy within broad federal guidelines, resulting in a complex mix of reimbursement rules. Many states use list prices to set reimbursement levels, and these list prices increasingly have been criticized as not accurately reflecting the cost of the drug. Specifically, there are concerns that some benchmarks lead to inflated reimbursement levels. As a result, the federal government has proposed new rules that aim to make reimbursement policies more closely match the cost of obtaining and filling prescriptions. However, the change in policy may have varying effects on reimbursement, depending on the state’s current approach and the type of drug in question. This paper explains current Medicaid pharmacy reimbursement methodology and examines the potential effect of the proposed rule changes.

Medicaid Drug Reimbursement Policy

State Medicaid programs reimburse pharmacies for prescription drugs based on the ingredient costs for the drug and a dispensing fee for filling the prescription. States use a variety of benchmarks to set reimbursement for the ingredient costs.  Concerns about the accuracy of drug pricing benchmarks commonly used, particularly average wholesale price (AWP) and wholesale acquisition cost (WAC), have led states and the federal government to look for new ways to determine payment levels. In February 2012, the Centers for Medicare & Medicaid Services (CMS), released a draft rule that would change the basis of payment for Medicaid-covered drugs from an “estimated acquisition cost” (EAC) to an “actual acquisition cost” (AAC).  CMS proposed this change, because it feels that AAC will more accurately reflect the actual prices that pharmacies pay to acquire drugs.1  In addition to modifying the language of drug reimbursement, the draft rule suggested ways that states could determine AAC; a final rule is anticipated this year.

This paper explains current pharmacy reimbursement methodology; examines proposed and final rule changes that CMS has issued; reviews outside studies on drug pricing benchmarks and how they compare to each other; and provides independent analysis on how one possible AAC measure, the National Average Drug Acquisition Cost (NADAC), compares to previously used EAC measures.

Box 1: Glossary of Acronyms

  • EAC: Estimated Acquisition Cost; EAC is a benchmark used by many state Medicaid programs to set payment for drug ingredient costs
  • AWP: Stands for “Average Wholesale Price,” but is more akin to a sticker price; AWP is one benchmark used to calculate EAC
  • WAC: Wholesale Acquisition Cost; WAC is one benchmark used to calculate EAC
  • AAC: Actual Acquisition Cost
  • NADAC: National Average Drug Acquisition Cost; NADAC can be used to calculate AAC
  • FUL: Federal Upper Limit; FUL sets a reimbursement limit for some generic drugs
  • MAC: Maximum Allowable Cost; MACs are reimbursement limits set by states in addition to the FUL
  • AMP: Average Manufacturer Price; AMP is used to calculate drug rebates.  The ACA also established that it would replace list prices as the basis for FULs, but this has not yet been implemented

Key Findings

  • While CMS has proposed to move from EAC to AAC, EAC is still currently used as the basis of payment for Medicaid-covered drugs in most states.  Most states calculate EAC by applying a percentage reduction to Average Wholesale Price (AWP) or a percentage increase to Wholesale Acquisition Cost (WAC).  In September 2013, 12 states used AWP as their primary reimbursement metric, 16 states used WAC, and only 6 states used AAC. 17 states used a combination of benchmarks in setting reimbursement levels.
  • To better understand the prices that pharmacies pay to acquire drugs, the US government and outside groups have conducted numerous studies comparing drug pricing benchmarks to each other, as well as measures of acquisition costs.  These studies have shown that the relationships among list prices (WACs and AWPs) and average prices paid (Average Manufacturer Prices, or AMPs) depends on whether a drug is a single-source brand, multiple-source brand, or generic.  They have also shown that AMPs were consistently less than AWPs and generic WACs, but much closer to brand WACs.
  • Independent analysis in this brief finds that one proposed AAC measure, the NADAC, is below currently-used benchmarks for single-source drugs. For single-source drugs, NADACs are well below AWPs and just slightly less than WACs.  We found that the difference between generic NADACs and generic benchmarks became more exaggerated.  We also found that actual Medicaid payments to retail pharmacies for prescribed drugs are much closer to WAC and NADAC prices than to AWP.
  • Any reimbursement formula that uses fixed percentages, such as AWP minus 16 percent or WAC plus 4 percent, results in pharmacy profits that vary based on the price of the drug.
  • Dispensing fees are an important factor in overall pharmacy reimbursement. Today, dispensing fees range from $2 to $10, with an average of $5 or less per prescription. Changes in ingredient costs could have implications for dispensing fees; as states switch to using AACs for drug reimbursement, dispensing fees are likely to rise.
  • Although reimbursement policy is important, there are other factors that also affect Medicaid spending on prescription drugs, such as the demand for extremely expensive specialty drugs.

Issue Brief: Background

At nearly $16 billion in FY 2010, prescription drug spending is a significant component of Medicaid total spending.2  Although in recent years, Medicaid prescription drug spending has been growing more slowly than in the early 2000s, it remains an area of concern. Medicaid prescription drug spending is driven by many factors, including utilization and reimbursement. Medicaid programs reimburse pharmacies for outpatient drugs based upon a drug ingredient cost and a dispensing fee. Revising drug ingredient cost reimbursement methodology continues to be an area for potential cost savings. In 2011, U.S. Department of Health and Human Services Secretary Kathleen Sebelius wrote to the state governments to inform them that the federal government would help states identify cost drivers and provide states with new ways to achieve cost savings. More effective drug ingredient costs were one of many items relating to pharmaceutical services in a long list.3 

Reimbursement methodology is just one factor that determines how much states and the federal government spend on Medicaid outpatient prescription drugs. Rebates at the federal and state levels offset some of this spending; in FY 2010, rebates accounted for over 40 percent of the $27 billion in pre-rebate Medicaid drug spending.4  Since 1991, federal law has required manufacturers wishing to have their products covered by any Medicaid program to participate in the Federal Medicaid Drug Rebate Program. In 2010, Congress raised the minimum required rebate level as part of the Affordable Care Act, and expanded the rebate requirement to include drugs paid for by Medicaid managed care plans.5 

When managed care plans cover drugs as part of the package of services for which they receive capitated payments from the state Medicaid agency, the plans establish the reimbursement levels paid to pharmacies. Prior to passage of the Affordable Care Act, several states with comprehensive Medicaid managed care plans carved out their prescription drug benefits—i.e., paid for drugs on a fee-for-service basis rather than including them in the package of services for which plans received capitated payments—in order to collect manufacturers’ rebates, because these discounts were not required when managed care plans paid for the prescription. The Affordable Care Act required manufacturers to provide rebates on all Medicaid-covered drugs purchased by managed care plans for their Medicaid clients, effective March 23, 2010. Proponents of incorporating drug benefits into the package of managed care services tend to highlight potential advantages from better coordination of pharmacy services with other medical care and administrative tasks handled by managed care plans. Arguments for carving out drugs generally focus on potential differences in formularies, prior authorization, benefit management processes among health plans, and concerns that plans may not have the same incentives to maximize federal or state rebates. 6  Although this paper primarily focuses drug reimbursement, it is important to keep in mind that there are other policies that affect Medicaid drug spending.

In this paper, we examine current Medicaid pharmaceutical reimbursement policy and explain how and why the policy is changing.  We then consider research on how Medicaid drug pricing metrics compare. Finally, we conduct our own analysis on how the recently created NADAC compares to other pricing metrics.


Issue Brief: Current Reimbursement Policy

Medicaid payments to retail pharmacies for prescription drugs are determined by a complex set of policies developed at both the federal and state levels.  Reimbursement is a factor of ingredient cost, dispensing fees, and any cost sharing paid by the beneficiary. States set policies on dispensing fees and, within federal guidelines, beneficiary cost-sharing. With respect to ingredient costs, with the exception of some multiple-source drugs7  for which there are specific federal or state limits, federal regulations require Medicaid programs to reimburse pharmacies based on the lesser of the (1) estimated acquisition cost (EAC) plus a reasonable dispensing fee; or (2) the pharmacy’s “usual and customary charge” to the public. 8 

Ingredient Cost

Estimated Acquisition Cost (EAC)

EAC is intended to reflect the price that providers and retail pharmacies generally and currently pay to procure a particular drug from its supplier. Most states determine EAC using formulas that apply either a percentage reduction from the average wholesale price (AWP) for the drug or a percentage increase to the wholesale acquisition cost (WAC) for the drug. (See Figure 1).

AWPs and WACs are prices published in commercially available drug pricing compendia. Although its name suggests that it is the actual price that wholesalers charge for a drug, critics and experts alike have noted that AWP is more akin to the sticker price on a car: it represents a starting point for negotiations. It does not include any discounts or rebates that would typically be incorporated in the actual price that the wholesaler charges. It is not defined in federal regulations. Similarly, WAC is not based on actual sales data. However, unlike AWP, WAC is defined in federal regulations.9 

Numbers of State Medicaid Programs Using AWP, WAC, AAC, or Multiple Measures as their Primary1 Drug Reimbursement Benchmarks, Quarter Ending September 2013

Federal Upper Limits (FUL)

Multiple-source drugs are drugs that are available from more than one manufacturer. The Federal Upper Limit (FUL) program caps reimbursement for certain multiple-source drugs, with the intent of making the government a prudent buyer – and reducing Medicaid expenditures – by basing payments on market prices for these drugs. CMS calculates a FUL amount for specific forms and strengths for each multiple-source drug that meets the established criteria. The federal government establishes maximum payment amounts for about 700 multiple-source drugs, which include both generics and originator brands for which generic versions are available.  According to CMS, FUL drugs accounted for $2.4 billion in Medicaid expenditures in 2010,10  9% of Medicaid spending on prescription drugs. 11 

Traditionally, the FUL for a multiple-source drug was set at 150% of the lowest price published in national drug pricing compendia. The Deficit Reduction Act (DRA) of 2005 included provisions to substantially reduce FULs, based in part on findings from a federal study that indicated that FULs based on published prices (AWP or WAC) were significantly higher than pharmacies’ acquisition costs.12  CMS did not implement these rules because of an injunction and subsequent changes to federal law. The Affordable Care Act and subsequent proposed rules limit reimbursement to no less than 175% of the weighted average of the most recently reported average manufacturer prices (AMP) for that drug. Federal law defines AMP as the average price paid to the manufacturer for the drug in the United States by (1) wholesalers for drugs distributed to retail community pharmacies and by (2) retail community pharmacies that purchase drugs directly from the manufacturer.13  CMS began publishing draft FULs based on these rules in September 2011 and continues to release updates for review and comment,14  but as of the date of this publication, FUL amounts continue to be based on published prices.

State Maximum Allowable Costs

Nearly all states apply maximum allowable cost (state MAC, or SMAC) limits to multiple-source drugs, which establish ceilings on reimbursement for the drug products included on state MAC lists. These state MAC amounts generally are part of a complex “lesser of” formula, where the state agency sets reimbursement for multiple-source drugs at the lowest amount for each drug based on (1) the state’s EAC formula, (2) the FUL (if applicable), (3) the state MAC or (4) the pharmacy’s usual and customary charge to the public. State MAC programs frequently include other drugs that do not have established FULs: a 2013 analysis by the U.S. Department of Health and Human Services’ Office of Inspector General (OIG) found that state MAC programs include 50-60 percent more drugs than FULs. Of 41 states that identified a pricing benchmark for their state MAC programs, 29 used pharmacy acquisition costs as part of the benchmark to set state MAC prices.15 

Dispensing Fees

The dispensing fee is intended to cover reasonable costs associated with providing the drug to a Medicaid beneficiary, including the pharmacist’s services and overhead associated with maintaining the facility and equipment necessary to operate the pharmacy. States establish dispensing fees for the pharmacies that fill prescriptions for Medicaid beneficiaries. In late 2013, these fees range from $2 or less per prescription in Arizona, Connecticut, New Hampshire, Ohio, and Pennsylvania to more than $10 in Alabama, Alaska, Colorado, Idaho, Iowa, Louisiana, and Oregon; most other states pay dispensing fees that average around $5 or less per prescription.16  In setting their fees, states look to the fees paid by other state Medicaid programs, as well as fees paid in private insurance programs and Medicare Part D plans. Although exact pricing for most plans is proprietary information, surveys from groups such as the Pharmacy Benefit Management Institute and the Kaiser Family Foundation, and drug benefit trend reports from pharmacy benefit managers (PBMs) such as CVS/Caremark and Express Scripts, offer insight into typical benefit designs including general pricing trends and dispensing fees.17 ,18 ,19 ,20 Variation in fees also reflect differences in states’ approaches to EAC: except for Alaska, the states with the highest fees also use AAC-based reimbursement.

Pharmacies often argue that dispensing fees do not adequately cover their “cost of dispensing”. Estimates from a study supported by retail pharmacies indicate that retail pharmacies’ average cost of dispensing nationwide was $10.50 per prescription (each pharmacy’s average cost weighted by prescription volume) or $12.10 per pharmacy (each pharmacy’s average cost counted once) in 2006.21  State-specific averages per pharmacy ranged from $10.36 to $15.91 in that study. Subsequent state-funded studies estimated an average cost of dispensing of $12.97 per pharmacy in Alabama in 200922  and an unweighted average cost of dispensing of $11.15 per pharmacy in Oregon that same year.23  These states use AAC-based reimbursement with dispensing fees of $10.64 (Alabama) and $9.68 to $14.01, varying by volume (Oregon).24  Alabama pays additional fees to pharmacists for special services such as pill-splitting or long-term drug maintenance.25 

Beneficiary Cost Sharing

A final component of Medicaid reimbursement for prescription drugs is cost sharing paid by the beneficiary. Medicaid has traditionally imposed limits on cost sharing. Until the enactment of the Deficit Reduction Act (DRA) of 2005, prescription drug copayments were limited to “nominal” levels, usually $3 per prescription except under Medicaid waiver, although some groups of enrollees, including children and pregnant women, could not be charged. In addition, under Medicaid policy, even if copayments were imposed and beneficiaries could not pay, pharmacies were supposed to dispense the drug anyway. The DRA modified these policies, allowing states to increase nominal cost-sharing levels based on the Consumer Price Index for Medical Care and permitting higher cost-sharing levels for beneficiaries with incomes over 100 percent of poverty as well as alternative cost-sharing policies. Today, almost all state Medicaid programs and Medicaid managed care plans charge nominal copayments for prescription drugs for adults, although they sometimes have variations in the copayment level based on whether a medication is generic or branded, or whether it is designated a “preferred” drug in the state’s Medicaid program.

Final rules issued by CMS in July 2013 allow states to require cost-sharing of up to $4 for preferred drugs and $8 for non-preferred drugs for all Medicaid-covered individuals, including individuals with incomes at or below 150% of the federal poverty level (FPL). For individuals with incomes above 150% of the FPL, the new rules allow states to establish higher cost sharing, including coinsurance of up to 20% of the cost of the drug, for non-preferred drugs.26 ,27 

In making decisions about imposing cost-sharing, states will need to weigh a large body of evidence about the effects of beneficiary cost sharing. A systematic review of cost sharing literature by Goldman et al. found that increases in cost sharing are associated with decreased use, poorer adherence, and more frequent discontinuation of prescription medicines.28  The literature also suggests that when higher cost sharing for prescription medications leads to reduced utilization and adherence, it can engender increases in other medical costs if patients become sicker as a result.29 ,30 ,31 , 32 ,33 

Issue Brief: Changes In Reimbursement Policy

Calls to Revise Drug Ingredient Cost Methodology

In the early 1990s, the Health Care Financing Administration34  pressured states to improve their estimates of acquisition costs based on evidence that AWP was higher than pharmacies’ actual costs of acquiring drugs from a wholesaler or manufacturer.35  Over the next two decades, federal investigations continued to show that AWP-based payments exceeded pharmacies’ acquisition costs, despite states’ efforts to bring reimbursement in line with costs.36 ,37 ,38 ,39 Regardless, until recently, the majority of states used AWP to determine reimbursement amounts; for example, at the end of 2010, 34 states still based their EAC on AWP.40 

In 2009, First DataBank and Medi-Span, publishers of the most widely used drug price compendia, settled lawsuits that alleged they had inflated AWPs to benefit pharmacies and wholesalers with higher payments, at the expense of purchasers (including state and federal governments). These lawsuits supported claims that AWP does not reflect actual transaction cost and confirmed suspicions that it may be subject to manipulation. In 2009, First DataBank announced they would cease publishing AWPs within two years. Medi-Span made a similar announcement at that time, but later reversed the decision, and as a result, they continue to publish AWPs today. However, the announcements that widely used sources would no longer list AWP, combined with the attention to the subject resulting from and abundance of studies and litigation on the topic caused many states and industry groups to discuss alternatives to the AWP. WAC seems to suffer much criticism because of its close relationship to AWP. However, there is evidence that WAC is actually a relatively accurate pricing measure for many single-source drugs (brand-name medications with market exclusivity) but it is less accurate, if even reported, for many multiple-source drugs (generic versions of brand-name drugs).41 

The Move to AAC

In this atmosphere, and in direct response to the OIG’s extensive research on the actual acquisition cost and AWP, in February 2012, CMS issued proposed rules that would require states to pay pharmacies based on actual acquisition cost (AAC) plus a “professional” dispensing fee, instead of the current EAC plus a reasonable dispensing fee.42  In the proposed rule,CMS defines AAC as the state Medicaid agency’s determination of pharmacy providers’ actual prices paid to acquire drug products marketed or sold by a specific manufacturer. To determine AAC, CMS suggests in the proposed rule that states may survey pharmacies, as is currently done by every state using AAC-based reimbursement, or use the AMP data that manufacturers already are required to report to enable calculations of federal rebates and FUL pricing. The Office of Management and Budget has indicated the final rule is scheduled to come out in mid-2014.43 

A 2011 survey by the Department of Health and Human Services’ Office of the Inspector General (OIG) found that most states want CMS to create a national benchmark for Medicaid reimbursement of prescription drugs.44  The proposed rule from February 2012 also mentioned that a national survey could be used to develop an AAC metric. To this end, CMS contracts with a public accounting firm to perform a survey of invoices from independent and chain retail pharmacies, which it uses to calculate National Average Drug Acquisition Costs (NADAC) values.45  CMS began to post draft NADAC data to a public website in October 2012. Effective November 27, 2013, CMS is posting final NADAC data, updated on a weekly and monthly basis.46  CMS views these data as a way of providing Medicaid agencies with information concerning acquisition costs, which state agencies can use to compare pricing methodologies and payments. If a state agency chooses to use NADAC as its metric to determine reimbursement, it would have to submit a state plan amendment to CMS for approval.

Commercial entities have also developed alternative measures to estimate actual acquisition costs. For example, Elsevier/Gold Standard, a drug database and drug reference provider, promotes use of a new pricing metric it calls Predictive Acquisition Cost (PAC). This metric comes from a predictive analytic model that estimates drug acquisition cost based on factors such as industry maximum allowable cost benchmarks, published prices, existing price benchmarks, drug dispensation metrics, supply-demand measures, and survey-based acquisition costs.47 

Issue Brief: Comparing Pricing Under Different Measures

Existing Evidence

The U.S. Department of Health and Human Services’ Office of Inspector General (OIG) and the U.S. Government Accountability Office (GAO) have issued several studies that indicate how drug pricing benchmarks relate to each other and to measures of acquisition costs, FULs, and state MACs. These studies emphasize that relationships between list prices (AWPs and WACs) and average prices (AMPs) differ based on whether a drug is a single-source brand, multiple-source brand, or generic. They show AMPs were consistently less than AWPs and generic WACs, but AMPs were relatively close to brand WACs. They also show AMPs were close to single-source brand invoice prices, but the relationship was much more variable for multiple-source brands and generics without FULs. Additionally, they showed that AMP values vary considerably from month to month. See Appendix Table 1 for a more complete review of OIG, GAO, and other existing research on the comparison of drug pricing metrics.

Comparing EACs and NADACs

Because the NADAC is a new measure, there is little current research on its relationship to other pricing metrics.  Our goal was to understand how the NADAC, an AAC measure, compares with the EAC measures and ultimately how they compare with the current amounts that Medicaid pays. To do this, we compared AWPs, WACs, NADACs, and amounts paid for different drugs.  We merged several sources of data at the National Drug Code (NDC)48  level. We grouped the NDCs by brand, generic, therapeutic class, and therapeutic subclass. Finally, we calculated the weighted averages of AWPs, WACs, NADACs, and amounts paid for the top 25 brand, top 25 generic, top 100 generic, and therapeutic class. The calculation of current payment levels takes into account each state’s EAC computations and the effects of FULs, state MACs and usual and customary charges.  Further details on our methodology are provided in the Methods section at the end of this report.

Brand-Name Drugs

Figure 2 shows that among the top 25 single source brands and top 25 multiple source brands, the average NADAC ($8.03) is about 18 percent less than the average AWP ($9.78), but just slightly less than the average WAC ($8.14).  Average WACs and NADACs for brand drugs are less than the amount that Medicaid pays ($8.33).  However, it is important to note that the actual paid amounts include dispensing fees, and are reduced by patient cost sharing and amounts paid by third parties, which are not accounted for in the AWP, WAC, or NADAC. To get a sense for this, if we assume that the average prescription for the top 25 single source brand drugs used to compute the values shown in Figure 2 contains 35 units (based on calculations using our source data), that the average dispensing fee is $5 per prescription ($0.14 per unit), and that there are negligible amounts of third party payment and cost sharing (reasonable assumptions at the national level), then the weighted average total amount paid per unit absent these amounts would be about $8.19.  We then approximate that for the top 25 single-source brand drugs, NADACs are just slightly less than actual Medicaid payments for the drug ingredient cost.

Pricing Metric Per Unit Comparison for Top 25 Brands by Number of Prescriptions

Table 1 shows the prescription-weighted, per-unit average AWP, WAC, NADAC and total amount paid for single source brand drugs grouped into therapeutic drug classes. Across therapeutic classes, NADAC is usually very close to WAC— 1 % to 2% higher or lower— although there are larger differences in a few classes. Table 1 also reaffirms that the acquisition costs are well below AWPs.

The analysis by therapeutic drug class also highlights the significant challenges in developing reimbursement formulas caused by great variation in drug prices. Any formula using a fixed percentage increase or decrease from a benchmark, such as AWP minus 16% or WAC plus 4%, results in markups (or markdowns) that vary in actual dollar amounts based on the price of the drug. The data in Table 1 illustrate this result: for example, the difference between the weighted average actual amount paid and the weighted average NADAC, per unit, is $0.20 for drugs the Cardiovascular Drugs class but $1.40 for the generally more expensive Anti-infective Agents class.

Table 1: Pricing Metric Per Unit Comparison by Therapeutic Class of Single-Source Brand Drugs
Therapeutic ClassWeighted AverageUnit AWPWeighted AverageUnit WACWeighted AverageUnit NADACWeighted AverageTotal Amount Paid Per UnitTotal Rx for 1 Quarter
Central Nervous System Agents$10.36$8.63$8.52$8.804,840,803
Hormones and Synthetic Substitutes$4.85$4.03$3.95$4.20927,027
Cardiovascular Drugs$4.57$3.80$3.75$3.95924,381
Anti-infective Agents$30.68$25.56$25.00$26.40822,343
Gastrointestinal Drugs$5.86$4.84$4.75$4.93818,167
Vitamins$1.01$0.74$0.68$0.77452,696
Autonomic Drugs$8.26$6.89$6.76$7.17344,827
Miscellaneous Therapeutic Agents$19.66$16.37$16.02$16.44123,565
Smooth Muscle Relaxants$6.84$5.70$5.60$5.80115,256
Blood Formation, Coagulation & Thrombosis$5.00$4.16$4.22$4.3162,356
Electrolytic, Caloric, and Water Balance$2.85$2.28$2.22$2.3747,612
Antineoplastic Agents$100.18$83.44$81.24$82.3817,855
Respiratory Tract Agents$4.55$3.78$3.72$3.8717,617
Antihistamine Drugs$2.09$1.70$1.72$1.9315,957
Skin and Mucous Membrane Preparations$24.90$19.94$19.41$21.494,715
Eye, Ear, Nose & Throat Preparations$0.56$0.45$0.42$0.431,224
Source: CMS Drug Utilization Data, 2011Q4-2012Q3; Wolters Kluwer Master Drug Database, Version 2.5, March 1, 2013; CMS NADACs, October 4, 2012.

Generic Drugs

For generic drugs, the differences between the benchmarks and actual amounts paid become more exaggerated. Although there are AWPs for generic drugs, the values are high and generally not reflective of actual transaction prices. Due to substantial discounts from AWP, aggressive state MAC rates established by states to pay for generic drugs, and usual and customary amounts, generics are more likely to be reimbursed at rates far below AWP values. As with brand-name drugs, WAC values tend to be much closer to actual paid amounts and relatively close to NADAC values.

Because generic drugs have much lower per-unit prices, the dispensing fee is a more important factor in the difference between paid amounts and benchmarks. The average prescription for the top 25 generic drugs used to compute the values shown in Figure 3 contains 46 units. If one assumes an average dispensing fee of $5 per prescription ($0.11 per unit) and negligible amounts of third party payment and cost sharing, which again are reasonable assumptions at a national level, the weighted average total amount paid per unit absent these amounts would be about $0.24 per unit, which falls between the weighted average WAC ($0.39) and NADAC amounts ($0.14).

As with brand-name drugs, generic drug prices differ considerably. Table 2 illustrates the variation in average benchmarks and actual amounts paid for generic drugs, across drug classes. The lowest prices tend to be in classes with multiple older, established products that compete with each other for market share, while the higher prices tend to be in classes with greater concentrations of newer products or fewer competing therapies. Unlike with the brand drugs, NADACs vary in their relation to WACs by therapeutic class, ranging from 11% less than WAC for the eye, ear, nose, and throat preparations class to 73% less than WAC for the gastrointestinal drugs class.

Pricing Metric Per Unit Comparison for Top 25 and Top 100 Generics by Number of Prescriptions
Table 2: Pricing Metric Per Unit Comparison by Therapeutic Class of Generic Drugs
Therapeutic ClassWeighted AverageUnit AWPWeighted AverageUnit WACWeighted AverageUnit NADACWeighted AverageTotal Amount Paid Per UnitTotal Rx for 1 Quarter
Central Nervous System Agents$2.33$0.51$0.27$0.5329,748,635
Cardiovascular Drugs$1.95$0.32$0.13$0.3511,240,268
Anti-infective Agents$4.50$1.28$0.49$1.266,764,413
Hormones and Synthetic Substitutes$1.11$0.62$0.45$0.706,185,648
Gastrointestinal Drugs$5.31$0.60$0.16$0.475,069,551
Antihistamine Drugs$0.98$0.24$0.13$0.282,948,786
Electrolytic, Caloric, and Water Balance$0.37$0.23$0.14$0.262,102,647
Autonomic Drugs$1.47$0.23$0.10$0.272,096,000
Vitamins$0.80$0.55$0.17$0.691,593,165
Blood Formation, Coagulation & Thrombosis$2.36$0.22$0.08$0.471,067,081
Miscellaneous Therapeutic Agents$11.24$2.55$1.57$2.70531,679
Antineoplastic Agents$6.49$1.22$0.47$1.24185,885
Smooth Muscle Relaxants$1.76$1.26$0.54$0.97141,244
Skin and Mucous Membrane Preparations$2.70$1.28$0.64$1.16127,572
Respiratory Tract Agents$1.35$0.51$0.25$0.4569,503
Eye, Ear, Nose & Throat Preparations$1.94$1.45$1.29$1.2919,261
Source: CMS Drug Utilization Data, 2011Q4-2012Q3; Wolters Kluwer Master Drug Database, Version 2.5, March 1, 2013; CMS NADACs, October 4, 2012.

Issue Brief: Policy Implications

FY 2015 HHS Budget

The federal government is making efforts to provide more transparent Medicaid drug pricing data, with Health and Human Services proposing to “increase access to and transparency of Medicaid drug pricing data” in its 2015 budget.49  HHS specifically proposes funding a nationwide survey of pharmacy drug prices to consumers, and collecting wholesale acquisition costs for all Medicaid-covered drugs. These proposals come amongst many to reform Medicaid outpatient drug reimbursement in the 2015 HHS budget.

State AAC Initiatives

State Medicaid programs use a variety of benchmarks to determine their reimbursements to pharmacies for prescribed drugs. Due to concerns about the accuracy and availability of commercially available benchmarks such as AWP, many states have changed the methods they use to determine reimbursement in recent years and more continue to explore new options. As of December 2013, Alabama, Colorado, Idaho, Iowa, Louisiana, and Oregon all use surveys of pharmacy invoices in an effort to bring more transparency to drug acquisition costs, as does CMS’s NADAC measure.  Five of these states use the same firm, Myers and Stauffer, LC, to conduct the state-wide pharmacy surveys as the federal government does.  Alabama was the leader in implementing these survey-based AACs, having used the AAC model since September 2010.  Oregon implemented the model in January 2011.50 

The state AAC and NADAC survey approaches rely on invoices to evaluate the costs that retail pharmacies pay to acquire prescription drugs from manufacturers or wholesalers; these costs do not account for rebates or discounts if they are not included on the invoice. Other states have switched from AWP-based formulas to WAC-based formulas, in part due to studies indicating WAC has a reasonably consistent relationship to invoice prices. State MACs typically determine reimbursements for the most common multiple-source brand-name drugs and generics.

The Relationship Between NADACs, EACs, and Actual Paid Amounts

The OIG’s analyses indicate that AWP, WAC, and AMP all have relatively consistent relationships with invoice prices for brands (including single- and multiple-source brands), but larger and more variable relationships with invoice prices for generic drugs. Our own analysis indicates that actual Medicaid payment amounts to retail pharmacies for prescribed drugs are much closer to WAC and NADAC prices than to AWP, primarily because of complex “lesser of” payment formulae and large percentage reductions from AWP used in EAC calculations. Differences between WAC or NADAC and the actual paid amounts are relatively modest because states have refined their reimbursement schemes over the past several years in response to concerns about excessive payment rates and as a way of controlling cost growth. For generic drugs, differences remain relatively large in percentage terms but are generally modest in terms of actual dollar amounts. Benchmarks and paid amounts vary considerably by drug class, in part due to the mix of brand name and generic medications in each class. It is important to note, however, that our analysis only looks at one point in time.  Further, we were examining NADACs from the first month they were issued. It would be worthwhile to continue looking at these trends using NADACs from other time periods, as well as studying the volatility of NADACs over time.

How Switching to AAC Affects Dispensing Fees

Regardless of whether one believes that any benchmark accurately captures final transaction prices at which retail pharmacies purchase the drugs that they dispense to Medicaid beneficiaries, the right benchmark for acquisition costs still does not resolve the issue of what constitutes “appropriate” reimbursement under Medicaid. Retail pharmacies incur costs to build and maintain infrastructure that is convenient for patients and to employ the staff and technology necessary to safely and accurately dispense medications to patients. To stay in business, the total compensation they receive, including reimbursement for the cost of the drug and the dispensing fee, needs to be sufficient to support ongoing operations profitability. Many states have increased their dispensing fees as they have ratcheted down the acquisition cost component of reimbursement.  In a 2011 Kaiser Family Foundation study of Medicaid pharmacy directors, some stated they would spend more money if they were to base their reimbursements on Alabama AACs, due to the accompanying increased dispensing fee.51  It should be noted that the pharmacy directors made these comments with regard to Alabama AACs, not NADACs. The potential savings from using NADACs or any other AAC measure are dependent on the current and future dispensing fees in each state and the state’s mix of brand and generic prescriptions. Policy-makers should not assume that the prescription trends of the past will remain the same in the future. Further, CMS and numerous experts have expressed the value of basing reimbursement on actual pricing data.52 

Specialty Drugs

Concerns over drug costs are increasingly falling outside the purview of traditional pharmacy reimbursement amounts and related benchmarks. Many new drugs and biologics are “specialty” medications, which may be dispensed through specialty pharmacies because of unusual distribution or handling requirements. These products may also require consultation with or monitoring of patients prior to or after administration of the medication, entailing administration by physicians or other health care providers, and coverage through medical benefits. Provider involvement adds a layer of complexity because of the necessary coordination of benefits, payments and rebate collections. Specialty products also tend to be much more expensive than traditional drugs, so accurate reimbursement is important, regardless of whether the state pays for them through pharmacies or through medical providers or health care facilities. With their high costs and rapid growth of utilization, managing specialty drugs will be crucial to limiting state and federal Medicaid expenditures for prescribed drugs in the near future.

This brief was prepared by Brian Bruen from George Washington University and Katherine Young from the Kaiser Family Foundation.

Methods

To compare actual drug payments to AWPs, WACs, and NADACs, we combined at the National Drug Code (NDC) level the CMS drug utilization data, the CMS list of NADACs for October 4, 2012, and the March 1, 2013 version of Wolters Kluwer Master Drug Database (MDDB) Version 2.5. We set the state drug utilization data to the most recent quarter available. At the time of this analysis, 2012 quarter three drug utilization was available for 40 states and the District of Columbia, 2012 quarter two for six states, 2012 quarter one for one state, and 2011 quarter 4 for two states.  We restricted the sample of interest to all NDCs with NADACs, AWPs, WACs, and utilization data. NADACs reported on October 2012 are reflective of data from at least a few weeks earlier. In this analysis we compared the NADACs to AWPs and WACs as of August 1, 2012.

NADAC data are available for drug products grouped by active ingredient(s), strength, dosage form, and route of administration. Drugs are further classified according to drug category as single-source, innovator multiple-source, or non-innovator multiple-source. Many people refer to drugs in the first two categories using the colloquial terms “brand-name” or “branded” drugs, and drugs in the latter category as “generic” drugs. Using the MDDB, we similarly classified single-source, single-source co-licensed, and multi-source originator products as brand drugs, and all others as generics. We identified the top 25 brand, top 25 generic, and top 100 generic drugs by the total number of paid prescriptions for each drug. We used the MDDB to identify the drug name, American Hospital Formulary System (AHFS) therapeutic class, and AHFS therapeutic subclass for each product. We then calculated the weighted average AWP, WAC, NADAC, and actual amount paid by state Medicaid agencies, for the top 25 brand, top 25 generic, top 100 generic, therapeutic class, and therapeutic subclass. We weighted each drug at the NDC level using the total number of prescriptions dispensed to Medicaid beneficiaries.

Appendix

Appendix Table 1: Existing Research on Pricing Benchmark Comparisons
TopicAuthor & Publication YearFindings
EAC/AAC BenchmarksOIG, 2005The OIG found that AMP was 23 percent lower than AWP for single-source brands, 28 percent lower for multiple-source brands, and 70 percent lower than AWP for generics (all differences measured at the midpoint of the distribution in the sample). AMP was 4 percent lower than WAC for single-source brands, 8 percent lower for multiple-source brands, and 25 percent lower for generics. There was much more variation in the percentage differences between AMP and published prices for generics than for brands.53 
OIG,2011The OIG compared AMPs, AWPs, and WACs to November 2010 invoice prices from a sample of pharmacies (as a proxy for acquisition costs). Invoice prices were generally about 15-20 percent lower than AWPs for single-source brands, with some larger differences among multiple-source brands. Invoice prices for generics without FULs ranged from 5 percent to 95 percent less than AWP, with no consistent relationship. WAC and AMP values were about the same as invoice prices for single-source brands but, as with AWP, the relationships were much more variable for multiple-source brands and generics without FULs. AMP was the least consistent benchmark.54 
AMP-Based FULsGAO,2013Using 2013 data, the GAO compared draft AMP-based FULs to NADACs, and found that in the aggregate, the two were within a few percentage points.  However, breaking the drugs out into brand and generic, but keeping the comparison in the aggregate, the GAO found that the generic draft AMP-based FULs were 19 percent higher than generic NADACs, and the brand draft AMP-based FULs were 26 percent lower than brand NADACs.55 
GAO,2010Using 2008 data, the GAO compared estimated AMP-based FULs with average retail pharmacy acquisition costs computed by IMS Health and found that acquisition costs were higher than AMP-based FULs for most of the studied drugs, and in the aggregate.56 After revising their estimates in 2010 to reflect changes to AMP-based FUL calculations included in the Affordable Care Act, the GAO concluded that AMP-based FULs were at least 35 percent higher than pharmacies’ acquisition costs, in aggregate.57 
OIG,2012The OIG compared pharmacy invoice data with FULs using the current method based on published prices and the revised, AMP-based FULs yet to be implemented by CMS. Invoice prices were four times lower than FULs based on published prices, and about 43 percent lower than AMP-based FULs, in aggregate.58 
A Fein,2011Analysis of the draft AMP-based FULs published by CMS in 2011 indicated that AMP-based payments for generic drugs could be about 40 percent lower than current federal and state payment levels, but because generics are comparatively inexpensive, the impact is smaller when including dispensing fees.59  Another analysis by the same author indicated that AMP values vary considerably from month-to-month.60 
OIG,2007These findings are consistent with another analysis by the OIG, which found that 24 percent of AMP values fluctuated by more than 10 percent from quarter to quarter; AMPs for high-expenditure drugs and single-source drugs had the most frequent changes.61 
OIG,2009 & 2010These OIG analyses raised concerns about the accuracy and consistency of AMP values.62 ,63 
State MAC PricingOIG,2013The OIG compared FULs to State Maximum Allowable Costs (state MACs) in a 2013 report, and found that FUL amounts using current methods based on published prices were almost twice the amount of state MAC prices, in aggregate. AMP-based FUL amounts were 22 percent lower than state MAC prices, in the aggregate. In addition, the OIG found that state MAC programs include 50-60 percent more drugs than FULs. Of 41 states that identified a pricing benchmark for their state MAC programs, 29 used pharmacy acquisition costs as part of the benchmark to set state MAC prices.64 

Endnotes

  1. “Medicaid Program; Covered Outpatient Drugs; Proposed Rule.” 72 Federal Register 22 (2 February 2012).  pp. 5317-5367. ↩︎
  2. This figure includes rebates.  See Urban Institute estimates based on data from Medicaid Financial Management Reports (HCFA/CMS Form 64). Published in Young K, Garfield R, Clemans-Cope L, Lawton E, and Holahan J. Enrollment-Driven Expenditure Growth: Medicaid Spending during the Economic Downturn, FY 2007-2011. Washington DC: Kaiser Family Foundation.  April 2013.  Available at https://modern.kff.org/medicaid/report/enrollment-driven-expenditure-growth-medicaid-spending-during/.   Note that more recent data is available, but because managed care organizations now currently handle much of Medicaid prescription drug services, publicly available data on prescription drug spending (i.e. fee-for-service prescription drug spending) only reflects a fraction of actual prescription drug spending. ↩︎
  3. Smith V, Kramer S, and Rudowitz R.  Managing Medicaid Pharmacy Benefits: Current Issues and Options. Washington DC: Kaiser Family Foundation.  September 2011.  Available at https://modern.kff.org/medicaid/report/managing-medicaid-pharmacy-benefits-current-issues-and-options/. ↩︎
  4. Young, Garfield, Clemans-Cope, Lawton, and Holahan, 2013. ↩︎
  5. For each covered drug that Medicaid programs pay for today, manufacturers must pay a rebate that at a minimum is equal to roughly 23 percent of the AMP for single-source drugs and 13 percent of the AMP for multiple source non-originator (generic) drugs.  Actual rebates paid for single-source drugs often exceed the minimum due to provisions in federal law that increase the rebates to account for price increases that exceed inflation, or to ensure that Medicaid gets the best price available to any private payer, including hospitals, nursing homes, and insurance plans. Most states also have supplemental rebate agreements with drug manufacturers. ↩︎
  6. For a thorough background on issues pertaining to Medicaid pharmacy benefits, see Smith, Kramer, and Rudowitz, 2011. ↩︎
  7. Multiple-source drugs are products available from two or more manufacturers; most are generic versions of older brand name drugs and the originator brand name drugs themselves. Most widely used multiple-source drugs have a federal upper limit (FUL) or a state maximum allowable cost (state MAC) that caps reimbursement below the estimated acquisition cost (EAC). ↩︎
  8. 42 CFR 447.512(b); note that the EAC is applied as an aggregate limit on payments, and need not apply to each prescription. Separate EAC certifications are required for single source and multiple-source drugs. ↩︎
  9. Section 1847A(c)(6)(B) of the Social Security Act defines WAC as the “manufacturer’s list pricefor the drug or biological to wholesalers or direct purchasers in the United States, not including prompt pay or other discounts, rebates or reductions in price […] as reported in wholesale price guides or other publications of drug or biological pricing data.” ↩︎
  10. U.S. Department of Health and Human Services – Office of Inspector General. Analyzing Changes to Medicaid Federal Upper Limit Amounts. October 2012.  Available at http://oig.hhs.gov/oei/reports/oei-03-11-00650.pdf. ↩︎
  11. Neither the total drug spending nor the spending on FUL drugs includes rebates. ↩︎
  12. U.S. Department of Health and Human Services – Office of Inspector General. Comparison of Medicaid Federal Upper Limit Amounts to Average Manufacturer Prices. June 2005. Available at https://oig.hhs.gov/oei/reports/oei-03-05-00110.pdf. ↩︎
  13. The “average” used to compute the FUL is a utilization-weighted average of the AMPs reported by each manufacturer of the drug. See Section 1927(k)(1) of the Social Security Act, as amended by §2503 of the Affordable Care Act, P.L. 111-148. ↩︎
  14. Draft Affordable Care Act Federal Upper Limit, March 2013. Available at http://www.medicaid.gov/ Medicaid-CHIP-Program-Information/By-Topics/Benefits/Prescription-Drugs/Federal-Upper-Limits.html. ↩︎
  15. U.S. Department of Health and Human Services – Office of Inspector General. Medicaid Drug Pricing in State Maximum Allowable Cost Programs. 2013. Available at http://oig.hhs.gov/oei/reports/oei-03-11-00640.pdf. ↩︎
  16. Centers for Medicare and Medicaid Services. Medicaid Prescription Reimbursement Information by State – Quarter Ending December 2013. [revised 01/31/2014; cited 4/9/2014]; Available at http://www.medicaid.gov/Medicaid-CHIP-Program-Information/By-Topics/Benefits/Prescription-Drugs/Downloads/Revised-Reimbursement-chart-.pdf. ↩︎
  17. Claxton G, Rae M, Panchal N, Damico A, Bostick N, Kenward K, and Whitmore H. Employer Health Benefits: 2012 Annual Survey. Washington DC: Kaiser Family Foundation and Health Research & Educational Trust. September 2012. Available at https://modern.kff.org/private-insurance/report/employer-health-benefits-2012-annual-survey/. ↩︎
  18. Pharmaceutical Benefit Management Institute. 2012-2013 Prescription Drug Benefit Cost and Plan Design Report. 2012. ↩︎
  19. CVS/Caremark. Insights. 2012. ↩︎
  20. Express Scripts. 2012 Drug Trend Report. March 2013. Available at http://www.drugtrendreport.com/. ↩︎
  21. Grant Thornton LLP. An Independent Comparative Analysis of U.S. Prescription Dispensing Costs. 2007. ↩︎
  22. Health Information Designs. Cost of Dispensing Prescription Drugs in Alabama. 2010. Available at http://medicaid.alabama.gov/documents/4.0_Programs/4.5_Pharmacy_Services/4.5.1_AAC/4.5.1_COD_FINAL_Report_1.06.10.pdf ↩︎
  23. Myers and Stauffer LC. Survey of Dispensing Costs of Pharmaceuticals in the State of Oregon. 2010. ↩︎
  24. Centers for Medicare and Medicaid Services. Medicaid Prescription Reimbursement Information by State – Quarter Ending December 2013. [revised 01/31/2014; cited 4/9/2014]; Available at http://www.medicaid.gov/Medicaid-CHIP-Program-Information/By-Topics/Benefits/Prescription-Drugs/Downloads/Revised-Reimbursement-chart-.pdf. ↩︎
  25. “Long-term drug maintenance” is dispensing 90-day supplies of preferred maintenance medications, as specified by the Alabama Medicaid Agency. ↩︎
  26. Medicaid and Children’s Health Insurance Programs: Essential Health Benefits in Alternative Benefit Plans, Eligibility Notices, Fair Hearing and Appeal Processes, and Premiums and Cost-sharing; Exchanges: Eligibility and Enrollment; Final Rule. 78 Federal Register 135 (15 July 2013) , pp. 42160-42322. ↩︎
  27. Rudowitz R and Snyder L. Premiums and Cost-Sharing in Medicaid. Washington DC: Kaiser Family Foundation. February 2013. Available at https://modern.kff.org/medicaid/issue-brief/premiums-and-cost-sharing-in-medicaid/. ↩︎
  28. Goldman D, Joyce G, Zheng Y. Prescription Drug Cost-sharing – Associations with Medication and Medical Utilization and Spending and Health. JAMA 2007;298(1):61-9. ↩︎
  29. Dor A, Lage MJ, Tarrants M, Castelli-Halley J. Cost-sharing, Benefit Design and Adherence: the Case of Multiple Sclerosis. Adv Health Econ Health Serv Res 2010;22:175-93. ↩︎
  30. Davidoff A, Lopert R, Stuart B, Shaffer T et al. Simulated Value-Based Insurance Design Applied to Statin Use by Medicare Beneficiaries with Diabetes. Value in Health 2012;15(3):404-11. ↩︎
  31. Bae SJ, Paltiel AD, Fuhlbrigge AL, Weiss ST, Kuntz KM. Modeling the Potential Impact of a Prescription Drug Copayment Increase on the Adult Asthmatic Medicaid Population. Value in Health 2008;11(1):110-8. ↩︎
  32. Gaynor M, Li J, Vogt WB. Is Drug Coverage a Free Lunch? Cross-Price Elasticities and the Design of Prescription Drug Benefits. No. w12758. National Bureau of Economic Research. 2006. ↩︎
  33. Goldman, D P, Joyce GF, Karaca-Mandic P. Varying Pharmacy Benefits With Clinical Status: The Case of Cholesterol-Lowering Therapy-Page 2. Am J Man Care 2006;12:21-8. ↩︎
  34. The Health Care Financing Administration became CMS in 2001. ↩︎
  35. Pracht EE, Moore WJ. Interest Groups and State Medicaid Drug Programs. Journal of Health Politics, Policy and Law. 2003;28(1):9-39. ↩︎
  36. U.S. Department of Health and Human Services – Office of Inspector General. Medicaid Pharmacy: Actual Acquisition Cost of Prescription Drug Products for Brand Name Drugs. 1997. Available at https://oig.hhs.gov/oas/reports/region6/69600030.pdf. ↩︎
  37. U.S. Department of Health and Human Services – Office of Inspector General. Medicaid Pharmacy: Actual Acquisition Cost of Brand Name Prescription Drug Products. 2001. Available at http://oig.hhs.gov/oas/reports/region6/60000023.pdf. ↩︎
  38. U.S. Department of Health and Human Services – Office of Inspector General. Medicaid Pharmacy: Additional Analyses of the Actual Acquisition Cost of Prescription Drug Products. 2002. Available at http://oig.hhs.gov/oas/reports/region6/60200041.pdf. ↩︎
  39. U.S. Department of Health and Human Services – Office of Inspector General. Medicaid Pharmacy: Actual Acquisition Cost of Generic Prescription Drug Products. 2002. Available at https://oig.hhs.gov/oas/reports/region6/60100053.pdf. ↩︎
  40. Centers for Medicare and Medicaid Services. Medicaid Prescription Reimbursement Information by State – Quarter Ending December 2010. Available at http://www.medicaid.gov/Medicaid-CHIP-Program-Information/By-Topics/Benefits/Prescription-Drugs/State-Prescription-Drug-Resources.html. ↩︎
  41. U.S. Department of Health and Human Services – Office of Inspector General. Medicaid Drug Price Comparisons: Average Manufacturer Price to Published Prices. 2005. Available at http://oig.hhs.gov/oei/reports/oei-05-05-00240.pdf. ↩︎
  42. Medicaid Program; Covered Outpatient Drugs, CMS–2345–P (2012). ↩︎
  43. Office of Management and Budget, Office of Information and Regulatory Affairs. RIN 0938-AQ41. Available at http://www.reginfo.gov/public/do/eAgendaViewRule?pubId=201310&RIN=0938-AQ41 ↩︎
  44. U.S. Department of Health and Human Services – Office of Inspector General, Replacing Average Wholesale Price: Medicaid Drug Payment Policy (OEI-03-11-00060). July 2011. Available at http://oig.hhs.gov/oei/reports/oei-03-11-00060.pdf. ↩︎
  45. Due to funding issues, as of July 2013, CMS suspended the portion of this survey focusing on consumer purchase prices, which provided estimated National Average Retail Prices (NARP) for selected outpatient drugs based on actual transaction prices. ↩︎
  46. CMS posts draft and final NADAC data, along with methods and answers to questions, on the agency’s website: http://www.medicaid.gov/Medicaid-CHIP-Program-Information/By-Topics/Benefits/Prescription-Drugs/Survey-of-Retail-Prices.html ↩︎
  47. Morgan K. NADAC or PAC; Examining Options for a Better Drug Price Standard. Elsevier. 2012. Available at http://www.goldstandard.com/2012/04/nadac-or-pac-examining-options-for-a-better-drug-price-standard.  ↩︎
  48. The NDC is a unique code that identifies each drug according to its labeler, strength, dosage form, package form, and package size. ↩︎
  49. Department of Health and Human Services. Fiscal Year 2015 Budget in Brief: Strengthening Health and Opportunity for All American.  Available at http://www.hhs.gov/budget/fy2015/fy-2015-budget-in-brief.pdf. ↩︎
  50. Smith, Kramer, and Rudowitz, 2011. ↩︎
  51. Smith, Kramer, and Rudowitz, 2011. ↩︎
  52. “Medicaid Program; Covered Outpatient Drugs; Proposed Rule.” 72 Federal Register 22 (2 February 2012).  pp. 5317-5367. ↩︎
  53. U.S. Department of Health and Human Services – Office of Inspector General. Medicaid Drug Price Comparisons: Average Manufacturer Price to Published Prices. 2005. Available at http://oig.hhs.gov/oei/reports/oei-05-05-00240.pdf. ↩︎
  54. U.S. Department of Health and Human Services – Office of Inspector General. Review of Drug Costs to Pharmacies and Their Relation to Benchmark Prices.  2011. Available at http://oig.hhs.gov/oas/reports/region6/61100002.pdf. ↩︎
  55. U.S. Government Accountability Office. CMS Should Implement Revised Federal Upper Limits and Monitor Their Relationship to Retail Pharmacy Acquisition Costs. 2013. Available at http://www.gao.gov/assets/660/659833.pdf. ↩︎
  56. U.S. Government Accountability Office. Medicaid Outpatient Prescription Drugs: Second Quarter 2008 Federal Upper Limits for Reimbursement Compared with Average Retail Pharmacy Acquisition Costs. 2009. Available at http://www.gao.gov/assets/100/96490.pdf. ↩︎
  57. U.S. Government Accountability Office. Medicaid Outpatient Prescription Drugs: Estimated Changes to Federal Upper Limits Using the Formula under the Patient Protection and Affordable Care Act. 2010. Available at http://www.gao.gov/assets/100/97232.pdf. ↩︎
  58. U.S. Department of Health and Human Services – Office of Inspector General. Analyzing Changes to Medicaid Federal Upper Limit Amounts. 2012. Available at http://oig.hhs.gov/oei/reports/oei-03-11-00650.asp. ↩︎
  59. Fein AJ. The Pharmacy Reimbursement Hit from AMP-Based FULs. Drug Channels. September 27, 2011. ↩︎
  60. Fein AJ. Generic Drug Prices are Rising, According to Latest AMP Data. Drug Channels. December 13, 2011. ↩︎
  61. U.S. Department of Health and Human Services – Office of Inspector General. Examining Fluctuations in Average Manufacturer Prices. 2007. Available at http://oig.hhs.gov/oei/reports/oei-03-06-00350.pdf. ↩︎
  62. U.S. Department of Health and Human Services – Office of Inspector General. Outlier Average Manufacturer Prices in the Federal Upper Limit Program. 2009. Available at http://www.healthlawyers.org/News/Health%20Lawyers%20Weekly/Documents/01%2022%2010/oei-03-07-00740.pdf. ↩︎
  63. U.S. Department of Health and Human Services – Office of Inspector General. Drug Manufacturers’ Noncompliance with Average Manufacturer Price Reporting Requirements. 2010. Available at http://oig.hhs.gov/oei/reports/oei-03-09-00060.pdf. ↩︎
  64. U.S. Department of Health and Human Services – Office of Inspector General. Medicaid Drug Pricing in State Maximum Allowable Cost Programs. 2013. Available at http://oig.hhs.gov/oei/reports/oei-03-11-00640.pdf. ↩︎

The Virginia Health Care Landscape

Published: May 20, 2014

The Affordable Care Act (ACA) went into full effect on January 1, 2014, ushering in health insurance reforms and new health coverage options in Virginia and across the country. Although the Medicaid expansion debate is still underway in the state, Virginia is experiencing changes to its health care delivery system. This fact sheet provides an overview of the population health, health coverage, and health care delivery system in Virginia in the era of health reform.

Demographics

Figure 1: Virginia is Located in the South Atlantic Region of the U.S.

Virginia has a growing and increasingly diverse population. Virginia is one of eight states and DC located in the South Atlantic region of the U.S. (Figure 1).1  At almost 40,000 square miles, it is the 37th largest state.2  Virginia is home to nearly 8 million residents, making it the 12th most populous state in the U.S.3  In 2012, 65% of Virginians identified as White, which is similar to the U.S. average. However, Virginia has a higher percentage of Blacks (19%) than the U.S. overall (12%) and a smaller percentage of Hispanics (7% compared to 17% nationally)(Figure 2).4  The age distribution of Virginia’s population aligns with the age distribution of the overall U.S. population.5  Between 2000 and 2010, Virginia’s population increased 13.0%, compared to 9.7% nationally, making Virginia the 17th fastest-growing state in the U.S.6   Population growth in Virginia was concentrated in the state’s major metropolitan areas, including northern Virginia (which is considered a suburb of Washington, D.C.), Richmond, and the Hampton Roads area in the southeastern part of the state.7  Meanwhile, many of the state’s rural counties in the south and west have experienced a decrease in their populations. (See Figure 11 in the Appendix for nonelderly population by county.)

Figure 2: Virginia State Demographics, 2012

Hispanics are the fastest-growing racial/ethnic group in Virginia, with the population increasing 92% between 2000 and 2010, followed by the Asian population, which increased 70% during the same time period.8  Changes in the political dynamics of the state, including the outcomes of recent statewide and national elections, are attributed, in part, to the changing demographics of the population within Virginia.

Virginia has lower unemployment and higher family incomes than the U.S. population overall. In March 2014, Virginia’s unemployment rate was 5%, which is lower than the national average (6.7%) and the 12th lowest unemployment rate among the states.9  The 2012 median household income in Virginia was nearly $62,000, which was the 9th highest among the states.10  Nearly one in six (16%) individuals in Virginia were living in poverty in 2012, which was the 12th lowest poverty rate among the states and well below the national average of 20% (Figure 3).11  Among states in the South Atlantic region, Virginia has the third highest median household income (behind MD and DC) and the second lowest poverty rate (behind MD). However, poverty rates vary across areas of the state. For example, poverty rates are lower in the state’s northern counties and the western counties outside of Richmond, than in the cities of Richmond and Norfolk and the rural counties of the south and southwest.12 

Figure 3: Distribution of Total Population by Federal Poverty Level, 2012

State Economy

Virginia is experiencing moderate economic growth. In 2012, Virginia’s Gross Domestic Product (GDP) was $445.9 billion, which makes it the 10th largest state economy in the U.S.13  Like other states across the country, Virginia has experienced consecutive years of economic growth.14  However, from 2011 to 2012, Virginia’s real GDP increased by 1.1%, less than the national GDP (2.5%).15  Agriculture, manufacturing, and mining are major industries in the state, in addition to federal government and military activities and tourism.16  Like other states across the country, Virginia experienced budgetary challenges during the recent economic downturn, although, the state’s economy continues to improve. Virginia ended State Fiscal Year (SFY) 2013 with a $585 million budget surplus, the state’s fourth annual budgetary surplus and its largest since 2005.17 

Population Health

The overall population health in Virginia is comparable to the national average. In 2013, Virginia ranked 26 among the 50 states in overall health, according to the United Health Care Foundation’s Annual Report, America’s Health Rankings.18  The shares of adults in Virginia who are overweight or obese, have been diagnosed with diabetes, or have asthma are similar to shares nationally, as are the death rates due to heart disease and cancer.19 ,20 ,21 ,22 ,23  Adults in Virginia were less likely than adults nationally to report being in fair or poor health or to have poor mental health.24 ,25  In addition, the proportion of adults in Virginia who are smokers is equal to the national average of 19%.26 

Population health varies across Virginia’s counties, with the state’s northern counties, those to the west of Richmond, and those in the west along the Blue Ridge Mountains, faring better than the cities of Richmond and Norfolk and the rural counties along the northern peninsula, south, and southwest.27 

Disparities in health and health care access exist in Virginia. Like other states across the country, measures of health status and access to and utilization of health care services in Virginia vary by race/ethnicity and patterns across these measures in Virginia closely align with national averages. Blacks (75 years) and Whites (79 years) in Virginia have a shorter life expectancy than Asians (87 years) and Hispanics (88 years).28  The mortality rates due to heart disease, cancer, and diabetes are higher for Blacks in Virginia than Whites.29  Further, nonelderly Black adults in Virginia are more likely to be overweight or obese (74% vs 61%), have diabetes (11% vs 7%), and report being in fair or poor health (19% vs 13%) than nonelderly White adults.30  Both nonelderly White (35%) and Black (33%) adults in the state are more likely to report experiencing frequent mental distress than nonelderly Hispanics (26%).31  While nonelderly Hispanic (58%) and Black (72%) adults are less likely than nonelderly White adults (77%) to have a usual source of care, nonelderly White adults (83%) are less likely than nonelderly Black (89%) and Hispanic (85%) adults to report having a primary care visit in the past two years.32 

To address the state’s health disparities and promote health equity, the Virginia Department of Health’s Office of Minority Health & Health Equity published a Health Equity report in 2012.33  This report is a call to action for Virginia communities across the state to work together to improve the health of all races and ethnicities. Local programs and initiatives are also operating in the state. For example, Virginia Commonwealth University operates the Virginia Coordinated Care (VCC) Program, which aims to increase access to primary care, and the Mosby Partnership, which works to reduce health disparities among public housing residents in the Richmond area.34  In addition, to address geographic health disparities, Virginia’s Department of Health released the Virginia’s State Rural Health Plan in 2013, which is a three-five year action plan to enhance health systems throughout rural areas of the state.35 

Coverage

Figure 4: Health Insurance Coverage of the Nonelderly Population, 2012

Over one million nonelderly individuals, or 13% of Virginia’s population, were uninsured in 2012 (Figure 4).36  This rate is lower than the U.S. average of 15%, which reflects the range of uninsured rates across the country from 4% in Massachusetts to 24% in Texas. People of color are disproportionately represented among the nonelderly uninsured in Virginia. Although only 19% of nonelderly Virginians identify as Black, they represent one-quarter (26%) of the state’s uninsured.37  Similarly, while only 8% of nonelderly Virginians identify as Hispanic, they represent one-fifth (19%) of the state’s uninsured. In addition, as shown in Figure 12 (Appendix), the nonelderly uninsured in Virginia are not equally distributed across the state’s counties, with the southern and northwestern regions having higher uninsured rates than other areas of the state. As in other states across the U.S., the majority of the uninsured have at least one full-time worker in their households, have income below 400% of the Federal Poverty Level (FPL), and are under age 55 (Figure 5).38 

Figure 5: Characteristics of the Nonelderly Uninsured in Virginia, 2012

Among the 87% of Virginians with health insurance, the largest share (54% of the state population) have employer-sponsored coverage, followed by Medicare (13%), Medicaid (10%), and individual private insurance (5%)(Figure 4).39 

Medicaid

Similar to the national picture, the large majority of Medicaid enrollees in Virginia are children, but the elderly and individuals with disabilities account for most Medicaid spending. Based on data for SFY 2013, 54% of Medicaid enrollees were children, who accounted for 23% of expenditures (Figure 6).40  While, one-quarter (26%) of enrollees were elderly or people with disabilities who accounted for 65% of total program costs. Based on data from 2010 (the latest year for comparative data), average federal and state spending per beneficiary in Virginia was $5,985, slightly higher than the national average of $5,563 and slightly above other states in the South Atlantic Region (Figure 7).41 

Figure 6: Virginia Medicaid Enrollment and Expenditures, SFY 2013

Medicaid costs are shared by the states and the federal government, with the federal government paying 50% of the cost of Virginia Medicaid; therefore, for every $1.00 that Virginia spends on Medicaid, the federal government sends an additional $1.00 to the state in matching funds.42  The combined federal and state spending on Medicaid in Virginia for SFY 2013 was $6.7 billion.43  This accounted for 17% of total state spending, 22% of state general funds, and 40% state spending of federal funds (Figure 8).44  Medicaid is the second largest source of state general fund spending behind elementary and secondary education, but the largest source of federal revenue flowing into the state.

Most Medicaid beneficiaries in Virginia are enrolled in managed care. Nearly 7 in 10 (69%) Medicaid beneficiaries in Virginia are enrolled in risk-based managed care.45  Seven managed care organizations serve Medicaid beneficiaries and the three largest plans, Anthem HealthKeepers Plus, Virginia Premier Health Plan, and Optima Family Care, account for nearly 85% of total Medicaid managed care enrollment.46  Although foster children were previously excluded from managed care, the state is currently transitioning them to Medicaid managed care, with an anticipated completion date of July 2014.47 

Figure 7: Average State Medicaid Spending per Beneficiary, 2010

Virginia currently has limited Medicaid eligibility for adults. Pregnant women in Virginia with income up to 148% FPL ($28,904 for a family of 3 in 2014) are eligible for Medicaid in Virginia, which is the sixth lowest eligibility limit in the country.48  Meanwhile, parents of dependent children are only eligible for Medicaid if their income does not exceed 51% FPL ($10,120 for a family of 3 in 2014), the sixteenth lowest eligibility limit in the country, and adults without dependent children in the state are ineligible for coverage, regardless of income. Virginia provides coverage for children up to 205% FPL through the CHIP-funded Family Access to Medical Insurance Security (FAMIS) plan.49 

The ACA could extend financial assistance for coverage to a majority of uninsured Virginians. A main goal of the ACA is to extend health coverage to many of the 47 million nonelderly uninsured individuals across the country, including many of the 1 million nonelderly uninsured Virginians. The ACA accomplishes this through insurance market reforms and by establishing new coverage pathways, including an expansion of Medicaid to cover nearly all nonelderly individuals up to 138% FPL ($16,105 for an individual, $27,310 for a family of 3 in 2014), and by providing premium tax credits to many individuals between 100-400% FPL to purchase coverage on the Health Insurance Marketplaces. However, as a result of the Supreme Court decision on the ACA, the Medicaid expansion is now effectively a state option.50  Many currently uninsured nonelderly Virginians are eligible for premium subsidies in the Marketplace or Medicaid coverage, if the state expands its Medicaid program (Figure 9). Regardless of a state’s Medicaid expansion decision, all states must simplify and streamline their eligibility and enrollment processes under the ACA, which, along with ACA outreach efforts, will likely increase Medicaid enrollment among currently eligible but unenrolled individuals, especially children.

Figure 8: Budget Expenditures by Funding Source for Virginia, SFY 2013

Without the Medicaid expansion, 191,000 currently uninsured adults (19% of the nonelderly uninsured in the state) who would have been eligible for Medicaid will remain in the coverage gap (Figure 10).51   In Virginia, the debate over the Medicaid expansion is still ongoing.52  If the state does not expand Medicaid, 191,000 individuals who have incomes below 100% FPL will be left out of coverage because they earn too much to qualify for Medicaid, but not enough to qualify for the premium subsidies for Marketplace coverage, which begin at 100% FPL. An additional 123,000 Virginians have incomes between 100-138% FPL and may currently be eligible for Marketplace subsidies.53  Virginia’s Governor Terry McAuliffe (D), who was elected in November 2013, has made Medicaid expansion one of his top priorities since taking office. On March 24, 2014, the start of the state legislature’s special session, Governor McAuliffe proposed expanding Medicaid in the state through a two-year pilot program, as part of his SFY 2015-2016 Budget proposal.54  On April 8, 2014, the State Senate approved the Governor’s Budget, but substituted his Medicaid expansion pilot program with its own pilot, called “Marketplace Virginia”.55  Marketplace Virginia would use federal Medicaid expansion funds to provide subsidies for up to 400,000 Virginians to purchase private health insurance, including those who are currently uninsured and some who are currently covered through other programs, such as pregnant women covered through the state’s CHIP program. The Governor and Democratic-controlled Senate are currently insisting on some form of Medicaid expansion in the state budget, while the Republican-controlled House of Delegates argues that the issue of Medicaid expansion should be debated separately from the state budget. Failure to pass a state budget could result in a state government shutdown on July 1, 2014.

Figure 9: Eligibility for Coverage Among Currently Uninsured Virginians, As of January 2014

If the state expands its Medicaid program, the federal government will pay 100% of the cost of coverage for those newly eligible through 2016, phasing down to 90% in 2020 and beyond. In January 2014, the Virginia Department of Medical Assistance Services released a report that estimated that Medicaid expansion would save the state $600 million through 2022.56  In advocating for the expansion, Governor McAuliffe and other supporters have emphasized the negative impact that foregoing federal dollars would have on the state’s safety-net providers.

Virginia is implementing new quality and performance measures to improve primary and preventive care and care coordination. In 2013, Virginia initiated two value-based purchasing programs in its Medicaid program: a pay-for-performance initiative designed to increase use of preventive services and an integration initiative that uses shared savings and shared risk arrangements between MCOs and providers to improve quality and financial performance.57  Managed care plans throughout the state are also experimenting with patient-centered medical home initiatives. For example, Virginia Premier Health Plan opened a “medical home” clinic in Roanoke to provide primary care and care coordination with specialists for Medicaid beneficiaries.58 

Figure 10: Nearly 191,000 Poor Nonelderly Uninsured Adults in Virginia Are Currently in the ACA Coverage Gap

Virginia is seeking to better coordinate care and control costs for its dual eligible beneficiaries, who often have complex and costly health care needs. In 2010, dual eligible beneficiaries, or individuals who are eligible for both Medicare and Medicaid, made up 14% of total Medicaid enrollment and accounted for $6 million (40%) of total Medicaid costs.59  In an effort to better integrate care and align financing for dual eligible beneficiaries, CMS is using new authority afforded under the ACA to launch demonstration projects in several states across the country that test new care coordination and delivery models. Virginia is one of 11 states that have been approved so far to participate in a duals demonstration project.60  Starting in April 2014, Virginia began enrolling 78,600 adult dual eligible beneficiaries in 104 localities, grouped into 5 regions, into capitated managed care plans through the duals demonstration project, called Commonwealth Coordinated Care.61  Commonwealth Coordinated Care includes the state’s home and community-based services (HCBS) waiver for seniors and persons with physical disabilities in the plans’ capitated rate, along with traditional Medicare and Medicaid benefits packages. Enrollment into the demonstration is voluntary for eligible beneficiaries, although they will be auto-enrolled into one of the demonstration plans, unless they take affirmative action to opt out. Savings are deducted prospectively from CMS and the state’s contributions to the Medicare and Medicaid capitated rates.

Health Insurance Marketplace

Virginia is one of 27 states in which the federal government has set up and is running the Health Insurance Marketplace.62  Despite initial plans to set up its own exchange, Virginia opted for a Federally Facilitated Marketplace. However, the state is retaining responsibility for managing and reviewing rates for health plans sold on the Marketplace. Eight insurance providers are offering 106 Qualified Health Plans in Virginia’s Marketplace.63  At $253 per month, Richmond has the 22nd lowest monthly premium for a Benchmark Health plan (defined as the second-lowest cost Silver plan in the rating area) among major cities across the country, before subsidies.64  Of the 823,000 individuals who could potentially enroll in the state’s Marketplace, 518,000 (63%) are estimated to be eligible for premium tax credits.65  As of April 19, 2014, 392,340 individuals had been determined eligible to enroll in a Marketplace plan, of whom 231,534 qualified for financial assistance and 216,356 selected a Marketplace plan.66 

Outreach and enrollment support is being provided by the federal government and private organizations. The state of Virginia has not provided any support for outreach and enrollment for the Marketplace. All funding for these efforts has come from the federal government and private organizations, such as Enroll America.67  To assist with ACA outreach and enrollment, 22 of Virginia’s Federally Qualified Health Centers (FQHCs) were awarded $3.8 million for FYs 2013 and 2014 and the Virginia Poverty Law Center, Inc. and Advanced Patient Advocacy, LLC. have been awarded federal navigator grants totaling $1.76 million.68 ,69  Enrollment assistance programs are also building off of the state’s Project Connect program, which has assisted with Medicaid and CHIP enrollment through community organizations and health care providers. Despite these efforts, resources for application and enrollment assistance are considerably less in Virginia compared to states that expanded Medicaid and established their own Marketplaces.70 

Safety Net

Virginia’s safety-net delivery system will continue to play an important role in providing health care to the state’s vulnerable population. Virginia’s community health centers and hospitals provide access to needed primary, preventive, and acute care services for low-income and underserved residents. There are no public hospitals owned or operated by local governments in the state and so Virginia’s two large academic medical centers, Virginia Commonwealth University (VCU) Medical Center in Richmond and the University of Virginia Medical Center in Charlottesville, serve as the state’s main safety-net hospitals. Several smaller private, not-for-profit hospitals also play a safety-net role. Seven of Virginia’s hospitals are designated as Critical Access Hospitals and provide 24-hour access to needed emergency medical services in rural areas of the state.71  In 2012, Virginia’s hospitals provided $2.3 billion in charity care, or about $2,300 per uninsured Virginian, the largest share of which was provided by the VCU and University of Virginia Medical Centers.72 

Virginia is home to 24 FQHCs, which operated 150 sites, served 284,000 patients, and provided over 1 million patient visits in 2012.73  Thirty-nine percent of patients were uninsured, 22% had Medicaid, and over half (57%) were below 100% FPL.74  Virginia is also home to 57 free clinics that, in 2012, provided an additional 255,000 primary and specialty care visits, as well as 46,600 dental and 22,000 behavioral health care visits, mostly to uninsured patients.75 

Despite Virginia’s existing safety-net, the state has Health Professional Shortage Areas (HPSAs) and unmet need for care. As of July 2013, Virginia had 90 HPSAs and only 72% of the primary health care need in the state was being met.76  The state had 50 mental health HPSAs and 83 dental HPSAs, and only 61% of the need for mental health and 47% of the need for dental care in the state was being met.77  Virginia is one of 12 states that have restricted autonomy, increased supervision, and increased licensure requirements for nurse practitioners, while 17 states allow nurse practitioners full autonomy and 21 states have more limited autonomy.78  Meanwhile, community health centers and free clinics report a 20% increase in uninsured patients over the past two years and free clinics report increased wait times, now up to four months for first-time appointments for new patients.79 

Virginia is working to strengthen its mental health system. In response to the November 2013 tragedy in which Sen. R Creigh Deeds was attacked by his son, who then killed himself, both houses of the Virginia Legislature approved changes to the state’s mental health system, including increasing the amount of time an individual deemed to be a threat could be involuntarily held or held in emergency custody, additional funding for the state’s mental hospitals to increase capacity, and the establishment of a joint committee to study the state’s mental health system.80  However, the proposals for additional spending are on hold due to the impasse over the state budget. The state’s Office of the Inspector General issued a report in February 2014 concluding that the state spent $28 million for institutional care of patients who were clinically ready to be discharged to community mental health settings, which has further added to the perception that the mental health system is in need of reform.81 

Looking Ahead

There is much to watch in Virginia. Individuals who have newly gained coverage in the Marketplace are beginning to interact with their new health plans; Governor McAuliffe and the state legislature are continuing negotiations over the state budget and a final decision on the Medicaid expansion; and the state’s safety-net providers will continue to adapt to the changing health coverage landscape and to provide care to the remaining uninsured. In addition, the state is experiencing changes in its health care delivery system, with the expansion of new models, such as the patient-centered medical home.82  It remains to be seen how these and other changes under the ACA will affect the health, health care access, and health care utilization of Virginians in the future.

Peter Cunningham of Virginia Commonwealth University, Department of Healthcare Policy and Research provided assistance in preparing this fact sheet.

Appendix

Figure 11: Virginia Nonelderly Population by County, 2008-2012
Figure 12: Virginia Nonelderly Uninsured Rate by County, 2008-2012
  1. U.S. Census Bureau, Census Regions and Divisions, http://www.census.gov/geo/maps-data/maps/pdfs/reference/us_regdiv.pdf. ↩︎
  2. World Atlas, United States, http://www.worldatlas.com/aatlas/infopage/usabysiz.htm. ↩︎
  3. Urban Institute and Kaiser Commission on Medicaid and the Uninsured estimates based on the Census Bureau’s March 2012 and 2013 Current Population Survey (CPS: Annual Social and Economic Supplements). ↩︎
  4. UI/KCMU estimates based on March 2012 and 2013 CPS. ↩︎
  5. UI/KCMU estimates based on March 2012 and 2013 CPS. ↩︎
  6. U.S. Census, Population Distribution and Change: 2000 to 2010 (March 2011), http://www.census.gov/prod/cen2010/briefs/c2010br-01.pdf. ↩︎
  7. Weldon Cooper Center for Public Service, Demographics Interactive Map: Population Growth (2000-2010) (University of Virginia), http://www.coopercenter.org/demographics/interactive-map/citycounty/3103. ↩︎
  8. Cai Qian, “A Decade of Change in Virginia’s Population” The Virginia News Letter vol. 87, no. 4(June 2011): 1-6, http://www.coopercenter.org/sites/default/files/publications/Virginia%20News%20Letter%202011%20Vol.%2087%20No%204.pdf. ↩︎
  9. Bureau of Labor Statistics, Unemployment Rates for State: Monthly Rankings Seasonally Adjusted, March 2014 (April 18, 2014), http://www.bls.gov/web/laus/laumstrk.htm and Bureau of Labor Statistics, The Employment Situation – March 2014 (April 4, 2014), http://www.bls.gov/news.release/pdf/empsit.pdf. ↩︎
  10. Amanda Noss, Household Income:2012, American Community Survey Briefs (September 2013), http://www.census.gov/prod/2013pubs/acsbr12-02.pdf. ↩︎
  11. UI/KCMU estimates based on March 2012 and 2013 CPS. ↩︎
  12. Bureau of the Census, Small Area Income and Poverty Estimates: Percent of total population in poverty, 2012: Virginia (March 12, 2014), http://www.ers.usda.gov/data-products/county-level-data-sets/poverty.aspx#.U1_XhfldUt4. ↩︎
  13. Bureau of Economic Analysis, Gross Domestic Product by State 2012 (June 6, 2013). ↩︎
  14. Bureau of Economic Analysis, Gross Domestic Product by State 2008-2012 (June 6, 2013). ↩︎
  15. Bureau of Economic Analysis, Widespread Economic Growth in 2012 (June 6, 2013), http://www.bea.gov/newsreleases/regional/gdp_state/gsp_newsrelease.htm. ↩︎
  16. University of Virginia, Industries of Virginia, http://vastudies.pwnet.org/pdf/Economics3.pdf. ↩︎
  17. Office of Governor Robert McDonnell, “Governor McDonnell Announces $585 Million Budget Surplus for FY 2013” (August 19, 2013), http://www.varoadtothefuture.virginia.gov/viewRelease.cfm?id=1948. ↩︎
  18. United Health Care Foundation, America’s Health Rankings: State Ranking Overview: 2013 (2013), http://www.americashealthrankings.org/rankings. ↩︎
  19. Overweight and obesity: 64% of adults in Virginia are overweight or obese, compared to 63% of adults nationally. KCMU analysis of the Center for Disease Control and Prevention (CDC)’s Behavioral Risk Factor Surveillance System (BRFSS) 2012 Survey Results. ↩︎
  20. Diabetes: 10.6% of adults in Virginia have been told by a doctor that they have diabetes, compared to a national average of 10.2%. KCMU analysis of the Center for Disease Control and Prevention (CDC)’s Behavioral Risk Factor Surveillance System (BRFSS) 2012 Survey Results. ↩︎
  21. Asthma: 8.4% of adults in Virginia have asthma, compared to 8.6% nationally. 2010 Behavioral Risk Factor Surveillance System (BRFSS), Table C1, analysis by Air Pollution and Respiratory Health Branch, National Center for Environmental Health Centers for Disease Control and Prevention, available at http://www.cdc.gov/asthma/brfss/2010/brfssdata.htm. ↩︎
  22. Heart Disease: The death rate due to heart disease in Virginia is 168.5/100,000, compared to the national average of 179.1/100,000. The Centers for Disease Control and Prevention (CDC), National Center for Health Statistics, Division of Vital Statistics, National Vital Statistics Report Volume 61, Number 4, Table 19, May 8, 2013. ↩︎
  23. Cancer: The death rate due to cancer in Virginia is 172.4/100,000, compared to the national average of 172.8/100,000. The Centers for Disease Control and Prevention (CDC), National Center for Health Statistics, Division of Vital Statistics, National Vital Statistics Report Volume 61, Number 4, Table 19, May 8, 2013. ↩︎
  24. Fair/Poor Health: 14.4% of nonelderly adults in Virginia report being in fair or poor health, compared to 16.2% nationally. KCMU analysis of the Center for Disease Control and Prevention (CDC)’s Behavioral Risk Factor Surveillance System (BRFSS) 2012 Survey Results. ↩︎
  25. Mental Health: 31% of adults in Virginia report having poor mental health, compared to 36% of adults nationally. KCMU analysis of the Center for Disease Control and Prevention (CDC)’s Behavioral Risk Factor Surveillance System (BRFSS) 2012 Survey Results. ↩︎
  26. KCMU analysis of the Center for Disease Control and Prevention (CDC)’s Behavioral Risk Factor Surveillance System (BRFSS) 2012 Survey Results. ↩︎
  27. Robert Wood Johnson Foundation and University of Wisconsin Population Health Institute, County Health Rankings & Roadmaps 2013: Virginia (2013), http://www.countyhealthrankings.org/sites/default/files/states/CHR2013_VA.pdf. ↩︎
  28. State Health Facts, Life Expectancy at Birth by State and by Race/Ethnicity (Kaiser Family Foundation, 2010), https://modern.kff.org/other/state-indicator/life-expectancy/?state=VA and https://modern.kff.org/other/state-indicator/life-expectancy-by-re/?state=VA. ↩︎
  29. The mortality rate for heart disease in Virginia is 163.5/100,000 for Whites and 208.2/100,000 for Blacks; the mortality rate in Virginia due to cancer is 169/100,000 for Whites and 205.9/100,000 for Blacks; and the mortality rate due to diabetes in Virginia is 15.7/100,000 for Whites and 36.1/100,000 for Blacks. Centers for Disease Control and Prevention, National Center for Health Statistics. Underlying Cause of Death 1999-2010 on CDC WONDER Online Database, released 2013. Data are from the Multiple Cause of Death Files, 1999-2010, as compiled from data provided by the 57 vital statistics jurisdictions through the Vital Statistics Cooperative Program (July 2013). ↩︎
  30. KCMU analysis of 2012 Behavioral Risk Factor Surveillance System (BRFSS) Survey Results. ↩︎
  31. KCMU analysis of 2012 BRFSS. ↩︎
  32. KCMU analysis of 2012 BRFSS. ↩︎
  33. Virginia Department of Health Office of Minority Health and Health Equity, Virginia Health Equity Report 2012, http://www.vdh.virginia.gov/OMHHE/2012HEReport/2012%20Hereport.html. ↩︎
  34. Virginia Commonwealth University, Virginia Coordinated Care Program, http://www.vcuhealth.org/vcc and Mosby Partnership, http://www.healthdisparities.vcu.edu/?id=1336&sid=10. ↩︎
  35. Virginia Department of Health, Virginia’s State Rural Health Plan (2013), http://www.va-srhp.org/docs/plan/2013Plan-final.pdf. ↩︎
  36. UI/KCMU estimates based on March 2012 and 2013 CPS. ↩︎
  37. UI/KCMU estimates based on March 2012 and 2013 ASEC Supplement to the CPS and Kaiser Commission on Medicaid and the Uninsured, Health Coverage and Care in the South in 2014 and Beyond, Appendix Table 3 (Kaiser Family Foundation, April 2014), https://modern.kff.org/disparities-policy/issue-brief/health-coverage-and-care-in-the-south-in-2014-and-beyond/. ↩︎
  38. UI/KCMU estimates based on March 2012 and 2013 CPS. ↩︎
  39. UI/KCMU estimates based on March 2012 and 2013 CPS. ↩︎
  40. Virginia Department of Medical Assistance Services (DMAS), Virginia Medicaid at a Glance (2013), http://www.dmas.virginia.gov/Content_atchs/atchs/va-medprg.pdf. ↩︎
  41. KCMU/UI estimates based on data from FY 2010 MSIS and CMS-64 reports, 2012. ↩︎
  42. For FY 2014: Federal Register, November 30, 2012 (Vol 77, No. 231), pp 71420-71423. ↩︎
  43. Virginia Department of Medical Assistance Services (DMAS), Virginia Medicaid at a Glance (2013). ↩︎
  44. KCMU estimates based on the NASBO November 2013 State Expenditure Report (data for Estimated SFY 2013). ↩︎
  45. Virginia Department of Medical Assistance Services, The History of Managed Care in Virginia, Version 2 (July 2012), http://www.dmas.virginia.gov/Content_atchs/mc/mc-hstry.pdf. ↩︎
  46. Virginia Department of Medical Assistance Services, Managed Care Coverage Map and MCO Characteristics Effective July 2013, http://www.dmas.virginia.gov/Content_atchs/mc/mc-mcc2.pdf. ↩︎
  47. Virginia Department of Medical Assistance Services, Virginia Medicaid Managed Care 2013 Annual Report: A year of Change Inside and Out, http://www.dmas.virginia.gov/Content_atchs/mc/apr-f8.pdf. ↩︎
  48. Based on data from the Centers for Medicare and Medicaid Services (CMS), State Medicaid and CHIP Income Eligibility Standards Effective January 1, 2014; accessed October 1, 2013. ↩︎
  49. KCMU estimates based on CMS, State Medicaid and CHIP Income Eligibility Standards Effective January 1, 2014 (October 1, 2013). ↩︎
  50. MaryBeth Musumeci, A Guide to the Supreme Court’s Affordable Care Act Decision (Kaiser Family Foundation, June 2012), https://modern.kff.org/health-reform/issue-brief/a-guide-to-the-supreme-courts-affordable/. ↩︎
  51. Kaiser Commission on Medicaid and the Uninsured, The Coverage Gap: Uninsured Poor Adults in States that Do Not Expand Medicaid (Kaiser Family Foundation, October 2013), http://modern.kff.org/health-reform/issue-brief/the-coverage-gap-uninsured-poor-adults-in-states-that-do-not-expand-medicaid/. ↩︎
  52. State Health Facts, “Status of State Action on the Medicaid Expansion Decision, 2014” (Kaiser Family Foundation, January 28, 2014), https://modern.kff.org/health-reform/state-indicator/state-activity-around-expanding-medicaid-under-the-affordable-care-act/. ↩︎
  53. Commission on Medicaid and the Uninsured, A Closer Look at the Impact of State Decisions Not to Expand Medicaid on Coverage for Uninsured Adults (Kaiser Family Foundation, April 2014), https://modern.kff.org/medicaid/fact-sheet/a-closer-look-at-the-impact-of-state-decisions-not-to-expand-medicaid-on-coverage-for-uninsured-adults/. ↩︎
  54. Governor Terry McAuliffe, “Governor McAuliffe Releases FY2015-16 Budget as Special Session Begins” (March 24, 2014), https://governor.virginia.gov/news/newsarticle?articleId=3650. ↩︎
  55. Virginia Senate Bill 5003 (April 8, 2014), http://legiscan.com/VA/bill/SB5003/2014/X1. ↩︎
  56. Rachel Weiner, “Medicaid Expansion in VA Gets a Boost” (Washington Post, January 22, 2014), http://www.washingtonpost.com/local/virginia-politics/medicaid-expansion-in-va-gets-a-boost/2014/01/22/9fcaea0c-83a9-11e3-9dd4-e7278db80d86_story.html. ↩︎
  57. Virginia Department of Medical Assistance Services, Virginia Medicaid Managed Care 2013 Annual Report: A year of Change Inside and Out. ↩︎
  58. VA Premier Health Plan, Inc, “Medical Home”, https://www.vapremier.com/medicalhome/patient-centered-medical-home/. ↩︎
  59. Kaiser Commission on Medicaid and the Uninsured and Urban Institute estimates based on data from FY 2010 MSIS, 2013, https://modern.kff.org/medicaid/issue-brief/medicaids-role-for-dual-eligible-beneficiaries/ ↩︎
  60. Kaiser Commission on Medicaid and the Uninsured, State Demonstration Proposals to Integrate Care and Align Financing and/or Administration for Dual Eligible Beneficiaries (Kaiser Family Foundation, April 2014), https://modern.kff.org/medicaid/fact-sheet/state-demonstration-proposals-to-integrate-care-and-align-financing-for-dual-eligible-beneficiaries/. For more information, see: MaryBeth Musumeci, Financial and Administrative Alignment Demonstrations for Dual Eligible Beneficiaries Compared: States with Memoranda of Understanding Approved by CMS (Kaiser Family Foundation, April 2014), https://modern.kff.org/medicaid/issue-brief/financial-alignment-demonstrations-for-dual-eligible-beneficiaries-compared/. ↩︎
  61. Virginia Department of Medical Assistance Services, Integrated Care for Medicare-Medicaid Enrollees, http://www.dmas.virginia.gov/Content_pgs/altc-enrl.aspx. ↩︎
  62. State Health Facts. “State Decisions for Creating Health Insurance Marketplaces” (Kaiser Family Foundation, May 28, 2013), http://modern.kff.org/health-reform/state-indicator/health-insurance-exchanges/. ↩︎
  63. State Health Facts, Total Number of Insurers Participating in the Individual Health Insurance Marketplace (Kaiser Family Foundation), https://modern.kff.org/health-reform/state-indicator/total-number-of-insurers-participating-in-the-individual-health-insurance-marketplace/. ↩︎
  64. This is the monthly premium for a single, 40-year-old at 250% FPL. With premium tax credits, the monthly premium drops to $193. To see how Virginia compares to other states, see: State Health Facts, “ 2014 Monthly Premiums for a Single 40-Year-Old at 250 Percent of Poverty in a Major City in Each State” (Kaiser Family Foundation), https://modern.kff.org/other/state-indicator/2014-monthly-premiums-for-a-single-40-year-old-at-250-percent-of-poverty-in-a-major-city-in-each-state/. ↩︎
  65. Gary Claxton, et al. State-by-State Estimates of the Number of People Eligible for Premium Tax Credits Under the Affordable Care Act (Kaiser Family Foundation, November 2013), https://modern.kff.org/health-reform/issue-brief/state-by-state-estimates-of-the-number-of-people-eligible-for-premium-tax-credits-under-the-affordable-care-act/. ↩︎
  66. Office of the Assistant Secretary for Planning and Evaluation (ASPE), Department of Health and Human Services (HHS), Health Insurance Marketplace: Summary Enrollment Report for the Initial Annual Open Enrollment Period (May 1, 2014), http://aspe.hhs.gov/health/reports/2014/MarketPlaceEnrollment/Apr2014/ib_2014Apr_enrollment.pdf. ↩︎
  67. John Holahan and Rebecca Peters, The Launch of the Affordable Care Act in Selected States: Insurer Participation, Competition, and Premiums (The Urban Institute, March 2014), http://www.urban.org/UploadedPDF/413040-The-Launch-of-the-Affordable-Care-Act-in-Selected-States-Insurer-Participation-Competition-and-Premiums.pdf. ↩︎
  68. HRSA, Virginia: Health Center Outreach & Enrollment Assistance, http://www.hrsa.gov/about/news/2013tables/outreachandenrollment/va.html. ↩︎
  69. CCIIO, Navigator Grant Recipients (October 2013), http://www.cms.gov/CCIIO/Programs-and-Initiatives/Health-Insurance-Marketplaces/Downloads/navigator-list-10-18-2013.pdf. ↩︎
  70. John Holahan and Rebecca Peters, The Launch of the Affordable Care Act in Selected States: Insurer Participation, Competition, and Premiums (March 2014). ↩︎
  71. Virginia Health Information, A Medical Profile, http://www.vhi.org/hguide_medicalprofile.asp. ↩︎
  72. Virginia Health Information, Industry Report: 2013, http://www.vhi.org/industry_reports.asp. ↩︎
  73. National Association of Community Health Centers (NACHC), Virginia Health Center Fact Sheet (April 11, 2014), https://www.nachc.com/client/documents/research/maps/VA14.pdf. ↩︎
  74. NACHC, Virginia Health Center Fact Sheet (2014). ↩︎
  75. Virginia Association of Free Clinics, http://www.vafreeclinics.org/how-we-help.asp. ↩︎
  76. Bureau of Clinician Recruitment and Service, Health Resources and Services Administration (HRSA), U.S. Department of Health & Human Services, HRSA Data Warehouse: Designated Health Professional Shortage Areas Statistics, as of July 29, 2013, http://ersrs.hrsa.gov/reportserver/Pages/ReportViewer.aspx?/HGDW_Reports/BCD_HPSA/BCD_HPSA_SCR50_Smry_HTML&rs:Format=HTML4.0 ↩︎
  77. HRSA, Designated Health Professional Shortage Areas Statistics, as of July 29, 2013. ↩︎
  78. American Association of Nurse Practitioners, State Practice Environment 2013, http://www.aanp.org/legislation-regulation/state-legislation-regulation/state-practice-environment. ↩︎
  79. Virginia Health Care Foundation, http://www.vhcf.org/data/. ↩︎
  80. Virginia Legislative Information System, SJ 47 Mental health; joint subcommittee to study services in the Commonwealth in twenty-first century (March 8, 2014), http://lis.virginia.gov/cgi-bin/legp604.exe?141+sum+SJ47. ↩︎
  81. Virginia Office of the State Inspector General, Virginia Department of Behavioral Health and Developmental Services, Discharge Assistance Program Performance Review (February 2014), http://osig.virginia.gov/media/2475/2014-bhds-005dap.pdf. ↩︎
  82. An example of a new patient-centered Medical home in the state is Virginia Coordinated Care program (VCC) operated by the Virginia Commonwealth University Medical Center. VCC manages the care of about 23,000 low income uninsured people (mostly in the Richmond area) by assigning them to primary care physicians who coordinates their other care needs. VCC recently started a complex care clinic to serve as a patient-centered medical home for VCC patients with chronic conditions and other complex medical needs. Virginia Coordinated Care Program, http://www.vcuhealth.org/vcc. ↩︎

Visualizing Health Policy: Public Opinion At The End of the First Open Enrollment Period

Published: May 20, 2014

This Visualizing Health Policy infographic takes a look at public opinion of the Affordable Care Act at the end of the first enrollment period, including the persistent deep partisan divisions, the sources of people’s impressions, and the favorable views towards many of the ACA’s least well-known provisions. Further, more people want Congress to improve the ACA than to repeal it.

jama_2014april_polling

Visualizing Health Policy is a monthly infographic series produced in partnership with the Journal of the American Medical Association (JAMA). The full-size infographic is freely available on JAMA’s website and is published in the print edition of the journal.

>>View Source Slides

Health Coverage and Care for Youth in the Juvenile Justice System: The Role of Medicaid and CHIP

Authors: Leslie Acoca, Jessica Stephens, and Amanda Van Vleet
Published: May 19, 2014

Girls and boys in the juvenile justice system are a diverse group of young people with often complex health needs. Many are from low-income families of color, have suffered abuse, were involved in the foster care system, and may require comprehensive and ongoing physical, reproductive, mental, and behavioral health services upon discharge from juvenile justice residential facilities. The provision of comprehensive, coordinated physical and mental health services for girls and boys while they are in the juvenile justice system and in their communities and after release is important to their rehabilitation and reintegration into society. Given the low incomes of many of these youth, Medicaid has the potential to play an important role in financing these services.

This brief provides an overview of the health and mental health needs of girls and boys in the juvenile justice system and the role of Medicaid in addressing those needs.  It focuses on the circumstances of those girls and boys who are placed in juvenile justice residential facilities, the discontinuity of Medicaid coverage for those youth, and the options for improving coverage, continuity of care and access to needed services post-discharge, including new opportunities provided by the Affordable Care Act.

News Release

New Survey Documents Women’s Health Care, Coverage and Early Experiences with the Affordable Care Act

Published: May 15, 2014

A comprehensive survey released today by the Kaiser Family Foundation provides a snapshot of women and their health coverage and care during a time of transition as important Affordable Care Act insurance market changes began to take root.   These include many changes that affect women including a prohibition on using gender in setting premiums, as well as broadening access to a more comprehensive range of preventive services benefits without cost sharing.

The Kaiser Women’s Health Survey, conducted from Sept. 19 to Nov. 21, 2013, provides a national overview of women’s health experiences regarding health care coverage, access, and affordability among nonelderly women (ages 18 to 64) in the United States more than a year after the ACA requirements for preventive and contraceptive coverage affecting women took effect and shortly before the coverage expansions in the law took full effect in January 2014.

Key findings include:

  • Among women ages 18 to 64, more than a quarter of women (26%) delayed care in the past year because of cost, compared to 20 percent of men. About one fifth of women also reported skipping recommended tests or treatment (20%), forgoing or skipping prescription medicines (22%), higher rates than men (14% and 12%, respectively).  And 28 percent of women say they had problems paying medical bills, compared to 19 percent of men.
  • While most women (82%) report a recent checkup or well woman visit, 6 in 10 know that insurance plans must now cover check-ups at no out-of-pocket cost, and 57 percent know that mammograms and pap tests are covered without cost sharing. Most women (70%) report discussing diet and nutrition with a provider in the past 3 years, but rates are lower for talking  to a provider about smoking (44%), alcohol or drug use (31%), and mental health (41%).
  • Coverage under a parent’s plan is now the leading way that women under age 26 get their coverage, with 45 percent of women ages 18-25 reporting that they were covered on a parent’s plan as a dependent. According to the survey few women in this age group are aware that private insurers can send documentation to the primary policy holder (often a parent) that details the services they have used, raising privacy concerns for young adults who want their use of health services to be confidential.

The survey also provides a deeper look at reproductive health and other issues affecting women of childbearing age, defined in the survey as those ages 15 to 44. Key findings for this age group include:

  • Nearly one in five (19%) sexually active women ages 15-44 who say they do not want to get pregnant report that they are not using contraceptives. Eighty-six percent of women ages 18 to 44 have heard of emergency contraceptive pills, while 5 percent have used or bought the pills, which became available without a prescription in 2009.
  • Among reproductive age women who used birth control and have private insurance (through an employer or an individual policy), 35 percent say their plan covered the full cost of contraception, while 42 percent report that insurance covered part of the costs and 13 percent say they did not have any coverage for birth control. The ACA required that contraception and other preventive services be covered without cost sharing in most non-grandfathered health plans starting with the first plan or policy year beginning on or after August 1, 2012.
  • Fifty percent of women of reproductive age (ages 15 to 44) say they had a recent conversation with a provider regarding sexual history, 34 percent reporting one about HIV and 23 percent saying they talked to a provider about intimate partner violence.

The survey is the latest in a periodic series begun in 2001. The complete 2013 survey report, including a discussion of methodology, can be viewed online. The findings were to be discussed this morning at a public briefing in the Barbara Jordan Conference Center in the Foundation’s Washington D.C. office. Materials from the briefing, including an archived webcast, will be available online later today.

Methodology

The 2013 Kaiser Women’s Health Survey was conducted from September 19 to November 21 among a nationally representative random digit dial telephone sample of 3,015 women ages 15 to 64 living in the U.S. Telephone interviews conducted by landline and cell phone were carried out in English and Spanish. A shorter companion survey with a nationally representative sample of 700 men ages 18 to 64 was conducted using similar RDD landline and cell phone methodology.  The margin of sampling error is plus or minus 3 percentage points for the full sample of women and plus or minus 4 percentage points for men. For results based on subgroups, the margin of sampling error is higher.

# # #

Women and Health Care in the Early Years of the ACA: Key Findings from the 2013 Kaiser Women’s Health Survey

Authors: Alina Salganicoff, Usha Ranji, Adara Beamesderfer, and Nisha Kurani
Published: May 15, 2014

Executive Summary

The passage of the Affordable Care Act (ACA) in 2010 heralded a new era in health care coverage, with major implications for women’s health and access to care. Provisions such as the mandatory inclusion of maternity care, coverage without cost sharing for preventive services such as contraceptives, and a prohibition on charging women more than men for the same plan were all designed to address gaps and inequities in women’s health insurance. Some of these provisions were implemented shortly after the passage of the ACA, including the expansion of dependent coverage and the preventive services coverage rules. The requirement for mandatory insurance coverage and the expansion in Medicaid eligibility and state-based Marketplaces are just getting underway.

Understanding the law’s myriad impacts on women’s health and access to care will take many years, but it is important to have a baseline with which to compare future outcomes. The Kaiser Family Foundation undertook this survey to provide an initial look into the range of women’s health and care experiences, especially those that are not typically addressed by most surveys nor often analyzed through a gender lens. The Kaiser Family Foundation conducted this nationally representative survey in the fall and early winter of 2013, just before the ACA’s major coverage expansion began. The findings presented in this report examine women’s coverage, access, and affordability to care, as well as their connections to health providers and use of preventive care based on an analysis of a nationally representative sample of 2,907 women ages 18 to 64. In addition, a shorter survey of 700 men ages 18 to 64 was also conducted and key findings are included in the text for the purposes of comparison. To provide the data for the analysis of women’s use of reproductive and sexual health services, this report analyzes the responses of a nationally representative sample of 1,403 women ages 15 to 44.

This report addresses a wide range of topics that are at the heart of women’s health care and changes that women may experience as a result of the ACA. It also highlights differences for uninsured, low-income, and minority women–groups of women that have been historically underserved –which is especially important in light of the characteristics of women in the U.S. today. Nearly one in three women ages 18 to 64 live in households that are below 200% of the federal poverty level (FPL) which was $19,530 for a family of three in 2013. One in three women identify as racial and ethnic minorities (13% Black, 14% Hispanic, and 9% Asian or Other) and half are in their childbearing years. A sizable minority of women also report that their health is fair or poor (15%) and over four in ten have a health condition that requires monitoring and treatment (43%). For these women in particular, access to health care is an essential and ongoing concern. Key findings from the survey include:

Coverage, Access and Affordability

The health coverage expansion will fill a major gap in coverage for women.

In the late fall and early winter of 2013, as the ACA’s coverage expansion kicked into gear, approximately one in five women ages 18-64 were uninsured (18%). Employer-sponsored insurance (ESI) covered the majority of women (57%), with nearly half of that group covered as a dependent either through a spouse or parent. Just 7% of women were covered by individual insurance and about one in ten women (9%) had Medicaid, the nation’s health program for low-income individuals. In the coming years, millions of uninsured women could gain access to coverage that includes a wide range of benefits that are important to their care.

Gaps in coverage are experienced by a disproportionately high share of low-income women and women of color.

For low-income women, the gaps in coverage are considerable, with 4 in 10 reporting that they were uninsured at the end of 2013. Nearly a quarter of Black (22%) and over one-third (36%) of Hispanic women were also uninsured. Eligibility for Medicaid and availability of subsidies in the form of tax credits will help many women gain access to coverage. While many may have enrolled in the state Marketplaces or in Medicaid during the open enrollment period, some of the poorest women do not qualify for assistance because they reside in a state that is not expanding Medicaid or are undocumented immigrants that are explicitly excluded from Medicaid and state Marketplace plans.

Coverage under a parent’s plan is now the leading way that women under age 26 get their coverage, but few are aware that parents may get information about their care.

One of the earliest ACA provisions that took effect in September 2010 was the extension of dependent coverage to young people up to age 26, who had the highest uninsured rate of any age group at the time the law was passed. In 2013, over four in ten (45%) women ages 18 to 25 reported that they were covered on a parent’s plan as a dependent. Because they are adult children, the extension of coverage has raised concerns about their ability to maintain privacy regarding the use of sensitive health services such as reproductive and sexual health care and mental health. The survey finds that less than four in ten young women (37%) are aware that private insurers typically send an explanation of benefits (EOB) documenting use of health care services to primary policy holders, often a parent. Yet, the vast majority (71%) of young women state that it is important to them that their use of health services be confidential.

One in four (26%) women have had to delay or forgo care in the past year due to cost compared to 20% of men. While health costs are a major barrier to care for nearly tw0-thirds (65%) of uninsured women, 16% of women with private insurance and 35% of women with Medicaid also said they delayed or went without care because they could not afford it. Nearly three in ten women have had problems paying medical bills in the past year (28%). Problems are, not surprisingly, more common among uninsured women (52%) and low-income women (44%), who have fewer resources to cover their bills. A substantial share of women with medical debt reported they either used up most of their savings, had difficulty paying for basic necessities, or had to borrow money from friends or relatives to pay for their bills.

Logistical barriers to care beyond coverage and affordability are challenges for many women.

Many women report they can’t find the time (23%) or take time off work (19%) to get their care. Childcare (15%) and transportation problems (9%) also prevent some women from getting to care, and are more frequently reported among low-income women (19% and 18%, respectively). One-quarter of all women, regardless of income, reported that lack of time to go to the doctor was a reason they went without care. While the ACA and other reforms have the potential to help offset coverage gaps and assist with the burdens of costs, the survey finds that factors such as work place flexibility, sick leave, and child care also have implications for women’s access to care.

Connections to Care

Coverage and delivery system reforms could result in more women having a stronger connection to health providers, but new models of care need to be gendersensitive.

The vast majority of women say they have a place to go when they need care (86%), have a doctor that they see regularly (81%) and have seen a provider in the past two years (91%). On average, a higher share of women than men report that they have an existing connection to a health care provider or place. Among women, however, those who are uninsured have considerably weaker connections to the health care system, reporting lower rates on all of these indicators. About seven in ten uninsured women (69%) have a regular site of care, but only half (50%) have a regular clinician, and three-quarters (75%) have had a recent provider visit. Women who are younger, Hispanic, low-income or uninsured are also more likely to lack these important connections to care. Women’s care can also be complex because some see Obstetrician/Gynecologists for their reproductive needs and different providers for their other health needs. The ACA includes incentives to improve primary care and develop new models for patient centered medical homes. Given the importance of sexual and reproductive health for women, incorporating these sensitive services into new models of care will be a key consideration.

While most women get their care in a private doctor’s office, community health centers and family planning clinics are sources of care for a sizable minority of women covered by Medicaid or without insurance.

Among women who identify a place where they usually seek care when they are sick or need medical advice, almost three in four (73%) go to a doctor’s office or a health maintenance organization setting (HMO). While eight in ten women with private insurance (82%) go to a doctor’s office for routine care, this share drops to two-thirds of women with Medicaid (66%) and less than half of uninsured women (45%). Medicaid beneficiaries (23%) and uninsured women (28%) have much higher reliance on clinics than privately-insured women (7%). Nearly one in six uninsured women (16%) say they get their routine care from an emergency room. While it is too soon to tell how safety net providers will fare as more people gain coverage and shift to private or Medicaid plans, many women will still rely on these providers for their care.

Preventive Services

The ACA rules that require private plans to cover preventive services without cost sharing may help boost use of preventive services, but awareness of the requirement and use of services are still lagging.

The ACA included new requirements for private plans to cover a wide range of recommended preventive screening and counseling services without cost sharing. Public awareness of these insurance reforms, however, is far from universal. Six in ten women know that plans must now cover well-woman visits and 57% know that mammograms and pap tests are covered without cost sharing. While most women report a recent checkup or well woman visit (82%), rates of specific preventive counseling and screenings are uneven. Most women report that they have discussed diet and nutrition (70%) with a provider in the past 3 years, but fewer than half of women have recently talked to a provider about smoking (44%), alcohol or drug use (31%), and mental health (41%). A deeper focus on the content of well woman visits, along with patient education, may be needed to broaden use of clinical preventive services for women.

Women enrolled in Medicaid use preventive care at rates that are similar or higher than women with private insurance.

Women enrolled in Medicaid, despite their lower incomes and constrained provider options, obtain preventive screening and counseling services at rates that are on par with women with private coverage. The ACA includes a small financial incentive for state Medicaid programs to provide coverage of all services recommended by the USPSTF without cost-sharing. Efforts to expand no-cost coverage under Medicaid to these recommended evidence-based services could further access to screening and counseling services for the millions of low-income women served by the program.

Reproductive and Sexual Health Services

There is considerable room for improvement in the rates of counseling on reproductive and sexual health topics.

Despite the high rates of sexually transmitted infections (STIs) and unintended pregnancy, counseling on these topics is not routine among women of reproductive age (15 to 44 years). While most reproductive age women have had recent conversations with a provider about contraception (60%), the rate is much lower regarding sexual history (50%), HIV (34%), other STIs (30%), and intimate partner violence (IPV) (23%). Furthermore, many women are incorrectly under the impression that HIV and STI tests are routinely included as part of their gynecological exams. While four in ten reproductive age women report that they have had a test for HIV (44%) or other STIs (40%) in the past two years—about half of these women mistakenly assumed this test was a routine part of an examination. Therefore, the actual screening rates are likely lower than the share of women who report being tested. This assumption clearly has implications for the treatment and the prevention of transmission of these infectious diseases.

A substantial share of sexually active women is not using any contraception and is at high risk for unintended pregnancy.

While the effectiveness of FDA approved contraceptives in preventing unintended pregnancy is widely known, an estimated one in five (19%) sexually active women ages 15 to 44 who do not want to get pregnant are at high risk for unintended pregnancy because they and their partner are not using contraceptives and have not had a sterilization procedure. Among women of reproductive age who have had sex in the past year, about half (51%) report that they or their partners used at least one contraceptive method, one in ten (10%) are pregnant or trying to conceive, and one in five (20%) women report that they or their partner have had a sterilization procedure or cannot become pregnant. Among sexually active women who have used contraceptives in the past year, nearly two-thirds (63%) report using male condoms and almost half have used birth control pills (48%).

A sizable minority of women using contraceptives now rely on long acting reversible contraceptives (LARCs).

LARCs, which include IUDs, sub-dermal implants and injections, are among the most effective methods of birth control. While condoms and oral contraceptives are the most common forms of birth control that women use, about one-third of women who have been sexually active in the past year and using a contraceptive say they used a LARC. About one in five (19%) say they have an intrauterine device (IUD), 6% report using an implant, and 7% report using hormonal injections as their contraceptive. LARCs, particularly IUDs, can have significant upfront costs and require provider insertion and follow up care. The ACA contraceptive coverage provision may result in the increased adoption of these highly effective approaches by eliminating potential cost barriers associated with these contraceptives.

While awareness of emergency contraceptive pills is quite high, a small fraction of women say they have actually used or purchased them.

Emergency contraceptive (EC) pills can be taken after unprotected sex or as a backup method to prevent unintended pregnancy in cases of contraceptive failure. In 2009, the EC pills, Plan B®, became available without a prescription and in 2010, a new prescription formulation (ella®), was approved by the FDA. As with other contraceptives, private plans are required to cover prescriptions for EC without cost sharing under the ACA’s preventive services policy. It has now been 15 years since EC pills were approved by the FDA and 86% of women ages 15 to 44 report that they have heard of them. However, a small percentage of women (5%) say they have used or bought EC pills, ranging from 12% of women ages 19 to 24 to 2% of both teens ages 15 to 18 and women ages 35 to 44.

One in three women with private insurance say their insurance covered the full cost of contraception.

The ACA includes provisions that require new plans to provide no-cost coverage for prescription FDA-approved contraceptive services and supplies for women (including insertion, removal and follow up care). While this provision only applies to “new” or “non-grandfathered” plans, over time it is anticipated that most women with private coverage will be enrolled in plans that offer this coverage. Nearly one and half years after the ACA contraceptive coverage rule took effect, insurance covered the full cost for one-third (35%) of women with private insurance. Another 41% reported that insurance covered part of the costs and about one in ten (13%) women with private insurance reported they did not have any coverage for birth control.

Family planning providers and community health centers play a major role in providing contraceptive care for uninsured women and women of color.

Most sexually active women who use birth control state that they receive contraceptives at a doctor’s office or HMO (61%) and 16% obtain contraceptive care at a clinic-based setting. Established to provide care regardless of income, essential community providers finance contraceptive care largely through Title X (the federal planning program) and Medicaid. These clinics provide contraceptive care to substantial shares of uninsured (43%), Hispanic (37%), and Black women (23%). As care systems increasingly shift to private managed care plans, it will be important to monitor how care changes for the women who have been relying on these providers for their reproductive and sexual health care. In addition, because some low-income women will either not qualify for coverage or may not be able to afford to enroll in plans, many will still be reliant on these safety-net providers for their sexual and reproductive health care.

Introduction

For women, health care has long been a priority issue for reasons stemming from their own health needs and their central roles in managing their families’ health. As such, many of the reforms in the Affordable Care Act (ACA) were developed to address the perceived shortcomings that were part of health insurance design before the passage of the law. The ACA includes a ban on gender rating, a policy that permitted plans in the individual insurance market to charge women more than men for the same coverage. The law eliminates pre-existing condition exclusions that affected women who were pregnant or victims of intimate partner violence or who had chronic medical conditions. It provides coverage without cost sharing for a wide range of recommended preventive services. These preventive benefits ultimately required coverage of contraceptives as well as seven other services specifically for women including well woman visits, screening for intimate partner violence, and breastfeeding support.

The impact of the law on women’s access to coverage and care will take many years to assess. Will it make coverage and care more affordable for women? Will access be improved? Will the new coverage requirements improve the use of preventive services? How will contraceptive coverage affect the contraceptive choices that women make and where they get that care? And ultimately, will the changes in coverage improve health and provide stability of coverage for women? These questions will take time and will be difficult to answer.

While it is too early even to begin to answer these and other questions about the ACA, this survey was conducted to get a window into women’s health care and coverage experiences at the early stage of the ACA’s implementation. This survey builds on prior Kaiser Family Foundation surveys on women’s health, conducted in 2001, 2004, and most recently in 2008 in the early days of the Great Recession. The survey was conducted in the fall and early winter of 2013 and reports on experiences related to health care coverage, access, affordability, providers, and preventive care among a nationally representative sample of women ages 18 to 64. It also reports on women’s access to reproductive and sexual health services among a nationally representative sample of women ages 15 to 44. While most of the report presents findings for women ages 18 to 64, a shorter survey of men ages 18 to 64 was also conducted and key findings are included in the text for the purposes of comparison. All women and men were interviewed by telephone (landline and cell phone).

This report provides new data on women’s health insurance coverage, their access to care and use of health care services,  as well as health care affordability. This survey addresses topics that affect women across their lifespans, including the importance of the ACA for women’s reproductive and sexual health care and establishes a useful baseline to help us understand and measure changes in women’s health care experiences as health reform implementation moves forward over the coming years. We hope that these data will provide a useful lens through which to begin to gauge the impact of the ACA on women’s health and their care.

Profile of Demographic and Health Characteristics of Women in the U.S.

Health care is shaped by and intertwined with many aspects of women’s lives. It is, therefore important to assess the demographic characteristics of the survey populations, non-elderly adult women ages 18 to 64 as well as reproductive age women, 15 to 44 years old.

Nonelderly adult women ages 18 to 64

Not surprisingly, the nation’s women are a diverse population in many respects. Fifteen percent of women are in their early adult years, ages 18 to 25. Another 38% are ages 26 to 44 and almost half (47%) are in their middle years, ages 45 to 64. Almost two-thirds of women are White, non-Hispanic (referred to as White throughout this report), 13% are Black, non-Hispanic (referred to as Black throughout this report), 14% are Hispanic, and 9% are of another racial or ethnic group, including Asian, Pacific Islander, and other groups

1

. Throughout this report, data are presented for White, Black, and Hispanic women. Data by other racial/ethnic groups are not presented because the sample sizes for these subgroups were not sufficient to provide reliable national estimates. The authors recognize that women of other races and ethnicities have important health needs and distinct health concerns; however, we were not able to report on these in this report. Half of women ages 18 to 64 are married (50%), nearly one in ten live with a partner (8%), 17% are widowed, divorced, or separated, and a quarter of women never married (25%).

Many women face challenging economic circumstances

2

. Fifteen percent live below the poverty line, which was just under $20,000 for a family of three in 2013, when this survey was conducted. Another 16% of women have incomes between 100 and 199% of poverty. Together, 31% of women ages 18 to 64 have incomes under 200% of the federal poverty level, referred to as “low income,” throughout this report. Almost six in ten women (58%) have incomes above this level and data are not available for 10% of women. About a third  (36%) have a high school degree or less education. Most women work outside the home, either full-time (45%) or part-time (15%). About a third are not employed for pay (19%), students (8%), or retired (6%).

Reproductive age women ages 15 to 44

The survey also includes a sample of teen girls ages 15 to 17 as part of the reproductive age group. Although most females ages 15 to 17 are not yet sexually active, many are dating and reproductive and sexual health services are an important component of health care for this age group.

3

 and

Throughout this report, data are presented to highlight the range of experiences that different subpopulations of women face when they use health care, particularly the challenges facing those who are at risk for poor access to care, those who are low-income, and women of color. These are the women who are most likely to benefit from the insurance and benefit reforms that are part of the ACA.

Women’s health status In addition to diversity in demographic characteristics, women have a wide range of health needs, which set the framework for the care they need and seek. How women assess their health status is an important gauge of their overall health and medical care needs. Women who rate their health as “fair” or “poor” typically need and use more health care services than women reporting better health (“excellent,” “very good” or “good”). In addition to the global measure of self-reported health status, the rates of chronic conditions and the impact of those conditions on women’s ability to lead productive lives are important measures of women’s health status and provide a window into their health needs over their lifetimes.

Overall, 15% of non-elderly adult women ages 18 to 64 rate their health as fair or poor (Table 1). This rate increases with age, from 12% of adult women in their reproductive years (ages 18 to 44) to nearly one in five women (19%) ages 45 to 64. Among Hispanic women, 28% report fair or poor health, also 12% of White and 16% of Black women. Fourteen percent of women report that they have a disability or chronic condition that  limits their daily activities. This is the case among 8% of women ages 18 to 44, but is reported by more than twice as many middle-aged and older women ages 45 to 64 (21%).

Table 1: Health problems reported by women, by age and race/ethnicity
All WomenAge GroupRace/Ethnicity
Share of women reporting:Ages 18-44Ages 45-64WhiteBlackHispanic
Fair/poor health15%12%19%12%16%28%*
Have disability, handicap, or chronic disease that limits activity14%8%21%*15%15%14%
Have ongoing condition that requires regular monitoring, care, or medication43%32%55%*48%38%*35%*
NOTE: Among women ages 18-64. *Indicates a statistically significant difference from Ages 18-44, White, p<.05.SOURCE: Kaiser Family Foundation, 2013 Kaiser Women’s Health Survey.

A sizable minority of women (43%) say that they have an ongoing condition that requires regular monitoring, treatment, or medication. This is reported by about one-third of women ages 18 to 44 (32%) and rises to over half of older women (55%). In contrast to self-reported health status, White women (48%) report ongoing health conditions that require monitoring, care or medication at higher rates than both Black (38%) and Hispanic women (35%). This difference could be attributable, in part, to poorer access to care experienced by women of color. Women with more limited access may be more likely to have undiagnosed conditions that require care, but they are unaware of their presence.

The difference in health status between women of different poverty levels is also notable and of particular relevance, given the ACA’s focus on health care costs and spending in addition to coverage. Low-income women report higher rates of health problems than more affluent women

5

. One in four low-income women rate their health as fair or poor, which is over twice the rate of higher-income women (9%). Similarly, the rate of women reporting an activity-limiting disability or chronic disease is twice as high among low-income women (21%) than their higher income counterparts (10%). The lack of differences in the share reporting that they have a medical condition that requires ongoing care could be attributable to the poorer health care access experienced by many low-income women.

Report: Methods

The 2013 Kaiser Women’s Health Survey obtained land line and cellular telephone interviews with a nationally representative sample of 3,015 women ages 15 to 64 living in the United States. The survey was conducted by Princeton Survey Research Associates International (PSRAI). Interviews were done in English and Spanish by Princeton Data Source LLC from September 19 to November 21, 2013. A combination of landline and cellular random digit dial (RDD) samples was used to represent all women ages 15 to 64 in the United States who have access to either a landline or cellular telephone. Both samples were provided by Survey Sampling International, LLC (SSI) according to PSRAI specifications.

For the landline sample, interviewers first asked to speak with the youngest female adult ages 18 to 64 who was at home. Once an eligible adult respondent was on the phone, interviewers determined if any eligible teens ages 15 to 17 lived in the household. If the household contained both an eligible adult and an eligible teen, one was chosen to interview, but priority was given to the teen interviews in recognition of the challenges of obtaining those interviews. Cell phone interviews started by first determining whether the person who answered the phone was eligible for the adult interview. If not, the interview was coded as ineligible and terminated. If the cell phone respondent was eligible for the adult interview, it was then determined whether or not they were the parent or guardian of any girls ages 15 to 17. Parental consent was obtained for all teen interviews and households where a teen interview was completed were sent $50 for their participation.

The samples were disproportionately-stratified to reach more low-income women and to increase the incidence of African American and Latina respondents. The data were weighted in the analysis to remove the disproportion from the selection rates by stratum and to make the data fully representative of women ages 15 to 64 living in the United States, as well as to compensate for patterns of nonresponse that might bias results. The weighting was accomplished in multiple stages to account for [a] the disproportionately-stratified samples, [b] the overlapping landline and cell sample frames, [c] household composition and [d] differential non-response associated with sample demographics.

A shorter companion survey of men was conducted via telephone (landline and cell phone) interviews with a nationally representative sample of 700 men ages 18 to 64 living in the United States to examine differences between women and men on a range of measures. Limited amounts of data on men are presented in this report and more detailed findings on men will be the subject of another forthcoming paper.

The margin of sampling error for the complete set of weighted data and for age subgroups of women as well as the full sample of men are shown in Table 2. When possible, statistically significant at p<.05, differences are noted in the tables and graphics included in the report.

Table 2: Survey sample size and margin of error
Sample SizeMargin of Error
Total sample of women ages 15-643,0152.9 percentage points
Women ages 18-642,9073.0 percentage points
Women ages 15-441,4034.1 percentage points
Total sample of men 18-647004.3 percentage points

Report: Coverage, Access, And Affordability

Health insurance coverage is a critical factor in making health care accessible and affordable to women. Women with health coverage are more likely to obtain needed preventive, primary, and specialty care services, and have better access to new advances in women’s health. The primary goal of the ACA was to expand coverage to millions of uninsured across the country and to make reforms so that coverage is stable, affordable, and comprehensive. The law requires that most individuals have health insurance coverage in 2014 or pay a tax penalty. To facilitate access to coverage, the law includes a major expansion of Medicaid to many low-income individuals and establishes new Marketplaces in each state where most uninsured individuals who do not qualify for Medicaid can purchase a private insurance policy. While the law’s primary focus is on expanding coverage and reducing the number of uninsured, it also makes a number of other changes designed to make care more affordable and accessible.

Coverage

The ACA extends coverage to uninsured individuals through a combination of changes in private and public coverage. The ACA was designed to expand eligibility for Medicaid to the poorest individuals (less than 138% of the federal poverty level) and to make to make coverage more affordable and available to individuals with incomes between 100% and 400% of poverty by establishing state-based Marketplaces where individual can obtain coverage and receive assistance with premium costs through a graduated system of tax credit subsidies. However, because of a 2012 Supreme Court ruling, the Medicaid expansion is now optional for states; about half have decided not to expand their programs at this time. In the states that have not expanded Medicaid, this choice has had the consequence of limiting access to affordable coverage for the poorest uninsured residents and lowering the number of people who qualify for coverage under the program.

As the major part of the ACA’s coverage expansion begins, almost one in five women are uninsured.

Most women (82%) have health coverage, but nearly one in five women (18%) between the ages of 18 and 64 are uninsured

1

. Men, however, are uninsured at a higher rate (23%) than women. Employer-sponsored insurance (ESI) covers the majority of women (57%), with nearly half of that group covered as a dependent either through a spouse or parent. One in four women are covered as dependents (26%) and can be more vulnerable to losing their insurance should they become widowed or divorced, their spouse or parent loses a job, or if their spouse’s or parent’s employer drops family coverage. Just 7% of women are covered by private individually purchased insurance, with that proportion expected to change, as many turn to state-based marketplaces to obtain their coverage under the ACA. Currently, Medicaid, the nation’s coverage program for low-income individuals, covers about one in ten women (9%). Before the ACA was enacted, eligibility for Medicaid in most states was limited to women with dependent children, those who were pregnant and those with a disability. The ACA’s coverage expansion was designed to broaden Medicaid to many more low-income individuals and offer a new coverage pathway to poor adults without children who were largely ineligible before the law was passed. Although not all states are expanding Medicaid, the program’s enrollment is expected to grow significantly in the coming years.

The ACA also included a major reform that allows adult children to stay on their parents’ health insurance policies up to the age of 26. This policy went into effect in 2010 and in 2013, many young adults were covered under their parents’ employer sponsored plans. While the overall rate of ESI coverage is similar between women of different age groups, 45% of women ages 18 to 25 are covered through a parent’s policy, accounting for the single largest segment of coverage in this age group

2

. In prior years, this age group had the lowest coverage rates. Among women in older age groups, most women with ESI obtain coverage through their own job or through a spouse’s job. Medicaid also plays a prominent role for women under age 45, insuring 12% in that age group, a rate that is over twice the rate of middle aged women ages 45 to 64.

Lack of coverage is a problem facing a significant share of women of color.

Minority women have higher rates of uninsurance and lower rates of employer-sponsored insurance compared to White women

3

. While two-thirds of White women (66%) have insurance through an employer, either their own or as a dependent, this is the case for less than half of Black (47%) and Hispanic women (38%). These differences in part reflect the fact that minority women and their spouses are more likely to work in low-wage jobs that do not provide access to employer-sponsored insurance and have fewer financial resources to purchase coverage on their own. The rate of Medicaid coverage among Black (17%) and Hispanic women (14%) is double that of White women (7%), reflecting the lower average incomes and concentration of poverty among racial and ethnic minority women who may be more likely to qualify for the program. The highest uninsured rate is among Hispanic women (36%), followed by Black women (22%), compared to 13% of White women. However not all women have access to Medicaid or federal tax credit subsidies under the ACA. Most women who are recent immigrants (who on average have high rates of poverty) do not qualify for Medicaid for at least five years after entering the U.S. legally, as a matter of federal law. Undocumented individuals, however, do not have any avenue to coverage, as they are barred both from Medicaid eligibility and from purchasing a plan or receiving subsidies through the state-based Marketplaces.

Low-income women have much lower coverage rates, and even among those who are currently covered, some have been without insurance earlier in the year.

Four in ten low-income women (40%) are uninsured currently, compared to 5% among higher-income women

4

. Not surprisingly, low-income women also have much higher rates of Medicaid coverage (21%) than their higher income counterparts (1%) due to Medicaid eligibility rules. They also have much lower rates of employer-sponsored insurance (22% vs. 80% respectively) than higher-income women largely due to the fact that they are more likely to work part-time or part-year, work in a low wage job that lacks health benefits, or live in a household without an attachment to the workplace.

Even among women who have insurance, coverage is not always stable. Women can have spells of being uninsured as a result of job loss or change, premium prices becoming unaffordable, or in the case of dependent coverage, a spouse’s job loss, or divorce or widowhood. While 82% of women report they had insurance at the time of the survey, a small share of that group report that there was a period in the prior when they were without insurance, which means that 77% were insured for the full year. Spells without insurance are more common among low-income women who have lower coverage rates to begin with. Only 53% of low-income women had coverage for a full year, compared to 90% of higher income women.

Access Challenges

While coverage plays a large role in accessing health care services, there are numerous factors that affect whether or not a woman actually obtains health care. These include health care costs, provider availability and capacity, as well as practical logistical issues such as transportation and finding time to make it to medical appointments. Some of these factors can be ameliorated by reforms in the ACA, such as the caps on out-of-pocket costs and the coverage expansions, but others are systemic such as workplace benefits and flexibility, child care, transportation, and the availability of health care in communities where low-income women reside.

Out-of-pocket health costs are barriers to care for women and men, but are more common among women.

A higher share of women forgo health care needs due to cost compared to men. Insurance premiums, co-payments, deductibles, and services that are not covered by insurance can be expensive, potentially limiting access to care or jeopardizing a woman’s and her family’s financial health. While women and men both feel the impact of health costs, they are burdensome for a higher share of women, who on average earn lower wages, have fewer financial assets, accumulate less wealth, and have higher rates of poverty. This is compounded by women’s greater health care needs, including reproductive health care services, and higher expenses throughout their lifespans.

A sizable share of women report that health care costs impede their access to services, force them to make tradeoffs, or result in unpaid medical bills

5

. Across the board, these problems are more common among women than men. One in four (26%) women and one in five men (20%) have had to delay or forego care in the past year due to cost. Because of costs, approximately one in five women have also postponed preventive care (20%), skipped a recommended test or treatment (20%), or made medication tradeoffs such as not filling a prescription or cutting dosages (22%). About three in ten women report that they have had problems paying medical bills (28%) in the prior year or are currently paying off medical bills (32%), compared to about one in five men who report problems paying bills (19%) or who are currently paying them off (22%).

Costs are particularly burdensome for uninsured and low-income women.

For uninsured women, health costs can be a considerable barrier to care

6

. Compared to women with private or public coverage, higher shares of uninsured women report that cost-related barriers to care. Almost two-thirds (65%) of uninsured women went without or delayed care because of the costs. Half postponed preventive services (52%) and half skipped a recommended medical test or treatment (50%). Four in ten uninsured women either didn’t fill a prescription or skipped or cut pills as a result of costs (42%) and about a quarter experienced problems obtaining mental health care (23%). However, it is important to recognize that even some women with coverage also experience affordability challenges that lower their access to health care. Sixteen percent of women with private insurance delayed or went without care because they could not afford it and many experienced other cost barriers as well. Although in some states Medicaid charges very nominal cost sharing amounts, this can still be an obstacle since women enrolled in the program have very low incomes by definition. One-third (35%) of women with Medicaid report postponing or going without care due to cost and many encountered other barriers too. One-quarter (25%) report that they made tradeoffs related to prescription drugs, which could be attributed to state policies that permit cost sharing or place caps on the number of prescriptions covered by their state Medicaid program.

Table 3: Cost barriers to health care for women, by race/ethnicity  and poverty level
All WomenRace/EthnicityPoverty Level
Share of women reporting they:WhiteBlackHispanicLess than 200% FPL200% FPL or greater
Put off or postponed preventive health services due to cost20%18%23%23%35%*13%
Skipped a recommended medical test or treatment due to cost20%19%25%21%34%*14%
NOTE: Among women ages 18-64 reporting actions within past 12 months. *Indicates a statistically significant difference from White, 200% FPL or greater, p<.05.SOURCE: Kaiser Family Foundation, 2013 Kaiser Women’s Health Survey.

Not surprisingly, low-income women report cost-related barriers at significantly higher rates than their higher income counterparts. One-third of low-income women report that cost was a reason they postponed preventive services (35%) or skipped medical tests and treatments (34%), a rate that was over twice as high among women with higher incomes (Table 3).

Costs and affordability are not the only barriers to health care for women. Lack of time and flexibility with work can pose a challenge in getting care for a sizable fraction of women. One in four women report that they did not obtain care they needed because they didn’t have time (23%) and one in five delayed or went without care because could not take time off work (19%). These barriers affect women of all socio-economic statuses to different extents

7

. However, childcare and transportation problems are much more frequently reported among low-income women. Among women with children, one in ten (11%) with higher incomes report they delayed or couldn’t obtain needed care because they had problems getting child care, but the rate is almost double among low-income women (19%). For many women, getting to a doctor can be a challenge, but nearly one in five low-income women cited transportation problems as a reason for going without care (18%).

Impact of Medical Bills

Many women and their family members face problems paying medical bills for a variety of reasons. While this problem is greater for women who are uninsured, women with Medicaid and with private insurance also have difficulties covering their out-of pocket medical costs. Medical bills can easily pile up given high cost sharing, charges associated with out of network use, coverage limits or exclusions, or high deductibles for women with insurance. Uninsured women are often charged “full price,” a higher amount than the negotiated rate insurance plans pay for medical services, and do not have insurance to pay any of the costs of their care. Some women incur significant out-of-pocket medical expenses because of an unexpected health event such as a pregnancy, illness, or injury. These events may also limit a woman’s ability to continue working and result in lost income, further limiting her ability to pay medical bills. Medical debt can have serious financial consequences. Prior research has found that it is the leading reason for personal bankruptcy, and can cause women to exhaust their savings, make tradeoffs with other needed expenses, or compromise their credit standing.1  As more women gain coverage under the ACA, this should help alleviate the impact of medical bills but for some women, there could still be considerable costs associated with care, even among those gaining coverage.

Problems paying medical bills are reported by a sizable minority of women.

Approximately three in ten women have had problems paying medical bills in the past year (28%) compared to 19% of men. Nearly a third of women say they currently have medical bills that are unpaid or are in the process of paying them off (32%), also at a rate that is higher than for men (22%). Not surprisingly, uninsured women report problems paying medical bills in the prior year (52%) and having current outstanding bills (52%) at twice the rate of women with private insurance (21% and 26% respectively) (Table 4). This is however still a problem for a significant fraction of women with insurance. About one-third of women covered by Medicaid, who have very low incomes to use to pay off medical debt, also report having problems (37%) with medical bills or are currently paying them off (36%). These problems are also more common among younger women, who also tend to have lower earnings.

Table 4: Rates of unpaid medical bills, by age group, insurance status, and poverty level
All WomenAge GroupInsurance StatusPoverty Level
Share of women reporting:Ages 18-44Ages 45-64Private insuranceMedicaidUninsuredLess than 200% FPL200% FPL or greater
They or family member had trouble paying medical bills in past 12 months28%31%26%21%37%*52%*44%*21%
They currently have unpaid medical bills or bills currently being paid off32%35%28%*26%36%52%*46%*25%
NOTE: Among women ages 18-64. *Indicates a statistically significant difference from Ages 18-44, Private insurance, 200% FPL or greater, p<.05.SOURCE: Kaiser Family Foundation, 2013 Kaiser Women’s Health Survey.

Medical bills have serious consequences for women’s finances and can force women to make difficult tradeoffs.

Medical bills have tangible consequences for other areas of women’s financial security. Among women reporting they had problems paying medical bills in the prior year, more than half report that they used up most of their savings (56%) or were contacted by a collection agency (55%) as a result of those bills. Many women also say they have had to borrow money from family or friends (50%), and or faced difficulties in paying for basic necessities such as food and electricity (45%) because of their medical bills. Not surprisingly, higher shares of low-income women face these difficult tradeoffs attributable to medical debt

8

.


Report: Connections To Health Providers

Women have a broad range of health needs that evolve over the course of their lives. In their younger years, health concerns related to reproductive and sexual health are priorities. As they age, management of chronic health problems takes on a larger role. Women’s health needs and connections to providers are major factors in how they use health care. The ACA includes a number of measures that affect the delivery of care, such as incentives to increase the supply of primary care providers, who are often a woman’s main connection to the larger health system. However, in recent years, there has been much concern that the supply of primary care providers is already insufficient and that this problem will be exacerbated by the health care demands of the newly insured. The ACA also prioritizes the development and expansion of health care delivery models, such as medical homes and accountable care organizations, which include financial incentives for providers to work in partnerships. The goal is to provide a strong linkage to a primary care provider and integrate the wide array of clinicians that women may turn to for health care. The expectation is that this will result in better coordination and continuity of care, as well as enhanced access to the full range of services women may need.

Usual Sources of Care

Having a usual site of care and a doctor are markers of women’s access to care and are associated with higher use of recommended preventive care and screening services. Having a regular place or provider helps with care coordination and can promote access and continuity. There is increased attention in the ACA to the concept of a “medical home.” In the case of women, this would be a health care setting where women’s health needs can be addressed and coordinated in a way that can promote the quality of care and reduce duplication in care. This is especially important for women, who are more likely than men to rely on at least two providers for their routine care.

Most women have a place that they go for routine care, but it is less common among young, Hispanic, low-income and uninsured women to have a usual source of care.

Most women (86%) report they have a place to go for care when they are sick  or need advice about their health

1

. This rate is significantly higher than for men (72%). Among women, however, the rate is lowest among younger women, with 75% of women ages 18 to 25 and 81% of women 26 to 34 reporting they have a usual place to get their care, significantly lower than the rates for women who are older. Fewer Hispanic women (75%), low-income (77%) and uninsured women (69%) report they have a routine place to get their care.

The vast majority of women also report that they have a specific clinician (doctor or other health provider) that they see for their routine care. Overall, more than eight in ten women report that they have a provider (81%) they use when they are sick or need routine care, compared to 68% of men. The rate is similar between privately insured women (89%) and those covered by Medicaid (85%)

2

. For uninsured women, however, connections with individual providers are the most tenuous. While about two-thirds (69%) say they have a place they get their care, only half report that they have a specific clinician that they see for routine care (50%).

Health care settings

Most women get their routine care from doctor’s offices, but one in ten rely on clinic-based settings.

Among women who identify a routine setting, doctor’s offices and HMOs are the most common site reported

3

. Almost three in four women (73%) report that this is where they seek care. About one in ten women (13%) rely on a clinic setting and 3% report an emergency room as their routine source of care. A small fraction of women report that they rely on school based clinics or urgent care centers for their routine care. Women who use urgent centers and emergency rooms may be most at risk for receiving expensive, fragmented, and discontinuous care.

A sizable minority of women covered by Medicaid or who are uninsured rely on clinics for their care. For one in six uninsured women, emergency departments serve as their routine source of care.

Differences in the types of settings that women with various types of insurance coverage rely on are notable

4

. This variation reflects the networks of providers available to women through their plans and the long-standing role that safety net providers have filled in serving uninsured and low-income patients. While eight in ten women with private insurance (82%) go to a doctor’s office for routine care, this share drops to two-thirds of women with Medicaid coverage (66%) and less than half of uninsured women (45%). There have been historical challenges with physician participation in the Medicaid program, which is due in part to low provider reimbursement rates under the program. Medicaid beneficiaries (23%) an d uninsured women (28%) have much higher use of clinics than privately-insured women (7%). Community health centers and public clinics were established to help care for low-income and underserved populations and play a major role serving these women. Of particular concern though, is that 16% of uninsured women say they usually seek care when they are sick or need medical advice in an emergency room, a rate considerably higher than their counterparts with Medicaid (3%) or private coverage (1%). As more women gain coverage under the ACA, they may also have better access to primary care and it is hoped that reliance on emergency departments for non-urgent care will fall. It is also not clear at this point, however, whether the provider networks under plans offered by state Marketplaces will include traditional safety-net providers, such as community health centers and family planning clinics.

Over four in ten women (43%) report they see one provider regularly and one-third of women (37%) say they have multiple providers to address their basic health needs (compared to 18% of men). Family practitioners and internists are the most common provider types, and among those with multiple providers, Obstetrician-Gynecologists (Ob/Gyns) are the most commonly identified second provider. This is not surprising given women’s reproductive and sexual health needs. Almost one in five women (18%) do not have a regular provider of any type

5

. 

Most women have had a recent health provider visit in the past two years, but uninsured women have the lowest rates.

Nine in ten adult women (91%) have seen a health care provider in the past two years compared to 75% of men. Hispanic women (84%) have a significantly lower rate than Black (91%) or White (93%) women of having a provider visit in the past two years. The largest difference is between women who are uninsured (75%), who have a significantly lower rate than women with private insurance or Medicaid

6

. Designing a medical home for women is complicated by the traditional division of care that many women experience, with reliance on Ob/Gyns for reproductive care as well as primary care providers for other types of care. Among women with more complex and multiple medical conditions, similar challenges will arise. In designing programs and systems that encourage stable and comprehensive medical homes, the distinct needs of women are important  considerations.

Most women use at least one prescription medication on an ongoing basis, and nearly one in ten take six or more medications on a regular basis.

Another important health access issue relates to women’s use of prescription drugs. Over half of women (56%) take at least one prescription medicine on a regular basis compared to just over one-third of men (37%). Three in ten women say they take one or two prescription medications (31%), while nearly one in ten women (9%) report taking at least six different medicines on a regular basis. Use of prescription medications is driven in part by health needs as well as access to care. Use rises with age, partly due to the higher rates of chronic conditions among older women. Six in ten uninsured women report that they do not use a prescription medicine on a regular basis, compared to about four in ten women with private insurance (40%) and Medicaid (42%) (Table 5). This may be in part attributable to poorer access to care, undiagnosed conditions that could be managed with medication, and poorer ability to pay for medications since they do not have insurance. Almost one in five women covered by Medicaid (19%) take at least 6 medications on an ongoing basis, compared to 6% of women with private insurance. This difference may be explained by the poorer health status of women enrolled in Medicaid. Women with Medicaid coverage are disproportionately poor and some may qualify on the basis of their disability as well as their poverty status. Under the ACA, prescription medicines are one of the Essential Health Benefits (EHBs) that all new plans must now cover, but specific medicines and cost sharing requirements vary between plans.

Table 5: Prescription drug use by women, by age, race/ethnicity and insurance status
All WomenAge GroupRace/EthnicityInsurance Status
Share of women reporting:Ages 18-44Ages 45-64WhiteBlackHispanicPrivateMedicaidUninsured
No Rx Use44%50%37%*39%45%60%*40%42%61%*
1-2 Medicines31%36%25%*33%28%27%36%20%*22%*
3-5 Medicines16%9%23%*18%16%8%*17%19%8%*
6+ Medicines9%4%15%*10%10%5%6%19%*7%
NOTE: Among women ages 18-64. *Indicates a statistically significant difference from ages 18-44, White, Private insurance, p<05.SOURCE: Kaiser Family Foundation, 2013 Kaiser Women’s Health Survey.

Report: Preventive Services

Clinical preventive care helps identify health problems earlier, allowing conditions to be treated or managed more effectively before they become more serious. The ACA prioritizes and promotes access to clinical preventive services by requiring that new private plans cover recommended clinical preventive services without cost sharing. The specific services that new plans must include are the ones that are recommended by:2 

  • the US Preventive Services Task Force (USPSTF), an independent body of clinicians and scientists that reviews the evidence of preventive health care services and develops recommendations for primary care providers and health care systems; services with grade A or B are covered under the ACA policy;3 
  • the Advisory Committee on Immunization Practices (ACIP), a group of medical and public health experts convened by the Centers for Disease Control and Prevention (CDC) that makes recommendations on vaccines for people of all ages;4 
  • the Health Resources and Services Administration’s (HRSA) Bright Futures project for children, in partnership with the American Academy of Pediatrics provides recommendations to improve health of infants, children and adolescents;5 
  • the Health Resources and Services Administration, Office of Women’s Health issued federal regulations for eight preventive care services for women based on recommendations from a committee of the Institute of Medicine (IOM).6 

The combined roster of services recommended by these groups is extensive and can be classified into a few broad categories, including counseling and screening tests related to cancer, chronic conditions, mental health, health behaviors, and certain sexual and reproductive health services. For women, the law also requires no cost sharing for at least one annual “well woman” visit.

Knowledge and Understanding of the ACA Rules on Preventive Care

Women’s awareness of the ACA requirements regarding no-cost coverage of preventive care is uneven.

Coverage for preventive services without cost sharing is required in all new private plans, including employer-sponsored plans, individual market plans, and those in the new state marketplaces. While millions of women could potentially reap these benefits, many are unaware of ACA’s coverage for preventive services

1

. A sizable majority (74%) of women are aware of the ACA’s requirement that individuals carry insurance, but fewer know that at least one preventive visit for women must be covered (60%), or of the no-cost coverage for preventive services such as mammograms (57%). Knowledge is quite low even among subgroups that are most directly affected. For example, only 34% of women of reproductive age (ages 18 to 44) know of the coverage for breastfeeding supports including breast pump rental. Awareness of other benefits of particular relavence to women, such as the prohibition on insurers charging higher premiums for women over men, known as gender rating, is also low.

General Checkups and Provider-Patient Counseling

Provider visits can give women an opportunity to talk with clinicians about a broad range of issues, including preventing illness, the role of lifestyle factors, and management of chronic illnesses. Under the ACA, new plans must cover at least one annual “well woman visit,” which the IOM Committee on Clinical Preventive Services for Women recommended could specifically cover a range of topics, such as assessment of diet and physical activity, history of pregnancy complications, mental health screenings for pregnant and post-partum women, screening for metabolic syndrome, preconception care, prenatal care, and screening for STIs.7 

The majority of women have had a recent checkup with a provider.

Eight in ten women (82%) have had a general checkup in the past two years

2

. However, it is less common among uninsured women (60%), women with incomes less than 200% FPL (72%), and those with poorer health (74%).  Rates are similar between women of different racial and ethnic groups, with about eight in ten White (83%), Hispanic (79%), and Black (88%) women reporting they have had a recent well woman visit.

In general, rates of counseling on healthy lifestyles are highest for diet, exercise, and nutrition.

One component of preventive care that is now covered by plans without cost-sharing is provider counseling on health-related behaviors such as diet, smoking, and alcohol use, which have been shown to affect a wide range of health issues including a woman’s risk for chronic diseases. Consistent with other national trends, the highest rate of preventive counseling is on diet and nutrition, which 70% of women have discussed with a provider in the past three years

3

. However, fewer than half of women have recently talked to a provider about other risk factors for chronic illnesses, such as smoking (44%) and alcohol or drug use (31%). Across the board, women covered by Medicaid have the highest rates of counseling.  In addition, younger women and those in poorer health have higher counseling rates compared to their counterparts

Fewer than half of women have talked recently with a provider about mental health issues.

It is estimated that 21% of adult women are affected by some form of mental illness, such as depression, anxiety, trauma, eating disorders, or dementia.8  Under the ACA, mental health services have been included as one of the ten Essential Health Benefits,9  meaning that all new plans must cover this category, although coverage for specific services varies between plans. Depression and anxiety in particular present challenges to a disproportionate share of women over their lifetimes, and in response, the USPSTF recommends routine screenings. Four in ten (41%) women report having discussed a mental health issue such as anxiety or depression with a provider in the past three years

5

. Mental health screening rates are similar between women of different racial and ethnic groups, with about four in ten White (42%), Hispanic (42%), and Black (39%) women reporting discussing with a provider. As with other counseling topics, the rate is higher among women who are younger, sicker, or covered by Medicaid.

Screening Tests

Rates of preventive screening tests are higher among women with insurance.

Use of preventive services can lead to early identification of conditions when they are most responsive to early interventions. This is especially true for some types of cancers and cardiovascular conditions. For example, routine mammograms and pap tests, which are used to identify breast and cervical cancers respectively, are recommended by the USPSTF as necessary preventive services. The USPSTF also recommends regular screenings for elevated blood pressure and cholesterol levels because they are considered markers for cardiovascular conditions, including stroke and heart disease. These services are all now covered by new private plans under the ACA’s preventive services coverage requirements.

Most women have received cancer and cardiovascular screening tests in the past two years, including mammograms (73%), pap tests (70%), and cholesterol tests (67%), with some variation by age group (Table 6). The rate of blood cholesterol tests varies significantly between younger women (58% for women ages 18 to 44) and older women (78% for women ages 45 to 64). Cholesterol tests are recommended for women older than 20 who are at increased risk for heart disease.10  Rates of screening for colon cancer within the past two years are lower, with about four in ten (39%) women 50 and older reporting a recent colorectal screening. The USPSTF recommends three different methods with different intervals that are equally effective screenings for women between age 50 and 75 years: 1) annual high-sensitivity fecal occult blood testing, 2) sigmoidoscopy every 5 years combined with high-sensitivity fecal occult blood testing every 3 years, and 3) screening colonoscopy at intervals of 10 years.11 

Table 6: Rates of screening tests among women, by age and race/ethnicity
Preventive ScreeningUSPSTF RecommendationShare of Women Reporting Screening Test in Past Two Years
  All WomenAge GroupRace/Ethnicity
 Ages 18-44Ages 45-64WhiteBlackHispanic
Blood Pressure(Hypertension)Screening for high blood pressure in adults age 18 and older.92%90%94%*94%93%83%*
Blood Cholesterol Test (Coronary Heart Disease)Screening of women ages 20 and older who are at increased risk for coronary heart disease.67%58%78%*69%66%63%
Pap Test(Cervical Cancer)A pap test every 3 years for women ages 21-65, or a combination of a pap test and HPV test every 5 years for women ages 30-65.70%72%67%71%76%72%
Mammogram(Breast Cancer)Mammography screenings once every 1 to 2 years for women ages 40 and older.73%N/AN/A74%79%72%
Colonoscopy, Fecal Occult Blood test, Flexible Sigmoidoscopy (Colorectal Cancer)1) Annual high-sensitivity fecal occult blood testing or 2) sigmoidoscopy every 5 years with high-sensitivity fecal occult blood testing every 3 years or 3) screening colonoscopy at 10 year intervals for adults ages 50 to 75.39%N/AN/A40%35%34%
NOTES: Among women ages 18-64, except mammogram (ages 40-64), and colorectal cancer (ages 50-64). The ACA requires coverage of mammogram services based on the USPSTF 2002 recommendation on breast cancer screening, which recommended screening every 1-2 years beginning at age 40. *Indicates a statistically significant difference from ages 18-44, White, p<.05.SOURCE: U.S. Preventive Services Task Force, USPSTF A and B Recommendations; Kaiser Family Foundation, 2013 Kaiser Women’s Health Survey. 

Women who are uninsured have consistently lower use of all screening tests. While 95% of privately-insured women have had a blood pressure check in the past two years, the rate is 78% among uninsured women

6

.  Just over half of uninsured women have had a recent pap test, compared to three in four women with private insurance or Medicaid. The differences are even larger for mammography, cholesterol and colon cancer screenings, which typically require that patients go to a lab or other facility to have blood drawn or obtain other costly testing procedures. Women with Medicaid coverage receive screening tests on a par with women who are privately insured.

Over the past decade, self-reported rates of screening tests have been fairly level, except for a rise in the rate of cholesterol screenings and a decline in the rate of pap testing between 2001 and 2013

7

. The latter may be related to changes in the recommendations and guidelines for cervical cancer screening over that time period, which reduced the frequency and narrowed the age group for testing compared to earlier guidelines.12 


Report: Reproductive And Sexual Health Services

Reproductive and sexual health is an integral component of women’s general health and well-being. The ACA makes many reforms to insurance coverage that may improve access to these important services for insured women, in addition to broadening the availability of coverage to uninsured individuals. The ACA’s requirement for preventive services coverage without cost sharing includes a number of counseling services, screening tests, and supplies that could affect women’s access to reproductive and sexual health services, such as contraceptives, screening tests for sexually transmitted infections (STIs) and HIV, and the Human Papilloma Virus (HPV) vaccine. They also include pregnancy-related services such as prenatal visits, folic acid supplements, screening tests, tobacco cessation, and breastfeeding supports. Notably, the law includes maternity care as an Essential Health Benefit category that all new health plans must cover in their policies.

The ACA’s large coverage expansion to the uninsured may also make changes in the types of settings that women, particularly those who are newly insured, will use to obtain their reproductive care. This change in coverage patterns may have a disproportionate effect on family planning clinics and community health centers, who have long served low-income women, but may not be part of the health care provider networks contracting with the Marketplace plans. The ACA’s extension of dependent coverage up to age 26 also extends a new coverage option to women at a peak time in their lives when they typically seek reproductive and sexual health care. The fact, however, that these adult children are part of their parents’ insurance during this period also raises questions about privacy and confidentiality around the services they use when the primary policy holders are their parents. This section reports survey findings among women of reproductive age, 15 to 44 years old.

Use of Services

Most reproductive age women have had a gynecologic or obstetric visit in the past year.

The majority of women ages 15 to 44 report that they have had a gynecologic or obstetric visit in the past year (61%). Women with private insurance, however, have higher rates of a recent visit (within the past 12 months) for obstetric or gynecologic care (70%), compared to women with Medicaid (58%) and uninsured women (43%). A higher share of women covered by Medicaid (12%) and uninsured women (16%) reported that their last visit was over three years ago, more than twice the rate of women with private insurance (6%)

1

. Just 13% of women ages 15 to 44 reported that they have never seen a provider for obstetric or gynecologic care and the rates were similar for all the insurance groups.

Most women (85%) report that their most recent sexual health visit was for gynecologic care and 14% report it was for prenatal care (Table 7). Almost one in four Hispanic women report that the reason was for pregnancy related care (23%), higher than for White (13%) and Black women (9%). Slightly more women ages 25 to 34 reported their most recent visit was for prenatal or pregnancy-related care (17%), and the shares of younger (12%) and older women (11%) were similar.

Table 7: Reason for most recent gynecologic visit, by age group, race/ethnicity, and poverty level
 All WomenAge GroupRace/EthnicityPoverty Level
15-2425-3435-44WhiteBlackHispanicLess than 200% FPL200% FPL or greater
Have had a gynecological or obstetric exam within the past year61%44%74%*64%62%70%56%56%*68%
Reason for most recent visit
Gynecologic care85%85%82%87%86%90%75%*79%*90%
Prenatal/ Pregnancy Care14%12%17%11%13%9%23%*20%*9%
NOTE: Reason for most recent visit among women ages 15-44 who have ever had an obstetric or gynecologic exam. Federal Poverty Level was $19,530 for a family of three in 2013. *Indicates a statistically significant difference from ages 15-24; White; 200% FPL or greater; p<.05.SOURCE: Kaiser Family Foundation, 2013 Kaiser Women’s Health Survey.

Private doctors’ offices and HMOs are the primary settings where women get gynecologic care, but family planning clinics and community health centers play a significant role for women who have Medicaid and women who are uninsured.

Among the group of women who said they have had a gynecologic exam (not for pregnancy related care) within the past three years, 73% report that their most recent exam was at a doctor’s office or HMO

2

. Among women who have a had a gynecologic exam in the past three years, nearly one in ten women (8%) report their most recent exam was at a community health center or public clinic. Fewer younger women sought care at a doctor’s office or HMO (64%) than other women of reproductive age, with slightly more seeking care at school based clinics and urgent care centers/ walk-in facilities than other women (Table 8). Not surprisingly, health care settings vary for women with different types of insurance coverage.

Table 8: Site of most recent gynecologic exam among women, by age and insurance coverage
All WomenAge GroupInsurance Coverage
Site of most recent visit 15-2425-3435-44Private InsuranceMedicaidUninsured
Doctor’s office or HMO73%64%72%82%84%57%*53%*
Community health center or public clinic8%9%8%7%4%13%16%*
Family planning clinic or Planned Parenthood5%6%5%4%2%5%16%*
School/college based clinic or urgent care center/ walk-in facility4%9%3%1%4%5%5%
Other place6%6%7%4%4%13%5%
Don’t know/refused4%3%5%2%1%7%3%
NOTE: Among women ages 15-44 who have had an exam in the past three years. Other place includes other types of clinics and other locations such as emergency departments. *Indicates a statistically significant difference from ages 35-44; Private Insurance; p<.05.SOURCE: Kaiser Family Foundation, 2013 Kaiser Women’s Health Survey.

Women with private insurance overwhelmingly get their gynecologic care from private doctor’s offices or HMOs. While just over half of women enrolled in Medicaid and uninsured women obtain care from a doctor’s office/HMO, community health centers, family planning clinics and school based clinics play an important role for these groups. A larger portion of women covered by Medicaid (13%) seek care in another location, which includes emergency departments, compared to women with private insurance and uninsured women. A sizable share of private physicians limits their participation in Medicaid, and safety net providers play an important role serving low-income and uninsured women. As more women gain coverage under the ACA, especially through the subsidized private plans available on state Marketplaces, many of the women using these safety net providers could shift to private settings because their existing providers may not be in-network providers.

Counseling and Screening

Among reproductive health topics, counseling is more commonly reported for birth control than for other issues such as sexual history, sexually transmitted infections, and HIV.

An important aspect of reproductive and sexual health care is the counseling and education that health care clinicians can offer patients. Counseling allows clinicians to provide patient education, screen for high-risk behaviors, and identify the need for additional testing services. Providers can now be reimbursed when they provide counseling on a wide range of sexual health topics, because they are part of the preventive services that the ACA requires plans to cover without cost sharing. This is especially important because some of the health challenges women face during their reproductive years stem from sexual and reproductive health concerns. It is estimated that half of all pregnancies in the U.S. are unintended.13  The CDC estimates approximately 19 million new cases of STIs, such as chlamydia, gonorrhea, and HPV, occur each year.14  Approximately half of cases occur among young people ages 15 to 24, and disproportionately affect certain communities, with Black women at elevated risk for contracting an STI. Sex is also the major mode of transmission of HIV/AIDS among women, which has had a disproportionate impact on young women of color, particularly Black women.

Despite the high rates of STIs and unintended pregnancy, and the recommendations of professional groups, counseling on many of these topics is not routine among women of reproductive age

3

. While most reproductive age women have had recent conversations with a provider about contraception (60%), the rate is much lower for other topics, including sexual history (50%), HIV (34%) and other STIs (30%). It is notable that women with Medicaid have significantly higher rates of counseling on most of these topics compared to women with private insurance. Women of color also report higher rates of counseling on HIV and other STIs, compared to White women

Despite the burden of sexual violence on women in the U.S., counseling on dating and domestic violence is particularly infrequent in a health setting.

More than 1 in 3 adult women in the United States (36%) have experienced rape, physical violence, and/or stalking by an intimate partner in their lifetime.15  Intimate partner violence (IPV), also called domestic or dating violence, can affect women at any point in their lives, but rates are highest among women in their reproductive years.16  IPV can take many forms, including sexual violence, physical violence, and psychological and emotional abuse. It has long been recognized that clinicians can play an important role in the identification and treatment of women who have suffered from violence. As with other sexual and reproductive health topics, counseling on domestic violence is highly sensitive and requires training, including special protections for patients’ privacy, and knowledge of referrals so patients receive safe and effective follow up care and are protected from retaliation by perpetrators.

One of the preventive services for women that the ACA covers without cost sharing is provider counseling on IPV. While there have been advances in the health care system’s handling of IPV and newly developed screening tools for providers to use, it is still far from routine for providers to raise the issue of violence with women. Nearly one-quarter of women ages 15 to 44 (23%) have discussed dating or domestic violence with a provider in the past three years

6

. Compared to older women, provider-patient conversations about IPV are more common among women in their twenties and early thirties, but it is still not the norm. Counseling rates for IPV are also higher among Hispanic women, those who are low-income, and those covered by Medicaid.

Approximately four in ten women report recent screenings for HIV and other STIs, but many incorrectly assume they are being tested.

Several professional groups and government agencies, including the USPSTF, the Institute of Medicine, and the Centers for Disease Control and Prevention, recommend that women in their reproductive years be tested for sexually transmitted infections such as chlamydia, gonorrhea and HIV.17 ,18 ,19  Knowing one’s status is important to receive early treatment and prevent transmission to sexual partners. As with provider counseling, these tests are now covered without cost sharing in new private plans under the ACA’s preventive services coverage requirements. They are also commonly included as part of family planning services under Medicaid.20 

Approximately four in ten women report that they have had a test for HIV (44%) or other STIs (40%) in the past two years; however, approximately half of these women assumed this test was a routine part of an examination—which it is not

7

. Therefore, the actual screening rate is likely lower than the share of women who report being tested. This perpetuates the gap in knowledge of HIV status and other STIs that has been reported in other research and may cause women to believe they do not have an STI when in fact they have not actually been tested.

Screening rates for HIV and STIs are higher among low-income, Medicaid, uninsured, and minority women, particularly Black women (Table 9). Notably, there is a higher rate among some of these groups of women reporting that they requested their provider to conduct these tests; however, among all these groups, a substantial share also still incorrectly assume the test is routinely included in a health exam.

Table 9: Receipt of sexual health screening tests, by race/ethnicity, insurance status, poverty level
All WomenRace/EthnicityInsurance StatusPoverty Level
Reported having test in past 2 years WhiteBlackHispanicPrivateMedicaid UninsuredLess than 200% FPL200% FPL or greater
HIV Test44%35%72%*60%*37%59%*51%*54%*37%
Thought test was routine part of Exam56%60%48%53%56%46%61%56%55%
Doctor recommended test14%14%7%22%16%9%13%12%18%
Asked to be tested27%23%43%*24%27%41%22%30%26%
STI Test40%33%63%*50%*37%55%*38%47%*36%
Thought test was routine part of exam53%55%47%54%58%35%59%50%58%
Doctor recommended test15%11%18%21%14%15%13%14%14%
Asked to be tested31%32%35%23%28%47%27%35%27%
NOTE: Among women ages 15-44. Federal Poverty Level was $19,530 for a family of three in 2013. *Indicates a statistically significant difference from White; Private insurance; 200% FPL or greater; p<.05.SOURCE: Kaiser Family Foundation, 2013 Kaiser Women’s Health Survey.

Use of Contraceptives

Nearly half of sexually active reproductive age women use at least one form of contraception, but approximately one in five sexually active women of reproductive age report that they do not use contraception despite reporting they do not want to get pregnant.

The vast majority of women who are of reproductive age (15 to 44 years) have been sexually active (81%) in the past year. Among sexually active women, one in ten are pregnant or trying to conceive, and one in five (20%) women report that they or their partners have had a sterilization procedure or cannot become pregnant. For women with reproductive capacity but who want to avoid an unintended pregnancy, contraception is an essential health service. Some contraceptives also can reduce the risk of transmitting certain STIs (such as condoms) and in some cases can assist in managing other medical conditions (such as oral contraceptives). Among reproductive age women who have had sex in the past year, half (51%) report that they or their partners used at least one contraceptive method

8

. An estimated 19% of sexually active women ages 15 to 44 are at high risk for unintended pregnancy because they or their partners are not using contraception.

Condoms and birth control pills are the most commonly used forms of contraception.

While all forms of FDA approved contraception can reduce the risk of unintended pregnancy when used correctly, they vary in their use and effectiveness. Women are encouraged to consider a range of issues when choosing a contraceptive method in order to find the one that is most effective but also fits best within their beliefs and lifestyle. Condoms can protect against STIs and are widely available through many outlets without a prescription. Oral contraceptives, often referred to as the Pill, require prescriptions, are hormonal, and cannot be used or tolerated by all women. Other methods include injectables, implants, patches, and the vaginal ring, which deliver different doses of hormones. Intrauterine Devices (IUD) are devices that are inserted in a woman’s uterus by a provider and some types also include hormones. They can last up to 5 years or longer and are among the most effective methods of reversible contraception but also have the highest up front cost. Under the ACA’s preventive services provision, all new private plans are required to cover all FDA-approved methods of contraception as prescribed for women without cost sharing.

Table 10: Types of contraceptives used among sexually active women, by age and race/ethnicity
All WomenAge GroupRace/Ethnicity
Types of contraception used within the past 12 months 15-2425-3435-44WhiteBlackHispanic
Male condoms63%82%60%*41%59%78%*59%
Oral contraceptives48%54%44%46%53%36%*49%
IUD19%N/A29%22%24%10%*17%
Injectables7%13%6%1%3%16%*11%
Implants6%N/A8%*1%6%8%8%
Other12%12%14%11%12%7%17%
NOTES: Only includes women ages 15-44 who were sexually active in past year and used contraceptives in past year. Women may use more than one form of contraception. Oral contraceptives include birth control pills. IUD is an intrauterine device such as Mirena, Skyla, or Paragard. Injectables include Depo-Provera. Implants include Implanon or tubes in arm. Other methods include vaginal ring and the topical patch. N/A indicates data are not sufficient to meet criteria for statistical reliability. *Indicates a statistically significant difference from 35-44; White; p<.05.SOURCE: Kaiser Family Foundation, 2013 Kaiser Women’s Health Survey.

Among sexually active women who use contraception, just over half (54%) rely on one method and just under half (45%) use more than one method. Women most frequently report that they have used condoms and birth control pills in the past year (Table 10). Nearly two-thirds (63%) of sexually active women who have used contraceptives in the past year report using male condoms, almost half have used birth control pills (48%), and about one in five (19%) use an IUD. Nearly one in four White women (24%) report that they are using an IUD. A larger share of Black women than White or Hispanic women use condoms. Black women also have higher usage of injectables than White or Hispanic women.

While preventing pregnancy is the leading reason for contraceptive use, a sizable fraction of women also use them to manage a medical condition.

While contraceptives are essential for preventing and spacing pregnancies, they can also aid in the management of a wide range of medical conditions such as endometriosis, irregular periods, and fibroids.21 ,22  Not surprisingly, preventing pregnancy is the main reason for using contraceptives (64%), but a fair share of women (21%) state they use it to prevent pregnancy and manage a medical condition

9

. This factor likely affects women’s choices in the types of contraceptives they select.

While most women get their contraceptives from a private physician or HMO, a significant minority get their contraceptives from a clinic-based provider.

Six in ten sexually active women who are using birth control report that they obtain contraceptives at a doctor’s office or HMO (61%), one in ten (10%) obtain it at a family planning clinic, such as Planned Parenthood, and 6% from a community health center

10

. Higher shares of women of color go to clinics for contraceptives though. Nearly three-fourths of White women report they obtained contraceptive care at a doctor’s office or HMO, compared to less than half of Black (46%) and Hispanic (43%) women. Conversely, reliance on family planning clinics and community health centers is more than twice as high among women of color as for White women. This is the case for more than a third (37%) of Hispanic women, who also have the highest uninsured rate. Some of the differences in site of care are likely related to insurance status, which means that over time there could be changes in where women obtain care for contraceptives as the ACA moves forward and more women gain coverage. It is important to note that 17% of all women state they received contraceptives at “some other place,” such as a drugstore where condoms can be purchased.

As with gynecologic exams, care seeking patterns differ between women with insurance and women who are uninsured, with uninsured women reporting much higher rates of obtaining contraceptives at family planning clinics such as Planned Parenthood (34%) compared to women with insurance (5%)

11

. Only 29% of uninsured women receive birth control care from a doctor’s office or HMO.

Among women who use oral contraceptives, most women typically receive 3 months’ supply at a time.

Women who use oral contraceptives must take a pill every day; therefore having an adequate supply is important for consistent and effective use.23 Nearly three in ten (28%) of those who take birth control pills report that they have missed a pill because they could not get next pack on time (data not shown). Among women who have used oral contraceptives in the past year, two-thirds (67%) reported their plan or clinic allows them to only get 3 months’ supply or less at a time

12

. A higher share of low-income women, however, say that their clinic or insurance covered a longer supply of oral contraceptives. At the same time though, more than one in ten low-income women (13%) also report that their plan did not cover birth control pills. The differences in dispensing patterns may be a result of differences in insurance coverage policies or practice variation between sites of care.

Awareness of the availability of emergency contraceptive (EC) pills is high, but only a fraction of women have purchased or used it.

Emergency contraception (EC), which is contraception that can be used after sex to prevent pregnancy, has been available in the U.S. since 1999. There are multiple forms, including the copper IUD, Plan B® pills, and more recently another form of EC pills, ella®, was approved by the FDA in 2010. Most forms require a prescription, except for Plan B®, which has been available without a prescription for women 17 and older since 2009. As with other contraceptives, new private plans are required to cover prescriptions for EC without cost sharing under the ACA’s preventive services policy.

It has now been 15 years since EC pills were approved by the FDA and awareness of EC among women is very high. On average, 86% of women ages 15 to 44 report that they have heard of EC pills

13

. Only a fraction of women (5%) have used or bought EC pills. Use is highest among women in their late teens and early twenties.

Contraceptive Coverage

Among sexually active women who used contraception in the past year, three-quarters say that their insurance or Medicaid paid for some or all of the costs. However, nearly one in five say they had no coverage for their contraceptives, and most of these women paid the full cost out of pocket.

One of the most publicized and discussed of the ACA’s preventive services benefits is the requirement that most new private plans cover without cost sharing prescription contraceptive services and supplies. This policy went into effect August 2012.

Among sexually active women who report using contraception in the last year, insurance covered the full cost for one-third (32%) of women

14

. Almost another one-third of women (31%) reported that insurance covered part of the costs, which could be because they are enrolled in an older private plan that is still “grandfathered” from ACA requirements or they used a particular contraceptive that is not covered by the requirement (such as condoms or a brand name drug), or they did not meet all the requirements (such as staying within the provider network). Family planning is a mandatory service under Medicaid and the program has covered contraceptives without cost sharing for decades. One in ten women who used birth control reported that Medicaid or another public program covered the costs of their contraceptives. Nearly one in five (18%) women reported they did not have any coverage for birth control, which could be due to lack of insurance or enrollment in a “grandfathered” plan (that does not have to cover preventive services). Among women without contraceptive coverage, nearly two-thirds (64%) paid the full cost out of pocket, 12% received a reduced price or financial assistance and 22% did not have to pay anything, presumably because they obtained free contraceptives at a clinic or through another assistance program.

About one in three women who use contraception and have private insurance say their plan covered the full cost of the contraceptives.

It is notable that by the end of 2013, just over one-third (35%) of sexually active women who use birth control reported that their insurance fully covered the cost of contraceptives. Another 41% of women who used contraceptives last year said that insurance covered part of the costs

15

. Over one in ten (13%) report that they did not have any coverage for contraceptives under their insurance. Almost all women with insurance for contraceptives (97%, data not shown) report that they did not have trouble getting their insurance to cover the costs (fully or partially) for prescribed contraceptives. Only a small fraction of women (3%) had problems getting insurance to pay.

Insurance and Confidentiality

Women of all ages, but especially young women, value confidentiality. Many are not aware that private insurance plans can send documentation to the primary policy holder (such as a parent or spouse) that details the services they use.

Nearly half of women 18 to 25 (45%) with employer sponsored coverage are covered as dependents under their parents plan. Some of these women may have been able to obtain or keep private insurance through the ACA’s extension of dependent coverage up to age 26. Because these individuals are adult children, the extension of coverage has raised concerns about maintaining privacy and confidentiality about use of health services. Overall, six in ten women 18 to 44 years old report that it is important to them that information about health care visits be kept confidential from a parent or spouse

16

. However, it is a higher priority among young women, who also have the lowest awareness of the private insurance industry practice of sending documentation known as an explanation of benefits (EOB) with details about services and costs of services that were paid for by insurance to primary policy holders, often a parent or spouse. Among women 18 to 25, 71% state that it is important to them that their use of health services, such as sexual or mental health care services, be kept confidential. Despite the importance of confidentiality, awareness of this practice was low among this age group, as only 37% of women knew that private insurers typically send an EOB to primary policy holders, often a parent. Awareness is even lower among teens ages 15 to 18, where only 24% reported knowing that EOBs were typically sent to the home (data not shown). Knowledge is considerably higher among women in older age groups, who likely have had greater experience with use of insurance plans.

Report: Conclusions And Implications

The findings of this survey provide new information about the opportunities and ongoing challenges in women’s health care and coverage in the early days of ACA implementation. The ACA includes reforms that could make coverage more affordable, accessible, and stable for many women in the years to come. The bans on pre-existing condition exclusions and gender-rating as well the requirement that plans now include maternity care and contraception could benefit many women, not just those who are uninsured. In the late fall and early winter of 2013 when this survey was conducted, there were still many gaps in coverage and access to care facing women. While the ACA can potentially fill some of these gaps, many challenges related to the law’s implementation and other structural factors remain.

This report documents gaps in women access to care and identifies some of the barriers they experience including the need for affordable care and coverage options. It also highlights some of the distinct health concerns of women, especially the importance of reproductive and sexual health and the need for it to be addressed as part of women’s basic care. Attention to these concerns will need to be part of the larger agenda to improve women’s access to care and coverage, quality of care, and ultimately, their health and well-being.

Coverage

The health coverage expansion will affect many uninsured women. Gaps in coverage are experienced by a disproportionately high share of low-income women and women of color.

Uninsured women consistently reported barriers to care, lower use, and poorer access to care at much higher rates than women enrolled in Medicaid or private insurance. Millions of uninsured women could gain access to coverage that includes a wide range of benefits. The gaps in coverage are considerable for low-income women, with 4 in 10 reporting that they were uninsured at the end of 2013. The survey finds that Black and Hispanic women also bear a disproportionate burden of being uninsured. Eligibility for Medicaid and the subsidies in the form of tax credits are available to help many low-income women secure coverage under the ACA. While many may have enrolled in the state Marketplaces or in Medicaid during the open enrollment period, some of the poorest women will not qualify for assistance because they reside in a state that is not expanding Medicaid. Additionally, gaps will remain for some immigrant women because federal rules ban Medicaid coverage for new immigrants, and undocumented immigrants are not eligible for Medicaid and do not have access to the Marketplace plans.

Coverage under a parent’s plan is now the leading way that women under age 26 get their coverage, highlighting the importance of confidentiality.

The ACA allows parents to keep their adult children enrolled in their plan until the age of 26. This age group had the highest uninsured rate of any age group before the law was passed. An issue related to this provision that has gotten less attention is confidentiality for this group. This stems from the practice of sending the Explanation of Benefits (EOB) to the principal policy holders, which in these cases is usually a parent of an adult child. The survey finds that most young women are not aware of this policy, but highly value their confidentiality. This is especially important when women see providers for sensitive services such as reproductive health and mental health care. While there are mechanisms available to protect confidentiality and privacy in a health care setting, the receipt of an EOB signaling that an adult child has used services could violate that privacy.

Costs and Access

Between one-fifth and one-quarter of women report that they either postponed or went without care they felt they needed because of costs. While health costs are a major barrier to care for many uninsured women, women on Medicaid and privately insured women also report that out-of-pocket costs can limit access on a broad range of indicators. Out-of-pocket spending may still be a barrier to care for newly insured, low-income women despite the availability of subsidies and caps on spending under the ACA. A substantial share of women on Medicaid report that cost is a barrier, which could be attributable to Medicaid policy that permits nominal cost-sharing for some services and in some states limits on the number of visits, prescription drugs, or range of drugs the program will cover.

Medical bills are problems for nearly three in ten women and some are forced to make difficult trade-offs to meet these obligations.

Women report difficulties paying for medical bills at significantly higher rates than men. Not surprisingly, medical debt is a problem for a higher share of women who are low-income, uninsured, and even for women on Medicaid, who may also contend with bills for other family members who are uninsured. A substantial share of women with medical debt report they either used up most of their savings, had difficulty paying for basic necessities, or had to borrow money from friends or relatives to pay for their bills. The issue of medical debt could also be a consideration for women in the selection of a plan’s metal tier available through the Marketplaces. Women choosing bronze plans with low premiums, but higher cost-sharing and deductibles could still face substantial out-of-pocket costs if they have a hospitalization, serious injury, or other medical condition that requires costly medical treatment. 

Logistical barriers to care beyond coverage and affordability are challenges for many women.

Lack of flexibility at work, problems with childcare and difficulty securing transportation are reported by a sizable minority of women as a reason that they didn’t get care they felt they needed in the past year. These challenges are more common among low-income women, but are also reported by some with higher incomes. Notably, one-quarter of all women, regardless of income, report that lack of time to go to the doctor is a reason they went without care. The survey suggests that factors such as work place flexibility, sick leave, and child care also could have implications for women’s access to care.

Connections to Care

Expansions in coverage options and system reforms could result in more women having a stronger connection to health providers, but it is important that new models of care be gender sensitive.

While most women report that they have a specific place or provider for their routine care, a substantial share of women who are younger, Hispanic, low-income or uninsured lack this important connection to care. Sizable shares of women also say they have more than one regular provider, typically a family physician/internist along with an Ob/Gyn. The ACA includes incentives to improve primary care and develop new models for patient centered medical homes. It will be important to examine how well these approaches address the diverse needs of women, including reproductive and sexual health care.

A network of safety-net clinics, including community health centers and family planning clinics, will still be needed by many women.

Safety-net providers including community health centers, public clinics, and family planning clinics play a significant role serving women, particularly those who are low-income, uninsured, or racial and ethnic minorities. While it is too soon to tell how these providers will fare as more people gain coverage and shift to private or Medicaid plans, many low-income women will remain reliant on these providers for their care.

Preventive Services

The ACA private plan coverage requirements may help improve the use of preventive services, yet awareness is still limited.

The new private plan coverage requirements in the ACA for well woman visits and for other preventive services could result in greater numbers of women receiving these services at recommended rates. However, public awareness of these insurance reforms is far from universal. In addition, while most women report a recent checkup or well woman visit, counseling and screening services are often not provided at recommended intervals. Gaps are especially notable among women who are low-income and uninsured.

Medicaid coverage of preventive services is an important benefit for low-income women.

Women with Medicaid coverage, despite their lower incomes and constrained provider options, obtain preventive screening and counseling services at rates that are on par with women with private coverage. The ACA includes a small financial incentive for state Medicaid programs to provide coverage of all services recommended by the USPSTF without cost sharing. In the coming years, we will track how many states take advantage of this option and broaden coverage of preventive care for women under Medicaid.

Sexual and Reproductive Health

There is considerable room for improvement in the rates of counseling on reproductive and sexual health services.

Among women of reproductive age, counseling rates fall far short of recommended levels. Screening rates for sensitive services are particularly low. Although nearly two-thirds of women have received some level of counseling for contraception, counseling on sexual history, HIV, and STIs is only provided to a fraction of reproductive age women. Many women are incorrectly under the impression that HIV and STI tests are routinely included as part of their gynecological exams. Therefore, the actual screening rate is likely lower than the share of women who report being tested. This mistaken assumption has implications for the treatment and prevention of transmission of these infectious diseases, especially given the high rates of STIs among young women and the disproportionate burden of HIV on Black women.

A substantial share of sexually active women is not using any contraception and consequently is at high risk for unintended pregnancy.

While the effectiveness of FDA approved contraceptives in preventing unintended pregnancy is widely known, many women are at very high risk for unintended pregnancy because they are not using any method. Among sexually active women who use reversible contraceptives, condoms are the most frequently reported followed by oral contraceptives, and a sizable share use more than one method. Condoms also offer important protection against certain STIs, but are not among the most effective methods for preventing pregnancy. It has now been 15 years since Plan B® emergency contraceptive (EC) pills were approved by the FDA and nearly 5 years since they became available without a prescription. Today, awareness of emergency contraceptive pills is quite high.  However, a fraction of women report that they have used or purchased them to prevent unintended pregnancy in cases of contraceptive failure or as a backup method of contraception.

A sizable minority of women using contraception now rely on long acting reversible contraceptives (LARCs).

Intrauterine devices (IUDs), sub-dermal implants and hormonal injections, considered to be LARCs, are among the most effective methods of birth control. The ACA includes provisions that require new plans to provide no-cost coverage for prescribed FDA-approved contraceptives and services for women (including insertion, removal and follow up care). This provision could expand access to highly effective and long lasting methods by eliminating costs as a barrier. In addition, coverage of family planning services without cost-sharing has long been a mandatory benefit under Medicaid. About half of the states also have special programs that provide coverage for family planning services to low-income women who do not qualify for full Medicaid, which has potentially expanded the pool of low-income women who can obtain LARCs without cost barriers. A recent study demonstrated that when financial barriers were removed, and women were counseled about all contraceptive methods, 75% of women chose LARCs.24 

One in three women with private insurance report that their insurance plans covered the full cost of contraceptives.

Almost two years after the ACA contraceptive coverage rule took effect, among women with private insurance, one in three report that their insurance covered the costs of their contraceptive care in full. This provision only applies to “new” or “non-grandfathered” plans and over time it is anticipated that most women with private coverage will be enrolled in plans that offer this coverage. Still, four in ten say their insurance covered part of the costs and 13% reported that their plans did not cover contraceptives. While this provision has received much attention in the media, not all women are aware of this policy, which has the potential to broaden access to the most effective, but sometimes more costly, methods of contraceptives.

Family planning providers and community health centers play an important role providing contraceptive care for uninsured women and women of color.

Community health centers and family planning clinics were established to provide care to individuals regardless of their ability to pay. Title X, the federal planning program, and the Medicaid program are theleading sources of public funding for family planning services provided by clinics. As care systems under Medicaid increasingly shift to private managed care plans, and growing numbers of uninsured women are enrolled in private plans and Medicaid, it will be important to monitor how care changes for the women who have been relying on these clinics for their reproductive and sexual health care. In addition, there will still be gaps in coverage as many low-income women will either not qualify for coverage or may not be able to afford to enroll. These low-income women will still need affordable sources of care if they are to have access to sexual and reproductive health services.

***

The findings of this survey provide new information about the opportunities and ongoing challenges in women’s health care and coverage in the early days of ACA implementation. The ACA includes reforms that could make coverage more affordable, accessible, and stable for many women in the years to come. While the ACA can address some of these gaps, many challenges related to the law’s implementation and other structural factors remain. Patient education, affordable care and coverage options, and integrated care systems that encompass the range of women’s health needs, including reproductive and sexual health, will be critical issues to consider moving forward.

Endnotes

  1. Kaiser Family Foundation, Medical Debt Among People with Health Insurance, January 7, 2014. ↩︎
  2. The Patient Protection and Affordable Care Act, Section 2713: Coverage of Preventive Health Services ↩︎
  3. U.S. Preventive Services Task Force, USPSTF A and B Recommendations ↩︎
  4. Centers for Disease Control and Prevention, Vaccine Recommendations of the ACIP ↩︎
  5. Bright Futures and American Academy of Pediatrics, Recommendations for Preventive Pediatric Health Care ↩︎
  6. Health Resources and Services Administration (HRSA), Women’s Preventive Services Guidelines ↩︎
  7. Health Resources and Services Administration, Women’s Preventive Guidelines ↩︎
  8. HHS, Substance Abuse and Mental Health Services Administration, Behavioral Health, United States, 2012 ↩︎
  9. HHS, Essential Health Benefits. ↩︎
  10. U.S. Preventive Services Task Force, Screening for Lipid Disorders in Adults ↩︎
  11. U.S. Preventive Services Task Force, Screening for Colorectal Cancer ↩︎
  12. U.S. Preventive Services Task Force, Screening for Cervical Cancer  ↩︎
  13. Guttmacher Institute. (2013). Unintended Pregnancy in the United States. ↩︎
  14. Centers for Disease Control and Prevention. (2013). Sexually Transmitted Infections Among Young Americans. ↩︎
  15. Centers for Disease Control and Prevention. (2011). The National Intimate Partner and Sexual Violence Survey. ↩︎
  16. Catalano, S. (2012). Intimate Partner Violence, 1993-2010. U.S. Department of Justice, Office of Justice Programs. ↩︎
  17. U.S. Preventive Services Task Force. (2008). Recommendations for STI Screening. ↩︎
  18. Centers for Disease Control and Prevention. (2014). Sexually Transmitted Diseases (STDs). ↩︎
  19. The Institute of Medicine. (2011). Clinical Preventive Services for Women: Closing the Gaps. ↩︎
  20. Kaiser Family Foundation. (2012). State Coverage of Preventive Services for Women under Medicaid: Findings from a State-Level Survey. ↩︎
  21. The American Congress of Obstetricians and Gynecologists. (2009). Hormonal Contraceptives Offer Benefits Beyond Pregnancy Prevention. ↩︎
  22. Dayal, M & Barnhart, KT. (2001). Noncontraceptive benefits and therapeutic uses of the oral contraceptive pill. Seminars in Reproductive Medicine 19(4). ↩︎
  23. Foster, D, et al. (2011). Number of oral contraceptive pill packages dispensed and subsequent unintended pregnancies. Obstetrics & Gynecology 117(3). ↩︎
  24. Peipert, J.F., et al. (2012). Preventing unintended pregnancies by providing no-cost contraception. Obstetrics and Gynecology 120 (6).  ↩︎