KFF designs, conducts and analyzes original public opinion and survey research on Americans’ attitudes, knowledge, and experiences with the health care system to help amplify the public’s voice in major national debates.
The Kaiser Health Policy News Index is designed to help journalists and policymakers understand which health policy-related news stories Americans are paying attention to, and what the public understands about health policy issues covered in the news.
Attention to Current News
Other than the big stories of Ferguson, Ebola and ISIS, the only other news which captured a majority of the public’s attention this month was President Obama’s executive order on immigration (followed very or fairly closely by 63 percent). Smaller, yet substantial, shares report closely following many health policy news stories this month. Over four in ten say they closely followed the lawsuit filed by House Republicans against President Obama over the implementation of the health care law (45 percent) and about a third say they followed a change in the official estimate for the number of people that enrolled in health insurance during the ACA’s first open enrollment period (34 percent) and the ACA’s second open enrollment period (28 percent). A third also report closely following the allegations of sexual assault against comedian and actor, Bill Cosby (34 percent). The least closely followed health policy story of those asked about this month, was coverage of comments about the ACA made by MIT health economist, Jonathan Gruber (followed closely by 22 percent, including one in ten who say they followed the story “very closely”).
Figure 1
A Deeper Look At The ACA In The News This Month
U.S. House Law Suit Over ACA Implementation
After news coverage of Ebola at home and abroad, the most closely followed health policy story this month was the lawsuit filed by House Republicans against President Obama regarding the implementation of the health care law (closely followed by 45 percent of the public). The public is more-or-less divided about the House Republicans’ motivations for the lawsuit, with half (50 percent) saying the Republicans are trying to gain political advantage and about four in ten (38 percent) saying the Republicans are suing mainly because they believe the president overstepped his legal authority.
Not surprisingly, opinion varies starkly by party identification. A majority of Republicans (71 percent) think the House Republicans filed the lawsuit because President Obama overstepped his authority, and a similarly large share of Democrats (78 percent) think the lawsuit is motivated by Republicans’ desire to gain political advantage.
Figure 2
Revisions To The Official Enrollment Estimate
In other health policy news, about a third (34 percent) of Americans report closely following the revision to the official estimate for the number of people that enrolled in health insurance during the health care law’s first open enrollment period. The number of enrollees was revised downward from 7.3 million to 6.7 million because enrollees in dental plans were incorrectly included in the original count1.
However, when asked whether the revised number of enrollees is larger or smaller than the originally reported number, about three in ten (28 percent) correctly answer that it is smaller, over four in ten (43 percent) incorrectly say the revised number is larger and another three in ten (29 percent) do not know. Even among those who report closely following the news coverage of the number revision, still only a third (32 percent) answered correctly. There is a large partisan divide in response to this factual question; further evidence of the underlying partisan perceptions of the law. Republicans are much more likely than their Democratic counterparts to correctly answer that the revised number is smaller than the original (42 percent vs. 19 percent) and independents fall in between (27 percent).
Figure 3
Open Enrollment Round Two
The ACA’s second open enrollment period, which began November 15th, by many accounts is off to a smoother start than the troubled launch of the first open enrollment period in October 2013, and just over a quarter say they are closely following it in the news (28 percent). When asked how the website’s functionality compares with last year, nearly half of the public (48 percent) say there have been fewer problems, 31 percent say the number of problems is about the same, and only 9 percent say there are more.
Figure 4
A majority of Democrats (61 percent) and nearly half (48 percent) of independents say there have been fewer problems this year, while Republicans are less likely to say so (36 percent). But across party lines, small shares they think there have been more problems with the website this year.
Awareness Of US Supreme Court Case On Financial Assistance Under ACA
The U.S. Supreme Court announced in early November that it will hear a case about whether low- and moderate-income people in states with marketplaces operated by the federal government will remain eligible for financial help from the government to buy health insurance. A large majority (84 percent) of the public say they have heard “only a little” (29 percent) or “nothing at all” (55 percent) about the case before the Supreme Court.
In addition to few hearing about the Supreme Court case, Americans are also largely unaware that 37 states are currently using the marketplace operated by the federal government, Healthcare.gov. Nearly half (46 percent) of the public incorrectly say less than half (29 percent) or just a few (17 percent) use the federal marketplace and 9 percent say “almost all”, while 18 percent say they don’t know. Roughly three in ten responded correctly that more than half (28 percent) of states use the marketplace operated by the federal government.
Figure 5
Year In Review
To cap off the first year of the new Kaiser Health Policy News Index, we asked the public, in their own words, what news story they have followed most closely this year. About a quarter (23 percent) referred to recent news about use of force among police, including many that referred to specific cases such as the case of Michael Brown, an unarmed African American young man in Ferguson, Missouri who was shot by a white police officer; a case that has sparked nationwide protests after a grand jury decided not to indict the police officer involved. Ranking third on the list, behind news about foreign policy (13 percent), comes health care with 9 percent of the public saying it’s the news story they’ve followed most closely this year, including 5 percent that specifically said the ACA.
FIGURE 6: Over the past year, what news story would you say you followed most closely?
Ferguson/Michael Brown/ Police Brutality
23%
Foreign Policy/ War
13
Health Care
9
Obamacare/ACA
5
Immigration
6
Ebola
4
Congress/Politics/President Obama
4
A look back at the Kaiser Health Policy News Index surveys throughout the year shows the top 5 health-related stories followed closely by the public include Ebola in the United States (79 percent in November) and in West Africa (78 percent in November) (despite only 4 percent of the public volunteering Ebola when asked in their own words). Fewer, but still about 6 in 10 Americans say they closely followed the Veteran’s Affairs scandal about waiting lists at VA facilities (64 percent in July), debate over whether for-profit companies are required to cover birth control in their health benefits packages (59 percent in July), and coverage of the ACA enrollment numbers (58 percent in May). With the exception of Ebola, these stories were followed closely by slightly fewer than those who followed non-health stories such as conflicts in Ferguson, Missouri (80 percent in December), the missing Malaysia Airlines flight (77 percent in March), and conflicts involving ISIS in Iraq and Syria (71 percent in November).
Figure 7
NOTE: These questions were asked as part of the December 2014 Kaiser Health Tracking Poll. For more results from that survey, including methods, see: Kaiser Health Tracking Poll: December 2014.
Medicare, the federal health program that provides health care and coverage to 54 million seniors and younger adults with permanent disabilities, is in the midst of an unprecedented slowdown in spending growth. A new issue brief from the Kaiser Family Foundation, How Much of the Medicare Spending Slowdown Can be Explained? Insights and Analysis from 2014, examines the factors that help explain why Medicare is on track to spend an estimated $580 billion in 2014, instead of the $706 billion forecast by the Congressional Budget Office in 2009. Medicare accounts for 14 percent of the federal budget and 20 percent of national health care expenditures.
The study synthesizes information from a variety of sources, and presents new analysis to assess the extent to which lower-than-projected Medicare spending in 2014 can be explained by deliberate policy and program changes, unexpected trends, and other factors. The analysis finds that about half of the gap between projected and actual Medicare spending in 2014 is explained by reductions in payments to providers and plans included in the Affordable Care Act of 2010 and the Budget Control Act of 2011. Other explanatory factors include the unanticipated slowdown in Medicare prescription drug spending caused by lower drug prices and other policy changes. Yet what accounts for more than one-third of the net $126 billion gap between projected and actual spending for 2014 remains unclear. The study reviews a number of factors that could potentially explain the spending slowdown in 2014 for which empirical evidence is not yet available. The study was authored by researchers at RAND Corporation and the Kaiser Family Foundation.
Analysts have warned federal policy makers for many years that long-term growth in spending on health care threatens to upend the federal budget and consume an unsustainable share of the nation’s economy.1 Medicare is by far the largest federal health program in terms of spending,2 and, historically, spending growth in the program has been driven by persistent increases in enrollees and spending per enrollee. Because Medicare has accounted for a rising share of the federal budget and the nation’s economy, concerns about Medicare spending growth have prompted a steady stream of proposals for major changes to the program, such as increasing the age of eligibility, restructuring Medicare’s benefit design, or shifting the program to a defined contribution arrangement.3
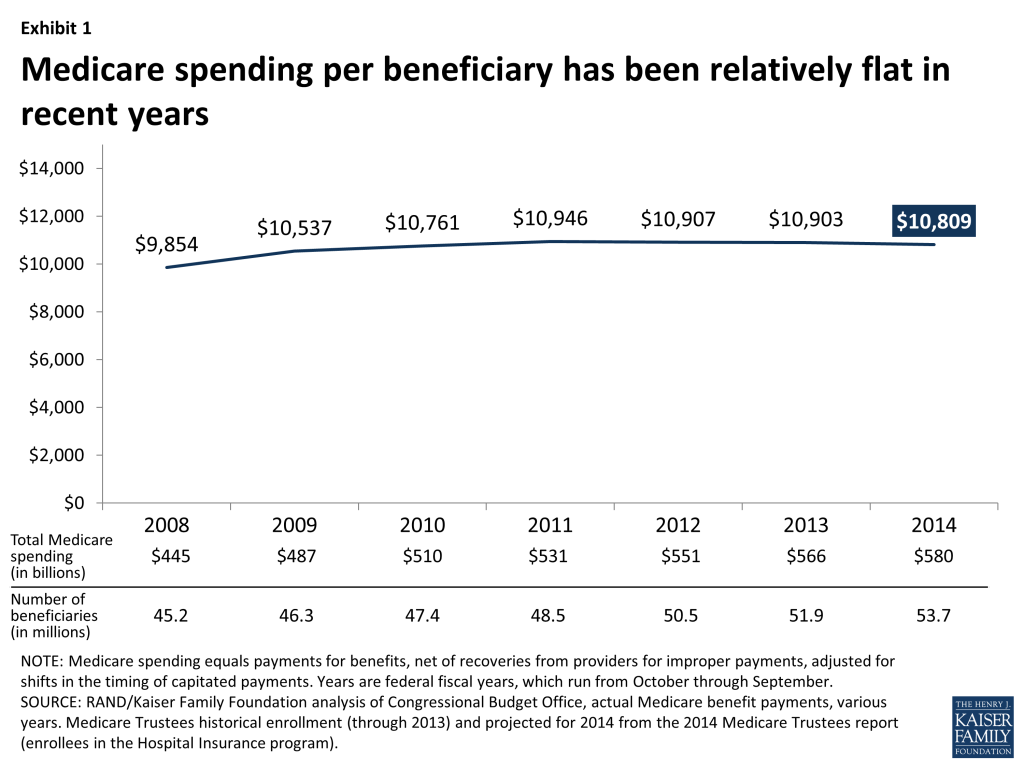
Against this backdrop, a seemingly incongruous storyline has emerged in recent years: Medicare spending growth of late has been remarkably low relative to historical norms. Annual growth in aggregate spending has averaged just over 3 percent since 2009, despite rapid enrollment growth due to the aging of the “baby boom” generation. On a per enrollee basis, Medicare spending has been growing more slowly than GDP per capita,4 and has been relatively flat since 2009—even falling very slightly, in nominal dollars, since 2011 (Exhibit 1). Both the magnitude and the duration of the slowdown in Medicare spending growth have no precedent in Medicare’s nearly 50-year history.
Exhibit 1: Medicare spending per beneficiary has been relatively flat in recent years
Medicare’s recent slow spending growth has manifested itself in several ways. Between 2009 and 2014, the Medicare Trustees extended by more than 10 years their projections of the solvency of the Medicare Hospital Insurance trust fund, from 2017 (2009 projection) to 2030 (2014 projection)—which is also related to growth in revenues from a payroll tax increase included in the Affordable Care Act (ACA) and to a stronger economy.5 The slow growth in Medicare spending has also led to relatively modest increases in Medicare premiums and cost sharing, which are indexed to rise with program costs. For example, Medicare Part B premiums, which are pegged to growth in Part B spending, were unchanged between 2013 and 2014 and will be the same in 2015 as in the previous two years. And the Medicare Trustees project that the Independent Payment Advisory Board (IPAB)—a controversial but not yet appointed or convened independent entity which was authorized by the ACA as a spending backstop—will not be required to issue recommendations for Medicare savings until 2022, due to relatively low projected spending trends.6
Issue Brief
Our Approach
The aim of this paper is to identify and quantify, to the extent possible, the factors that explain the gap between actual Medicare spending in 2014 and CBO’s 2009 projections of what Medicare spending would be this year. Other researchers have analyzed economic and other factors that are associated with the recent slow growth in overall health care spending, and in Medicare specifically. This study synthesizes information from a variety of sources and presents new analysis to assess the extent to which lower-than-projected Medicare spending in 2014 can be explained by deliberate policy and program changes, unexpected trends, and other factors.
To quantify the 2014 spending gap, we estimate the actual level of spending in 2014 ($580 billion) and compare that to the level of spending projected for this year by the Congressional Budget Office (CBO) in 2009 ($706 billion)—a gap of $126 billion. We include in the 2009 projections an upward adjustment for the cost of overriding the Sustainable Growth Rate (SGR) formula and freezing physician payments. That approach is consistent with CBO’s “alternative fiscal scenario” baseline, which reflects their assessment of Medicare’s likely spending path absent any changes in policy.
Because the Medicare program has, in fact, changed since 2009, we quantify how much of the gap between projected and actual 2014 Medicare spending can be attributed to specific legislative and policy changes since 2009, based mainly on CBO’s estimates of the projected effects of these changes. These estimates are not a perfect measure of actual spending reductions directly attributable to policy changes, but they are the best available proxies for gauging the impact of policy changes on Medicare spending. Such changes include provisions in the 2010 Affordable Care Act and the Budget Control Act of 2011. In addition, we quantify the portion of the 2014 spending gap that can be explained by other trends and changes that have had a measurable effect on Medicare spending in 2014 (including those that led to both lower-than-expected spending and higher-than-expected spending), and the remaining portion of the spending gap which remains unexplained. Finally, we describe several factors that could be associated with Medicare savings in 2014 for which empirical evidence is not yet available.
The analysis draws on several sources, including Congressional Budget Office (CBO) Medicare spending baseline projections over multiple years, CBO estimates of policies that affected Medicare expenditures, monthly statements of receipts and outlays issued by the U.S. Treasury for 2014 and other years, Medicare population projections from the Centers for Medicare & Medicaid Services (CMS) Office of the Actuary, and other data from a variety of government sources. (See Appendix 1: Methodology for more details about the methods used in this analysis, and Appendix 2: Factors Related to Changes in Projected Versus Actual Medicare Spending in 2014, for a table summarizing the factors included in this analysis and their spending effects.)
Summary of Prior Research
Slow growth in spending in the Medicare program is one piece of a larger puzzle: the surprisingly slow growth in overall health care spending in recent years. Analysts have noted a slowdown in total health care spending beginning in 2005,7 and a number of recent studies have examined the explanations for, and implications of, that broader slowdown of health care costs. The debate has shaped up between those who attribute the slowdown in health care costs primarily to the “Great Recession” and those who point to system-wide changes that might be taking hold. Those who attribute slow growth primarily to the Great Recession warn of a likely resurgence in spending growth.8 Other analysts suggest that the recent slowdown reflects broader, and possibly enduring, changes in the health care system, including the adoption of alternative payment approaches (e.g., value-based purchasing, pay-for-performance bonuses, and bundled payments), the use of “big data” to target wasteful spending, the introduction of Accountable Care Organization (ACOs) and other payment and delivery system reforms, the spread of high-deductible plans, and slower development of new medical treatments and technology such as “blockbuster” prescription medications.9
Several researchers have focused specifically on slow growth in Medicare spending, comparing trends in various time periods. White (2008) showed that the rate of growth in Medicare spending per enrollee was sharply lower from 1997-2005 than in earlier periods, which he attributes to a series of changes in provider payment policy, including reductions in hospital payments and new prospective payment systems for post-acute care.10 Levine and Buntin (2013) tested a number of possible explanations for the slowdown in the annual growth in spending per beneficiary in traditional Medicare between the years 2000-2005 (7.1 percent growth) and 2007-2010 (3.8 percent), including slower growth in payment rates, the Great Recession, and the influx of younger and healthier beneficiaries, and found that none of these factors explained the bulk of the observed slowdown.11
Chappel et al. (2014) compared annual growth in Medicare spending per beneficiary between two time periods: 2000-2008 versus 2009-2012.12 They used detailed claims data from beneficiaries in traditional Medicare to quantify the contributions to the slowdown from specific service categories (e.g., hospital inpatient, home health), and the contributions of trends in prices versus quantities. They find that the slowdown appears across nearly all service categories, and that for most service categories, slow growth in quantities, rather than prices, appeared to be the main driver of slow spending growth between 2009 and 2012. The Committee for a Responsible Federal Budget (2014) examined Medicare spending growth between 2013 and 2014 and suggested that much of the slowdown in that one year can be attributed to sequestration (which is scheduled to expire in 2024) and the phasing in and ramping up of provisions in the ACA.13 Neuman and Cubanski (2014) find that Medicare spending per enrollee in 2014 is $1,200 lower than was projected by the Congressional Budget Office (CBO) in 2010.14 Adler and Rosenberg (2014) compare CBO’s March 2011 and April 2014 Medicare spending baseline, and attribute much of the projected 10-year (2012-2021) reduction in Medicare spending from the 2011 to 2014 baselines to the slowdown in Part D spending.15 Dobson et al. (2014) highlight the role of structural changes, including payment reforms in the ACA, as explanations for the recent slow growth in Medicare spending.16
This analysis differs from previous work in several ways. Unlike Chappel et al. (2014), we examine spending in 2014 relative to CBO’s 2009 projections and the factors related to lower-than-expected Medicare spending this year. Unlike White (2008), Levine and Buntin (2013), Neuman and Cubanski (2014), and Adler and Rosenberg (2014), we focus on changes occurring between 2009 and 2014 that may have contributed to the gap in projected versus actual spending in 2014, including the implementation and effects of the Affordable Care Act and the Budget Control Act of 2011 (BCA) along with other changes.
Quantifying the Gap Between Projected and Actual Medicare Spending in 2014
To quantify the gap between projected Medicare spending in 2014 and actual spending this year, we compare actual 2014 spending with CBO’s 2009 “baseline” amount for 2014 (including an upward adjustment to physician payments to account for the fact that Congress has overridden the cuts called for by the SGR). That baseline reflects CBO’s best guess of Medicare’s spending trajectory if the program remained unchanged. An alternative approach to quantifying this difference would be to calculate average historical rates of growth in spending per beneficiary, and project spending from 2008 forward applying the historical average growth rate to the projected number of beneficiaries. The second approach is simpler and more transparent, but fails to take advantage of CBO’s detailed projection methodologies. (See Appendix 1: Methodology)
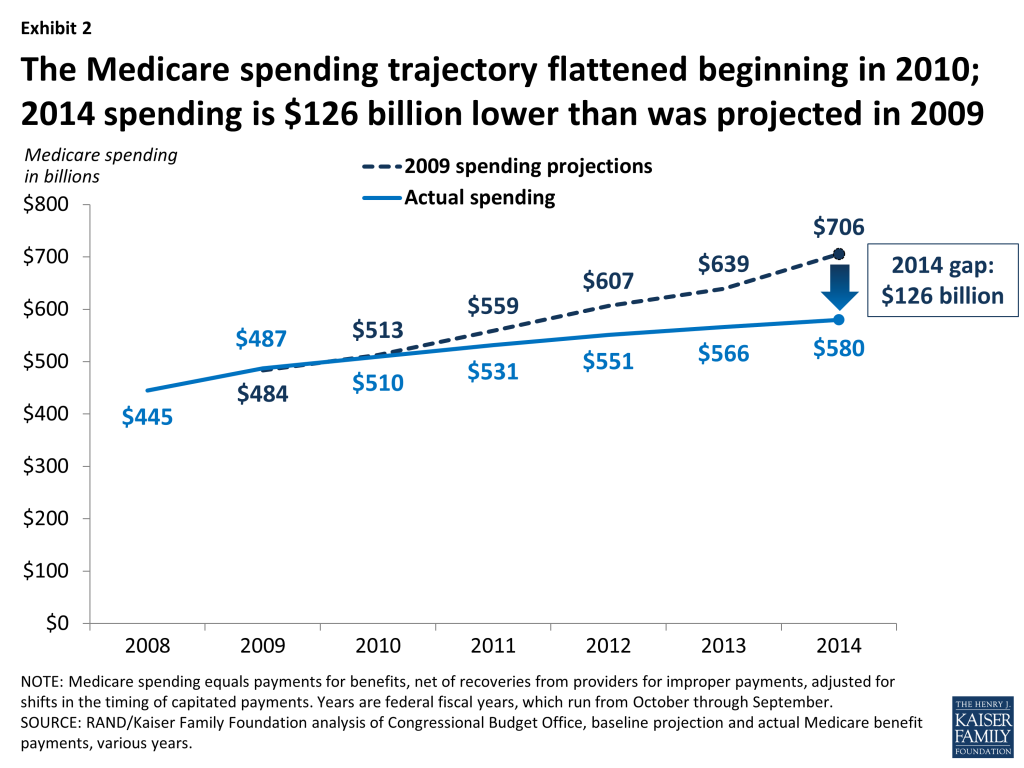
In 2009, CBO projected that Medicare spending would grow to $706 billion in 2014 (Exhibit 2). This estimate includes the estimated effects on Medicare spending from freezing physician payments rather than allowing the cuts called for by the Sustainable Growth Rate (SGR) to take effect. Using historical average growth rates yields similar projected levels of total spending in 2014, ranging from $702 billion (similar to the CBO projection for 2014) to $753 billion, depending on the historical period used.17 But actual Medicare spending in 2014 has ended up far below any of those projections, totaling $580 billion in 2014—18 percent, or $126 billion, lower than CBO’s 2009 projection. (See Appendix 1: Methodology for more details about these calculations.)
Exhibit 2: The Medicare spending trajectory flattened beginning in 2010; 2014 spending is $126 billion lower than was projected in 2009
The change in the trajectory of Medicare spending since 2009 is by no means a complete surprise; to the contrary, much of the change was the result of deliberate policy actions and was projected by CBO in 2010 with the enactment of the ACA and in 2011 with the enactment of the BCA. Together, these laws were projected to reduce Medicare spending on net by $65 billion in 2014, based on CBO estimates at the time.18 ,19 This explains about half of the difference between CBO’s 2009 projections of Medicare spending in 2014 and actual 2014 Medicare spending. Even after taking the savings attributed to the ACA and BCA into account, however, Medicare spending is still far lower in 2014 than CBO projected it would be in 2009.
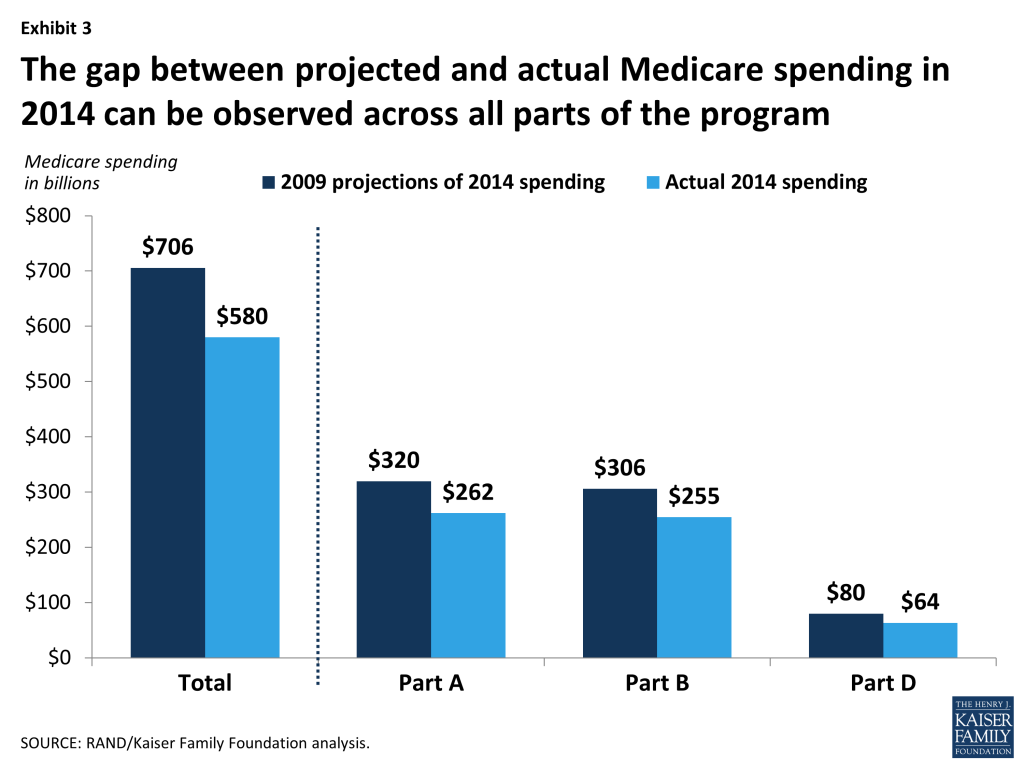
The difference between 2009 projections of Medicare spending in 2014 and actual spending this year can be observed across all parts of the program, including Part A (which covers inpatient hospital stays, skilled nursing facility stays, some home health visits, and hospice care), Part B (which covers physician visits, outpatient services, preventive services, and some home health visits), and Part D (which covers outpatient prescription drugs). (Spending on enrollees in private Medicare Advantage plans is included in the totals for Parts A, B, and D.) According to our analysis, Part A spending in 2014 is $58 billion lower than was projected in 2009, Part B spending is $51 billion lower, and Part D spending is $16 billion lower (Exhibit 3).20 In each of those parts, actual spending in 2014 is around 20 percent below the levels that were projected for 2014 by CBO in 2009.21
Exhibit 3: The gap between projected and actual Medicare spending in 2014 can be observed across all parts of the program
Explaining the Gap Between Projected and Actual Medicare Spending in 2014
Expected Effects of Changes in Medicare Policy Since 2009
In a program as large and complex as Medicare, three factors make it difficult to measure with any precision the spending effects of any specific policy change: 1) many aspects of the Medicare program are changing at the same time, 2) the program is embedded within a larger health care system that is also in flux, and 3) policy changes in one area of the program may have spillover or interaction effects with other areas. To make inroads in understanding the gap between the projected and actual spending amounts for 2014, we take the approach of using CBO’s estimates to quantify the effects of various policy changes on Medicare spending. In general, CBO estimates of savings are generally considered to be methodologically conservative in that they only credit savings if there is a clear and direct link from the policy to reduced spending. We take CBO’s estimates as a useful approximation of the direct effects of policy changes although, as we will point out, in some cases CBO’s estimates clearly missed the mark.
Based on our analysis, in 2010 CBO expected that the Medicare payment reductions in the ACA would reduce Medicare spending by $58 billion in 2014. The ACA also expanded benefits for prescription drugs and preventive services, which was expected to increase spending this year by around $4 billion, resulting in a net projected savings from the ACA of $54 billion in 2014 ($58 billion in savings minus $4 billion in new spending).22
In 2011, CBO projected that the BCA would reduce Medicare spending by $11 billion in 2014. Two other policy changes—a reduction in hospital payment rates in the American Taxpayer Relief Act of 2012 (ATRA) and competitive bidding for durable medical equipment—were projected to reduce Medicare spending by an estimated $4 billion this year. Taken together, these changes account for net savings of $69 billion in 2014, or more than half (55 percent) of the $126 billion gap between 2009 Medicare spending projections for 2014 and actual Medicare spending this year (See Appendix 2: Factors Related to Changes in Projected vs. Actual Medicare Spending in 2014).
The Affordable Care Act
The ACA, which was enacted in 2010, included a number of provisions designed to achieve Medicare savings:
Reductions in the growth in Medicare provider payment rates. The prices that Medicare pays to health care providers in the traditional (fee-for-service) program are determined by formulas spelled out in law. The ACA included numerous downward adjustments in these price formulas. These adjustments are “cuts” in the sense that prices have and will continue to grow more slowly as a result of the ACA, although they continue to rise in nominal terms. The most important price cuts in the ACA are the “productivity adjustments,” which are permanent and apply to all providers except physicians. The productivity adjustments reduce default year-over-year price updates to account for economy-wide productivity growth.23 The ACA also included a number of targeted cuts to provider payments, such as reductions of one percentage point in price updates for home health care each year from 2011 through 2013, and reductions in payment rates for advanced imaging.24 The savings from these cuts include the direct effects of lower prices paid in traditional Medicare, as well as indirect savings from reduced payments to Medicare Advantage plans.25 Taken altogether, these provisions were expected to reduce Medicare spending by $24 billion in 2014.
Reductions in Medicare payments to Medicare Advantage plans. Medicare Advantage plans provide services covered under Parts A and B of Medicare, and in many instances, prescription drugs covered under Part D. Medicare pays plans a fixed amount per enrollee. In 2009, the Medicare Payment Advisory Commission (MedPAC) estimated that Medicare payments per enrollee to Medicare Advantage plans were 114 percent of what spending would have been for those enrollees had they been covered under traditional Medicare, on average. The ACA modified the methodology for calculating benchmarks to reduce the gap in payment between Medicare Advantage and traditional Medicare. The payment reductions were scheduled to be phased in over a six-year period. As of 2014, the payment reductions have been fully implemented in more than half of all counties,26 and the ratio of payments to Medicare Advantage plans relative to traditional Medicare has declined from 114 percent to 106 percent.27 CBO expected these payment changes to reduce Medicare spending by $16 billion in 2014, although, as we describe below, unexpected growth in Medicare Advantage enrollment has offset some of the reduction in Medicare spending associated with the Medicare Advantage payment reductions in the ACA.28
Elimination of the Medicare Improvement Fund. Prior to the ACA, Congress maintained a sizeable “Medicare Improvement Fund” in the federal accounts, which acted as a reserve source of financing for the program for federal fiscal years 2014 and 2015. The ACA zeroed out this fund, contributing another $16 billion to the difference between projected and actual Medicare spending in 2014.
Other provisions of the ACA. The ACA launched a vast array of payment and delivery system reforms in the traditional Medicare program with the overarching goal of shifting the program from “paying for volume” to “paying for value.” These reforms include the creation of Accountable Care Organizations (ACOs) through the Medicare Shared Savings Program, authorization of the IPAB, quality-based payment incentives for physicians, hospitals, and Medicare Advantage plans, and enhanced program integrity efforts. The ACA also established the Patient-Centered Outcome Research Institute (PCORI) and the Center for Medicare & Medicaid Innovation (CMMI, or the “Innovation Center”), both of which are charged with testing new payment models and delivery systems. CBO generally scored little or no savings to the Medicare program from these reforms, and altogether they account for only around $2 billion of the expected Medicare savings from the ACA in 2014, based on CBO’s projections.
The ACA also included a number of provisions that were expected to increase Medicare spending in 2014:
The ACA gradually phases in coverage in the Medicare Part D prescription drug benefit’s coverage gap (the so-called ‘doughnut hole’) and enhanced coverage of and lower beneficiary cost sharing for preventive services. Taken together, these provisions were estimated by CBO to increase Medicare spending by $4 billion in 2014.
Taken together, CBO expected the net effect of the ACA on Medicare spending in 2014 would be a reduction of $54 billion this year.29
The Budget Control Act of 2011
Congress’s goal in enacting the BCA was not to reform the Medicare program, but instead to pressure itself and the President to agree on a sweeping, long-term deficit reduction plan. As an action-forcing mechanism, the BCA included across-the-board fallback cuts (“sequestration”) that were intended to be unpalatable. But, because Congress and the Administration did not reach a broader agreement on a deficit reduction plan, these cuts were implemented beginning in March 2013. As a result, Medicare payments to plans and providers were cut by two percent across-the-board beginning in 2013, and that two-percent reduction in Medicare price levels is scheduled to remain in place through 2023. CBO estimated that the BCA would reduce Medicare spending by $11 billion in 2014.
Medicare Savings from Other Policy Changes Implemented Since 2009
In addition to the ACA and the BCA, Congress and the Administration have made a number of smaller legislative and regulatory changes to the Medicare program since 2009. Two notable changes have contributed approximately $4 billion to the difference between projected and actual Medicare spending in 2014:
The American Taxpayer Relief Act of 2012 (ATRA) required CMS to reduce hospital payment rates to recoup overpayments resulting from coding “creep.” Coding creep refers to increases in patients’ severity of illness and treatment intensity that are due to changes in documentation rather than health status or care provided. CBO estimated that this adjustment would reduce Medicare spending by $2 billion in 2014.30
CMS has implemented a pilot program of competitive bidding for durable medical equipment (DME), with the goal of reducing unjustifiably high prices for some types of equipment. An initial pilot was launched in nine metropolitan areas in 2011, and that pilot program was expanded to 91 other metropolitan areas in 2013. The CMS actuary, based on an analysis of claims data through 2011, estimated that the competitive bidding program would reduce Medicare spending by $26 billion over the 10-year period from 2013 through 2022.31 Assuming this spending reduction is distributed evenly over the 10-year period, this would correspond to roughly $2 billion in lower spending in 2014.
Slower Growth in Prescription Drug Spending
Analysts have shown that the growth rate in overall prescription drug spending has been relatively low since 2003, and lower than in previous years.32 This slow growth rate has been reflected in slower growth in Medicare Part D spending than CBO projected when the drug benefit was established.33 Experts attribute that slowing to a number of “blockbuster” drugs coming off patent, and a shift to tiered formularies with cost-sharing differentials that steer patients from higher-priced generics to lower-priced generic substitutes. The Medicare Trustees, in their 2014 report, attribute the slow growth in Part D benefit payments to “… the larger-than-expected impact from the patent expiration for some high-cost drugs and the continual shift from brand-name to generic drugs.”34 According to our estimates of Medicare Part D spending, this slow growth in prescription drug spending accounts for roughly $16 billion of the difference between CBO’s 2009 projections of Medicare spending in 2014 and actual spending this year.
Unanticipated Effects of Changes in Medicare Policy
As mentioned above, CBO generally scored little or no savings to the Medicare program from the Medicare payment and delivery system reforms in the ACA, aside from the more straightforward reductions in provider payment rates. For example, Medicare ACOs were projected by CBO to reduce Medicare spending by only $300 million in 2014, less than one-tenth of one percent of total Medicare spending this year. In the case of ACOs, those expectations of very modest savings appear to be on target, according to recent data from CMS.35
There is some evidence, however, that some of the other payment and delivery system reforms in the ACA, along with other changes in Medicare policy, are altering providers’ behavior and reducing spending in ways that CBO did not anticipate, including lower spending associated with reductions in hospital readmissions, reductions in the area of home health services, and more aggressive program integrity efforts. Taken altogether, we estimate that these factors account for $16 billion of the difference between projected and actual Medicare spending in 2014.
Hospital readmissions have fallen. The ACA included several provisions targeting hospital readmission rates. One is the Hospital Readmission Reduction Program (HRRP), under which hospitals with high readmission rates began facing financial penalties in October 2012.36 As part of its estimate of the health reform law, CBO estimated $300 million in savings from this program. As it turns out, readmission rates have fallen sharply since 2011, and the Administration estimates an annual reduction of around 75,000 readmissions.37 Taking that number at face value, avoided readmissions this year translates to around $1 billion in Medicare savings in 2014,38 which implies additional savings around three times as large as CBO’s 2010 estimate of $300 million.39
Home health spending has fallen sharply. The ACA included several provisions that affect home health agencies,40 including payment rebasing, the productivity adjustments, and targeted cuts to prices for home health care, and a new requirement that physicians have a face-to-face encounter before certifying that a patient is eligible for home health care.41 The ACA also expanded “program integrity” (anti-fraud) activities and imposed stiffer penalties for Medicare fraud. In addition, the Medicare Fraud Strike Force, which predated the ACA and was first launched in Miami in 2007, was given enhanced funding and authority under the ACA and was expanded to other cities beginning in 2010.42 The anti-fraud provisions apply broadly, but according to the Department of Health and Human Services Office of Inspector General, “[home health agencies] are considered to be particularly vulnerable to fraud, waste, and abuse.”43
Prior to the ACA, home health spending was growing rapidly, and in 2010, CBO estimated that the payment reductions for home health care in the ACA would deflect the Medicare spending trajectory only slightly downward; $2 billion in lower spending from those price cuts are included in the expected spending reduction from the Medicare provider payment reductions discussed above. Beginning in 2010, however, home health spending slowed much more sharply than expected, with aggregate payments to home health agencies essentially flat and spending per traditional Medicare enrollee falling in nominal terms each year since then. CBO estimated home health savings of around $2 billion in 2014 from the ACA provisions, while we estimate the difference in projected versus actual home health spending in 2014 to be around $12 billion.44 In other words, home health spending in 2014 is $10 billion lower than projected by CBO in 2010, after taking into account the $2 billion ACA payment reductions in 2014.
Higher recoveries due to increased program integrity. The Medicare program has gradually strengthened its program integrity efforts in a number of ways. These include the nationwide expansion of the Recovery Audit Contractor (RAC) program in 2010,45 the localized Strike Forces described above, the increased penalties in the ACA, and a Fraud Prevention System designed to block improper payments before they go to the provider. The Government Accountability Office reports that the number of post-payment claims reviews grew by more than 50 percent from 2011 to 2012.46 The increased focus on program integrity also appears to have slowed home health spending growth, as described above.
Another visible effect of these program integrity efforts is an increase in recoveries from providers—that is, amounts paid by the Medicare program but then subsequently disallowed and recouped. In 2009, CBO projected that recoveries in the Medicare program would total $13 billion in 2014, but CBO now projects they will total $18 billion this year, a difference of $5 billion. What is impossible to judge is the extent to which the increased claims reviews are producing savings beyond those recovered amounts, by dissuading providers from submitting questionable claims in the first place. This “chilling effect” could be substantial, although it is not quantifiable.
Factors Related to Higher Medicare Spending
Not all of the trends and changes in the Medicare program since 2009 have led to lower spending in 2014 than CBO projected for this year back in 2009. Aside from the benefit improvements included in the ACA described above, two other changes are related to higher spending in 2014 than was anticipated in 2009:
Higher-than-expected Medicare enrollment. In 2009, CBO projected that enrollment in Part A (which includes traditional Medicare and Medicare Advantage enrollees) would rise to 52 million in 2014. Now, CBO is projecting enrollment of 54 million in Part A this year, a difference of 2 million beneficiaries, or roughly 4 percent. This higher-than-expected enrollment has almost certainly increased Medicare spending this year, although the size of the effect is unclear and depends on exactly which types of beneficiaries account for the higher enrollment. For example, Medicare enrollees ages 65 to 69 have relatively low spending per person, particularly if they have employment-based coverage and Medicare is a secondary payer, whereas older beneficiaries who are more likely to have multiple chronic conditions, have relatively high spending per person. In the absence of evidence to the contrary, we assume that the additional two million enrollees incur spending that is equal to the average spending per person in Medicare. Based on this assumption, Medicare’s higher-than-expected enrollment in 2014 accounts for roughly $19 billion in increased spending this year.47
Higher-than-expected Medicare Advantage enrollment. Another factor that has contributed to higher Medicare spending in 2014 is the unexpectedly robust enrollment in Medicare Advantage. As discussed earlier, the ACA reduced payments to Medicare Advantage plans, which CBO expected would lead to a roughly 25 percent drop in enrollment in Medicare Advantage in 2014. In fact, enrollment in Medicare Advantage increased between 2010 and 2014, both in absolute numbers (from 11 million to 16 million) and as a share of total Medicare enrollment (from 24 percent to 30 percent). The unexpected growth in Medicare Advantage enrollment affects total Medicare spending because Medicare payments for Medicare Advantage enrollees generally exceed what Medicare would spend on those individuals if they were enrolled in traditional Medicare. As noted above, MedPAC has estimated that the Medicare Advantage payment gap is now around 6 percent (down from 14 percent in 2009).48 The fact that Medicare Advantage enrollment in 2014 far exceeded CBO’s baseline projections in 2009 and 2010 results in an additional $4 billion in Medicare spending in 2014, according to our analysis.49 This is because the 2009 and 2010 projections assumed a larger number of beneficiaries would be covered under traditional Medicare in 2014, at a lower cost per person.
Together, these higher-than-expected enrollment trends can account for an increase of $27 billion in Medicare spending in 2014 that was not forecast back in 2009.
Other Factors that May Have Contributed to the Gap Between Projected and Actual Medicare Spending in 2014
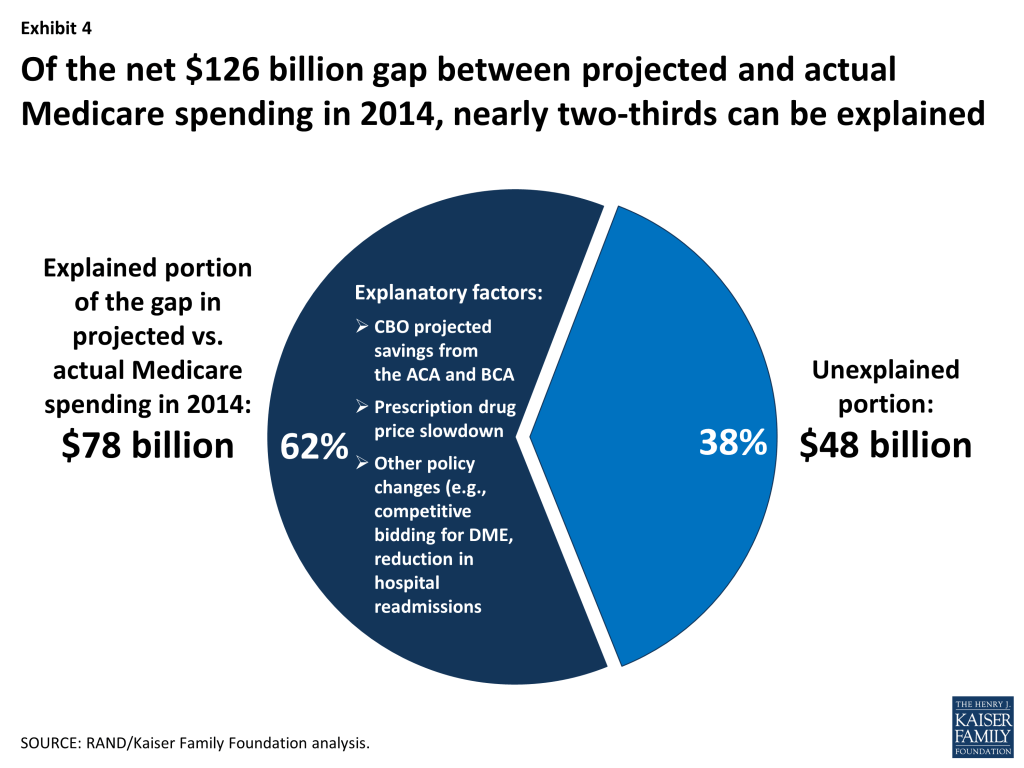
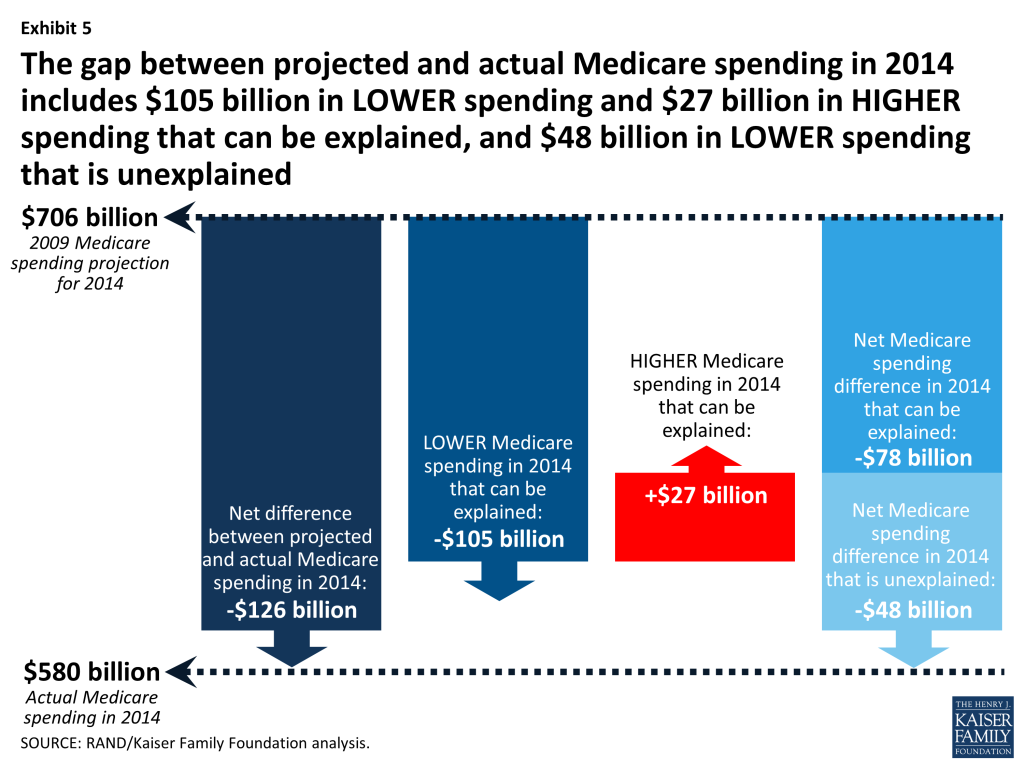
The net effect of the factors that we have quantified thus far account for only about three-fifths of the $126 billion gap between CBO’s 2009 projections for 2014 Medicare spending and actual Medicare spending this year: $105 billion in spending reductions and $27 billion in spending increases, for a net reduction of $78 billion in spending based on factors that can be attributed to specific changes we can identify and quantify. This leaves $48 billion unexplained (Exhibits 4 and 5).
Exhibit 4: Of the net $126 billion gap between projected and actual Medicare spending in 2014, nearly two-thirds can be explainedExhibit 5: The gap between projected and actual Medicare spending in 2014 includes $105 billion in LOWER spending and $27 billion in HIGHER spending that can be explained, and $48 billion in LOWER spending that is unexplained
Below we discuss several possible factors that could explain some or all of the $48 billion remainder, although it is not yet possible to quantify their specific contribution to the difference between projected and actual Medicare spending in 2014.
Certain provisions in the ACA may be having a greater-than-expected effect on Medicare spending that is not yet quantifiable. For example, the ACA required that the Secretary of Health and Human Services establish a “National Strategy for Quality Improvement in Health Care,”50 which CBO scored as having no impact on Medicare spending. One outgrowth of the National Strategy was the “Partnership for Patients”51 (P4P), a public-private partnership launched in 2011 that has been focusing on reducing hospital readmission rates and “hospital-acquired conditions” (HACs), including medication errors, post-surgical infections, and pressure ulcers. The Agency for Healthcare Research and Quality has reported that overall hospital-acquired condition rates dropped by nine percent from 2010 to 2012, which the Administration credits to the P4P.52 While a reduction in HACs would reduce Medicare spending and may have contributed to the gap in projected versus actual spending in 2014, the size of the impact is not clear.
Reductions in Medicare payment rates (prices) may have contributed to a reduction in utilization. The ACA and the BCA reduce the prices that Medicare pays providers for the services they provide. Some analysts believe that providers will make up for payment cuts by increasing volume, but a growing body of evidence links price reductions with reductions in the volume of services provided. Medicare price cuts have been associated with reduced volume of inpatient hospital stays,53 outpatient hospital visits,54 advanced imaging procedures,55 and skilled nursing facility days.56 It is, therefore, possible that the reductions in payment rates under the ACA and BCA are indirectly reducing utilization and spending.57
Coverage expansions for the nonelderly may be having a modest impact on use of services by Medicare beneficiaries. Coverage expansions have been shown, in some contexts, to reduce the utilization of services among continuously insured populations, such as Medicare beneficiaries.58 That type of displacement can occur when newly insured individuals seek care from a fixed pool of providers, and, as a result, providers shift some of their output to serve the newly insured. The ACA coverage expansions began on a small scale in 2010, and are taking full effect in 2014 with the expansions of Medicaid eligibility and availability of subsidized exchange coverage. It will take months or years for researchers to determine whether the ACA coverage expansions might have had this type of offsetting effect on utilization of services by Medicare beneficiaries, but we would expect the effect, if any, to be modest, if it occurs at all.
The “Great Recession” may have had indirect effects on Medicare spending. The sharp economic downturn that began in December 2007 resulted in massive losses of employment, income, and employment-based health coverage among the non-elderly.59 As discussed earlier, many analysts have attributed the recent slow growth rate in overall health spending partly to these effects of the Great Recession. But Medicare beneficiaries were largely shielded from those direct effects because they maintained their health care coverage, including, for most beneficiaries, supplemental coverage that covers most out-of-pocket liabilities. The elderly did experience declines in income, housing wealth, and liquid assets from 2008 to 2010, but those losses do not appear to be associated with reductions in utilization of health care services.60
It is possible that the recession may have had a more indirect effect on Medicare spending, but there is little evidence to support this hypothesis. For example, the recession clearly limited hospitals’ revenues and access to capital, and appears to have slowed their investment in new facilities and equipment.61 That reduction in capital investment could have, in turn, limited the supply of services available to treat Medicare beneficiaries, which could have contributed to a reduction in hospital spending. But, at the same time, unemployment and uninsurance among the nonelderly population could have prompted providers to increase the share of their output going to Medicare beneficiaries, which could have increased Medicare spending.62 Thus, while the Great Recession may have affected Medicare spending, the possible net effects are uncertain.
Medicare may be affected by spillovers from broader health care trends. The health care system is undergoing many changes that could be indirectly affecting spending trends in the Medicare program, including the adoption of alternative payment approaches, increased adherence by medical professionals to treatment guidelines, and an increased role for patients in care decisions.
Alternative payment approaches. Alternative payment approaches include value-based purchasing, pay-for-performance bonuses, episode-based or “bundled” payments, and global payments capitation. As these payment approaches are being tested in Medicare, similar developments are occurring in commercial health plans and Medicaid.63 The broader application of these payment approaches by other purchasers may reinforce the changes in Medicare and contribute to slowing the growth of Medicare spending.
Treatment guidelines. There is a growing movement among medical professionals to embrace “parsimonious care” as an ethical obligation, which has been defined as “practic[ing] effective and efficient health care and…us[ing] health care resources responsibly.”64 One prominent force in this movement is the ABIM Foundation’s “Choosing Wisely” campaign, which began in 2011 with top 5 “don’t do” lists for primary care physicians.65 To the extent that more physicians are adhering to such treatment guidelines, this could have the effect of reducing the amount or type of services provided to Medicare beneficiaries, which may affect overall program spending.
Increased role for patients. Patients are increasingly being encouraged or expected to factor the cost of services into their utilization decisions and to shop around for providers offering the best combination of price and quality, and there is growing interest in efforts to increase the availability of health care price and quality data.66 Although Medicare beneficiaries are not directly affected by these trends, consumerism might indirectly impact Medicare beneficiaries if providers recommend lower-cost treatment protocols or refer their patients to lower-cost settings (e.g., an ambulatory surgical center instead of a hospital outpatient department for advanced imaging).
Conclusion
Much has been written about the slow growth in Medicare spending in recent years. This analysis aims to elaborate on the factors behind the gap between CBO’s 2009 projections of what Medicare spending would be in 2014 and actual 2014 spending. Our analysis shows that policy choices make a difference: the ACA and BCA, along with various policies adopted by the Administrations, account for most of the $126 billion difference between CBO’s 2009 Medicare spending projections for 2014 and actual spending this year. Yet, even after taking into account Medicare spending reductions included in the ACA and BCA, additional savings associated with slower-than-expected growth in drug spending and other changes for which we could find solid evidence of savings, we are still unable to explain what accounts for more than one-third of the gap between projected and actual spending for 2014.
Three significant questions remain. The first is how to explain the remaining portion of the gap between projected and actual spending this year that is, as yet, unexplained. There are several possible factors that we have discussed, but they are difficult or impossible to test and quantify. The second question is how beneficiaries have been affected by the historically low rate of Medicare spending growth. From a financial standpoint, slower spending growth has clearly benefitted beneficiaries by limiting their cost sharing and premium liabilities, but the effects on quality and access to care are more difficult to assess. The third question is whether slow growth in Medicare spending can and will be sustained. Our analysis suggests that the answer to this question depends in large part on future policy choices.
This brief was prepared by Juliette Cubanski and Tricia Neuman from the Kaiser Family Foundation, and Chapin White of the RAND Corporation.
Appendix
Appendix 1: Methodology
For this analysis, “Medicare spending” is defined as payments by the Medicare program for covered services, excluding the costs of administering the program. This spending amount does not include an offset for Part B premium payments (so-called “offsetting receipts”), but does include an offset for amounts paid to providers and subsequently recovered by the program due to improper documentation or some other reason. The years are federal fiscal years (October through September), and spending is adjusted to smooth out unevenness from year to year in the number of capitation payments to Medicare Advantage plans and Part D plans.67
Projected Medicare spending for 2014 is taken from CBO’s March 2009 baseline,68 with an upward adjustment applied to Part B spending on physician services to reflect a physician fee freeze.69 That 2009 projection takes into account the increase in the number of enrollees in the program due to the aging of the “baby boomer” generation, and the shift in enrollment toward a relatively younger population.
Actual spending in 2014 is from the September 2014 issue of the Monthly Treasury Statement, which covers the 2014 fiscal year (October-September).70 The difference between the two estimates—the 2009 spending projection for 2014 and the 2014 actual spending amount—serves as the focus of the analysis of the Medicare spending gap that we attempt to explain in this paper. We use the same methodology to quantify the difference in projected versus actual spending separately for Parts A, B, and D. For each of those parts, we compared CBO’s 2009 projected Medicare spending in 2014 versus actual 2014 spending from the Monthly Treasury Statement.
Chappel et al. (2014) take an alternative approach to quantifying the Medicare spending slowdown. They first measure the historical average annual growth in Medicare spending per enrollee excluding Part D from 2000-2008 (6.3 percent), and then create a benchmark by applying that growth rate from 2008 forward. That approach results in projected spending in 2014 that is even higher than the method we use. One difference between the approaches lies in the fact that using historical average growth rates implicitly assumes that the Medicare program will continue to be changed in ways that are similar to the ways it has been changed in the past, while using CBO’s projections (as we do) assumes that the Medicare program will remain unchanged during the projection period.
Appendix 2: Factors Related to Changes in Projected Versus Actual Medicare Spending in 2014
Factor
Estimate of Medicare spending effect
Source of estimate
PROJECTED MEDICARE SPENDING IN 2014 (BASED ON 2009 ESTIMATES)
$706 BILLION
Author’s analysis of CBO (2009a, 2009b)
ACTUAL MEDICARE SPENDING IN 2014
$580 BILLION
Author’s analysis of CBO (2014) and Treasury (2014)
DIFFERENCE
$126 BILLION
FACTORS RELATED TO LOWER MEDICARE SPENDING IN 2014
Effect on Medicare Spending in 2014
CBO projected savings from the ACA and BCA
ACA: Fee-for-service price cuts
$24 billion spending reduction
Author’s analysis of CBO (2010)
ACA: Medicare Advantage cuts
$16 billion spending reduction
Author’s analysis of CBO (2010)
ACA: Elimination of Medicare Improvement Fund
$16 billion spending reduction
Author’s analysis of CBO (2010)
ACA: Payment and delivery system reform
$2 billion spending reduction
Author’s analysis of CBO (2010)
BCA: Fee-for-service price cuts (sequestration)
$11 billion spending reduction
CBO (2011)
SUBTOTAL
$69 billion spending reduction
Other policy changes
ATRA: Recoupment of coding “creep”
$2 billion spending reduction
CBO (2013)
MMA and ACA: Competitive bidding for durable medical equipment
$2 billion spending reduction
Author’s analysis based on CMS (2012)
SUBTOTAL
$4 billion spending reduction
Prescription drugs
Unexpectedly slow growth in prescription drug spending
$16 billion spending reduction
Author’s analysis based on Medicare Trustees reports (2013 and 2014)
SUBTOTAL
$16 billion spending reduction
Unanticipated effects of changes in Medicare policy
Reduction in hospital readmissions
$1 billion spending reduction
DHHS (2014)
Reductions in home health utilization
$10 billion spending reduction
Author’s analysis
Increased recoveries from providers
$5 billion spending reduction
Author’s analysis of CBO (2009 and 2014)
SUBTOTAL
$16 billion spending reduction
SUBTOTAL: Factors related to lower Medicare spending
$105 billion spending reduction
FACTORS RELATED TO HIGHER MEDICARE SPENDING IN 2014
ACA benefit expansions
$4 billion spending increase
Author’s analysis of CBO (2010)
Unexpected growth in overall enrollment
$19 billion spending increase
Author’s analysis
Unexpected growth in enrollment in Medicare Advantage
$4 billion spending increase
Author’s analysis
SUBTOTAL: Factors related to higher Medicare spending
$27 billion spending increase
SUBTOTAL: EXPLAINED FACTORS
$78 billion spending reduction
RESIDUAL: Unexplained factors related to lower Medicare spending
$48 billion spending reduction
SOURCES: CBO, 2009a, CBO’s March 2009 Baseline: MEDICARE; CBO, 2009b, “A Preliminary Analysis of the President’s Budget and an Update of CBO’s Budget and Economic Outlook,” March 2009; CBO, 2010, “Cost estimate for the amendment in the nature of a substitute for H.R. 4872, incorporating a proposed manager’s amendment made public on March 20, 2010;” CMS, Competitive Bidding Update—One Year Implementation Update, April 17, 2012; CBO, Estimated Impact of Automatic Budget Enforcement Procedures Specified in the Budget Control Act, September 12, 2011; CBO, Detail on Estimated Budgetary Effects of Title VI (Medicare and Other Health Extensions) of H.R. 8, the American Taxpayer Relief Act of 2012, as passed by the Senate on January 1, 2013, January 1, 2013; CBO, 2014, “Congressional Budget Office’s April 2014 Medicare Baseline.” U.S. Department of Health and Human Services, 2014, “New HHS Data Shows Major Strides Made in Patient Safety, Leading to Improved Care and Savings;” U.S. Department of the Treasury, Monthly Treasury Statement of Receipts and Outlays of the United States Government for Fiscal Year 2014 Through September 30, 2014, and Other Periods.
Endnotes
See for example: Orszag, P. R., and P. Ellis. 2007. “Addressing Rising Health Care Costs—A View from the Congressional Budget Office.” New England Journal of Medicine 357(19), 1885-87; Orszag, P. R., and P. Ellis. 2007. “The Challenge of Rising Health Care Costs—A View from the Congressional Budget Office.” New England Journal of Medicine 357(18), 1793-95; U.S. Government Accountability Office. 2007. “Health Care 20 Years from Now: Taking Steps Today to Meet Tomorrow’s Challenges “, http://www.gao.gov/assets/210/203207.pdf. ↩︎
Roehrig, Charles, Ani Turner, Paul Hughes-Cromwick, and George Miller, “When the Cost Curve Bent — Pre-Recession Moderation in Health Care Spending,” New England Journal of Medicine, Vol. 367, No. 7, August 16, 2012, pp. 590-593. ↩︎
See for example: Dranove, D., C. Garthwaite, and C. Ody. 2014. “Health Spending Slowdown Is Mostly Due To Economic Factors, Not Structural Change In The Health Care Sector.” Health Affairs 33(8), 1399-406; Cuckler, G. A., A. M. Sisko, S. P. Keehan, S. D. Smith, A. J. Madison, J. A. Poisal, C. J. Wolfe, J. M. Lizonitz, and D. A. Stone. 2013. “National Health Expenditure Projections, 2012–22: Slow Growth Until Coverage Expands And Economy Improves.” Health Affairs 32(10); Levitt, Larry, Gary Claxton, Charles Roehrig, and Thomas Getzen, Assessing the Effects of the Economy on the Recent Slowdown in Health Spending, April 22, 2013. https://modern.kff.org/health-costs/issue-brief/assessing-the-effects-of-the-economy-on-the-recent-slowdown-in-health-spending-2/. ↩︎
In 2008, total Medicare spending was $445 billion and there were 44.4 million beneficiaries (both from CBO’s March 2009 Medicare baseline). CBO projected in 2009 that the number of beneficiaries would grow to 51.9 billion in 2014. We measured average annual rates of growth in Medicare spending per beneficiary on Parts A and B over four historical periods: 2000-2008 (6.4%), 1995-2008 (5.1%), 1990-2008 (6.1%), and 1985-2008 (6.3%). (From the Medicare Trustees. 2014. “2014 Annual Report Of The Boards Of Trustees Of The Federal Hospital Insurance And Federal Supplementary Medical Insurance Trust Funds.” http://www.cms.gov/Research-Statistics-Data-and-Systems/Statistics-Trends-and-Reports/ReportsTrustFunds/Downloads/TR2014.pdf.) Projected spending in 2014 equals $445 billion*(51.9/44.4)*((1+g )^(2014-2008)), where g equals the historical growth rate. This yields projected spending of $753 billion (g=0.064, 2000-2008), $702 billion (g=0.051, 1995-2008), $740 billion (g=0.061, 1990-2008), and $750 billion (g=0.063, 1985-2008). ↩︎
Congressional Budget Office, Cost estimate for the amendment in the nature of a substitute for H.R. 4872, incorporating a proposed manager’s amendment made public on March 20, 2010, March 20, 2010, http://www.cbo.gov/ftpdocs/113xx/doc11379/AmendReconProp.pdf. ↩︎
The savings for Parts A, B, and D are calculated by comparing: 1) CBO’s projections in March 2009 of benefit payments in each part of the program (with recovered amounts allocated proportionally, and with Part B benefit payments increased to reflect an “SGR fix”) with 2) actual benefit payments using FY 2014 outlays from the September 2014 Monthly Treasury Report. See U.S. Department of the Treasury, Monthly Treasury Statement of Receipts and Outlays of the United States Government for Fiscal Year 2014 Through September 30, 2014, and Other Periods, http://www.fiscal.treasury.gov/fsreports/rpt/mthTreasStmt/mts0914.pdf. ↩︎
Loren Adler and Adam Rosenberg have reported that “Part D has accounted for over 60 percent of the slowdown in Medicare benefits since 2011” (See Adler, L., and A. Rosenberg. 2014. “The $500 Billion Medicare Slowdown: A Story About Part D.” Health Affairs Blog, http://healthaffairs.org/blog/2014/10/21/the-500-billion-medicare-slowdown-a-story-about-part-d/). Adler and Rosenberg’s analysis differs in two key ways from our analysis. First, to quantify the Medicare spending slowdown, they compare CBO’s March 2011 baseline with CBO’s April 2014 baseline. The March 2011 baseline already incorporates the projected savings in Parts A and B from the ACA. Second, they do not adjust the March 2011 baseline to reflect the anticipated effect of the SGR fixes. ↩︎
For CBO’s score of the ACA, see Congressional Budget Office. 2010. “Cost estimate for the amendment in the nature of a substitute for H.R. 4872, incorporating a proposed manager’s amendment made public on March 20, 2010.” http://www.cbo.gov/ftpdocs/113xx/doc11379/AmendReconProp.pdf. The $54 billion in savings is larger than the $42 billion reported by CBO for 2014 for “Medicare and Other Medicaid and CHIP Provisions.” The difference between $54 billion and $42 billion reflects the fact that we are focusing on Medicare spending, whereas CBO’s estimated $42 billion reflects the estimated effect of the Medicare provisions on net outlays, which includes an offset for reduced collections of beneficiary premium payments. ↩︎
This analysis follows CBO’s general approach of including indirect savings in the Medicare Advantage program in the savings attributed to changes in fee-for-service prices. For example, CBO notes in its 2014 score of the “SGR Repeal and Medicare Beneficiary Improvement Act of 2013” (http://cbo.gov/sites/default/files/cbofiles/attachments/s1871.pdf): “Payments to Medicare Advantage (MA) plans are based on underlying fee-for-service (FFS) costs, so CBO estimates an interaction between changes in FFS spending and MA plan payments. … Most estimates in the preceding table incorporate the effect of changes in FFS spending on MA spending …” ↩︎
In 2009, CBO projected that there would be 12 million enrollees in Medicare Advantage plans in 2014, and that Medicare would spend a total of $155 billion on Medicare Advantage, or $12,600 per enrollee. Based on CBO’s most recent projections, actual spending on Medicare Advantage will total $156 billion in 2014, which almost exactly matches the total projected in 2009. That near match reflects two major offsetting factors: enrollment in Medicare Advantage is much higher than was projected in 2009—16 million beneficiaries rather than 12 million—and spending per enrollee is much lower than was projected in 2009—$9,600 rather than $12,600. If CBO has projected that Medicare Advantage enrollment would increase to 16 million in 2014 when estimating the effects of the ACA Medicare Advantage payment reductions, rather than decline to 9 million, CBO’s projected Medicare baseline for 2014 would have been higher, as would their estimates of savings attributable to the Medicare Advantage payment reductions that year; quantifying these effects is beyond the scope of this analysis. ↩︎
CBO’s 2010 score of the ACA reports that the Medicare provisions would reduce the deficit by $43 billion. That total is smaller than the $54 billion net reduction in Medicare spending. The effect on the deficit is smaller than the effect on spending because the deficit effect includes an offset for reduced premium payments (i.e. “offsetting receipts”). ↩︎
Congressional Budget Office, “Competition and the Cost of Medicare’s Prescription Drug Program,” July 30, 2014, http://www.cbo.gov/publication/45552; Medicare Trustees, 2014 Annual Report Of The Boards Of Trustees Of The Federal Hospital Insurance And Federal Supplementary Medical Insurance Trust Funds. ↩︎
Medicare Trustees, 2014 Annual Report Of The Boards Of Trustees Of The Federal Hospital Insurance And Federal Supplementary Medical Insurance Trust Funds, page 105. ↩︎
Based on historical data on program payments per discharge and estimates by the Medicare Trustees of increases in prices per discharge, average spending per inpatient hospital discharge is just over $12,000 this year. ↩︎
The full effects of avoided readmissions on total Medicare spending will depend on spillover effects on services that are substitutes (e.g. emergency department visits), as well as complements (e.g. post-acute rehabilitation services). While the rate of hospital readmissions has declined since 2010, the rate of emergency department visits has increased, as has the rate of “observation stays,” meaning . This suggests that emergency department visits and observation stays might be substituting for at least some of the avoided readmissions, and that savings to the Medicare program might be smaller than $1 billion. But, Gerhardt et al. (2014) report that “our analysis of Medicare claims data does not suggest that the overall reduction in Medicare readmission rates that occurred in 2012 was primarily the result of greater use of outpatient ED visits or observation stays.” (Gerhardt, G., A. Yemane, K. Apostle, A. Oelschlaeger, E. Rollins, and N. Brennan. 2014. “Evaluating Whether Changes in Utilization of Hospital Outpatient Services Contributed to Lower Medicare Readmission Rate.” Medicare & Medicaid Research Review 4(1), E1-E13.) ↩︎
The relevant ACA sections are: productivity adjustments (Sec. 3401), targeted cuts to prices for home health care (Sec. 3131), a new requirement that physicians have a face-to-face encounter before certifying that a patient is eligible for home health care (Sec. 6407), expanded “program integrity” (anti-fraud) activities (Secs. 6402 and 6411), and stiffer penalties Medicare fraud (Secs. 6408 and 10606). ↩︎
In 2009, CBO projected that home health spending per enrollee in traditional Medicare would be $732 in 2014. CBO’s most recent projections of home health spending per enrollee in 2014 are $500. When multiplied by 54 million enrollees, the change in home health spending ($500 versus $732) has reduced total Medicare spending by $12.5 billion (this estimate includes the Medicare Advantage interaction). ↩︎
U.S. Government Accountability Office, Medicare Program Integrity: Increasing Consistency of Contractor Requirements May Improve Administrative Efficiency, July 2013, http://www.gao.gov/assets/660/656132.pdf. ↩︎
The additional spending from higher enrollment equals $12,000 spending per enrollee multiplied by 1.6 million additional enrollees. ↩︎
Medicare Payment Advisory Commission, Medicare Payment Policy, March 2009; Medicare Payment Advisory Commission, Medicare Payment Policy, March 2014. ↩︎
In 2010, after the enactment of the ACA, CBO projected that 18 percent of Medicare enrollees would be in Medicare Advantage in 2014. Based on the most recent Medicare Trustees report, the actual share of enrollees in Medicare Advantage in 2014 is around 30 percent, which is 12 percentage points higher than CBO projected in 2010. The estimated spending impact of higher-than-expected enrollment in Medicare Advantage equals 12 percent (i.e. 30 percent minus 18 percent) of enrollees multiplied by the 6 percent payment gap multiplied by total spending of $580 billion. This estimate is our best approximation of the added Medicare spending due to higher-than-expected Medicare Advantage enrollment; calculating the exact amount would require knowing the counties in which those additional Medicare Advantage enrollees live and the difference between Medicare Advantage and traditional Medicare spending in those counties and for those individual enrollees. ↩︎
U.S. Department of Health and Human Services. 2012. “National Strategy for Quality Improvement in Health Care.” ↩︎
The Administration describes the Partnership for Patients as “a public-private partnership working to improve the quality, safety and affordability of health care for all Americans.” See Centers for Medicare & Medicaid Services, 2014, “Partnership for Patients,” http://innovation.cms.gov/initiatives/partnership-for-patients/. ↩︎
See the rightmost column in Table 7, Dafny, L. S. 2005. “How Do Hospitals Respond to Price Changes?” American Economic Review 95(5), 1525-47; White, C., and N. Nguyen. 2011. “How Does the Volume of Post-Acute Care Respond to Changes in the Payment Rate?” Medicare & Medicaid Research Review 3(1), E1-E22, http://dx.doi.org/10.5600/mmrr.001.03.a01. ↩︎
He, D., and J. M. Mellor. 2012. “Hospital volume responses to Medicare’s Outpatient Prospective Payment System: Evidence from Florida.” Journal of Health Economics 31, 730–43; He, D., and J. M. Mellor. 2013. “Do Changes in Hospital Outpatient Payments Affect the Setting of Care?” Early View, http://onlinelibrary.wiley.com/doi/10.1111/1475-6773.12069/full. ↩︎
Levin, David C., Vijay M. Rao, and Laurence Parker, “Trends in the Utilization of Outpatient Advanced Imaging After the Deficit Reduction Act,” Journal of the American College of Radiology, Vol. 9, No. 1, January, 2012, pp. 27-32. http://www.sciencedirect.com/science/article/pii/S1546144011004844. ↩︎
White, C., and T. Yee. 2013. “When Medicare Cuts Hospital Prices, Seniors Use Less Inpatient Care.” Health Affairs 32(10), 1789–95. ↩︎
In the market for physician services, the evidence on the effects of price changes on volume is more mixed. An early generation of studies found that Medicare price cuts appeared to increase the volume of services provided (the so-called “volume offset”). For example, see Nguyen, X. N., and F. W. Derrick. 1997. “Physician Behavioral Response to a Medicare Price Reduction.” Health Services Research 32(3), 283-98; and Yip, W. C. 1998. “Physician Response to Medicare Fee Reductions: Changes in the Volume of Coronary Artery Bypass Graft (CABG) Surgeries in the Medicare and Private Sectors.” Journal of Health Economics 17(6), 675-99. Also a recent study shows evidence of a volume offset in the provision of chemotherapy (Jacobson, Mireille, Tom Y. Chang, Joseph P. Newhouse, and Craig C. Earle, Physician Agency and Competition: Evidence from a Major Change to Medicare Chemotherapy Reimbursement Policy, NBER, July, 2013. http://www.nber.org/papers/w19247). But, most recent studies suggest that the market for physician services operates like a typical market, and that reduced prices for physician services lead to reduced physician labor supply, and reduced volume of physician services provided. For example, see Staiger, D. O., D. I. Auerbach, and P. I. Buerhaus. 2010. “Trends in the Work Hours of Physicians in the United States.” Journal of the American Medical Association 303(8), 747-53; and Dunn, A., and A. H. Shapiro. 2012. “Physician Market Power and Medical-Care Expenditures,” http://www.bea.gov/papers/pdf/physician_market_power_and_medical_care.pdf. ↩︎
See for example: Stewart, W. H., and P. E. Enterline. 1961. “Effects of the National Health Service on Physician Utilization and Health in England and Wales.” New England Journal of Medicine 265, 1187-94; Enterline, P. 1973. “The Distribution of Medical Services before and after ‘Free’ Medical Care — The Quebec Experience.” New England Journal of Medicine 289, 1174-78; Bond, A. M., and C. White. 2013. “Massachusetts Coverage Expansion Associated with Reduction in Primary Care Utilization among Medicare Beneficiaries.” Health Services Research 48(6pt1), 1826-39. Also, the expansion of coverage when Medicare was established in the 1960s has been linked to an increase in spending on hospital services among the nonelderly; see Finkelstein, Amy, “The Aggregate Effects of Health Insurance: Evidence from the Introduction of Medicare,” Quarterly Journal of Economics, Vol. 122, No. 1, 2007, pp. 1-37. That type of positive spending spillover from a coverage expansion may be a historical artifact that does not apply to the current coverage expansions—Medicare’s payments to hospitals at the time the program was established were extremely generous, and supported broad-based expansions in capacity and staffing. ↩︎
White, C., and J. D. Reschovsky. 2012. “Great Recession Accelerated Long-Term Decline of Employer Health Coverage.” National Institute for Health Care Reform, Number 8, Online: http://www.nihcr.org/Employer_Coverage.pdf. ↩︎
Levine and Buntin, “Why Has Growth in Spending for Fee-for-Service Medicare Slowed?” ↩︎
McInerney, M. P., and J. M. Mellor. 2012. “State Unemployment In Recessions During 1991–2009 Was Linked To Faster Growth In Medicare Spending ” Health Affairs 31(11), 2464-73. ↩︎
See for example: Song, Z., D. G. Safran, B. E. Landon, M. B. Landrum, Y. He, R. E. Mechanic, M. P. Day, and M. E. Chernew. 2012. “The ‘Alternative Quality Contract,’ Based On A Global Budget, Lowered Medical Spending And Improved Quality.” Health Affairs 31(8), 1-10; Grossman, J., H. Tu, and D. Cross. 2013. “Arranged Marriages: The Evolution of ACO Partnerships in California,” http://www.chcf.org/~/media/MEDIA%20LIBRARY%20Files/PDF/A/PDF%20ArrangedMarriagesACOsCalifornia.pdf; Newcomer, L. N. 2012. “Changing Physician Incentives For Cancer Care To Reward Better Patient Outcomes Instead Of Use Of More Costly Drugs.” Health Affairs 31(4), 780-85; Hussey, P. S., A. W. Mulcahy, C. Schnyer, and E. C. Schneider. 2012. “Bundled Payment: Effects on Health Care Spending and Quality,” Agency for Healthcare Research and Quality, Number 208, http://www.effectivehealthcare.ahrq.gov/ehc/products/324/1235/EvidenceReport208_CQGBundledPayment_FinalReport_20120823.pdf. ↩︎
Snyder, L. 2012. “American College of Physicians Ethics Manual: Sixth Edition.” Annals of Internal Medicine 156(1, Part 2), p. 86. ↩︎
As was widely expected in 2009, the physician fee cuts called for under the Sustainable Growth Rate (SGR) formula were overridden each year from 2010 through 2014. Therefore, to calculate CBO’s projected Medicare spending in 2010 through 2014, we added the estimated increase in Medicare spending from overriding the SGR. The spending increase from overriding the SGR was based on the President’s 2009 budget, which proposed to freeze physician fees at the 2009 level, as reported in Congressional Budget Office. 2009. “A Preliminary Analysis of the President’s Budget and an Update of CBO’s Budget and Economic Outlook.” http://www.cbo.gov/sites/default/files/cbofiles/ftpdocs/100xx/doc10014/03-20-presidentbudget.pdf. The spending increase reported by CBO includes an offset for changes in Part B premium payments. Therefore, we divided the spending increase reported by CBO by one minus 0.25 (the approximate share of Part B spending financed by beneficiary premium payments). ↩︎
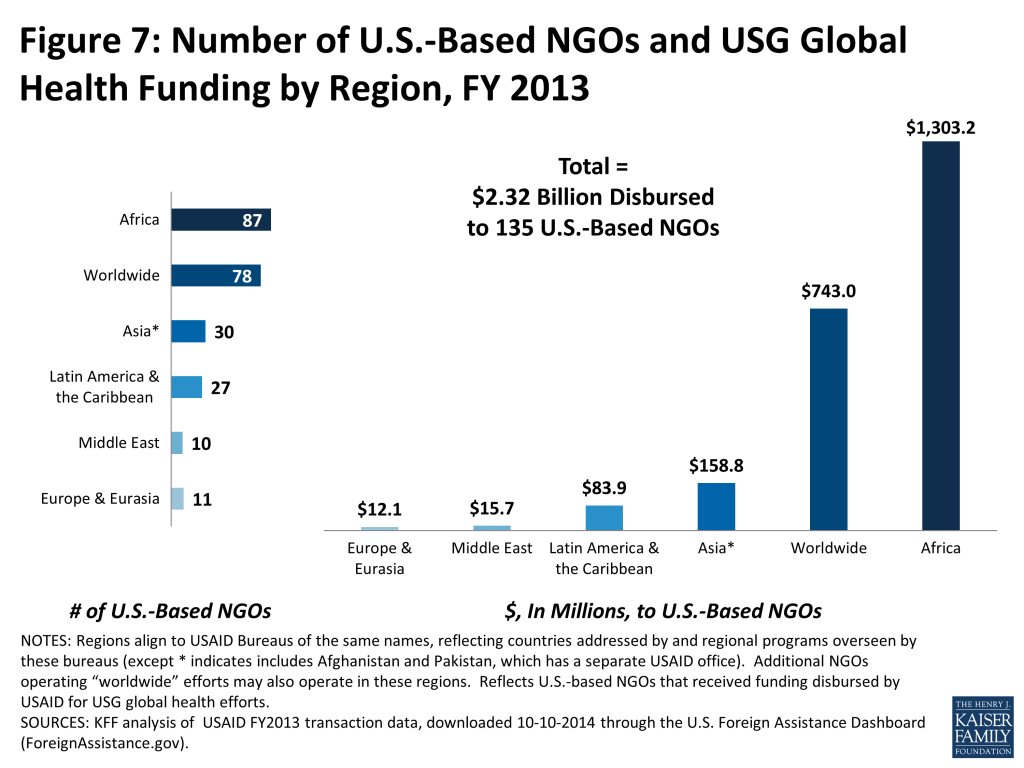
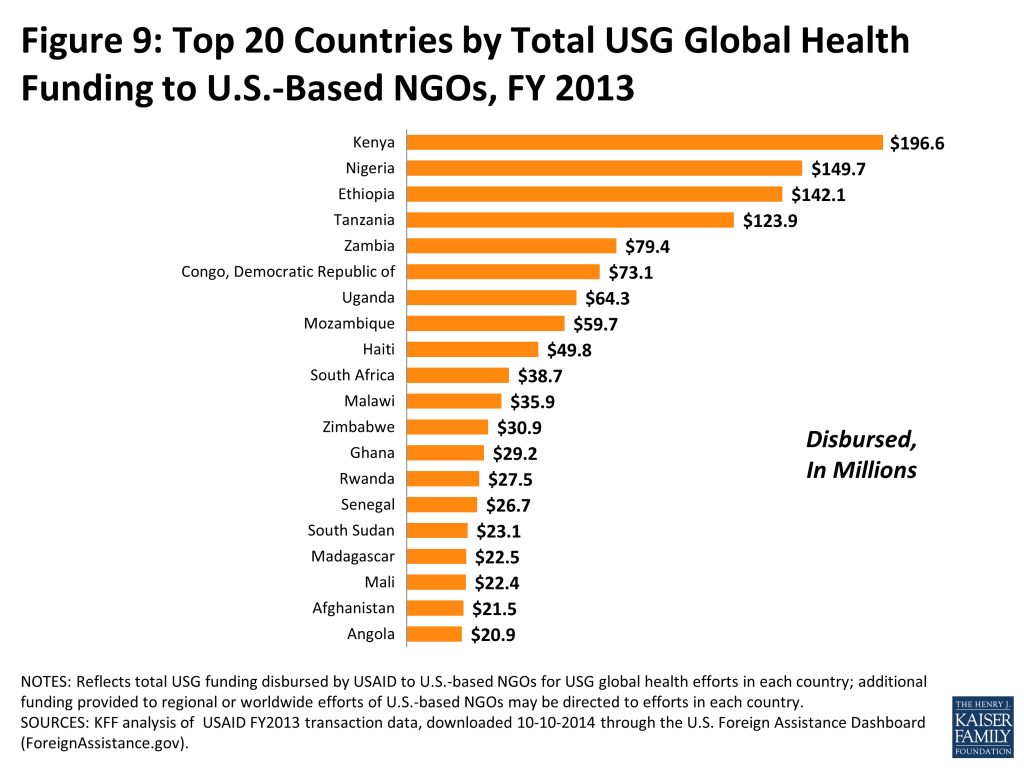
A new Kaiser Family Foundation report finds 135 different U.S.-based non-governmental organizations (NGOs) received U.S. Agency for International Development (USAID) funding in 2013 to implement U.S. global health programs on the ground. The report aims to shed light on the extent of the role of NGOs in carrying out U.S. global health programs. Ninety-one percent of the funding went to 20 NGOs.
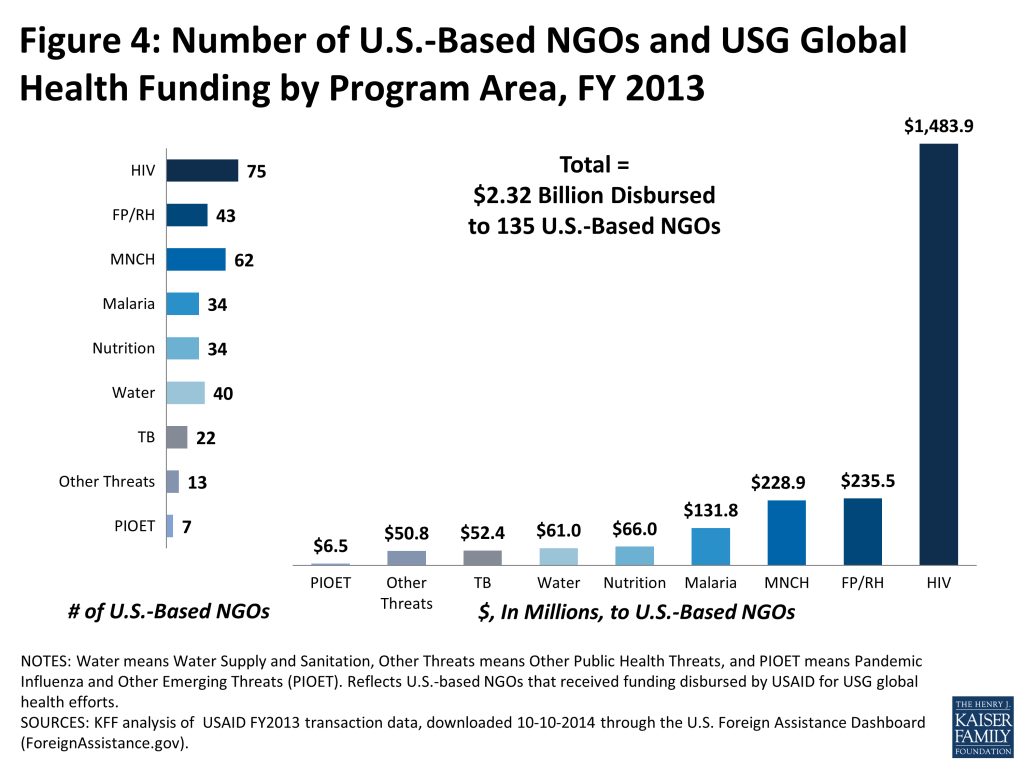
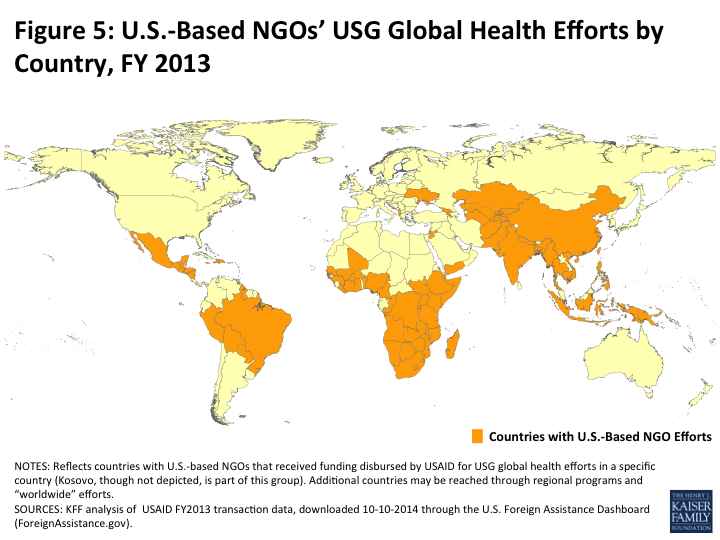
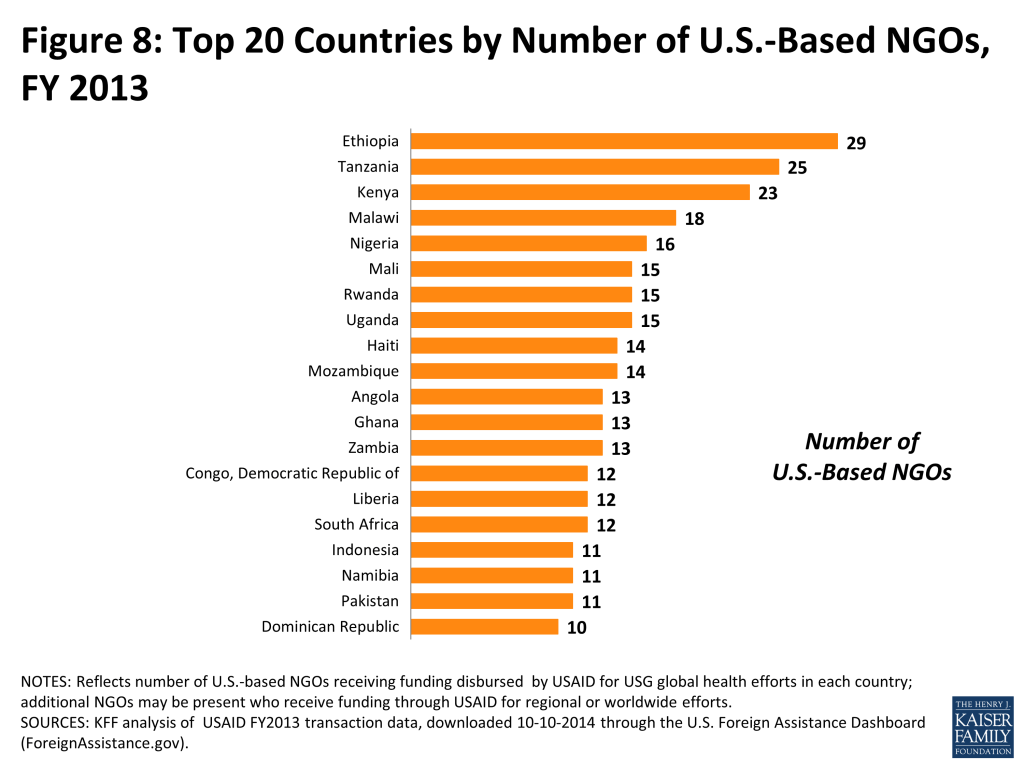
NGOs received more than a third of the agency’s global health spending and carried out global health efforts in all major U.S. global health program areas, across 72 countries, and in multiple regions – though mainly in Africa, which had more NGOs than all other regions combined. NGO efforts related to HIV received the highest overall amount of funding and involved the largest number of NGOs, while NGO efforts related to family planning/reproductive health and maternal, newborn, and child health received the next highest amounts of funding and also involved large numbers of NGOs.
Non-governmental organizations (NGOs) are key partners in U.S. global health efforts. Indeed, a significant share of U.S. government funding for global health is channeled to NGOs, who act as program implementers on the ground. To date, however, little information has been available about the extent of their role in carrying out U.S. global health programs. To help fill this void, this report provides an analysis of U.S.-based NGOs that received global health funding from the U.S. government (USG) during FY 2013. It specifically focuses on funding provided to NGOs by the U.S. Agency for International Development (USAID), the largest implementer of global health activities among USG agencies and departments. The focus on USAID is due both to the availability of data from this agency and the fact that USAID spending represents the majority of bilateral U.S. global health spending.1 Key findings include (also see Table 1 below):
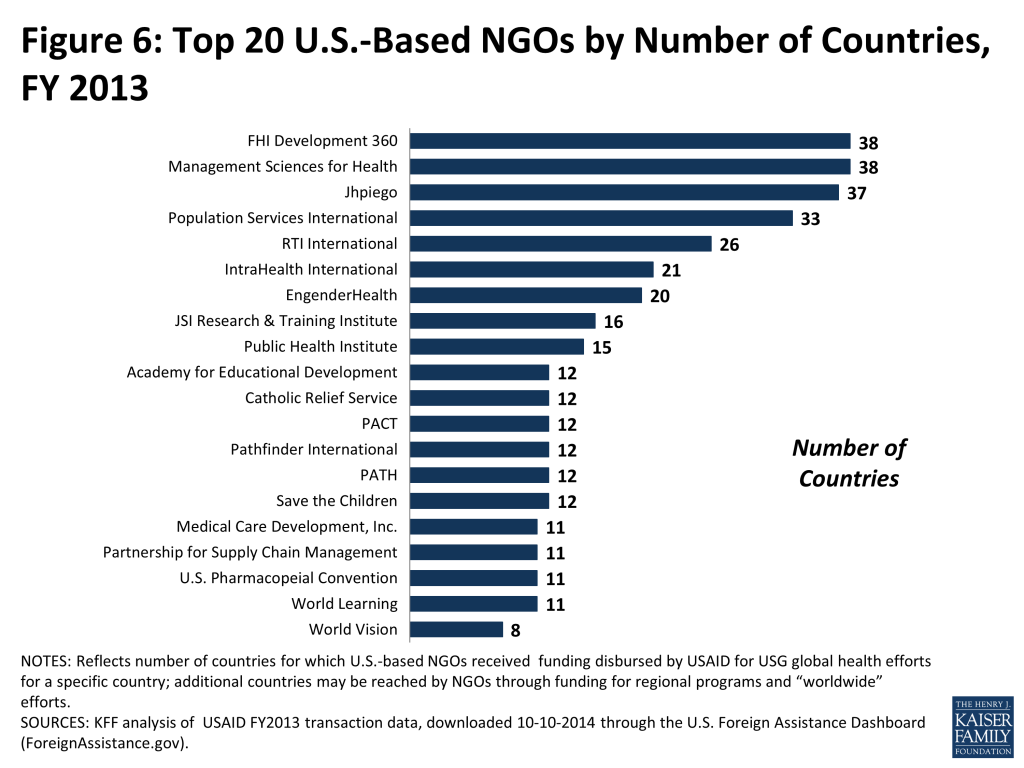
Total Number of NGOs: In FY 2013, 135 U.S.-based NGOs received USG global health funding through USAID to implement global health activities. They include NGOs working on specific global health issues, those working in multiple health areas, as well as those with an even broader development scope. About 15% (20 NGOs) are faith-based organizations.
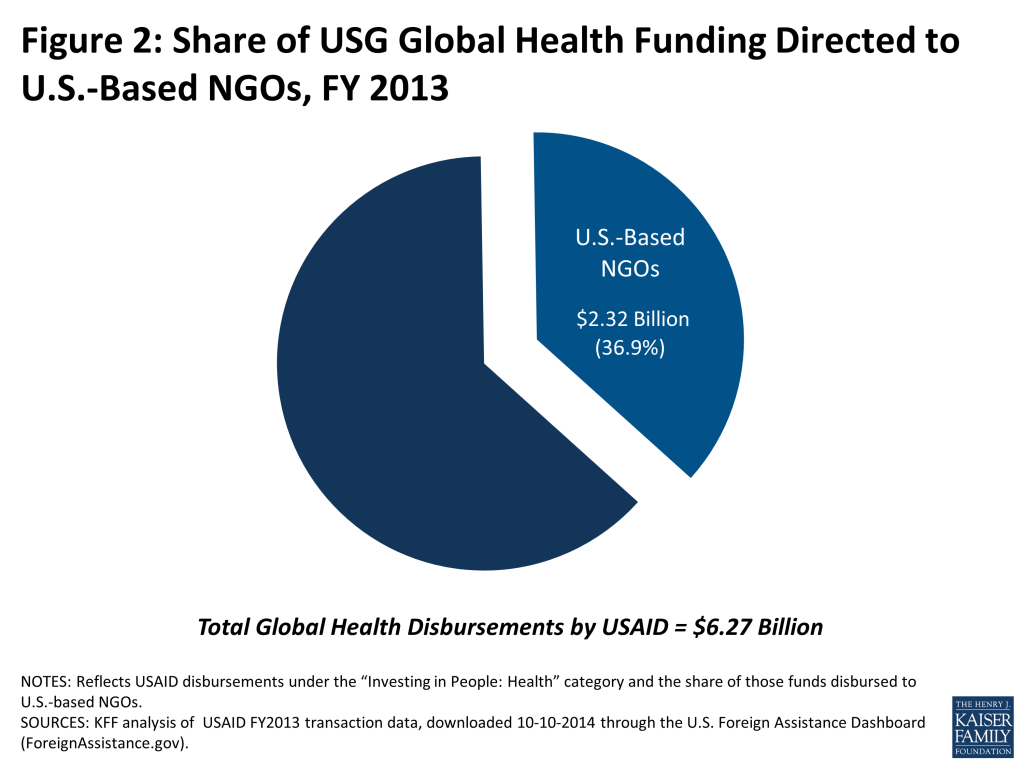
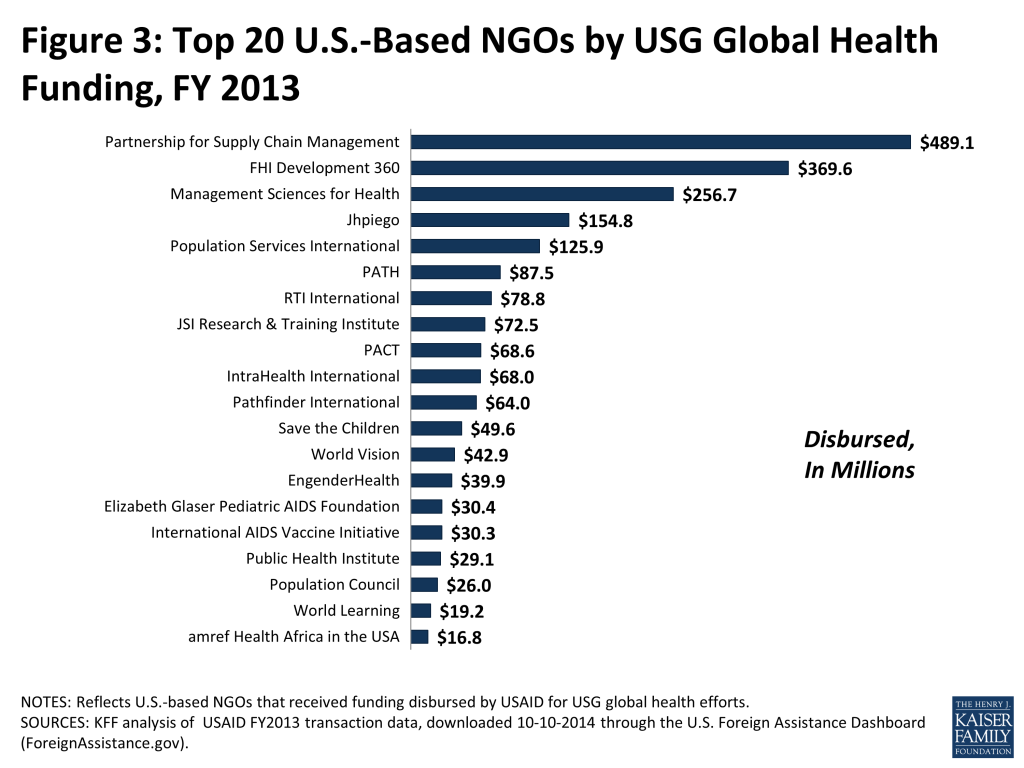
Total Funding: Collectively, these NGOs received more than a third (approximately $2.32 billion) of USAID global health disbursements in FY 2013. The vast majority of this funding (91%) was concentrated among 20 NGOs. Funding amounts ranged from a high of more than $50 million per NGO (11 NGOs) to less than $1 million (74 NGOs).
Program Areas: NGOs carry out global health efforts in all major U.S. program areas, with HIV receiving the highest amount of funding and involving the greatest number of NGOs. Family planning/reproductive health receives the second highest amount of funding, followed by maternal, newborn, and child health.
Geographic Presence: NGOs received USG global health funding for efforts carried out in 72 countries and across multiple regions, including Africa, Asia, Europe & Eurasia, Latin America & the Caribbean, and the Middle East. Many NGOs (78) implement efforts that are “worldwide” in scope, though most (105) are engaged in regional and/or country-specific programs. Two-thirds of funding to NGOs ($1.57 billion) supports regional and country-specific efforts, while the remainder ($0.74 billion) is directed to “worldwide” efforts. Among the 103 engaged in country-specific efforts, the majority of NGOs (61) received funding for efforts in one country, while the remainder (42) received funding for efforts in two or more countries, including 19 that received funding in 10 or more countries. Nearly all countries (64 of 72) host activities by more than one NGO, with more than a quarter (20) – mostly in sub-Saharan Africa – hosting activities by 10 or more NGOs each. Overall, more NGOs operate in Africa than in all other regions combined.
Table 1: Summary of U.S.-Based NGO Engagement in USG Global Health Efforts, FY 2013
Pandemic Influenza and Other Emerging Threats (PIOET)3
7
Countries Reached
72*
NOTES: Reflects U.S.-based NGOs that received funding disbursed by USAID in FY 2013 for USG global health activities. + NTDs are neglected tropical diseases. * Other countries may have been reached through regional programs or “worldwide” efforts.SOURCES: KFF analysis of USAID FY2013 transaction data, downloaded 10-10-2014 through the U.S. Foreign Assistance Dashboard (ForeignAssistance.gov) as well as information from NGO websites.
Report
Introduction
Non-governmental organizations (NGOs) are key partners in U.S. global health efforts. Indeed, a significant share of U.S. government funding for global health is channeled to NGOs, who act as program implementers on the ground. NGOs also play other roles in global health, including through advocacy, analysis, education and awareness-raising, and fundraising activities. To date, however, little information has been available about the extent of their role in carrying out U.S. global health programs.
To help fill this void, this report provides an analysis of U.S.-based NGOs that received global health funding from the U.S. government (USG) during FY 2013. Due to the parameters of the analysis as well as data limitations, this report focuses on USG funding that the U.S. Agency for International Development (USAID) received through direct appropriations as well as through interagency transfers (e.g., from the Department of State4 ), which together account for the majority of U.S. bilateral global health spending.5 Specifically, its findings are based on KFF analysis of data on funding disbursed by USAID in FY 2013 to U.S.-based non-profits implementing USG global health activities, which was downloaded from the U.S. government’s Foreign Assistance Dashboard (www.ForeignAssistance.gov); other sources of data included organizations’ websites, which were used to confirm organizations’ non-profit statuses as well as the U.S. locations of their headquarters/main U.S. offices implementing specific global health activities. (See Box 1 for the definition of U.S.-based NGOs utilized in the analysis and Appendix A for a detailed methodology.) In addition to identifying these NGOs, this report examines their funding levels, program areas, and geographic focus.
Box 1: Definition of Non-Governmental Organizations (NGOs)
For the purposes of this analysis, to be eligible to be included, an organization had to meet the following definition of a U.S.-based NGO: a non-profit that is independent of the U.S. government and any other government, based in the United States (through either its headquarters or a main U.S. office that had been awarded a USG global health project), and not a university/college, a hospital, or a foundation that solely supports a U.S. government department/agency, hospital, or university. Non-profits excluded under this definition include, for example, the CDC Foundation and the Pan American Health Organization. This definition was informed by the USAID definition of private voluntary organizations (PVOs),6 which guides a USAID registration process for NGOs.
By design, therefore, this report does not include an exhaustive examination of U.S.-based NGOs involved in carrying out USG-supported global health efforts (let alone U.S.-based NGOs carrying out global health efforts who do not receive USG support; see endnote7 ). It also does it include foreign-based NGOs, who also are significant implementers of USG programs.
Findings
Overview
More than 130 U.S.-based NGOs implement USG global health efforts. In FY 2013, 135 NGOs received USG funding from USAID to implement global health efforts (see Figure 1). They include NGOs working on specific global health issues (such as the Global Alliance for TB Drug Development and mWater), those working in multiple global health areas (such as CARE and Save the Children), and those with an even broader development scope (such as Innovations for Poverty Action). They include 20 faith-based NGOs (such as Samaritan’s Purse and World Vision).8
Figure 1: U.S.-Based NGOs Implementing USG Global Health Efforts, FY 2013
A Glimmer of Hope Foundation
American Association for the Advancement of Science (AAAS)
Academy for Educational Development (AED) #
ACDI/VOCA
Adventist Development and Relief Agency (ADRA)
African Wildlife Foundation
Africare
Aga Khan Foundation
AIDS Vaccine Advocacy Coalition (AVAC)
Alliance for Youth Achievement
American Council on Education
American Institutes for Research
American International Health Alliance
Amref Health Africa in the USA (formerly African Medical and Research Foundation)
Ananda Marga Universal Relief Team (AMURT)
American Near East Refugee Aid (ANERA)
Armenian American Cultural Association (AACA)
Armenian EyeCare Project
Aspen Institute, The
Axios Foundation
CARE (Cooperative for Assistance and Relief Everywhere)
Carter Center, The
Catholic Medical Missions Board
Catholic Relief Services (CRS)
Center for Human Services
ChildFund International USA (formerly Christian Children’s Fund)
Concern Worldwide US
Counterpart International
Cross International
Curamericas Global
Diagnostics For All
D-REV
Education Development Center
Elizabeth Glaser Pediatric AIDS Foundation
EngenderHealth
Episcopal Relief & Development
Feed the Children
FHI Development 360 (formerly Family Health International)
Future Generations
FXB USA (Association Francois-Xavier Bagnoud USA)
Global AIDS Interfaith Alliance
Global Alliance for TB Drug Development
Global Communities (formerly CHF International)
Global Environment and Technology Foundation
Global Partners in Care (formerly Foundation for Hospices in Sub-Saharan Africa)
Global Team for Local Initiatives
Gorongosa Restoration Project (Gregory C. Carr Foundation)
Grameen Foundation USA
Green Empowerment
Health Alliance International
Health Partners
Health Right International
Health Through Walls
Heartland Alliance for Human Needs & Human Rights (Heartland Alliance International)
Helen Keller International
HOPE worldwide
Innovations for Poverty Action
Institute of International Education
International AIDS Vaccine Initiative (IAVI)
International Center for Research on Women (ICRW)
International City/County Management Association
International Medical Corps
International Orthodox Christian Charities (IOCC)
International Partnership for Microbicides
International Relief and Development
International Rescue Committee (IRC)
International Research and Exchange Board (IREX)
International Virtual e-Hospital Foundation
International Youth Foundation (IYF)
Internews Network
IntraHealth International
James R. Jordan Foundation
Jane Goodall Institute
Johns Hopkins Program for International Education in Gynecology and Obstetrics (Jhpiego)
JSI Research & Training Institute
Lifewater International
Link Community Development
Lutheran World Relief
Management Sciences for Health (MSH)
Medical Care Development (including Medical Care Development International)
Medical Teams International (formerly northwest medical teams)
Mennonite Economic Development Associates
Mercy Corps
Mercy-USA for Aid and Development
Millennium Water Alliance
mothers2mothers
mWater
National Collegiate Inventors and Innovators Alliance (NCIIA)
National Cooperative Business Association CLUSA International
Natural Family Planning Center of Washington D.C (TeenSTAR)
Nazarene Compassionate Ministries
Pacific Institute for Studies in Development, Environment and Security
PACT
Palms for Life Fund
Partners for Development
Partners In Health
Partners of the Americas
Partnership for Child Health Care #+
Partnership for Supply Chain Management (PFSCM) ~
Pathfinder International
PCI-Media Impact (formerly Population Communication International)
Plan International USA
Population Council
Population Reference Bureau (PRB)
Population Services International (PSI)
Program for Appropriate Technology in Health (PATH)
Project C.U.R.E. (Commission on Urgent Relief and Equipment)
Project Concern International
Project HOPE (Health Opportunities for People Everywhere)
Project Medishare for Haiti
Public Health Institute (PHI)
RAND Corporation
Relief International
Research Triangle Institute (RTI International)
Samaritan’s Purse
Save the Children
Search for Common Ground
Sesame Workshop
South Africa Partners
Synergos Institute
TechnoServe
TOSTAN
Touch Foundation
United States (U.S.) Pharmacopeial Convention
Wildlife Conservation Society
Winrock International
World Concern
World Education
World Hope International
World Learning for International Development (World Learning)
World Relief Corporation of National Association of Evangelicals (World Relief)
World Renew (formerly Christian Reformed World Relief Committee)
World Vision
World Wildlife Fund (WWF)
YMCA
NOTES: Includes U.S.-based NGOs to which USAID disbursed USG global health funding in FY 2013. # indicates NGO is no longer operating. + indicates NGO included JSI Research & Training Institute, MSH, and AED. ~ indicates NGO is a separate legal entity established by JSI Research & Training Institute and MSH to implement specific work.SOURCES: KFF analysis of USAID FY2013 transaction data, downloaded 10-10-2014 through the U.S. Foreign Assistance Dashboard (ForeignAssistance.gov) as well as information from NGO websites.
Approximately $2.32 billion – or more than a third of USAID global health disbursements – was disbursed to U.S.-based NGOs in FY 2013. U.S.-based NGOs received $2,316,727,617 in FY 2013 for USG global health efforts, about 37% of total global health funding disbursed by USAID that year (see Figure 2). This funding was provided to U.S.-based NGOs through all of the functional and geographic bureaus at USAID, including the Bureau for Africa and the Bureau for Global Health.9
Most funding provided to NGOs was directed to a small number of organizations. Twenty NGOs accounted for the vast majority of funding (about 91% or $2.1 billion) (see Figure 3). Among these, 11 received more than more than $50 million in net disbursements each, collectively accounting for more than three-quarters of all funding (about 79% or $1.8 billion). These were the Partnership for Supply Chain Management, FHI Development 360, Management Sciences for Health (MSH), Jhpiego, Population Services International (PSI), PATH, RTI International, JSI Research & Training Institute, PACT, IntraHealth International, and Pathfinder International. On the other end of the funding range, 74 NGOs received less than $1 million each.
Figure 2: Share of USG Global Health Funding Directed to U.S.-Based NGOs, FY 2013Figure 3: Top 20 U.S.-Based NGOs by USG Global Health Funding, FY 2013
Program Areas
NGOs carry out USG global health efforts in all major U.S. program areas. NGOs are working in all nine program areas of the USG, including: HIV/AIDS; tuberculosis (TB); malaria; family planning/reproductive health (FP/RH); maternal, newborn, and child health (MNCH); nutrition; water supply and sanitation; pandemic influenza and other emerging threats (PIOET);10 and other public health threats, including neglected tropical diseases (NTDs).11
About half of NGOs receive funding in a single global health program area, while remaining NGOs receive funding to work in multiple program areas. In FY 2013, 68 NGOs received support for efforts related to a single program area, while 67 received support for efforts related to more than one program area, including 27 (20%) that received funding for efforts related to four or more areas.
The program area involving the greatest numbers of NGOs is HIV, followed by MNCH. As Figure 4 shows, 75 NGOs worked on HIV and 62 on MNCH efforts, followed by FP/RH (43), water supply and sanitation (40), malaria (34), nutrition (34), TB (22), and other public health threats (13). Only PIOET efforts involved less than ten NGOs, with 7 NGOs carrying out these efforts. The greatest proportion of funding to NGOs was for HIV efforts, followed by FP/RH and MNCH. (See Appendix B for a listing of NGOs by program area.)
Figure 4: Number of U.S.-Based NGOs and USG Global Health Funding by Program Area, FY 2013
Geographic Presence
Stateside, NGO operations are based across the U.S. but most often in the Northeast and West Coast regions. The headquarters/main U.S. offices of these NGOs are in half (25) of all U.S. states and in the District of Columbia (DC). The greatest number are in DC (25), followed by New York (21), Maryland (16), California (12), Virginia (10), Massachusetts (9), North Carolina (5), and Washington (4) — locations proximate to major USG, international, and multilateral organizations that address global health, universities with significant global health programs, and/or other major funders of global health efforts (e.g., the Gates Foundation, which is located in Washington state).
Worldwide Efforts
Nearly 80 NGOs provided “worldwide” support or focused on activities with global purposes. In FY 2013, 78 NGOs received funding for “worldwide” USG global health efforts; 30 received only “worldwide” funding, with the rest also receiving funding for country-and region-specific efforts. About a third of funding provided to NGOs ($0.74 billion) is directed to such efforts. “Worldwide” activities may include providing technical assistance to field missions as part of certain project awards and carrying out globally-focused activities; for example, in FY 2013, funds for worldwide efforts were disbursed for field support efforts related to fistula prevention and repair led by EngenderHealth and for vaccine research and development efforts carried out by the International AIDS Vaccine Initiative.
Regional and Country-Specific Efforts
More than 100 NGOs carried out regional and country-specific programs. In FY 2013, 105 NGOs received funding for regional and country-specific efforts, accounting for about two-thirds of funding provided to NGOs ($1.57 billion).
Regional efforts: 22 NGOs received funding for activities that spanned portions and/or the entirety of one or more of the following regions: Africa, Asia, Eurasia, Latin American and the Caribbean, and the Middle East.12 Nearly all of these NGOs also received funding for “worldwide” efforts (19) as well as country-specific efforts (20).
Country-specific efforts: More than three-quarters of NGOs (103) received funding for activities in a specific country, spanning 72 countries (see Figure 5).13 61 NGOs received such funding for efforts in one country, while 42 received funding for efforts in two or more countries. Among the 20 NGOs with the greatest number of country-specific efforts (see Figure 6), 19 carried out USG global health efforts in 10 or more countries.14 The efforts of four NGOs – FHI Development 360, MSH, Jhpiego, and PSI – each reached more than 30 countries.
Figure 5: U.S.-Based NGOs’ USG Global Health Efforts by Country, FY 2013Figure 6: Top 20 U.S.-Based NGOs by Number of Countries, FY 2013
Overall, more NGOs carry out regional and country-specific efforts in Africa than in all the other regions combined. As Figure 7 shows, nearly 90 U.S.-based NGOs received funding for region- and country-specific projects in Africa, with about a third as many (30) in Asia and fewer in other regions. Most regional/country funding was also directed to efforts in Africa, followed by Asia.
Nearly all countries host more than one NGO, with more than a quarter – mostly in sub-Saharan Africa – hosting 10 or more NGOs each. In FY 2013, the 72 countries reached by NGOs’ country-specific efforts each hosted activities by varying numbers of NGOs, with 8 countries hosting activities by one NGO apiece (i.e., 1 NGO received country-specific funding for efforts in each of 8 countries) and 64 countries hosting activities by more than one NGO apiece. About one in four countries (20) hosted activities by 10 or more U.S.-based NGOs implementing USG global health efforts (see Figure 8); most (16) of these countries are in sub-Saharan Africa. The number of NGOs was highest in Ethiopia (29), Tanzania (25), and Kenya (23); excluding these three countries, sub-Saharan African countries hosted an average of approximately nine NGOs each.
The countries with the highest levels of NGO funding are almost all in sub-Saharan Africa. In FY 2013, among the 20 countries with the highest country-specific funding to NGOs (see Figure 9), 18 are in sub-Saharan Africa. Funding to NGOs exceeded $50 million in each of 8 countries and was highest in Kenya ($196.6 million), followed by Nigeria ($149.7 million), and Ethiopia ($142.1 million). On the other end of the funding range, funding to NGOs was less than $1 million in each of 17 countries.
Figure 7: Number of U.S.-Based NGOs and USG Global Health Funding by Region, FY 2013Figure 8: Top 20 Countries by Number of U.S.-Based NGOs, FY 2013Figure 9: Top 20 Countries by Total USG Global Health Funding to U.S.-Based NGOs, FY 2013
Conclusion
As the findings of this report have shown, U.S.-based NGOs play an important role in carrying out USG global health efforts, accounting for a third of USAID global health disbursements in FY 2013. Greater understanding of the extent of NGO engagement in these efforts can be elucidated by further analysis, as data on USG global health funding for U.S.-based NGOs become increasingly available publicly and as the quality and clarity of these data improve. The USG has taken important steps in recent years to make funding and project data more available and easily accessible, but further attention is still required to fill in gaps in data – particularly with regard to USG funding sources beyond USAID – and to ensure the quality and completeness of existing USG data resources. Moreover, such data are critical to evaluating whether investments in NGOs further achievement of USG global health goals. Still, the findings of this report suggest that the significant role of NGOs will be important to consider in understanding USG global health efforts going forward.
Appendices
Appendix A: Detailed Methodology
This report is based on Kaiser Family Foundation analysis of USAID global health funding data for FY 2013. Data were downloaded from the U.S. Foreign Assistance Dashboard (www.ForeignAssistance.gov) on October 10, 2014.
The analysis uses transaction-level data on funding disbursed by USAID to U.S.-based NGOs for global health activities. Data include funding that was appropriated by Congress to USAID for global health activities and then disbursed to NGOs, as well as funding that was appropriated to other agencies for global health efforts, transferred to USAID, and then disbursed to NGOs.15 Due to data limitations on the Dashboard and the parameters of this analysis, the data does not include funding disbursed by other USG departments/agencies (such as the Department of State or the Centers for Disease Control and Prevention) to NGOs. Still, this analysis captures the majority of bilateral U.S. global health funding disbursements.16
Additionally, note:
To be eligible to be included in this analysis, an organization had to meet the following definition of a U.S.-based NGO: a non-profit that is independent of the U.S. government and any other government, based in the United States (through either its headquarters or a main U.S. office that had been awarded a USG global health project), and not a university/college, a hospital, or a foundation that solely supports a U.S. government department/agency, hospital, or university. Each organization’s non-profit status as well as whether they were U.S.-based was confirmed using data found on organizations’ websites.
Funding totals shown in this report represent net disbursements, which include positive and negative disbursed funding amounts as well as zero-dollar disbursed funding amounts. For zero-dollar transactions, we included only transactions we could verify as no-cost extensions.17
Data on health funding provided under the American Schools and Hospitals Abroad (ASHA) program were not included in NGO funding totals but were included in the overall global health funding total ($6.27 billion).
Appendix B: U.S.-Based NGOs by Program Area, FY 2013
Table B-1: U.S.-Based NGOs Implementing USG Global Health Efforts by Program Area, FY 2013
Malaria34
HIV75
TB22
American Association for the Advancement of Science
Aga Khan Foundation
American Council on Education
CARE
Catholic Medical Mission Board
Catholic Relief Services
ChildFund International USA
Concern Worldwide US
Curamericas Global
Episcopal Relief & Development
FHI Development 360
Health Partners
Health Right International
IntraHealth International
Jhpiego
JSI Research & Training Institute
Lutheran World Relief
Management Sciences for Health
Medical Care Development
Medical Teams International
Mennonite Economic Development Associates
Partnership for Child Health Care
Pathfinder International
Plan International USA
Population Services International
PATH
Project C.U.R.E
Public Health Institute
RTI International
Save the Children
U.S. Pharmacopeial Convention
World Learning
World Renew
World Vision
Academy for Educational Development
ACDI/VOCA
Adventist Development and Relief Agency
African Wildlife Foundation
Africare
AIDS Vaccine Advocacy Coalition
American Council on Education
American Institutes for Research
Amref Health Africa in the USA
Ananda Marga Universal Relief Team
Axios Foundation.
CARE
Catholic Relief Services
Cross International
Education Development Center
Elizabeth Glaser Pediatric AIDS Foundation
EngenderHealth
Feed the Children
FHI Development 360
FXB USA
Global AIDS Interfaith Alliance
Global Communities
Global Partners in Care
Gorongosa Restoration Project (Gregory C. Carr Foundation)
Health Alliance International
Health Through Walls
Heartland Alliance International
HOPE worldwide
International AIDS Vaccine Initiative
International Orthodox Christian Charities
International Partnership for Microbicides
International Relief and Development
International Research and Exchange Board
International Youth Foundation
Internews Network
IntraHealth International
James R. Jordan Foundation
Jane Goodall Institute
Jhpiego
JSI Research & Training Institute
Link Community Development
Management Sciences for Health
mothers2mothers
Natural Family Planning Center of Washington D.C (TeenSTAR)
Nazarene Compassionate Ministries
PACT
Partners in Health
Partnership for Child Health Care
Partnership for Supply Chain Management
Pathfinder International
Plan International USA
Population Council
Population Reference Bureau
Population Services International
PATH
Project Concern International
Project HOPE
Project Medishare for Haiti
Public Health Institute
RTI International
Samaritan’s Purse
Save the Children
Search for Common Ground
Sesame Workshop
South Africa Partners
Synergos Institute
TechnoServe
Touch Foundation
U.S. Pharmacopeial Convention
World Concern
World Education
World Hope International
World Learning
World Vision
YMCA
CARE
Elizabeth Glaser Pediatric AIDS Foundation
FHI Development 360
Global Alliance for TB Drug Development
Health Through Walls
Helen Keller International
International Relief and Development
IntraHealth International
Jhpiego
JSI Research & Training Institute
Management Sciences for Health
National Collegiate Inventors and Innovators Alliance
Partners In Health
Plan International USA
Population Services International
PATH
Project Concern International
Public Health Institute
RTI International
U.S. Pharmacopeial Convention
World Relief
World Vision
FP/RH43
MNCH62
Nutrition34
American Association for the Advancement of Science
Academy for Educational Development
ACDI/VOCA
American Council on Education
Amref Health Africa in the USA
Aspen Institute, The
CARE
Catholic Relief Services
ChildFund International USA
Counterpart International
Education Development Center
Elizabeth Glaser Pediatric AIDS Foundation
EngenderHealth
FHI Development 360
Helen Keller International
International Center for Research on Women
International Partnership for Microbicides
International Rescue Committee
Internews Network
IntraHealth International
James R. Jordan Foundation
Jhpiego
JSI Research & Training Institute
Management Sciences for Health
Medical Care Development
Mercy Corps
National Collegiate Inventors and Innovators Alliance
Partnership for Supply Chain Management
Pathfinder International
Plan International USA
Population Council
Population Reference Bureau
Population Services International
PATH
Public Health Institute
RTI International
Save the Children
TOSTAN
Wildlife Conservation Society
World Education
World Learning
World Wildlife Fund
World Vision
Academy for Educational Development
ACDI/VOCA
Adventist Development and Relief Agency
Africare
Aga Khan Foundation
American Council on Education
American International Health Alliance
Amref Health Africa in the USA
Armenian EyeCare Project
CARE
Catholic Relief Services
Center for Human Services
ChildFund International USA
Concern Worldwide US
Curamericas Global
Diagnostics For All
D-REV
EngenderHealth
Episcopal Relief & Development
FHI Development 360
Future Generations
Global Environment and Technology Foundation
Grameen Foundation USA
Health Alliance International
Health Partners
Health Right International
Helen Keller International
Innovations for Poverty Action
Institute of International Education
International Relief and Development
International Rescue Committee
Internews Network
IntraHealth International
Jhpiego
JSI Research & Training Institute
Lutheran World Relief
Management Sciences for Health
Medical Teams International
Mercy Corps
National Collegiate Inventors and Innovators Alliance
National Cooperative Business Association CLUSA International
PACT
Partners for Development
Partnership For Child Health Care
Partnership for Supply Chain Management
Pathfinder International
Plan International USA
Population Council
Population Reference Bureau
Population Services International
PATH
Project C.U.R.E.
Public Health Institute
RAND Corporation
RTI International
Save the Children
U.S. Pharmacopeial Convention
Winrock International
World Learning
World Relief
World Renew
World Vision
Academy for Educational Development
ACDI/VOCA
Africare
Amref Health Africa in the USA
CARE
Catholic Relief Services
Center for Human Services
ChildFund International USA
Concern Worldwide US
FHI Development 360
Future Generations
Health Through Walls
Helen Keller International
International Relief and Development
IntraHealth International
Jhpiego
JSI Research & Training Institute
Management Sciences for Health
Mercy Corps
National Cooperative Business Association CLUSA International
Partners of the Americas
Partnership for Child Health Care
Partnership for Supply Chain Management
Pathfinder International
Population Services International
PATH
Public Health Institute
RTI International
Save the Children
U.S. Pharmacopeial Convention
Winrock International
World Learning
World Relief
World Vision
Other Public Health Threats, Including NTDs13
Water Supply and Sanitation40
Pandemic Influenza and Other Emerging Threats7
Armenian American Cultural Association
CARE
Carter Center, The
FHI Development 360
Innovations for Poverty Action
International Virtual e-Hospital Foundation
IntraHealth International
Jhpiego
JSI Research & Training Institute
Population Services International
Project C.U.R.E.
Public Health Institute
RTI International
A Glimmer of Hope Foundation
Academy for Educational Development
ACDI/VOCA
Alliance for Youth Achievement
American Council on Education
Amref Health Africa in the USA
American Near East Refugee Aid
Catholic Relief Services
Episcopal Relief & Development
FHI Development 360
Global Communities
Global Environment and Technology Foundation
Global Team for Local Initiatives
Green Empowerment
Innovations for Poverty Action
International City/County Management Association
International Relief and Development
International Rescue Committee
Jhpiego
JSI Research & Training Institute
Lifewater International
Management Sciences for Health
Mercy Corps
Mercy-USA for Aid and Development
Millennium Water Alliance
mWater
National Cooperative Business Association CLUSA International
Pacific Institute for Studies in Development, Environment and Security
PACT
Palms for Life Fund
Pathfinder International
PCI-Media Impact
Population Services International
RAND Corporation
Relief International
RTI International
Save the Children
Winrock International
World Concern
World Vision
Academy for Educational Development
American Council on Education
FHI Development 360
International Medical Corps
Public Health Institute
RTI International
U.S. Pharmacopeial Convention
NOTES: Includes U.S.-based NGOs to which USAID disbursed USG global health funding, by program area, in FY 2013.SOURCES: KFF analysis of USAID FY2013 transaction data, downloaded 10-10-2014 through the U.S. Foreign Assistance Dashboard (ForeignAssistance.gov).
Endnotes
Based on Kaiser Family Foundation analysis of data from the U.S. Foreign Assistance Dashboard (www.ForeignAssistance.gov). ↩︎
Other Public Health Threats also addresses dangers posed by infectious diseases not included elsewhere, such as cholera, dengue, and meningitis; significant non-communicable health threats of major public health importance; the containment of antimicrobial resistance; and the crosscutting work on surveillance that builds capacity for outbreak preparedness and response. According to USAID congressional budget justifications, http://www.usaid.gov/results-and-data/budget-spending/congressional-budget-justification. ↩︎
Pandemic Influenza and Other Emerging Threats includes efforts to mitigate the possibility that a highly virulent virus could develop into a pandemic by strengthening targeted countries’ ability to detect cases early and to apply appropriate control measures quickly. According to USAID congressional budget justifications, http://www.usaid.gov/results-and-data/budget-spending/congressional-budget-justification. ↩︎
For example, USAID transaction data analyzed for this report include funds transferred from the Department of State to USAID for HIV efforts, which were then obligated and eventually disbursed to U.S.-based NGOs. ↩︎
Based on Kaiser Family Foundation analysis of data from the U.S. Foreign Assistance Dashboard (www.ForeignAssistance.gov). ↩︎
PVOs are a subset of the wider NGO community and “are tax-exempt nonprofits that leverage their expertise and private funding to address development challenges abroad.” USAID, “PVO Registration,” webpage, http://www.usaid.gov/pvo. ↩︎
Numerous U.S.-based NGOs carrying out global health efforts do not receive USG support for their efforts. For some, this is a conscious choice to not accept government funding, while others’ global health activities, priorities, and/or approaches may not lend themselves to being funded by the USG for any number of reasons. Some examples of U.S.-based NGOs engaged in global health activities that fall into this category include the Center for Health and Gender Equity (CHANGE), Doctors Without Borders/Médecins Sans Frontières (MSF) USA, Friends of the Global Fight Against AIDS, Tuberculosis and Malaria, the Mennonite Central Committee U.S., the ONE Campaign, and Oxfam America. ↩︎
The 20 faith-based NGOs are Adventist Development and Relief Agency, Catholic Medical Missions Board, Catholic Relief Services, Cross International, Episcopal Relief & Development, Feed the Children, HOPE worldwide, International Orthodox Christian Charities, Lifewater International, Lutheran World Relief, Medical Teams International, Mennonite Economic Development Associates, Nazarene Compassionate Ministries, Samaritan’s Purse, World Concern, World Hope International, World Relief, World Renew, World Vision, and YMCA. It is important to note, however, that other organizations may identify as secular but have religious principles undergirding their work. For example, the work of the Aga Khan Foundation (part of the Aga Khan Development Network, AKDN) “is underpinned by the ethical principles of Islam – particularly consultation, solidarity with those less fortunate, self-reliance and human dignity – but AKDN does not restrict its work to a particular community, country or region.” AKDN, “Press Centre: Frequent Questions,” webpage, http://www.akdn.org/faq.asp. ↩︎
The other relevant bureaus are: the Bureau for Asia; Bureau for Europe and Eurasia; Bureau for Latin America and the Caribbean; Bureau for the Middle East; Office of Afghanistan and Pakistan Affairs; Bureau for Democracy, Conflict and Humanitarian Assistance; Bureau for Food Security; Bureau for Economic Growth, Education and Environment (previously known as the Bureau for Economic Growth and Trade (EGAT)); and U.S. Global Development Lab (incorporates the former Office of Innovation and Development Alliances (IDEA) and Office of Development Partners (ODP)). Additionally, a very small amount of funding was designated for the “Recovery” organizational unit. ↩︎
Pandemic Influenza and Other Emerging Threats includes efforts to mitigate the possibility that a highly virulent virus could develop into a pandemic by strengthening targeted countries’ ability to detect cases early and to apply appropriate control measures quickly. According to USAID congressional budget justifications,http://www.usaid.gov/results-and-data/budget-spending/congressional-budget-justification. ↩︎
Other Public Health Threats also addresses dangers posed by infectious diseases not included elsewhere, such as cholera, dengue, and meningitis; significant non-communicable health threats of major public health importance; the containment of antimicrobial resistance; and the crosscutting work on surveillance that builds capacity for outbreak preparedness and response. According to USAID congressional budget justifications,http://www.usaid.gov/results-and-data/budget-spending/congressional-budget-justification. ↩︎
In addition to “worldwide” support, regions/sub-regions mentioned in the data sources included: Africa, East Africa, West Africa, South Africa, Asia, Central Asia, East Asia, Eurasia, the Middle East, Latin America & the Caribbean, Central America, and South America. ↩︎
In addition to the countries listed below, other countries may have been reached through regional efforts. Afghanistan, Albania, Angola, Armenia, Bangladesh, Benin, Bolivia, Botswana, Brazil, Burkina Faso, Burma, Burundi, Cambodia, Cameroon, China, Congo (Republic of), Cote d’Ivoire, Djibouti, Dominican Republic, DR Congo, El Salvador, Ethiopia, Georgia, Ghana, Guatemala, Guinea, Guyana, Haiti, Honduras, India, Indonesia, Jamaica, Jordan, Kazakhstan, Kenya, Kosovo, Kyrgyzstan, Lesotho, Liberia, Madagascar, Malawi, Mali, Mexico, Mozambique, Namibia, Nepal, Nicaragua, Nigeria, Pakistan, Papua New Guinea, Paraguay, Peru, Philippines, Rwanda, Senegal, Somalia, South Africa, South Sudan*, Swaziland, Tajikistan, Tanzania, Thailand, Timor-Leste, Turkmenistan, Uganda, Ukraine, Uzbekistan, Vietnam, West Bank and Gaza, Yemen, Zambia, and Zimbabwe. *Some data entries state “Sudan, Pre-2011 Election”, which refers to the 2011 election that led to the division of Sudan into two countries, one of which is South Sudan; USG efforts have historically targeted this area. ↩︎
Although a defunct organization whose activities were mostly taken over by FHI Development 360, the Academy for Education Development (AED) appears in FY 2013 transaction data and is, therefore, included in this analysis and the related figures. ↩︎
For example, USAID transaction data analyzed for this report include funds transferred from the Department of State to USAID for HIV efforts, which were then obligated and eventually disbursed to U.S.-based NGOs. ↩︎
Based on Kaiser Family Foundation analysis of data from the U.S. Foreign Assistance Dashboard (www.ForeignAssistance.gov). ↩︎
Positive and negative disbursements along with zero-dollar disbursements that are no-cost extensions) are each closely linked to the recent completion or ongoing execution of global health activities, providing the best approximation available for showing where work is being done. ↩︎
Most Americans in prime working age who aren’t currently employed hope to return to work in the future, though family responsibilities, health issues and a lack of good jobs pose significant challenges, finds a new survey conducted by the Kaiser Family Foundation, The New York Times and CBS News.
Rather than focusing only on those who meet the official government definition of unemployment, this survey takes a broad look at all adults of prime working age (25-54) who are not working, regardless of their desire for work or job-seeking activities. Conducted to shed light on recent trends in the nation’s employment market, the survey probes why they are not working, how they get by financially, what it would take to get them working, and – for those who used to work – how being out of work has changed their lives. Each news organization plans a series of reports drawing on the survey’s findings, beginning with a segment last night on the CBS Evening News and a story this morning in The New York Times.
The survey’s findings include:
Prime age adults who are not working make up 13 percent of the total U.S. adult population. About a third (34%) of this group says they have a disability that prevents them from doing any kind of work for at least the next 6 months. The others say they are able to work, including about a quarter each who consider themselves unemployed and homemakers, one in 10 who call themselves students and 4 percent who say they are retired.
Almost two-thirds of those who are disabled and unable to work (64%), and of those who consider themselves unemployed and able to work (63%), say their employment situation is a source of stress in their lives, including about four in ten who say it’s a major source of stress.
Among the previously employed who now consider themselves unemployed and able to work, about half say they have borrowed money from family and friends (50%) or put off needed health care (47%) as a result of being out of work. More than four in ten say they have taken money out of savings or retirement to pay bills (43%), and more than a third say they’ve been contacted by a collection agency (35%) or changed their living situation in order to save money (35%).
Those who are unemployed, able to work, and have looked for a job in the past year report being willing to make various sacrifices such as taking an entry-level job in a new field (86%), returning to school or a job training program (81%) or working non-traditional hours such as nights or weekends (77%). Six in ten (61%) say they’d work for minimum wage, and nearly seven in ten (69%) of those who used to work say they’d take a 10 percent pay cut from what they earned at their last job. Nearly half say they’d be willing to move to a different city (45%) or take a job that requires more than an hour commute each way (46%).
An overview and full survey results are available on the Foundation’s website.
The survey was designed and analyzed by public opinion researchers at the Foundation, the Times, and CBS News, and was conducted from November 11-25 among a nationally representative random digit dial telephone sample of 1,002 adults between the ages of 25-54 who are not employed either full-time or part-time. Telephone interviews conducted by landline and cell phone were carried out in English and Spanish. The margin of sampling error is plus or minus 4 percentage points for results based on the full sample; for subgroups the margin of sampling error is higher.
To help shed light on recent trends in the U.S. employment market, the Kaiser Family Foundation partnered with The New York Times and CBS News to conduct a survey of adults between the ages of 25-54 (generally considered to be prime working age) who are not currently employed. Rather than focusing only on those who meet the official government definition of unemployment, this survey takes a broad look at all prime-age adults who are not working, regardless of their desire for work or job-seeking activities. While the official U.S. unemployment rate has declined since the start of the recession in late 20071, the total share of adults who are not employed has risen in recent years. Economists consider this “labor force participation rate” at least as important as the official unemployment rate as a measure of the current and future health of the U.S. economy. This survey examines the views and experiences of this broad group of prime-age workers who are not employed, including how they get by financially, the factors to which they attribute their lack of employment, what it would take to get them working, and – for those who used to work – how being out of work has changed their lives.
Overall, the survey paints a portrait of a diverse group of Americans who are out of the workforce. This report focus on three main categories within the non-employed: those who say they have a disability that prevents them from working, those who are able to work and consider themselves unemployed, and those who are able to work and call themselves homemakers. (In a few places, it draws on data from the Kaiser Health Tracking Poll for comparisons to full-time workers in the same age range.) While most homemakers report that they are happy with their current situation, most of those who are disabled or unemployed say it is a source of stress, and that being out of work has been a hardship for them and their families. These latter two groups report a variety of negative impacts of being out of work in terms of health, relationships, and finances. The survey finds that most of those who are unemployed and looking for work would be willing to make a variety of sacrifices to find a new job, including in some cases taking significant pay cuts. In addition, it finds that most homemakers say they plan to go back to work in the future, and that many would be more likely to return to the workforce now for jobs that provide flexible hours, the ability to work from home, or an increase in pay over their most recent job.
See The New York Times and CBS News coverage of the poll:
Americans ages 25-54 who are not currently working (a group we will refer to throughout this report as “the non-employed”)2, make up 13 percent of the entire U.S. adult population. Among this group, about a third (34 percent) say they have a disability that prevents them from doing any kind of work for at least the next 6 months. The remainder say they are able to work, including about a quarter each who consider themselves unemployed (24 percent) and homemakers (26 percent), 10 percent who call themselves students and 4 percent who say they are retired.
Figure 1
Most of the non-employed (61 percent) say their last job ended after the start of the recession in December 2007, while a quarter (25 percent) say they have not worked since before the start of the recession and 13 percent have never had a full-time job.
Two-thirds (67 percent) of the non-employed are women, while six in ten full-time workers in the same age range are men3. Compared with full-time workers, the non-employed are more likely to be African American (14 percent versus 10 percent) or Hispanic (20 percent versus 15 percent). More than half (54 percent) have only a high school education or less, and one in five (20 percent) have graduated from a 4-year college (compared with 39 percent of full-time workers).
The non-employed report being in significantly poorer health than their full-time working counterparts. Nearly four in ten (37 percent) say their health is “only fair” or “poor,” compared with just 11 percent of full-time workers. This difference in health status is driven largely (but not entirely) by those who say they have a disability that prevents them from working.
Three-quarters (74 percent) of the non-employed report having health insurance coverage. Compared with full-time workers, the non-employed are much less likely to get coverage through an employer (27 percent versus 77 percent), and are more likely to buy it on their own (12 percent) or get it through Medicaid (22 percent) or Medicare (9 percent). One-quarter of the non-employed are uninsured, about 10 percentage points higher than among full-time workers (14 percent).
FIGURE 2: Demographics Of Non-Employed Versus Full-Time Workers
There are demographic differences within subgroups of the non-employed as well. The vast majority (97 percent) of those who call themselves homemakers are women, as are six in ten (62 percent) of those who say they are unemployed and able to work. Those who have a disability that prevents them from working are more evenly split between women (53 percent) and men (47 percent). Within the prime-age non-employed, those with a disability are also much older on average than those who say they are able to work – six in ten of them are between the ages of 45-54, compared with about three in ten among those without a disability.
FIGURE 3
These groups also differ greatly in terms of likeliness to have health insurance and sources of coverage. Eighty-five percent of those with a disability say they have coverage, mostly through public programs (61 percent). Three-quarters (74 percent) of homemakers report getting coverage, most commonly through a spouse’s employer (54 percent). Those who are unemployed and able to work are much less likely to report being insured, with four in ten (43 percent) saying they have no health insurance coverage at all.
FIGURE 4
Job-Wanting And Job-Seeking
Nearly six in ten (57 percent) of the non-employed say they currently want a job, including 34 percent who say they want to be working full-time and 23 percent who part-time work. Among those who consider themselves unemployed and are able to work, the vast majority (87 percent) say they want a job, including 67 percent who want a full-time job. Even among those who say they have a disability that prevents them from working, fully half say they currently want a job, suggesting that many would prefer to return to work if their disability were not a factor.
About four in ten (43 percent) of those who call themselves homemakers and are not disabled say they currently want a job, though more would prefer part-time rather than full-time work (27 percent versus 16 percent). Overall, most homemakers say they either want a job now or will want to go back to work someday; just 13 percent of this group says they don’t want a job now and don’t think they’ll want one in the future.
FIGURE 5
Among those who consider themselves unemployed and able to work, most report that they have actively looked for work within the past year. Nearly eight in ten (78 percent) say they have contacted someone about finding a job or applied for a job within the past 12 months, including 57 percent who report having done so in the past 4 weeks. However, 14 percent say they haven’t done any active job-seeking in over a year, suggesting that they may have become discouraged and given up looking.
FIGURE 6
Factors Contributing To Being Out Of Work
The non-employed overall attribute their employment situation to a mix of personal and economic factors. Over half say family responsibilities (53 percent) and health problems (51 percent) are major or minor reasons why they’re not working, similar to the share who name lack of good jobs available (48 percent). Other reasons are cited by smaller shares, including lack of education and skills necessary for the jobs available (38 percent), not needing the income (38 percent), jobs being replaced by technology (30 percent), jobs going overseas (26 percent), and discrimination (22 percent).
This overall ranking of reasons masks some big differences between groups. For those who are able to work and consider themselves unemployed, the top reason is lack of good jobs available (66 percent), though about half name family responsibilities (52 percent) as well. Among homemakers, family responsibilities are far and away the top reason (84 percent), followed by not needing the income (50 percent). Still, a substantial share of homemakers (41 percent) say lack of good jobs available is a major or minor reason why they’re not working, suggesting that many of them might have continued working or returned to the job market if more attractive opportunities were available. For those with a disability, health problems are by far the most common reason given for being out of work (96 percent), though many cite other contributing factors as well, including lack of good jobs available (45 percent).
FIGURE 7: Factors Contributing To Employment Situation Among Non-Employed
All Non-Employed
Unemployed, Able To Work
Disabled, Unable To Work
Homemaker, Able To Work
Percent who say each is a major or minor reason why they are not working
Family responsibilities
53%
52%
37%
84%
Health problems or disability
51
32
96
22
Lack of good jobs available
48
66
45
41
Lack of education or skills necessary for the jobs available
38
42
38
29
You don’t need the income
38
35
34
50
Jobs being replaced by technology
30
35
34
23
Jobs going overseas
26
32
30
19
Discrimination
22
28
26
15
General Impacts Of Not Working
Almost two-thirds of those with a disability who are unable to work (64 percent), and of those who consider themselves unemployed and are able to work (63 percent), say that their employment situation is a source of stress, including about four in ten who say it’s a major source of stress in their lives. Among full-time workers in the same age range, far fewer (42 percent) say their employment situation is a source of stress, including just 14 percent who say it’s a major source. By contrast, those who call themselves homemakers are far less likely to feel stressed about their employment situation, with over three-quarters (77 percent) saying it is not a source of stress at all.
FIGURE 8: Employment-Related Stress Among Non-Employed And Full-Time Workers
Many of those who are unemployed and able to work report feeling a negative impact on their health and relationships. This group is more likely to say their employment situation is bad rather than good for their physical health (40 percent versus 16 percent), their mental health (40 percent versus 15 percent), their sleep (37 percent versus 8 percent), and their romantic relationships (35 percent versus 15 percent). However, they are equally likely to see a positive as a negative impact on their relationships with friends, with most saying it hasn’t had much impact.
FIGURE 9
How Do The Non-Employed Make Ends Meet?
About half (51 percent) of the non-employed overall say they feel financially secure, including 18 percent who feel very secure and 33 percent who feel somewhat secure. The other half say they feel somewhat (23 percent) or very insecure (25 percent). While three-quarters (76 percent) of homemakers report feeling financially secure, about six in ten of those who are unemployed and disabled say the opposite (60 percent and 61 percent, respectively.
FIGURE 10
The non-employed report relying on a variety of sources of income and benefits. The most common is income from a spouse or another employed person in their household (42 percent), followed by Food Stamps (30 percent), disability benefits (28 percent), and money from family and friends (26 percent). Less common sources are income from temporary work or odd jobs (19 percent), money taken out of savings or retirement (17 percent), and spousal or child support (11 percent). Just 3 percent report getting unemployment benefits.
These sources of income vary greatly within the non-working population. Those who are unemployed and able to work report relying on a variety of sources, with about a third each saying they get income from a spouse or another employed person in their household (34 percent), money from family from friends (33 percent), Food Stamps (32 percent), and income from temporary work or odd jobs (31 percent). Those with a disability that prevents them from working are most likely to report getting disability benefits (69 percent) and Food Stamps (45 percent). By contrast, the main source of income for homemakers is income from a spouse or another employed person in the household (71 percent).
FIGURE 11: Sources Of Income And Benefits Among The Non-Employed
All Non-Employed
Unemployed, Able To Work
Disabled, Unable To Work
Homemaker, Able To Work
Percent who say they get any income, money, or benefits from:
Income from spouse or another employed person in household
42%
34%
30%
71%
Food Stamps
30
32
45
14
Disability benefits, SSI, or SSDI
28
8
69
2
Money from family and friends
26
33
29
10
Income from temporary work or odd jobs
19
31
9
16
Money taken out of savings or retirement
17
24
12
11
Spousal or child support
11
12
6
19
Unemployment benefits
3
7
2
1
For Those Who Used To Work, How Has Being Out Of Work Changed Their Lives?
Among those who used to work full-time (who make up 87 percent of the prime-age non-employed), roughly equal shares say being out of work has been a hardship and caused major life changes (30 percent), that it’s been difficult but not caused major life changes (35 percent), and that it hasn’t had much of an impact one way or another (34 percent). Those who used to work but now have a disability that prevents them from working are the most likely to report experiencing major hardship as a result of being out of work (48 percent), followed by those who are unemployed (32 percent). Few previously employed homemakers (7 percent) say that not working has been a major hardship, though nearly four in ten (37 percent) say it has been difficult.
This may be related to the fact that two-thirds (67 percent) of previously employed homemakers say it was their own decision to leave their last job, while just three in ten (31 percent) of the unemployed and a quarter (25 percent) of those who are unable to work due to a disability say the same.
FIGURE 12
Those who were previously employed also report a variety of financial impacts as a result of not working. Not surprisingly, this is particularly true for those who are either disabled or able to work but unemployed, and less so for those who call themselves homemakers. Most commonly, about half of those who call themselves unemployed (50 percent) and disabled (54 percent) say they’ve borrowed money from family and friends as a result of being out of work. At least four in ten in each of these groups say they have put off health care they thought they needed because of the cost (47 percent and 41 percent, respectively) or taken money out of savings or retirement accounts to make ends meet (43 percent and 40 percent). A third (35 percent) of the unemployed and half (50 percent) of those with a disability and a say they’ve been contacted by a collection agency. A quarter (24 percent) of the unemployed and 45 percent of the disabled say they have received food from a non-profit or religious organization. Smaller, but still important shares of these groups say they have changed their living situation, such as moving in with a friend or relative to save money (35 percent and 28 percent), increased their credit card debt (27 percent and 26 percent), missed a rent or mortgage payment (24 percent and 28 percent), or had at least one of their utilities turned off (12 percent and 19 percent) as a result of being out of work.
FIGURE 13: Financial Impacts Of Being Out Of Work Among Previously Employed
All Non-Employed Who Ever Had A Full-Time Job
Unemployed, Able To Work
Disabled, Unable To Work
Homemaker, Able To Work
Percent who say each of the following has happened as a result of not working
Borrowed money from family or friends
41%
50%
54%
16%
Put off or postponed getting needed health care because of cost
37
47
41
22
Taken money out of savings or retirement
37
43
40
27
Been contacted by a collection agency
35
35
50
21
Received food from a non-profit or religious organization
29
24
45
15
Changed living situation to save money
26
35
28
9
Increased credit card debt to pay bills
25
27
26
20
Missed a rent or mortgage payment
20
24
28
6
Had any utilities turned off
13
12
19
2
For those who used to work, being out of work has also changed their daily activities. Large shares of the previously employed say that since they stopped working, they spend more time doing household work or chores (57 percent), engaging in leisure activities like reading and watching TV (56 percent), and caring for family members who need assistance (45 percent). The vast majority of previously employed parents of minor children (88 percent) say they now spend more time on child care.
What Would It Take To Get The Non-Employed Working?
Among those who consider themselves unemployed and able to work, most are at least somewhat optimistic about their future job prospects. Half (50 percent) of this group says it’s very likely that they’ll be working 6 months from now, and another 35 percent think it somewhat likely. Among homemakers, most don’t think it’s likely that they’ll be working in the next 6 months, but over half (53 percent) say it’s very or somewhat likely that they’ll be working in one year, and over seven in ten (72 percent) think they’re likely to be working 5 years in the future. By contrast, a majority (57 percent) of those with a disability that prevents them from working now say it’s unlikely they’ll be working 5 years from now.
Among those who consider themselves unemployed, able to work, and have looked for a job in the past year (an approximation of those who are “in” the market for a job), large shares report being willing to make various sacrifices in order to find work. Over eight in ten say they would willingly take an entry-level job in a new field (86 percent) or return to school or a job training program (81 percent), and about three-quarters would be willing to work non-traditional hours such as night or weekend shifts (77 percent). Six in ten (61 percent) say they’d be willing to work for minimum wage. Among those who’ve worked previously, nearly seven in ten (69 percent) say they’d be willing to take a 10 percent pay cut from what they earned at their last job, though fewer (37 percent) would be willing to accept a 25 percent reduction. Nearly half also say they’d be willing to move to a different city (45 percent) or take a job that requires more than an hour commute each way (46 percent).
FIGURE 14
On the other side, many homemakers who say they are able to work but have not looked for a job in over a year (those who are “out” of the market for a job) say they’d be more likely to consider taking a job if it came with certain perks, including being allowed to work from home, having flexible hours, being in an interesting field, providing significant opportunities for advancement, and offering childcare.
FIGURE 15
The large majority (91 percent) of homemakers who are “out” of the market for a job say that they would be willing and able to take a job that pays 10 percent more than their previous job, suggesting that many of those who are not in the job market now could be enticed back to work for an increase in pay.
Among those who are disabled and unable to work, about two-thirds (68 percent) say their disability prevents them from working under any circumstances, while just over a quarter (27 percent) say there are accommodations an employer could make that would make it possible for them to work. These range from physical accommodations such as office modifications and limits on physical work, to scheduling accommodations such as flexible hours and rest periods, to other accommodations such as help with transportation and being allowed to work from home.
FIGURE 16
Conclusion
Americans of prime working age who are not currently working – including those who are counted in government statistics as officially unemployed and those who fall in the category of “outside the labor force” – represent a diverse and complicated group. Their reasons for not working are multiple and varied, with health problems, family responsibilities, and a sense that there are no good jobs available playing the most prominent roles.
Those who consider themselves unemployed and able to work (who make up about a quarter of the non-employed) report facing particular struggles as a result of their situation, and most say they’d be willing to make a variety of sacrifices in order to find a job. These individuals see a lack of good jobs available as the main factor contributing to their lack of employment, yet most are at least somewhat hopeful about finding work in the future. Those with a disability that prevents them from working (who make up a third of the non-employed) also report a variety of ill-effects of being out of work, and their future outlook is more pessimistic than it is for the able-bodied unemployed. Although many say they want to be working, most say their disability prevents them from working under any circumstances, and most do not expect to find work in the future. Still, about a quarter say they could return to work with certain accommodations, suggesting that a segment of this population may return to the workforce in the future. The survey also points out the role of government benefits in helping this group make ends meet, as many report relying on public programs for income, food assistance, and health care.
The experiences of those who call themselves homemakers (who make up a quarter of the non-employed) stand in sharp contrast to these previous two groups. Most say they are not working by their own choice, and most have the resources – such as income from a working spouse – to feel financially secure. Still, the survey suggests that at least some homemakers see a lack of good jobs as one reason they’re not currently working, and many say they could be enticed back into the job market for a job that paid more or offered perks such as flexible hours. There is a gender component underlying all of this, with nearly all homemakers and a majority of the able-bodied unemployed being women. These non-working women, who are more likely than their male counterparts to have children living at home, may place more of a premium on jobs that allow them the flexibility to help care for their children.
Methodology
The Kaiser Family Foundation/New York Times/CBS News Non-Employed Poll is based on telephone interviews conducted November 11 through November 25 with 1,002 respondents between the ages of 25 and 54 who are currently not employed either full-time or part-time. Interviews were administered in English and Spanish, combining random samples of both landline and cellular telephones.
The Foundation, The Times, and CBS News contributed financing for the survey, and teams from all three organizations worked together to develop the questionnaire and analyze the data. Each organization is solely responsible for its content.
SSRS of Media, Pennsylvania conducted sampling, interviewing, and tabulation for the survey. Respondents were reached in one of three ways:
350 interviews were completed with respondents reached through random-digit dialing to landline (N=151) and cell phones (N=199) specifically for the Non-Employed Poll;
157 interviews were completed with respondents reached via landline (N=78) and cell phone (N=79) as part of the weekly SSRS omnibus poll, which also utilizes random digit dialing to reach respondents;
495 interviews (261 landline and 199 cell phone) were completed by dialing numbers where interviews had been recently completed as part of the SSRS omnibus poll and respondents’ previous answers indicated they met inclusion criteria for the survey.
For each sample, landline telephone exchanges were randomly selected from a complete list of active phone exchanges. The samples were designed so that the selected exchanges amounted to a proportional geographic representation of the U.S. (including Alaska and Hawaii). Within each exchange, random digits were added to form complete telephone numbers. Cellular telephone numbers were generated using a similar procedure to the one described for landlines. Both the landline and cell phone samples were generated by Marketing Systems Group. Within each household reached by landline, one qualifying adult was designated by a random procedure to be the respondent for the survey. Cell phone interviews were completed with the qualifying adult answering the phone.
Interviewers made multiple attempts to reach every phone number in the survey, calling back unanswered numbers on different days at different times of both day and evening, and attempting to convert initial refusals.
The combined results have been weighted to adjust for the fact that not all survey respondents were selected with the same probability, to address the implications of sample design, and to account for systematic nonresponse along known population parameters. The first weighting stage was conducted separately for each of the 3 samples, and addressed differences in probability of selection stemming from respondents’ likelihood of owning multiple telephones, as well as the number of adults in each household. The callback sample was also adjusted for individual propensity to respond to a follow-up contact.
In the second weighting stage, the 3 samples were combined and adjusted to match known demographic distributions of the target population. Typically, researchers use demographic weighting parameters based on national administrative data sources such as the U.S. Census Bureau’s American Community Survey. However, the non-employed as defined for this poll are not equivalently captured by the Census Bureau employment definitions. Thus, to generate population parameters, SSRS calculated population weights for all interviews completed to date in 2014 on its omnibus poll with respondents 25 to 54 years old (N=19,269) by matching estimates from the Census Bureau’s Current Population Survey March 2014 Supplement based on age, gender, race/ethnicity, nativity (for Hispanics), education, marital status, Census region, and phone status. These interviews were then filtered to only include those ages 25 to 54 who are non-working (N=4,574). This created population parameters unique to the target population, which were used as targets for demographic weighting of the combined sample. Self-defined employment status (homemaker, student, retired, temporarily unemployed, other) was also added as a weighting target in the final stage.
The margin of sampling error including the design effect for the full sample is plus or minus 4 percentage points. Numbers of respondents and margin of sampling error for key subgroups are shown in the table below. For results based on other subgroups, the margin of sampling error may be higher. Sample sizes and margins of sampling error for other subgroups are available by request. Note that sampling error is only one of many potential sources of error in this or any other public opinion poll.
Group
N (unweighted)
M.O.S.E.
Total Non-Employed Ages 25- 54
1,002
±4 percentage points
Disabled, unable to work
406
±6 percentage points
Able to work, unemployed
205
±8 percentage points
Able to work, homemaker
239
±8 percentage points
Kaiser Family Foundation public opinion and survey research is a charter member of the Transparency Initiative of the American Association for Public Opinion Research.
For purposes of this report, “non-employed” or refers to adults between the ages of 25-54 who answer “not at all” to the question: “Are you currently employed full-time, part-time, or not at all?” ↩︎
Comparisons to full-time workers ages 25-54 are based on the November Kaiser Health Tracking Poll, conducted Nov. 5-13, 2014. ↩︎
Source: November Kaiser Health Tracking Poll, conducted Nov. 5-13, 2014. ↩︎
Source: November Kaiser Health Tracking Poll, conducted Nov. 5-13, 2014. ↩︎
As we enter the last two years of President Obama’s final term, with a newly reshaped Congress after the mid-term elections, what is in store for U.S. global health policy? What are the key issues in need of attention and will they be addressed now or have to await the arrival of a new President 2017? Will the recent Ebola outbreak in West Africa change the equation? Here’s our pick of eight questions that together, are likely to shape the future of the U.S. response.
How Should the U.S. Balance a Shifting Burden of Disease with the Unfinished MDG Agenda? Currently, U.S. global health programs are squarely targeted on traditional global health challenges – the “MDG agenda” of tackling major communicable diseases such as HIV, malaria, and tuberculosis, and maternal and child health and family planning and reproductive health – even as new global health challenges have emerged and the global burden of disease has shifted. While the traditional agenda still represents the primary health challenges facing the region of sub-Saharan Africa and some of the poorest countries around the world, in all other regions, the most pressing health challenges come primarily from non-communicable diseases (NCDs) such as cancer, heart disease, and diabetes. This shifting burden has led some to call for more U.S. investment in global NCD efforts while others have worried that such investments could come at the expense of the remaining global health agenda and the poorest of the poor. These questions and the pressure to pivot U.S. programs and funding will likely become even more pronounced as the global community moves into the post-2015 era and the burden of disease continues to shift even further.
What Can We Learn from Ebola? The biggest global health story of 2014 took everyone by surprise: an epidemic of Ebola (primarily in three West African countries) that quickly grew to a truly unprecedented size. The epidemic spilled across national and regional borders, generating fear and, eventually, a global response including sizeable financial and personnel contributions from the U.S. government. Many have pointed to the lack of investment in health systems in the highly affected countries as being the key reason for the spread of Ebola there and the subsequent global repercussions. Until now, U.S. investments in and programmatic focus on strengthening health systems, especially the kinds of basic public health capabilities that would help address emerging health threats such as Ebola, have been fairly meager. Recognizing that country capacity for preventing, detecting and responding to emerging threats was limited, the U.S. did launch a new effort earlier this year (and before anyone was talking about Ebola in West Africa) called the Global Health Security Agenda to bolster these capacities along with 30 partner countries. Will recent events end up having a lasting effect on the U.S. Global Health Security Agenda, and on U.S. support for strengthening health systems? Will the emergency Ebola funding included in the FY2015 budget support GHSA objectives, and will it translate into meaningful progress on improving basic public health capabilities in the developing world?
Who Will Lead the U.S. Response? When President Obama first took office, he created the Global Health Initiative (GHI), intended to foster “a more integrated approach to fighting diseases, improving health, and strengthening health systems”, and provide a comprehensive U.S. government strategy for global health. The GHI also sought to move toward a more centralized governance and leadership structure for U.S. global health programs. These steps were based on the Administration’s diagnosis that the U.S. approach to global health had become overly siloed, with programs funded, implemented, and evaluated along separate, parallel lines. However, after several years of halting progress and intra-agency tensions, the GHI was effectively abandoned in 2012, and its overall legacy is decidedly mixed. At this point, the structure of U.S. global health programs has returned in large part to its pre-GHI state, and there is no clear leadership structure. With no real overarching leader for U.S. global health programs, who will drive the agenda going forward?
Will Funding Rise to Meet Global Health Priorities? The economic crisis of 2008 and subsequent recession ushered in an era of federal budget austerity, which in turn affected funding for global health. Following a decade of remarkable growth, U.S. global health funding began to level off after 2010 (see graph), though it generally has fared better than some other sectors. The FY 2015 budget bill just introduced in Congress continues this trend, maintaining overall global health funding at current levels. Still, within an essentially fixed budget, this has meant that current priorities have sometimes had to compete with one another and there is little room for funding new or expanded programs, resulting in an increasingly zero sum game. Looking ahead, the fiscal environment is likely to get even tighter in the new Congress. What will this mean for the future of U.S. global health programs, especially with continuing, and in some cases growing, unmet needs? Will funding for global health continue to do relatively well, compared to other sectors?
U.S. Global Health Funding, FY 2001-FY 2015
Will Bipartisanship be Sustained? Support from Democrats and Republicans alike has been one of the hallmarks of U.S. global health policy, most notably seen in PEPFAR, first created by President Bush in 2003, and reauthorized twice by Congress on a bipartisan basis, including in 2008 and again in 2013, the latter being a time when few other pieces of legislation were passed. In addition, as noted above, even though global health funding has plateaued, it has fared relatively well compared to some other areas because of bipartisan support. And even issues that have historically been caught in the partisan crossfire, such as family planning, have also benefited from some bipartisan support. With the loss of some key Congressional global health champions on both sides of the aisle in recent years, including in the most recent election, it is not yet clear how global health will fare.
How Will the U.S. Manage Country Transitions and “Graduation” from U.S. Assistance? Countries receiving U.S. global health assistance have experienced enormous income and demographic changes over the last several decades. In the past decade alone, more than 30 countries have transitioned from low to middle-income status and many others are on the cusp of making such a transition. Today, the majority of the global poor now live in middle-income countries rather than low income ones. In addition, many countries that have historically been aid recipients are increasingly able to use domestic resources to respond to their health needs. As such, global health donors, including the Global Fund, GAVI, and the U.S., are struggling to adjust to these broad trends, and face many challenges to moving in this direction. These include how best and when to begin transferring financial and technical oversight of global health programs to country partners, including civil society; how to ensure that country progress in health is not negatively affected with a reduction in U.S. support; and how to address health inequities that may persist – or reach populations whose needs may not be being met by their government – in countries that otherwise would be candidates for transitioning from U.S. support.
What is the Future of PEPFAR? PEPFAR is the largest health program in the world focused on a single disease and by far the largest program in the U.S. global health portfolio. It has been widely heralded as a major success, helping to stem the tide of the HIV epidemic in sub-Saharan Africa and other hard hit areas. Now in its second decade, PEPFAR remains a cornerstone of the U.S. global health response and is expected to announce new global HIV targets next year. But there are ongoing questions and concerns about how it continues to work towards the goal of achieving an “AIDS Free Generation” in an era of shrinking resources, requiring it to “do more with less” while HIV needs remain significant and deep disparities persist for some populations and within some countries. In addition to resource constraints, other challenges facing the program include: how to continue to support a shift from an “emergency” response to a sustained, country-led model; how to strike the right balance in funding and programming between HIV treatment, prevention, and care, between bilateral HIV programs and the Global Fund, and between HIV and other parts of the U.S. global health portfolio; and how to set new, ambitious targets for the future.
How Should the U.S. Address the Links Between Human Rights & Health? Human rights and health are integrally linked. While promotion of human rights is a stated goal of U.S. foreign and national security policy, the link between human rights and health has only gained more attention within U.S. programs and policy recently. This has been driven by the experience of PEPFAR, which has sought to provide HIV interventions to many who are marginalized and stigmatized within their countries and communities, including men who have sex with men and sex workers, as well as the challenge of addressing gender-based violence among women. In addition, there has been growing awareness of the stigma, discrimination, and violence faced by lesbian, gay, bisexual, and transgender (LGBT) individuals, both within and outside of the health sector, which compromise their ability to access needed health services and can adversely affect health status. In many countries, including those that receive U.S. health and development assistance and/or are key strategic partners of the U.S., the barriers faced by LGBT individuals include discriminatory laws and policies. Recent actions to further criminalize same sex behavior and/or restrict the rights of LGBT persons and their supporters in several countries that are top aid recipients of U.S. support have raised questions about how the U.S. should respond, including whether the U.S. should suspend or redirect aid or implement new policies to govern its assistance.
Given the outsized role of the U.S. in global health, the way in which the U.S. addresses these key issues will have major implications not just for U.S. standing in the world but also for the future trajectory of global health. Key moments to watch will include ongoing negotiations on the budget, the start of the next Presidential campaign, and ultimately, the 2016 election.
In the latest post in the Policy Insights series, Jen Kates and Josh Michaud outline eight questions that are likely to shape the U.S. global health response in the last two years of the current presidential term and beyond.
Follow Jen Kates and Josh Michaud on Twitter, and access previous columns in the Policy Insights series on kff.org.
The Kaiser Family Foundation today released two new Spanish-language tools to help consumers better understand health insurance as they shop for plans during open enrollment for the Affordable Care Act’s marketplaces and in other venues.
El seguro de salud, explicado: ¡los YouToons lo tienen cubierto!, is a Spanish version of the five-minute cartoon video Health Insurance Explained – The YouToons Have It Covered, a light-hearted treatment of a difficult and important topic. It breaks down important health insurance concepts, such as premiums and provider networks, and explains how individuals pay for coverage and obtain medical care and prescription drugs when enrolled in various types of health insurance, including HMOs and PPOs. Pamela Silva Conde, a six-time Emmy Award-winning journalist who co-anchors the Univision Network’s Primer Impacto, narrates the video, which is the third written and produced by the Foundation featuring the YouToons. All three videos are available in both English and Spanish.
Additionally, Calculadora del Mercado de Seguros Médicos, the Spanish version of the Foundation’s Health Insurance Marketplace Calculator, now includes zip code-specific data on 2015 marketplace plans. It allows consumers to generate estimates of their heath insurance premiums and government subsidies based on zip code, household income, family size and ages of family members. The calculator also helps people determine whether they could be eligible for Medicaid.
The Foundation developed the video and calculator to aid Spanish-speaking consumers as they make decisions about health coverage for 2015 — whether through the ACA marketplaces, job-based coverage, or Medicaid. Organizations and individuals are encouraged to embed both tools on their websites, as well as share them via social media. Detailed instructions are available for embedding the calculator. The YouToons video can be embedded via YouTube’s share button.
For other consumer resources, visit the Foundation’s Understanding Health Insurance web page in English or Spanish.
Filling the need for trusted information on national health issues, the Kaiser Family Foundation is a nonprofit organization based in Menlo Park, California.
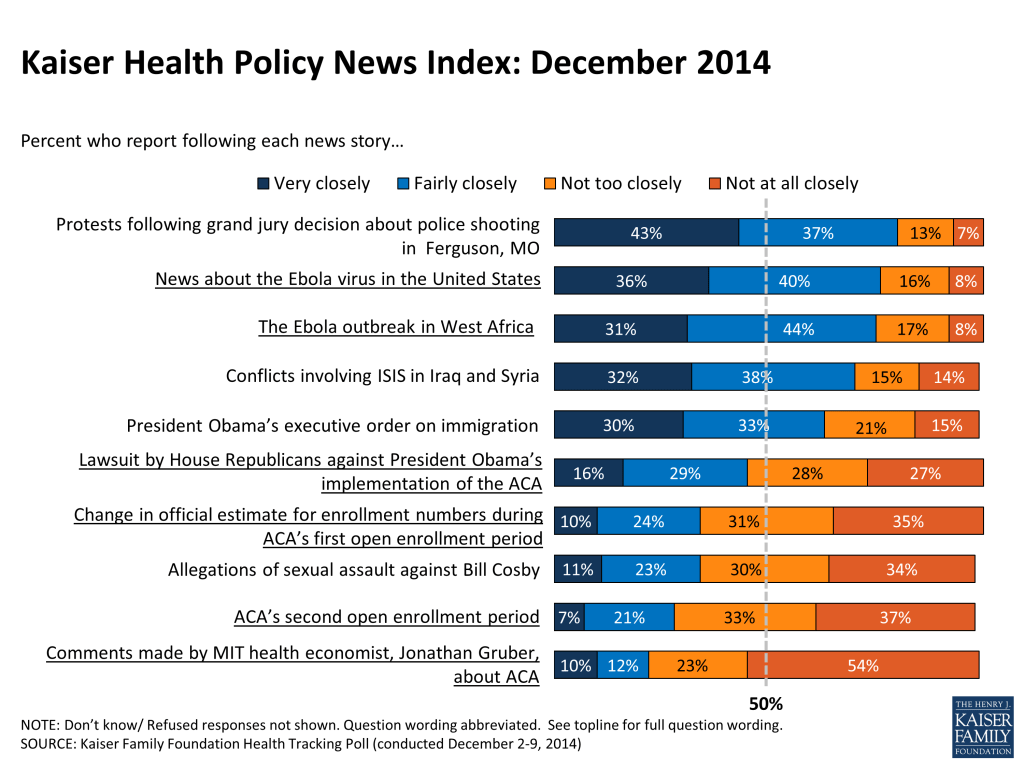
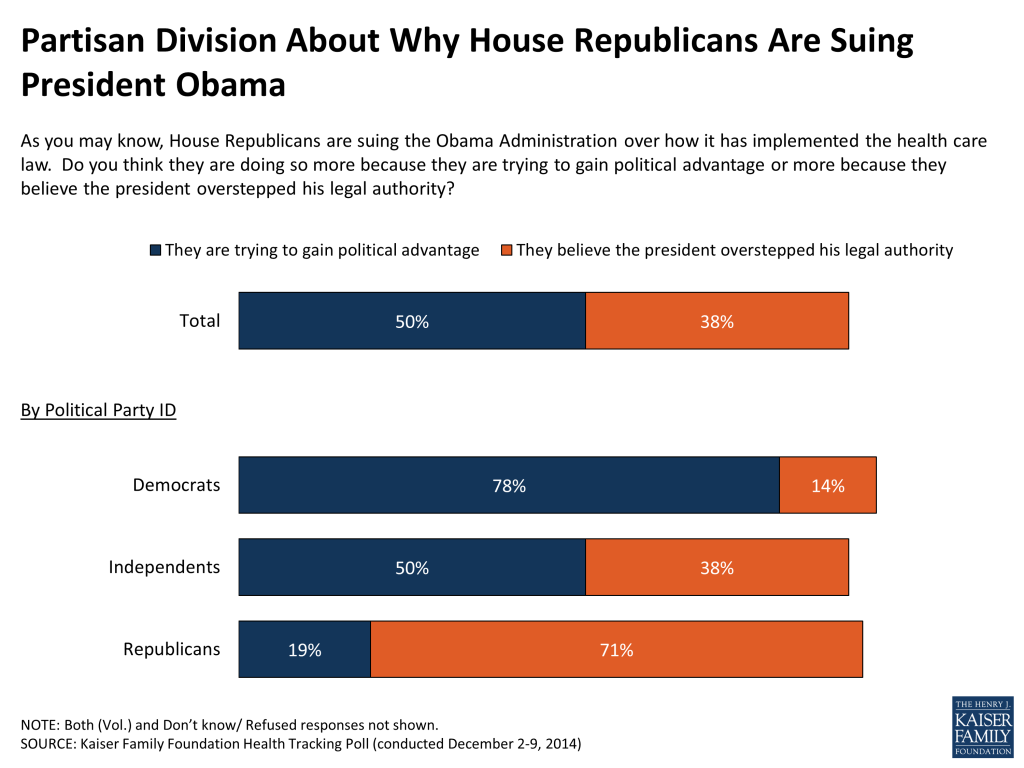
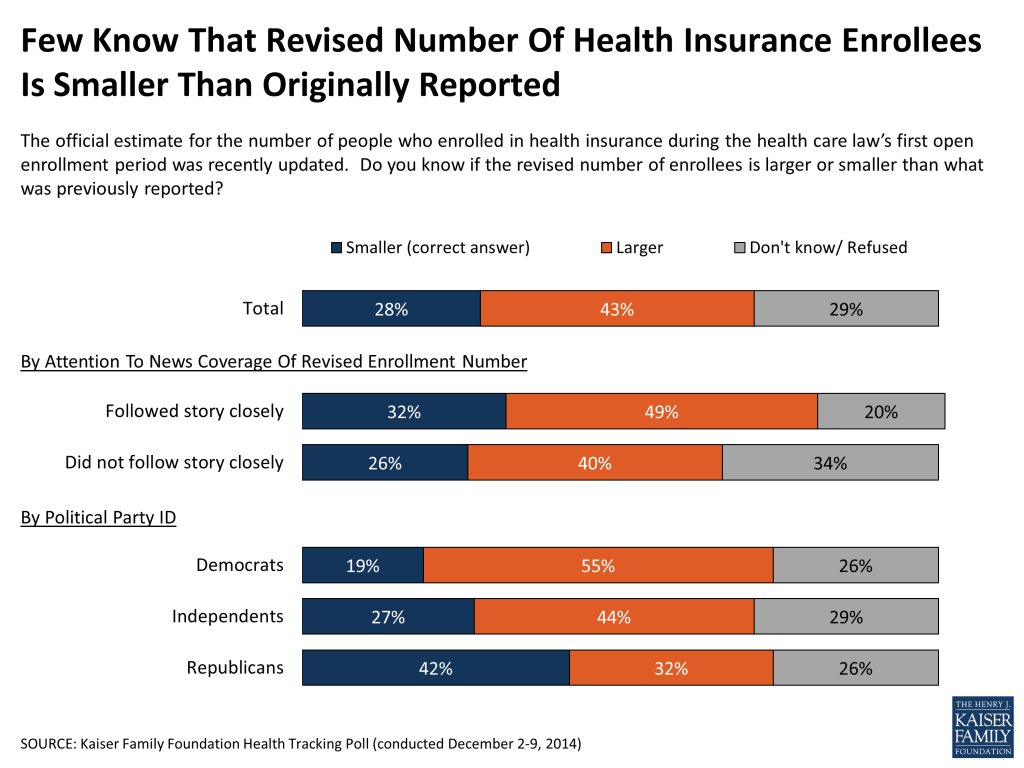
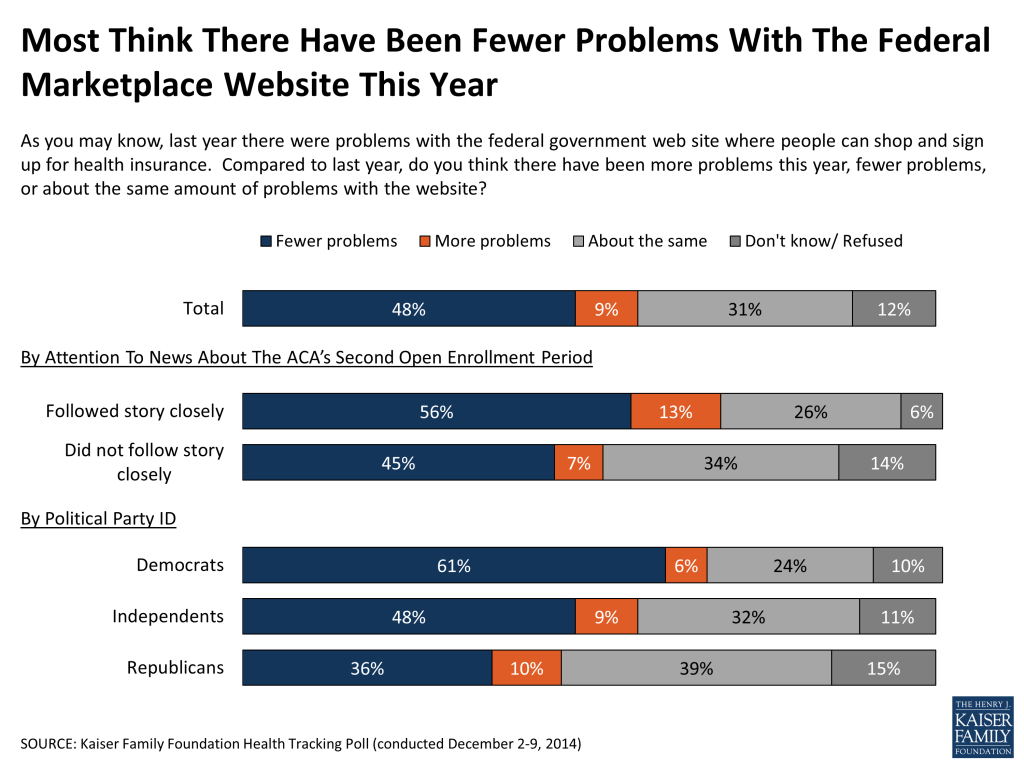
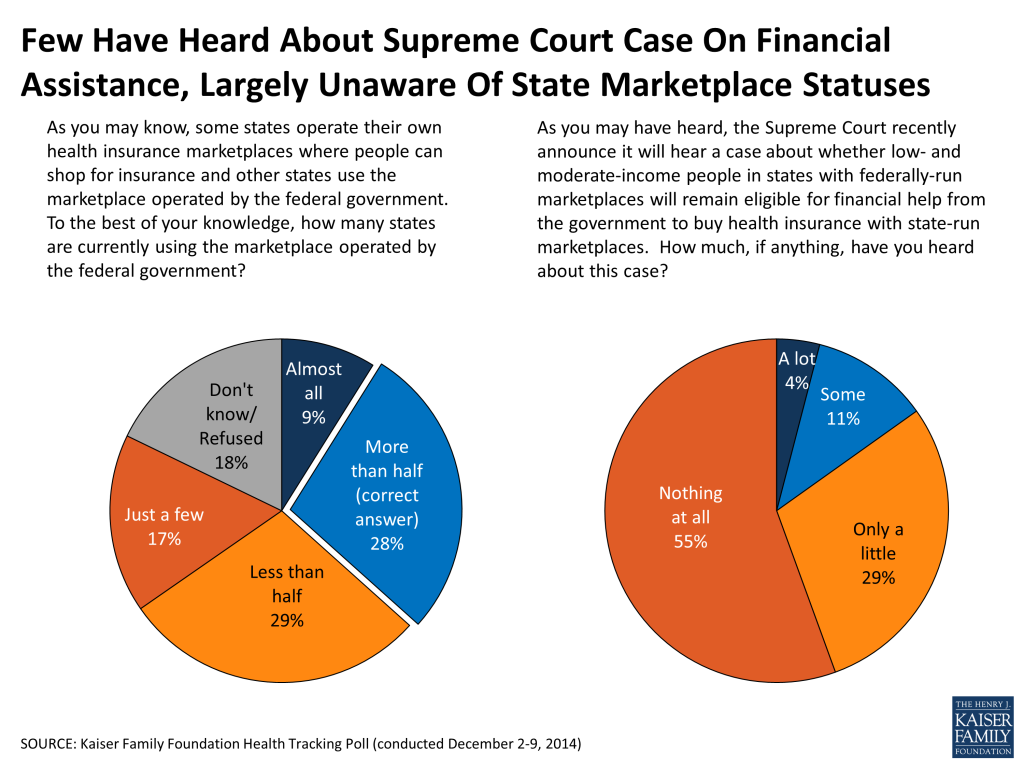
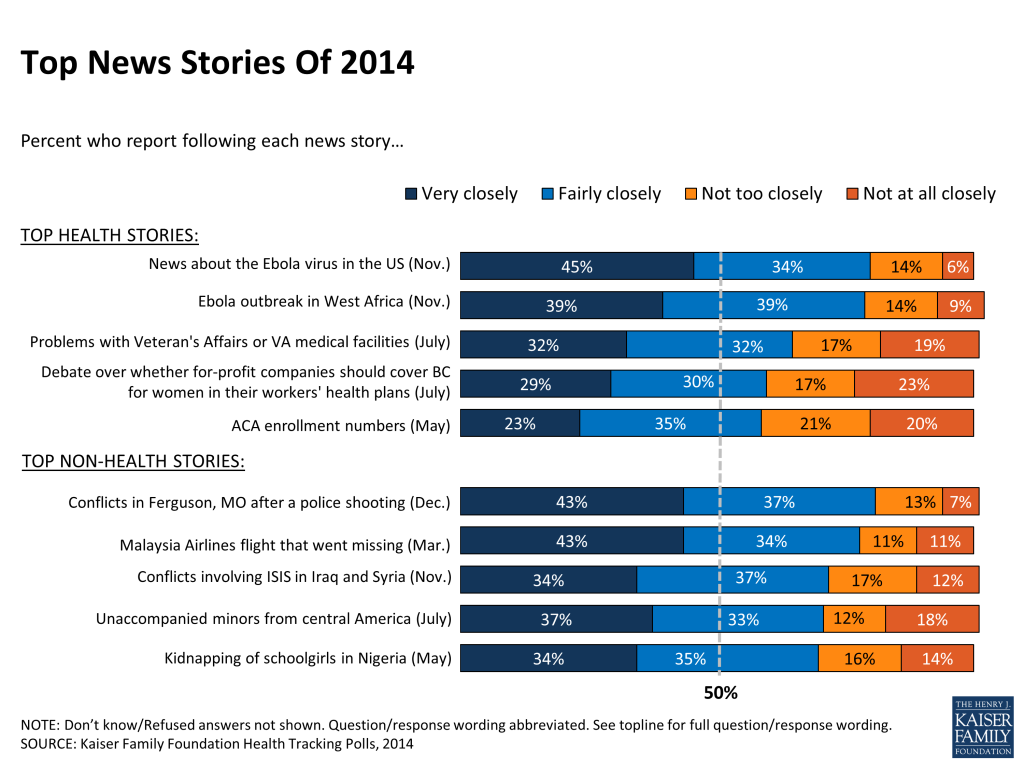
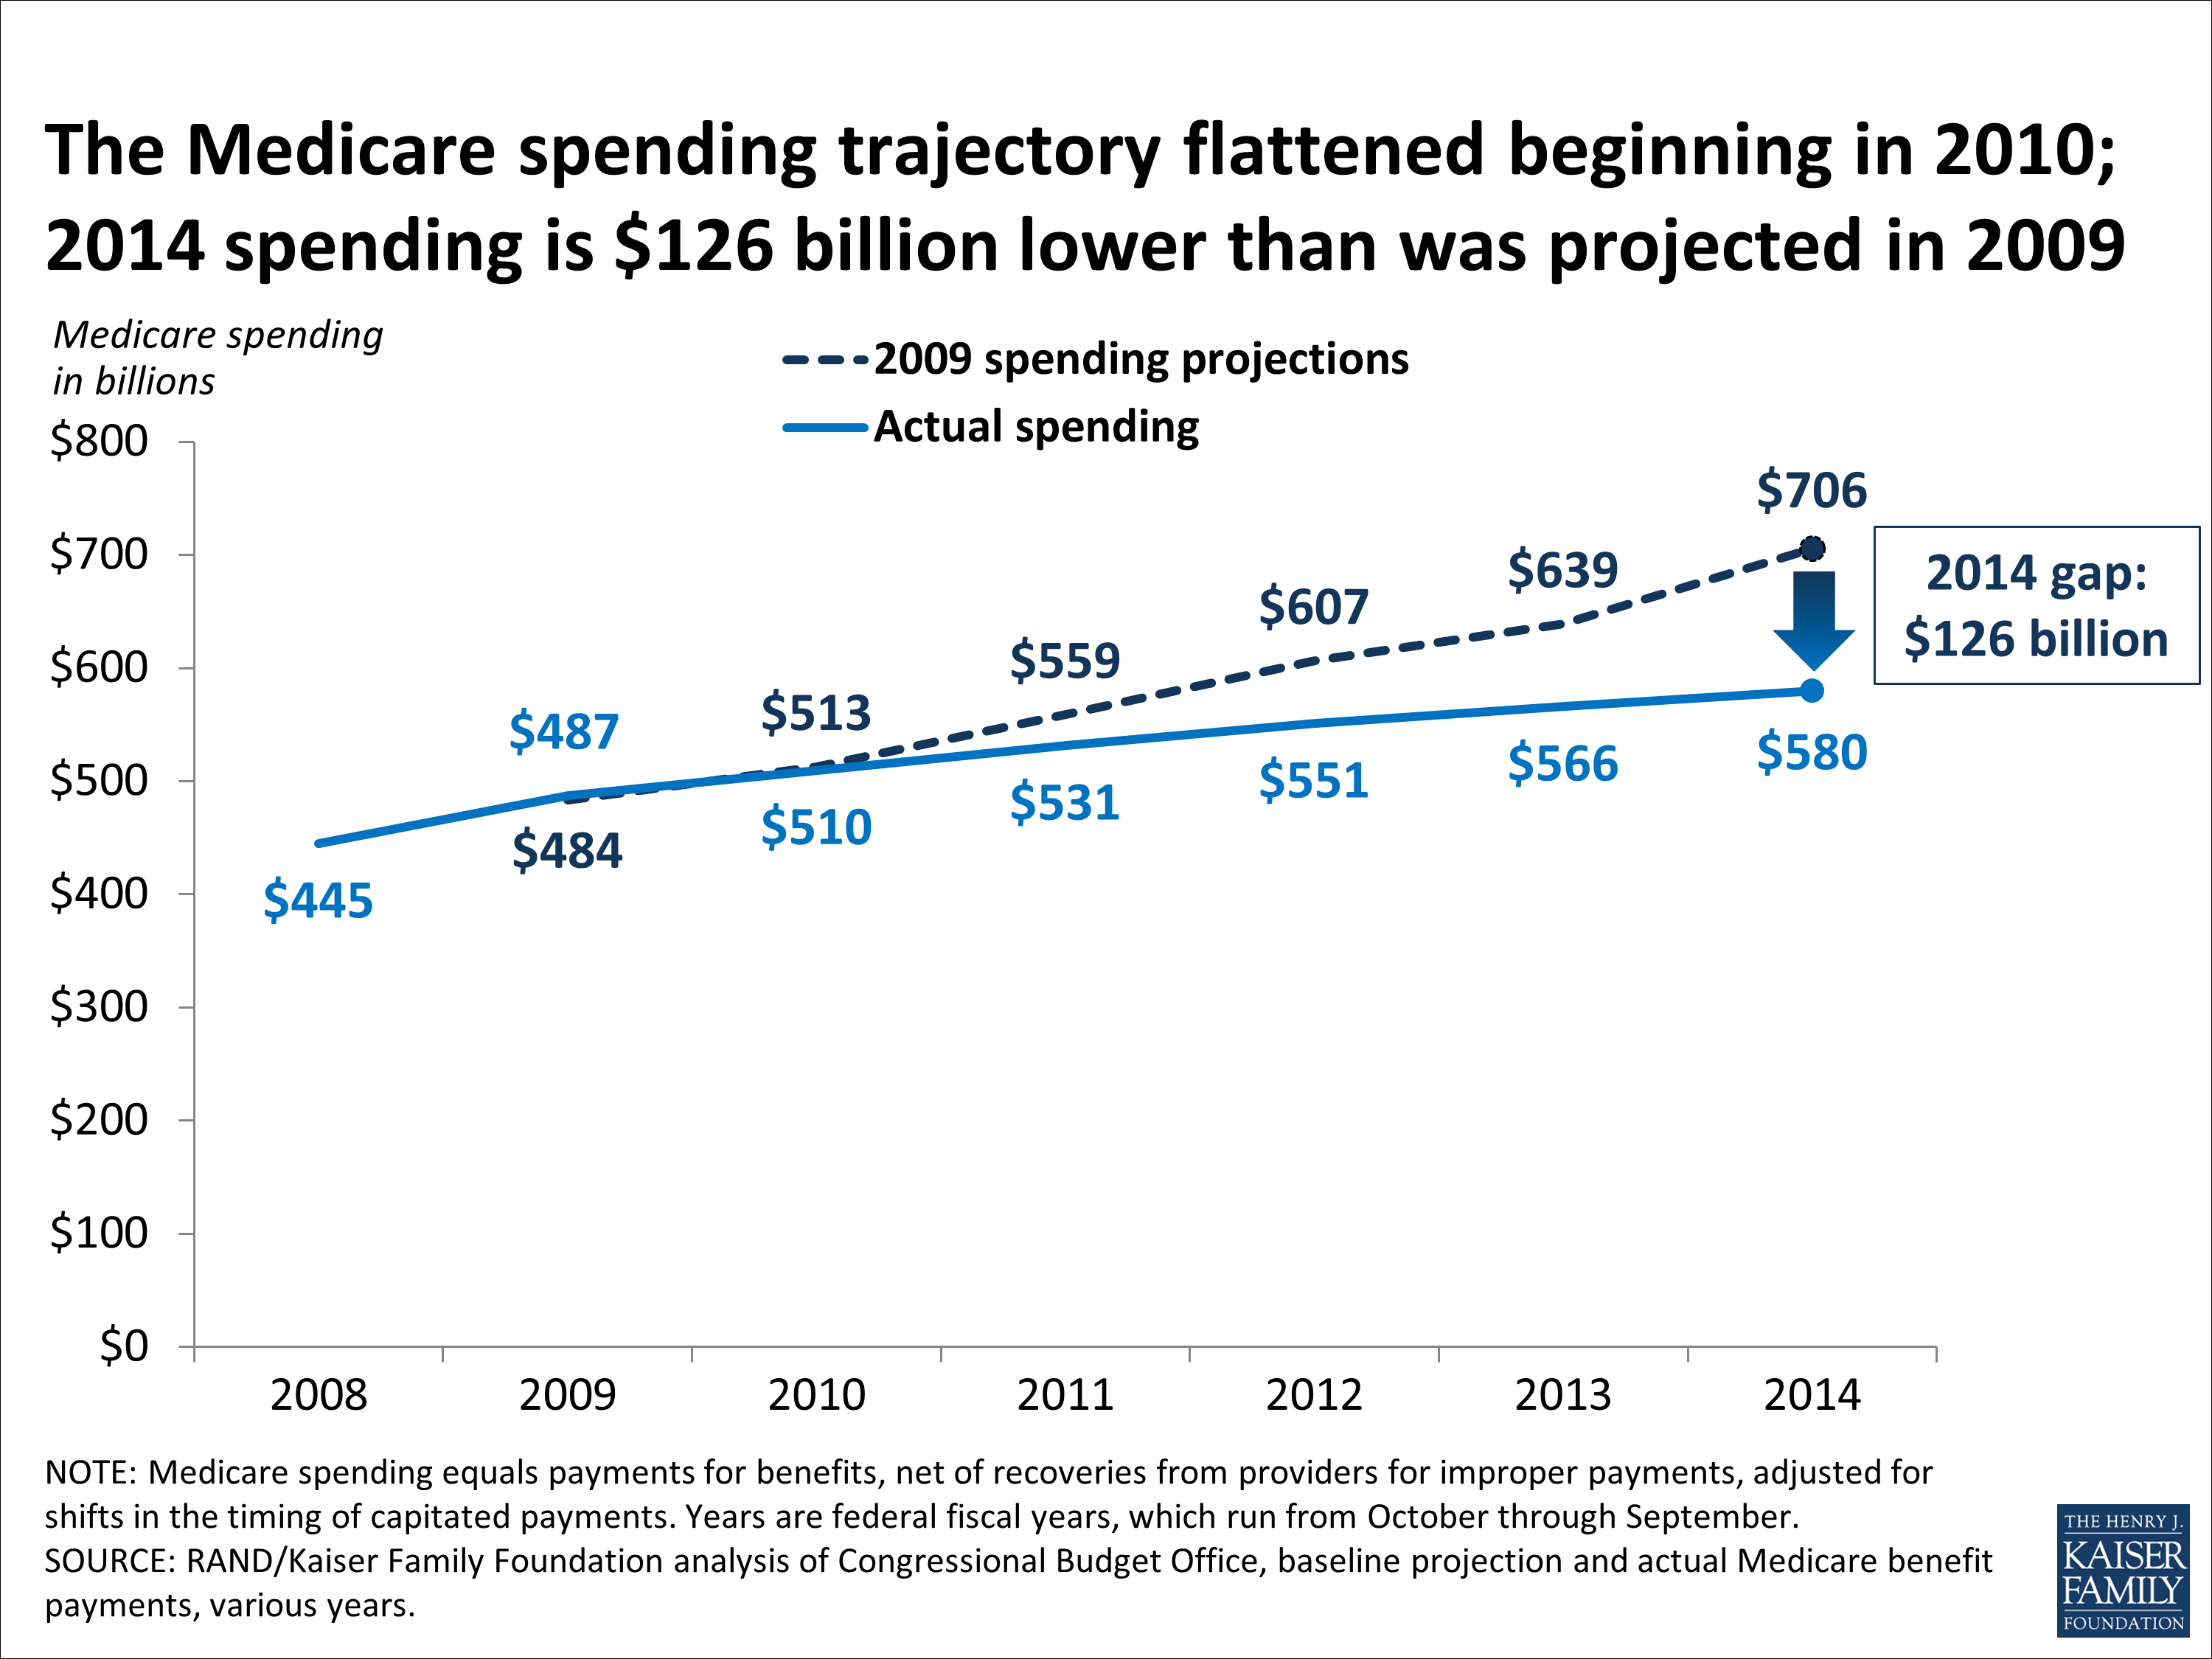.png?t=1418918988185)