KFF designs, conducts and analyzes original public opinion and survey research on Americans’ attitudes, knowledge, and experiences with the health care system to help amplify the public’s voice in major national debates.
Kaiser Health Tracking Poll: Late June 2015 Findings
The latest Kaiser Health Tracking Poll finds that following the Supreme Court’s decision in King v. Burwell, a case challenging the legality of health insurance subsidies in states with federally operated exchanges under the Affordable Care Act (ACA), public attention to the case inched up, though many Americans remain tuned out amid other breaking news stories. When told that the Court ruled to keep the law as it is, allowing subsidies to be provided to low- and moderate-income people in all states regardless of who runs their Marketplace, about 6 in 10 say they approve of the decision while about a third disapprove. Even among Republicans and those who view the ACA unfavorably, about 3 in 10 say they approve of the Court’s decision. The ruling does not appear to have had an immediate effect on the public’s overall views of the law. Opinion remains pretty much evenly divided (43 percent favorable, 40 percent unfavorable), as it has been for the past several months. Still, most Americans do not think the ACA has cleared its last big hurdle with the recent Supreme Court ruling; just 18 percent think the recent debate over who can receive financial help under the law was the last major battle over the ACA, while nearly 8 in 10 think there will be more major battles about the law in the future.
Public Attention and Awareness Of King V. Burwell
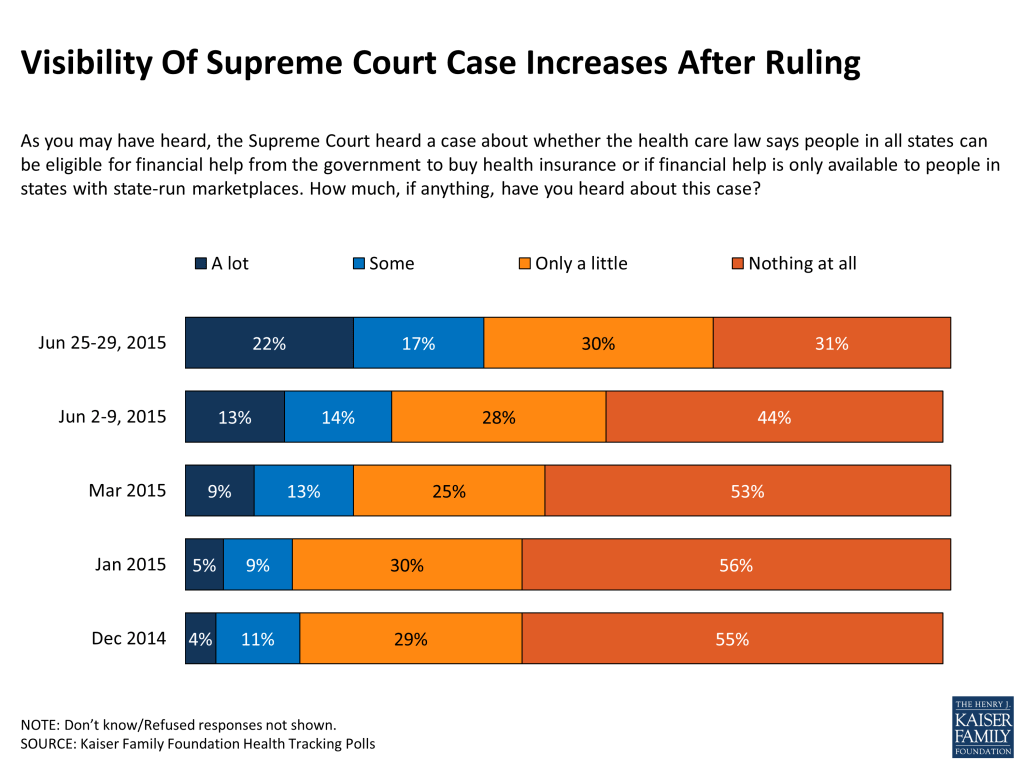
The health care law faced its second major test at the Supreme Court this session, when the legality of who is eligible to receive federal subsidies was challenged in the case King v. Burwell. Since news media began covering the case late last year, small shares of the public have reported hearing much about it. Those shares inched up in recent months, and in the most recent poll (conducted immediately following the ruling), 39 percent say they’ve heard “a lot” or “some” about the case, up from 27 percent earlier in June. Still, even after the ruling a majority (61 percent) say they have heard only a little (30 percent) or nothing at all (31 percent) about the case.
Figure 1
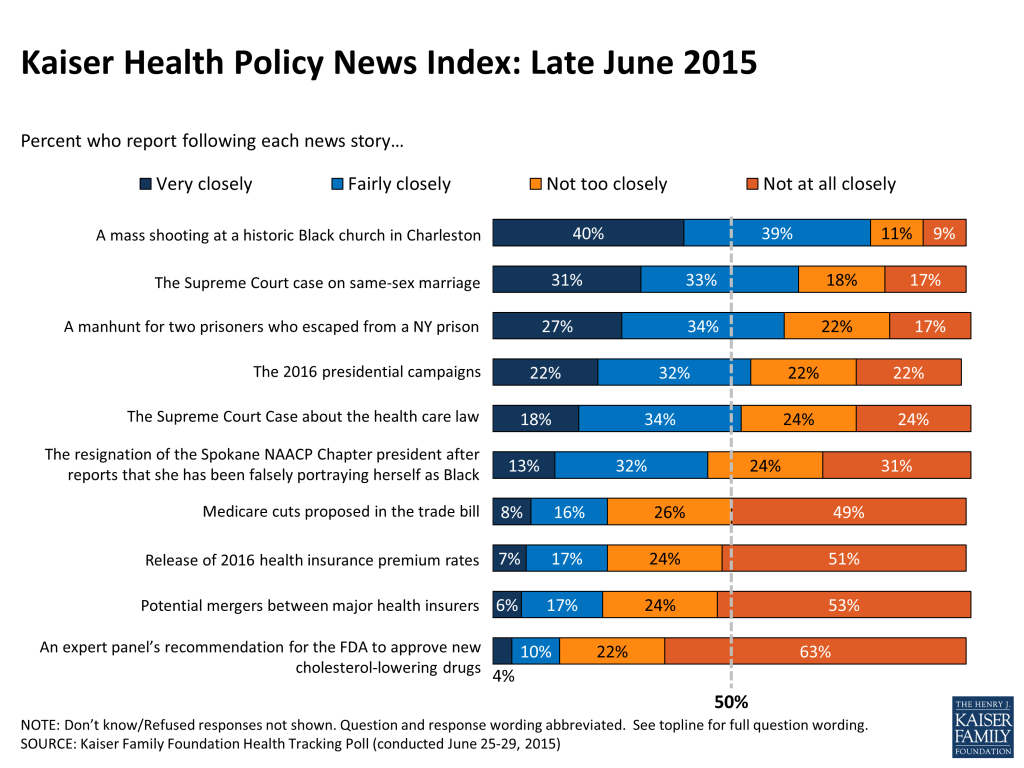
A number of other high-profile news stories garnered more attention than King v. Burwell this month, including the shooting at the Emanuel A.M.E. Church in Charleston, which was followed closely by 8 in 10 Americans (79 percent). About half (52 percent) say they followed the Supreme Court case about the health care law at least “fairly” closely, ranking it behind the Supreme Court case on same-sex marriage (64 percent), the manhunt for two escaped prisoners in New York (61 percent), and the 2016 presidential election campaigns (54 percent). Other health policy stories were followed by smaller shares of the public this month, including the release of 2016 health insurance premium rates (24 percent), Medicare cuts proposed in the trade bill (24 percent), potential mergers between some of the nation’s major health insurers (23 percent), and an expert panel’s recommendations for FDA approval of new cholesterol-lowering drugs (14 percent).
Figure 2
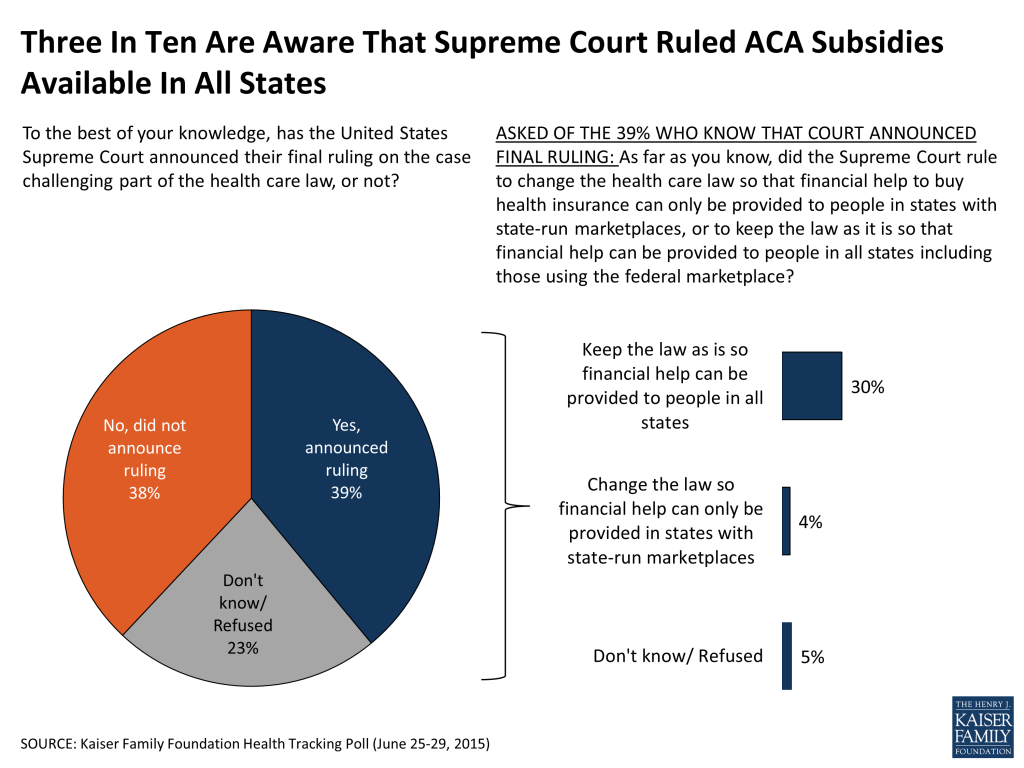
Asked more specifically about the ACA-related Supreme Court case, 4 in 10 (39 percent) are aware that the Court announced its final ruling, while a similar share (38 percent) believe the Court has not ruled and nearly a quarter (23 percent) are unsure. Among those who are aware that the Court ruled, a large majority know what the outcome was. Three in 10 of the public overall correctly answered that the Court ruled that financial help under the law can be provided to people in all states, while just 4 percent mistakenly believe that the court ruled in favor of the plaintiffs and 5 percent are aware the Court ruled but say they don’t know the outcome of the ruling.
Figure 3
Opinions About The Ruling
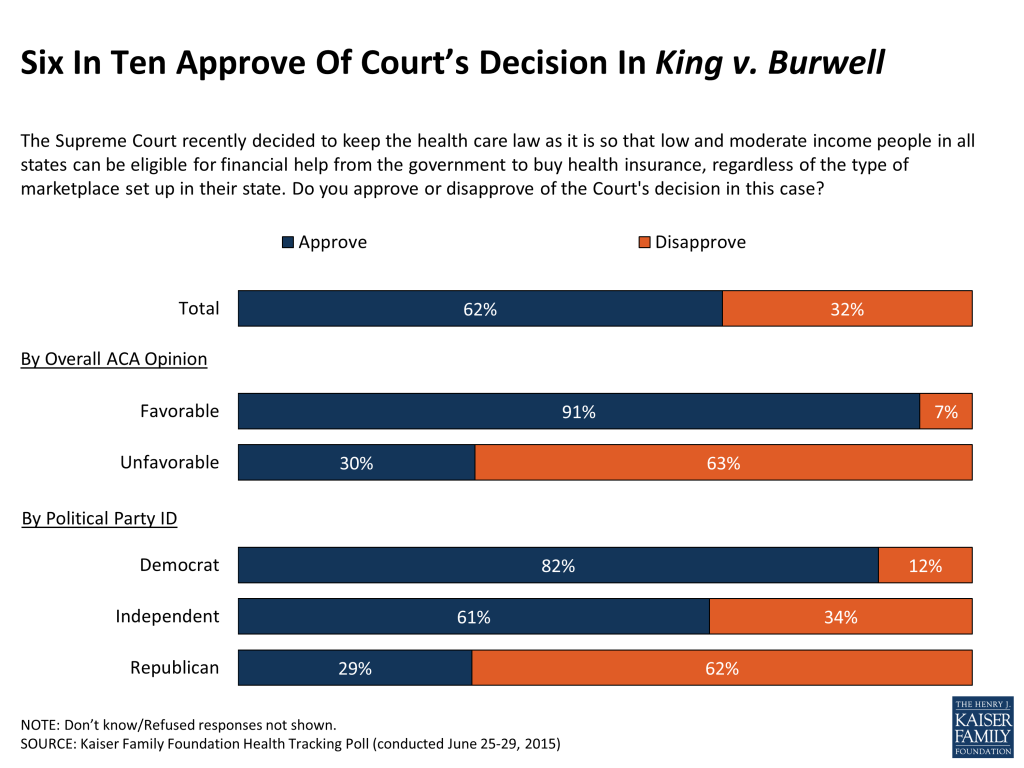
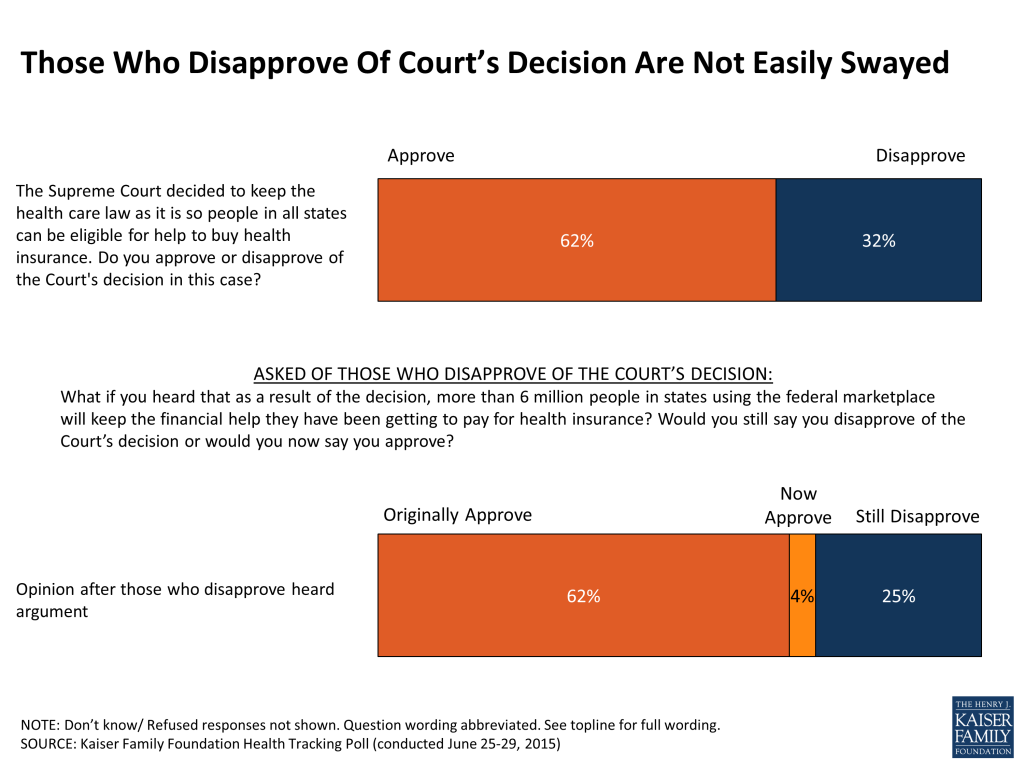
When told that the Supreme Court decided to keep the health care law as it is so that low and moderate income people in all states can be eligible for government financial help to buy health insurance, just over 6 in 10 (62 percent) say they approve of the Court’s decision and about a third (32 percent) say they disapprove. Approval is higher in this case than it was following the 2012 Supreme Court decision upholding most major provisions of the ACA. In the June 2012 Kaiser Health Tracking poll, the public was more evenly split, with 47 percent approving and 43 percent disapproving of the Court’s decision in the earlier case.
When it comes to the current case, there are the expected partisan differences in views, with Democrats more likely to approve of the decision and Republicans more likely to disapprove. However, views on the law and on the Court’s decision in this case are not completely aligned. About three in ten Republicans (29 percent) and a similar share of those who view the law unfavorably (30 percent) say they approve of the Court’s decision in this case.
Figure 4
The 32 percent of the public who disapprove of the Court’s decision are largely set in their opinions. Even after they are told that more than 6 million people in states using the federal marketplace will keep the financial help they have been getting to pay for health insurance because of the decision, most of those who initially disapprove of the decision say they continue to disapprove (25 percent of the public overall), while a small share (4 percent of the total) are swayed by this argument.
Figure 5
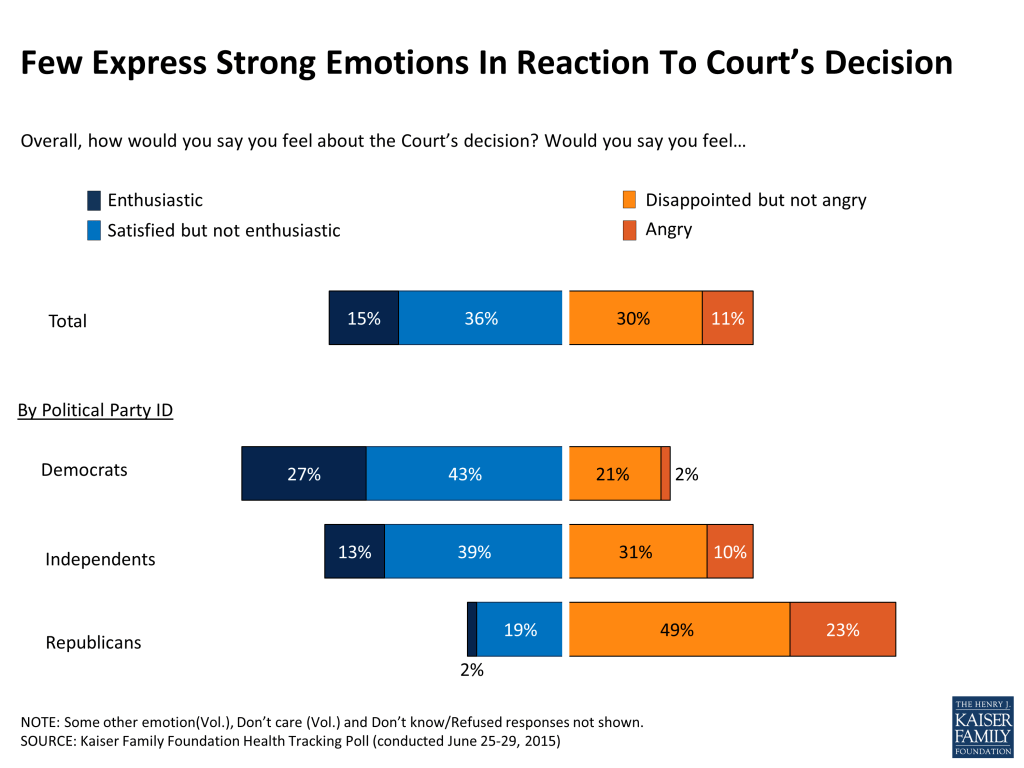
The public’s emotional response to the Court’s decision is fairly muted, with a little over a third (36 percent) saying they feel satisfied but not enthusiastic about the decision and 3 in 10 saying they feel disappointed but not angry. Smaller shares report feeling stronger emotions, such as enthusiasm (15 percent) or anger (11 percent). Not surprisingly, Republicans are more likely to report negative feelings about the decision and Democrats are more likely to report positive feelings, with independents falling in the middle. The strength of these emotions is about the same on either side of the aisle, with about a quarter (23 percent) of Republicans saying they feel angry and a similar share (27 percent) of Democrats saying they feel enthusiastic.
Figure 6
Opinion Of The Health Care Law In The Wake Of The Court’s Decision
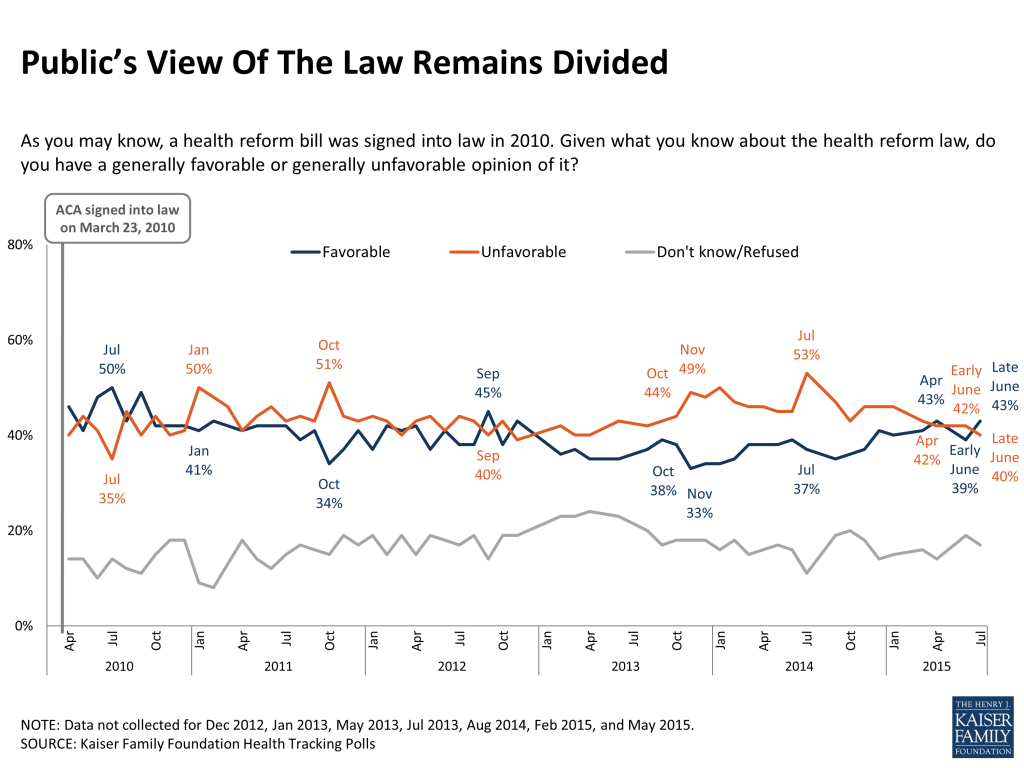
The outcome of the Supreme Court case doesn’t appear to have had an immediate impact on the public’s overall opinion of the ACA. Americans remain split in their views of the law, with 43 percent reporting a favorable view and 40 percent reporting an unfavorable view. This is statistically unchanged from the past few months.
Figure 7
Ongoing Debate About The Health Care Law
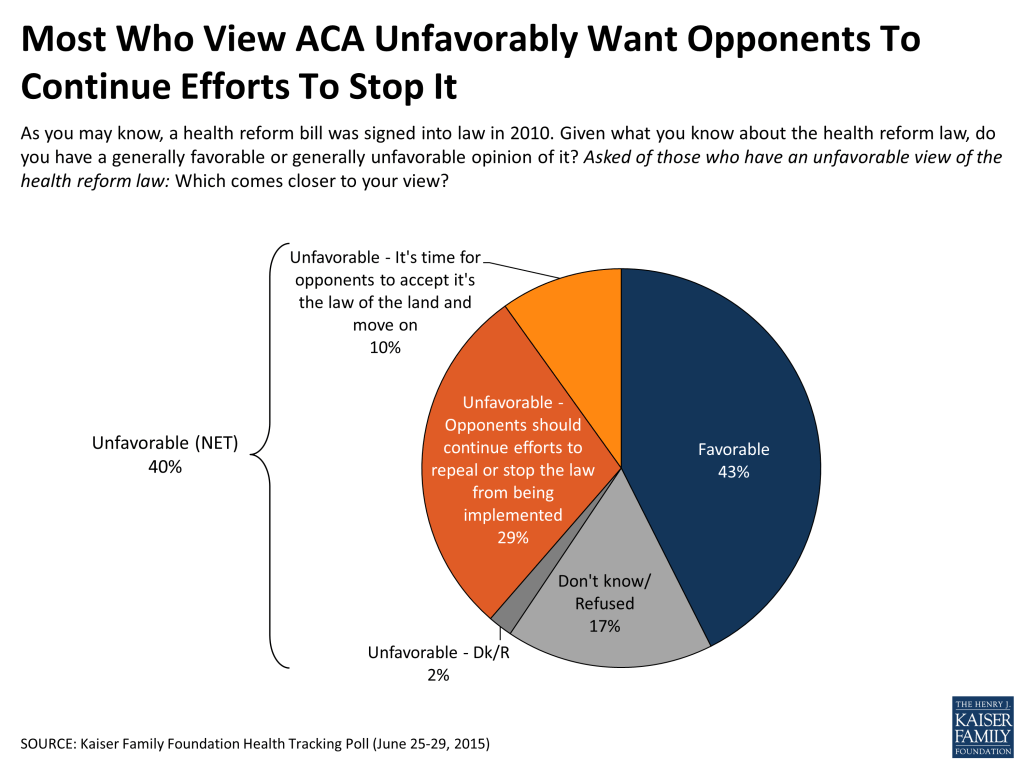
Among those who have an unfavorable view of the law, three-quarters (72 percent, or 29 percent of the public overall) want opponents to continue their efforts to repeal it or stop it from being fully implemented, while a much smaller share (23 percent, or 10 percent of the total public) say opponents should accept that it’s the law of the land and move on to other things.
Figure 8
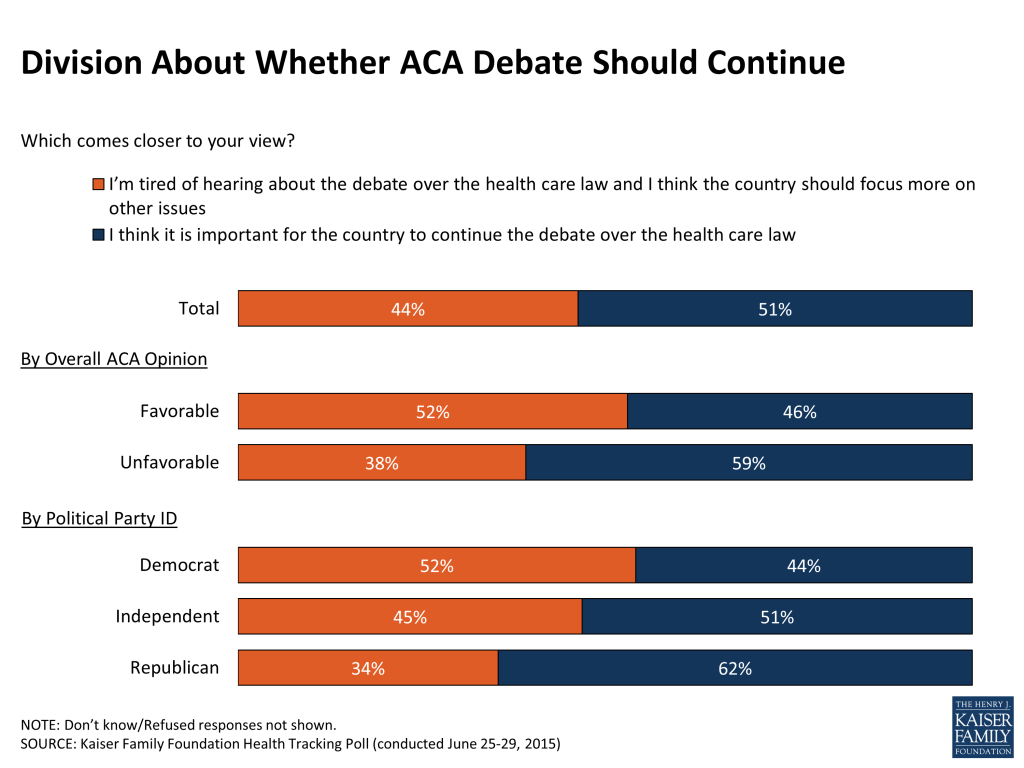
As a whole, Americans can’t seem to agree about whether the country should continue debating the health care law or not. Half (51 percent) think it is important to continue the debate, while 44 percent say they are tired of hearing about it and think the country should focus more on other issues. Republicans and those who view the law unfavorably are more likely to say it’s important for debate to continue, but still substantial shares of Democrats and those with a favorable view of the law hold this view.
Figure 9
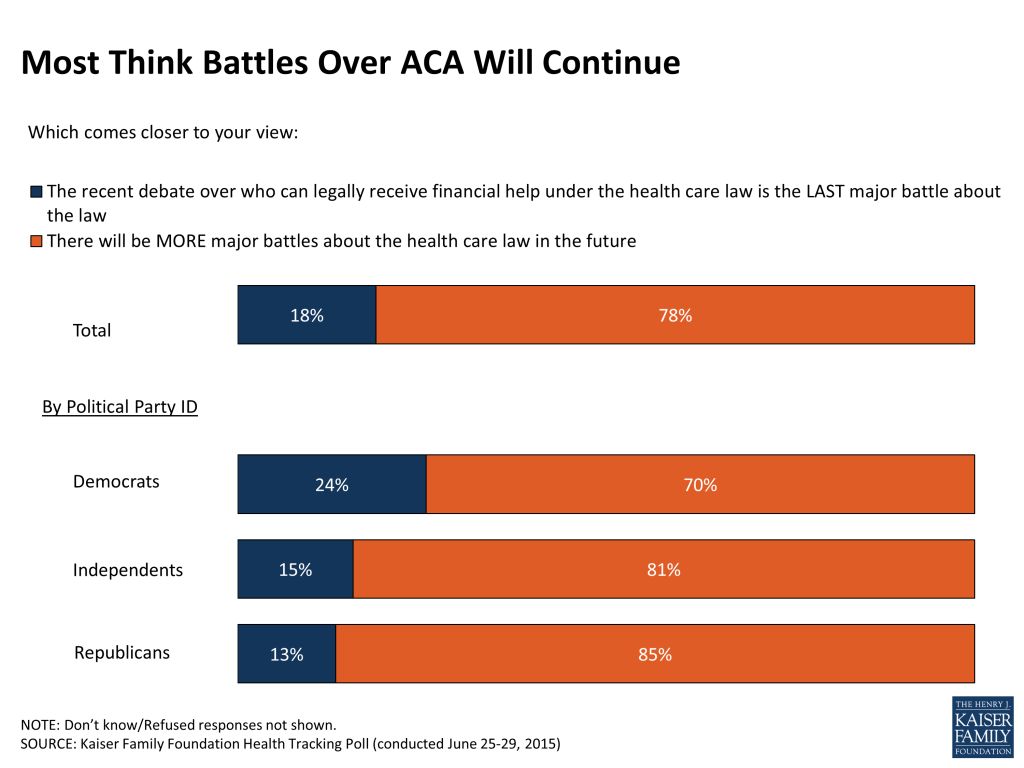
Personal preferences aside, a large majority of Americans (78 percent) think that future battles over the health care law are inevitable, while just 18 percent believe the most recent debate that reached the Supreme Court is the last major battle the law will face.
Figure 10
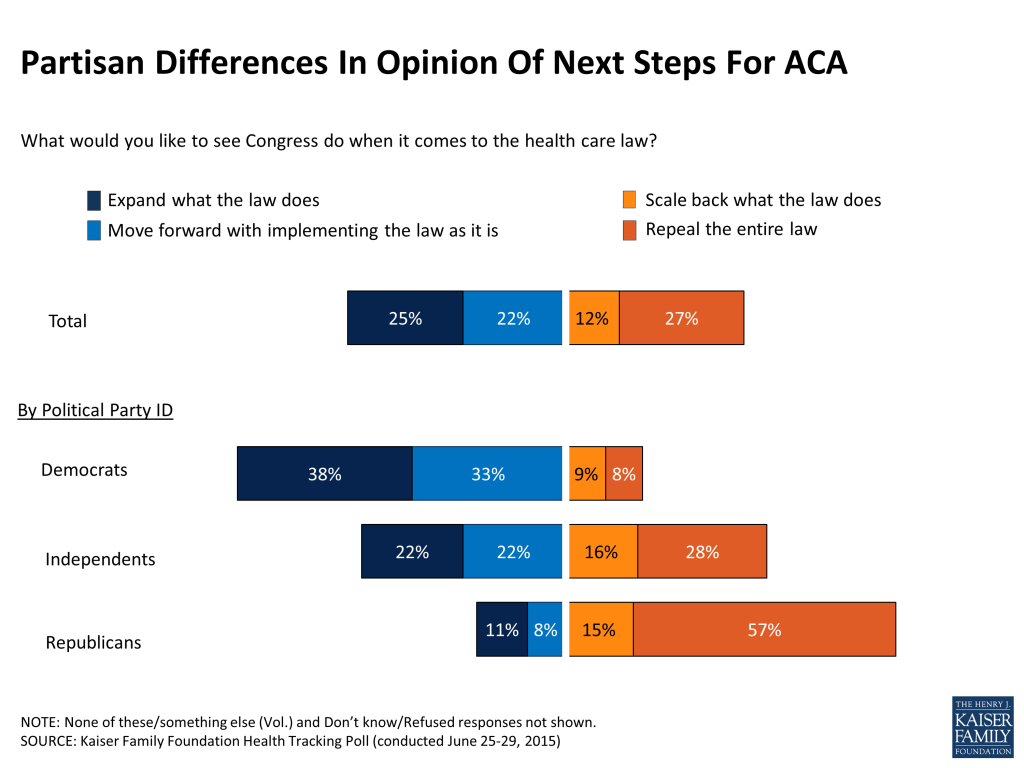
When it comes to the next steps they would like to see Congress take, Americans are as divided as ever, with a quarter (25 percent) saying they want them to expand what the law does, a similar share (27 percent) saying they want a full repeal, and the rest falling in the middle of these two extremes.
Figure 11
Kaiser Health Tracking Poll: Late June 2015 Methodology
This Kaiser Health Tracking Poll was designed and analyzed by public opinion researchers at the Kaiser Family Foundation (KFF). The survey was conducted June 25-29, 2015, among a nationally representative random digit dial telephone sample of 1,202 adults ages 18 and older, living in the United States, including Alaska and Hawaii (note: persons without a telephone could not be included in the random selection process). Computer-assisted telephone interviews conducted by landline (482) and cell phone (720, including 418 who had no landline telephone) were carried out in English and Spanish by Princeton Data Source under the direction of Princeton Survey Research Associates International (PSRAI). Both the random digit dial landline and cell phone samples were provided by Survey Sampling International, LLC. For the landline sample, respondents were selected by asking for the youngest adult male or female currently at home based on a random rotation. If no one of that gender was available, interviewers asked to speak with the youngest adult of the opposite gender. For the cell phone sample, interviews were conducted with the adult who answered the phone. KFF paid for all costs associated with the survey.
The combined landline and cell phone sample was weighted to balance the sample demographics to match estimates for the national population using data from the Census Bureau’s 2013 American Community Survey (ACS) on sex, age, education, race, Hispanic origin, nativity (for Hispanics only), and region along with data from the 2010 Census on population density. The sample was also weighted to match current patterns of telephone use using data from the January-June 2014 National Health Interview Survey. The weight takes into account the fact that respondents with both a landline and cell phone have a higher probability of selection in the combined sample and also adjusts for the household size for the landline sample. All statistical tests of significance account for the effect of weighting.
The margin of sampling error including the design effect for the full sample is plus or minus 3 percentage points. Numbers of respondents and margins of sampling error for key subgroups are shown in the table below. For results based on other subgroups, the margin of sampling error may be higher. Sample sizes and margins of sampling error for other subgroups are available by request. Note that sampling error is only one of many potential sources of error in this or any other public opinion poll. Kaiser Family Foundation public opinion and survey research is a charter member of the Transparency Initiative of the American Association for Public Opinion Research.
With recent news about possible health insurance company mergers, Drew Altman looks beyond the impact on Wall Street to how mergers could affect Medicare beneficiaries in his latest column for The Wall Street Journal’s Think Tank.
All previous columns by Drew Altman are available.
Enrollment in Medicare Advantage continues to climb steadily as spending reductions enacted in the Affordable Care Act reduce historical overpayments to the private plans, according to a new analysis by the Kaiser Family Foundation. But limits on out-of-pocket spending for Medicare-covered services are rising, providing less protection for enrollees with relatively high health care expenses.
Medicare Advantage enrollment grew in virtually all states and reached 16.8 million beneficiaries as of March 2015, an increase of more than 1 million people since the preceding March. Enrollment in Medicare Advantage plans, an alternative to traditional Medicare, has increased by 5.6 million people since the enactment of the ACA in 2010, according to the Foundation’s Medicare Advantage 2015 Spotlight: Enrollment Market Update, which analyzes trends in enrollment (nationally and by state), premiums, out of pocket limits, and quality ratings.
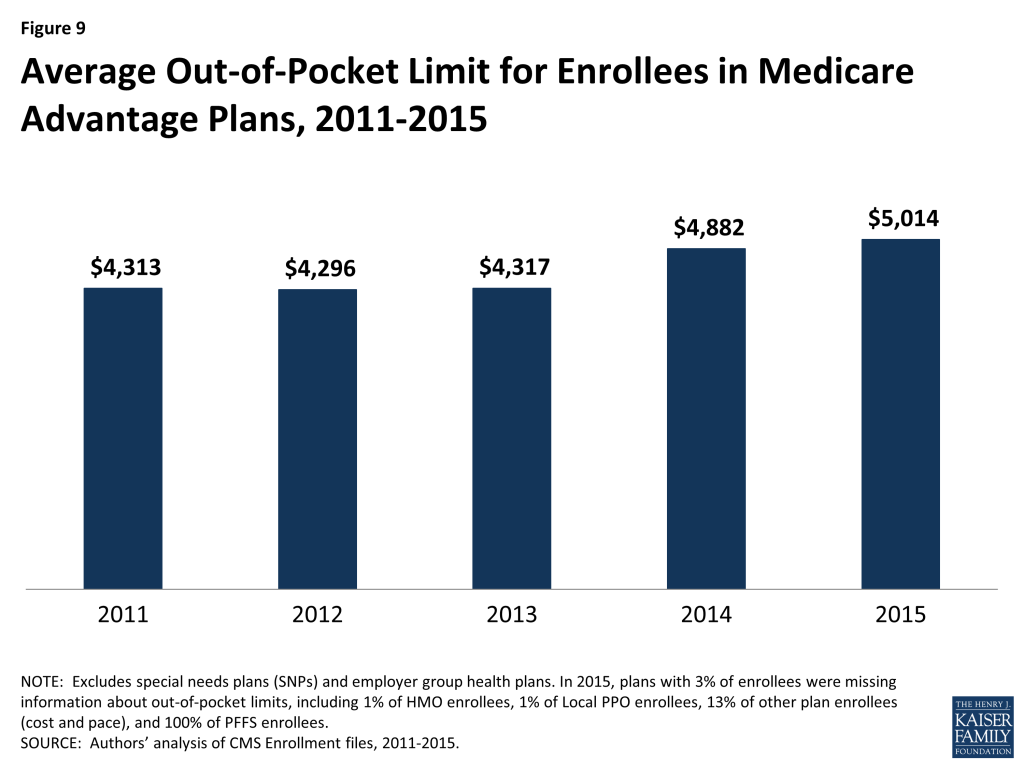
Premium growth in Medicare Advantage has been modest – premiums (weighted by enrollment) have remained relatively flat since 2011, and average $38 per month in 2015, up $3 per month from 2014. Out-of-pocket spending limits, however, have increased in recent years, rising from an average of $4,317 in 2013 to $5,041 in 2015. Between 2013 and 2015, the share of enrollees in plans with out-of-pocket limits above $5,000 nearly doubled to 46 percent. Medicare Advantage plans, unlike traditional Medicare, are required to have an out-of-pocket limit for services covered under Medicare Parts A and B that is no higher than $6,700.
Other key findings include:
Enrollment remains concentrated among a relatively small number of firms. Together, UnitedHealthcare and Humana account for 39 percent of Medicare Advantage enrollment; three other firms and BCBS affiliates account for another 33 percent. In 15 states and the District of Columbia, more than half of all enrollees are in plans offered by one company.
Most enrollees (64%) continue to be in HMOs, despite growth in enrollment in new plan types. Enrollees in HMOs, on average, pay lower premiums and have lower out-of-pocket limits than enrollees in other types of Medicare Advantage plans.
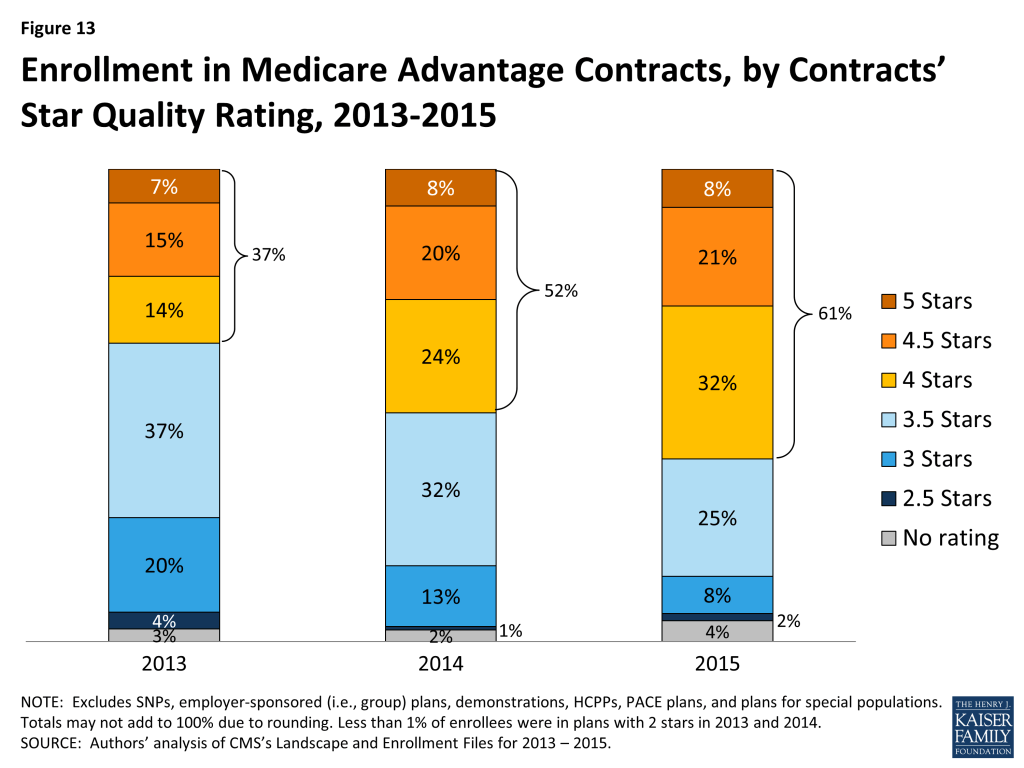
The share of Medicare Advantage enrollees in plans with 4 or more stars rose to 61 percent in 2015, up from 37 percent in 2013.
The full analysis is available online, as are the Foundation’s latest Medicare Advantage fact sheet and the newly updated Medicare Health and Prescription Drug Plan Tracker, where users can monitor trends in enrollment, market penetration and other topics for Medicare Advantage plans since 1999 and stand-alone Medicare drug plans since 2006 by state, county and other sub-state geographies.
Despite concerns that reductions in payments to Medicare Advantage plans enacted in the Affordable Care Act of 2010 (ACA) would lead to reductions in Medicare Advantage enrollment, the number and share of Medicare beneficiaries enrolling in Medicare Advantage plans has continued to climb.1 Since the enactment of the ACA, Medicare Advantage enrollment has increased by 5.6 million, or by 50 percent. The ACA payment reductions aimed to reduce historical overpayments to Medicare Advantage plans, relative to traditional Medicare.
This Data Spotlight reviews national and state-level enrollment trends as of March 2015 and examines variation in enrollment by plan type and firm. It analyzes the most recent data on premiums, out-of-pocket limits, Part D cost sharing, and plans’ quality ratings for Medicare Advantage enrollees. Key findings include:
Medicare Advantage enrollment has continued to grow and increased in virtually all states in 2015. Almost one in three (31 percent) people on Medicare (16.8 million beneficiaries) were enrolled in a Medicare Advantage plan in March 2015 – up by more than one million beneficiaries from 2014.
Medicare Advantage enrollment continues to be highly concentrated among large firms, both nationally and in local markets. Together, UnitedHealthcare and Humana account for 39 percent of all Medicare Advantage enrollment, and three other firms and BCBS affiliates account for another 33 percent of enrollment in 2015. In 15 states and the District of Columbia, more than half of all enrollees are in plans offered by one company – an indicator that these markets that may not be very competitive.
Despite the growth in enrollment in new plan types, most enrollees continue to be in HMOs (64% in 2015). As in prior years, enrollees in HMOs, on average, pay lower premiums and have lower limits on total out of pocket expenses than enrollees in other plan types.
The share of enrollees in plans with 4 or more stars rose from 37 percent in 2013 to 61 percent in 2015.
While growth in premiums has been relatively modest, Medicare Advantage plans provide less financial protection to Medicare enrollees than they have in the past. While average monthly premiums for MAPDs (weighted by enrollment) remain relatively flat ($38 per month in 2015, an increase of $3 per month from 2014), they vary across plan types and states.
Average out-of-pocket spending limits have continued to rise, exposing enrollees with significant medical needs to higher costs, and in 2015, the average out-of-pocket limit is $5,041. All plans have been required to limit enrollees’ out-of-pocket expenses to no more than $6,700 since 2011, and are encouraged have lower limits. The growth in out-of-pocket limits makes it increasingly critical that beneficiaries receive good information to help them choose effectively among the complex array of choices they face.
Overall Trends in Enrollment
Nationwide Enrollment
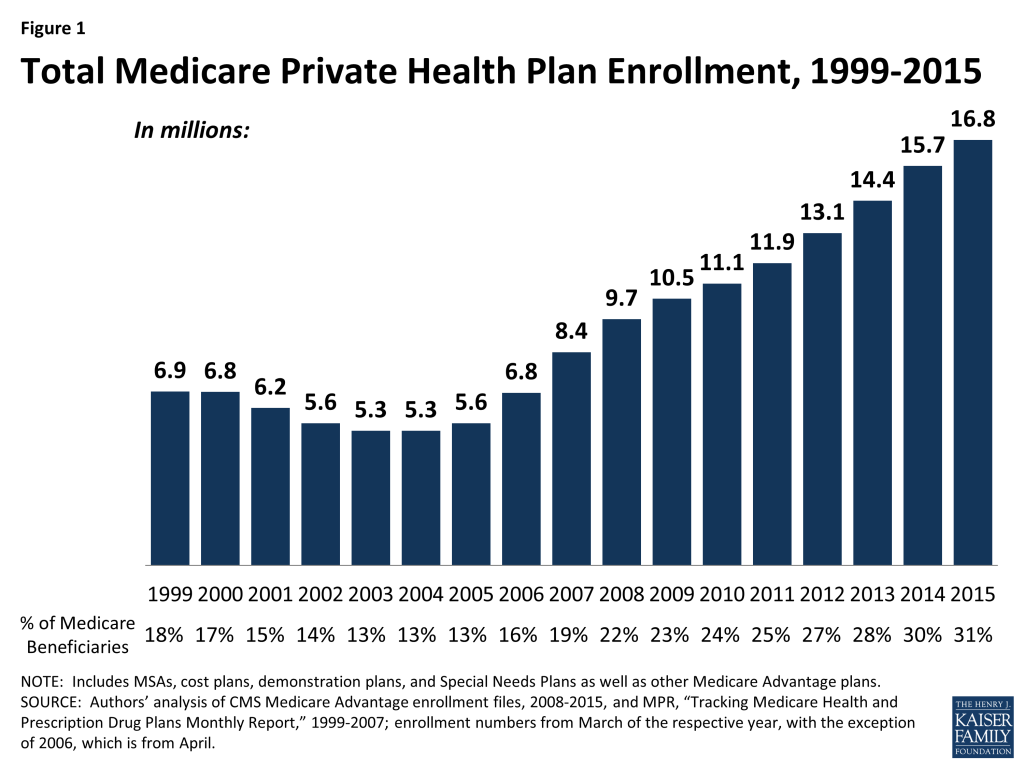
There are 16.8 million beneficiaries – 31 percent of the Medicare population – are enrolled in Medicare Advantage plans in 2015 (Figure 1). Total Medicare Advantage enrollment grew by more than 1 million beneficiaries, or 7 percent, between 2014 and 2015. This pattern continues the rapid growth in enrollment that occurred concurrently with the introduction of Part D (prescription drug coverage) in 2006 and other changes in the Medicare Advantage program authorized by the Medicare Prescription Drug, Improvement and Modernization Act (MMA) of 2003. While some of the growth in Medicare advantage enrollment reflects the influence of the baby boomers newly eligible for Medicare, recent evidence has indicated that enrollment growth also reflects small shifts in the larger pool of current beneficiaries switching from traditional Medicare to Medicare Advantage plans.2 Medicare enrollment has continued to grow despite the fact that the average number of plans available to enrollees nationwide declined from a high of 48 plans in 2009 to 20 plans in 2012 and to 18 in 2014 and 2015, as firms made changes to plans offered under their Medicare Advantage contracts.3
Figure 1: Total Medicare Private Health Plan Enrollment, 1999-2015
Trends in Enrollment by Plan Type
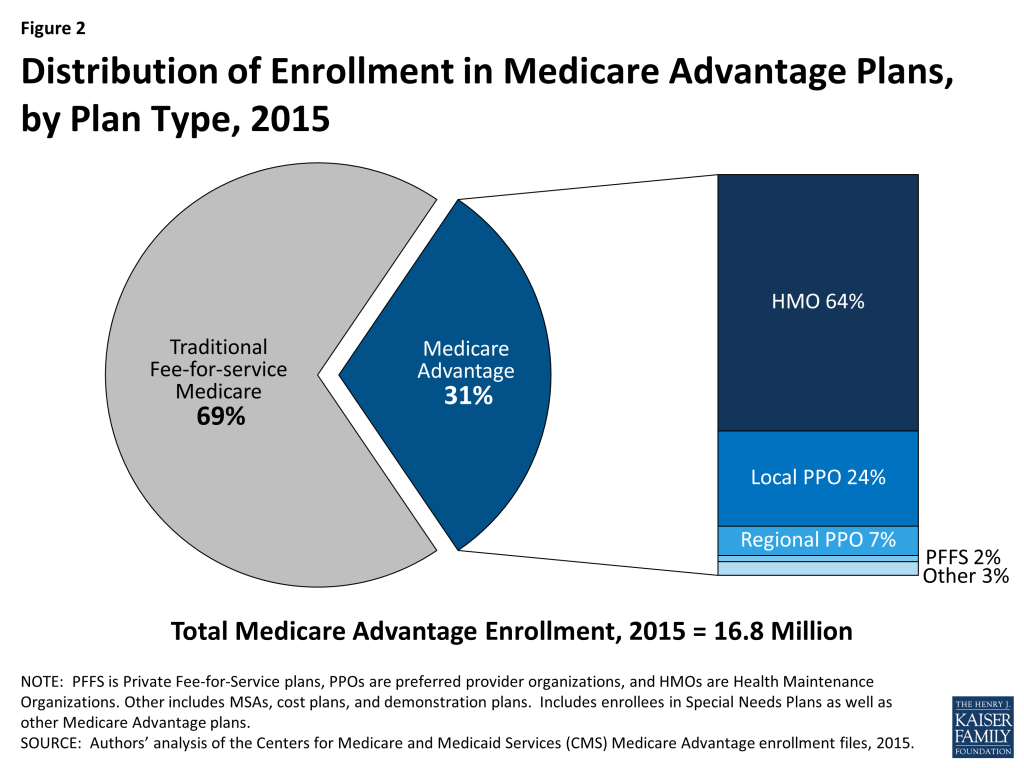
Similar to each year since 2007, about two-thirds (64%) of Medicare Advantage enrollees are enrolled in HMOs in 2015 (Figure 2). Almost one-third of enrollees are in either local PPOs (24%) or regional PPOs (7%), 2 percent are in PFFS plans, and 3 percent are in other types of plans, including cost plans and Medicare Medical Savings Accounts (MSAs).
Figure 2: Distribution of Enrollment in Medicare Advantage Plans, by Plan Type, 2015
PFFS plans were the primary alternative to HMOs from 2007 through 2009 but their role in the Medicare Advantage market has now been more than eclipsed by that of PPOs (especially local PPOs) since the Medicare Improvements for Patients and Providers Act (MIPPA) of 2008 required PFFS plans (with some county-specific exceptions) to have networks of providers by 2011.4
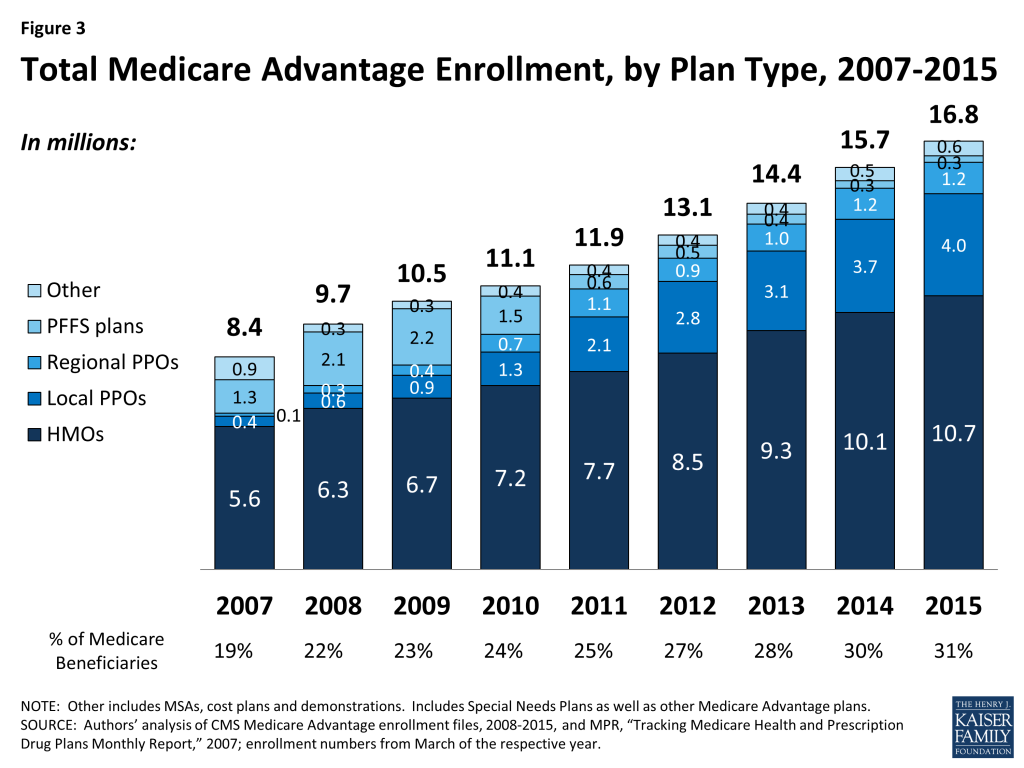
HMOs. In absolute numbers, enrollment in HMOs grew more than other plan types. Enrollment in HMOs increased by 0.7 million to 10.7 million beneficiaries in 2015, a seven percent increase (Figure 3).
Figure 3: Total Medicare Advantage Enrollment, by Plan Type, 2007-2015
PPOs. Enrollment in local PPOs increased by 0.3 million to 4.0 million beneficiaries in 2015, a nine percent increase. In contrast, enrollment in regional PPOs (1.2 million) remained flat between 2014 and 2015. Between 2007 and 2015, total PPO enrollment increased ten-fold from about 500,000 to 5.2 million, with most of the growth in local PPOs. Regional PPOs have had limited traction nationwide, although they account for a not insignificant share of the market in a small number of states (Table A1).5–A key difference between an HMO and a PPO is that the latter provides enrollees with more flexibility to see providers outside of the plan’s provider network, although cost sharing associated with out-of-network providers typically is substantially higher than for providers in a plan’s network. Local PPOs, like HMOs, are open to beneficiaries who live in specified counties. Regional PPOs are required to serve areas defined by one or more states with a uniform benefit package across the service area.
PFFS Plans. Enrollment in PFFS plans (0.3 million) has been fairly flat since 2014, and is substantially lower in 2015 than the high of 2.2 million enrolled in 2009.6 Enrollment has fallen precipitously since MIPPA of 2008 required PFFS plans in most parts of the country to have networks of providers. Among PFFS plan enrollees, 29% are in counties in which PFFS plans are exempted from network requirements.
Group Enrollment
Most Medicare beneficiaries who enroll in Medicare Advantage plans do so as individuals, but a small share is enrolled through groups, comprised largely of employment-sponsored Medicare Advantage plans for retirees. Under these arrangements, employers contract with a Medicare Advantage insurer to provide its retirees supplemental benefits, and Medicare pays the plan a fixed payment per enrollee to provide benefits covered by Medicare, and the employer pays a premium for any additional benefits.7
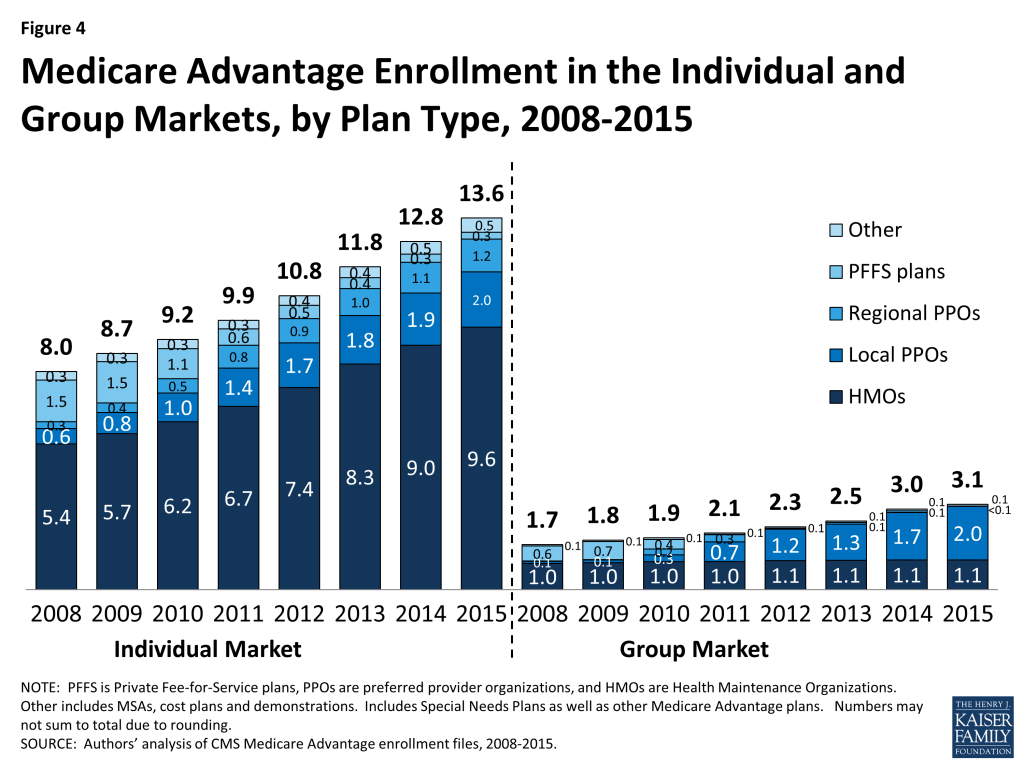
In 2015, 3.1 million of the 16.8 million Medicare Advantage enrollees (19%) were in a group plan, (Figure 4 and Table A2).
Figure 4: Medicare Advantage Enrollment in the Individual and Group Markets, by Plan Type, 2008-2015
The share of Medicare Advantage enrollees in group plans has never been very large, but the numbers are growing, consistent with trends in the overall Medicare Advantage market. In some states, the share of Medicare Advantage enrollees in group plans is much larger than average, including West Virginia (55%), Michigan (49%), Kentucky (42%), Illinois (41%), Ohio (38%), Maryland (32%), New Hampshire (31%), and the District of Columbia (30%). Higher rates of Medicare Advantage group enrollment in these states are likely due to a higher prevalence of employers offering retiree health benefits, including public and unionized industries.8
Employers (and their retirees) appear to continue to favor local PPOs over HMOs, which contrasts with the individual market. Most of the enrollment growth in the group market between 2014 and 2015 was in local PPOs, with enrollment increasing to 2.0 million from 1.7 million.
According to the Medicare Payment Advisory Commission (MedPAC), group Medicare Advantage plans typically receive higher Medicare payments and have higher bids, on average, than plans offered in the individual Medicare Advantage market.9 Their analysis shows that the average payment to group Medicare Advantage plans is 106 percent of traditional Medicare spending whereas the average payment to all Medicare Advantage plans is 102 percent of traditional Medicare spending in 2015. MedPAC attributes the differences to incentives for firms in the group market to maximize Medicare revenue to offset employer costs by bidding at the benchmark, whereas firms in the individual Medicare Advantage market have an incentive to bid below the benchmark, in order to receive a rebate (a percent of the difference between the bid and the benchmark) with which they can provide extra benefits to individual plan enrollees.
Medicare Advantage Enrollment Growth by State
Enrollment increased in virtually all states in 2015, with the exception of Maryland in which enrollment declined by less than 1 percent (Table 1). Five states and the District of Columbia saw particularly large increases in enrollment (19% in SD, 18% in ND, 14% in DC, 14% in GA, 14% in IL, and 14% in ME). High rates of growth typically reflect small states with limited prior year enrollment whose growth rates are sensitive to small changes in enrollment; for example, South Dakota has the highest growth rate (19%) and has historically had relatively low enrollment in Medicare Advantage plans.
While HMOs are the most common type of plan nationally, they are not equally important in all states. For example, HMOs constitute 75 percent of Medicare Advantage enrollment in 11 states (AZ, CA, CO, CT, LA, MA, NJ, NV, RI, UT, and WA) but less than half of Medicare enrollment in 25 states, 6 of whom (AK, MT, ND, SD, VT, and WV) have less than 10 percent HMO enrollment (see Table A1). Geographic variation in the composition of Medicare Advantage plans is important since HMOs tend to perform better on certain measures of efficiency and tend to have lower premiums.10 In addition, there is more evidence on the quality of care in HMOs than in other model types.11
Enrollment Growth by County, based on Medicare Spending Quartiles.
Over the years, Congress and various Administrations have made a number of changes to payment and participation rules for Medicare Advantage plans. Many of these changes have revolved around plan payment levels, seeking to balance plan participation and plan choices for beneficiaries with parity in payments between traditional Medicare and Medicare Advantage. The ACA reduced payments to all plans, and varied payment policy with the level of traditional Medicare spending in counties, grouped evenly into four quartiles. In 2017, when payments are fully phased in, they will range from 95 percent of traditional Medicare spending for counties in the top quartile of spending to 115 percent of traditional Medicare spending in the bottom quartile of such spending, and 100 percent and 107.5 percent of traditional Medicare spending in the two middle quartiles.
As of 2015, payment reductions have been fully implemented in 78 percent of all counties nationwide; these counties account for 69 percent of all Medicare beneficiaries nationwide and 68 percent of all Medicare Advantage enrollees.
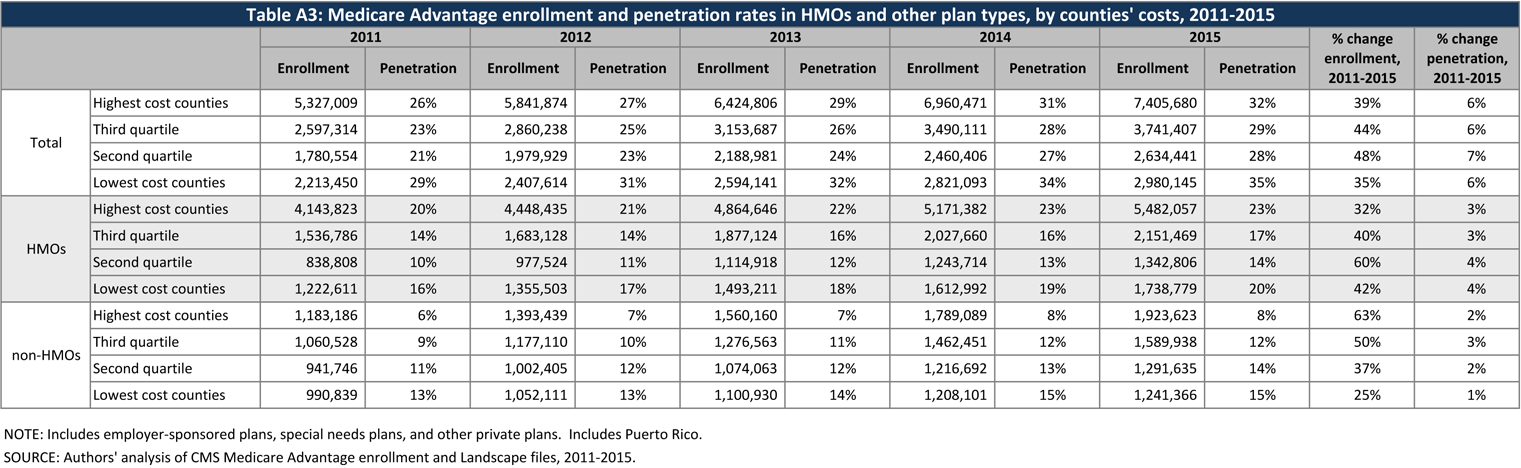
Enrollment continues to grow relatively equally across counties in each of the four quartiles of traditional Medicare spending (Table A3). Between 2014 and 2015, enrollment grew by 6 percent in both the highest quartile counties and in the lowest quartile counties, and by 7 percent each in the two middle quartiles. Overall penetration is also similar across the quartiles (ranging from 28% to 35%). Thus, enrollment continues to grow across counties, irrespective of changes in payments that differ according to traditional Medicare spending.
Table 1: Medicare Advantage Enrollment and Penetration Rate, by State, 2014-2015
State
2014 Total Enrollment
2015 Total Enrollment
Change in Total Enrollment, 2014-2015
Percent Change in Enrollment, 2014-2015
2014 Penetration Rate
2015 Penetration Rate
Total U.S.
15,732,081
16,761,673
1,029,592
7%
30%
31%
Alabama
220,640
238,091
17,451
8%
24%
25%
Alaska
N/A
56
N/A
N/A
N/A
<1%
Arizona
401,626
425,454
23,828
6%
38%
38%
Arkansas
107,713
114,326
6,613
6%
19%
19%
California
2,061,617
2,127,666
66,049
3%
38%
38%
Colorado
263,788
281,467
17,679
7%
36%
37%
Connecticut
146,372
157,692
11,320
8%
24%
25%
Delaware
12,623
13,841
1,218
10%
7%
8%
District of Columbia
9,714
11,033
1,319
14%
11%
13%
Florida
1,438,325
1,570,845
132,520
9%
38%
40%
Georgia
404,628
460,670
56,042
14%
28%
31%
Hawaii
108,143
110,465
2,322
2%
46%
46%
Idaho
81,440
87,837
6,397
8%
33%
32%
Illinois
326,678
371,007
44,329
14%
16%
18%
Indiana
244,970
264,104
19,134
8%
22%
23%
Iowa
77,032
81,541
4,509
6%
14%
14%
Kansas
59,018
61,600
2,582
4%
13%
13%
Kentucky
198,052
212,948
14,896
8%
24%
25%
Louisiana
213,280
232,445
19,165
9%
28%
30%
Maine
58,234
66,307
8,073
14%
20%
22%
Maryland
76,464
76,375
-89
0%
9%
8%
Massachusetts
229,400
233,084
3,684
2%
20%
19%
Michigan
547,372
595,239
47,867
9%
30%
32%
Minnesota
448,301
480,474
32,173
7%
51%
53%
Mississippi
69,962
76,776
6,814
10%
13%
14%
Missouri
285,066
311,364
26,298
9%
26%
28%
Montana
31,125
34,758
3,633
12%
17%
18%
Nebraska
33,507
34,982
1,475
4%
13%
11%
Nevada
135,599
146,094
10,495
8%
33%
33%
New Hampshire
15,905
17,295
1,390
9%
6%
7%
New Jersey
219,494
222,846
3,352
2%
15%
15%
New Mexico
107,064
113,807
6,743
6%
30%
31%
New York
1,151,620
1,212,239
60,619
5%
35%
37%
North Carolina
475,432
512,924
37,492
8%
28%
29%
North Dakota
15,202
17,878
2,676
18%
14%
15%
Ohio
794,226
811,503
17,277
2%
38%
38%
Oklahoma
106,706
111,013
4,307
4%
16%
17%
Oregon
305,794
323,765
17,971
6%
43%
44%
Pennsylvania
971,144
1,001,864
30,720
3%
39%
40%
Rhode Island
70,627
71,009
382
1%
36%
35%
South Carolina
193,641
209,812
16,171
8%
22%
23%
South Dakota
22,242
26,400
4,158
19%
15%
17%
Tennessee
376,577
412,042
35,465
9%
32%
34%
Texas
990,399
1,098,678
108,279
11%
29%
31%
Utah
107,139
113,034
5,895
6%
34%
33%
Vermont
8,368
8,984
616
7%
7%
7%
Virginia
196,993
206,427
9,434
5%
15%
16%
Washington
329,087
348,467
19,380
6%
29%
30%
West Virginia
96,604
99,454
2,850
3%
24%
24%
Wisconsin
352,842
388,732
35,890
10%
35%
38%
Wyoming
1,997
2,071
74
4%
3%
2%
NOTE: Includes employer-sponsored plans, special needs plans, and other private plans. N/A indicates too few (less than 50) enrollees to report. Total U.S. includes Puerto Rico.SOURCE: Authors’ analysis of CMS Medicare Advantage enrollment and Landscape files, 2014-2015.
Medicare Advantage Penetration
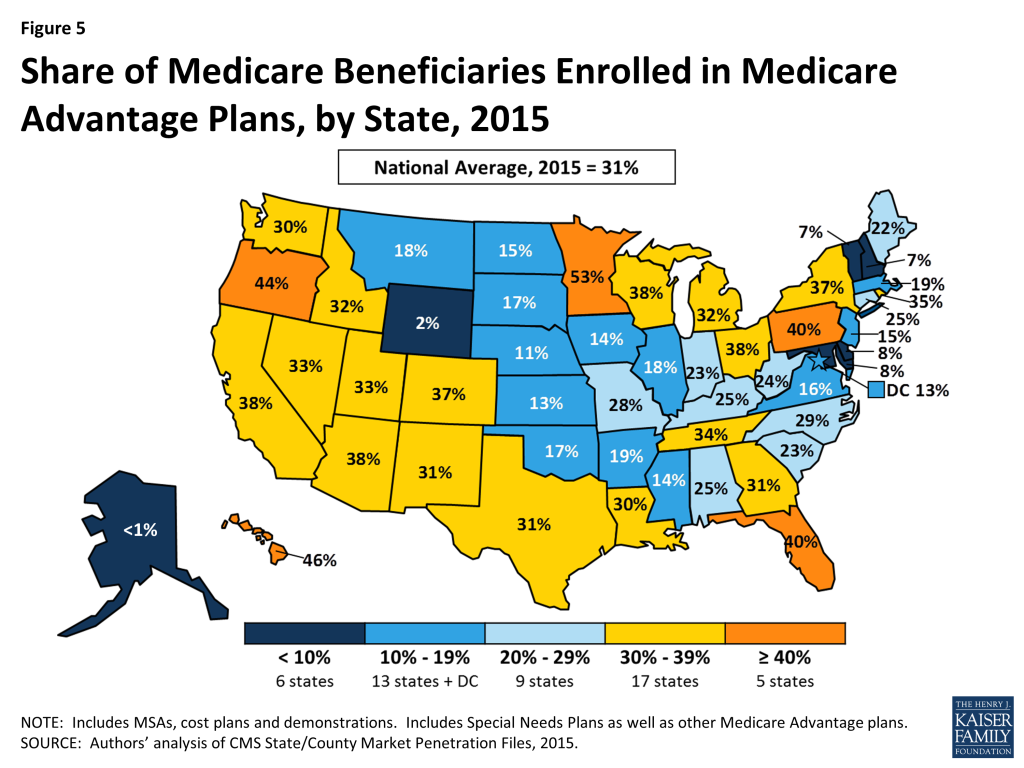
While Medicare Advantage enrollment is increasing in many states, in 6 states (AK, DE, MD, NH, VT and WY) less than 10% of beneficiaries are enrolled in Medicare Advantage plans in 2015, which was also the case in at least the prior three years (Figure 5). In contrast, in 22 states (versus 18 states in 2014 and 15 states in 2013) more than 30 percent of beneficiaries are enrolled in Medicare Advantage plans in 2015. Additionally, in 5 states (FL, HI, MN, OR, and PA) more than 40 percent of beneficiaries are enrolled in Medicare Advantage plans, and Medicare Advantage enrollment these states account for 6% of all Medicare beneficiaries and 21% of all Medicare Advantage enrollees. This variation reflects the urban origins of health maintenance organizations (HMOs) in Medicare Advantage and other factors, such as the history of managed care in the state and the prevalence of employer sponsored insurance for retirees. Within states, Medicare Advantage penetration varies across counties. For example, 43 percent of beneficiaries in Los Angeles County, California are enrolled in Medicare Advantage plans compared to only 8 percent of beneficiaries in Santa Cruz County, California.
Figure 5: Share of Medicare Beneficiaries Enrolled in Medicare Advantage Plans, by State, 2015
Premiums
Medicare Advantage enrollees are responsible for paying the Part B premium, in addition to any premium charged by the plan. The Medicare Advantage premium paid by enrollees reflects the difference between the plan’s costs of providing Part A and B benefits and any supplemental benefits offered, and the federal payment to the plan for the benefits. Plans receive a percentage of the difference between their bid and the maximum federal payment (known as a rebate) and are required to use this amount to offer extra benefits, reduce cost sharing, or reduce the Part B premium. If the plan offers the Part D drug benefit, as most plans do, the plan may also use the rebate to reduce the Part D premium.
This brief analyzes premiums for Medicare Advantage plans that offer prescription drug benefits (MA-PDs) because the vast majority (88%) of Medicare Advantage enrollees is in MA-PDs.
Average Premium Trends
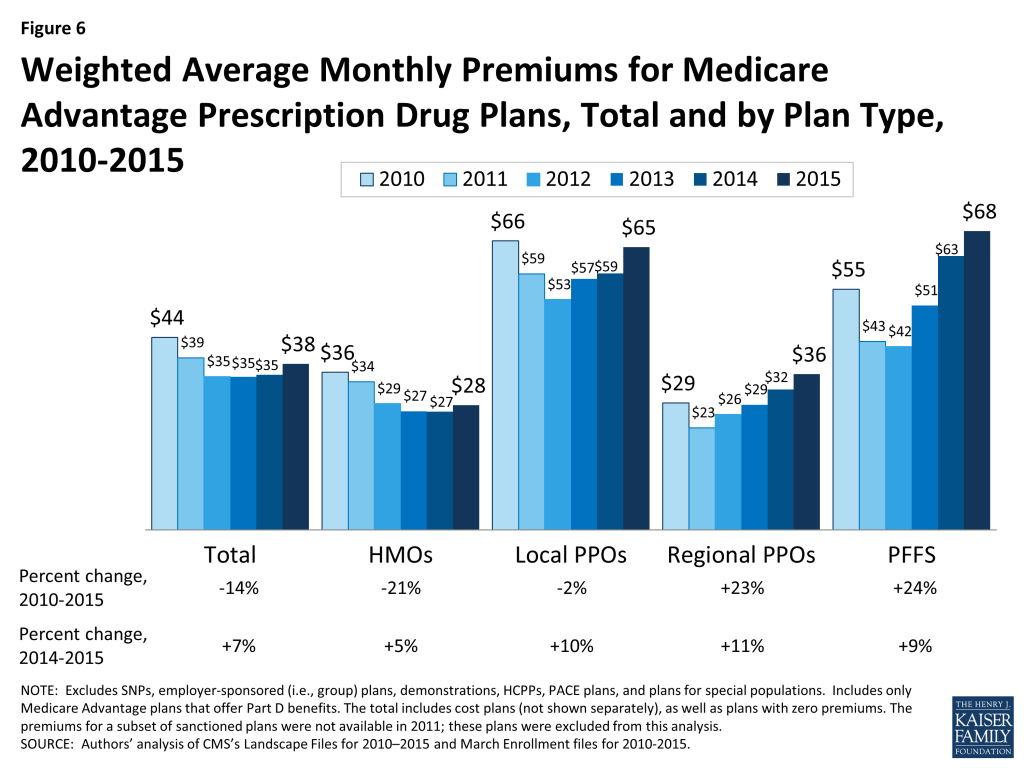
The average MA-PD enrollee pays a monthly premium of about $38 in 2015, a $3 per month (7%) increase from 2014 (Figure 6). Actual premiums paid by enrollees vary by plan type, locale, and characteristics, such as relative breadth of the provider network and/or benefits.12
Figure 6: Weighted Average Monthly Premiums for Medicare Advantage Prescription Drug Plans, Total and by Plan Type, 2010-2015
Average premiums range from $28 per month (for HMO enrollees) to $68 per month (for PFFS plan enrollees). Average premium increases were lower for HMO enrollees ($1 per month) than for local PPO enrollees ($6 per month), regional PPO enrollees ($4 per month), and PFFS plan enrollees ($5 per month).
Average Medicare Advantage premiums for HMO enrollees and local PPO enrollees are lower in 2015 than in 2010, prior to the ACA payment changes; premiums are higher in 2015 than in 2010 for regional PPOs and PFFS plans.
Zero Premium Plans
As in prior years, most Medicare beneficiaries (78%) had a choice of at least one MA-PD that charged no additional premium for coverage, other than the monthly Part B premium, also known as “zero premium plans”.13
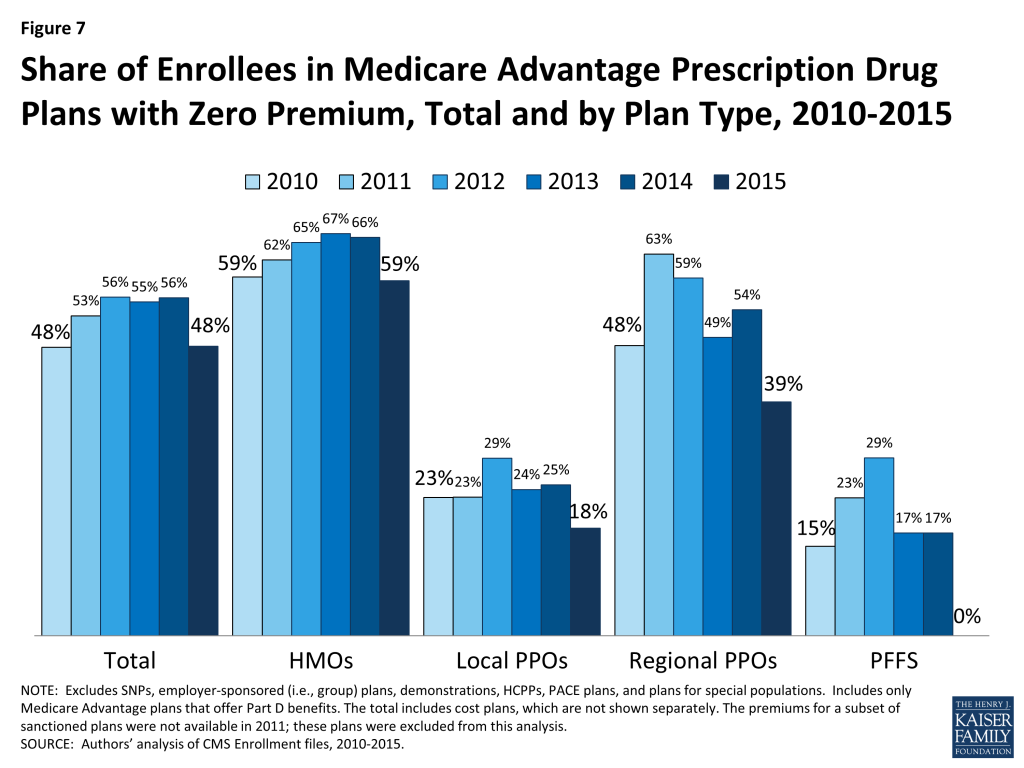
Between 2014 and 2015, the share of enrollees in zero premium MA-PDs declined from 56 percent to 48 percent, which is about the same share as in 2010 (Figure 7). Similar to prior years, a larger share of enrollees in HMOs was enrolled in zero-premium plans (59%) than enrollees in regional PPOs (39%) or local PPOs (18%). No zero premium PFFS plans are offered in 2015.
Figure 7: Share of Enrollees in Medicare Advantage Prescription Drug Plans with Zero Premium, Total and by Plan Type, 2010-2015
Premium Variation Across States
Comparing premiums across states is complicated by the fact that premiums reflect many factors, including the underlying costs of care in a given county relative to the national average, the level of payments to Medicare Advantage plans in the area, and firms’ strategy about whether to use plans’ rebates to offer extra benefits, reduce cost-sharing, or lower premiums. Additionally, as previously discussed, premiums vary across plan types, with HMOs having the lowest average premiums, and enrollment by plan type varying across states.
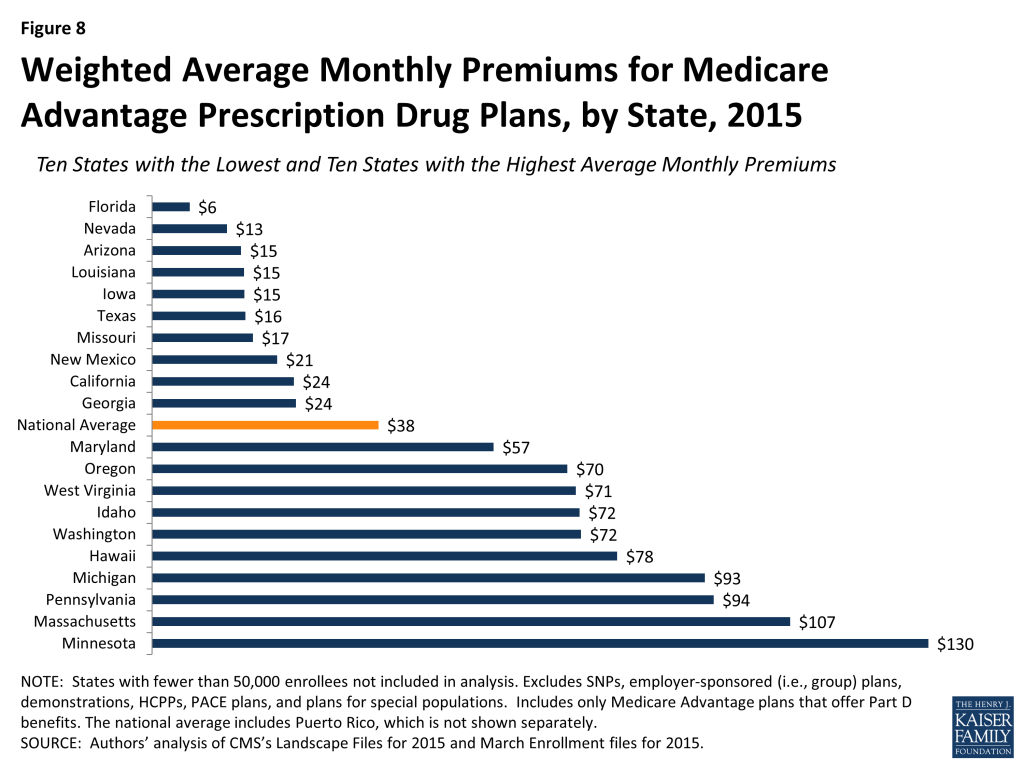
Average monthly premiums paid by enrollees vary across states (Figure 8). While the average premium nationwide is $38 per month, in four states (MA, MI, MN, and PA,) average monthly premiums exceed $90 in 2015.14 In contrast, average monthly premiums are less than $20 in seven states (AZ, IA, FL, LA, MO, NV, and TX). (States with fewer than 50,000 Medicare Advantage enrollees are not displayed in the exhibit).
Figure 8: Weighted Average Monthly Premiums for Medicare Advantage Prescription Drug Plans, by State, 2015
Premiums also vary greatly within a state since plans and federal payments to plans vary by county. For example, in Los Angeles County, California, Medicare Advantage enrollees pay an average of $2 per month for an MA-PD. In contrast, in San Francisco County, California, enrollees pay an average of $65 per month for an MA-PD. Similarly, in New York County, New York, enrollees pay an average of $18 per month for an MA-PD whereas in Albany County, New York, enrollees pay an average of $73 per month for an MA-PD.
Structuring Cost Sharing in the Medicare Benefit
Medicare Advantage plans are required to provide all Medicare covered services. In addition, plans are required to limit enrollees’ out-of-pocket expenditures for Part A and Part B covered services and may provide additional benefits that are not covered by traditional Medicare. Out-of-pocket limits define ultimate financial liability for Medicare benefits for in-network Medicare-covered benefits and are especially important for people with relatively high health expenses. Actual financial liability will vary with a beneficiary’s health status and use of medical care.
Out-Of-Pocket Limits
Although traditional Medicare does not include an annual out of pocket limit on cost sharing for Medicare A and B benefits, the CMS began requiring all Medicare Advantage plans to have a limit no higher than $6,700 annually, and recommended a limit of $3,400 or lower, for in-network services, as of 2011.15
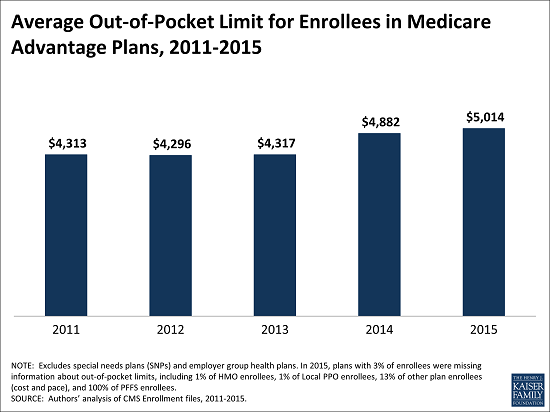
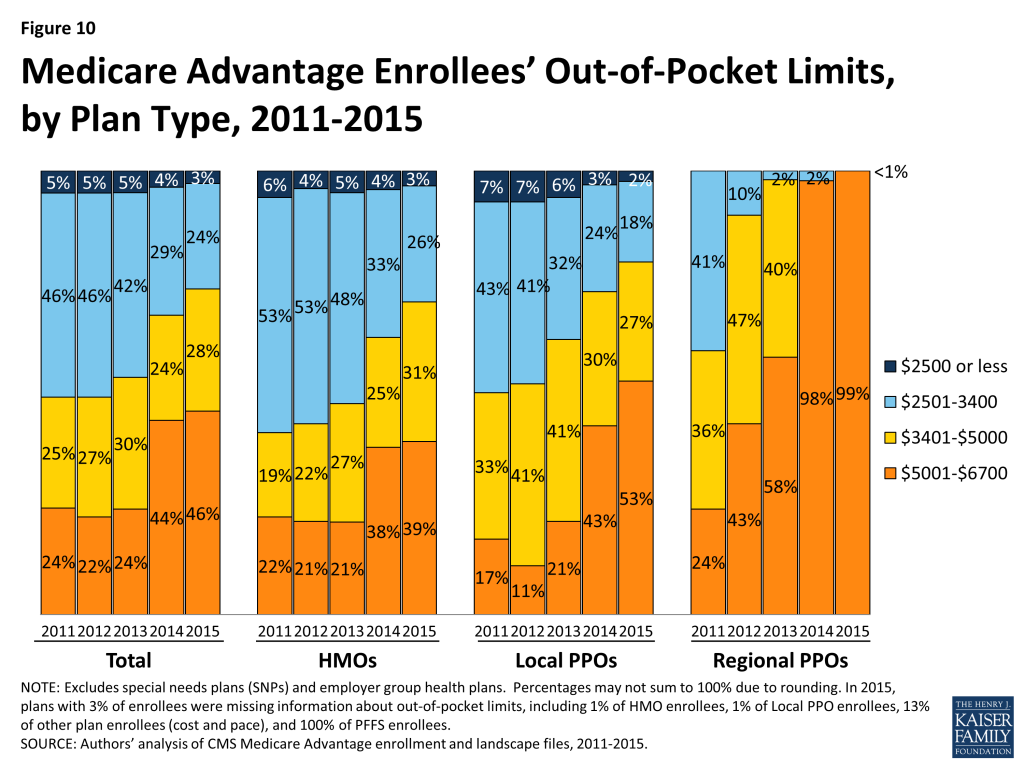
In 2015, the average out-of-pocket limit for Medicare Advantage enrollees is $5,041 (Figure 9). Nearly half of all enrollees (46%) are in plans with limits above $5,000 in 2015, roughly the same share as in 2014. Between 2011 and 2015, the share of enrollees in plans with a limit above $5,000 nearly doubled, from 24 percent in 2011 to 46 percent in 2015. Concurrently, the share of beneficiaries in plans with limits below $3,400 has declined from 51 percent in 2011 to 27 percent in 2015.
Figure 9: Average Out-of-Pocket Limit for Enrollees in Medicare Advantage Plans, 2011-2015
HMOs have generally had lower out-of-pocket limits than local PPOs or regional PPOs, and this remains the case in 2015 (Figure 10). Virtually all regional PPO enrollees (99%) and more than half of local PPO enrollees (53%), compared to more than one-third of HMO enrollees (39%), are in plans with limits above $5,000 in 2015. Less than one-third (29%) of HMO enrollees are in plans with limits below $3,400 in 2015, a decline from 59 percent of HMO enrollees in 2011. About one in five (20%) local PPO enrollees and less than 1 percent of regional PPO enrollees are in plans with limits below $3,400.
Figure 10: Medicare Advantage Enrollees’ Out-of-Pocket Limits, by Plan Type, 2011-2015
Part D Cost Sharing
The standard Medicare Part D benefit in 2015, for both stand-alone prescription drug plans (PDPs) and MA-PDs, has a $320 deductible and 25 percent coinsurance up to an initial coverage limit of $2,960 in total drug costs, followed by a coverage gap (the so-called “donut hole”), until their total out of pocket Part D spending reaches $4,700 when the catastrophic limit kicks in and beneficiaries pay 5 percent of the cost of drugs.
Part D Deductibles
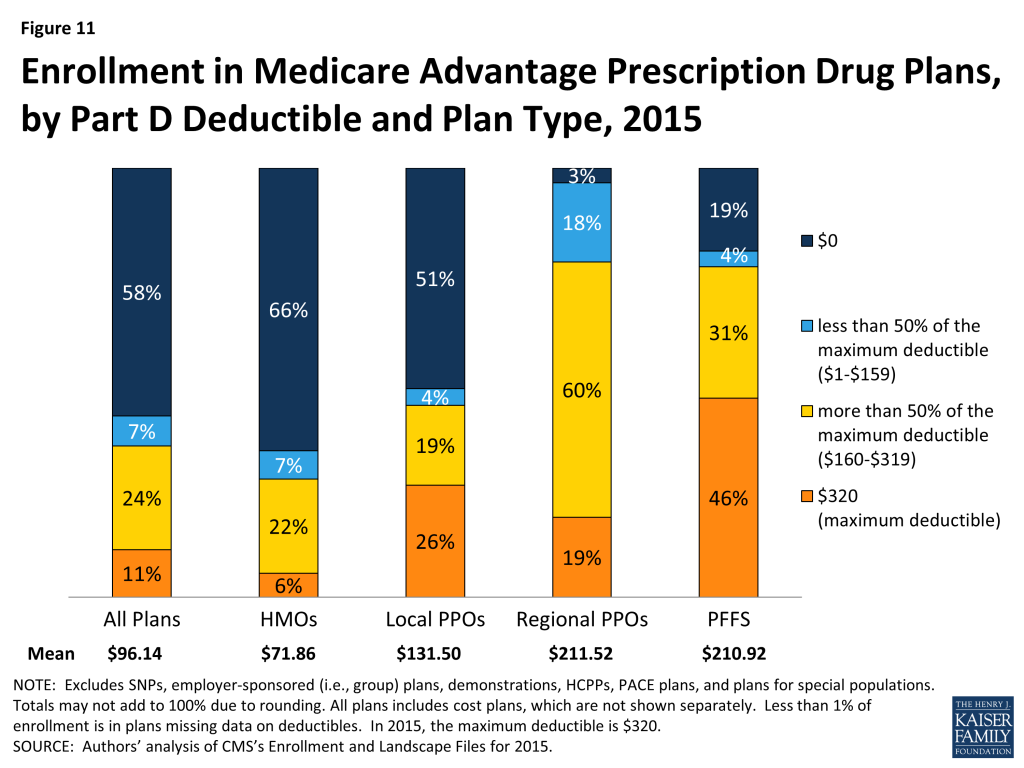
Medicare Advantage plans have the flexibility to vary the design of their Part D benefit; however, the deductible cannot exceed $320 in 2015. In 2015, most MA-PD enrollees (58%) are in plans without a Part D deductible (Figure 11). Only 11 percent are in plans with the maximum deductible of $320. Nearly one-third of MA-PD enrollees have deductibles ranging from $160-$319.
Figure 11: Enrollment in Medicare Advantage Prescription Drug Plans, by Part D Deductible and Plan Type, 2015
Two-thirds (66%) of MA-PD HMO enrollees and half (51%) of local PPO enrollees do not have a Part D deductible. In contrast, the preponderance of regional PPO enrollees (97%) and PFFS plan enrollees (81%) do have a Part D deductible. Six percent of HMO enrollees are in plans with the maximum deductible, compared to 26 percent of local PPO enrollees, 19 percent of regional PPO enrollees, and 46 percent of PFFS plan enrollees.
Coverage in the Part D Donut Hole
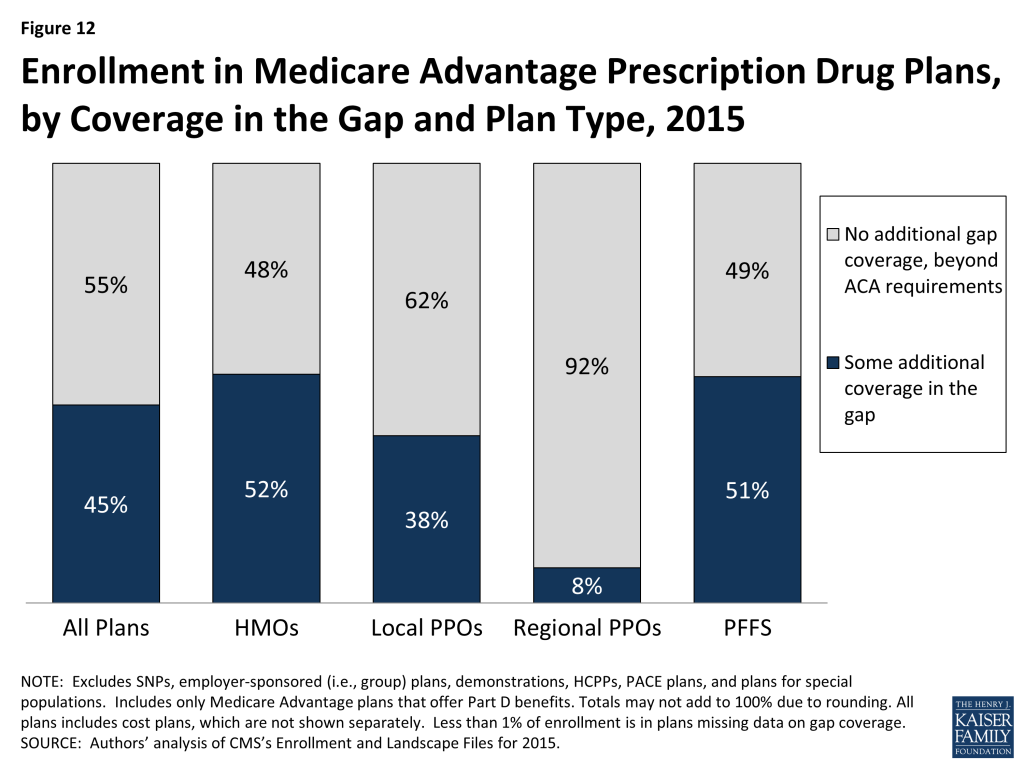
The ACA gradually closes the coverage gap by 2020. Plans have the option to close the gap before then, but few have. In 2015, 45 percent of enrollees are in plans that provide some additional coverage – beyond what is required by law – a decline from 51 percent in 2014 (Figure 12). Enrollees in plans with no additional gap coverage will pay 45 percent of the total costs of brand-name drugs and 65 percent of the total cost of generics in the gap in 2015 until they reach the catastrophic limit. A larger share of enrollees in PFFS plans (51%) and HMOs (52%) are in plans that provide some coverage in the gap, than enrollees in local PPOs (38%) or regional PPOs (8%).16
Figure 12: Enrollment in Medicare Advantage Prescription Drug Plans, by Coverage in the Gap and Plan Type, 2015
Star Quality Ratings
For many years, the CMS has posted quality ratings of Medicare Advantage plans to provide beneficiaries with additional information about plans offered in their area. All plans are rated on a 1 to 5 star scale, with 1 star representing poor performance, 3 stars representing average performance, and 5 stars representing excellent performance. The quality scores for Medicare Advantage plans are derived from plan and beneficiary information collected in three surveys – HEDIS®, CAHPS®, and HOS – and administrative data. CMS assigns quality ratings at the contract level, rather than for each individual plan, meaning that each plan covered under the same contract receives the same quality rating (and most contracts cover multiple plans of the same type).
In 2012, Medicare Advantage plans began receiving bonus payments based on quality ratings. These payments were initially established in the ACA and provided for bonuses to plans that receive 4 or more stars and to unrated plans beginning in 2012. In addition, CMS launched a demonstration for 2012 through 2014 that increased the size of bonuses for these plans, and also provided bonuses to plans rated as average (receiving 3 or 3.5 stars), using the same 1 to 5 star scale. CMS indicated that one goal of the demonstration was to provide an initial boost to plans in meeting the more stringent 4 star goals.17 In 2015, the bonus payments have reverted back to those that were authorized under the ACA, and plans with 3 or 3.5 stars do not receive bonus payments. Beneficiaries can enroll in a plan with 5 stars at any time during the year, not just during the annual open enrollment period.
Between 2013 and 2015, the share of enrollees in plans with 4 or more stars has steadily increased, from 37 percent in 2013 to 61 percent in 2015 (Figure 13). Much of the increase in enrollment in plans with four or more stars has occurred in the plans with 4 or 4.5 stars, while the share of enrollees in plans with 5 stars has been relatively stable.
Figure 13: Enrollment in Medicare Advantage Contracts, by Contracts’ Star Quality Rating, 2013-2015
Notably, while a larger share of beneficiaries is in plans with relatively high star ratings, seniors have said in focus groups that they do not use the star ratings to select their plan.18 Nonetheless, the star ratings may be correlated with factors that seniors do use to select their plan, including provider networks, and plan benefits and costs, and thus may be correlated with enrollment. It is noteworthy that the share of beneficiaries in plans with 5 stars did not materially change between 2013 and 2015. Some have argued that the measures required to achieve 5 stars are more demanding than lower level star ratings, requiring integration that some plans find more difficult to achieve.
Medicare Advantage Firms
Enrollment by Firm
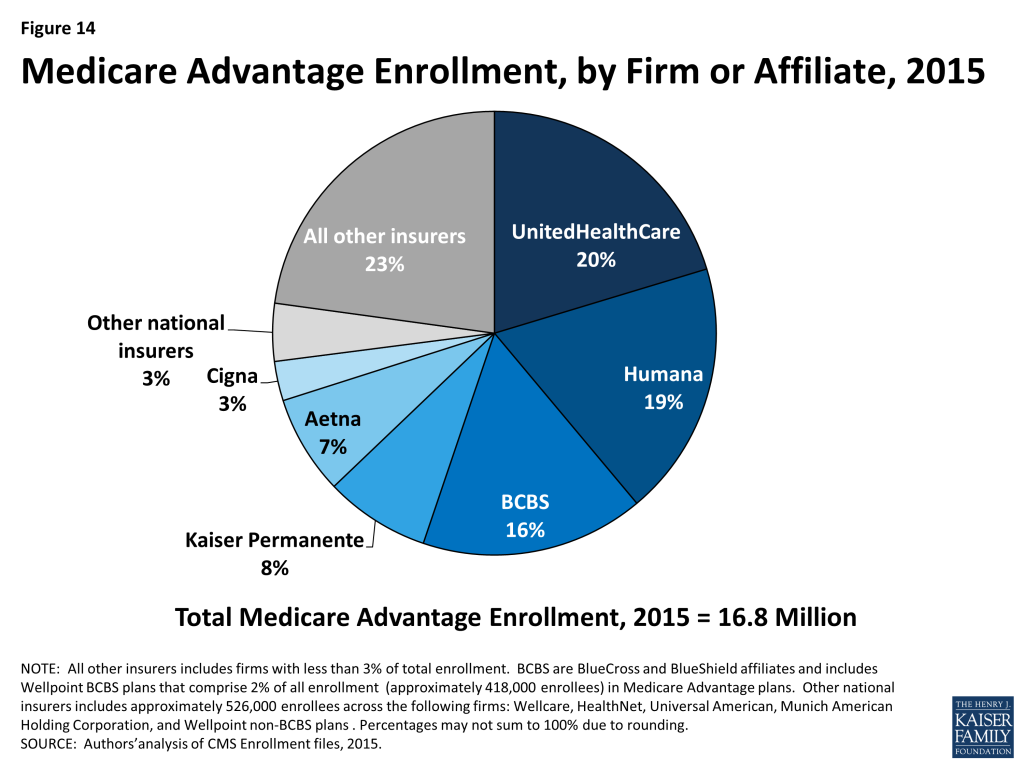
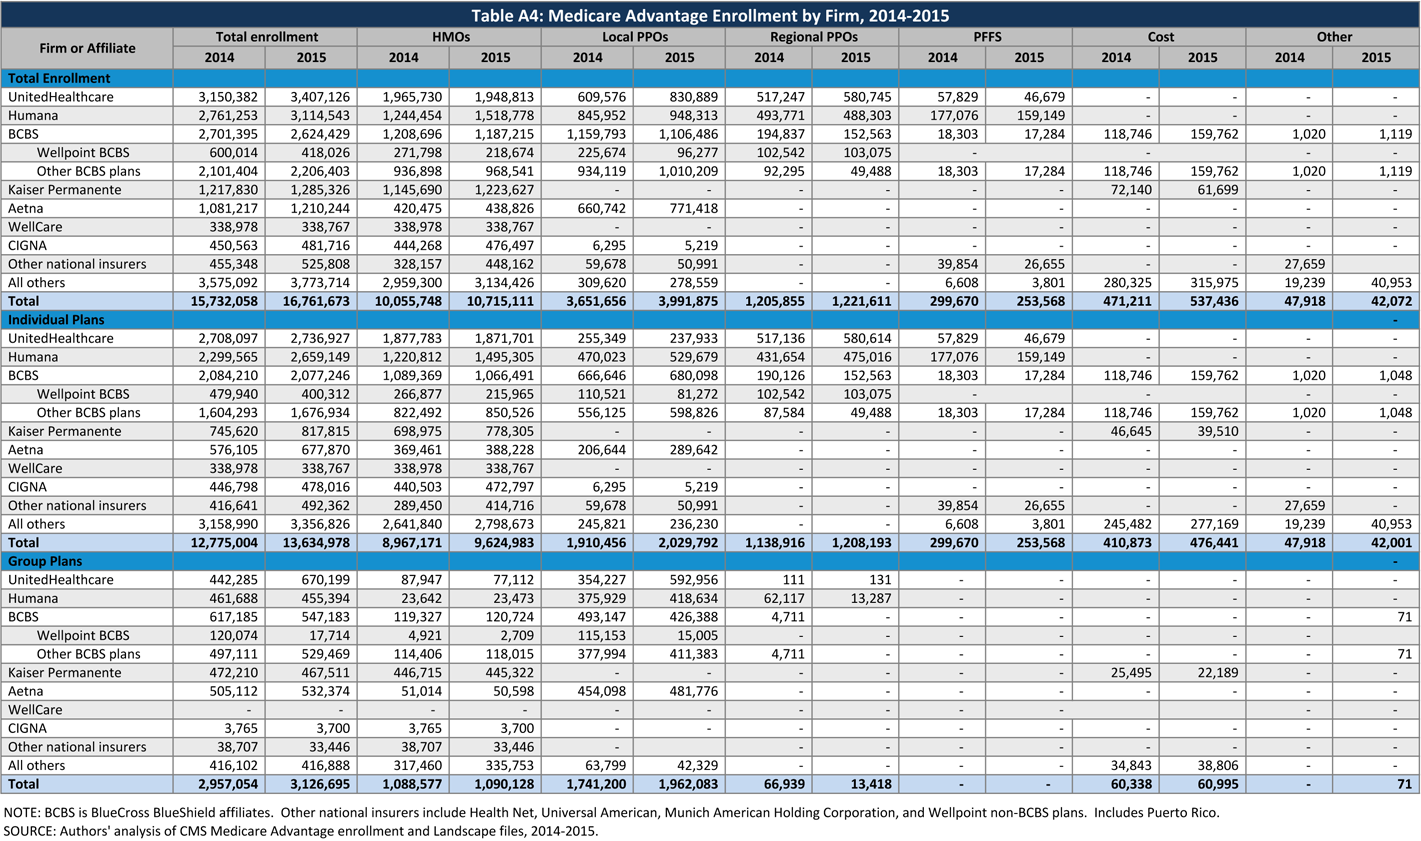
As in prior years, Medicare Advantage enrollment in 2015 tends to be highly concentrated among a small number of firms (Figure 14 and Table A4). In 2015, six firms or BCBS affiliates accounted for 72 percent of the market: UnitedHealthcare (20%), Humana (19%), Blue Cross Blue Shield (BCBS) affiliated plans (16%), Kaiser Permanente (8%), Aetna (7%), and Cigna (3%). Another six national firms account for 5 percent of the market, including Wellcare, HealthNet, Universal American, Munich American Holding Corporation, and Wellpoint plans not affiliated with BCBS. The remaining enrollees are in plans offered by more locally or regionally focused firms.
Figure 14: Medicare Advantage Enrollment, by Firm or Affiliate, 2015
Enrollment in Humana’s plans in absolute numbers grew by more than 350,000 beneficiaries between 2014 and 2015 – more than any other national firm – and its national share of the Medicare Advantage market increased from 17% in 2014 to 19% in 2015. UnitedHealthcare and Aetna also had large increases in enrollment, growing by more than 250,000 and 125,000, respectively, between 2014 and 2015. Other national firms saw smaller changes in enrollment between 2014 and 2015, including Wellpoint BCBS affiliated plans, which had a net decline in enrollment.
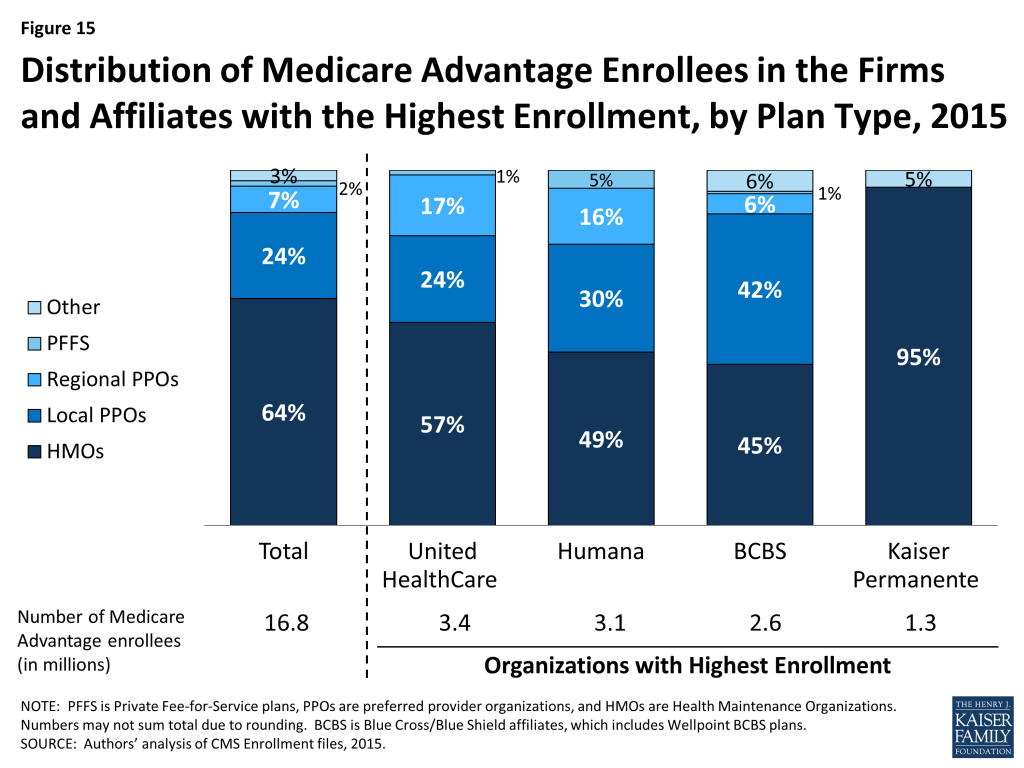
Firms differ in how they position themselves in the market, including the plan types they offer. Almost all of Kaiser Permanente’s enrollees (95%) are in HMOs with the remainder (5%) in similarly structured cost plans (Figure 15). In contrast, UnitedHealthcare’s enrollment is in HMOs, local PPOs, regional PPOs, and PFFS plans, and enrollment among plan types has shifted somewhat between 2014 and 2015. A smaller share of UnitedHealthcare’s enrollees is in HMOs in 2015 than in 2014 (57% versus 62%, respectively) and a larger share are in local PPOs (24% versus 19%, respectively).
Figure 15: Distribution of Medicare Advantage Enrollees in the Firms and Affiliates with the Highest Enrollment, by Plan Type, 2015
Compared to UnitedHealthcare, Humana and BCBS affiliated plans have a smaller share of their enrollment in HMOs (49% for Humana and 48% for BCBS versus 57% for United Healthcare). Humana’s distribution of enrollment across plan types continues the shift from earlier years when a much larger share of Humana’s enrollees was in PFFS plans. The share of Humana’s enrollees in HMOs increased from 45 percent in 2014 to 49 percent in 2015, while the share of Humana’s enrollees in other types of plans decreased.
Group Enrollment by Firm
Most of the growth in Medicare Advantage enrollment is in the individual market, but enrollment through group plans has been a major factor in the experience of some firms, and for UnitedHealthcare in particular (Table A4). Enrollment in group plans represents 20 percent of total enrollment in UnitedHealthcare plans, up from 14 percent in 2014. Similar to 2014, growth in the group market accounts for almost all of the net growth in UnitedHealthcare’s enrollment over the past year.
As in prior years, enrollment in the group market in 2015 is particularly important to Aetna (44% of enrollment, down from 47% in 2014) and Kaiser Permanente (36% of enrollment, down from 39% in 2014). Group enrollment historically has been less central to Humana’s strategy (15% of enrollment, down from 17% in 2014). Notably, all three firms saw stronger growth in their individual enrollment than group enrollment (with both Kaiser Permanente and Humana experiencing an actual decline in such enrollment). Total Medicare Advantage enrollment in Wellpoint BCBS’s plans also declined between 2014 and 2015 in part due to the large decline in group enrollment (from roughly 120,000 to 17,000). The role of individual versus group accounts in firm enrollment will vary with firm strategy, where firms are located in relation to large group accounts, and decisions made by those accounts about whether to continue retiree benefits and how to structure them (i.e., group products versus subsidies for individual purchase of products and which plans to offer or subsidize).
Firm Market Concentration by State
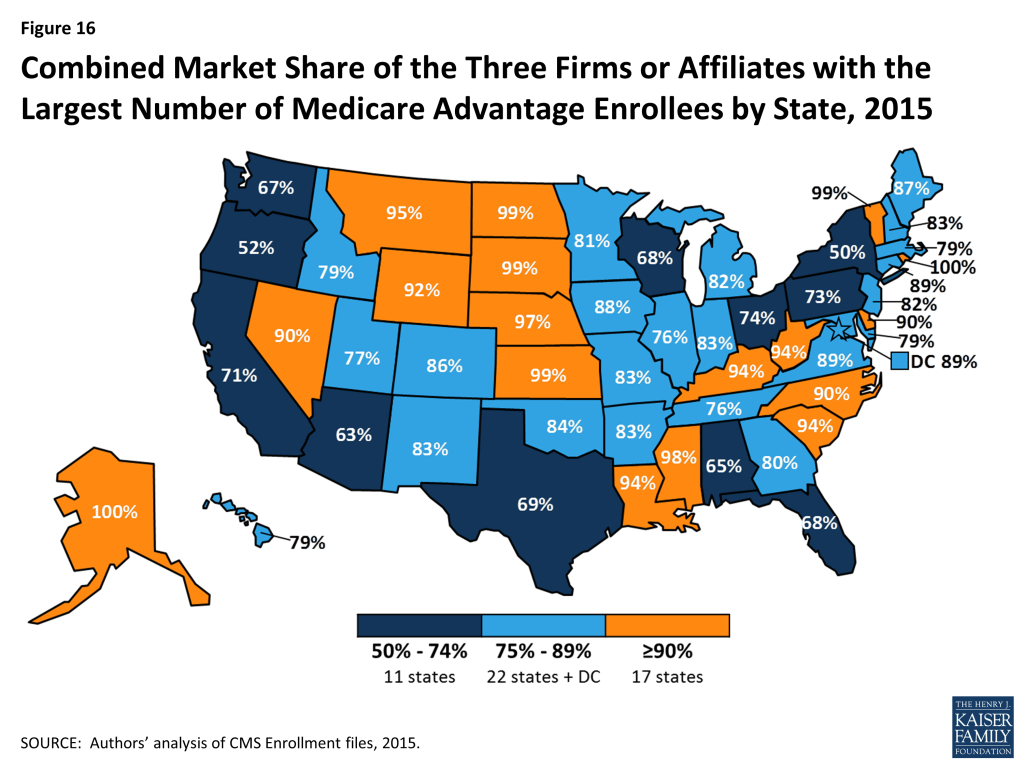
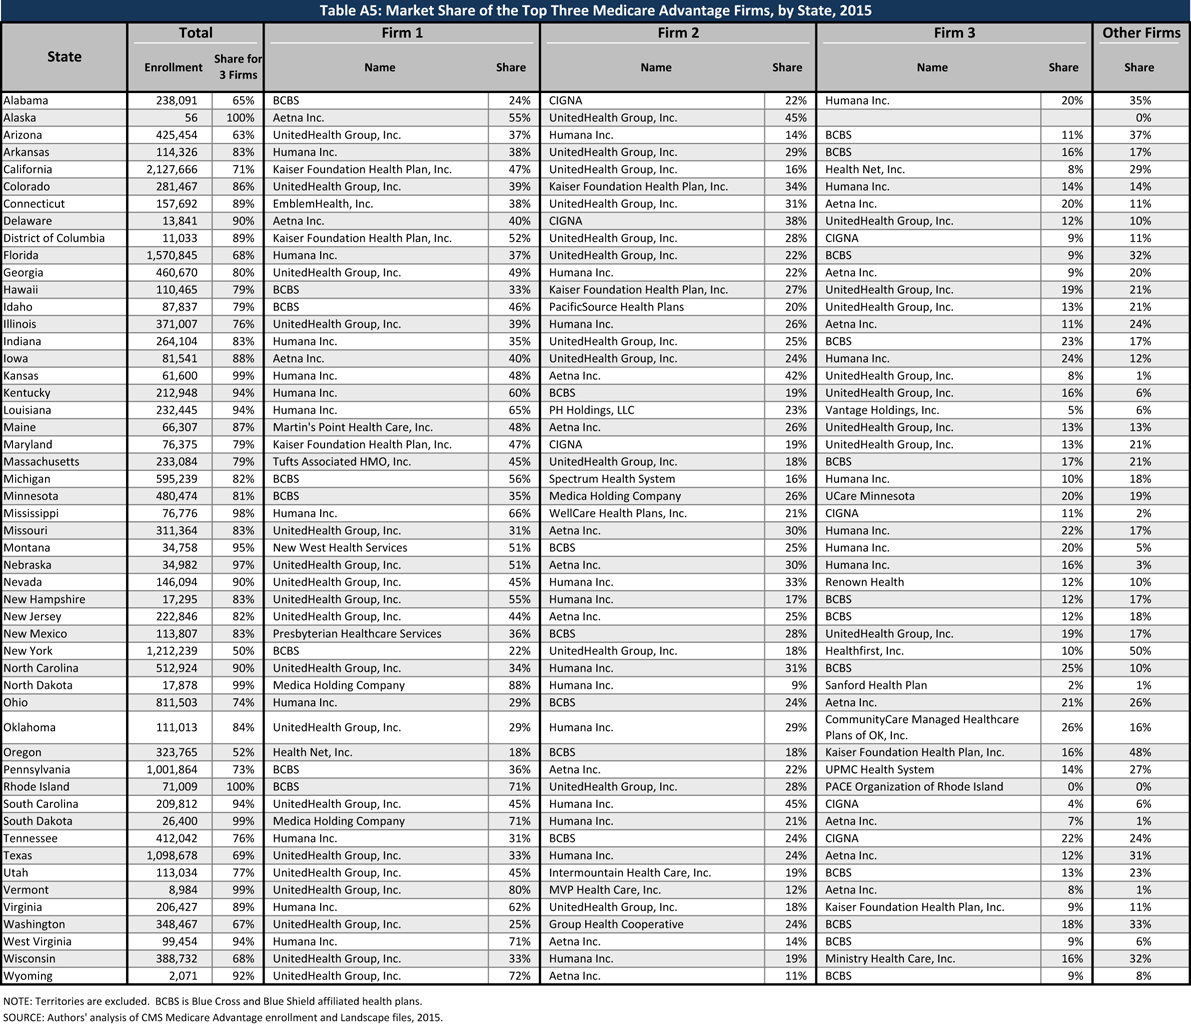
As is the case nationally, a small number of firms dominate Medicare Advantage enrollment in most states (Figure 16). Similar to prior years, in all but one state (NY), the three largest firms or BCBS affiliates account for more than 50 percent of enrollment. In 38 states and the District of Columbia, at least 75 percent of enrollment is in the three largest firms, including 17 states in which at least 90 percent of enrollment is in the three largest firms. Some states with highly concentrated markets (three firms accounting for at least 90 percent of enrollment) have Medicare Advantage penetration rates below the national average (AK, DE, KS, KY, MS, MT, ND, NE, SC, SD, VT, WV, WY), but several other such states do not (LA, NC, NV, RI).
Figure 16: Combined Market Share of the Three Firms or Affiliates with the Largest Number of Medicare Advantage Enrollees by State, 2015
In 15 states and the District of Columbia, one company has more than half of all Medicare Advantage enrollment – an indicator that these markets that may not be very competitive (Table A5). For the most part these large firms include large players dominant nationally, but in some cases they are local organizations that may be small nationally but having a substantial share in many states. United Healthcare has the largest share in 18 states and is among the top three firms in an additional 19 states and the District of Columbia. Humana has the largest enrollment in 11 states and is among the top 3 firms in another 19 states. Plans offered by BCBS affiliates have the most enrollees in 8 states and are among the top firms in another 18 states. Kaiser Permanente’s presence is more geographically focused than other major national firms, with a heavy concentration in California, Colorado, the District of Columbia and Maryland. Kaiser Permanente has more enrollees than any other firm in California, the District of Columbia and Maryland.
Similar to prior years, locally dominant plans, that is, those with the most Medicare Advantage enrollees in their state include EmblemHealth (CT), Martin’s Point Health are (ME), Tufts Associated HMO (MA), New West (MT), Presbyterian Healthcare Services (NM), and Medica Holding Company (ND and SD). While these large plans do not necessarily have a large national presence, they are very important in some local markets where their enrollment may equal or exceed some national players. In 2015, local firms include a total of 3.7 million Medicare Advantage enrollees, or 23 percent of Medicare Advantage enrollment.
Discussion
Despite controversy over the reductions in payments for Medicare Advantage plans that were included in the ACA, enrollment in Medicare Advantage plans continues to grow nationally, by state, and across quartiles of traditional Medicare spending. As of 2015, the Medicare Advantage payment reductions have been fully phased in for the majority of counties.
While Medicare Advantage premiums have remained relatively flat, out-of-pocket limits have been increasing over the past few years, providing less financial protection to Medicare enrollees with significant medial needs than they have in the past. Additional work is needed to understand plans’ cost-sharing and provider networks, including changes over time and variation across plans. A key concern is whether beneficiaries have the information they need to make fully informed health plan choices from one year to the next, taking into account changes in their plan’s coverage and/or provider network, and changes in their own health care needs.
As in prior years, enrollment in the Medicare Advantage market is concentrated among a handful of firms. Six firms or BCBS affiliates account for almost three-quarters (72%) of the market. Two firms, UnitedHealthcare and Humana, account for almost four in ten Medicare Advantage enrollees. Enrollment is even more highly concentrated in some states, with three firms or affiliates accounting for more than 90 percent of enrollment in 17 states, and one firm accounting for more than half of enrollment in 15 states and the District of Columbia. A key, unanswered question is what this market concentration means for consumers.
From the perspective of the Medicare program overall, it is clear that Medicare Advantage has become an increasingly important way in which Medicare beneficiaries receive their benefits and all signs suggest that this will only increase in the future. With such a large share of the program dependent on products offered from a relatively small number of private firms operating at the national and local levels, the ability of Centers for Medicare and Medicaid Services (CMS) to serve as a strong fiduciary for the program becomes increasingly important as well as challenging.
Gretchen Jacobson and Tricia Neuman are with the Kaiser Family Foundation; Anthony Damico is an independent consultant; and Marsha Gold is a Senior Fellow Emeritus with Mathematica Policy Research and independent consultant.
Appendix
Appendix A: Special Needs Plans
Special Needs Plans (SNPs) restrict enrollment to specific types of beneficiaries with significant or relatively specialized care needs, including beneficiaries: (1) dually eligible for Medicare and Medicaid (D-SNPs); (2) requiring a nursing home or institutional level of care (I-SNPs); or (3) with severe chronic or disabling conditions (C-SNPs.)
Enrollment in SNPs increased modestly from 1.9 million to 2.0 million beneficiaries between 2014 and 2015 (Figure A1 and Table A6). As a share of the total Medicare Advantage population, enrollment in SNPs is relatively low, and the 2.0 million SNP enrollees in 2015 account for about 12 percent of total Medicare Advantage enrollment. Yet, in four states and the District of Columbia, enrollment in SNPs is more than one-fifth of total Medicare Advantage enrollment (31% in DC, 28% in SC, 22% in AZ, 21% in AR, and 20% in AL; data not shown).
Figure A1: Number of Beneficiaries in Special Needs Plans, by Type, 2006 – 2015
Similar to prior years, most SNP enrollees are in HMOs (86%), with 11 percent enrolled regional PPOs and 3 percent in local PPOs. The majority of SNP enrollees (82%) are in plans serving those dually eligible for Medicare and Medicaid (D-SNPs). Enrollment of dually eligible beneficiaries in D-SNPs varies greatly by state, and is particularly prevalent in Hawaii (49%) and Arizona (41%) (Table A6).
Separately, several states (including CA, IL, MA, MI, MN, NY, OH, SC, TX, and VA) are undertaking demonstrations with CMS to improve the alignment of Medicare and Medicaid for dually eligible beneficiaries using a capitated model. These enrollees are not included in the SNP enrollment statistics provided here because they operate under unique authority and CMS classifies them as demonstrations. Minnesota is an exception because the demonstration uses its existing D-SNPs to improve the administrative alignment of Medicare and Medicaid in these dual SNPs. (Enrollment in Minnesota’s demonstration is included in the SNP enrollment in Table A6.)
It is unclear how the demonstration will affect the growth in D-SNP enrollment over time in states pursing capitated demonstrations. As of March 2015, more than 300,000 dual eligibles were enrolled in the demonstrations. Between 2014 and 2015, enrollment in D-SNPs increased or remained stable in the majority of demonstration states but enrollment in D-SNPs declined in California, Michigan, and Ohio.
Appendix B: Tables
Table A1: Medicare Advantage Enrollment by State and Plan Type, 2015
State
Total
Distribution of Enrollment, by State and Plan Type
% in HMOs
% in Local PPOs
% in Regional PPOs
% in PFFS Plans
% in Cost Plans
% in Other Plans
Total U.S.
16,761,673
64%
24%
7%
2%
3%
<1%
Alabama
238,091
62%
31%
7%
<1%
0%
<1%
Alaska
56
0%
100%
0%
0%
0%
0%
Arizona
425,454
91%
7%
1%
1%
<1%
0%
Arkansas
114,326
39%
16%
26%
18%
0%
<1%
California
2,127,666
98%
2%
0%
<1%
<1%
<1%
Colorado
281,467
80%
9%
0%
1%
8%
<1%
Connecticut
157,692
85%
12%
3%
0%
0%
0%
Delaware
13,841
62%
37%
0%
0%
0%
1%
District of Columbia
11,033
16%
32%
0%
0%
52%
0%
Florida
1,570,845
70%
7%
23%
<1%
<1%
<1%
Georgia
460,670
30%
44%
24%
2%
0%
0%
Hawaii
110,465
42%
55%
3%
0%
0%
0%
Idaho
87,837
52%
47%
0%
1%
0%
0%
Illinois
371,007
44%
52%
2%
1%
<1%
0%
Indiana
264,104
15%
65%
19%
2%
0%
0%
Iowa
81,541
31%
56%
0%
2%
11%
<1%
Kansas
61,600
44%
46%
2%
7%
0%
<1%
Kentucky
212,948
18%
57%
23%
2%
0%
0%
Louisiana
232,445
86%
5%
8%
<1%
0%
<1%
Maine
66,307
64%
32%
0%
3%
0%
0%
Maryland
76,375
32%
20%
0%
0%
47%
<1%
Massachusetts
233,084
75%
17%
4%
0%
0%
1%
Michigan
595,239
39%
55%
4%
1%
0%
<1%
Minnesota
480,474
25%
8%
0%
<1%
67%
0%
Mississippi
76,776
51%
18%
28%
3%
0%
0%
Missouri
311,364
68%
19%
10%
3%
0%
<1%
Montana
34,758
2%
88%
0%
11%
0%
0%
Nebraska
34,982
53%
28%
0%
19%
0%
<1%
Nevada
146,094
89%
11%
0%
0%
0%
0%
New Hampshire
17,295
42%
35%
0%
23%
0%
0%
New Jersey
222,846
78%
21%
0%
0%
0%
1%
New Mexico
113,807
62%
36%
0%
1%
0%
<1%
New York
1,212,239
72%
18%
7%
2%
<1%
<1%
North Carolina
512,924
45%
47%
6%
3%
2%
<1%
North Dakota
17,878
0%
9%
0%
1%
89%
1%
Ohio
811,503
44%
46%
7%
1%
2%
<1%
Oklahoma
111,013
66%
27%
3%
4%
0%
<1%
Oregon
323,765
60%
40%
0%
<1%
0%
<1%
Pennsylvania
1,001,864
62%
34%
1%
1%
0%
1%
Rhode Island
71,009
93%
4%
2%
0%
0%
<1%
South Carolina
209,812
29%
20%
46%
5%
0%
<1%
South Dakota
26,400
<1%
27%
0%
2%
71%
0%
Tennessee
412,042
69%
28%
2%
0%
0%
<1%
Texas
1,098,678
59%
23%
13%
3%
2%
<1%
Utah
113,034
82%
18%
0%
0%
0%
0%
Vermont
8,984
6%
21%
45%
27%
0%
<1%
Virginia
206,427
38%
25%
12%
14%
9%
1%
Washington
348,467
83%
17%
0%
<1%
0%
<1%
West Virginia
99,454
7%
82%
5%
6%
0%
0%
Wisconsin
388,732
48%
33%
4%
3%
12%
<1%
Wyoming
2,071
9%
18%
0%
66%
0%
3%
NOTE: Total U.S. includes Puerto Rico. Includes employer-sponsored plans, special needs plans, and other private plans.SOURCE:Authors’ analysis of CMS Medicare Advantage enrollment and Landscape files, 2015.
Table A2: Medicare Advantage Enrollment in the Individual and Group Markets, by State, 2015
State
Total
Individual plans
Group plans
% enrollees in group plans
Total U.S.
16,761,673
13,634,978
3,126,695
19%
Alabama
238,091
226,722
11,369
5%
Alaska
56
0
56
100%
Arizona
425,454
380,348
45,106
11%
Arkansas
114,326
109,552
4,774
4%
California
2,127,666
1,647,253
480,413
23%
Colorado
281,467
232,166
49,301
18%
Connecticut
157,692
142,843
14,849
9%
Delaware
13,841
10,656
3,185
23%
District of Columbia
11,033
7,738
3,295
30%
Florida
1,570,845
1,465,892
104,953
7%
Georgia
460,670
333,521
127,149
28%
Hawaii
110,465
83,119
27,346
25%
Idaho
87,837
86,197
1,640
2%
Illinois
371,007
217,198
153,809
41%
Indiana
264,104
218,813
45,291
17%
Iowa
81,541
76,739
4,802
6%
Kansas
61,600
57,017
4,583
7%
Kentucky
212,948
124,342
88,606
42%
Louisiana
232,445
213,612
18,833
8%
Maine
66,307
53,713
12,594
19%
Maryland
76,375
51,724
24,651
32%
Massachusetts
233,084
196,422
36,662
16%
Michigan
595,239
302,171
293,068
49%
Minnesota
480,474
437,232
43,242
9%
Mississippi
76,776
74,762
2,014
3%
Missouri
311,364
279,712
31,652
10%
Montana
34,758
32,961
1,797
5%
Nebraska
34,982
31,769
3,213
9%
Nevada
146,094
138,940
7,154
5%
New Hampshire
17,295
12,005
5,290
31%
New Jersey
222,846
170,491
52,355
23%
New Mexico
113,807
94,595
19,212
17%
New York
1,212,239
999,021
213,218
18%
North Carolina
512,924
385,512
127,412
25%
North Dakota
17,878
17,775
103
1%
Ohio
811,503
500,372
311,131
38%
Oklahoma
111,013
100,538
10,475
9%
Oregon
323,765
272,682
51,083
16%
Pennsylvania
1,001,864
798,441
203,423
20%
Rhode Island
71,009
65,268
5,741
8%
South Carolina
209,812
195,819
13,993
7%
South Dakota
26,400
26,006
394
1%
Tennessee
412,042
389,994
22,048
5%
Texas
1,098,678
909,082
189,596
17%
Utah
113,034
109,107
3,927
3%
Vermont
8,984
7,338
1,646
18%
Virginia
206,427
179,573
26,854
13%
Washington
348,467
304,472
43,995
13%
West Virginia
99,454
44,273
55,181
55%
Wisconsin
388,732
347,663
41,069
11%
Wyoming
2,071
1,681
390
19%
NOTE:Total U.S. includes Puerto Rico.SOURCE:Authors’ analysis of CMS Medicare Advantage enrollment and Landscape files, 2015.
Table A6: Enrollment in Special Needs Plans (SNPs), by Plan Type and State, 2015
State
Enrollment in Special Needs Plans
Total Dual Eligibles (in 2013)
% of Dual Eligibles in D-SNPs
Total
Dual eligibles(D-SNPs)
Institutional(I-SNPs)
Chronic or disabling conditions(C-SNPs)
Total U.S.
2,011,505
1,657,554
48,740
305,211
10,705,500
15%
Alabama
48,409
48,391
136
–
220,060
22%
Alaska
–
–
–
–
16,520
0%
Arizona
95,008
75,703
1,746
17,559
186,160
41%
Arkansas
24,389
12,308
–
12,081
136,060
9%
California
214,208
170,334
3,645
40,229
1,358,140
13%
Colorado
12,773
10,270
2,425
78
102,800
10%
Connecticut
12,242
9,742
2,500
–
173,400
6%
Delaware
2,223
885
457
881
29,100
3%
District of Columbia
3,394
3,218
68
108
30,940
10%
Florida
266,831
205,219
3,196
58,416
787,040
26%
Georgia
87,737
44,328
2,236
41,173
317,440
14%
Hawaii
19,118
19,118
–
–
39,120
49%
Idaho
1,460
1,460
–
–
42,840
3%
Illinois
11,648
9,547
615
1,486
382,340
2%
Indiana
4,454
821
93
3,540
190,460
<1%
Iowa
585
169
–
416
90,640
<1%
Kansas
289
–
227
62
70,860
0%
Kentucky
3,977
3,505
–
472
194,180
2%
Louisiana
27,784
26,293
–
1,491
214,220
12%
Maine
1,548
1,548
–
–
102,000
2%
Maryland
11,164
4,839
2,808
3,517
139,100
3%
Massachusetts
34,195
33,794
191
210
302,300
11%
Michigan
18,966
18,664
198
104
321,400
6%
Minnesota
36,188
36,188
–
–
146,460
25%
Mississippi
13,752
12,036
–
1,716
169,580
7%
Missouri
23,756
10,871
21
12,864
200,440
5%
Montana
–
–
–
–
27,380
0%
Nebraska
364
–
–
364
45,920
0%
Nevada
8,511
15
–
8,496
54,940
0%
New Hampshire
19
19
–
–
34,240
0%
New Jersey
11,207
9,526
1,460
221
226,420
4%
New Mexico
10,950
9,991
297
662
76,080
13%
New York
192,449
177,861
14,276
312
857,220
21%
North Carolina
21,052
16,157
2,417
2,478
342,720
5%
North Dakota
–
–
–
–
17,580
0%
Ohio
13,453
11,201
1,203
1,049
369,500
3%
Oklahoma
115
–
115
–
123,600
0%
Oregon
25,460
21,675
581
3,204
118,820
18%
Pennsylvania
119,052
103,998
2,927
12,127
456,240
23%
Rhode Island
1,538
14
1,524
–
42,080
0%
South Carolina
58,005
22,242
–
35,763
162,020
14%
South Dakota
–
–
–
–
21,920
0%
Tennessee
68,356
68,356
–
–
287,800
24%
Texas
163,979
133,966
198
29,815
726,120
18%
Utah
8,155
8,155
–
–
38,100
21%
Vermont
–
–
–
–
30,900
0%
Virginia
3,817
1,329
89
2,399
201,920
1%
Washington
24,563
23,084
1,479
–
189,940
12%
West Virginia
133
133
–
–
88,180
<1%
Wisconsin
21,109
18,454
1,612
1,043
176,620
10%
Wyoming
–
–
–
–
12,160
0%
NOTE: Total U.S. includes Puerto Rico. Blank cells indicate no plans offered.SOURCE: Authors’ analysis of CMS Medicare Advantage enrollment and Landscape files, 2015.Number of dual eligibles by state is derived from the CMS Chronic Conditions Data Warehouse standard analytic files for 2013.
Endnotes
In this document, the ACA refers to the Patient Protection and Affordable Care Act of 2010 (P.L. 111-148; PPACA) as amended by the Health Care and Education Reconciliation Act of 2010 (P.L. 111-152). ↩︎
G. Jacobson, P. Neuman, and A. Damico. “At Least Half of New Medicare Advantage Enrollees Had Switched From Traditional Medicare During 2006-11,” Health Affairs, vol. 34 no. 1, p. 48-55, January 2015. Also see G. Jacobson, T. Neuman, and A. Damico. “Medigap Enrollment Among New Medicare Beneficiaries: How Many 65-Year Olds Enroll In Plans With First-Dollar Coverage?” Washington DC: Kaiser Family Foundation, April 2015. Available at: https://modern.kff.org/medicare/issue-brief/medigap-enrollment-among-new-medicare-beneficiaries/, Last accessed June 5, 2015. ↩︎
M. Gold. “Medicare’s Private Plans: A Report Card on Medicare Advantage,” Health Affairs Web Exclusive, November 24, 2008. ↩︎
M. Gold, D. Phelps, G. Jacobson, and T. Neuman. “Medicare Advantage 2010 Data Spotlight: Plan Enrollment Patterns and Trends,” Washington DC: Henry J. Kaiser Family Foundation, June 2010. Available at: https://modern.kff.org/wp-content/uploads/2013/01/8080.pdf#page=7↩︎
Kaiser Family Foundation and Health Research and Education Trust, “Section 11. Retiree Health Benefits.” Employer Health Benefits: 2013 Annual Survey. Washington, DC: Kaiser Family Foundation, 2013, pp. 191-199; and P. Fronstein and N. Adams. “Employment Based Retiree Health Benefits: Trends in Access and Coverage: 1997-2010.” EBRI Education and Research Institute, 2012. ↩︎
Medicare Payment Advisory Commission “Chapter 13. The Medicare Advantage Program: Status Report” in Report to Congress: Medicare Payment Policy, Washington DC, March 2015. pp 313-343. ↩︎
Medicare Payment Advisory Commission “Chapter 13. The Medicare Advantage Program: Status Report” in Report to Congress: Medicare Payment Policy, Washington DC, March 2015. pp 313-343 and Marsha Gold and Maria Cupples Hudson. “Analysis of the Variation in Efficiency among Medicare Advantage Plans” Research Brief Washington DC: Mathematica Policy Research, April 2013. ↩︎
In the fall of 2014, we calculated that beneficiaries who were enrolled in Medicare Advantage plans at that time would pay a premium of $41 per month in 2015, compared to $34 per month in 2014, which assumed they remained in the same plan. Among Medicare Advantage enrollees in 2015, the average premium actually paid by enrollees ($38 per month) is slightly lower than the amount estimated in the fall, with the difference in estimates reflecting both changes in beneficiaries enrolled in Medicare Advantage plans from 2014 to 2015 and shifts by enrollees among plans and plan types. ↩︎
In Minnesota, 67% of private plan enrollment is in cost plans, which have higher average premiums than Medicare Advantage plans. ↩︎
Limits were required for regional PPOs since they were first authorized in 2006. ↩︎
The files used for this analysis provide limited details on the type or extent of coverage in the Part D coverage gap that plans provide, and some additional coverage may be minimal. ↩︎
Department of Health and Human Services, Centers for Medicare and Medicaid Services, “Medicare Announces Quality Bonus Payment Demonstration for Medicare Health Plans,” November 2010. ↩︎
In addition to expanding the Medicaid program to cover low-income adults, the Affordable Care Act (ACA) established new modernized, streamlined enrollment and renewal rules for Medicaid and CHIP that are designed to create a coordinated, “no wrong door” system and keep individuals enrolled for as long as they are eligible. States must implement these new policies regardless of whether they adopt the Medicaid expansion to low-income adults.
While much attention has been focused on enrollment efforts, this brief reviews the new renewal requirements for Medicaid and CHIP that are designed to maintain continuity of coverage for eligible individuals. It provides an overview of state implementation of the new renewal policies and considers the potential role managed care plans can play in supporting renewals. Key findings include:
While states have made significant progress implementing new enrollment processes, some aspects of the simplified renewal policies have not yet been fully implemented due to a range of challenges.
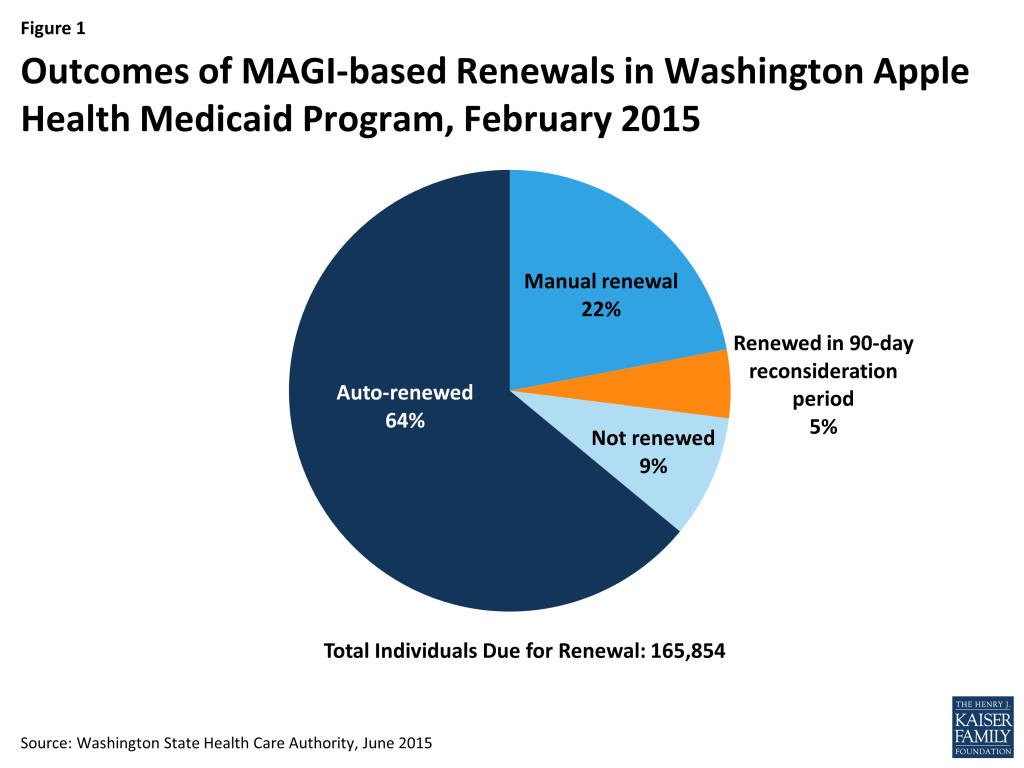
While many states have been delayed in implementing the streamlined renewal policies, some states, including Washington and Rhode Island, have successfully implemented the new policies and achieved high retention rates with more than nine in ten enrollees successfully renewed.
Managed care plans can support renewals by reminding members to renew and providing direct assistance with the renewal process. However, plans identified challenges to supporting renewal, including lack of accurate data on member renewal dates; concerns about how marketing guidelines apply to renewal outreach; and lack of clear guidance, expectations, and financial support from states for plans’ role in supporting renewals.
Issue Brief
Medicaid and CHIP Renewals under the ACA
Effective renewal processes are important for maintaining the coverage gains that have been achieved under the ACA to date, supporting access to care, and promoting administrative efficiency. There is substantial evidence demonstrating the negative effects of “churning” on and off of health coverage, including health consequences and increased medical costs resulting from disruptions in care as well as administrative delays and inefficiencies for families, providers, health plans and states. Research over the years has confirmed that a significant number of enrollees who lose coverage at renewal remain eligible and return to Medicaid within the same year.1
The ACA established new simplified renewal rules for Medicaid and CHIP designed to keep individuals enrolled for as long as they are eligible. In March 2012, the Centers for Medicare & Medicaid Services published federal regulations that outlined new renewal processes for states to promote continuity of coverage as envisioned by the ACA.2 The regulations were informed by prior state successes reducing administrative burdens on families in renewing Medicaid and CHIP coverage and built on longstanding policy and regulations that limit information states can collect to renew Medicaid eligibility.3 The regulations take into account the availability of new technology, the enhanced ability to conduct electronic matches with state databases, and the creation of a federal data services hub that allows states to conduct real-time electronic data matches against federal data sets.4
The new renewal processes are designed to minimize the information requested from families and support transitions to other coverage. Following are the new renewal processes for individuals determined eligible for Medicaid or CHIP based on modified adjusted gross income (MAGI) (see Appendix A for details):
States must first seek to renew eligibility on an ex parte basis, which does not require any action from the enrollee. To complete an ex parte renewal, states check all available data sources to confirm if eligibility can be renewed without contacting the family. The state then sends a notice informing the enrollee of his or her continued eligibility. If nothing has changed, the enrollee does not need to sign or return the notice.
If an ex parte renewal cannot be achieved, states must provide enrollees with a pre-populated form that includes information available to the agency and requests any additional information needed to renew eligibility. Individuals must sign and return the form with any additional information required to complete renewal.
If an individual does not complete his or her renewal, states must provide at least a 90-day reconsideration period after coverage ends. During this period, individuals can provide the necessary information to continue coverage without submitting a new application.
When an individual is found no longer eligible for Medicaid or CHIP, states must assess or determine eligibility for Marketplace coverage, and electronically transfer the account to the Marketplace if an individual is assessed as potentially eligible.
Eligibility may only be re-determined once every 12 months unless the state has information provided by the beneficiary or through data sources indicating changes in circumstances that may affect eligibility.5 Individuals are required to report changes that might affect their eligibility,6 and states must enable families to report changes in a timely manner and promptly address any changes. 7 The rules also no longer permit states to require an in-person interview at either enrollment or renewal.8
State Implementation of Streamlined Renewal Policies
States prioritized implementing streamlined enrollment processes, which led to delays in implementing new renewal procedures in most states. In order to implement the new ACA enrollment and renewal policies, many states needed to make significant upgrades to their eligibility and enrollment systems. CMS facilitated these efforts by providing an enhanced federal Medicaid matching rate for systems work.9 However, many states faced challenges completing their system builds and upgrades prior to implementation of the ACA and had to prioritize their policy changes in conjunction with system functionality decisions. Initially, states and the federal government focused heavily on implementing streamlined enrollment processes and establishing coordination between Medicaid and Marketplace coverage. As a result, most states were delayed in their ability to focus on implementation of the new renewal procedures. Recognizing this challenge, and the large scope of work facing states with enrollment under the coverage expansions and changes in the eligibility rules, CMS offered states the opportunity to temporarily delay renewals for existing Medicaid or CHIP enrollees, a strategy that 36 states adopted during 2014. While a number of these states had completed all delayed renewals by 2015, others extended these delays into 2015.10
Many states are still transitioning to the streamlined renewal processes due to a range of challenges. For example, states needed to migrate data for existing Medicaid and CHIP enrollees from old legacy systems to their new MAGI-based eligibility systems. Moreover, states were not able to conduct ex parte renewals for existing Medicaid enrollees since they needed to collect additional information – including MAGI-based income and tax filing household information – which they did not have on file for these individuals to conduct determinations based on the new MAGI-based rules. Finally, states were still developing systems capacity to process ex parte renewals and produce pre-populated forms and notices for individuals.
Given these challenges, CMS worked with states to develop interim mitigation strategies and utilize flexibility to facilitate renewals. Specifically, states can use simpler “non-filer” tax rules to calculate ongoing eligibility for existing Medicaid enrollees. They also can receive approval to conduct renewals using data from the Supplemental Nutritional Assistance Program (SNAP or food stamps) and to accept self-attestation that a family’s income and other circumstances have not changed.11 A number of states took up these strategies as part of their mitigation plans and, to date, there have not been any substantial downward trends in enrollment data that would suggest coverage losses due to problems with renewals.12 CMS reports that most states have now implemented or are in the process of implementing pre-populated renewal forms, and most states expect to have the full ability to conduct ex parte renewals during 2015.13 However, renewals remain a concern in some states.
In May 2013 guidance, CMS reiterated that states may adopt 12-month continuous eligibility for parents and other adults through Section 1115 waiver authority, but states have not taken up this option. One effective strategy for promoting continuity of Medicaid and CHIP coverage and minimizing administrative burdens and costs is to provide 12 months of continuous eligibility, regardless of changes in family circumstances. This policy has been available as a state option for children enrolled in Medicaid and/or CHIP since 1997 and can be implemented under Medicaid section 1115 waiver authority for parents and other adults. When CMS reiterated the waiver opportunity, it clarified that, because some newly eligible adults who qualify for an enhanced federal matching rate might have become ineligible at some point in the year, a financial adjustment would be applied to these “newly eligible” adults. Under the adjustment, 97.4% of the 12 months of coverage for each enrollee would be matched at the enhanced rate, and 2.6% of the enrollee months would be matched at the regular match rate.14 To date, New York is the only state that has taken up this option. Limited state interest may reflect less perceived need for 12-months continuous eligibility because of the shift toward real-time eligibility and streamlined renewal policies. States may also have reservations about the financial adjustment.
Examples of State Successes with New Renewal Policies
While many states have been delayed in implementing the new streamlined renewal policies, some states, including Washington and Rhode Island, which have been long-time leaders in adopting renewal simplification strategies for children, have already achieved significant success implementing the new policies based on information reported by state officials, as described below.15
Washington
Prior to the ACA, Washington had a largely manual renewal process. Most renewals were completed by an enrollee returning a paper renewal form and attaching documentation to verify current wages. Renewal forms were sent out 45 days prior to the renewal date and were manually reviewed and completed by eligibility staff.
Today, Washington primarily relies on a process it calls “auto-renewal.” The state first conducts an electronic data match with available data sources (from the Internal Revenue Service and the state’s more timely quarterly wage database) to confirm continued eligibility. If the data match is successful, 60 days before the renewal date, the state sends a pre-populated form informing the individual of continued eligibility and providing an opportunity to update information. If nothing has changed, the individual does not need to return the form to continue coverage. If the data match is not successful, the state requests the additional information needed to complete the renewal. If an individual does not complete the renewal and is within the 90-day reconsideration period, he or she can renew in real-time by going on-line or calling the state’s customer service center.
Two-thirds of MAGI-based enrollees are now renewed through ex parte processes and overall retention rates have increased to above 90% in Washington. About two-thirds of the Washington’s MAGI-based enrollees (children, pregnant women, parents, and expansion adults) qualify for auto-renewal. Overall, more than eight in ten individuals are successfully renewed during their 12-month eligibility period through both auto-renewals and manual renewals, for which families must submit additional information. An additional 5% of renewals are completed during the 90-day reconsideration period. The state reported an overall retention rate of 91% as of February 2015, after taking into account those renewing during the reconsideration period (Figure 1).
Figure 1: Outcomes of MAGI-based Renewals in Washington Apple Health Medicaid Program, February 2015
Rhode Island
Building on previous success with adopting innovative practices and efficient processes, Rhode Island has also achieved a high Medicaid retention rate of 94%. The Rhode Island Executive Office of Health and Human Services sends out a pre-populated renewal form to every MAGI Medicaid beneficiary who is coming up for renewal 60 days in advance of the renewal date. The pre-populated form includes all of the information known to the state, including the results of electronic data matching conducted immediately before sending the forms. Rhode Island reports that two-thirds of the renewal forms do not request any additional information and, in those cases, families are renewed without having to take any action if nothing has changed. For the remaining one-third of cases that request information or documentation, the state asks for the information to be returned within 15 days.16 Thirty days before the renewal date, the state sends notices to all households notifying them of their renewal and any change in eligibility category.
Leveraging Managed Care Plans to Support Renewals
Managed care plans can play a key role in supporting renewals given their ongoing relationship with enrollees. Information collected from 14 plans in 9 states (CA, CO, MA, NY, OH, RI, TX, VA, and WA) by the Association for Community Affiliated Plans and follow-up telephone interviews conducted with four health plan representatives identified both promising examples of how managed care plans can facilitate renewals, as well as challenges to maximizing the potential of this role.
Plans identified a range of strategies they have employed to educate and remind members about renewal. Several plans reported that they conduct live or automated calls to let members know that their renewal date is approaching, send reminder postcards, and are starting to use newer communication strategies like text messages. In addition, some plans reported including reminders in member newsletters about the importance of watching for and responding to mail from the state, making sure mailboxes are accessible, and providing a number to call if assistance is needed. Some plans indicated that they work with individual providers to remind their patients to renew. For example, plans share renewal dates with primary care providers or community health centers and ask the provider or health center to remind patients about upcoming renewals during visits or through direct outreach by phone or in-person. One plan noted that it has established a partnership with the state human service agency to provide grant funding to community-based organizations to focus on renewal outreach.
A number of plans described more hands-on approaches to assist members with completing their renewals. These included working closely with county eligibility offices to validate eligibility information and renewal dates; the plan acting as a “authorized representative” for the member, enabling the plan to complete the renewal process on the member’s behalf; and assisting members with providing additional information to reinstate coverage if they have not completed a renewal and are in the 90 day reconsideration period.
However, the plans indicated that conducting renewal outreach is sometimes challenging due to lack of accurate data on member renewal dates. The plans indicated that, while state Medicaid agencies generally are willing to provide the plans with eligibility information and renewal dates for their members, the renewal dates are sometimes inaccurate or out-of-date. This can result in confusion for individuals if a plan reminds a member about renewal after the individual has already completed the renewal process. Some plans noted that the information they have on file for their members is often more up-to-date than the state’s data, but that the state will not or cannot update its information based on the plan’s data. Some plans also noted that counties sometimes have more timely information than the state due to their administration of other social services programs. Plans also mentioned that enrollment and renewal dates provided by the state may cover several programs, and sometimes it is not clear which date applies to Medicaid. Further, with the change to new eligibility systems, some states have been temporarily unable to provide information to plans. This issue may be resolved as systems reach full functionality, but, in the short-term, it has created a challenge for plans in conducting renewal outreach.
A number of plans also indicated concerns about how marketing guidelines apply to renewal outreach, particularly since materials must be approved by the state. These perceptions could be due at least, in part, to misunderstanding of how federal rules regarding marketing practices for Medicaid managed care plans may apply to activities designed to facilitate renewal. To clarify these rules, in January 2015, CMS released a set of Frequently Asked Questions (FAQs) that confirm that Medicaid managed care plans may conduct outreach to their enrollees regarding the Medicaid renewal process. As long as outreach to enrollees is directed at “beneficiaries who are currently enrolled with that Medicaid managed care plan, and is not intended to influence the beneficiary to re-enroll in that particular Medicaid managed care plan,” the activity is appropriate. The FAQs further clarify that educational materials emphasizing the importance of completing the state’s Medicaid renewal process in a timely fashion are not considered marketing materials.17 Moreover, the most recent proposed rules for managed care plans issued by CMS in May 2015 include similar assurances confirming the policy outlined in the FAQs.18
In addition, plans reported feeling limited in the ability to provide direct assistance with renewals. Some plans noted that they are encouraged by their state to educate their members about renewal, but that the plan must refer the member back to the county or state to complete the renewal process. One plan reported that their managed care contract specifically prevents the plan from assisting with renewal. Other plans noted that the lack of clear guidance, expectations, and financial support for the plans’ role in facilitating renewals limits their activities.
Conclusion
States have achieved significant progress implementing streamlined enrollment and renewal procedures under the ACA, but there is still more work to be done, particularly in fully implementing new renewal processes to facilitate continuity of coverage. While many states have faced challenges in implementing the new renewal policies, several states, including Washington and Rhode Island, have already experienced success and high retention rates under the new policies. As more states complete the implementation process, it will be important to continue to monitor impacts on retention rates to assess the extent to which they are supporting the ACA’s vision of keeping individuals enrolled for as long as they are eligible. Looking ahead, managed care plans could play a key role in supporting renewals given their ongoing relationship with enrollees, but plans also have identified a range of challenges they face in supporting renewals. Addressing these challenges may bolster plans’ ability to collaborate with states to promote continuity of coverage.
This brief was prepared by Jennifer Ryan of Harbage Consulting and Samantha Artiga of the Kaiser Family Foundation. The authors express their appreciation to Mary Wood, Washington State Health Care Authority; Amy Lapierre, Rhode Island Executive Office of Health and Human Services; Brenda Whittle and Lisa Carcieri, Neighborhood Health Plan of Rhode Island; Carolyn Thon, Health Plan of San Mateo; Michael Nguyen and Gerri Casillas, Health Plan of San Joaquin; and Anne Marie Costello and Sarah deLone, Center for Medicaid and CHIP Services, CMS for their assistance and insights in developing this paper.
Appendix
Appendix A:
Renewal Processes for Medicaid and CHIP under the ACA
Ex parte renewals.19 The state should check all data sources to determine if eligibility can be renewed based on available data without contacting the family. Because the decision is based on reliable data sources, a signed renewal form is not needed. The state must send a notice to the beneficiary informing him or her of continued eligibility and providing the opportunity to correct any inaccurate information, but, if nothing has changed, the individual is not required to sign or return the notice.20 The concept of ex parte renewal is a longstanding federal Medicaid policy, but it had previously been inconsistently applied by states, since many states had limited systems capability to check against data sources and renew eligibility without the enrollee providing information. The broader systems upgrades facilitated by the ACA, coupled with access to electronic verification data, enhanced states’ ability to implement an effective ex parte process.
Pre-populated forms. If an ex parte renewal cannot be achieved, states must provide the enrollee a pre-populated renewal form that includes information available to the agency and requests additional information needed to renew eligibility.21 These pre-populated forms must be provided at least 30 days in advance of the renewal date and must be accepted through multiple modes, including online, by phone, mail and in person.22 Individuals must sign and return the pre-populated renewal form to complete the renewal, and states must provide several signature options, including telephonic signatures, electronic signatures and handwritten signatures that can be transmitted electronically.23 States also are required to provide notices to individuals following completion of the renewal.24
90-day reconsideration period. If an individual does not complete the renewal, states must provide at least a 90-day reconsideration period after the date coverage ends.25 During this period, families have the opportunity to provide the necessary information to continue coverage without being required to complete a new application. Under regulations, retroactive Medicaid coverage is available back to the date coverage ended, although some states have received waivers of retroactive coverage.
Coverage transitions. Prior to terminating Medicaid coverage, the state must consider eligibility through all eligibility pathways (both MAGI and non-MAGI) and assess or determine eligibility for other coverage options including CHIP and Marketplace coverage.26 If the state assesses the individual as potentially eligible for Marketplace coverage, it must electronically transfer that individual’s account to the Marketplace for a complete determination of eligibility.27
Renewals for Non-MAGI groups. There are some differences in renewal rules for elderly and disabled populations whose Medicaid eligibility is determined based on non-MAGI rules.28 Eligibility is renewed at least every 12 months, and ex parte renewal is required if sufficient information is available. States may, but are not required, to use a pre-populated renewal form for these groups. In general, states have delayed systems upgrades for non-MAGI groups, with most planning toward incorporating them into new or upgraded systems in 2016.29
States may only collect “information that is necessary to determine ongoing eligibility and that relates to circumstances that are subject to change, such as income and residency. States cannot require individuals to provide information that is not relevant to their ongoing eligibility, or that has already been provided with respect to an eligibility factor that is not subject to change, such as date of birth or United States citizenship.” Health Care Financing Administration, Letter to State Medicaid Directors from Tim Westmoreland, April 7, 2000, available at http://downloads.cms.gov/cmsgov/archived-downloads/SMDL/downloads/smd040700.pdf↩︎
The hub is designed to provide states and the federal government with coordinated and real-time access to information about applicants, including their quarterly wages, citizenship and immigration status, and other eligibility criteria. ↩︎
CMS offered states an enhanced 90 percent federal Medicaid matching rate to build new eligibility and enrollment systems and a 75 percent matching rate for upgrading existing systems and supporting ongoing maintenance and operating costs Medicaid Program; Federal Funding for Medicaid Eligibility Determination and Enrollment Activities; Final Rule, April 19, 2011; available http://www.gpo.gov/fdsys/pkg/FR-2011-04-19/pdf/2011-9340.pdf. CMS recently proposed to extend this enhanced match rate on a permanent basis. Letter from Cindy Mann to National Association of Medicaid Directors and the American Public Human Services Association indicating CMS’ intent to publish a proposed regulation that will permanently extend the availability of the 90% and 75% matching funds for E & E systems modernization activities. The letter also discusses an extension of the OMB Circular A-87 waiver that enables states to pursue integrated eligibility systems with other human services programs. October 28, 2014, available at http://www.medicaid.gov/medicaid-chip-program-information/by-topics/data-and-systems/downloads/medicaid-90/10-funding-extension.pdf. The proposed rule is available at http://www.gpo.gov/fdsys/pkg/FR-2015-04-16/pdf/2015-08754.pdf↩︎
Author interview with Mary Wood, Director of Eligibility Policy and Service Delivery, Washington State Health Care Authority, April 13, 2015 and follow-up email conversations on May 20 and June 16, 2015 and author interview with Amy Lapierre, Administrator, Rhode Island Executive Office of Health and Human Services, April 16, 2015. ↩︎
Although individuals have 30 days to respond before termination can take place. ↩︎
See 42 CFR Section 438.104 of the May 26, 2015 proposed rule, “Medicaid and Children’s Health Insurance Program (CHIP) Programs; Medicaid Managed Care, CHIP Delivered in Managed Care, Medicaid and CHIP Comprehensive Quality Strategies, and Revisions Related to Third Party Liability; Proposed Rules,” p.31273. Available at http://www.gpo.gov/fdsys/pkg/FR-2015-06-01/pdf/2015-12965.pdf. ↩︎
The regulation requires that the state give the individual at least 30 days from the date of receipt of the renewal form. States generally send the form well in advance of the end date of coverage so that they can give the person the 30 days to respond and for the state to receive the form and have time to process it prior to the coverage end date. ↩︎
After today’s Supreme Court ruling upholding the Affordable Care Act’s federal subsidies, Drew Altman’s latest column in The Wall Street Journal’s Think Tank explores what the decision means and what’s next for the health law.
All previous columns by Drew Altman are available.
A Kaiser Family Foundation analysis of ACA plans in major metropolitan areas in 11 states where data are available, including the District of Columbia, finds that preliminary 2016 premiums for benchmark silver plans grew modestly, but increased more sharply this year than last year. The average increase for benchmark plans across the cities is 4.4 percent for 2016 compared with a 2 percent increase nationwide in 2015.
Premium changes for the benchmark plans vary significantly across the cities in the analysis, ranging from a decrease of 10.1 percent in Seattle to an increase of 16.2 percent in Portland, Ore. Complete 2016 rate information isn’t yet available for all states.
In 2016, the number of insurers offering coverage stayed the same or increased in nine states, but decreased in Michigan and the District of Columbia, according to the analysis.
The Affordable Care Act’s rate review provision requires early public notification of very large premium increases exceeding 10 percent in all states, and recent press reports focused on these rates when they were submitted. This analysis examines rate information for silver plans in the largest city in 10 states and the District of Columbia, where complete rate information is available. Silver plans are the most popular with marketplace enrollees, selected by 68 percent of enrollees. The benchmark silver plan is the second lowest-cost silver plan available in each market, and its rates are used to determine the size of premium tax credits available to low- and moderate-income enrollees, regardless of which plan they choose.
An updated analysis of 2016 premiums in Affordable Care Act marketplaces is availablehere.
An updated analysis of insurer participation in 2016 Affordable Care Act marketplaces is availablehere.
INTRODUCTION
Premium growth in the Affordable Care Act’s Health Insurance Marketplaces has been an area of significant interest, as this is one of the most tangible and measurable indicators of whether the ACA is working to keep health insurance affordable. The ACA’s rate review provision requires premium increases over ten percent to be made public. As a number of individual market insurers are requesting 2016 increases well above 10 percent, concern has been raised over the affordability of premiums in the coming year. However, these increases are not necessarily representative of the range of products from which consumers will be able to choose, and similar data is not widely available for the plans with moderate increases or decreases.
This brief presents an early analysis of changes in the premiums for the lowest- and second-lowest cost silver marketplace plans in major cities in 10 states plus the District of Columbia, where we were able to find complete data on rates for all insurers. It follows a similar approach to our September 2013 and 2014 analyses of Marketplace premiums.
In most of these 11 major cities, we find that the costs for the lowest and second-lowest cost silver plans – where the bulk of enrollees tend to migrate – are changing relatively modestly in 2016, although increases are generally bigger than in 2015. The cost of a benchmark silver plan in these cities is on average 4.4% higher in 2016 than in 2015. These premiums are still preliminary in some cases and could be raised or lowered through these states’ rate review processes, and it is difficult to generalize to all states based on this small sample of states where all rate filings are available. We also find that the number of insurers participating has stayed the same or increased in 9 states, while insurer participation decreased in Michigan and the District of Columbia.
Approach
In preparation for open enrollment for coverage in 2016, insurers filed premiums with state insurance departments. States vary in whether and when they release those filings. Our analysis is based on the 10 states plus the District of Columbia where we were able to find comprehensive filings or other information about the rates of the lowest-cost plans. Other states have released summary information, but not sufficient detail to identify the lowest-cost silver plans. In many cases, premiums are still under review by insurance departments and may change prior to the start of open enrollment.
We examine premiums in the rating area that includes a major city in each state. Premiums vary significantly within states, with the rating area being the smallest geographic unit by which insurers are allowed to vary rates. For each rating area, we look at premiums for the two lowest-cost silver plans. We focus on silver plans because they are the basis for federal premium subsidies and because these are the plans that most marketplace enrollees (68%) have chosen.
Changes in Lowest Two Silver Plans
Across the 11 cities we examined, the premium for the second-lowest-cost silver plan in the Marketplace – before accounting for any tax credit – is increasing by an average of 4.4%. By contrast, in these cities, the average change in the benchmark silver plan was -0.6% from 2014 to 2015. (The nationwide average increase in this plan was 2% from 2014 to 2015).
Silver Premium Percent Change from Previous Year
Benchmark premium changes in 2016 vary significantly across the cities, ranging from a decrease of 10.1% in Seattle, Washington to an increase of 16.2% in Portland, Oregon.
Table 1: Monthly Benchmark Silver Premiums for a 40 Year Old Non-Smoker Making $30,000 / Year
State
Rating Area(Major City)
2nd Lowest Cost Silver Before Tax Credit
2nd Lowest Cost Silver After Tax Credit
2015
2016
% Change from 2015
2015
2016
% Change from 2015
Connecticut
2 (Hartford)
$322
$328
2.0%
$208
$208
0.2%
DC
1 (Washington)
$242
$248
2.8%
$208
$208
0.2%
Maine
1 (Portland)
$282
$290
2.9%
$208
$208
0.2%
Maryland
1 (Baltimore)
$235
$246
4.6%
$208
$208
0.2%
Michigan
1 (Detroit)
$230
$226
-1.8%
$208
$208
0.2%
New Mexico
1 (Albuquerque)
$171
$190
11.0%
$171*
$190*
11.0%*
New York
4 (New York City)
$372
$374
0.5%
$208
$208
0.2%
Oregon
1 (Portland)
$213
$248
16.2%
$208
$208
0.2%
Vermont
1 (Burlington)
$436
$476
9.2%
$208
$208
0.2%
Virginia
7 (Richmond)
$260
$288
10.8%
$208
$208
0.2%
Washington
1 (Seattle)
$254
$228
-10.1%
$208
$208
0.2%
Average % change from 2015
4.4%
1.2%
SOURCE: Kaiser Family Foundation analysis of 2016 insurer rate filings to state regulators.NOTES: Rates are not yet final and subject to review by the state. Oregon rates reflect preliminary changes from the state. *Unsubsidized Albuquerque premiums are so low that a 40 year old making $30,000 per year would not qualify for a premium tax credit in 2016
As shown in the final column of the above table, the amount paid by an enrollee after accounting for the premium tax credit will depend on his or her income and family size. In 2015, a 40-year-old single enrollee making $30,000 per year would have paid $208 per month in most areas of the country, and a similar person would pay approximately the same in 2015. (Although premium caps are increasing for 2016, the poverty guidelines are also changing such that a single person making $30,000 will be at a slightly lower percent of poverty than he or she would be this year. These two changes in effect cancel each other out, leaving monthly payments for the benchmark plan very similar from year-to-year.)
Similar patterns can be seen for the lowest-cost silver plan in each city. On average, the premium for the lowest-cost-silver plan in these cities is increasing by 4.5% from 2015 to 2016, ranging from a decrease of 4.2% in Seattle, Washington to an increase of 19.0% in Richmond, Virginia.
Table 2: Monthly Lowest-Cost Silver Premiums for a 40 Year Old Non-Smoker Making $30,000 / Year
State
Rating Area(Major City)
Lowest Cost Silver Before Tax Credit
Lowest Cost Silver After Tax Credit
2015
2016
% Change from 2015
2015
2016
% Change from 2015
Connecticut
2 (Hartford)
$321
$327
1.9%
$207
$207
0.1%
DC
1 (Washington)
$239
$244
2.1%
$205
$204
-0.6%
Maine
1 (Portland)
$275
$284
3.4%
$201
$202
0.7%
Maryland
1 (Baltimore)
$226
$232
2.6%
$199
$194
-2.2%
Michigan
1 (Detroit)
$219
$210
-4.2%
$197
$192
-2.3%
New Mexico
1 (Albuquerque)
$167
$186
11.5%
$167*
$186*
11.5%*
New York
4 (New York City)
$372
$369
-0.7%
$207
$203
-1.9%
Oregon
1 (Portland)
$212
$228
7.7%
$207
$189
-8.6%
Vermont
1 (Burlington)
$428
$471
10.0%
$200
$203
1.6%
Virginia
7 (Richmond)
$241
$287
19.0%
$189
$208
9.8%
Washington
1 (Seattle)
$235
$225
-4.2%
$189
$205
8.6%
Average % change from 2015
4.5%
1.5%
SOURCE: Kaiser Family Foundation analysis of 2016 insurer rate filings to state regulators.NOTES: Rates are not yet final and subject to review by the state. Oregon rates reflect preliminary changes from the state. *Unsubsidized Albuquerque premiums are so low that a 40 year old making $30,000 per year would not qualify for a premium tax credit in 2016
Active Renewal and Premium Changes
As was the case last year, the plans that had the lowest premiums in 2015 were usually no longer one of the two lowest-cost silver plans in 2016. Among the 10 major cities where we could identify the product offered as the lowest and second-lowest silver plan, in only one city (Portland, Maine) would a person who signed up for either of the two lowest-cost silver plans in 2015 be able to stay in the same plan and still be enrolled in one of the two lowest silver plans in 2016.
Table 3: Changes in Lowest-Cost Silver Products
State
Rating Area(Major City)
Is the 2015 Lowest-Cost Silver Still One of Two Lowest Silvers in 2016?
Is the 2015 Second-Lowest-Cost Silver Still One of Two Lowest Silvers in 2016?
Connecticut
2 (Hartford)
Yes
No
DC
1 (Washington)
N/A*
N/A*
Maine
1 (Portland)
Yes
Yes
Maryland
1 (Baltimore)
Yes
No
Michigan
1 (Detroit)
Yes
No
New Mexico
1 (Albuquerque)
No
No
New York
4 (New York City)
No
No
Oregon
1 (Portland)
No
No
Vermont
1 (Burlington)
Yes
No
Virginia
7 (Richmond)
No
No
Washington
1 (Seattle)
Yes
No
SOURCE: Kaiser Family Foundation analysis of 2016 insurer rate filings to state regulatorsNOTES: Rates are not yet final and subject to review by the state.*The District of Columbia did not public sufficient detail to determine whether plans are the same as those offered in 2015, but the insurers are the same.
This underscores the importance of enrollees actively shopping each open enrollment period. For example, in Seattle, Washington, Bridgespan offered the second-lowest-cost silver plan in 2015 at a premium of $254 per month for a single 40 year-old before taking a tax credit into account. Bridgespan is increasing this plan’s rate to $286 per month for 2016, but another insurer (Ambetter) is undercutting it and offering two lower-cost silver options for $225 and $228 per month. An unsubsidized person enrolled in the 2015 second-lowest silver plan offered by Bridgespan would see a 12.6% increase if she stayed in the same plan. Conversely, if she switched to the new second-lowest silver plan offered by Ambetter, her premium would drop -10.1% (before accounting for the relatively small effect aging up a year would have on her premiums).
The effect of changes in the benchmark premium relative to other plans is magnified for subsidized enrollees because the tax credit is tied to the premium for the second-lowest cost silver plan in a given year. If the same 40 year-old in the example above makes $30,000, she would be paying $208 per month in 2015 for the benchmark plan (offered by Bridgespan) and the federal government covers the rest through a tax credit. In 2016, if she switches to the new benchmark (offered by Ambetter), she would continue to pay $208 per month (assuming she continues to have the same income and family size in 2016). However, if she stayed in the Bridgespan plan, she would have to pay that amount plus the premium difference between the Bridgespan and Ambetter plans, or a total of approximately $266 (an increase of about 28%, before accounting for a relatively small increase resulting from aging one year). To keep her lower premium, she has to be willing to switch plans. Similar situations arise in the 9 cities where a low-cost insurer is raising its premiums faster than other carriers, or where a different insurer is offering lower premium.
In addition to switching plans, the person in the example above would also have to switch insurance companies in order to avoid a significant premium increase. Similar situations could arise for people enrolled in at least one of the two lowest-cost silver plans in 2015 in seven out of eleven major cities.
Table 4: Changes in Insurers Offering the Lowest-Cost Silver Products
State
Rating Area (Major City)
Would person enrolled in 2015 Lowest-Cost Silver Have to Switch Insurers to Stay in One of Two Lowest Plans?
Would person enrolled in 2015 Second-Lowest-Cost Silver Have to Switch Insurers to Stay in One of Two Lowest Plans?
Connecticut
2 (Hartford)
No
No
DC
1 (Washington)
No
No
Maine
1 (Portland)
No
No
Maryland
1 (Baltimore)
No
Yes
Michigan
1 (Detroit)
No
Yes
New Mexico
1 (Albuquerque)
Yes
No
New York
4 (New York City)
Yes
Yes
Oregon
1 (Portland)
No
Yes
Vermont
1 (Burlington)
No
No
Virginia
7 (Richmond)
Yes
Yes
Washington
1 (Seattle)
No
Yes
SOURCE: Kaiser Family Foundation analysis of 2016 insurer rate filings to state regulatorsNOTES: Rates are not yet final and subject to review by the state.
Although switching insurance carries could help stimulate competition in the exchange – which, to some extent, is how the premium tax credit is designed to work – changing insurance carriers can cause challenges for some enrollees, in particular potentially needing to change doctors (although staying with the same carrier from year-to-year does not necessarily guarantee a consistent network of doctors either).
Insurer Participation
On average, 7 insurers (grouped by parent company) will offer coverage in these states in 2016, which is a similar number that participated in 2015 and an increase from 6 in 2014. Insurer participation has increased or remained stable in all of the states but Michigan, where the number dropped from 13 to 12 and the District of Columbia, where the number dropped from 3 to 2. The number of insurers participating in these states’ Marketplaces ranges from 2 in Vermont and DC to 16 in New York.
Table 5: Number of Insurers, Grouped by Parent Company, Participating in Marketplaces, 2014 – 2016
State
2014
2015
2016
Connecticut
3
4
4
DC
3
3
2 (Aetna exited)
Maine
2
3
4 (Aetna entered)
Maryland
4
5
5
Michigan
9
13
12 (Assurant exited)
New Mexico
4
5
5
New York
16
16
16
Oregon
11
10
11 (Zoom Health entered)
Vermont
2
2
2
Virginia
5
6
6
Washington
7
9
11 (UnitedHealth and Health Alliance entered)
AVERAGE
6.0
6.9
7.1
SOURCE: Kaiser Family Foundation analysis of 2016 insurer rate filings to state regulatorsNOTES: Filings are not yet final and subject to review by the state.
Discussion
Premium changes for 2016 will vary substantially across areas and across insurers within a given region. At this time, with complete premium information only available in 10 states plus DC, and still awaiting final reviews by state regulators, it is too soon to draw conclusions about the premiums nationally. As a result of the ACA’s rate review provision, data has become public on rate increases over 10 percent, with some insurers requesting average increases well into the double digits. However, the patterns in these 10 states and DC, where more complete information is available, suggest that the premiums for the two lowest-cost silver plans – where the bulk of enrollees tend to migrate – are not necessarily increasing, and where they are increasing, the growth has generally been moderate.
As discussed in detail in our previous analysis, there are a variety of factors that may influence variations in premium changes, including the accuracy with which insurers had predicted their rates in 2014 and 2015, the composition of the risk pool, the steadiness of enrollment growth, and competitive dynamics. The proposed rates for 2016 represent the first year where insurers are able to set premiums based on actual claims experience for Marketplace enrollees. Even so, insurers only have annual data from 2014, which was incomplete (as most enrollees did not effectuate coverage until mid-year, whereas deductibles are annual) and not necessarily representative (as there was likely pent-up demand for health services among people who were previously uninsured).
Some of this remaining uncertainty is mitigated by the ACA’s “3 R’s” programs. These programs – risk adjustment, reinsurance, and risk corridors – redistribute risk among insurance carriers so that plans that enroll disproportionately sicker or higher-cost enrollees can be prevented from having to significantly raise premiums. However, two of these three programs (reinsurance and risk corridors) were only intended to be transitional, and reinsurance funding is phasing out from a maximum of $10 billion in 2014 to $4 billion in 2016. Another potential driver of 2016 premium increases is that the underlying cost of health care is expected to increase next year, particularly for prescription drugs.
Factors that could have a downward effect on premiums in 2016 include competitive forces (for which average growth in the number of insurers is a positive sign); increases in enrollment among the uninsured (which would bring healthier enrollees into the risk pool); and the movement of healthier enrollees from “grandmothered” plans into ACA-compliant plans either on- or off- of the exchange.
Finalized information on 2016 Marketplace premiums will become available for these and other states over the next few months, with complete information for all 50 states typically becoming public shortly before open enrollment, which begins November 1, 2015.
Methods
Data were collected from health insurer rate filing submitted to state regulators. These submissions are publicly available for the states we analyzed. Most rate information is available in the form of a SERFF filing (System for Electronic Rate and Form Filing) that includes a base rate and other factors that build up to an individual rate. In states where filings were unavailable, we gathered data from tables released by state insurance departments. Filings are still preliminary. All premiums in this analysis are at the rating area level, and some plans may not be available in all cities or counties within the rating area. Rating areas are typically groups of neighboring counties, so a major city in the area was chosen for identification purposes.
The House Committee on Appropriations released the FY 2016 Departments of Labor, Health & Human Services, Education and Related Agencies appropriations bill and associated committee report, which provides global health funding through the Centers for Disease Control and Prevention (CDC) and for research activities at the National Institutes of Health (NIH). The bill specifies $426.9 million for global health activities at CDC, which includes $128.4 million for HIV. The bill also provides $68.6 million for research activities at the Fogarty International Center (FIC) at NIH. Additional information on global health research programs at NIH is not yet available.
Note: The majority of U.S. global health funding is provided through the State & Foreign Operations (SFOPs) appropriations bills; learn more about the House SFOPs appropriations bill here.
A new issue brief from the Kaiser Family Foundation draws upon 40 in-person interviews conducted with a variety of stakeholders to assess the recent experiences of five states during the second year of coverage expansions under the Affordable Care Act (ACA). The interviews took place in three states — Colorado, Kentucky and Washington — that have State-based Marketplaces, and have adopted the Medicaid expansion, and in two states — Utah and Virginia — that rely on the Federally-facilitated Marketplace, and have not expanded Medicaid.
In addition to providing insight into how enrollment in coverage under the ACA is going, and the extent to which the problems that plagued the initial open enrollment period have been resolved, the brief offers detailed, on-the-ground views of how Marketplaces are evolving and impacting consumer choices, the financial stability of State-based Marketplaces, the extent to which newly insured individuals are accessing care; and what the costs of care have been for Medicaid expansion adults.
Key findings include:
Most major enrollment systems issues have been resolved. States that expanded Medicaid continued to experience enrollment growth, and marketplace enrollment goals were met or surpassed in four of the five states, although affordability remains a challenge.
In all five states, efforts are underway to increase health insurance and health care literacy among newly insured individuals.
The three states that expanded Medicaid report that per enrollee costs of care for Medicaid expansion enrollees have been lower than anticipated and expansion enrollees generally have been able to get care, although there are access challenges for certain specialties and behavioral health services.
Access to care for individuals enrolled in QHPs varies based on their choice of plan, with some individuals who selected lower cost plans with limited networks experiencing challenges getting care.
Looking ahead, the states are focused on a range of priorities, including continued improvements to enrollment systems and efforts to enhance access to care and care coordination. Moreover, in Colorado and Washington, there is significant pressure on the Marketplaces to achieve financial sustainability; in Utah and Virginia, debate around the Medicaid expansion and the outcome of the King v. Burwell Supreme Court case remain the most significant issues; and, in Kentucky, the upcoming gubernatorial election could have significant implications for implementation given the opposition to the ACA among potential candidates.