Analysis of Insurer Participation in 2016 Marketplaces
As Marketplace enrollees begin to shop for coverage starting in 2016, the number of insurance choices available to them is changing in some parts of the country. In early 2015, an average of 6.1 insurer groups offered coverage in each state, up from an average of 5.0 in 2014. Since then, some insurers have announced their exit or been required to withdraw from the Marketplaces, most notably a number of nonprofit Consumer Operated and Oriented Plans (CO-OPs) and some larger insurers like Blue Cross Blue Shield of New Mexico. Despite these withdrawals, the Department of Health and Human Services (HHS) recently announced that the average number of issuers per state is increasing slightly in 2016 and that about 9 out of 10 returning Healthcare.gov customers will have 3 or more insurers from which to choose in 2016.
This data note highlights areas where insurer participation is changing in 2016, and where this may have an appreciable effect on market competition. We also examine insurer participation in rural areas, in particular, which have historically had low rates of insurer competition. This analysis is based on public data in states that use Healthcare.gov (including some state-based exchanges that use the platform). In some cases, two or more issuers in a given area may be owned or operated by a single parent company. As the degree to which these subsidiaries compete against each other is unclear, we group issuers by parent company (using data from Mark Farrah Associates and HHS Medical Loss Ratio public use files), and refer to these groupings of affiliated issuers as single “insurers” throughout the analysis.
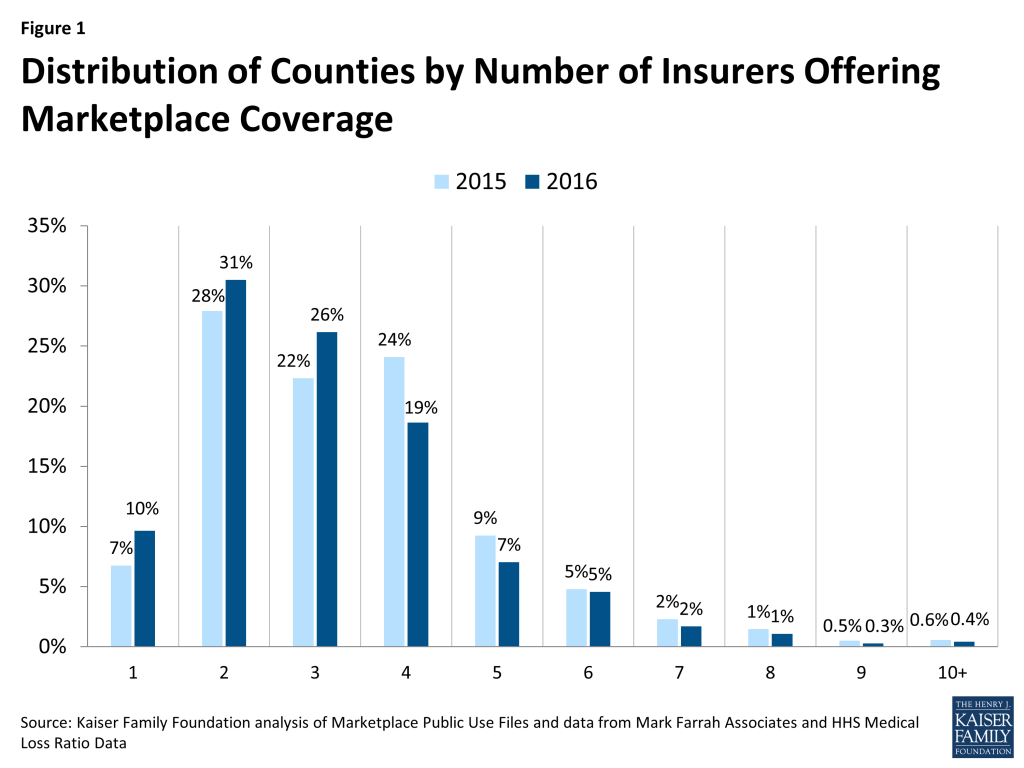
We found that 40% of counties in states using Healthcare.gov will have just one or two insurers, up from 35% of counties in 2015. With fewer than 3 insurers, these counties may not benefit from insurer market competition to hold down premiums or offer plans with better value. We also found that the number of counties with 5 or more insurers decreased in 2016.
Changes in County-Level Insurer Participation
Overall, 17% of counties in states using Healthcare.gov will see a net increase in the number of insurers offering coverage, while 36% will see a net decrease. The bulk of counties, though, will not have any net change in the number of insurers participating, but in some cases a new company may have entered while another exited.
| Table 1: Changes in the Number of Insurers Offering Coverage in States using Healthcare.gov, by county, 2015 – 2016 | |||||
| Change in insurer participation: | -2 or more insurers | -1 insurer | No net change | + 1 insurer | + 2 insurers |
| Number of Counties | 132 | 804 | 1232 | 412 | 23 |
| Percent of Counties | 5% | 31% | 47% | 16% | 1% |
| SOURCE: Kaiser Family Foundation. | |||||
In states using Healthcare.gov, county-level changes in insurer participation range from an increase of 2 insurers (in about two dozen counties, primarily in Virginia, Indiana, and Ohio) to a drop of 7 insurers in Pinal County, Arizona. Arizona counties are particularly hard hit by the withdrawal of three insurers from the state’s marketplace (Assurant, the University of AZ Health Plans, and most recently the co-op plan Meritus), as well as by continuing insurers changing the areas within the state that they service. Ten of the 15 counties in Arizona will have a net loss of five or more insurers.
Counties with Low or High Levels of Insurer Participation
Although most states have several insurers offering coverage in their Marketplaces, and the average number of insurers participating in each state is expected to increase slightly in 2016, there is substantial variation within states. For example, although there are 14 insurers (parent companies) offering coverage in Texas’ Marketplace in 2016 (a similar number as last year), 78% of Texas counties will have just one or two insurers from which enrollees can choose (up from 62% of Texas counties in 2015).
In 2016, there are a total of 2,603 counties in states using Healthcare.gov, and in the majority (60%) of these counties, residents will have a choice of plans offered by 3 or more insurers. In fact, most of the counties have consistently had 3 or more insurers in 2015 and 2016.
Even so, in a substantial number of counties (1,045, or 40%) residents will have one or two insurers offering coverage, up from 35% in 2015. Because these counties are largely rural (discussed more in the following section), the share of potential of exchange enrollees in these counties is likely lower than 40% (as these counties represent just 32% of the population in the 38 states using Healthcare.gov).
As shown in the table below, 13% of counties in states using Healthcare.gov will go from having 3 or more insurers to just 1 or 2 in 2016. At the same time, 8% of counties will have a net increase in the number of insurers so that they no longer have just 1 or 2 participating. This leaves a net increase of 142 counties (5% of all counties in Healthcare.gov states) with only one or two participating insurers.
| Table 2: Changes in County-Level Insurer Participating in States using Healthcare.gov, 2015 – 2016 | |||
| Direction of Change | Number of Counties | % of Total Counties in States using HC.gov | Average % of county population living in rural area |
| Decreased such that the county now has only 1 or 2 insurers | 350 | 13% | 64% |
| Increased such that the county now has 3 or more insurers | 208 | 8% | 65% |
| County consistently had 1 or 2 insurers in both 2015 and 2016 | 695 | 27% | 66% |
| County consistently had 3 or more insurers in both 2015 and 2016 | 1,350 | 52% | 54% |
| SOURCE: Kaiser Family Foundation. | |||
Many of the counties with significant changes in insurer participation are concentrated in a handful of states. A number of states went from having at least 3 insurers in every county to having just one or two insurers in a large share of counties, including South Dakota (100% of counties will have just one or two insurers), Utah (79%), Florida (66%), South Carolina (63%), Tennessee (60%), and Arizona (53%). Iowa and Missouri, by contrast, will now have three or more insurers in the majority of counties whereas there were just one or 2 insurers in the vast majority of both states’ counties in 2015.
| County Level Insurer Participation in States Using Healthcare.gov, 2015 – 2016 | |||||||
| State | Num. of Counties | Average Number of Insurersper County | Counties with 1 or 2 Insurers | Counties where the Number of Insurers: | |||
| 2015 | 2016 | 2015 | 2016 | Down to 1 or 2 | Up to 3 + | ||
| U.S. (38 ST) | 2,603 | 3.4 | 3.1 | 903 (35%) | 1,045 (40%) | 350 | 208 |
| AK | 29 | 2.0 | 2.0 | 29 (100%) | 29 (100%) | – | – |
| AL | 67 | 2.0 | 2.1 | 64 (96%) | 60 (90%) | – | 4 |
| AR | 75 | 4.0 | 4.0 | 0 (0%) | 0 (0%) | – | – |
| AZ | 15 | 7.8 | 2.9 | 0 (0%) | 8 (53%) | 8 | – |
| DE | 3 | 2.0 | 2.0 | 3 (100%) | 3 (100%) | – | – |
| FL | 67 | 3.8 | 2.6 | 0 (0%) | 44 (66%) | 44 | – |
| GA | 159 | 4.4 | 3.6 | 0 (0%) | 30 (19%) | 30 | – |
| HI | 5 | 2.0 | 2.0 | 5 (100%) | 5 (100%) | – | – |
| IA | 99 | 2.1 | 2.8 | 85 (86%) | 21 (21%) | 8 | 72 |
| IL | 102 | 4.6 | 4.5 | 0 (0%) | 0 (0%) | – | – |
| IN | 92 | 4.9 | 5.1 | 0 (0%) | 0 (0%) | – | – |
| KS | 105 | 2.0 | 2.0 | 105 (100%) | 105 (100%) | – | – |
| LA | 64 | 3.8 | 3.1 | 0 (0%) | 0 (0%) | – | – |
| ME | 16 | 3.0 | 3.0 | 0 (0%) | 0 (0%) | – | – |
| MI | 83 | 4.3 | 3.8 | 14 (17%) | 21 (25%) | 7 | – |
| MO | 115 | 2.4 | 3.1 | 69 (60%) | 2 (2%) | – | 67 |
| MS | 82 | 2.1 | 2.4 | 67 (82%) | 50 (61%) | – | 17 |
| MT | 56 | 4.0 | 3.0 | 0 (0%) | 0 (0%) | – | – |
| NC | 100 | 2.1 | 2.2 | 72 (72%) | 61 (61%) | – | 11 |
| ND | 53 | 2.8 | 2.9 | 9 (17%) | 4 (8%) | – | 5 |
| NE | 93 | 3.7 | 4.0 | 0 (0%) | 0 (0%) | – | – |
| NH | 10 | 4.9 | 4.9 | 0 (0%) | 0 (0%) | – | – |
| NJ | 21 | 4.4 | 3.4 | 0 (0%) | 0 (0%) | – | – |
| NM | 33 | 4.1 | 4.0 | 0 (0%) | 0 (0%) | – | – |
| NV | 17 | 2.9 | 1.6 | 10 (59%) | 14 (82%) | 4 | – |
| OH | 88 | 6.6 | 6.7 | 0 (0%) | 0 (0%) | – | – |
| OK | 77 | 1.9 | 2.0 | 63 (82%) | 77 (100%) | 14 | – |
| OR | 36 | 7.4 | 6.5 | 0 (0%) | 0 (0%) | – | – |
| PA | 67 | 4.7 | 3.5 | 0 (0%) | 13 (19%) | 13 | – |
| SC | 46 | 3.3 | 2.4 | 0 (0%) | 29 (63%) | 29 | – |
| SD | 66 | 3.0 | 2.0 | 0 (0%) | 66 (100%) | 66 | – |
| TN | 95 | 3.6 | 2.5 | 0 (0%) | 57 (60%) | 57 | – |
| TX | 254 | 2.7 | 2.0 | 158 (62%) | 198 (78%) | 47 | 7 |
| UT | 29 | 4.2 | 1.6 | 0 (0%) | 23 (79%) | 23 | – |
| VA | 134 | 2.6 | 3.2 | 54 (40%) | 37 (28%) | – | 17 |
| WI | 72 | 4.4 | 4.8 | 18 (25%) | 10 (14%) | – | 8 |
| WV | 55 | 1.0 | 1.2 | 55 (100%) | 55 (100%) | – | – |
| WY | 23 | 2.0 | 1.0 | 23 (100%) | 23 (100%) | – | – |
| SOURCE: Kaiser Family Foundation analysis of premium data from Healthcare.gov, Mark Farrah Associates, HHS MLR Data, and Insurer Rate Filings. | |||||||
Though plan level enrollment data have not been made available in states using Healthcare.gov (thus making any analysis of the competitiveness of Marketplaces difficult), the participation of 5 or more insurers suggests that residents of some areas may be benefiting from a highly competitive insurer market.
In 2016, 15% of counties in states using Healthcare.gov will have 5 or more insurers participating, down from 19% of counties in 2015. Counties with 5 or more insurers are largely concentrated in a handful of states, such as Oregon, Ohio, and Indiana.
Insurer Participation in Rural Areas
Urban insurance markets tend to be more competitive than markets in rural areas, where there are fewer potential enrollees to attract insurers and also fewer health care providers with whom they can contract.
In counties with just one insurer participating, an average of 64% of the population lives in rural areas, compared to 50% or fewer in areas with 5 or more insurers.
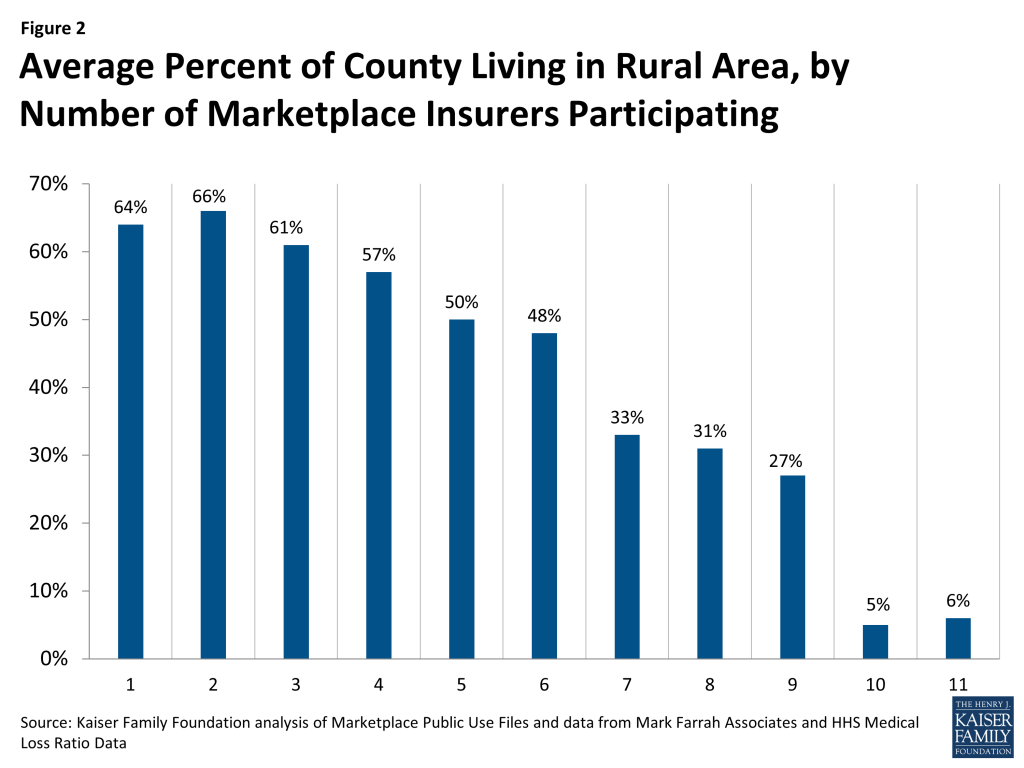
In 2016, counties that are mostly rural will have an average of 2.9 Marketplace insurers participating, down very slightly from an average of 3.1 insurers in 2015. However, a somewhat larger drop in insurer participation occurred in counties where at least half of the population is living in urban areas; these areas will have an average of 3.5 insurers participating in 2016, down from an average of 3.9 in 2015.
Though counties that are primarily rural were somewhat less likely than urban counties to have a net decrease in the number of insurers – and also somewhat more likely to have an increase in participating insurers in 2016 – this may be explained by the fact that rural areas already had lower insurer participation.
Conclusion
Despite some high-profile insurer exits from Marketplaces, residents of most counties in states using Healthcare.gov will continue to have at least 3 insurers from which to choose – a number that is generally recognized as the minimum necessary for market competition to take place. The bulk of counties (47%) in these states will also have no net change in the number of Marketplace insurers offering coverage.
Still, a substantial portion of counties continue to have just one or two insurers participating. By and large, areas with low insurer participation tend to be more rural, though this analysis suggests that rural areas were somewhat more likely than urban areas to gain insurers in 2016.
Methods
This analysis utilizes publicly available data for states using the Healthcare.gov interface (including state-based exchanges that utilize Healthcare.gov: NV, NM, HI, and OR). 2015 data for HI was supplemented by our review of state regulatory documents, and a fifth county in Hawaii was added to the public use file in 2016.
Issuers that have recently announced their exit, specifically 3 CO-OP plans, were removed from the public use files, as were plans with no premium data for silver coverage. A correction was made to New Mexico insurer participation, where based on our review of rate filings and conversations with state regulators, it appears that New Mexico Health Connections was not fully included in the public use file because of incomplete filings.
We grouped insurers by parent company or group affiliation, which we obtained from a combination of Mark Farrah Associates and the HHS Medical Loss Ratio public use files, matched using HIOS and NAIC plan IDs. We then analyzed, at the county level, how many parent companies participate in these Marketplaces. The percent of county population residing in rural areas was obtained from the Missouri Census Data Center. All averages in this analysis are simple averages across counties and are not weighted by population.