Data Note: Medicare Advantage Enrollment, by Firm, 2015

Authors: Gretchen Jacobson, Anthony Damico, and Tricia Neuman
Published: Jul 14, 2015

Updated county-level data showing market share by firm for 2016 is available here.

In recent weeks, a number of potential mergers and acquisitions between large firms that offer health insurance have been reported in the press, including the July 3, 2015 announcement of a merger between Aetna and Humana. These mergers could affect consumers in the individual market, enrollees in the new federal and state Marketplaces, employees with employer-sponsored insurance, as well as people covered by public programs such as Medicare. Nearly 17 million Medicare beneficiaries – almost one-third of the total Medicare population – are enrolled in private Medicare plans, known as Medicare Advantage plans, raising questions about the potential impact of these mergers on Medicare enrollees.

This Data Note examines the Medicare Advantage market share of large firms that have reportedly engaged in merger and acquisition discussions: Aetna, Anthem, Cigna, Humana, and UnitedHealthcare. Table 1 shows the Medicare Advantage market shares of these five firms nationally and by state. Table 2 highlights the counties in which the Aetna-Humana merger could have a relatively large impact on Medicare Advantage enrollees based on the combined market share of these two firms. Table 3 shows the market share of these five firms in the 50 counties with the largest number of Medicare Advantage enrollees. This Data Note uses Medicare Advantage enrollment data released by the Centers for Medicare and Medicaid Services in March 2015.

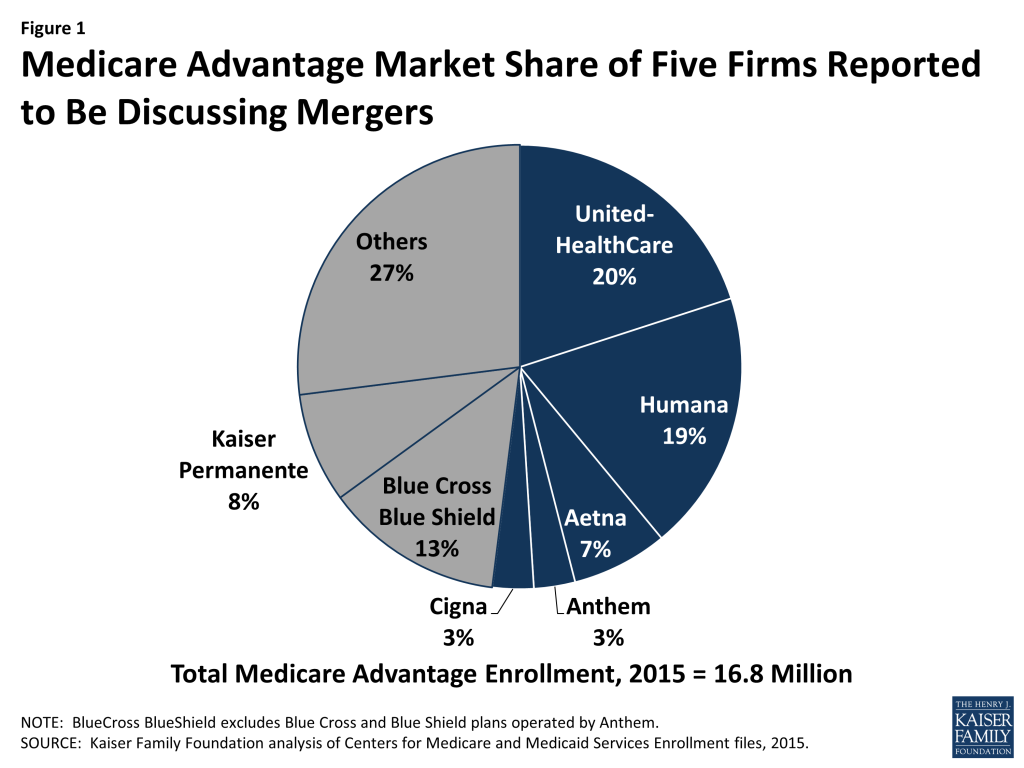
Table 1 shows the market share of the five large firms, nationally and by state, that have reportedly been engaged in merger and acquisition discussions. Together, these five firms comprise more than half (52%) of the Medicare Advantage market (Figure 1).

Figure 1: Medicare Advantage Market Share of Five Firms Reported to Be Discussing Mergers

If the announced deal between Aetna and Humana proceeds, the consolidated firm would provide coverage to more than one-quarter (26%) of all Medicare Advantage enrollees nationwide, making it the leading Medicare Advantage insurer, ahead of UnitedHealthcare, which has 20 percent of all Medicare Advantage enrollees.

Mergers between insurers would play out differently across the country because Medicare Advantage market share by firm varies greatly across states and counties. In some counties and states, locally-owned firms play a larger role in the Medicare Advantage market than national firms, while other states are dominated by the large, national firms.

  • Based on current enrollment numbers, the combined market share of Aetna and Humana would include at least half of all Medicare Advantage enrollees in 10 states and at least two-thirds of all enrollees in five states (KS, LA, MS, VA, and WV), unless they divest some Medicare Advantage plans in response to regulatory (antitrust) issues. By itself, Humana has more than half of the Medicare Advantage market in five states (KY, LA, MS, VA, and WV), including two states (MS and WV) in which it has more than two-thirds of all Medicare Advantage enrollees. Aetna has at least one-quarter of all enrollees in eight states (AK, DE, IA, KS, ME, MO, NE, and NJ).
  • UnitedHealthcare currently has more than half of the market in four states (NE, NH, VT, and WY), including two states (VT and WY) in which it has more than two-thirds of the market. UnitedHealthcare has more than one-quarter of all enrollees in 19 other states and the District of Columbia. Anthem more than one-fifth of the market (23%) in Ohio. Cigna has more than one-third of the market (38%) in Delaware and about one-fifth of the market in three other states (TN, AL, and MD).

In seven states (CT, ME, MA, MT, NM, ND and SD), the firm with the most Medicare Advantage enrollees is a locally operated firm and thus mergers among the large, national firms would likely have a smaller impact in these states.

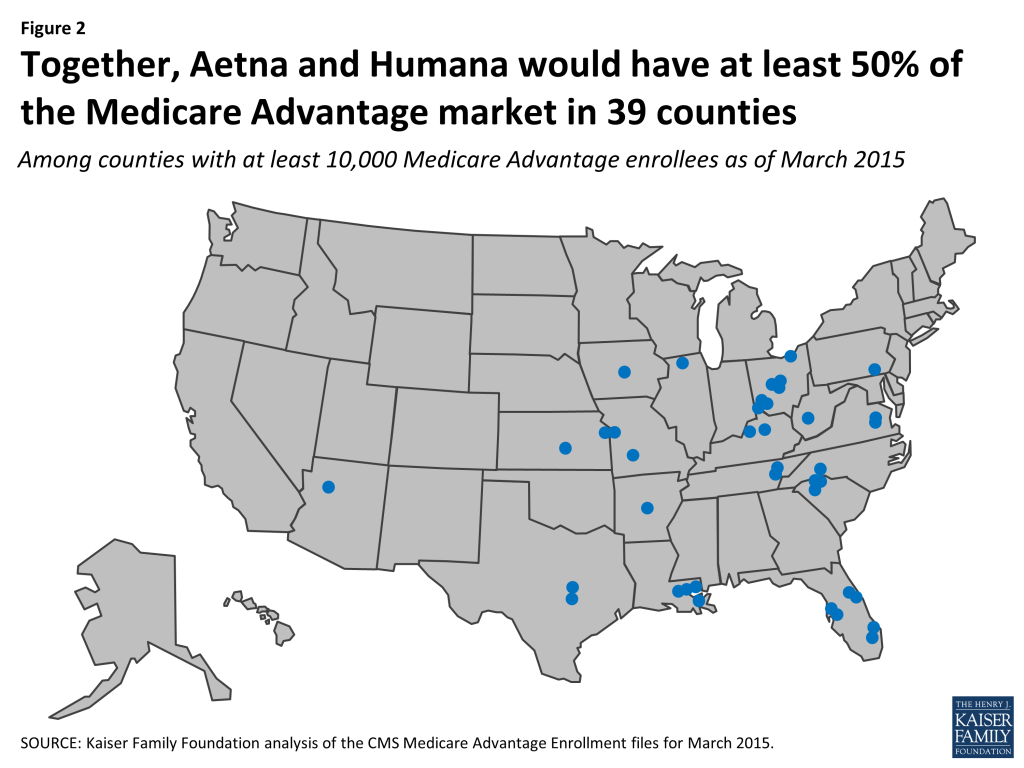
Table 2 and Figure 2 drill down to the county level to show the counties in which Humana and Aetna currently account for at least 50 percent of the Medicare Advantage market.

Figure 2: Together, Aetna and Humana would have at least 50% of the Medicare Advantage market in 39 counties

Among the 335 counties nationwide with at least 10,000 Medicare Advantage enrollees:

  • Humana currently provides coverage to at least half of all Medicare Advantage enrollees in 21 counties, and at least two-thirds of all Medicare Advantage enrollees in six counties;
  • Aetna currently provides coverage to more than half of all Medicare Advantage enrollees in two counties: Polk County, Iowa which includes Des Moines and Sedgwick County, Kansas which includes Wichita; and
  • Together, Aetna and Humana currently cover at least half of all Medicare Advantage enrollees in 39 counties, and at least 75 percent of all Medicare Advantage enrollees in nine counties (Benton, AR; Polk County, IA; Winnebago County, IL; Johnson County, KS; Sedgwick County, KS; Livingston County, LA; Jackson County, MO; Anderson County, SC; and Kanawha County, WV).

Table 3 shows the Medicare Advantage market shares of the five large, national firms in 50 counties with the largest number of Medicare Advantage enrollees. Together, these 50 counties account for about one-third (34%) of all Medicare Advantage enrollees nationwide.

  • Humana has more enrollees than any other firm in 11 counties, while UnitedHealthcare has more enrollees than any other firm in 10 of the 50 counties. Anthem has a larger market share than any other firm in three counties. Cigna has the most Medicare Advantage enrollees in one of the 50 counties – Philadelphia County, PA.
  • Humana has at least half of all Medicare Advantage enrollees in three counties in Florida (Broward County, Palm Beach County, and Volusia County). UnitedHealthcare has at least half of all Medicare Advantage enrollees in six counties, three of which are in Texas (Pima County, AZ; Clark County, NV; Bexar County, TX; Dallas County, TX; Tarrant County, TX; and Milwaukee County, WI). Anthem has more than half of all Medicare Advantage enrollees in Suffolk County, NY.
  • Together, Aetna and Humana have more than half of all Medicare Advantage enrollees in six counties (Broward County, FL; Hillsborough County, FL; Palm Beach County, FL; Pasco County, FL; Volusia County, FL; and Franklin County, OH). In three of these six counties (Broward County, FL; Palm Beach County, FL; and Volusia County, FL), Humana already has at least half of all Medicare Advantage enrollees.

While the large, national firms have a substantial presence in many counties with a relatively large number of Medicare Advantage enrollees, none of these five large, national firms have the largest Medicare Advantage market share in 25 of the 50 counties.

Gretchen Jacobson and Tricia Neuman are with the Kaiser Family Foundation; and Anthony Damico is an independent consultant.

 Table 1: Medicare Advantage Market Share of the Five Firms Reported to be Discussing Mergers, by State, 2015
StateTotal Medicare Advantage EnrollmentPercent of Enrollees in Firm’s Plans
AetnaAnthemCignaHumanaUnited-HealthcareAll Others
Total U.S.16,761,6737%3%3%19%20%48%
Alabama238,0910%0%22%20%16%43%
Alaska5655%0%0%0%45%0%
Arizona425,4541%4%10%14%37%34%
Arkansas114,3266%0%2%38%29%25%
California2,127,6661%4%0%3%16%76%
Colorado281,4671%0%0%14%39%46%
Connecticut157,69220%3%0%0%31%46%
Delaware13,84140%0%38%8%12%2%
District of Columbia11,0337%0%9%0%28%56%
Florida1,570,8456%2%3%37%22%30%
Georgia460,6709%1%4%22%49%15%
Hawaii110,4650%0%0%10%19%71%
Idaho87,8370%0%0%10%13%77%
Illinois371,00711%0%5%26%39%19%
Indiana264,1043%14%1%35%25%21%
Iowa81,54140%0%0%24%24%12%
Kansas61,60042%0%0%48%8%1%
Kentucky212,9482%17%0%60%16%5%
Louisiana232,4451%0%0%65%1%33%
Maine66,30726%2%0%7%13%52%
Maryland76,37510%0%19%2%13%56%
Massachusetts233,0841%0%0%0%18%81%
Michigan595,2391%0%0%10%1%88%
Minnesota480,4740%0%0%7%0%93%
Mississippi76,7761%0%11%66%1%22%
Missouri311,36430%2%0%22%31%15%
Montana34,7580%0%0%20%4%76%
Nebraska34,98230%0%0%16%51%3%
Nevada146,0944%4%0%33%45%14%
New Hampshire17,2953%12%0%17%55%14%
New Jersey222,84625%3%0%0%44%27%
New Mexico113,8071%2%0%13%19%65%
New York1,212,2395%10%0%1%18%67%
North Carolina512,9248%0%1%31%34%26%
North Dakota17,8780%0%0%9%1%90%
Ohio811,50321%23%0%29%8%19%
Oklahoma111,0133%0%0%29%29%40%
Oregon323,7650%0%0%1%12%87%
Pennsylvania1,001,86422%0%6%4%3%65%
Puerto Rico552,8880%0%0%9%0%91%
Rhode Island71,0090%0%0%0%28%72%
South Carolina209,8122%0%4%45%45%4%
South Dakota26,4007%0%0%21%1%71%
Tennessee412,0421%1%22%31%18%27%
Texas1,098,67812%3%10%24%33%18%
Utah113,0348%0%0%7%45%40%
Vermont8,9848%0%0%0%80%12%
Virginia206,4274%3%0%62%18%13%
Washington348,4670%0%0%9%25%65%
West Virginia99,45414%0%0%71%2%13%
Wisconsin388,7320%1%0%19%33%47%
Wyoming2,07111%0%0%4%72%12%

SOURCE: Kaiser Family Foundation analysis of CMS Medicare Advantage enrollment files for March 2015.

Table 2: Market Shares of Aetna and Humana in Counties in Which the Combined Enrollment of Aetna and Humana Includes At Least Half of the Medicare Advantage Market(Among counties with at least 10,000 Medicare Advantage enrollees as of March 2015)
StateCountyTotal Medicare Advantage EnrollmentPercent of Enrollees in Firm’s Plans
AetnaHumanaAetna-HumanaCombined
ArkansasBenton11,44756%20%76%
ArizonaMohave15,33954%1%55%
FloridaBroward151,99755%9%64%
FloridaFlagler12,00450%3%53%
FloridaHillsborough94,33448%6%53%
FloridaPalm Beach106,63662%7%69%
FloridaPasco60,33647%2%50%
FloridaVolusia58,66155%1%56%
IowaPolk12,10322%55%77%
IllinoisWinnebago15,41335%41%76%
KansasJohnson22,47340%45%86%
KansasSedgwick14,42640%57%98%
KentuckyFayette13,03869%2%72%
KentuckyJefferson39,76956%3%58%
LouisianaEast Baton Rouge29,04271%1%73%
LouisianaJefferson44,67759%1%60%
LouisianaLivingston10,02078%0%78%
LouisianaSt. Tammany21,34461%3%63%
MissouriGreene22,27625%36%61%
MissouriJackson40,69345%35%80%
North CarolinaGaston13,51739%12%51%
OhioButler23,96831%23%54%
OhioClark13,17719%45%64%
OhioClermont14,57335%17%53%
OhioDelaware10,43835%31%66%
OhioFranklin70,36935%22%57%
OhioHamilton50,26936%19%55%
OhioLorain18,92730%27%57%
PennsylvaniaLancaster36,4459%47%56%
South CarolinaAnderson12,27177%1%78%
South CarolinaGreenville25,72963%1%64%
South CarolinaSpartanburg20,30756%0%56%
TennesseeBlount11,22668%1%69%
TennesseeKnox32,82171%0%71%
TexasTravis28,42352%12%64%
TexasWilliamson16,73141%13%54%
VirginiaChesterfield10,20158%5%63%
VirginiaHenrico10,22660%4%64%
West VirginiaKanawha13,62064%18%82%
SOURCE: Kaiser Family Foundation analysis of the CMS Medicare Advantage enrollment files for March 2015.
Table 3:  Medicare Advantage Market Share of the Five Firms in the 50 Counties with the Most Medicare Advantage Enrollees, 2015
StateCountyTotal Medicare Advantage EnrollmentPercent of Enrollees in Firm’s Plans
AetnaAnthemCignaHumanaUnited-HealthcareAll Others
ArizonaMaricopa251,3681%2%16%13%30%38%
ArizonaPima87,0141%12%0%8%53%26%
CaliforniaAlameda91,8500%0%0%3%6%90%
CaliforniaContra Costa80,7560%0%0%8%3%89%
CaliforniaLos Angeles579,0721%6%0%1%15%77%
CaliforniaOrange209,3381%7%0%2%21%69%
CaliforniaRiverside166,6133%2%0%7%19%70%
CaliforniaSacramento101,3770%0%0%1%14%84%
CaliforniaSan Bernardino134,3933%4%0%3%19%71%
CaliforniaSan Diego195,1342%2%0%2%32%62%
CaliforniaSanta Clara93,1911%4%0%1%8%86%
FloridaBroward151,9979%0%0%55%13%23%
FloridaHillsborough94,3346%1%0%48%20%25%
FloridaMiami-Dade260,5337%7%17%28%24%17%
FloridaOrange69,5671%1%0%39%14%45%
FloridaPalm Beach106,6367%0%0%62%17%14%
FloridaPasco60,3362%0%0%47%18%32%
FloridaPinellas101,4454%1%0%39%25%32%
FloridaPolk62,2799%6%0%33%25%27%
FloridaVolusia58,6611%0%0%55%14%30%
HawaiiHonolulu78,8190%0%0%9%22%69%
IllinoisCook132,9404%0%11%32%29%24%
MassachusettsMiddlesex54,9700%0%0%0%18%81%
MichiganOakland67,6581%0%0%8%1%90%
MichiganWayne98,7451%0%0%8%0%91%
MinnesotaHennepin95,7060%0%0%5%0%94%
MissouriSt. Louis67,50527%2%0%4%35%32%
NevadaClark112,8755%5%0%38%51%1%
New MexicoBernalillo54,6490%2%0%6%9%82%
New YorkBronx99,7322%8%0%0%11%79%
New YorkErie104,3392%0%0%0%4%94%
New YorkKings136,5524%9%0%0%18%69%
New YorkMonroe89,8417%0%0%0%10%84%
New YorkNassau57,5864%35%0%1%13%47%
New YorkNew York89,6883%8%0%0%23%65%
New YorkQueens139,7854%14%0%0%26%56%
New YorkSuffolk55,3164%55%0%1%14%27%
OhioCuyahoga89,63918%33%0%23%12%14%
OhioFranklin70,36922%10%0%35%9%24%
OregonMultnomah63,4840%0%0%2%14%84%
PennsylvaniaAllegheny154,16817%0%0%1%1%81%
PennsylvaniaPhiladelphia105,43211%0%41%2%1%45%
PennsylvaniaWestmoreland55,38124%0%0%1%0%75%
TexasBexar104,46510%4%3%27%50%7%
TexasDallas86,48512%0%3%15%54%15%
TexasEl Paso54,9776%12%5%21%36%20%
TexasHarris181,05410%8%17%9%14%42%
TexasTarrant92,3448%4%2%9%65%12%
WashingtonKing96,6231%1%0%7%30%62%
WisconsinMilwaukee59,8700%2%0%14%73%11%

SOURCE:  Kaiser Family Foundation analysis of CMS Medicare Advantage enrollment files for March 2015.

News Release

Kaiser/UNAIDS Study Finds Slight Increase In Donor Government Funding for AIDS In 2014

Published: Jul 14, 2015

Increase Mainly Due to U.K.; However, Funding from Half of Fourteen Donor Governments Declined

As world leaders meet to discuss global financing for development, a new report from the Kaiser Family Foundation and the Joint United Nations Programme on HIV/AIDS (UNAIDS) finds that although there was a slight increase in funding to respond to HIV in low- and middle-income countries in 2014, seven of 14 donor governments actually decreased funding, two remained flat and funding from five governments increased.

Overall donor government funding for the AIDS response increased slightly, by less than 2 percent in 2014 to US$8.6 billion. After adjusting for inflation and exchange rates, the 2014 increase was 1%.

Still, 2014 funding levels are the highest to date. Funding began to rise again recently following a dip after the global economic crisis.

Most of the increase in HIV funding in 2014 can be attributed to the United Kingdom, without which overall funding would have dropped. In addition, contributions to the Global Fund to Fight AIDS, Tuberculosis and Malaria, an increasing channel of HIV support for some donors over time, went up overall, while bilateral funding went down.

“International assistance for AIDS has been instrumental in expanding access to HIV treatment and in funding HIV prevention programmes for people most affected by HIV,” said Luiz Loures, Deputy Executive Director of UNAIDS. “The donor community must now build on current funding levels to help close the resource gap to end the AIDS epidemic by 2030.”

“Funding for HIV continued to be a priority for donor governments in 2014, but how funding for HIV will fare in the post-2015 era, with its much more crowded development agenda and competing demands on donors remains to be seen,” said Kaiser Family Foundation Vice President Jen Kates, Director of Global Health and HIV Policy.

The U.S. government remained the largest donor government to HIV in the world but funding remained essentially flat, totaling US$5.6 billion in 2014, as it did in 2013. The next largest funder was the U.K., at US$1.1 billion.

In addition to the U.K. increase, Italy, Japan, the Netherlands, and Norway also increased total assistance for HIV in 2014, while Germany and the U.S. remained essentially flat. Australia, Canada, Denmark, France, Ireland, Sweden, and the European Commission decreased assistance for HIV in 2014.

The U.S. accounted for nearly two-thirds (64.5%) of total funding (bilateral and multilateral) from donor governments, followed by the U.K. (12.9%), France (3.7%), Germany (3.2%), and the Netherlands (2.5%).

The new report, produced as a partnership between the Kaiser Family Foundation and UNAIDS, provides the latest data available on donor funding disbursements based on data provided by governments. It includes their bilateral assistance to low- and middle-income countries and contributions to the Global Fund as well as UNITAID.

The full analysis is available online.

Filling the need for trusted information on national health issues, the Kaiser Family Foundation is a nonprofit organization based in Menlo Park, California.

The Joint United Nations Programme on HIV/AIDS (UNAIDS) leads and inspires the world to achieve its shared vision of zero new HIV infections, zero discrimination and zero AIDS-related deaths. UNAIDS unites the efforts of 11 UN organizations—UNHCR, UNICEF, WFP, UNDP, UNFPA, UNODC, UN Women, ILO, UNESCO, WHO and the World Bank—and works closely with global and national partners towards ending the AIDS epidemic by 2030. Learn more at unaids.org and connect with us on Facebook and Twitter.
Financing the Response to HIV in Low- and Middle-Income Countries: International Assistance from Donor Governments in 2014

Authors: Jennifer Kates, Adam Wexler, and Eric Lief
Published: Jul 13, 2015

Executive Summary

As world leaders meet to discuss the future of financing for development1 , this report from the Joint United Nations Programme on HIV/AIDS (UNAIDS) and the Kaiser Family Foundation finds that funding to address HIV in low- and middle-income countries from nine of fourteen donor governments assessed either declined or remained flat in 2014; funding from five governments increased. Donor government funding for HIV overall grew by less than 2 percent, totaling US$8.64 billion in 2014. After adjusting for inflation and exchange rate changes, the increase was marginal (1%).  Still, this was its highest level to date. Most of the increase in HIV funding in 2014 can be attributed to the United Kingdom, without which overall disbursements would have dropped. In addition, contributions to Global Fund to Fight AIDS, Tuberculosis and Malaria (the Global Fund), an increasing channel of HIV support for some donors over time, went up overall, while bilateral funding went down. Funding from the United States, the largest donor to HIV in the world, was essentially flat.

Key Findings Include:

  • In 2014, donor government disbursements for HIV totaled US$8.64 billion (see Figure 1), a less than 2 percent increase (US$149 million) above 2013 levels (US$8.49 billion). While funding had risen sharply in the prior decade, it then stabilized and declined after the global economic crisis. Funding began to rise again recently, with 2014 levels being the highest to date. After adjusting for inflation and exchange rate changes, the increase between 2013 and 2014 was marginal (1%). Increases in funding over the past 10 year period were significantly less in constant dollars than in current dollar spending.
  • Most of the overall increase in HIV support in 2014 can be attributed to the U.K., which increased both bilateral support and its contribution to the Global Fund. Without the U.K. increase, disbursements would have declined.
  • Contributions to the Global Fund, which undertook significant reforms and finalized a major three year replenishment effort in 2013 to raise resources for the 2014-2016 period, went up overall. Bilateral assistance for HIV declined. While most international assistance for HIV is still provided bilaterally (73% in 2014), the Global Fund has become an increasing channel of support for a subset of donor governments over time. In 2014, six donors provided the majority of their funding for HIV through the Global Fund.
  • In addition to the U.K., four of the 14 governments assessed (Italy, Japan, the Netherlands, and Norway) also increased disbursements for HIV in 2014, compared to 2013, although increases by Japan and the Netherlands follow prior declines and are still below earlier funding levels.
  • Funding from most other governments (nine of 14) either declined (Australia, Canada, Denmark, France, Ireland, Sweden, and the European Commission) or was essentially flat (Germany and the United States), after accounting for exchange rate fluctuations.
  • The U.S. remained the largest donor in 2014 (US$5.6 billion) accounting for approximately two-thirds (64.5%) of donor government disbursements for HIV. The U.K. was the second largest donor (12.9%) followed by France (3.7%), Germany (3.2%), and the Netherlands (2.5%).
  • In 2014, several donor governments provided a greater share of funding to HIV than their share of the world’s GDP: the U.S., the U.K., Sweden, and Denmark. However, when standardized by the size of their economies (GDP per US$1 million), Denmark ranks first followed by the U.K., the U.S., Sweden, and the Netherlands.

  1. The Third International Conference on Financing for Development, Addis Ababa, Ethiopia, July 2015. ↩︎
News Release

Updated Infographic Explains New Federal Regulations on Contraceptive Coverage

Published: Jul 10, 2015

A newly-updated infographic from the Kaiser Family Foundation explains the final regulations on employer-based coverage of birth control released today by the U.S. Department of Health & Human Services.

How Does Where You Work Affect Your Contraceptive Coverage? provides a clear explanation of coverage requirements under the new regulations for employers with religious objections to contraceptive coverage, including houses of worship, religiously-affiliated nonprofits and closely-held for-profit corporations.

A related summary, also updated to reflect the new regulations, clarifies who has a plan that includes contraceptive coverage and who may not.

For more updated resources, visit kff.org.

News Release

New KFF Resources Provide the Latest Information on Public and Private Coverage of Contraceptives

Published: Jul 9, 2015

Public programs and private health insurance now pay for the vast majority of contraceptive services and supplies for women. However, complex and shifting regulations shaped by state and federal policy, legal challenges to the Affordable Care Act’s contraceptive coverage provision, and other factors affect the scope of coverage.

New resources from the Kaiser Family Foundation offer the latest information on options and requirements for contraceptive coverage.

Private Insurance Coverage of Contraception. This policy brief explains state and federal rules for private insurance coverage of contraceptives and identifies key issues going forward, including oversight of the ACA’s contraceptive coverage requirement, religious objections, the impact of state policies, and remaining gaps in coverage.

Private and Public Coverage of Contraceptive Services and Supplies in the United States. This fact sheet examines the role of private insurance and publicly-funded programs, including Medicaid, Medicare, TRICARE, the Indian Health Service, and Title X-funded clinics, in financing contraceptive services for women.

Intrauterine Devices: Access for Women in the U.S. This fact sheet provides the most up-date-information on awareness, use, availability and insurance coverage of IUDs, one of the most effective and increasingly popular forms of reversible contraception.

Additionally, Medicaid and Family Planning: Background and Implications of the ACA, a recently-updated issue brief, describes Medicaid’s role in financing and providing access to family planning services for low-income women, and highlights future challenges in the context of the Affordable Care Act.

Senate Appropriations Subcommittee Approves FY 2016 State and Foreign Operations Appropriations Bill

Published: Jul 8, 2015

The Senate Appropriations Subcommittee on State, Foreign Operations, and Related Programs approved the FY 2016 State and Foreign Operations Appropriations bill, which includes funding for U.S. global health programs at the U.S. Agency for International Development (USAID) and the State Department comprising a significant portion of U.S. funding for global health (total funding for global health is not yet known as some funding provided through USAID, HHS, and DoD is not yet available). Committee Majority and Minority statements indicate that funding in the bill for global health would total $8.47 billion, $287 million above both the President’s request and $14 million above the FY 2015 enacted level.

News Release

What a Break in the Obamacare Battles Could Bring

Published: Jul 8, 2015

Following the Supreme Court’s King v. Burwell decision, the Affordable Care Act could use a break from the intense political heat, though it may not get a long one as the 2016 election season heats up and presidential candidates play to their bases on health care, writes Drew Altman in his latest column for The Wall Street Journal’s Think Tank.

All previous columns by Drew Altman are available.

What do we know about the burden of disease in the United States?

Published: Jul 7, 2015

This slideshow examines disease burden in the United States and comparable countries as measured by Disability Adjusted Life Years, which take into account years of life lost due to premature death and years of productive life lost to poor health or disability. Although the U.S. disease burden rate dropped 14 percent between 1990 and 2010. comparable countries saw an average decrease of 18 percent. In the United States, mental health and musculoskeletal disorders are the leading cause of years lost to disability, while cancer and circulatory diseases are the leading causes of years of life lost.

The slideshow is part of the Peterson-Kaiser Health System Tracker, an online information hub dedicated to monitoring and assessing the performance of the U.S. health system.

News Release

Poll Finds 62% of Americans Approve of the Supreme Court’s Decision to Continue Allowing ACA Health Insurance Subsidies in All States, While 32% Disapprove

Published: Jul 1, 2015

Public’s View of the Health Care Law Remains Nearly Evenly Divided Immediately Following King v. Burwell Ruling

Nearly Eight in 10 Americans Expect More Major Battles about the ACA in the Future

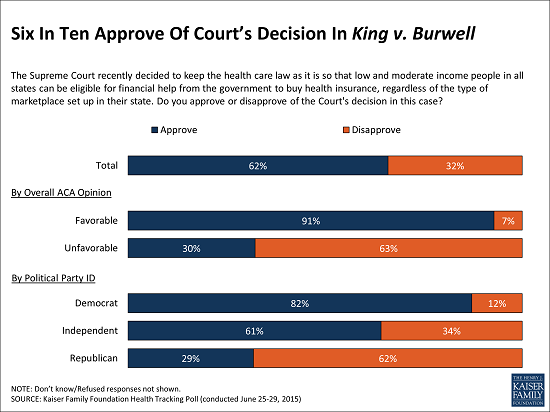
Just over six in 10 Americans (62%) say they approve of the U.S. Supreme Court’s decision last week to continue allowing low- and moderate-income people in all states to be eligible for government subsidies to buy health plans through Affordable Care Act (ACA) insurance marketplaces, finds the Kaiser Family Foundation’s latest tracking poll. About one third (32%) say they disapprove of the ruling.

Although Democrats are more likely to approve of the King v. Burwell decision, and Republicans are more likely to disapprove, about three in 10 Republicans (29%), and a similar share of those who view the law unfavorably (30%), approve of the ruling.

7.01.15_-_Polling_-_KvB_approval-1

The public’s approval of the King v. Burwell decision is higher than it was following the Supreme Court’s 2012 ruling that upheld most major provisions of the health care law. About half (47%) approved and 43 percent disapproved of the ruling in that case, according to the June  2012 Kaiser Health Tracking poll.

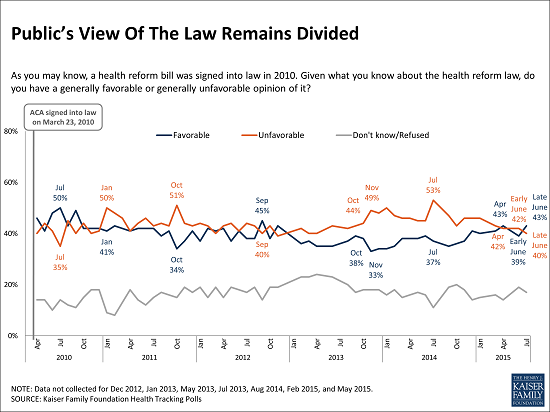
Despite the majority’s favorable opinion of the King v. Burwell decision, though, the new poll finds the public’s view of the ACA remains largely unchanged immediately after the June 25 ruling, with 43 percent viewing it favorably and 40 percent unfavorably.

7.01.15_-_Polling_-_ACA_opinion

Additionally, a large majority don’t think the case will end debate on the health care law.  Nearly four-fifths (78%) say they expect more major battles on the ACA in the future, compared to 18 percent who think King v. Burwell will be the last. Half (51%) think it’s important to continue the debate, while 44 percent say they are tired of hearing about the law and think the country should focus more on other issues.

King v. Burwell attracted little notice from the public, although attention inched up in recent months. Immediately after the ruling, 39 percent say they’ve heard a lot or some about the case, up from 27 percent earlier in June.  However, a majority (61%) report hearing only a little (30%) or nothing at all (31%) about the lawsuit.

The poll was designed and analyzed by public opinion researchers at the Kaiser Family Foundation, and was conducted from June 25-29, 2015 among a nationally representative random digit dial telephone sample of 1,202 adults. Interviews were conducted in English and Spanish by landline (482) and cell phone (720). The margin of sampling error is plus or minus 3 percentage points for the full sample. For results based on other subgroups, the margin of sampling error may be higher.