KFF designs, conducts and analyzes original public opinion and survey research on Americans’ attitudes, knowledge, and experiences with the health care system to help amplify the public’s voice in major national debates.
Drawing on the latest Kaiser Family Foundation comprehensive survey of New Orleans, Drew Altman discusses a growing racial divide in the city about perceptions of economic opportunity for blacks and whites and what progress and challenges in New Orleans may mean for urban America in his latest column for The Wall Street Journal’s Think Tank.
All previous columns by Drew Altman are available online.
In his latest column for The Wall Street Journal’s Think Tank, Drew Altman discusses whether the Centers for Medicare and Medicaid Services’ broad new responsibilities implementing the Affordable Care Act and a more proactive approach to Medicare payment signals that it’s time for (another) name change.
All previous columns by Drew Altman are available online.
Ten years after Hurricane Katrina battered the Gulf Coast and the subsequent levee failure led to unprecedented destruction in New Orleans, the Kaiser Family Foundation teamed up with NPR to conduct a survey of the city’s current residents. This work builds on three previous surveys conducted by the Foundation in 2006, 2008, and 2010, as well as a survey of Katrina evacuees in Houston shelters conducted in partnership with the Washington Post in September 2005.
The new survey examines how those who are currently living in Orleans Parish feel about the progress the city has made and the lingering challenges it faces, including those brought about by Katrina and those that pre-date the storm.
Ten years after Hurricane Katrina battered the Gulf Coast and the subsequent levee failure led to unprecedented destruction in New Orleans, the Kaiser Family Foundation teamed up with NPR to conduct a survey of the city’s current residents. This work builds on three previous surveys conducted by the Foundation in 2006, 2008, and 2010, as well as a survey of Katrina evacuees in Houston shelters conducted in partnership with the Washington Post in September 2005. The new survey examines how those who are currently living in Orleans Parish feel about the progress the city has made and the lingering challenges it faces, including those brought about by Katrina and those that pre-date the storm.
Overall, the survey paints a portrait of a city whose residents are remarkably optimistic, resilient, and proud of their city’s culture. On many fronts, residents’ reports of conditions in their own neighborhoods and their evaluations of the city’s progress in recovery have improved steadily over the 10-year period since the storm. But in this city where racial disparities in income and employment existed long before Katrina, the survey finds that most of these improvements have been unevenly distributed by race. African Americans continue to lag far behind whites, both in their perceptions of how much progress has been made and in the rates at which they report continuing struggles. In some areas – notably the perception of New Orleans as a good place for young people – the racial gap has widened over time. Further, despite the fact that federal statistics show a decline in rates of violent and property crime in New Orleans compared to pre-Katrina levels1 , the survey finds that crime remains residents’ top concern and that several measures of feelings of personal safety have declined since 2010. Among those who were living in New Orleans at the time Katrina hit and are still living there today, most say their overall quality of life is the same as or better than before the storm, though of potential concern for the city’s future, more than a quarter of current residents – and almost half of those under age 30 – say they are considering moving away.
Key Findings: Section 1: New Orleans Residents Are Optimistic And Rate Recovery Efforts Positively
New Orleans Remains Optimistic And Proud Of Its Culture
True to the city’s reputation, the people of New Orleans maintain a remarkably positive attitude. Nearly eight in ten residents (78 percent) say they are optimistic about the future of the greater New Orleans area, a share that has been high since Katrina hit, but has increased somewhat since 2006 (70 percent). Optimism is the prevailing view across all groups of residents, including African Americans (75 percent) and whites (85 percent), and those with lower and higher incomes (75 percent of those with incomes below 200 percent of the federal level and 82 percent of those with higher incomes).
Figure 1
Residents are also unshaken in their pride for their city’s culture. As was the case in 2010, culture – including food, music, and nightlife – tops the list of responses to an open-ended question about the best thing that New Orleans has to offer (53 percent), followed by other factors such as tourism (13 percent) and the people (7 percent).
Figure 2
Most Say Recovery Is Going In Right Direction
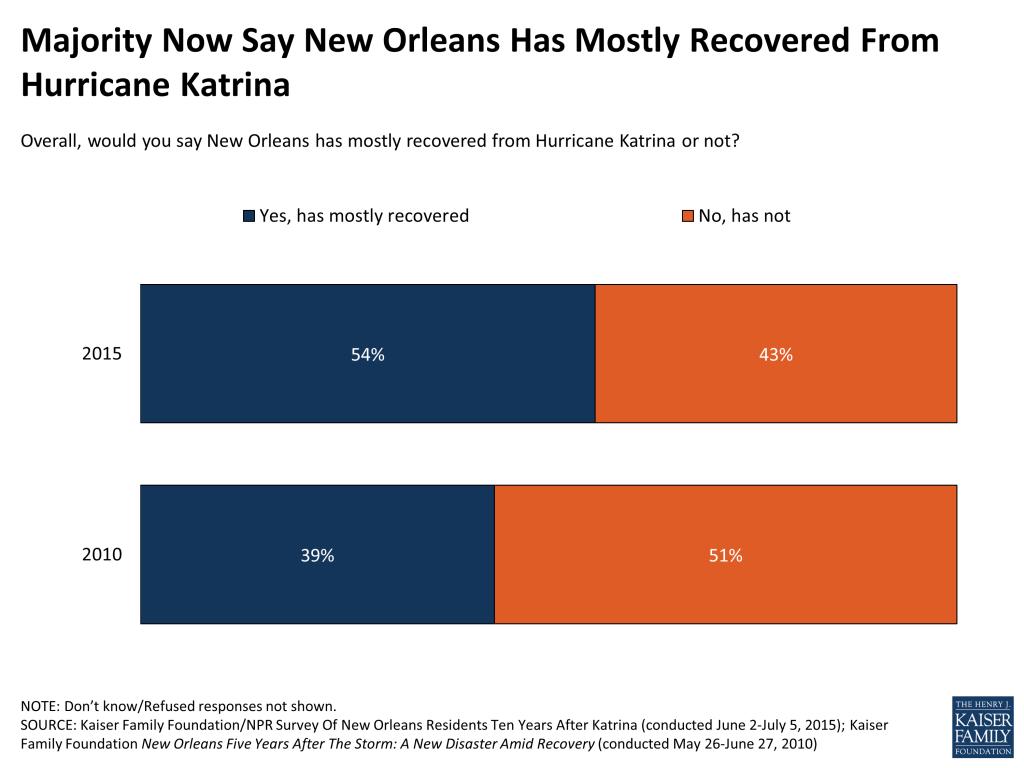
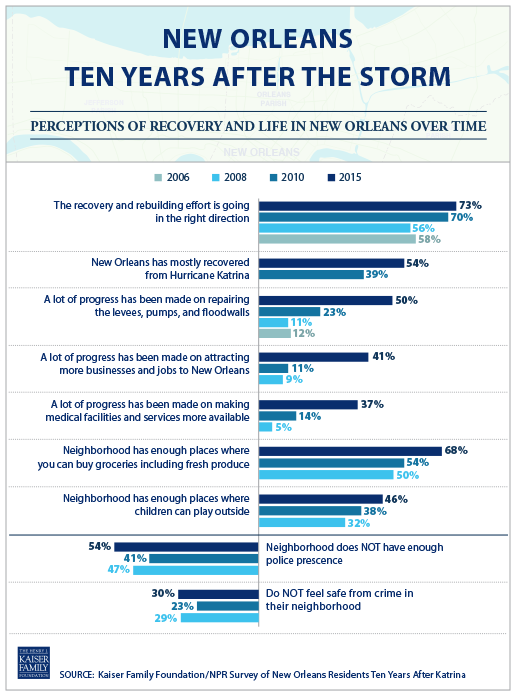
New Orleanians also take a generally positive view of the city’s efforts to recover from Hurricane Katrina. Nearly three-quarters (73 percent) now say the recovery and rebuilding effort is going in the right direction, similar to the share who said the same in 2010, but higher than the shares in 2006 and 2008. In fact, a majority of residents (54 percent) now say the city has mostly recovered from Hurricane Katrina, an increase from about four in ten (39 percent) who said the same five years ago.
TABLE 1: Recovery Effort Increasingly Viewed As Going In The Right Direction
Would you say that in general the recovery and rebuilding effort since Hurricane Katrina in the greater New Orleans area is going in the right direction or going in the wrong direction?
2015
2010
2008
2006
Right direction
73%
70%
56%
58%
Wrong direction
21%
24%
35%
33%
Don’t know/ Refused
6%
7%
9%
9%
Figure 3
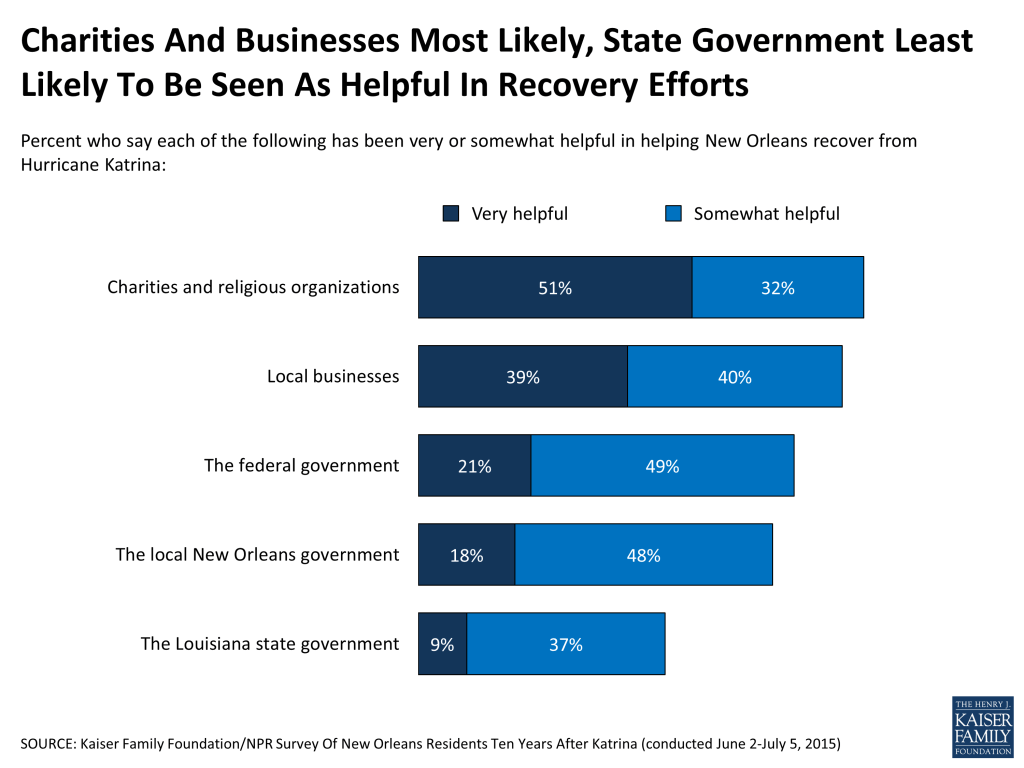
The people of New Orleans are quick to acknowledge the efforts made by many groups and organizations that have bolstered the rebuilding efforts. Large majorities say that charities and religious organizations (83 percent), local businesses (79 percent), and the federal and local governments (70 percent and 66 percent, respectively) have been at least somewhat helpful in city’s recovery. Fewer (46 percent) say the Louisiana state government has been helpful, perhaps reflecting New Orleans’ mainly Democratic allegiance in a state whose government is led by Republicans.
Figure 4
Who Has The Recovery Effort Helped Most?
Although most New Orleanians think the recovery effort is on the right track, many also believe that some have reaped the benefits more than others. Over four in ten say that the efforts to rebuild New Orleans have done “a lot” to help wealthy people (43 percent) and whites (42 percent), while smaller shares say the efforts have done “a lot” to help Hispanics (28 percent), African Americans (21 percent), middle class people (19 percent) and poor people (17 percent).
Figure 5
These results hold true at the personal level, where African Americans and those with lower incomes are more likely to feel left behind by the recovery efforts. About half of African Americans (47 percent) and those with incomes below 200 percent of the federal poverty level (46 percent) say that the recovery efforts have not done much, if anything at all, to help “people like you.” In contrast, about two-thirds of whites (67 percent) and those with higher incomes (66 percent) say the efforts have helped people like them “a lot” or “some.”
Table 2: African Americans And People With Lower Incomes Less Likely To Feel Helped By Recovery
RACE
INCOME
How much do you think the efforts to rebuild New Orleans after Hurricane Katrina have done to help people like you?
TOTAL
African American
White
Less Than 200% FPL
200% FPLOr More
A LOT/SOME (NET)
58%
53%
67%
52%
66%
A lot
20
20
19
20
19
Some
38
33
48
32
47
NOT TOO MUCH/NOTHING AT ALL (NET)
40
47
28
46
31
Not too much
24
29
15
29
19
Nothing at all
16
18
13
17
12
NOTE: Don’t know/ Refused responses not shown.
Key Findings: Section 2: Racial Disparities
Disparities In Economic Circumstances
The sense that New Orleans’ African American residents have been left behind by the recovery efforts may be exacerbated by the fact that these residents were living substantially different economic realities from their white counterparts long before Hurricane Katrina hit, and continue to do so today. A recent report found that the median household income for African Americans in New Orleans was 54 percent lower than for area whites, and 20 percent lower than for African Americans nationwide. Similarly, while employment rates for white men in New Orleans were on par with other fast-growing Southern metro areas, the employment rate for black men – at 57 percent in 2013 – lagged behind similar cities.2
Those differing circumstances are reflected in the survey findings when it comes to reports of specific financial troubles. For example, African Americans are more likely than whites to say that in the past year, they have had problems with credit card debt or other personal debt (32 percent, compared to 16 percent), had hours cut back at work (31 percent, compared to 18 percent), fallen behind in rent or mortgage payments (27 percent, compared to 8 percent), been laid off or lost a job (26 percent, compared to 13 percent), or given up looking for work because of a lack of good jobs (22 percent, compared to 10 percent).
Figure 6
Uneven Progress In Perceptions Of Recovery
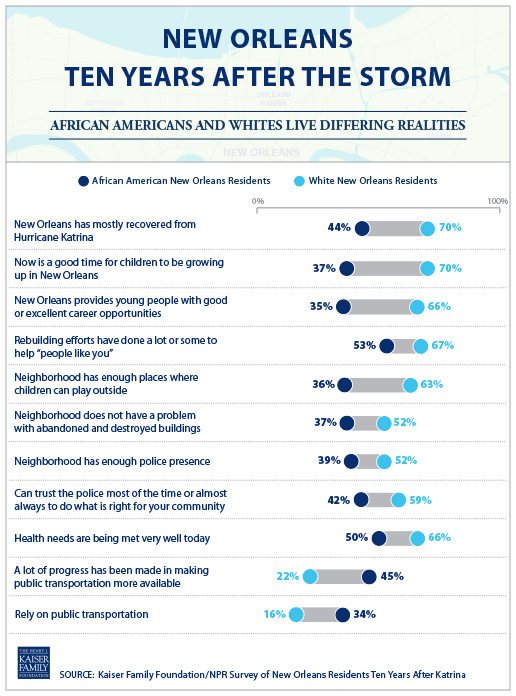
As noted above, the share of New Orleans residents overall who say the city has mostly recovered from Hurricane Katrina has increased substantially since 2010. However, a large racial gap underlies this overall positive trend. While fully seven in ten whites now say the city has mostly recovered, just 44 percent of African Americans say the same, leaving a majority of African Americans (54 percent) saying that the city has not yet fully recovered.
African Americans are also more likely than whites to think that if Hurricane Katrina were to hit the Gulf Coast today, the levees would be breached again (41 percent, compared to 28 percent). This concern may reflect the fact that African Americans are more likely to live in neighborhoods that are at the highest risk for flooding if another big storm hits, including New Orleans East, Gentilly, and Algiers.
Table 3: African Americans Less Likely To Say New Orleans Has Recovered From Katrina, More Likely To Worry About Future Levee Breaches
Total
African Americans
Whites
Overall, would you say New Orleans has mostly recovered from Hurricane Katrina or not?
Yes, has recovered
54%
44%
70%
No, has not recovered
43
54
28
Don’t know/Refused
2
2
1
If Hurricane Katrina were to hit the Gulf Coast today, do you think the New Orleans levees would hold, or do you think they would be breached again?
Levees would hold
53
49
62
Levees would be breached
36
41
28
Don’t know/Refused
11
10
10
Widening Racial Gaps On New Orleans As A Good Place For Young People
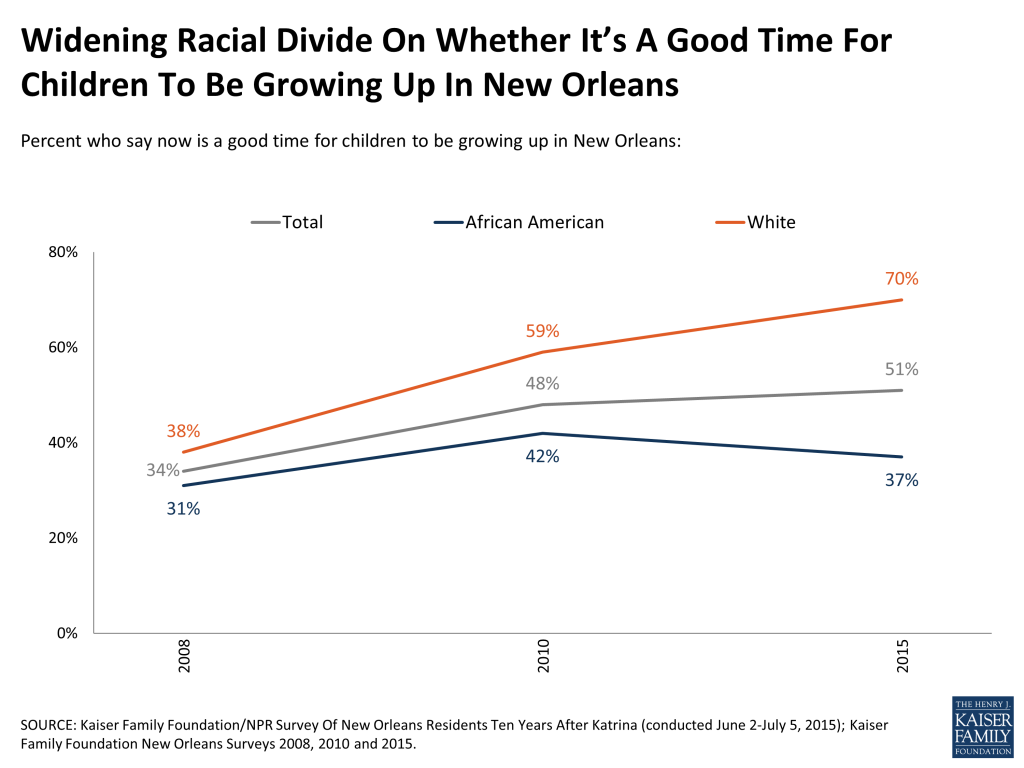
One of the more troubling trends identified by the survey is a widening of the racial gap in perceptions of New Orleans as a good place for young people. Seven in ten whites (70 percent) now say it’s a good time for children to be growing up in New Orleans, a proportion that has risen steadily since 2008. By contrast, fewer than four in ten African Americans agree, while a majority (57 percent) of African Americans say now is a bad time for children to be growing up in the city. This negative view is even higher among African American parents, 68 percent of whom say it’s a bad time for children to be growing up in New Orleans.
Figure 7
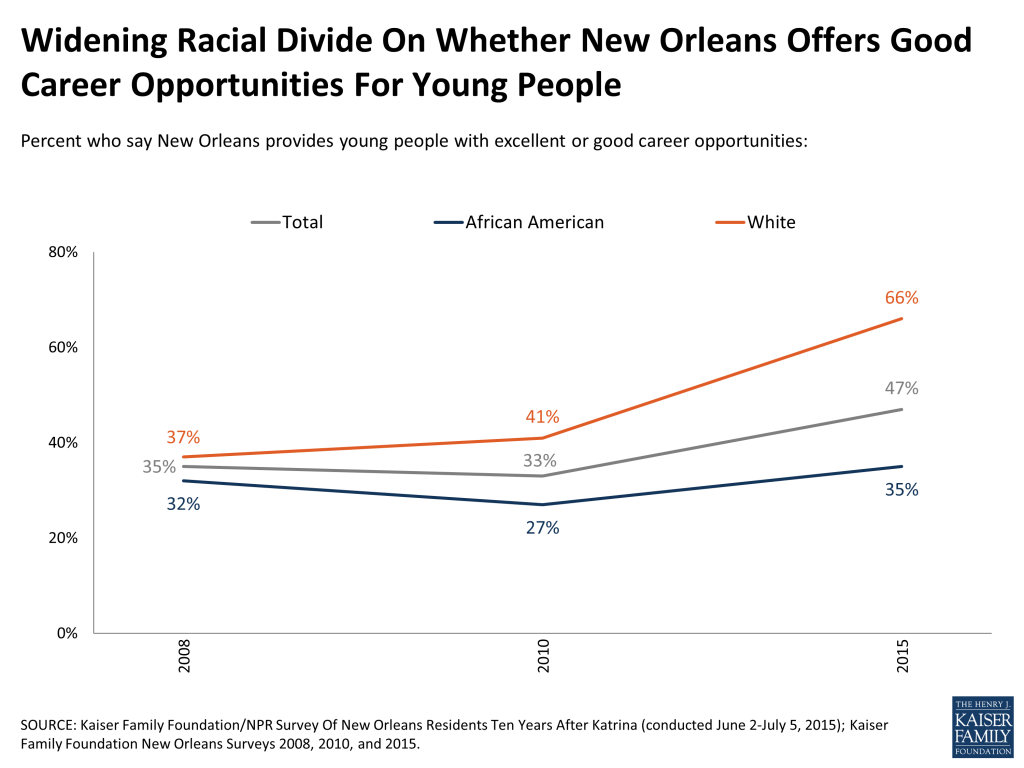
Similarly, while the share of residents overall who say New Orleans provides excellent or good career opportunities for young people has increased over time, this trend is driven mainly by the increasingly positive views of whites. Two-thirds (66 percent) of whites now hold this view, up 29 percentage points since 2008, while just 35 percent of African Americans agree, about the same proportion who felt this way 7 years ago.
Figure 8
Despite these widening racial gaps in attitudes and continuing economic disparities, and despite the fact that other polls have found a recent worsening in perceptions of race relations nationally3 , a majority (56 percent) of residents who’ve lived in New Orleans since before the storm say race relations in the city are about the same as they were pre-Katrina. This view is held by a majority of both African Americans and whites. However, for those who see a change in race relations, whites are more likely to say things are better today than before the storm (27 percent better versus 13 percent worse), while Africans Americans are more divided (19 percent better, 23 percent worse).
Figure 9
Key Findings: Section 3: Progress In Specific Areas
Most See Progress In Many Areas, With Crime The Glaring Exception
Most New Orleans residents believe that at least some progress has been made on eight of nine key issues facing the city. Most notably, residents seems to recognize the nearly $14 billion dollars spent to repair the city’s storm protection infrastructure after Katrina, as over eight in ten (82 percent) say at least “some” progress has been made in repairing the levees, pumps and floodwalls, including 50 percent who say there has been “a lot” of progress. More than seven in ten say progress has been made in attracting more businesses and jobs to New Orleans (75 percent), making medical facilities and services more available (72 percent), and making public transportation more available (71 percent), and at least half perceive progress in strengthening the public school system (59 percent), dealing with destroyed or abandoned buildings (53 percent), and making affordable housing more available (50 percent). By contrast, just about a third (35 percent) say at least some progress has been made in controlling crime and assuring public safety, while two-thirds (64 percent) say there has been little to no progress in this area.
Figure 10
All in all, this progress report highlights increasingly positive public attitudes over the past five years on many of these key issues. When it comes to strengthening flood protection infrastructure, attracting jobs and business, and making medical facilities and public transportation more available, larger shares of residents now believe progress has been made than said the same in 2010. By contrast, when it comes to public schools, affordable housing, and crime, public perceptions of progress appear to be stagnant, with similar shares saying progress has been made today as said so 5 years ago.
Further, a large majority of residents (84 percent) continue to see political corruption as a serious problem, similar to the share who held this view in 2010 (86 percent).
Figure 11
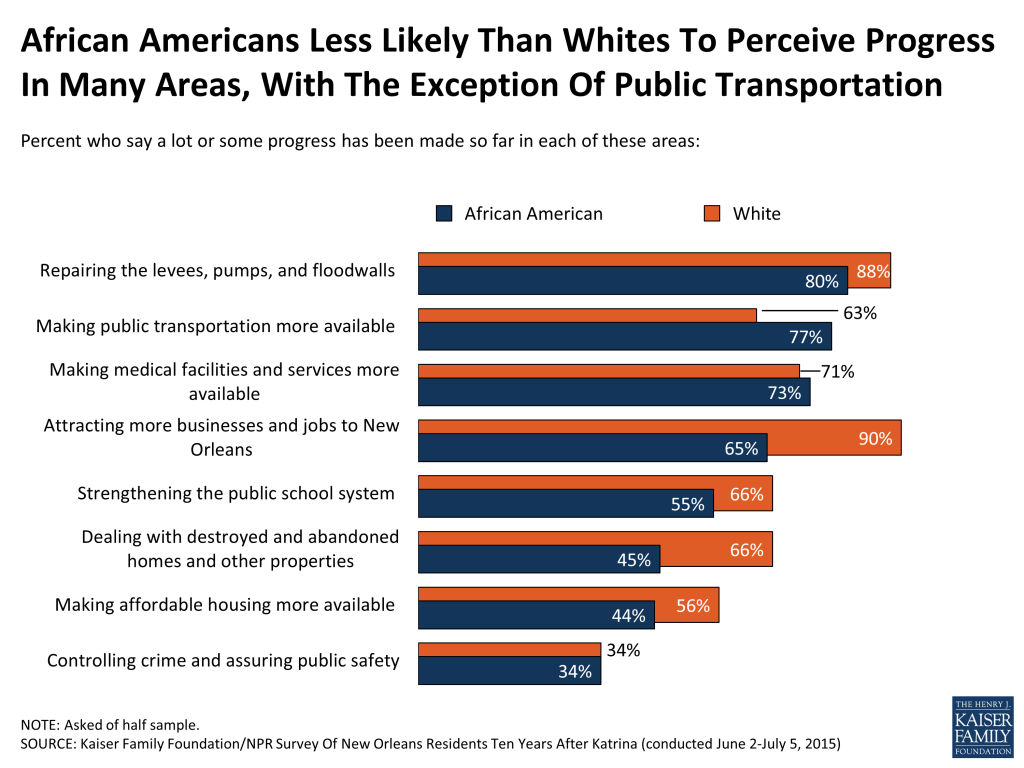
For the most part, whites are more likely than African Americans to say progress has been made in specific areas, most notably attracting jobs (90 percent versus 65 percent), strengthening public schools (66 percent versus 55 percent), making affordable housing available (56 percent versus 44 percent), and dealing with abandoned properties (66 percent versus 45 percent). This last point may be related to the fact that African Americans are more likely than whites to say their own neighborhood has a major problem with abandoned and destroyed buildings (35 percent versus 10 percent).
One of the few exceptions where the survey finds African Americans more likely than whites to express positive views is on public transportation. Over three-quarters (77 percent) of African Americans believe the city has made progress in this area compared to 63 percent of whites. African Americans may be in a better position to judge the city’s progress in this area, as they are about twice as likely as whites to say they rely on public transportation (34 percent versus 16 percent).
Figure 12
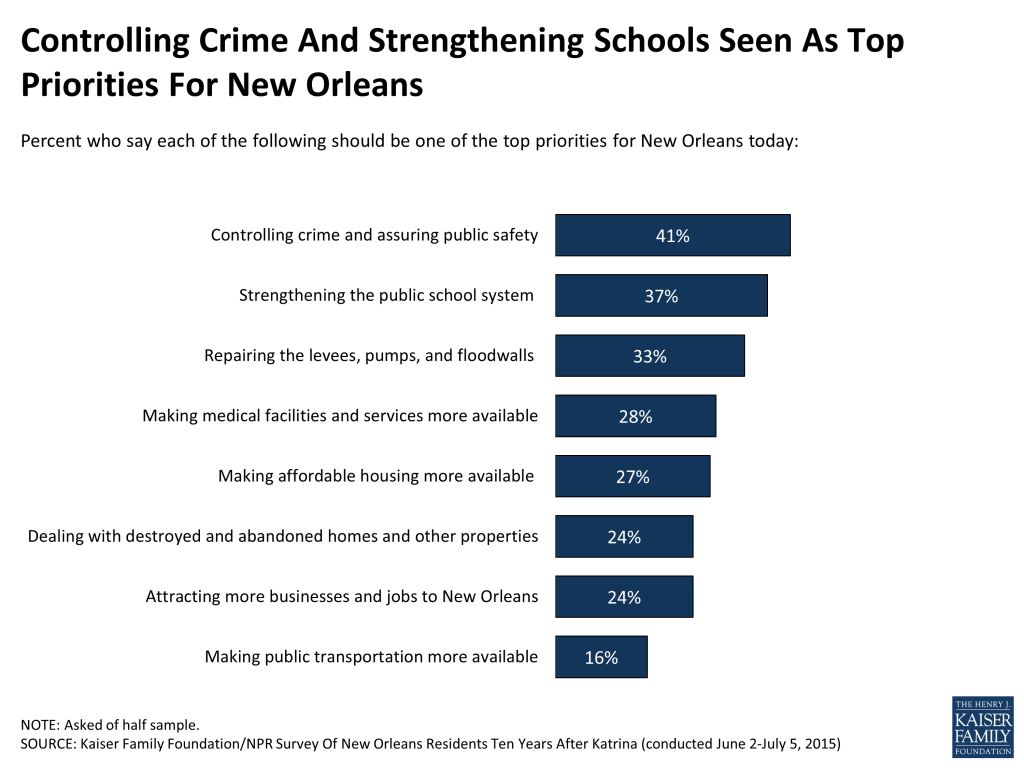
Reflecting the fact that crime is the area where residents are least likely to perceive progress, it is also at the top of the list of residents’ priorities for the city going forward. Four in ten (41 percent) say controlling crime and assuring public safety should be “one of the top priorities” for New Orleans today, followed by strengthening the public school system (37 percent). Though the vast majority believe progress has been made in repairing the levees, pumps, and floodwalls, one-third (33 percent) say this should continue to be a top priority, ranking third on the list. About a quarter each would place a top priority on medical facilities (28 percent), affordable housing (27 percent), dealing with abandoned properties (24 percent) and attracting more jobs to the area (24 percent), while fewer (16 percent) prioritize improvements to public transportation.
Figure 13
Amenities In Their Own Neighborhoods
Consistent with other survey findings, New Orleanians’ reports of amenities in their own neighborhoods have improved significantly over the past several years, though large racial disparities remain. Compared with 2008 and 2010, more residents overall now say their neighborhood has enough places to buy fresh groceries (68 percent, up from 50 percent in 2008), sufficient public transportation (67 percent, up from 43 percent), and enough restaurants (65 percent, up from 56 percent). While fewer than half (46 percent) now say their neighborhood has enough places for children to play outside, this is also a significant increase from prior years.
While reports of neighborhood services have improved since 2008 across racial groups, African Americans remain less likely than whites to say their neighborhood has sufficient places to buy groceries (63 percent, compared to 78 percent of whites), restaurants (55 percent versus 83 percent), and places for children to play outside (36 percent versus 63 percent). Once again, public transportation is the exception to this pattern. About two-thirds of both African Americans (67 percent) and whites (68 percent) say their neighborhood has enough public transportation.
Table 4: Increasingly Positive Ratings Of Neighborhood Services, But Racial Gaps Remain
TOTAL
African American
White
Percent who say their neighborhood has enough…
2015
2010
2008
2015
2010
2008
2015
2010
2008
…places where you can buy groceries including fresh produce
68%
54%
50%
63%
44%
43%
78%
73%
59%
…public transportation*
67
59
43
67
56
36
68
66
56
…restaurants
65
57
56
55
45
39
83
77
81
…places where children can play outside
46
38
32
36
28
22
63
55
45
*2010 and 2008 wording was “bus service”
Crime And Police Presence
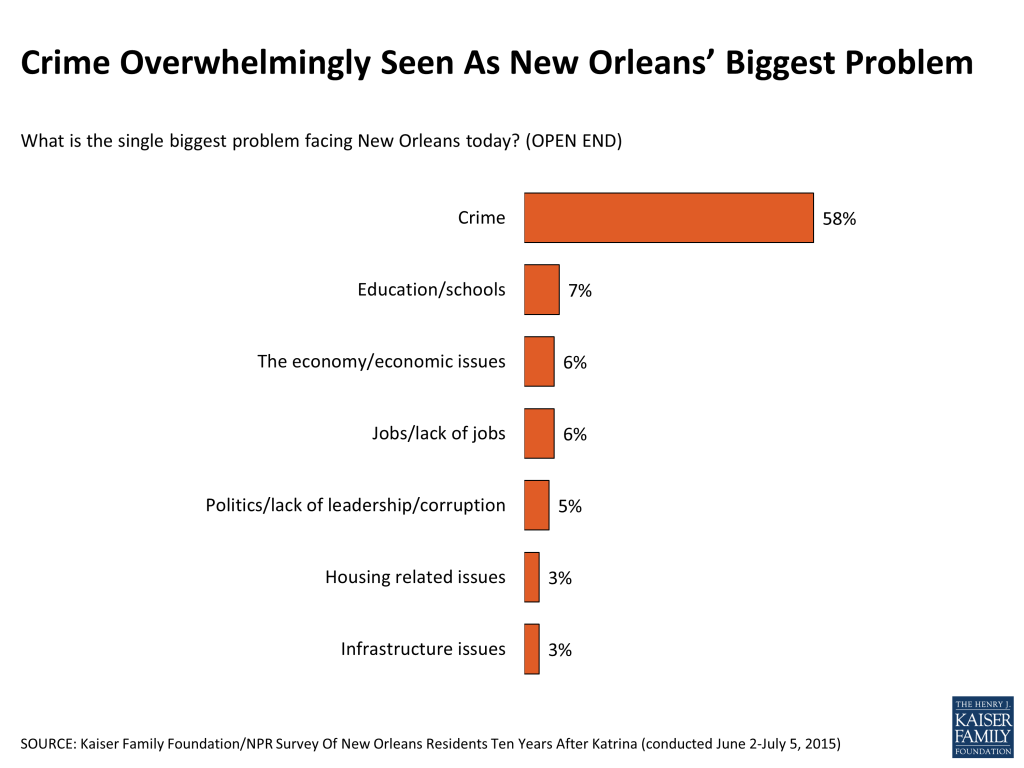
As noted above, New Orleanians rank controlling crime and assuring public safety as the top priority for the city and as the area where the least progress has been made. They also overwhelmingly see crime as the city’s biggest problem; nearly six in ten residents (58 percent) name crime in an open-ended question about the biggest problem facing New Orleans, a response that has topped the list since this question was first asked in 2008. While rates of violent and property crime in New Orleans have declined in recent years, they remain significantly higher than the national average.4 Louisiana continues to have the highest incarceration rate in the country5 , and the city’s criminal justice system has been the subject of much public scrutiny over the past 10 years.6
Figure 14
The survey finds that residents’ personal worries about crime have increased somewhat over the past five years, returning closer to 2008 levels. About three in ten (29 percent) now say they are “very” worried they will be the victim of a violent crime, up from 23 percent in 2010. Furthermore, while most residents say they feel at least somewhat safe from crime in their neighborhood, the share who say they feel “not too safe” or “not safe at all” has increased since 2010 (from 23 percent to 30 percent). In contrast with reported improvements in other neighborhood services, there has been a decline since 2010 in the share who say their neighborhood has enough police presence (44 percent, down from 58 percent).
Table 5: Measures Of Personal Safety Declined Since 2010
2015
2010
2008
How worried are you, if at all, that you will be the victim of a violent crime?
Very worried
29%
23%
31%
Somewhat worried
33
31
35
Not too worried
23
29
22
Not at all worried
15
18
12
These days, how safe from crime do you feel in your neighborhood?
Very safe
18
22
17
Somewhat safe
52
54
54
Not too safe
19
13
19
Not safe at all
11
10
10
Would you say your neighborhood does or does not have enough police presence?
Does have enough
44
58
52
Does NOT have enough
54
41
47
Note: Don’t know/Refused responses not shown.
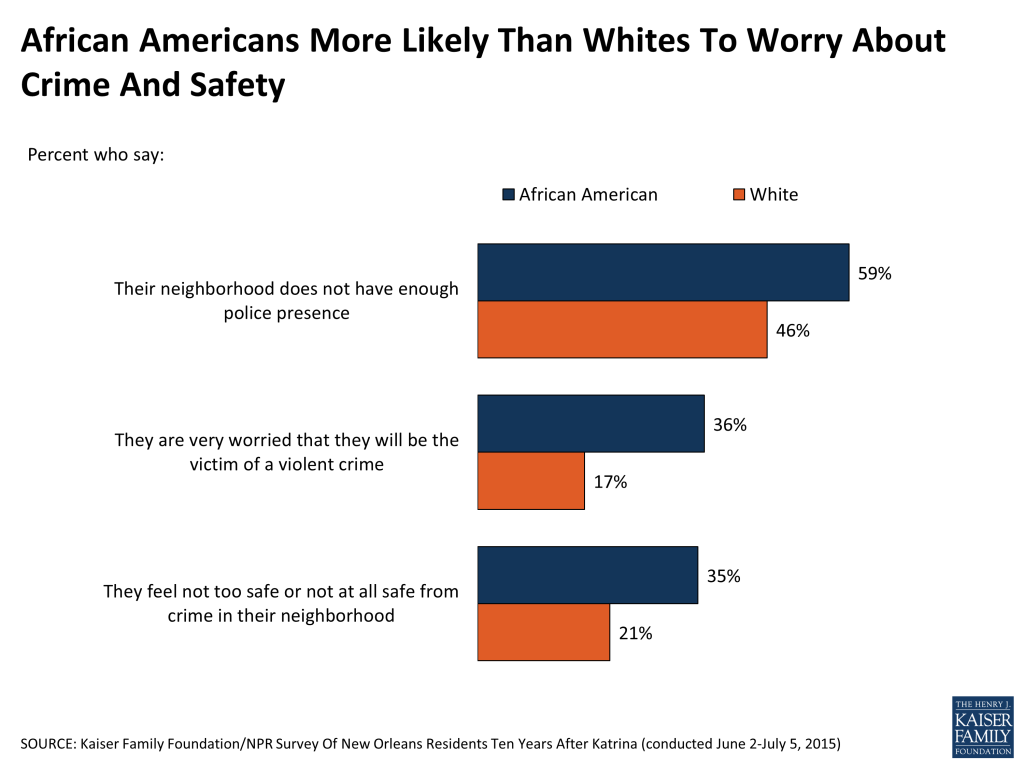
Racial disparities exist on all these measures, with African Americans more likely than whites to say that they are very worried about being a victim of violent crime (36 percent versus 17 percent), that they don’t feel safe from crime in their neighborhood (35 percent versus 21 percent) and that their neighborhood does not have enough police presence (59 percent versus 46 percent).
Figure 15
Despite recent efforts to reform New Orleans’ policing and criminal justice system7 , the police force continues to suffer from a distinct lack of public trust, particularly among African Americans. While most whites (59 percent) say they trust the police to do what is right for their community “almost always” or “most of the time,” a majority (58 percent) of African Americans say they trust the police “only some of the time” or “almost never.” This racial divide in police trust is not specific to New Orleans and may be part of a broader national trend that has been exacerbated by widespread attention to recent events in cities such as Ferguson, Missouri and Charleston, South Carolina. However, in New Orleans the gap in trust between African Americans and whites does not appear to have widened over the past 5 years, and in fact the share of African Americans who say they mostly trust the police has increased slightly, from 34 percent in 2010 to 42 percent today.
Table 6: African Americans Less Likely Than Whites To Trust Police, But Racial Gap Has Not Widened Since 2010
2015
2010
How much of the time do you think you can trust the police to do what is right for you or your community?
Total
African American
White
Total
African American
White
Almost always/Most of the time (NET)
48%
42%
59%
44%
34%
59%
Almost always
14
10
21
13
9
18
Most of the time
34
32
38
31
25
41
Only some of the time/Almost never (NET)
50
58
38
55
64
40
Only some of the time
34
38
28
40
45
31
Almost never
16
20
10
15
19
9
Public Schools
As noted above, Parish residents rank strengthening the public school system as the second-highest priority for the city, after controlling crime and assuring public safety. While nearly six in ten residents (59 percent) believe that at least some progress has been made in this area, 42 percent of parents with children under age 19 say they are “very” worried that their children won’t be able to get a good education (albeit down somewhat from 51 percent in 2010). This worry is concentrated among African American parents, over half (53 percent) of whom say they are very worried, compared to just 17 percent of white parents.
The public school system in New Orleans today looks nothing like it did prior to Hurricane Katrina. In May 2014, the Recovery School District, a state control board that had been overseeing most of the city’s public schools since 2005, shut down the last of its five traditional public schools, making New Orleans the first school district in the nation to be made up entirely of charter schools.8 The survey finds a majority (60 percent) of parents believe the increase in charter schools is a good thing for New Orleans, while a quarter (24 percent) say it hasn’t made much difference and 12 percent say it is a bad thing. Statistics show the student body of public schools, including charters, is 85 percent African American.9 Thus, it is notable that African American parents are somewhat more ambivalent about the increase in charter schools; though a slim majority (53 percent) of this group views the trend as a good thing, 14 percent see it is a bad thing and 30 percent say it hasn’t made much difference.
Figure 16
Health Care
When Charity Hospital closed its doors due to Hurricane Katrina, many of the city’s poor and uninsured were left without a place to go for care. In the intervening 10 years, dozens of new community clinics have opened, providing residents with more opportunities to access health care outside the hospital setting. In August 2015, a new hospital – University Medical Center New Orleans – opened, aiming to replace Charity as the city’s main trauma and safety-net hospital while also providing high-end specialty care to privately insured patients.10
Many survey trends reflect an improvement in residents’ perceptions of access to health care in the city. Nearly four in ten (37 percent) now say there has been “a lot” of progress in making medical facilities and services more available, up from just 14 percent five years ago. Further, a large majority (88 percent) says their own health needs are being met at least “somewhat” well, and the share saying they are being met “very well” is up 19 percentage points since 2006.
Table 7: Increasingly Positive Ratings Of Progress On Medical Facilities
2015
2010
2008
Please tell me how much progress you think has been made so far in making medical facilities and services more available?
A lot
37
14
5
Some
35
35
33
Not too much
17
32
40
None at all
9
17
19
NOTE: Don’t know/ Refused responses not shown.
Table 8: Majority Say Health Needs Are Being Met Very Well
2015
2010
2008
2006
Overall, how well would you say your health needs are being met today?
Very well
55
55
42
36
Somewhat well
33
29
44
53
Not too well
7
10
10
9
Not at all well
4
5
4
2
NOTE: Don’t know/ Refused responses not shown.
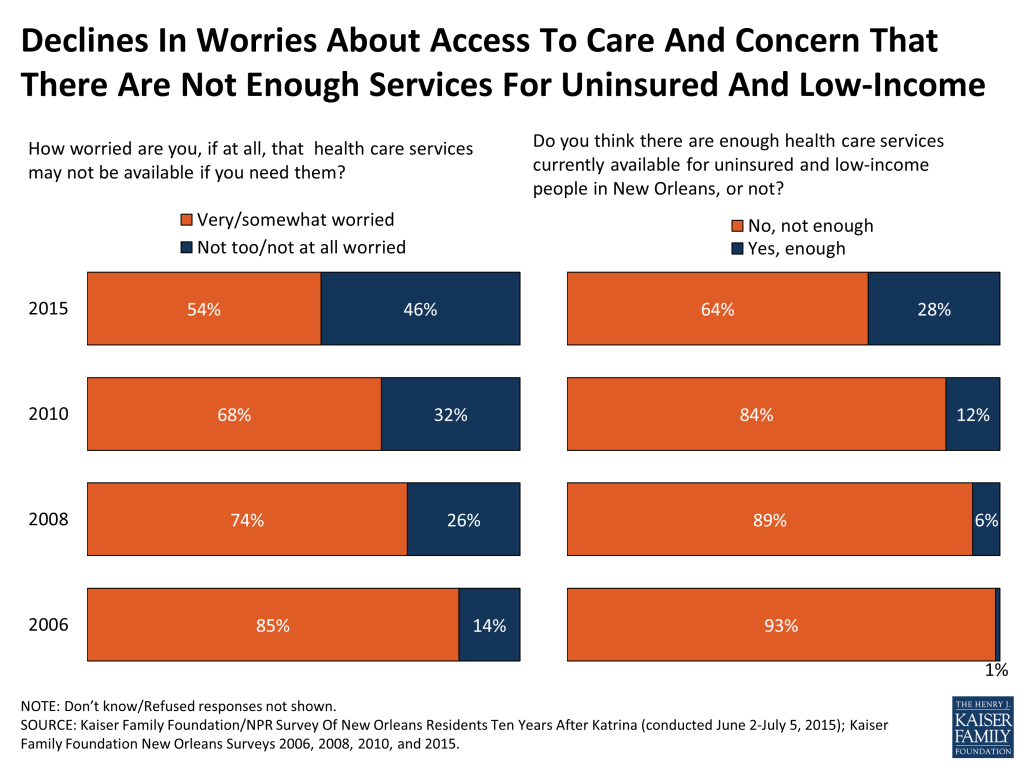
Worries about access to care have also dissipated: just over half (54 percent) of residents now say they are “very” or “somewhat” worried that health care services might not be available if they need them, down from 85 percent in 2006. And while nearly two-thirds (64 percent) say there are not enough health care services available for uninsured and low-income people in the city, this is down from a near-unanimous 93 percent in 2006.
Figure 17
Despite these improvements, it comes as no surprise that the city’s more vulnerable populations – including those with lower incomes and those without health insurance – report problems accessing and affording health care at higher rates than their counterparts. Overall, about a quarter of residents (23 percent) say that in the past 6 months they have skipped or postponed needed medical care, and about one in five (19 percent) say they have not filled a prescription or skipped doses of a medicine. These proportions are even higher among those with incomes below 200 percent of the poverty level (32 percent and 26 percent, respectively) and among the uninsured (47 percent and 33 percent). Similarly, about a quarter (27 percent) of residents overall say they had problems paying medical bills in the past 6 months, with much higher rates among the uninsured (51 percent), those with lower incomes (41 percent), and African Americans (34 percent).
Table 9: Uninsured, Lower-Income, And African Americans More Likely To Report Problems With Health Care Access And Affordability
INSURANCE STATUS
INCOME
RACE
Percent who say, in the past 6 months, they…
TOTAL
Uninsured, ages 18-64
Insured, ages 18-64
Less Than 200% FPL
200% FPL Or More
African American
White
…did NOT get, or postponed medical care when they needed it
23%
47%
21%
32%
17%
25%
21%
…did NOT fill a prescription, skipped doses, or took less than the prescribed dose of a medication
19
33
19
26
13
22
15
…had problems paying for medical bills
27
51
26
41
14
34
16
Key Findings: Section 4: Quality Of Life And Mental Health
Changes In Quality Of Life Since Katrina
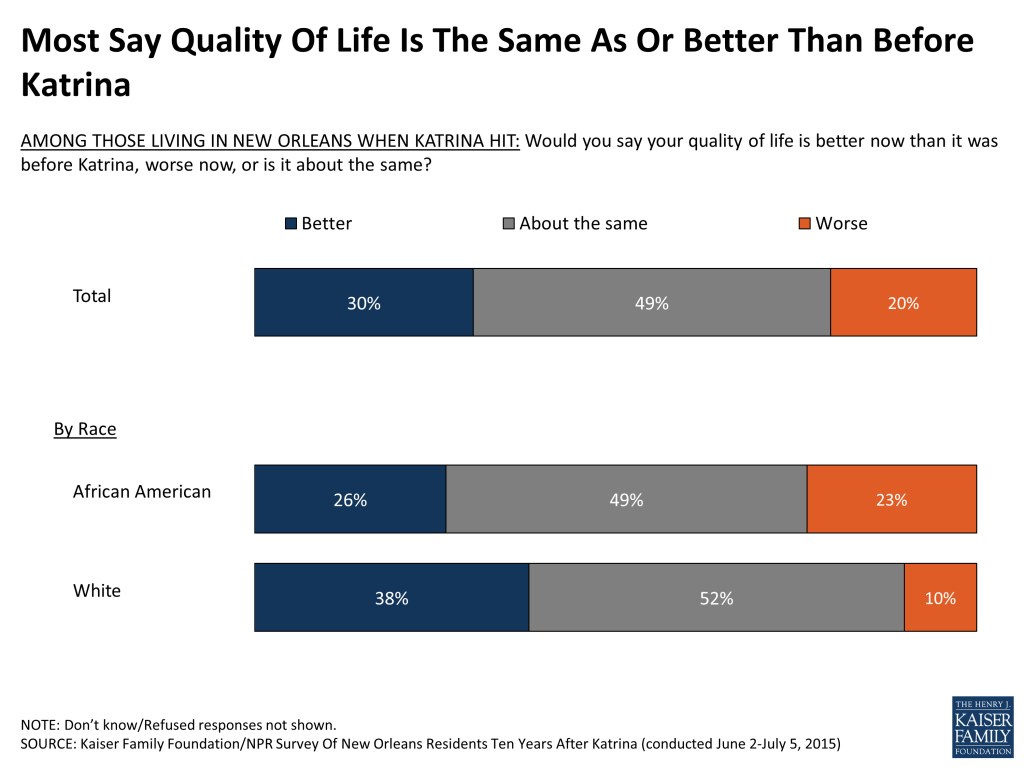
Overall, about half (49 percent) of those who were living in New Orleans at the time Katrina hit say their own quality of life is about the same as it was before the storm, while 30 percent say it is better and 20 percent say it’s worse. Of those who report a change, African Americans are split between saying their quality of life is better and worse (26 percent and 23 percent, respectively), while more whites say things have gotten better than say things have gotten worse (38 percent and 10 percent).
Figure 18
Similarly, half (50 percent) of those living in New Orleans when Katrina hit say their personal support network of relatives and friends is about the same as it was before the storm, while 31 percent say it’s better and 19 percent say it’s worse. African Americans whose residency pre-dates Katrina are somewhat more likely than whites to say their support network has gotten worse (24 percent versus 10 percent), and also more likely to say someone close to them died as a result of the storm (36 percent of African Americans versus 19 percent of whites).
Lingering Personal Impacts Of Katrina
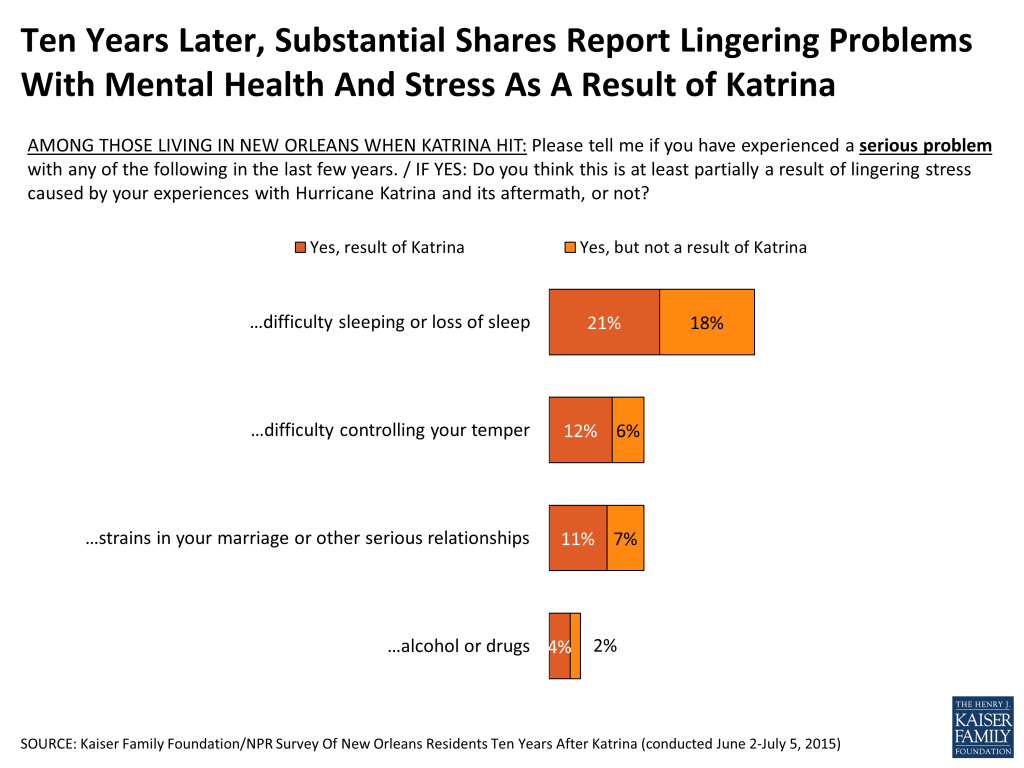
While most report a similar or improved quality of life, some residents who lived in New Orleans during Katrina report lingering mental health effects from their experience with the storm. Two in ten (21 percent) say they have had a serious problem with sleep loss in the past few years that is at least partially attributable to their experiences with Katrina. Smaller shares say they have had serious problems with controlling their temper (12 percent), strains in their marriage (11 percent), and alcohol or drug use (4 percent) and attribute these problems to their experiences during and after the storm.
Figure 19
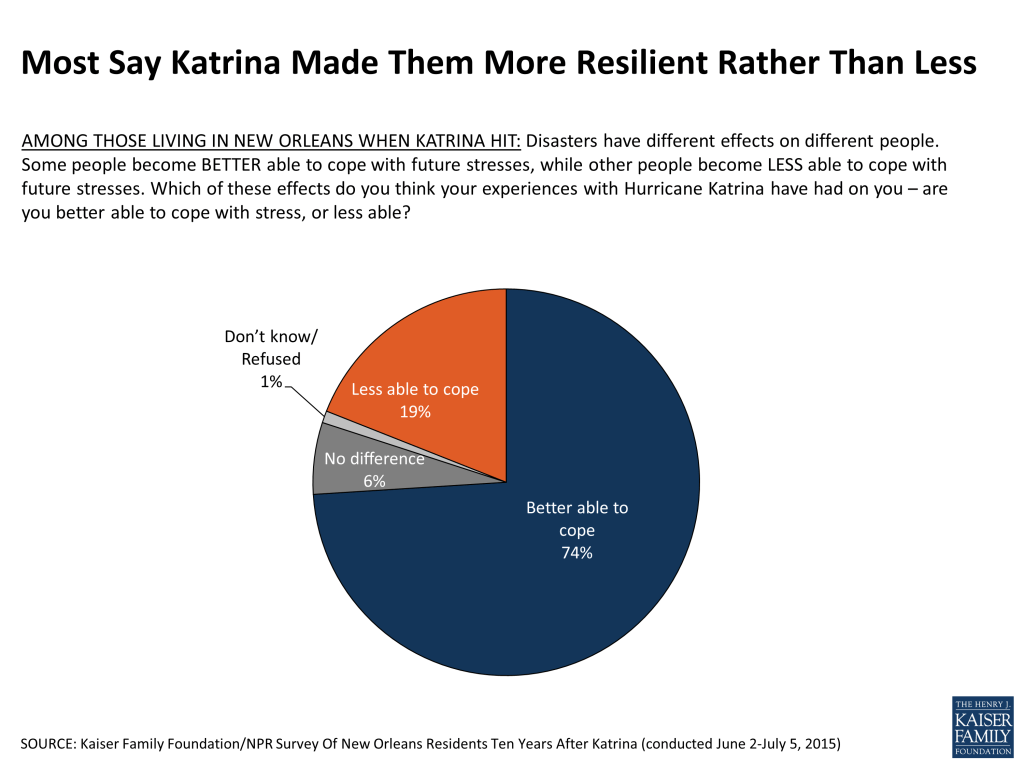
Despite these lingering problems for some, most of those who lived through Katrina and remain in New Orleans say the experience made them more resilient rather than less. Roughly three-quarters (74 percent) of residents who were living in New Orleans at the time of the storm say they are better able to cope with stress as a result, while one in five (19 percent) say the experience made them less able to cope. Perhaps reflecting other disparities noted in this report, African Americans are about twice as likely as whites to say their experiences with the storm made them less able to cope with stress (23 percent versus 11 percent).
It is worth noting that this survey can only represent the views of the city’s current residents, meaning those New Orleanians who remain or have returned to the city 10 years after the storm. If this question were asked of those who were displaced and have not been able to return, it’s quite possible a different picture of the impact of Katrina on people’s ability to cope might emerge.
Figure 20
Self-Assessments of Mental Health Similar to National
For the most part, residents’ assessments of their own mental health status and how well their mental health needs are being met are similar regardless of whether they lived through Katrina in New Orleans or moved there more recently, and are also similar to adults nationwide. About two-thirds (68 percent) of residents say their mental health is excellent or very good, similar to the share of adults nationally who said so in a Kaiser Family Foundation survey (70 percent).11 Seventeen percent – including equal shares of those living in New Orleans when Katrina hit and those who moved there after the storm – say they have taken medication for their emotions, nerves, or mental health in the past 6 months, similar to the 15 percent of adults nationally who reported doing so.12 And overall, the vast majority of residents (84 percent) say their mental health needs are being met “very” or “somewhat” well, again similar to 87 percent in the same national survey.
Key Findings: Section 5: Coming And Going
Newcomers Mostly Viewed Positively By Longer-Term Residents
The vast majority (85 percent) of current residents of Orleans Parish were also living in the New Orleans area when Hurricane Katrina hit. Compared to these longer-term residents, those who moved to the city in the past 10 years are more likely to be white (48 percent versus 31 percent), under the age of 50 (83 percent versus 55 percent), and have a college degree (45 percent versus 31 percent). Among the newcomers, most say they moved to New Orleans to be with family (31 percent) or for work (2o percent). Smaller shares say they moved to the city for school (12 percent), that they were born or raised in New Orleans or lived in the city previously and were returning (11 percent), or to volunteer (6 percent).
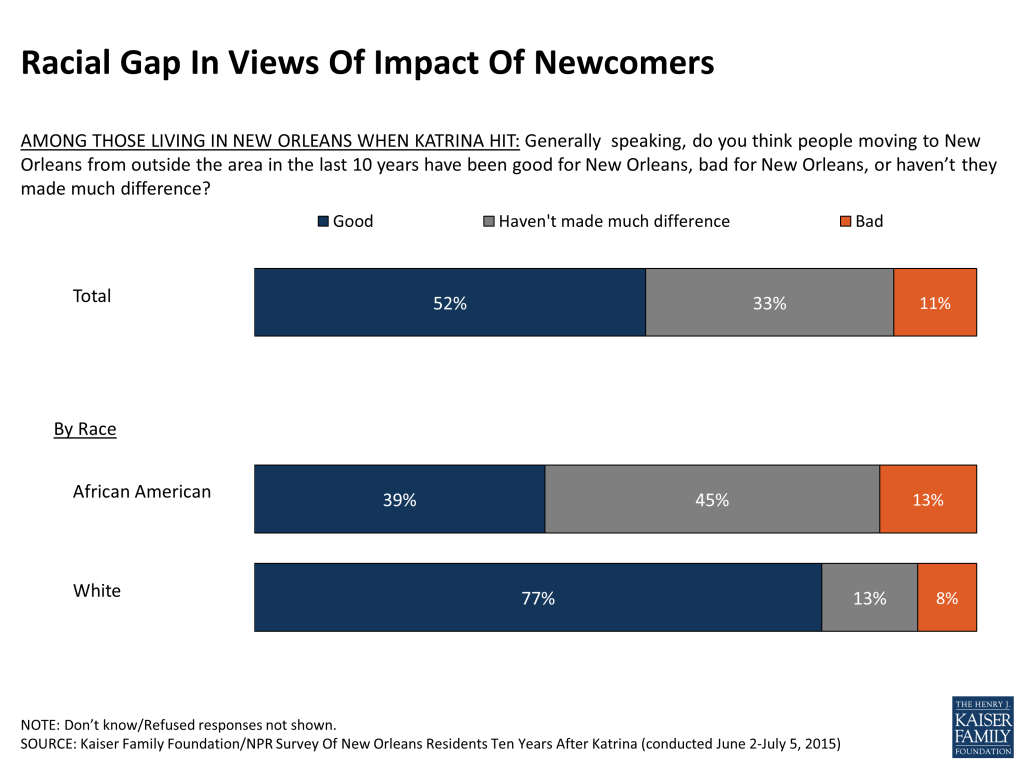
For the most part, longer-term New Orleans residents think that these newcomers have been good for New Orleans (52 percent), while a third (33 percent) say they haven’t made much difference and just one in ten (11 percent) say they have been bad for the city. Among longer-term residents, whites overwhelmingly see the newcomers as having a positive impact on the area (77 percent), while African Americans are more divided between saying they have been good for the city (39 percent) and haven’t made much difference (45 percent).
Figure 21
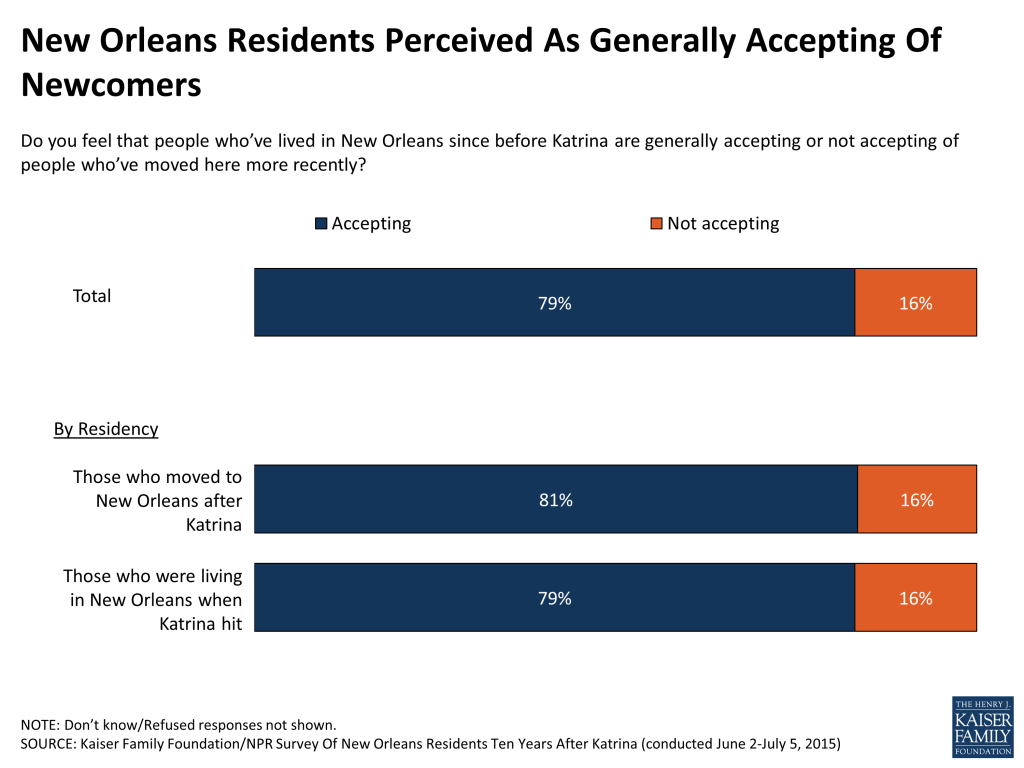
Regardless of their feelings about newcomers, New Orleanians’ reputation for being friendly and welcoming extends to all comers. Eight in ten residents overall (79 percent), including 81 percent of those who are newer to the city, say that the people who’ve lived in New Orleans since before Katrina are generally accepting of people who moved to the area more recently.
Figure 22
Moving Away
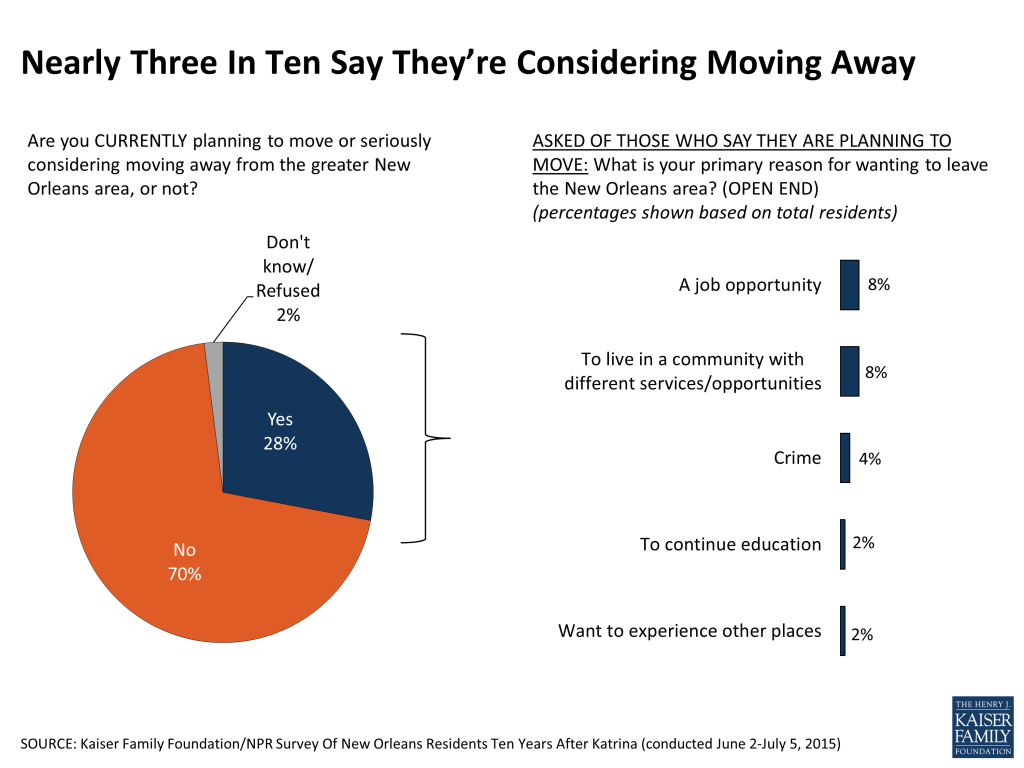
Among all current New Orleans residents, almost three in ten (28 percent) say they are currently planning to move away from the area or are seriously considering it, up slightly from 24 percent of residents who said the same five years ago. About twice as many African Americans as whites say this is their intention (35 percent, compared to 17 percent). The intention to move is mainly driven by those under age 30, 47 percent of whom say they are planning to leave (up from 37 percent of 18-29 year-olds in 2010).
Of those who say they are planning to move, most cite job opportunities elsewhere and the desire to live in a community with different services and opportunities as their main reasons (each reason accounts for about a quarter of those who are planning to move, or 8 percent of all residents). Others name crime (4 percent of all residents), educational opportunities (2 percent), and the desire to experience other places (2 percent) as their primary reason for wanting to leave.
Figure 23
Conclusion
Taken together, the survey findings highlight both the remarkable progress New Orleans has made in the 10 years since Katrina, as well as the stark challenges that remain. Perhaps the biggest of these challenges is one that was not brought about by the storm, but may have been exacerbated by it: the vast differences in the living circumstances of the city’s African American and white residents. These gaps are reflected not only in the rates at which African Americans and whites report ongoing financial problems and a lack of neighborhood services, but also in their feelings about how far New Orleans has come in its recovery and their views of the city as a good place for young people. Racial disparities in income and living conditions are not uncommon in urban areas across the U.S., and what we cannot tell from this survey is the degree to which any of the gaps identified are unique to New Orleans and its residents’ experiences with Katrina, or whether other cities would differ on these same dimensions. While a majority of both blacks and whites remain optimistic about New Orleans’ future, the fact that about a third of African Americans and nearly half of young adults are considering moving away is a potentially troubling sign for the city’s ability to maintain the vibrant and diverse community for which it has long been famous.
Methodology
The Kaiser Family Foundation/NPR Survey Of New Orleans Residents Ten Years After Katrina was conducted as part of a survey partnership between NPR and the Kaiser Family Foundation. Representatives of the two organizations worked together to develop the survey questionnaire, with NPR maintaining editorial control over its broadcasts and online reporting relating to the survey results. The Kaiser Family Foundation paid for all fieldwork costs associated with the survey. The 2015 survey builds on a series of three prior surveys conducted solely by the Kaiser Family Foundation in 2006, 2008, and 2010.
The survey was conducted June 2 – July 5, 2015, among 1,517 randomly selected adults ages 18 and older residing in Orleans Parish, Louisiana (the city of New Orleans). SSRS collaborated with Kaiser Family Foundation researchers on sample design and weighting, and supervised all phases of the fieldwork. Computer-assisted interviews conducted via landline telephone (705) and cell phone (812) were carried out in English and Spanish.
The survey is based on an overlapping dual-frame, random digit dial (RDD) design. The landline component consisted of randomly generated phone numbers in Orleans Parish, and the cell phone sampling frame consisted of all cell phone exchanges with the greater New Orleans area code. Marketing System Group (MSG) provided both the landline and cell phone samples. Respondents were asked to provide basic address information which was used to determine geographic eligibility. For the landline sample, respondents were selected by asking for the adult male or female living in the household who had the most recent birthday, based on a random rotation.
Efforts were made to maximize survey response, including: pre-testing the survey instrument to ensure it was working smoothly; completing at least 7 call attempts to any non-responsive numbers; varying the time of day and day of week for callbacks; and permitting respondents to schedule a callback at their convenience. Respondents concerned with the cost of their cell phone minutes were offered a $20 incentive to complete the survey.
The combined landline and cell phone sample was weighted to balance the sample demographics to match estimates for the adult population of Orleans Parish using data from the Census Bureau’s 2013 American Community Survey (ACS) for age-by-gender, race-by-gender, and education, as well as current patterns of telephone usage based on estimates from the CDC’s National Health Interview Survey (NHIS). The weight takes into account the fact that respondents with both a landline and cell phone have a higher probability of selection in the combined sample and also adjusts for the household size for the landline sample. All statistical tests of significance account for the effect of weighting.
The margin of sampling error including the design effect for the full sample is plus or minus 3 percentage points. Note that the survey included Orleans Parish residents in all their racial and ethnic diversity – including whites, African Americans, Hispanics, Asian Americans and those of other backgrounds – but because groups are represented based on their actual share of the total population, the only two groups large enough to be analyzed separately are African Americans and whites. The table below shows the number of respondents and margin of sampling error for the total sample and for these two key subgroups. Margins of sampling error for other subgroups may be higher, and are available by request. Note that sampling error is only one of many potential sources of error in this or any other public opinion poll.
Number of Respondents
M.O.S.E
Total 2015
1,517
±3 percentage points
African American 2015
764
±4 percentage points
White 2015
574
±5 percentage points
Total 2010
1,528
±3 percentage points
Total 2008
1,294
±3 percentage points
Total Orleans Parish 2006
901
±5 percentage points
Kaiser Family Foundation public opinion and survey research is a charter member of the Transparency Initiative of the American Association for Public Opinion Research.
METHODOLOGY FOR PREVIOUS WAVES: NEW ORLEANS 2006, 2008 AND 2010
The methodology of the four surveys in this series has developed and adapted according to changing conditions on the ground in New Orleans. The 2006 survey was conducted at a time when New Orleans residents were still experiencing significant Katrina-related dislocation, a situation not conducive to a telephone-centered methodology. Instead, the 2006 survey employed an address based sample and all interviews were conducted face-to-face. By 2008, the situation had stabilized and we employed a mixed mode methodology, conducting roughly half the interviews via telephone, and the rest either in-person or via the Internet, again using an address-based sample. As the 2008 survey results suggested that only a very small proportion of the target population (2 percent or less) was without either landline or cell phone service, we switched to a dual-frame telephone methodology in 2010, similar to the methodology used for the current survey.
See full methodological information for the surveys in 2006, 2008 and 2010.
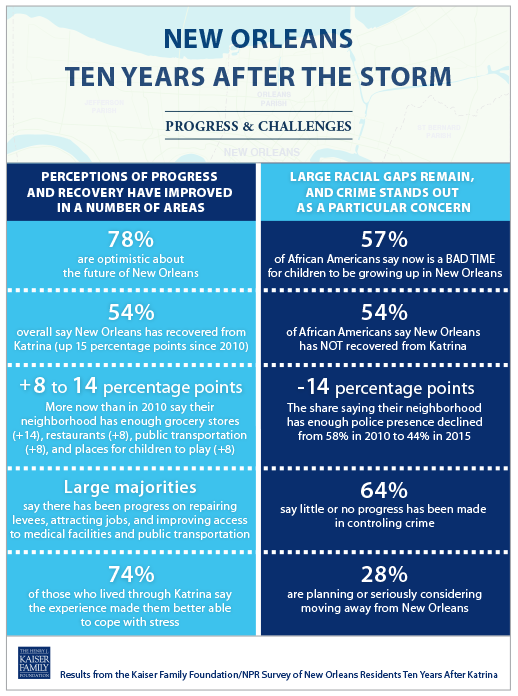
A Kaiser Family Foundation/NPR survey finds views of recovery and life in New Orleans a decade after Hurricane Katrina paint a picture of both progress and challenges. Residents’ reports of conditions in their own neighborhoods and their evaluations of the city’s progress have improved steadily on many fronts. However, large gaps exist between African Americans and Whites, and residents point to other challenges, particularly in the area of public safety.
A decade after Hurricane Katrina battered the Gulf Coast and flood waters breached levees to cause unprecedented destruction in New Orleans, the Kaiser Family Foundation has teamed with NPR to survey current residents on the city’s recovery efforts and lingering challenges.
The new survey adds to findings from a series of surveys conducted by the Foundation in 2006, 2008, and 2010, as well as a survey of Katrina evacuees conducted in partnership with TheWashington Post just weeks after the storm hit the Gulf Coast on Aug. 29, 2005. The series tracks how New Orleans residents feel about their city and its progress on a number of fronts, including race relations, public safety, affordable housing, and education.
New Orleans Ten Years After the Storm finds that residents overall are optimistic, resilient, and proud of their city’s culture. In many cases, survey trends show steady improvements in neighborhood conditions and residents’ evaluations of the recovery’s progress. However, African Americans continue to lag far behind Whites, both in their perceptions of how much progress has been made and in the rates at which they report continuing struggles. In some areas — such as views of whether New Orleans offers good career opportunities for young people — the racial gap has widened since the hurricane. Crime continues to be seen as the city’s biggest problem among residents of all races, the survey finds, with personal worries about crime increasing over the past five years.
Three infographics from the Foundation illustrate some of the survey’s main findings:
In the decade after Hurricane Katrina wreaked havoc in New Orleans in 2005, the Kaiser Family Foundation conducted a series of surveys with the city’s residents, tracking how they feel about New Orleans’ progress on a number of fronts, including conditions in their own neighborhoods.
A decade after Hurricane Katrina hit, a 2015 Kaiser Family Foundation/NPR survey finds a racial divide in how New Orleans residents perceive the city’s recovery. African-Americans continue to lag far behind Whites, both in their views of how much progress has been made and in the rates at which they report continuing struggles. For more details, read the full survey report.
The financial alignment demonstrations for seniors and younger people with disabilities dually eligible for Medicare and Medicaid are joint efforts of selected states and the Centers for Medicare and Medicaid Services (CMS), designed to align benefits and financing with the goals of delivering better coordinated care and reducing costs. These three-year demonstrations are based on authority in the Affordable Care Act and were implemented beginning in July 2013.
Recent case studies describe program design and early implementation activities in three of the first states to enroll dually eligible beneficiaries in these demonstrations: Massachusetts, Ohio, and Virginia. This issue brief provides additional information and insights about initial program activities from the perspective of beneficiaries in these three states, based on 12 individual interviews conducted in early 2015. Profiles of six beneficiaries are presented to illustrate representative program experiences, along with key findings from across all of the interviews.
Interviewees include seniors and younger people with a range of physical and mental health disabilities and chronic conditions. All live independently in the community. Some voluntarily enrolled in the demonstration, and others were automatically enrolled. They were asked to comment on how they initially heard about the demonstration, their experience with the enrollment process, whether they had help or advice when they enrolled, the needs assessment process associated with the demonstration, their access to medical and other services, their experience with care coordination, if they know who to contact should problems arise, and whether they have suggestions for improving the program.
This issue brief was prepared by Laura Summer, consultant; Molly O’Malley Watts of Watts Health Policy Consulting; and MaryBeth Musumeci of the Kaiser Family Foundation. The authors extend special thanks to the many dedicated individuals in the three states who helped with interview arrangements as well as those who participated in the interviews.
Key Findings
Although interviewees’ experiences differed, certain common themes provide insights that can help inform states and other stakeholders as the demonstrations progress and as other new programs, particularly managed care delivery systems that integrate medical care and long-term services and supports, are implemented.
Generally, interviewees tended to enroll in the demonstration based on information or with assistance from trusted sources. These sources included providers, colleagues in the disability community, and service coordinators at a housing complex and a center for independent living. Interviewees put particular trust in their medical and LTSS providers with regard to whether to enroll in the demonstration. Consequently, when providers are not familiar with the demonstration, are not participating in health plan networks, or are wary about program policies, interviewees were less inclined to participate.
Interviewees who opted out of the demonstrations often did so because they did not understand what the new program would mean for them or felt that the risk of disrupting established services outweighed any potential benefits. Interviewees reported that they were afraid of change or were simply comfortable their current situation and not want to “rock the boat.” Interviewees who have longstanding relationships with personal care attendants who help them with day-to-day functioning were especially reluctant to change delivery systems if their aides are not participating in the new health plan networks. Word of mouth has a powerful impact on interviewees’ decisions about whether to participate in the demonstrations. Interviewees who heard about gaps in service or other problems that occurred in parts of the state where implementation occurred earlier were not inclined to enroll. For example, in Ohio, which had a two-part enrollment process, several people characterized the transition to Medicaid managed care, which occurred first, as “a bumpy start” and said that, as a result, they were reluctant to enroll in Medicare managed care later.
Interviewees’ participation in the demonstrations can be disrupted if they lose eligibility for either Medicare or Medicaid benefits. Both of these programs have complex rules, and Medicaid eligibility must be periodically renewed. An interviewee, who continued to meet the eligibility criteria but temporarily lost Medicaid benefits due to glitches in renewal paperwork, was faced with having to re-enroll in the demonstration once Medicaid eligibility was re-established. Other interviewees were at risk of losing Social Security Disability, and consequently Medicare, benefits as a result of a return to work or medical improvement in disability status and therefore would no longer be eligible for the demonstrations even though they still may have the same underlying chronic conditions or other needs that would benefit from the care coordination offered by the demonstrations.
Interviewees universally embrace the concept of better-coordinated care, although initial implementation of this feature of the demonstrations was slow. Those who received care coordination services were very positive about the program. Those who did not, particularly after they requested help, became frustrated and anxious due to the lack of communication with care coordinators because they had complex needs that must be addressed often daily. Interviewees said that health plans seemed overwhelmed by the number of new enrollees. Consequently, interviewees did not always hear from care coordinators immediately or have initial needs assessments, which are used as the basis for planning services, in a timely manner. Similarly, a broader team approach to care planning, which is a prominent feature of each demonstration, had not yet been implemented to any significant extent.
Although interviewees generally understood that their benefits had changed at the start of the demonstrations, many were confused about what the change meant for them. The experience of those who did not have smooth transitions to the new programs suggests that better coordination requires improved communication among state agencies and health plans, between different departments within health plans, between former and new providers, among care coordinators if interviewees had more than one, and within care teams. Otherwise, interviewees may have received confusing or conflicting information and assistance.
In some instances, health plan provider networks were not as robust as interviewees thought they would be. Interviewees cited several reasons for this, including that some providers, particularly independent caregivers, were not always aware that they would be required to have contracts with and bill health plans; some providers were negotiating but had not yet been certified to participate in health plan networks; and some providers simply were not familiar with the new program or had not been able to get the information they needed to apply to be in plan networks.
Beneficiary interviews revealed a need for greater assistance and more information about how to get help with obtaining needed services and answering questions. Although each state established an ombuds office for the demonstration, most interviewees did not know about those services or how to access them. Interviewees were more apt to know the name of their insurance plan than of the new program, and they tend to contact their health plan directly when they have questions. Early on, however, respondents indicated that health plan customer service representatives could not answer their questions or that plan representatives acted more as gatekeepers than assistors. Some interviewees reported that health plan staff did not seem to understand the nature of long-term services and supports, including the need for quick responses to problems that can have an immediate effect on beneficiaries’ safety and ability to function on a daily basis.
Issue Brief: Beneficiary Profiles
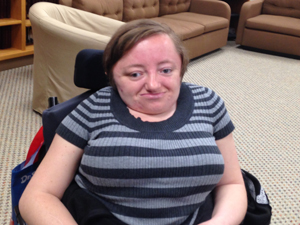
Desiree, age 28, MassachusettsDesiree lives independently and uses a power wheelchair, a service dog, and personal care services for help with activities of daily living as a result of a genetic condition. She is happy with the demonstration now that she has an assigned care coordinator but found the program very difficult to navigate initially, leading to a delay in a needed wheelchair service authorization. She believes that the demonstration could be improved to better meet the needs of people like her who work full-time.
Rob, age 65, OhioRob, who has multiple chronic conditions, likes the concept of the demonstration, but has had initial difficulties with the enrollment process and getting updated information about participating providers. After initial delays in having someone assigned, he is now in regular contact with his care coordinator but has not yet received a needs assessment to begin the care planning process.
Eric, age 31, VirginiaEric attends community college and receives regular intensive outpatient behavioral health services. He was surprised to be enrolled in the demonstration but is generally satisfied, particularly with the new dental benefit. He has only had one call from his health plan, however, and does not know who to contact with questions, such as where he should go in a psychiatric emergency.
Mary Francis, age 88, VirginiaFollowing a stroke, Mary Francis has difficulty walking and is prone to falls. She has multiple chronic conditions and attends an adult day health center. Mary Francis is very pleased with her care coordinator’s review of her medications, help with arranging rehabilitation services, and accompanying her to a doctor’s visit. However, she recently was disenrolled from the demonstration, due to a mix-up with her Medicaid renewal paperwork, and is in the process of re-enrolling with the health plan.
John, age 41, OhioJohn has quadriplegia and worried that enrolling in a health plan would disrupt his existing arrangements with the home health aides on whom he relies to help him get ready each morning. He was unable to find a health plan whose network included all of his longstanding providers, although he thinks that the plan provider networks are growing. He also experienced a delayed authorization to replace the battery in his ceiling lift, as a result of late plan payments to the vendor, placing him at risk of injury when transferring from his power wheelchair. He is interested in possibly self-directing his services once that option is fully implemented.
Sylvia, age 44, MassachusettsAnxiety and depression made it difficult for Sylvia to make and keep physical therapy appointments following back and shoulder surgery and to arrange care for other conditions. Living alone and feeling isolated at times, she enrolled in the demonstration because she would welcome help with care coordination. Her regular doctor was able to become a participating network provider without any disruption in her care, but Sylvia does not know how to initiate the care planning process with her health plan.
Issue Brief: Desiree, Age 28, Massachusetts
Desiree has a Master of Science degree in Education and Assistive Technology and has worked for Easter Seals for the past year and a half as a youth services manager. She lives with a roommate in a physically accessible apartment in downtown Boston and uses public transportation to commute to work, go to the gym, and go out with friends. She has a power wheelchair with a seat elevator, which she needs because of her short stature and brittle bones, characteristics of osteogenesis imperfecta type III, a genetic condition. Desiree does not have other medical problems. She receives routine care from her primary care doctor and sees an orthopedist and a neurosurgeon when necessary. She also receives22 hours of personal care services each week. Desiree also has had a service dog for the past two and a half years. The dog performs tasks such as opening doors, switching on lights, and picking things up.
“One thing I like about [the demonstration] is that once it’s straightened out, there’s not a lot of hoops to jump through.”
Desiree first heard about the demonstration from colleagues at the Center for Independent Living. She was eager to enroll when the program became available, and so, when she received a letter introducing the program, she signed up to receive services from the only plan available in her area. Her early program experiences were discouraging, however; initially, she found the program “very difficult to navigate.” For example, no one from the health plan contacted her, and a visit from a care coordinator did not occur until seven or eight months after she called to request one. It took about a year for the LTSS coordinator to respond to her request to meet.
Once she connected with the care coordinators, Desiree was pleased. She received authorization for additional personal care hours. She now has an assistive technology device that helps extend her reach, and the LTSS coordinator is working with her building manager to make the kitchen in her apartment fully accessible.
Not having a specific contact at the health plan early on was particularly problematic when Desiree needed authorization to service her wheelchair. It took two weeks before the calls she made to health plan were returned. Each time Desiree spoke with plan representatives, she was told that they would give the care coordinator her message, but she was unable to contact the care coordinator directly, and her wheelchair was “pretty much out of commission” by the time she got a response. Her experience was much different once she had an established care coordinator who she could call directly. When she injured her shoulder, for example, she received immediate authorization to see her orthopedist although he is not in the plan’s network, because he already knows her medical history and seeing him was a good alternative to going to the emergency room.
Desiree recently learned that she would have a new care coordinator though she does not know the reason for the change. She would prefer not to have to start again with someone new. Also, she would rather not have so many meetings with care coordinators, particularly in-person meetings. She suggested that phone meetings might be a good alternative, particularly for independent working enrollees who have proven ability to manage their own care.
At this point, Desiree is pleased to be enrolled in the demonstration as a dual eligible. Looking ahead, she is concerned, however, that her length of work will affect her Medicare eligibility and, in turn, her eligibility for the demonstration because if she loses Medicare coverage, she will no longer be a dual eligible. Now that she is working, she is in a transition period during which she retains Medicare but no longer receives Social Security Disability benefits. After five years of work, she can pay to receive Medicaid benefits through the buy-in program for working adults with disabilities, but once she loses Medicare coverage, she will no longer be dually eligible and so does not think she will be able to participate in the demonstration. In speaking about the program, she notes, “It really wasn’t made for working professionals. I don’t think it’s understood that there [are] working professionals who need it.”
Issue Brief: Rob, Age 65, Ohio
Rob lives alone, but doesn’t spend much time by himself. He helps care for his brother and his nephew, both of whom have disabilities and live nearby. He is active with his church and with a civic association that polices the neighborhood, and he advocates for many friends. Rob has degrees in business administration and music. Before he retired, he worked as an education program coordinator and as a professional musician.
Rob is grateful to be able to be so active because he has multiple health problems. He has been diagnosed with diabetes, hypertension, arthritis, and spinal stenosis. He suffers from migraines and back pain. He has had numerous surgeries including gastric bypass, knee replacements, hernia repair, and gallbladder, appendix, tumor removal. Rob’s main health care need now is prescription drugs. He takes 14 pills a day and uses a special cream for his knees. Sometimes he uses a walker, and he has trouble getting up steps but manages for now. Rob says that his mental health is sound because he stays active, travels to see family, and has a strong relationship with God.
“When you see it on paper, it’s great… There are some pluses… [but] I want to see it fixed, or I want to see it gone.”
When Rob received the first letter about the demonstration, he understood that he had to choose one of two health plans in his area for his Medicaid services. He chose his health plan because he had heard about payment problems in the past with the other plan from home health aides. Rob understood that he could voluntarily enroll in the same health plan to also receive Medicare services or remain in traditional Medicare. He contacted the health plan to ask for information. His main concern was what would happen with his coverage when he travels out-of-state. He also wanted to know whether the health plan would pay for the cream he uses for his knees because it comes from a specialty pharmacy in another state. His Medicare Part D plan now covers it but that took effort to arrange. The health plan customer service representative could not answer his questions so he decided to keep his traditional Medicare coverage. When the letter regarding enrollment for the second phase of Ohio’s demonstration arrived, Rob was surprised to see that he had been assigned to the health plan for his Medicare coverage because he thought that he had already chosen to retain his traditional Medicare. He called the state “to opt out again” so that he retains his traditional fee-for-service Medicare coverage and is enrolled in a health plan for his Medicaid coverage.
Rob still has not received an assessment by his health plan. He said, “I was completely on my own” because his care manager did not contact him until six months after he enrolled in the demonstration. He and his care manager now communicate by phone, and he is pleased to “have a direct line with [the health plan].” Rob has contacted the health plan customer service representatives, the demonstration enrollment broker, the ombuds office, and the state insurance commission. He reports that the ombuds office was helpful, but he would not have known about those services if he had not had help from a local beneficiary advocacy group. Rob also notes that many enrollees do not have the awareness, perseverance, or time that he does to devote to getting answer to questions.
Rob has particular concerns about the provider network available through his health plan. He says the list of doctors is not up-to-date. Consequently, people go to their appointments and are told that doctors can no longer see them. Rob is under the impression that many doctors’ offices do not like the new program because they have to have new contracts, have to bill in a different way, and are not getting paid on time. He notes that these problems affect patients as well. However, Rob does think that the demonstration has potential.
Issue Brief: Eric, 31, Virginia
Eric is a community college student who hopes to continue studying social sciences at a local university. When he is not studying, he enjoys playing laser tag and video games with friends, going to the gym, and eating Indian food at a local restaurant. He also takes care of his fish and walks his friend’s dogs. He lives by himself in an apartment.
Eric last worked in 2003. He was doing kitchen work but stopped working after he was admitted to an inpatient psychiatric hospital and diagnosed with schizoaffective disorder. He was in and out of the hospital for four years, but has not been hospitalized since 2007. He is grateful to have more stability now, to be responding well to his medication, and to have coverage for routine medical care. Eric has a regular primary care physician. He is being treated for high blood pressure.
“I already have a case manager, so it might be redundant.”
Eric was surprised when he received the letter that introduced the demonstration and indicated that he would be enrolled in a particular health plan unless he chose another plan. He called the phone number on the letter and asked some general questions, then decided to go with the health plan to which he was assigned. Soon afterward, he received an insurance card from the plan and a call from someone at the plan who asked a number of questions. Eric was not sure why she called, and at first, he thought she was a telemarketer. She has not called since, and Eric does not have her name or contact information.
To his knowledge, Eric does not have a health plan case manager, and he has not heard any discussion about a behavioral health home, one of the features planned for Virginia’s demonstration. He says these features might be a good idea for others, but Eric says that he already has an established case manager at the behavioral health organization where he goes for regular treatment.
Eric does have some questions related to his new coverage. One question is whether there is a particular hospital where he would have to go to in an emergency, for example, if he had a psychotic break. He is also unsure why a different doctor rather than his own doctor is listed as the primary care doctor on his health plan card, although he has not had problems having visits with his regular doctor covered. Basically, however, Eric is satisfied with the demonstration. He has used the extra dental benefits to have his teeth cleaned. He does not have to pay for his prescriptions or monthly lab work. His only concern at this point is whether he will be able to maintain his Social Security Disability benefits. He has just appealed a decision to discontinue these benefits, and the outcome could affect his Medicare eligibility as well.
Issue Brief: Mary Francis, Age 88, Virginia
Fifteen years ago, Mary Francis moved from Oklahoma, where she was retired after working as a cook in a restaurant, to live with her daughter, Mary, in Virginia. She had had a stroke, which left her with little muscle control in her left leg. She uses a walker and is prone to falls and bone fractures. She still has pins in one knee because of a fall. Mary Francis has had a few surgeries over the years. She has hypertension and advanced glaucoma and is followed for a heart murmur.
Mary Francis has been attending the same adult day health center for 15 years. She participates in all of the activities that are offered and says she enjoys every one of them. She is proud to have attended the center longer than anyone else. She also receives 44 hours per week of home health services, including help with dressing, preparing meals, and grocery shopping. Her granddaughter is available to provide respite care. In describing her situation, Mary Francis says, “I’m loved.”
She and her daughter first heard about the demonstration at a meeting sponsored by the adult day health center. Representatives from the state as well as the participating health plans made presentations. Mary and her mother were drawn to the demonstration because of the extra benefits, such as podiatry, that were available and the promise of care coordination. They said it was also reassuring to know that they could leave the program if they did not like it. Mary chose a health plan after she determined that all of her mother’s doctors were in the plan’s network. In making the choice, she contacted a counselor from Virginia’s state health insurance assistance program for Medicare beneficiaries. The counselor had made a presentation at the introductory session and provided her contact information.
The Care Coordinator “was really good… When she was first assigned, she went with me to meet Mama’s primary care physician just so she could let them know who she was and what Services she was going to be providing.”
Shortly after she enrolled, a care coordinator visited Mary Francis at home to conduct an assessment, including a review of her prescription medications. The coordinator also called to check on Mary Francis at least once a month. Mary was particularly pleased that the coordinator was available to help arrange care for her mother after she fell, had to go to the emergency room, and needed rehabilitation services. In the past, Mary said, she would have had to make all of those arrangements. She appreciated the help.
The only “glitch” that Mary Francis encountered was that she lost eligibility for the demonstration for 45 days because of an administrative error related to her Medicaid eligibility. Although her daughter submitted the Medicaid eligibility renewal paperwork before the deadline, it was not processed on time, and therefore, Mary Francis lost her dual eligibility status and was removed from the demonstration. Mary was able to re-establish her mother’s Medicaid eligibility and to re-enroll her in the demonstration with help from the social worker at the adult day health center. They are hoping to be able to continue working with the same care coordinator who already knows Mary Francis and has been so helpful, but they do not know yet whether that will be possible after the gap in coverage.
Issue Brief: John, Age 41, Ohio
At the age of 19, John, a college freshman, lost his balance when he jumped into a local pond on a hot summer day. The accident left him with C5 quadriplegia. After his accident John was fortunate to find Creative Living, a residential community for people with high-level physical disabilities near his university. Living there allowed John to finish his undergraduate degree. He now lives independently in a condominium in the same neighborhood as his mother and two sisters and has a close relationship with his twin nephews. He likes to be outside as much as possible and vacations at state parks. Currently, he serves on the Board of Trustees for Creative Living. He volunteers in other capacities, helping organizations with IT issues and advocating on behalf of others with disabilities.
Overall, John describes himself as “fairly healthy” but must be constantly vigilant to avoid skin breakdown and other complications related to his disability. He relies on home health aides for about 12 hours each day and has nursing services several times a week. He uses a power wheelchair, a hospital bed, ceiling lift, and shower chair. His condominium has been modified with ramps and widened doors, and he has a minivan modified to accommodate his wheelchair.
“I hated the idea of being transferred. I had a wonderful support team and it seemed ominous and very disruptive… i worried about who would get me up in the morning.”
John has had Medicaid and Medicare since his accident. The demonstration is his first experience with managed care. When he learned about the program from others in the disability community, he was anxious about transitioning to a new delivery system.
John chose his health plan and was distressed because he could not keep all of his providers. Some did not participate with both or either of the health plans in his area, making it difficult to select a plan.
Provider networks are improving, but John thinks that what is happening now should have happened a year earlier. He appreciates the program policy that will reimburse out-of-network providers who continue to see beneficiaries during a grace period but says that in practice, “it’s less than advertised” because some doctors are unfamiliar with the program and therefore reluctant to schedule appointments with demonstration enrollees.
Prior to the demonstration, John had a longstanding relationship with his case manager but he had to switch because his new health plan uses a different case management organization. When no one contacted him, John called the health plan to request a visit. He liked the new case manager but was distressed that she knew nothing about him. His understanding is that his previous case management records had been sent to the health plan but subsequently lost. Later, an assessor from the health plan visited him. There were no service changes in his new care plan except for a small number of more flexible hours that he can use to juggle his aides’ schedules when necessary.
“How do you choose between a neurologist you’ve had for 20 years and a DME provider who customized your seat you use every day?”
After the transition to the demonstration, John was able to keep his personal care team, but he says it required a “Herculean effort.” All but one of his six personal care aides was an independent provider, and none had any knowledge about the impending program change. Under the demonstration, independent providers have to be part of the health plan network and must bill the plan for claims. Only by inquiring as if he were an independent provider himself, was John able to obtain guidance about how to complete the required paperwork. After extensive consultation with the health plan, John made a template for his independent providers and helped them all apply to the plan’s network. Another early challenge was that even after they joined the plan network, his providers were not paid for almost two months. They finally received checks just after he called attention to the situation publicly.
Delayed payments had practical consequences for John in another way when a battery for his ceiling lift had to be replaced. He called his new case manager and learned that he now needs prior authorization for a battery, but the case manager was not successful initially at getting the prior authorization from the plan. John is able to transfer on his own on occasion, but when he must do this for a prolonged period of time, both he and his aides are at risk of injury. The repairman who he knew and contacted had a contract with the health plan, but because the repair company had not been paid for prior work, they would not change the battery without prior authorization. Finally, after several weeks, John called the customer relations representative at the plan; he received authorization the next day. John said that this story shows how much the plan’s the customer relations function has improved but also illustrates a particular challenge associated with his change in coverage.
The option for self-directed care in Ohio’s demonstration is a new feature that is particularly appealing to John, but he had to take the initiative to find out about it, and at this point, after talking with his case manager and another representative from the health plan, he concluded that “essentially they are still building the [self-direction] model.” A major outstanding issue is whether his aides would be paid the same wage under self-direction as under the current program.
John sees potential in a system that would provide a single point of contact to coordinate all of his Medicaid and Medicare services, but he opted out of the Medicare portion of the demonstration before it became effective because his experience with his health plan so far had been challenging. Also, since his current doctor accepts Medicare but not Medicaid, he can only continue to see his doctor if he stays with traditional Medicare.
Issue Brief: Sylvia, Age 44, Massachusetts
Sylvia enjoys reading and writing and is working on a memoir. She has two adult children and lives alone. Sometimes, she feels isolated. Sylvia has worked since she was 14, most recently in the customer service field, but following back and shoulder surgery due to injuries from a car accident is not feeling well enough to go back to work. She has received some physical therapy and has a prescription for more as well as a prescription for acupuncture for pain management but has not made appointments for these services yet. She is taking anti-inflammatory medicine. Sylvia also has peptic ulcers and sees a dermatologist for skin conditions.
Sylvia has had anxiety and depression her whole life as well as prolonged grief associated with trauma in her past. She had received therapeutic counseling, but the clinic she attended shut down, and she was told that there was a two to three month wait to see a new therapist. Rather than stay on a waiting list and go through the orientation and intake process again, she relies on her primary care doctor who has prescribed medication.
“I feel prone to being lost in the system… i really want someone to work with me. I need someone to communicate and listen to me and explain what’s going on with me to doctors.”
Sylvia knows that she should make an appointment to see a gynecologist. She is trying to get to the acupuncturist and physical therapist and would like to attend a weight management clinic but finds it “difficult to get started.” Also, she says that sometimes appointments are scheduled too far in advance, and she forgets about them. She has a car but sometimes does not feel up to driving or does not have money for gas. She does not know if she would qualify for assistance with transportation or how to arrange those services but thinks it would help her get to some appointments.Sylvia has received Social Security Disability benefits since 2001. She has had Medicare coverage for 12 years and has qualified for Medicaid off and on during that time as her income has fluctuated. The hospital helped her apply for Medicaid when she had surgery. She heard about the demonstration then and decided to enroll because she was looking for someone to help her with care coordination. However, no one from the health plan has called or visited her since she enrolled. Sylvia assumes that they are probably overbooked or backlogged. She did get a packet of information but says most of it pertained to choosing doctors. She already has a regular doctor, who was not originally part of the health plan’s network, but Sylvia received care without interruption, and her doctor is now a network provider. Sylvia also read about care teams in a brochure that she received, but she does not think she has one yet and is not sure if it is up to her or her doctor or someone else to set up the team.
Through its coverage expansions, the Affordable Care Act (ACA) provides an opportunity to reduce longstanding disparities in health insurance coverage for people of color, which may contribute to improvements in their access to and utilization of care. However, many factors beyond health insurance influence individuals’ ability to obtain care. As such, one key question is the extent to which people of color may continue to experience disparities in access to and utilization of care even after ACA implementation. To provide greater insight into this question, this analysis examines differences in access to and utilization of care for Black and Hispanic adults compared to White adults among those who are uninsured, enrolled in Medicaid, and privately insured. It is based on data from the 2014 Kaiser Survey of Low-Income Americans.
The findings show that, consistent with other research, both Medicaid and private coverage are associated with improvements in access to and utilization of care compared to being uninsured, and these differences generally hold true for White, Black, and Hispanic adults. However, privately insured Black and Hispanic adults fare worse than privately insured White adults along several measures of access to and utilization of care and have less confidence in their ability to afford medical costs. Fewer differences are seen between Blacks and Hispanics compared to Whites among uninsured adults and Medicaid enrollees, and where there are differences, Blacks and Hispanics fare better relative to Whites in most cases (Table 1).
ES Table 1: Differences in How Black and Hispanic Adults Fare Relative to Whites with Same Coverage Type for Selected Measures of Access, Utilization, and Financial Confidence
Uninsured
Medicaid Enrollees
Privately Insured
Black compared to White
Hispanic compared to White
Black compared to White
Hispanic compared to White
Black compared to White
Hispanic compared to White
Access to Care
Usual Source of Care
Worse
Worse
Regular Provider
Worse
Worse
Postponing/Going without Care
Better
Better
Postponing/Going without Care Due to Cost
Better
Better
Better
Utilization of Care
Use of Medical Services
Worse
Use of Preventive Services
Better
Worse
Confidence in Ability to Afford Medical Costs
Usual Medical Costs
Worse
Worse
Worse
Major Medical Costs
Worse
Worse
Worse
Among uninsured adults, Hispanics are less likely than Whites to delay or forgo care and more likely to receive preventive care. Black uninsured adults also are less likely than White uninsured adults to delay or forgo care due to cost. These differences may reflect uninsured Hispanics greater reliance on clinics for care relative to Whites, since clinics often have outreach and supportive services to connect patients to care. They also may reflect cultural differences in perceived need for care.
Among Medicaid enrollees, Hispanic adults are less likely than White adults to delay or forgo care, although no significant differences are observed among the share delaying or going without care due to cost. Hispanic adults have less confidence than White adults in their ability to afford usual and major medical costs. The small number of disparities observed among Medicaid enrollees may reflect the program’s role serving diverse and vulnerable low-income populations. Medicaid provides supportive services that can help connect individuals to care, such as transportation and case management. Moreover, Medicaid managed care plans and providers have significant experience serving diverse populations and may provide services designed to address their specific needs.
More differences are seen among privately insured adults, particularly for Hispanics compared to Whites. Among privately insured adults, Blacks and Hispanics are less likely than Whites to have a usual source of care and a regular provider, and less likely to have confidence in the ability to afford usual and major medical costs. In addition, Hispanics are less likely than Whites to use medical services or receive preventive care. While these differences may, in part, reflect the fact that Black and Hispanic privately insured adults have lower incomes than their White counterparts, the findings also suggest that other factors beyond cost are a substantial barrier to care.
Overall, the findings suggest that gains in health coverage under the ACA will lead to improvements in access to care and utilization for White, Black, and Hispanic adults. They also highlight the importance of increased attention to addressing racial and ethnic disparities in access to and utilization of care among privately insured adults, particularly as the privately insured population becomes more diverse as a result of greater enrollment of people of color into private plans through the ACA Marketplaces. Continued efforts by insurers and providers to target the specific linguistic, cultural, and social and environmental needs of these groups will be important to achieving greater equity in access to and utilization of care. Such efforts may build on lessons learned from successful strategies in Medicaid, given the program’s longstanding experience serving a diverse population.
Issue Brief
INTRODUCTION
People of color have historically had higher uninsured rates, experienced more barriers to care, and received poorer quality care compared to Whites, all contributing to worse health outcomes.1,2 The ACA health coverage expansions offer an opportunity to reduce the longstanding disparities in coverage among people of color. Recent data show declines in uninsured rates following implementation of the ACA, with larger declines for Blacks and Hispanics relative to Whites. However, Blacks and Hispanics still remain more likely to be uninsured than Whites.3
A large body of existing research suggests that these gains in health coverage will lead to improvements in access to and utilization of care. However, as the group of insured adults becomes more diverse, it is important to understand the extent to which people of color may continue to face disparities in access to and use of care even after ACA implementation. Many factors beyond coverage influence individuals’ access to and use of care, such as linguistic and cultural barriers as well as broad social and environmental factors. Existing research shows that even when controlling for health insurance, income, and other factors, people of color face increased barriers to care.4,5
This analysis provides greater insight into the extent to which Black and Hispanic adults with health coverage face disparities in access to and utilization of care and whether these disparities vary between Medicaid enrollees and privately insured adults. It is based on data from the 2014 Kaiser Survey of Low-Income Americans. The survey of 10,502 nonelderly adults was fielded between September 2 and December 15, 2014. Data were analyzed by type of health coverage, including uninsured, Medicaid, and private coverage, and racial and ethnic group, including Non-Hispanic Whites (Whites), Non-Hispanic Blacks (Blacks), and Hispanics. Analysis by additional racial/ethnic groups was not possible due to sample size limitations. Detail on the survey methods is available online.
BACKGROUND
Insurance Status
Based on the survey findings, approximately 11 million non-elderly adults were newly insured in 2014. Blacks and Hispanics were about twice as likely to report being newly insured as Whites (data not shown). Consistent with other recent analysis, this suggests narrowing in the longstanding disparities in coverage among Blacks and Hispanics. Among all insured adults, Blacks and Hispanics were significantly more likely than Whites to have Medicaid and less likely to have private coverage (Figure 1).
Figure 1: Coverage Distribution of Insured Adults by Race/Ethnicity
Demographic Characteristics and Health Status
In examining differences between Whites, Blacks, and Hispanics in access and utilization, it is important to understand how these groups differ in other ways that may impact access to care. Among uninsured and privately insured adults, Blacks and Hispanics have lower incomes relative to Whites, which may contribute to more financial barriers to care for these groups (Table 1). Among Medicaid enrollees, Hispanics are more likely than Whites to have income in the 139%-400% FPL range. Given that they are more likely to have children, this finding may reflect them being more likely to qualify through a pregnancy-related pathway, which typically has a higher eligibility limit than eligibility pathways for other adults.
Among uninsured adults, Medicaid enrollees, and privately insured adults, Hispanics are younger and more likely to have children than Whites, reflective of overall demographic patterns. Among uninsured and privately insured adults, Blacks are less likely than Whites to be married. Privately insured Hispanic adults are also less likely to be married than their Whites counterparts.
Table 1: Selected Demographic Characteristics of Adults by Race/Ethnicity and Coverage Type
Uninsured
Medicaid
Private
White
Black
Hispanic
White
Black
Hispanic
White
Black
Hispanic
Income
< 138% FPL
47%
59%
*
62%
*
81%
77%
77%
9%
23%
*
20%
*
139 – 400% FPL
43%
34%
33%
*
14%
19%
23%
*
38%
43%
53%
*
>400% FPL
10%
—
—
—
—
—
54%
34%
*
28%
*
Age
19-25
17%
18%
29%
*
13%
19%
28%
*
9%
14%
19%
*
26-34
29%
33%
26%
20%
15%
12%
*
18%
21%
22%
35-44
20%
17%
20%
24%
19%
25%
20%
18%
28%
*
45-64
34%
32%
24%
*
44%
47%
35%
52%
47%
31%
*
Marital Status
Married
33%
11%
*
28%
25%
17%
32%
69%
35%
*
56%
*
Not Married
67%
89%
*
71%
73%
82%
68%
31%
65%
*
43%
*
Children
Children
36%
29%
45%
*
39%
34%
56%
*
43%
38%
51%
*
No children
64%
70%
54%
*
60%
66%
44%
*
57%
62%
49%
*
NOTES: “–“: Estimates with relative standard errors greater than 30% or with cell sizes less than 100 are not provided.* Indicates statistically significant difference from White, Non-Hispanic of same insurance type at p<0.05 level.SOURCE: 2014 Kaiser Survey of Low-Income Americans and the ACA.
Among uninsured and privately insured adults, Hispanics are more likely than Whites to report fair or poor health (Table 2). However, across uninsured adults, Medicaid enrollees, and privately insured adults, Hispanics are less likely than Whites to report an ongoing condition. Among Medicaid enrollees and privately insured adults, Hispanics also are less likely to report taking a prescription drug. Privately insured Black adults also are less likely to report an ongoing condition or taking a prescription drug than their White counterparts.
Table 2: Selected Measures of Health Status for Adults by Race/Ethnicity and Coverage Type
Uninsured
Medicaid
Private
White
Black
Hispanic
White
Black
Hispanic
White
Black
Hispanic
Fair/Poor Health Status
31%
36%
45%
*
45%
42%
46%
12%
16%
18%
*
Fair/Poor Mental Health Status
21%
16%
19%
32%
32%
29%
6%
6%
9%
Has an Ongoing Condition
36%
37%
25%
*
62%
55%
39%
*
38%
29%
*
28%
*
Taking a Prescription Drug
27%
32%
20%
65%
67%
50%
*
49%
34%
*
36%
*
NOTES: * Indicates statistically significant difference from White, Non-Hispanic of same insurance type at p<0.05 levelSOURCE: 2014 Kaiser Survey of Low-Income Americans and the ACA.
Findings: Access, Utilization, and Financial Confidence
Consistent with other research, the findings show that Medicaid and private coverage are associated with improved access to and utilization of care compared to being uninsured, and these differences generally hold true for White, Black, and Hispanic adults. However, as shown below, privately insured Black and Hispanic adults fare worse than privately insured White adults along several measures of access to and use of care and have less confidence in their ability to afford medical costs. Fewer differences are seen between Blacks and Hispanics compared to Whites among uninsured adults and Medicaid enrollees. Moreover, where there are differences, Blacks and Hispanics fare better relative to Whites in most cases. (See Appendix Table A for complete findings).
Usual Source of Care and Regular Doctor. Among privately insured adults, Blacks and Hispanics are less likely than their White counterparts to report having a usual source of care or a regular provider (Figures 2 and 3). There are no significant differences between Blacks and Hispanics compared to Whites in these measures among uninsured adults and Medicaid enrollees.
Figure 2: Has a Usual Source of Care by Coverage Type and Race/EthnicityFigure 3: Has a Regular Doctor at Usual Source of Care by Coverage Type and Race/Ethnicity
Type of Usual Source of Care. Among uninsured adults, Medicaid enrollees, and privately insured adults, Hispanics are more likely than Whites to rely on a clinic and less likely to have a doctor’s office as their usual source of care (Figure 4). In contrast, privately insured Black adults are less likely than their White counterparts to report a clinic as their usual source of care; there is no significant difference in the share relying on a doctor’s office
Figure 4: Type of Usual Source of Care by Coverage Type and Race/Ethnicity
Postponing or Going Without Care. Among uninsured adults, Medicaid enrollees, and privately insured adults, Blacks and Hispanics are not more likely than Whites to delay or go without care and, in some cases, fare better than Whites on these measures (Figure 5). Among uninsured adults, Hispanics are less likely than Whites to delay or go without care for any reason. In addition, Blacks and Hispanics are less likely than Whites to delay or go without care due to cost, despite having lower incomes relative to Whites. Among Medicaid enrollees, Hispanics are less likely than Whites to delay or go without care for any reason, and, among privately insured adults, Blacks are less likely than Whites to delay or go without care due to cost. Together these data also show that other barriers beyond cost appear to explain a large share of delayed or forgone care for Medicaid enrollees and privately insured adults, particularly for Black and Hispanic privately insured adults.
Figure 5: Postponed or Went Without Care by Coverage Type and Race/Ethnicity
Use of Medical Services. Among privately insured adults, Hispanics are less likely to report use of medical services than Whites (Figure 6). There are no significant differences in use of services for Blacks and Hispanics compared to Whites among uninsured adults and Medicaid enrollees.
Figure 6: Used any Medical Services by Coverage Type and Race/Ethnicity
Preventive services. Privately insured Hispanic adults are less likely than privately insured White adults to report a check-up or preventive visit (Figure 7). In contrast, among uninsured adults, Hispanics are more likely than Whites to have received preventive care. Among Medicaid enrollees, there are no significant differences in the likelihood of receiving preventive care when comparing Blacks and Hispanics to Whites.
Figure 7: Had Check up or Preventive Visit by Coverage Type and Race/Ethnicity
Confidence in Ability to Afford Medical Costs. Among privately insured adults, Blacks and Hispanics are less likely than Whites to have confidence in their ability to afford both usual and major medical costs (Figures 8 and 9). Hispanic Medicaid enrollees also have less financial confidence compared to their White counterparts. Among uninsured adults, there are no significant differences for Blacks and Hispanics compared to Whites.
Figure 8: Confident Can Afford Usual Medical Costs by Coverage Type and Race/EthnicityFigure 9: Confident Can Afford Major Medical Costs by Coverage Type and Race/Ethnicity
Discussion
In sum, these findings show that having health insurance improves access to and utilization of care for White, Black, and Hispanic adults. However, privately insured Blacks and Hispanics fare worse than privately insured Whites along several measures of access to and utilization of care and have less confidence in their ability to afford medical costs. Fewer differences are seen between Blacks and Hispanics compared to Whites among uninsured adults and Medicaid enrollees, and where there are differences, Blacks and Hispanics fare better relative to Whites in most cases (Table 3).
Table 3: Differences in How Black and Hispanic Adults Fare Relative to Whites with Same Coverage Type for Selected Measures of Access, Utilization, and Financial Confidence
Uninsured
Medicaid Enrollees
Privately Insured
Black compared to White
Hispanic compared to White
Black compared to White
Hispanic compared to White
Black compared to White
Hispanic compared to White
Access to Care
Usual Source of Care
Worse
Worse
Regular Provider
Worse
Worse
Postponing/Going without Care
Better
Better
Postponing/Going without Care Due to Cost
Better
Better
Better
Utilization of Care
Use of Medical Services
Worse
Use of Preventive Services
Better
Worse
Confidence in Ability to Afford Medical Costs
Usual Medical Costs
Worse
Worse
Worse
Major Medical Costs
Worse
Worse
Worse
Among uninsured adults, Hispanics fare better than Whites on several measures of access and utilization, including being less likely to delay or forgo care and being more likely to receive preventive care. Black adults also are less likely than White adults to delay or forgo care due to cost. These differences may reflect uninsured Hispanics greater reliance on clinics for care relative to Whites, since clinics often have outreach and supportive services to connect patients to care. They also may reflect cultural differences in perceived need for care.
Among Medicaid enrollees, there are few differences in access to and utilization of care for Blacks and Hispanics compared to Whites. Hispanics are less likely than Whites to delay or forgo care, although no differences are observed among the share delaying or going without care due to cost. Hispanics have less confidence than Whites in their ability to afford usual and major medical costs. The small number of disparities observed among Medicaid enrollees may reflect the program’s role serving diverse and vulnerable low-income populations. Medicaid provides supportive services that can help connect individuals to care, such as transportation and case management. Moreover, Medicaid managed care plans and providers have significant experience serving diverse populations and may provide services designed to address their specific needs.
A greater number of differences are seen among privately insured adults, particularly for Hispanics compared to Whites. Among privately insured adults, Blacks and Hispanics are less likely to have a usual source of care and a regular provider and less likely to have confidence in the ability to afford usual and major medical costs. In addition, Hispanics are less likely than Whites to use medical services or receive preventive care. These differences may, in part, reflect the fact that Black and Hispanic privately insured adults have lower incomes than their White counterparts, although the findings suggest that other factors beyond cost are a substantial barrier to care for these adults.
Overall, the findings suggest that gains in health coverage under the ACA will likely lead to improvements in access to care and utilization across White, Black, and Hispanic adults. They also suggest that as the privately insured population becomes more diverse as a result of greater enrollment of people of color into private plans through the ACA Marketplaces, it will be important to focus attention on addressing racial and ethnic disparities in access to and utilization of care among privately insured adults. Reducing these disparities among privately insured adults will likely involve broad efforts by both insurers and providers to better address the specific linguistic, cultural, and social and environmental needs of diverse populations. Such efforts may build on lessons learned from Medicaid’s experience, given the program’s longstanding role serving a diverse population.
Cohen R. and M. Martinez, “Health Insurance Coverage: Early Release of Estimates from the National Health Interview Survey, 2014,” National Health Interview Survey Early Release Program, National Center for Health Statistics, Centers for Disease Control and Prevention, June 2015, available at: http://www.cdc.gov/nchs/data/nhis/earlyrelease/insur201506.pdf↩︎
A new Kaiser Family Foundation survey of insurance brokers and assistance programs examines the help they provided to consumers during the 2015 open enrollment period for Affordable Care Act coverage.
The 2015 Survey of Health Insurance Marketplace Assister Programs and Brokers provides estimates of the number of people helped and the number and type of assister programs, while offering an in-depth look at assisters’ assessments of the enrollment process in the second year of the ACA marketplaces. For the first time this year, the survey also included health insurance brokers who helped people apply for non-group coverage in an ACA marketplace.
Survey findings include:
More than 4,600 assister programs employing 30,400 full-time staff and volunteers provided help for consumers during 2015 open enrollment, a slight increase (7%) from the previous year.
Marketplace navigators and other assisters say they helped an estimated 5.9 million people during the sign-up period that ran from Nov. 15, 2014 through Feb. 15. Returning assister programs, which comprised 91 percent of responding programs, helped about 5.8 million of those, which they say is a decrease of about 19 percent from 2014. A number of factors may have contributed to the drop in consumers seeking assistance: The open enrollment period in the second year of the ACA marketplaces was half as long as it was in the first year; marketplace websites worked better; and more than 2 million returning enrollees auto-renewed their health coverage for 2015.
Compared to the prior year, a larger share of assister programs report being able to meet consumer needs in 2015: 81 percent said their capacity was equal to demand or they could have helped more people, compared with 63 percent in 2014. Overall, most assister programs (82%) report that open enrollment for 2015 went somewhat or much better than the prior year.
In between enrollment periods, returning assister programs helped an estimated 630,000 consumers apply for coverage through special enrollment periods; 290,000 consumers report mid-year changes to an ACA marketplace; and nearly 800,000 consumers resolve post-enrollment problems.
Brokers and assister programs appeared to serve somewhat different populations, with brokers less likely to serve Latinos, people who were uninsured, and consumers with incomes low enough to be eligible for Medicaid.
Most (66%) brokers say it takes more time to sell a non-group policy in 2015 compared to before the marketplaces launched in 2014. More than half (57%) say revenue per policy has decreased, while six in 10 (60%) brokers say they sell more policies now than before 2014.
Brokers are divided on whether they’re receiving more overall commission revenue now than before ACA implementation: 40 percent say their revenue increased, 40 percent say it decreased, and 20 percent say it stayed about the same.
METHODOLOGY
The survey was designed and analyzed by researchers at the Kaiser Family Foundation and was administered online from March 31, 2015 through May 13, 2015 by Davis Research. Assister programs nationwide were surveyed, including navigators, federally qualified health centers, certified application counselors, and other recognized programs; 713 out of 4,680 programs responded. In addition, a sample of 9,700 brokers nationwide was surveyed and 662 responded. The margin of sampling error is plus or minus 4 percentage points for both the assister program and broker full sample. For results based on assister program subgroups, the margin of sampling error is higher.