Loneliness and Social Isolation in the United States, the United Kingdom, and Japan: An International Survey

Authors: Bianca DiJulio, Liz Hamel, Cailey Muñana, and Mollyann Brodie
Published: Aug 30, 2018

Overview

The Kaiser Family Foundation, in partnership with The Economist, conducted a cross-country survey of adults in United States, the United Kingdom, and Japan to examine people’s views of and experiences with loneliness and social isolation. The survey, the second in partnership with The Economist, explores the public’s perceptions of the issue, including their views of the role of government and society in helping to reduce it, and how technology contributes to or stems the problem. It includes additional interviews with individuals who report always or often feeling lonely, left out, isolated or that they lack companionship to better understand the personal characteristics and life circumstances associated with these feelings, the reported causes of loneliness, and how people are coping.

Coverage from The Economist:

Loneliness is a Serious Public Health Problem

Key Findings: Introduction

In recent years, the issue of social isolation and loneliness has garnered increased attention from researchers, policymakers, and the public as societies age, the use of technology increases, and concerns about the impact of loneliness on health grow. To understand more about how people view the issue of loneliness and social isolation, the Kaiser Family Foundation, in partnership with The Economist, conducted a cross-country survey of adults in the United States, the United Kingdom, and Japan. The survey included additional interviews with individuals who report always or often feeling lonely, left out, isolated or that they lack companionship to better understand the personal characteristics and life circumstances associated with these feelings, the reported causes of loneliness, and how people are coping.

Key Findings

Some of the key findings from the survey across all three countries are as follows.

1 in 5 Americans always or often feel lonely or socially isolated, including many whose health, relationships and work suffers as a result. More in 3-country @KaiserFamFound/@Economist survey

  • More than two in ten report loneliness or social isolation in the U.K. and the U.S., double the share in Japan. More than a fifth of adults in the United States (22 percent) and the United Kingdom (23 percent) as well as one in ten adults (nine percent) in Japan say they often or always feel lonely, feel that they lack companionship, feel left out, or feel isolated from others, and many of them say their loneliness has had a negative impact on various aspects of their life. For example, across countries, about half or more reporting loneliness say it has had a negative impact on their personal relationships or their physical health. While loneliness is often thought of as a problem mainly affecting the elderly, the majority of people reporting loneliness in each country are under age 50. They’re also much more likely to be single or divorced than others.
  • Loneliness appears to occur in parallel with reports of real life problems and circumstances. Across the three countries, people reporting loneliness are more likely to report being down and out physically, mentally, and financially. People experiencing loneliness disproportionately report lower incomes and having a debilitating health condition or mental health conditions. About six in ten say there is a specific cause of their loneliness, and, compared to those who are not lonely, they more often report being dissatisfied with their personal financial situation. They are also more likely to report experiencing negative life events in the past two years, such as a negative change in financial status or a serious illness or injury. Three in ten say their loneliness has led them to think about harming themselves.
  • Those reporting loneliness appear to lack meaningful connections with others. Those reporting loneliness in each country report having fewer confidants than others and two-thirds or more say they have just a few or no relatives or friends living nearby who they can rely on for support. While individuals who report loneliness are more likely to express dissatisfaction with the number of meaningful connections they have with family, friends and neighbors, in the U.K. and the U.S., many still report talking to family and friends frequently by phone or in person. In Japan, reports of communication with family and friends are much less frequent, regardless of whether someone reports loneliness.
  • Among the public at large, across countries, many have heard of the issue but views vary on the reasons for loneliness and who is responsible for helping to reduce it. Across the U.S., the U.K. and Japan, majorities say they have heard at least something about the issues of loneliness and social isolation in their country. In the U.S., the public is divided as to whether loneliness and social isolation are more of a public health problem or more of an individual problem (47 percent vs. 45 percent), and a large majority (83 percent) see individuals and families themselves playing a major role in helping to reduce loneliness and social isolation in society today and fewer see a major role for government (27 percent). In contrast, residents of the U.K. and Japan are more likely to see the issue as a public health problem than an individual issue (66 percent vs. 27 percent in the U.K. and 52 percent vs. 41 percent in Japan). And, while large majorities in the U.K. and Japan also think individuals and families should play a major role in stemming the problem, six in ten also see a major role for government, unlike in the U.S. A majority of people in the U.K. say “cuts in government social programs” is a major reason why people there are lonely or socially isolated, compared to minorities in the U.S. and Japan.
  • Some are critical of the role technology plays in loneliness and isolation, but some see social media as an opportunity for connection. Many in the U.S. (58 percent) and U.K. (50 percent) view the increased use of technology as a major reason why people are lonely or socially isolated, whereas fewer people in Japan say the same (26 percent). Across countries, more say technology in general has made it harder to spend time with friends and family in person than say it has made it easier. However, when it comes to social media specifically, in each country, more say that they think their ability to connect with others in a meaningful way is strengthened by social media rather than weakened. But, for those experiencing loneliness or social isolation personally in the U.K. and the U.S., they are divided as to whether they think social media makes their feelings of loneliness better or worse. In addition, people who report being socially isolated or lonely in each country are not more likely than their peers to report using social media.
  • Despite fewer people in Japan reporting loneliness, reports of the severity of the experience are worse. Half of those experiencing loneliness in Japan (or 5 percent of residents of Japan overall) say it is a major problem for them, compared to a fifth of those experiencing loneliness in the U.S. and the U.K. In Japan, more than a third (35 percent) of those who self-identify as lonely say they have felt isolated or lonely for more than 10 years, compared to a fifth of those in the U.S. (22 percent) or the U.K. (20 percent). Half of those reporting loneliness in Japan report dissatisfaction with their family life or employment situation and two thirds say the same about their financial situation. Higher shares in Japan than in the U.S. or U.K. say their loneliness has had a negative impact on their job and their mental health. Many people reporting loneliness in Japan are younger — nearly six in ten are less than 50 years old, compared to 42 percent who don’t report loneliness. People in Japan experiencing loneliness are also much more likely to be dissatisfied with the number of meaningful connections they have with friends. More generally, large majorities in Japan think the Japanese concepts of Hikikomori and Kodokishi are serious problems.

Key Findings: Section 1: Characteristics And Experiences Of Those Who Report Often Feeling Lonely Or Socially Isolated

Prevalence of Loneliness and Social Isolation

Consequences of loneliness: Many Americans who always or often feel lonely say it affects their physical and mental health, relationships and work, per @KaiserFamFound survey w/@Economist

More than a fifth of adults in the U.S. (22 percent) and the U.K. (23 percent) say they often or always feel lonely, feel that they lack companionship, feel left out, or feel isolated from others, about twice the share in Japan (nine percent), referred to here as those reporting loneliness or social isolation. Not everyone experiences loneliness and social isolation the same way and some do not see it as a problem for them; however, most of those reporting loneliness across the U.S., the U.K., and Japan do. About one in twenty across countries say their loneliness is a “major” problem for them. In the U.S. and the U.K. there are more saying it is a minor problem or not really a problem for them, whereas in Japan, most people who report feeling lonely say it is a major problem for them.
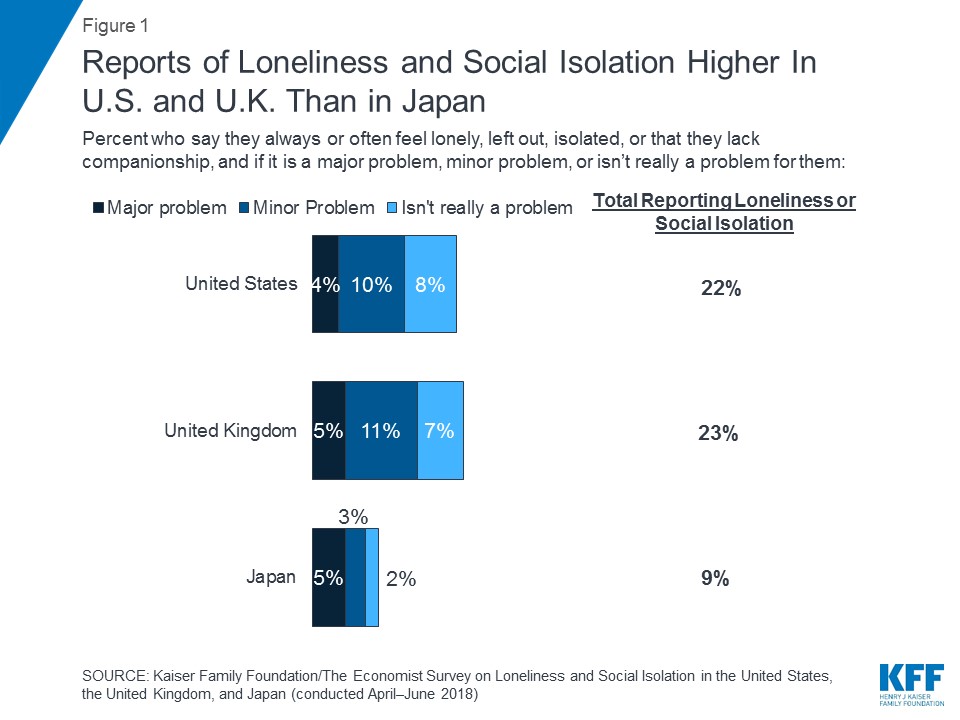
Figure 1: Reports of Loneliness and Social Isolation Higher in U.S. and U.K. Than in Japan

There are considerable differences in the share reporting loneliness or social isolation across a number of different demographics and life circumstances. The groups of people who are most likely to report being lonely or socially isolated include people who say they have few confidants, have mental health conditions, have a debilitating chronic illness or disability, are lower income, and are single, divorced, widowed, or separated. Each of these is discussed in more depth throughout this section.
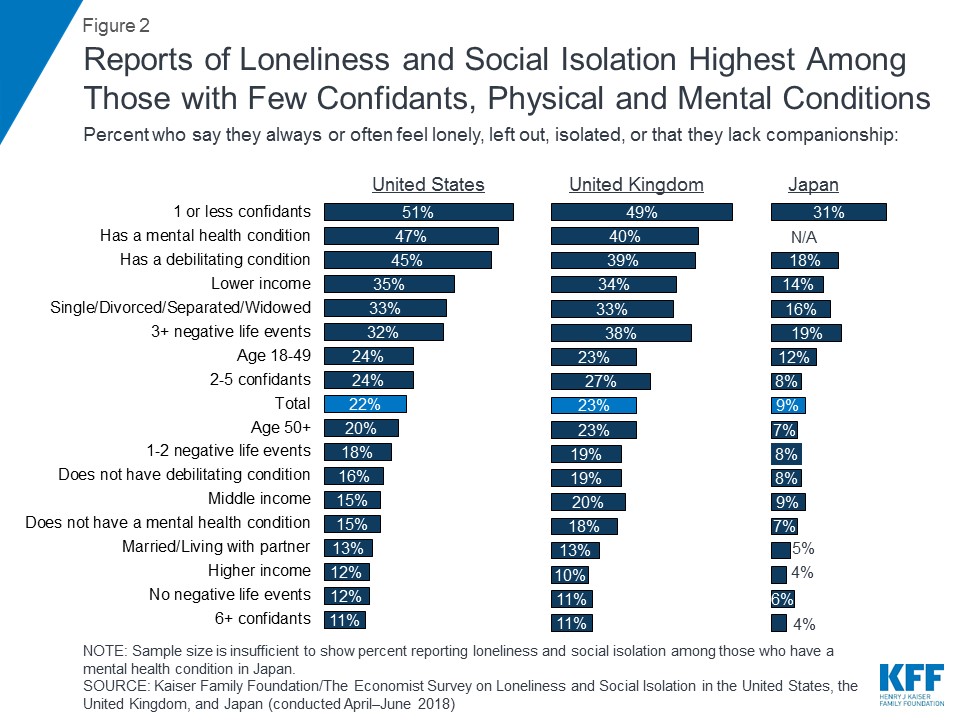
Figure 2: Reports of Loneliness and Social Isolation Highest Among Those with Few Confidants, Physical and Mental Conditions

Personal Characteristics of Adults Reporting Loneliness

Looked at another way, comparing the demographic profiles of those who report loneliness and those who do not can provide insights into the circumstances of those experiencing loneliness. For example, while loneliness is often thought of as a problem mainly affecting the elderly, majorities of people reporting loneliness across countries are younger than 50. In addition, those who report loneliness or social isolation are more likely than others to report lower incomes and not being married.

Table 1: Demographics of those reporting loneliness
 United StatesUnited KingdomJapan
 LonelyNot LonelyLonelyNot LonelyLonelyNot Lonely
Age
18-49 NET59%52%56%55%57%42%
18-29242125211912
30-49353130343730
50+ NET414844454358
50-64252619232323
65+162125222136
Gender
Male445045505451
Female565055504649
Income
Lower Income583149294730
Middle Income213418212931
Higher income112510281126
Education
High school or less/secondary or less473735306362
Some college/ post-secondary/junior college353041391415
College/university or more173321311920
Employment status
Employed full time334925433546
Employed part time131514151614
Unemployed (NET)1441452211
Other (NET)403147362529
Marital status
Single, that is never married322332234219
Single, living with a partner71071422
Married224822433060
Divorced/Separated26102311148
Widowed1171481210

Reports of physical and mental health conditions are much more common among those experiencing loneliness than others. For example, across the three countries, people reporting loneliness are at least two times as likely as others to report having a debilitating disability or chronic disease that keeps them from fully participating in daily activities or to say they have been told by a medical professional that they have a serious mental health condition. And, while loneliness and social isolation may be perceived to be more often associated with mental health issues, those experiencing loneliness are almost as likely to report debilitating disabilities or chronic diseases as they are to report having a serious mental health condition.
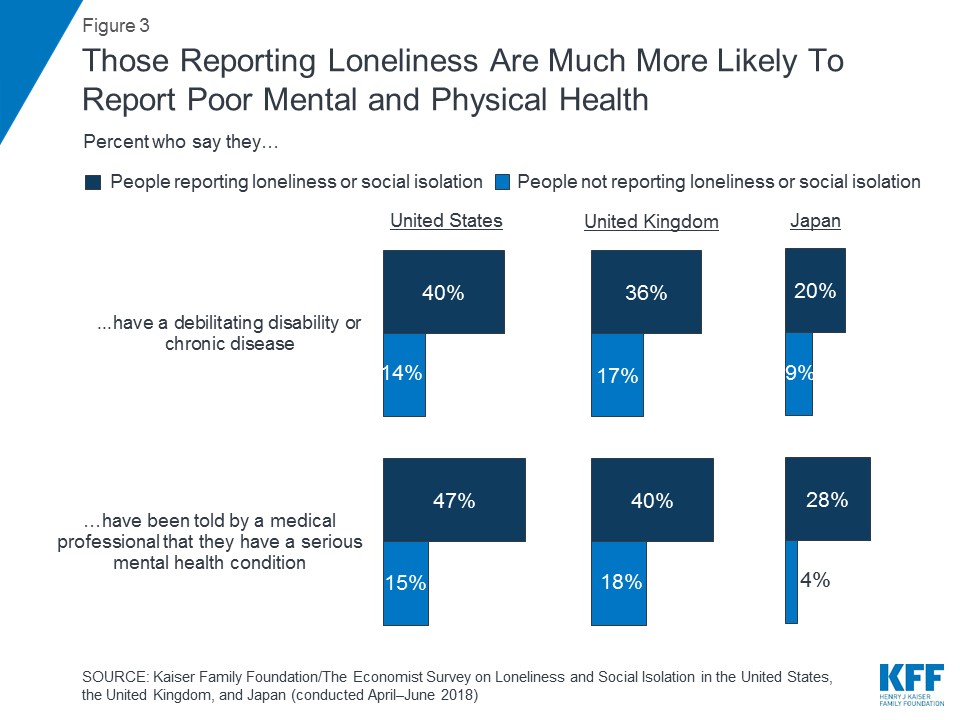
Figure 3: Those Reporting Loneliness Are Much More Likely to Report Poor Mental and Physical Health

Reported Causes of Loneliness and Negative Life Events

Loneliness appears to occur in parallel with reports of real life problems and circumstances. Across countries, about six in ten say there is a specific cause of their loneliness, but when asked what the specific cause is, the responses vary considerably. More than one in ten say the death of a significant other, parent, or other person caused their feelings of loneliness, while others say physical health problems (12 percent in U.S., eight percent in the U.K. and in Japan). Fewer say things like divorce, being away from family, or mental health problems are the specific causes of loneliness.

Figure 4: Death of Loved One, Health Problems Top Reasons for Loneliness Among U.S., U.K., Japan

Some negative life events may exacerbate or put people at risk for feelings of loneliness and the findings show that loneliness is associated with real life challenges. For example, compared to others, people who report feeling lonely are much more likely to say they have experienced a negative change in financial status, a change in living situation, a serious injury or illness personally, or loss of a job in the past two years.

Table 2: Reports of Negative Life Events
United StatesUnited KingdomJapan
Percent who say that in the past two years, they have experienced …LonelyNot LonelyLonelyNot LonelyLonelyNot Lonely
The death of a close family member or friend59%50%53%45%34%36%
A change in living situation463442293828
A negative change in financial status472241223918
A serious illness or injury in their family474239322119
A serious illness or injury themselves371836182814
A loss of a job27161711289
A death of a spouse or partner11412554
Marital separation or divorce12411232
Yes to any of the above918189757967

Roughly half of those in the U.S. and the U.K. and two-thirds of those in Japan say they have felt lonely or isolated from those around them for at least three years. In Japan, more than a third (35 percent) say they have felt isolated or lonely for more than 10 years, compared to a fifth of those in the U.S. (22 percent) or the U.K. (20 percent).

Figure 5: One-Third of People In Japan Say They Have Experienced Loneliness for More Than 10 Years

Impacts of Loneliness and Social Isolation

Substantial shares across the three countries report that loneliness has had a negative impact on their lives. In Japan, majorities say loneliness has had a negative impact on their mental health (75 percent), physical health (63 percent), and personal relationships (59 percent), and nearly half say it’s had a negative impact on their ability to do their job (47 percent). In the U.S. and U.K., many say their loneliness has had a negative impact on their mental health (58 percent and 60 percent, respectively) and about half say it’s had a negative impact on their personal relationships (49 percent and 55 percent) and their physical health (55 percent and 49 percent). In terms of their ability to do their job, about a third in the U.S. and the U.K. say their loneliness has had a negative impact.

Figure 6: Across Countries, Many Say Loneliness Has Had a Negative Impact on Relationships, Mental and Physical Health

Likely stemming in part from the relatively high reports of mental health issues and negative mental health impacts of loneliness, about three in ten people experiencing loneliness in each country say it has led them to think about harming themselves – 31 percent in U.S., 30 percent in U.K., and 33 percent in Japan. Fewer say it has led them to think about committing a violent act – 15 percent in the U.S., 9 percent in the U.K., and 17 percent in Japan.

Figure 7: Three in Ten of Those Reporting Loneliness or Social Isolation Say It Has Led Them to Think About Self-Harm

In addition to the specific impacts of loneliness, those reporting loneliness or isolation are much more likely to express general dissatisfaction with a number of different life domains, particularly when it comes to personal finances or employment, but also in housing and family life.

Figure 8: Those Experiencing Loneliness Are Much More Likely To Report Being Dissatisfied In a Number of Life Domains

Social Interactions and Loneliness

Across countries, people experiencing loneliness are much more likely than others to say they have “just a few” or “no” people nearby they can rely on for help or support.

Figure 9: Large Majorities of Those Reporting Loneliness or Social Isolation Say They Have Few People They Can Rely On

Specifically when it comes to the number of confidants people have with whom they can discuss personal matters, those who report feelings of loneliness and social isolation report having fewer confidants than others. For example, in the U.K., 11 percent of adults who report feeling lonely or socially isolated say they have no one with whom they can discuss things that are personally important to them and another 33 percent say they have one or two confidants, compared with 1 and 13 percent for others in the U.K.
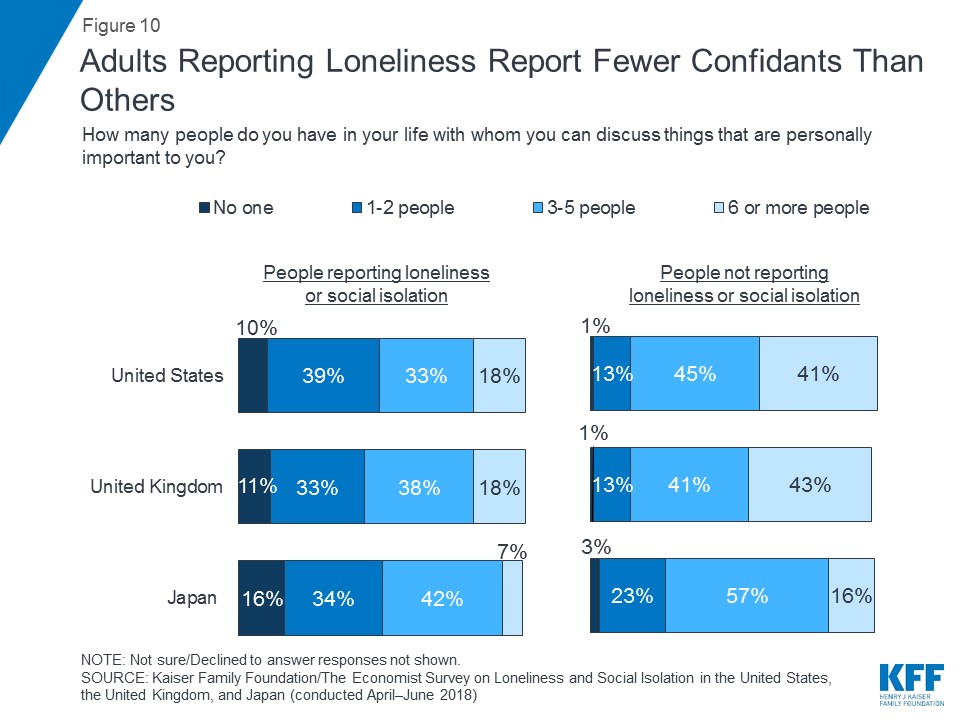
Figure 10: Adults Reporting Loneliness Report Fewer Confidants Than Others

And, more generally, across the three countries, those reporting loneliness are more likely to be dissatisfied with the number of meaningful connections they have with neighbors, family members and friends.

While some experiencing loneliness may be dissatisfied with the number of meaningful connections they have or have few confidants, many (roughly half or more) in the U.S. and the U.K. report talking to family or friends at least a few times a week either in person or over the phone. In Japan, it appears to be much less common to talk with family members frequently and roughly a fifth of those experiencing loneliness say they are in contact with family members in person or over the phone at least a few times a week. In each country, those who are lonely generally report communicating with friends and family less frequently than those who don’t report loneliness.

Table 3: Frequency of Communication With Family and Friends
 United StatesUnited KingdomJapan
 LonelyNot LonelyLonelyNot lonelyLonelyNot lonely
Talk to family members at least a few times a week…
…in person48%59%59%69%17%27%
…over the phone577166751928
…through email, text, or social media466250622028
Talk to friends at least a few times a week…
…in person577460732527
…over the phone576248581323
…through email, text, or social media616654663434

Coping with Loneliness

There are a number of different ways people may cope with loneliness, some more positive than others. Across countries, the most commonly reported coping mechanisms were distracting oneself with television, or computer or video games and reliving memories from the past, with about seven in ten or more saying they almost always or sometimes do these things when they feel lonely. Majorities report talking to a friend or relative, browsing the internet or social media sites or exercising. On the more negative side, across countries, four in ten say they overeat at least sometimes when feeling lonely, a third or more say they at least sometimes smoke cigarettes or use other tobacco products when feeling lonely, and two in ten say they at least sometimes abuse alcohol or drugs.
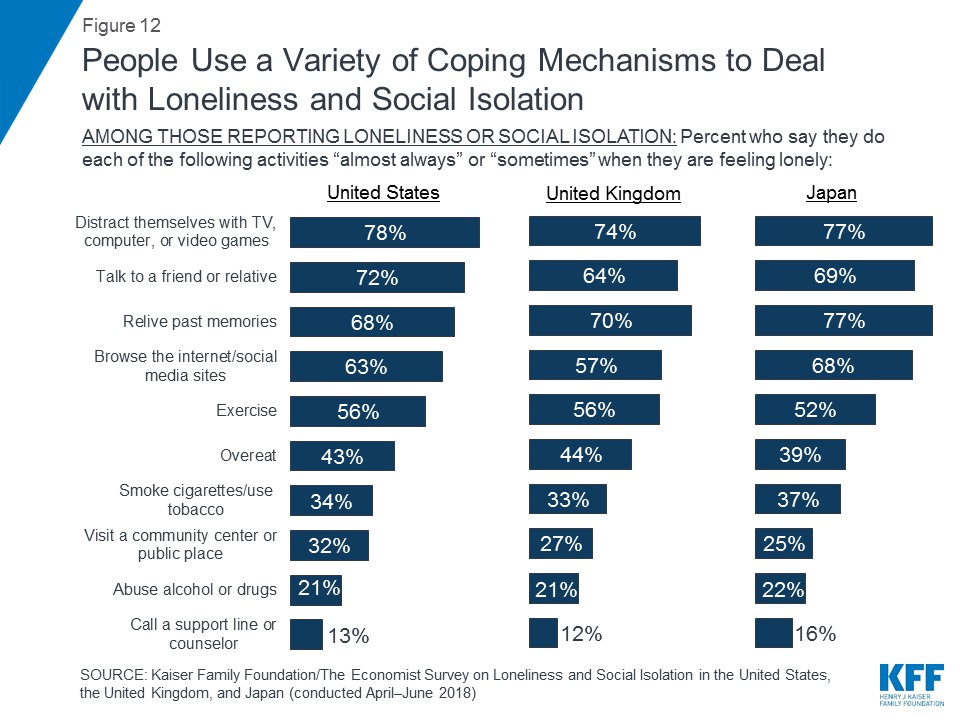
Figure 12: People Use a Variety of Coping Mechanisms to Deal with Loneliness and Social Isolation

Across countries, majorities say they have talked to someone about their feelings of loneliness, but still others say they haven’t talked to anyone about it. Most commonly, they report talking to a close friend or family member, but some report talking to a doctor or other health professional, a mental health professional, or a religious or spiritual advisor.
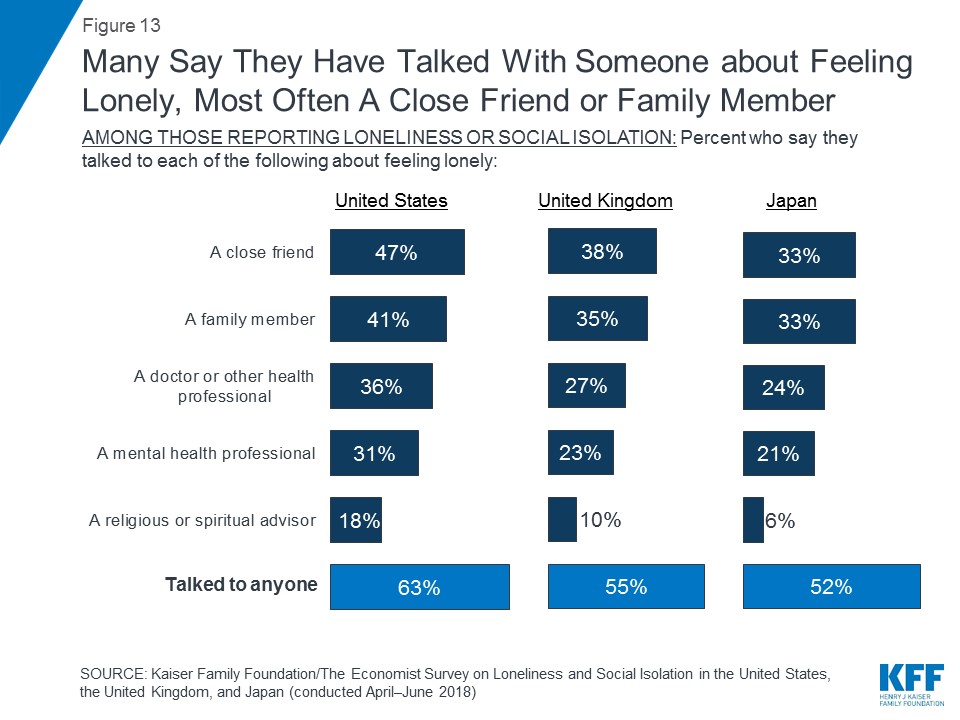
Figure 13: Many Say They Have Talked with Someone about Feeling Lonely, Most Often A Close Friend or Family Member

Key Findings: Section 2: The Public’s Perceptions Of Loneliness And Social Isolation

Awareness and Views of the Issue

Across the U.S., the U.K., and Japan, majorities say they have heard “a lot” or “some” about the issue of loneliness and social isolation in their country. Not surprisingly given recent efforts by the U.K. government to address the issue, visibility is highest in the U.K. with two-thirds (67 percent) saying they’ve heard at least something about it, followed by 58 percent in Japan and 51 percent in the U.S. In the U.K., where a new minister for loneliness was appointed earlier this year, three in ten say they have heard or read “a lot” or “some” about recent efforts by the British government to address loneliness in the U.K. Another third say they’ve heard or read “only a little” and another third say they’ve heard “nothing at all.”

Figure 14: Visibility of Loneliness and Social Isolation Higher in the U.K. than the U.S. or Japan

Who do people think of as being lonely? The most frequent answer is older people, with nearly three quarters of people in the U.K. (73 percent) and about half in the U.S. (49 percent) and Japan (46 percent) volunteering this group in an open-ended question. About four in ten people in Japan (43 percent) say when they think about people in Japan who are lonely, they think of people who live alone or are introverts, and nearly a fifth in the U.K. and the U.S. say the same. Additionally, about a fifth of adults in the U.S. and U.K. say they think of children, teenagers or young adults when they think of people who are lonely, compared to just six percent in Japan.

Across countries, views vary as to whether loneliness is more of a public health problem or more of an individual problem. In the U.K., and to a lesser extent Japan, more say it is more of a public health problem than say it is more of an individual problem (66 percent vs. 27 percent in the U.K. and 52 percent vs. 41 percent in Japan), whereas Americans are divided (47 percent vs. 45 percent).

Figure 15: People in the U.K. and Japan More Often Say Loneliness is a Public Health Problem than an Individual Problem

Japan has unique terms for two specific conditions related to loneliness. One is Hikikomori, or the acute social withdrawal of adolescents and young adults, and the other is Kodokishi, which refers to the concept of dying alone. In Japan, eight in ten or more say that these are very or somewhat serious problems. Those reporting loneliness in Japan are more likely than others to say Hikikomori and Kodokishi are “very” serious problems (43 percent vs. 31 percent and 60 percent vs. 40 percent, respectively).

Figure 16: Most People in Japan View Hikikomori and Kodokishi as Serious Problems

Across countries, large majorities of people say individuals and families should play a major role in helping to reduce loneliness and social isolation in society today. However, just about a quarter of Americans (27 percent) say the government should play a major role, whereas six in ten people in the U.K. (63 percent) and Japan (62 percent) see a major role for the government. Instead, more Americans see a major role for churches and other religious institutions (61 percent) than in the U.K. (42 percent) and Japan (16 percent).

Figure 17: U.S. Public Least Likely to See a Role for Government in Helping to Reduce Loneliness

Perceptions of Reasons for Loneliness

When asked how much responsibility individuals bear for their own loneliness, over half of Americans (54 percent) and seven in ten British people (72 percent) say a person’s loneliness is usually due to factors and circumstances beyond their control, rather than saying they mostly have themselves to blame. The Japanese are more divided with similar shares saying lonely people mostly have themselves to blame and saying loneliness is due to factors out of their control (44 percent and 42 percent, respectively). However, among people experiencing loneliness in Japan, 57 percent say a person’s loneliness is due to factors beyond their control.

Figure 18: Most in the U.S. and the U.K. say Loneliness is Beyond an Individual’s Control, Views More Mixed in Japan

There are a number of different societal factors that may play a role in loneliness and social isolation and views of these potential reasons for loneliness differ across the U.S., U.K. and Japan. In one place of agreement, majorities across countries say that long-term unemployment is a major reason why people are lonely or socially isolated in their country. Much of the public in the U.S. and U.K. point to increased use of technology and adults playing less of a role in helping aging parents as major reasons, whereas fewer in Japan say the same. In addition, residents of the U.K. are more likely than those in the U.S. to say people moving away from where they grew up is a major reason for loneliness. Residents of the U.K. are also more likely than people in the U.S. or Japan to say cuts in government social programs is a major reason for loneliness. Views are similar regardless of whether or not someone reports personally experiencing loneliness or social isolation themselves.

Figure 19: Views of Potential Reasons for Loneliness Differ Across Countries

One striking difference across countries is in the shares saying “increased use of technology” is a major reason people are lonely or socially isolated – from 58 percent in the U.S., to 50 percent in the U.K. and 26 percent in Japan. When including “minor” reason, the shares in the U.S. (84 percent) and U.K. (86 percent) are similar, but in Japan, it is just over half (56 percent).

Figure 20: Large Shares in the U.S. and U.K. View the Increased Use of Technology as a Reason for Loneliness, Less So in Japan

Social Media and Loneliness

Social media consumption varies across the three countries from four in ten in Japan saying they use it, including 23 percent who say they use it every day, to 69 percent in the U.S. and 67 percent in the U.K., including nearly half in the U.S. and U.K. who say they use it every day, some of them for hours a day.
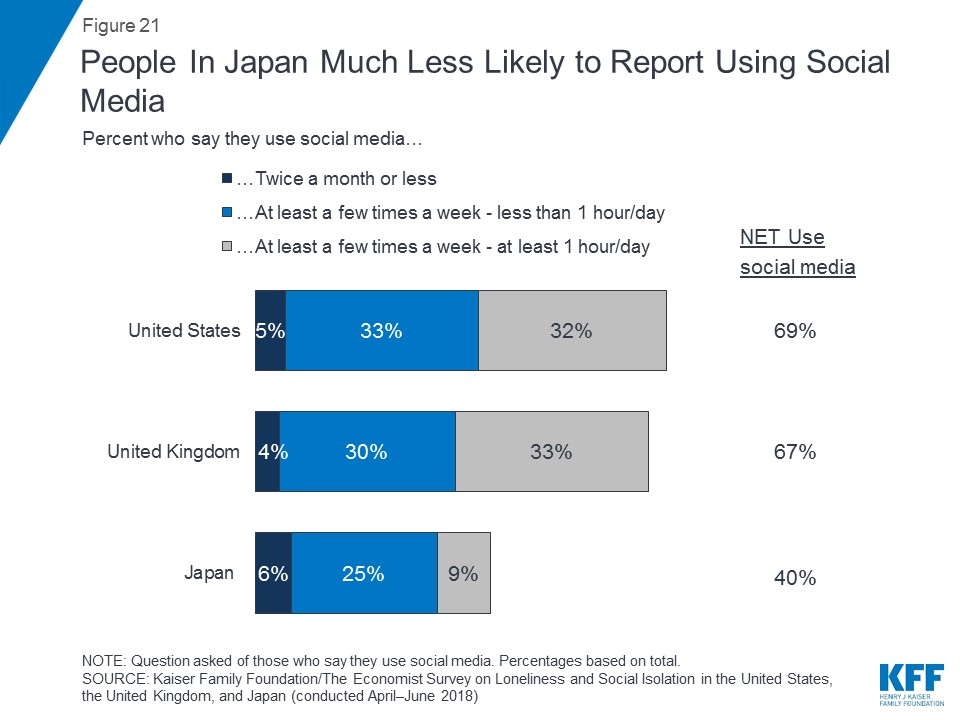
Figure 21: People In Japan Much Less Likely to Report Using Social Media

While most Americans view increased technology use as a major reason why people feel lonely/isolated, those who always or often feel that way are divided on social media’s impact

For the most part, people who report being socially isolated or lonely in each country are not more likely than their peers to report using social media. However, those experiencing loneliness in the U.S. and Japan are more likely than others to say they use social media for 2 hours or more per day (22 percent vs. 12 percent in the U.S. and 11 percent vs. 4 percent in Japan).

Figure 22: In U.S. and Japan, A Larger Share of Those Experiencing Loneliness Use Social Media for Two or More Hours Per Day

In each country, more of the public overall says that they think their ability to connect with others in a meaningful way is strengthened by social media than say it is weakened. However, those who are experiencing loneliness are more divided.
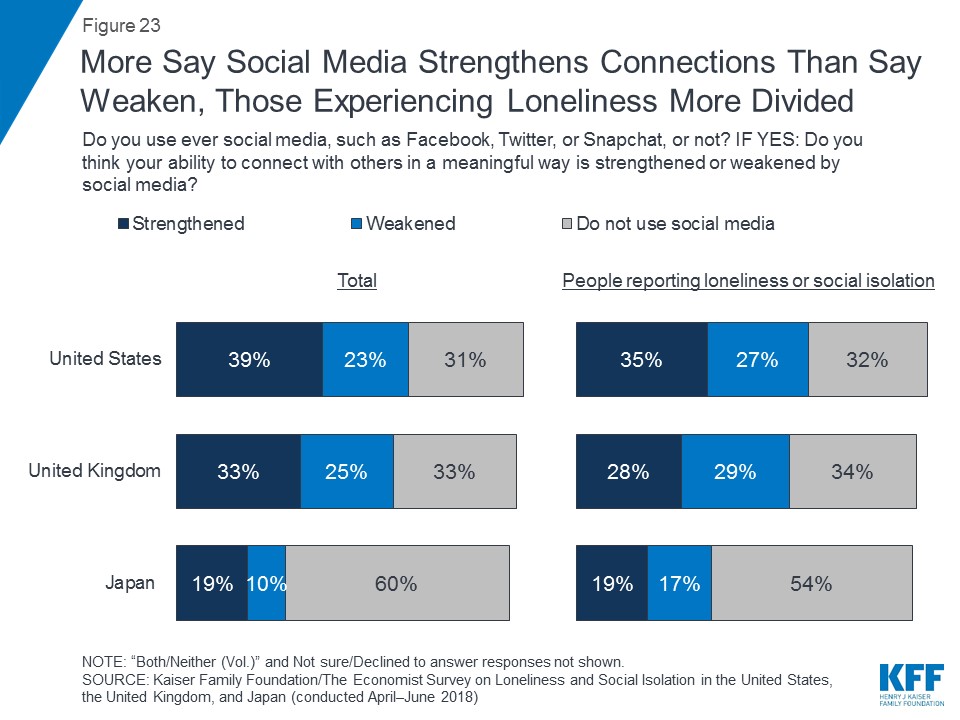
Figure 23: More Say Social Media Strengthens Connections Than Say Weaken, Those Experiencing Loneliness More Divided

On the question of whether one’s personal feelings of loneliness are made better or worse by social media, roughly similar shares of those experiencing loneliness in the U.S., U.K., and Japan say better or say worse.

Figure 24: Those Reporting Loneliness Roughly Split on Whether Social Media Improves or Worsens Feelings

Most people in the U.S. and U.K. say that after interacting with a friend online they’re as satisfied as they would be after interacting with a friend on the phone. Still more say they feel less satisfied with this type of interaction than say they leave more satisfied. In Japan, views are more mixed with similar shares saying they they’re less satisfied (32 percent) as saying they’re equally satisfied (31 percent) when interacting via phone compared to online. However, when comparing an online interaction to an in-person interaction, across countries about four in ten say they’re less satisfied after interacting online, while fewer say they’re equally satisfied or more satisfied.

Figure 25: Across Countries Few Say They’re More Satisfied with Online Interactions than Those by Phone or In-Person

More broadly, across countries, more say technology in general has made it harder to spend time with friends and family in person than say it has made it easier. A third or more say it hasn’t made a difference. People experiencing loneliness or social isolation in the U.K. or Japan are more likely than others to say technology has made it harder to spend time with family and friends. In the U.S., shares are similar for those who are experiencing loneliness and those who aren’t.
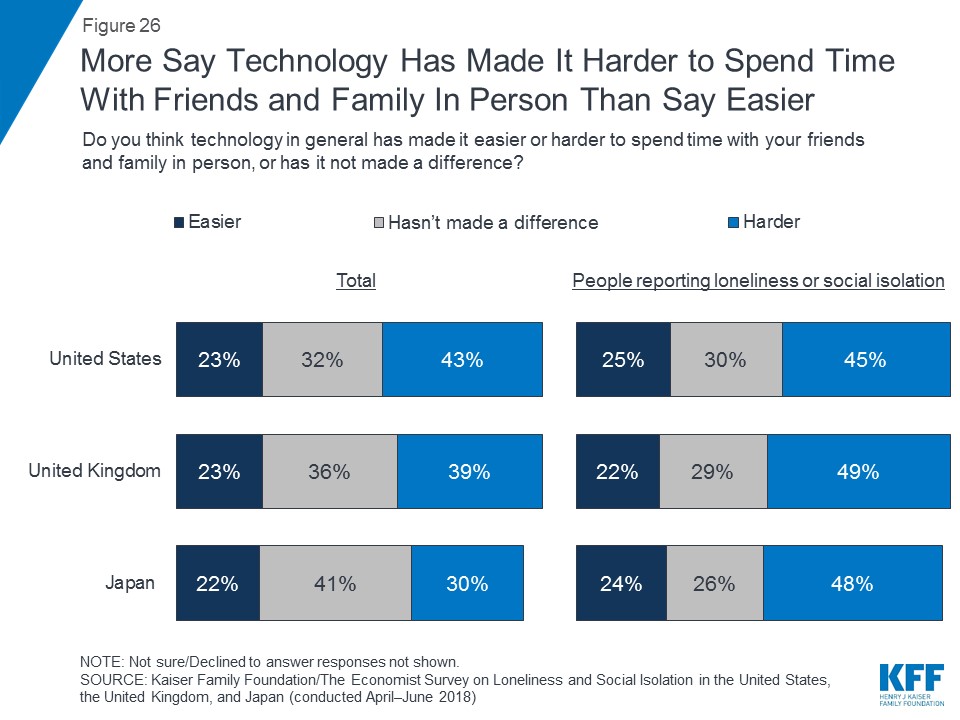
Figure 26: More Say Technology Has Made It Harder to Spend Time with Friends and Family In Person Than Say Easier

Methodology

The Kaiser Family Foundation/The Economist Loneliness and Social Isolation in the United States, the United Kingdom, and Japan: An International Survey was conducted among nationally representative random digit dial (RDD) telephone (landline and cell phone) samples of adults ages 18 and older, living in the United States (including Alaska and Hawaii), in the United Kingdom, and Japan (note: persons without a telephone could not be included in the random selection process). SSRS carried out the sampling and weighting for all countries, and conducted computer-assisted telephone interviews for the U.S. sample. Interviews in the U.K. were carried out by GDCC and interviews in Japan were carried out by Adams Communications, under the direction of SSRS. RDD landline and cell phone samples were provided by Marketing Systems Group (MSG) for the U.S., Sample Solutions Europe (SSE) for the U.K., and Adams Communications for Japan. Interview languages, field dates, and sample sizes for each country are shown in the table below. Teams from The Economist and the Kaiser Family Foundation worked together to develop the survey questionnaire and analyze the data. The Kaiser Family Foundation paid for the fieldwork costs associated with the survey. Each organization is responsible for its content.

CountryField DatesLanguage(s)Total sample size (unweighted)Cell phone sampleLandline sample
United StatesApril 18-May 23, 2018English and Spanish1,003720283
United KingdomApril 18-May 23, 2018English1,002503499
JapanApril 18-June 4, 2018Japanese1,000635365

Due to the multi-national design, the questionnaire was tested and translated in multiple stages. The first step involved a live-interview telephone pretest of the English questionnaire with U.S. and U.K. respondents. Revisions to the English questionnaire were made following the pretest in order to shorten the survey instrument and improve respondent comprehension of questions. Following the English pretest, the questionnaire was translated into Spanish (for interviewing in the U.S.) and Japanese. Translations were reviewed by a team of professional translators. A second pretest was conducted in Japan after which further revisions were made to the questionnaire.

In order to better understand the views and experiences of those personally experiencing loneliness or social isolation, the full sample includes additional interviews with people who say they “always” or “often” feel lonely, that they lack companionship, isolated, or left out (commonly referred to as an “oversample”). For brevity, throughout this report, this group is referred to as “lonely.” In order to complete at least 200 interviews in each country with adults meeting this definition, some interviews were only completed if the individual met the loneliness screening criteria. In the U.S., the SSRS Omnibus (weekly, RDD landline and cellular phone surveys of the general public) was used to identify respondents who qualified as lonely and then those individuals were re-contacted and re-screened for this survey. A total of 86 interviews in the U.S. were conducted with these pre-recruited individuals.

In each country, to randomly select a household member for the landline samples, respondents were selected by asking for the adult male or female currently at home who had the most recent birthday based on a random rotation. If no one of that gender was available, interviewers asked to speak with the adult of the opposite gender who had the most recent birthday. For the cell phone samples, interviews were conducted with the adult who answered the phone.

Multi-stage weighting processes were applied separately for each country to ensure an accurate representation of each country’s national adult population. The first stage of weighting involved corrections to account for the fact that respondents with both a landline and cell phone have a higher probability of selection as well as accounting for oversampling of lonely respondents, as well as non-response adjustment. The second weighting stage was designed to make demographic adjustments to the sample to match national population estimates. In the U.S., the sample was balanced to match known adult-population parameters using data from the Census Bureau’s 2016 American Community Survey (ACS) and phone use parameters from the January-June 2017 early release estimates for the National Health Interview Survey. The weighting parameters used for the U.S. were age, gender, education, race/ethnicity, census region, and telephone use. Population parameters for the U.K. were from the mid-2014 U.K. Census Update and included gender, age, educational attainment, and region as well as phone status (cell phone only or reachable by landline) from Q1 2015 Communications Market Report. Population parameters from Japan were from the Population Census of Japan 2010 and included gender, age, educational attainment, marital status and region. In the final weighting stage, the lonely oversample was weighted to reflect its actual share in the adult population for each country. All statistical tests of significance account for the effect of weighting.

At the end of the field period, SSRS completed several data validation processes on the international data that included: internal validity checks, testing for straightlining, and analyzing paradata (interviewer workload, interview length, interview time, and overlap of interviews). The Kaiser Family Foundation, along with SSRS, also conducted a percent-match procedure to identify cases that share a high-percentage of identical responses to a large set of questions. This extra validation measure allows for detection of possible duplicate data, whether as a result of intentional falsification, or due to errors in data-processing.

The margin of sampling error including the design effect for each country sample is shown in the table below. For results based on subgroups, the margin of sampling error will be higher; sample sizes and margins of sampling error for subgroups are available by request. Note that sampling error is only one of many potential sources of error in this or any other public opinion poll. Kaiser Family Foundation public opinion and survey research is a charter member of the Transparency Initiative of the American Association for Public Opinion Research.

CountryTotal sample size (unweighted)M.O.S.E
United States
Total1,003±3 percentage points
Total reporting loneliness or social isolation276±7 percentage points
United Kingdom
Total1,002±4 percentage points
Total reporting loneliness or social isolation261±4 percentage points
Japan
Total1,000±4 percentage points
Total reporting loneliness or social isolation200±9 percentage points
News Release

New Analysis Maps Prevalence of Pre-Existing Conditions by Metro Area

In Some Areas, Nearly 4 in 10 Adults Would Likely Be Denied Individual Insurance Coverage Based on Pre-ACA Guidelines Or Under Short-Term Plans

Published: Aug 28, 2018

A new Kaiser Family Foundation analysis maps rates of pre-existing conditions across 129 metropolitan and micropolitan areas in the U.S., finding that even within the same state, the prevalence of such conditions can vary substantially.

For example, 34 percent of residents of Florence, South Carolina have a pre-existing condition, but further south in Charleston and Hilton Head, the rate is 24 percent.

The share of non-elderly adults with a pre-existing condition ranges from 41 percent in Kingsport, Tennessee to 20 percent in Logan, Utah and Rochester, Minnesota.

A previous KFF analysis showed that nationwide, 27 percent of adults age 18-64 have a pre-existing condition that would have led to a denial of individual market insurance coverage prior to the ACA. Since 2014, the law has prohibited individual market insurers from denying coverage due to a current or past diagnosis of a so-called “declinable medical condition,” such as cancer, diabetes, heart disease, or pregnancy.

While many people with pre-existing conditions obtain health insurance through an employer or through a public coverage option like Medicaid, these new estimates suggest that in some areas, many adults would be ineligible for individual market insurance under pre-ACA medical underwriting practices if they were to lose their current coverage.

The Trump administration has continued to pursue policy changes that would weaken protections for people with pre-existing conditions, including expanding the availability of short-term insurance plans, which are exempt from ACA-required coverage requirements, including guaranteed access to insurance for people with pre-existing conditions. Several states have responded with legislation restricting or effectively banning such plans.

The ACA is also being challenged in court by a group of state attorneys general who argue that the individual mandate is unconstitutional, and the law should therefore be overturned. The Trump administration has filed a brief in the case agreeing that the individual mandate is unconstitutional, and arguing that the ACA’s pre-existing condition protections should be invalidated.

Mapping Pre-existing Conditions across the U.S.

Authors: Rachel Fehr, Anthony Damico, Larry Levitt, Gary Claxton, Cynthia Cox, and Karen Pollitz
Published: Aug 28, 2018

The future of protections for people with pre-existing conditions has once again become a focus of debate following recent legal and policy developments.

The Affordable Care Act (ACA) contained a number of new rules related to pre-existing conditions, including:

  • Guaranteed access to insurance in the individual market regardless of health. Previously, insurers typically used medical underwriting to deny coverage to people with pre-existing conditions, and also excluded coverage of any pre-existing conditions for people who were accepted.
  • Community rating in the individual and small business markets, prohibiting insurers from varying premiums based on people’s health, which was common before the ACA.
  • Required coverage of essential benefits. Prior to the ACA, insurers in the individual market often excluded coverage of maternity, mental health, and substance abuse.

Congressional efforts to repeal and replace the ACA during 2017 would have weakened these protections. For example, the bill passed by the House would have allowed states to alter the essential benefit requirement and waive community rating for people with gaps in coverage. The so-called Graham-Cassidy-Heller-Johnson bill drafted in the Senate would have allowed states to determine what factors insurers could use in setting rates, except for gender and genetic information, and also let states change the essential benefits.

While those repeal efforts failed, changes pursued by the Trump administration through regulation and the courts have implications for people with pre-existing conditions. For example:

  • New regulations would expand the availability of short-term insurance plans, which are not required to follow any of the ACA’s requirements, including guaranteed access for people with pre-existing conditions, community rating, or coverage of essential benefits. By siphoning off healthier people, these short-term plans would leave ACA-compliant plans in the individual market with a sicker pool and higher premiums. While people eligible for ACA premium subsidies would be protected from those higher premiums, those with pre-existing conditions and incomes too high to qualify for the subsidies will see higher premiums.
  • A group of state attorneys general has filed a lawsuit arguing that the ACA should be thrown out. The case argues that the ACA’s individual mandate – which was previously upheld by the Supreme Court based on the federal government’s power to tax – is unconstitutional now that Congress has set the tax penalty associated with the mandate to zero. According to the suit, the rest of the ACA is not severable from the mandate and should therefore be overturned. The Trump administration has filed a brief in the case agreeing that the individual mandate is unconstitutional, and that the ACA’s protections for pre-existing conditions should be invalidated along with it.

Polling by the Kaiser Family Foundation (KFF) finds that 64% of the public does not want the Supreme Court to overturn the ACA’s protections for people with pre-existing conditions, and that continuing those protections tops the list of health issues registered voters say they’ll consider in supporting candidates as the midterm election approaches.

Estimated Share of Adults with Pre-Existing Conditions by Metropolitan or Micropolitan Statistical Area

We previously estimated using 2015 data from the Centers for Disease Control and Prevention that 27% of adults age 18-64 (52 million people) have a pre-existing condition that would have led to a denial of insurance in the individual market before the ACA. A larger share of nonelderly women (30%) than men (24%) have declinable preexisting conditions. The share of people with pre-existing conditions also varies by age, ranging from 15% for 18-24 year-olds to 47% for 60-64 year-olds.

The share of non-elderly adults with a declinable pre-existing condition ranges from one-third or more in some states (Kentucky, Alabama, Mississippi, and West Virginia) to 23% or less in others (Alaska, District of Columbia, New Jersey, Utah, Colorado, and Minnesota). Estimates for all states are available here.

New estimates show the variation in the prevalence of pre-existing conditions across communities in the U.S., with substantial differences within states in some cases.

The share of non-elderly adults with a declinable pre-existing condition ranges from 41% in Kingsport, Tennessee to 20% in Logan, Utah and Rochester, Minnesota. The prevalence of pre-existing conditions can vary by 10% or more between cities in the same state. For example, in Kansas 32% of Topeka’s population has a pre-existing condition, as compared to 21% of Manhattan’s population. Similarly, in South Carolina 34% of Florence residents have a pre-existing condition, compared to 24% in Charleston or Hilton Head.

Our estimates are based on a review of pre-ACA underwriting manuals used by insurers in the individual market. Medical conditions that commonly led to a decline of coverage are listed in Table 1.

Table 1: Examples of Declinable Conditions In the Medically Underwritten Individual Market, Before the Affordable Care Act
ConditionCondition
AIDS/HIVLupus
Alcohol abuse/ Drug abuse with recent treatmentMental disorders (severe, e.g. bipolar, eating disorder)
Alzheimer’s/dementiaMultiple sclerosis
Arthritis (rheumatoid), fibromyalgia, other inflammatory joint diseaseMuscular dystrophy
Cancer within some period of time (e.g. 10 years, often other than basal skin cancer)Obesity, severe
Cerebral palsyOrgan transplant
Congestive heart failureParaplegia
Coronary artery/heart disease, bypass surgeryParalysis
Crohn’s disease/ ulcerative colitisParkinson’s disease
Chronic obstructive pulmonary disease (COPD)/emphysemaPending surgery or hospitalization
Diabetes mellitusPneumocystic pneumonia
EpilepsyPregnancy or expectant parent
HemophiliaSleep apnea
Hepatitis (Hep C)Stroke
Kidney disease, renal failureTranssexualism
Source: Kaiser Family Foundation review of field underwriting guidelines from Aetna (GA, PA, and TX), Anthem BCBS (IN, KY, and OH), Assurant, CIGNA, Coventry, Dean Health, Golden Rule, Health Care Services Corporation (BCBS in IL, TX) HealthNet, Humana, United HealthCare, Wisconsin Physician Service.  Conditions in this table appeared on declinable conditions list in half or more of guides reviewed.

Note: Many additional, less-common disorders also appearing on most of the declinable conditions lists were omitted from this table.

While a large share of people with pre-existing conditions have coverage through an employer or public coverage where they do not face medical underwriting, our estimates quantify how many people could be ineligible for individual market insurance under pre-ACA practices if they were to ever lose their current coverage. The individual market is often a temporary source of insurance for people who are between jobs or too sick to work, so the ramifications of the lawsuit extend beyond the people who are currently purchasing individual coverage at any given point in time. Ours is a conservative estimate, as the survey data we used do not include sufficient detail on several conditions that would have been declinable before the ACA (such as HIV/AIDS, or hepatitis C). Additionally, millions more have other conditions that could lead to higher premiums rather than a denial of coverage if the ACA’s community rating requirement were eliminated.

Methods

This analysis of selected metropolitan and micropolitan statistical areas (MMSAs) extends our prior methodology to the CDC’s 2015 Behavioral Risk Factor Surveillance System (BRFSS) SMART City and County dataset. For a detailed description of our calculation of pre-existing conditions, see the Methods section of our previous analysis.1   Since the 2015 BRFSS SMART dataset includes only a subset of the U.S. population, we applied the Generalized Regression Estimator (GREG) scaling factors used to calibrate the nationwide 2015 BRFSS to the 2015 National Health Interview Survey (NHIS). The CDC’s National Center for Health Statistics (NCHS) relies on the medical condition modules of the annual NHIS for many of its core publications on the topic; therefore, we consider this survey to be the most accurate means to estimate both the nationwide rate and weighted population. After applying this calibration, we estimated pre-existing condition prevalence rates and population estimates for the 130 geographic areas with sufficient sample size.

The programming code, written using the statistical computing package R v.3.5.1, is available upon request for people interested in replicating this approach for their own analysis.

Endnotes

  1. Separately, we updated the nationwide analysis using 2016 survey data to check for any significant movement in the rate of pre-existing conditions. The more current year of microdata shows very similar results to our earlier analysis, with 26% of non-elderly adults having a declinable pre-existing condition, or 51 million people. ↩︎

Since 2007, total spending on the EpiPen in Medicare Part D has grown substantially – doubling between 2014 and 2016

Published: Aug 23, 2018

Source

KFF analysis of a five percent sample of Medicare prescription drug event claims from the CMS Chronic Conditions Data Warehouse, 2007-2016.

Community Health Centers’ Experiences in a More Mature ACA Market

Authors: Anne Markus, Jessica Sharac, Jennifer Tolbert, Sara Rosenbaum, and Julia Zur
Published: Aug 23, 2018

Executive Summary

Community health centers provide comprehensive primary care services in some of the most underserved communities in the nation. Four years following implementation of the ACA’s coverage expansions, health centers continue to play a central role in connecting consumers to expanded Medicaid and marketplace coverage even as they faced challenges during the 2018 marketplace open enrollment period because of the administration’s decision to shorten the enrollment period to six weeks, reduce advertising funding, and reduce federal Navigator funding. In addition, in response to improved financing from having more insured patients as well enhanced federal grant support under the ACA, health centers have also experienced significant growth in their service capacity. This brief summarizes findings from the Kaiser Family Foundation/Geiger Gibson Program in Community Health Policy 2018 Health Center Survey to provide a snapshot of health centers’ outreach and enrollment activities as well as changes in service capacity, and overall financial condition since implementation of the ACA. Key findings include:

  • Most health centers took steps to prepare for the shorter open enrollment period in effect in most states. Nearly four in five health centers took some action, including contacting consumers ahead of November 1st to inform them of the shortened enrollment period and increasing outreach activities.
  • The majority of health centers employed the same level of outreach and enrollment staff as last year and served about the same number or more people seeking enrollment assistance. Two-thirds of health centers indicated that the number of full time equivalent (FTE) paid enrollment assistance staff had stayed about the same since the last open enrollment period, but 21% said staffing had decreased. Despite arguments from policymakers that the need for in-person assistance would diminish, over seven in ten health centers reported serving the same number or more people seeking enrollment assistance during the most recent open enrollment period.
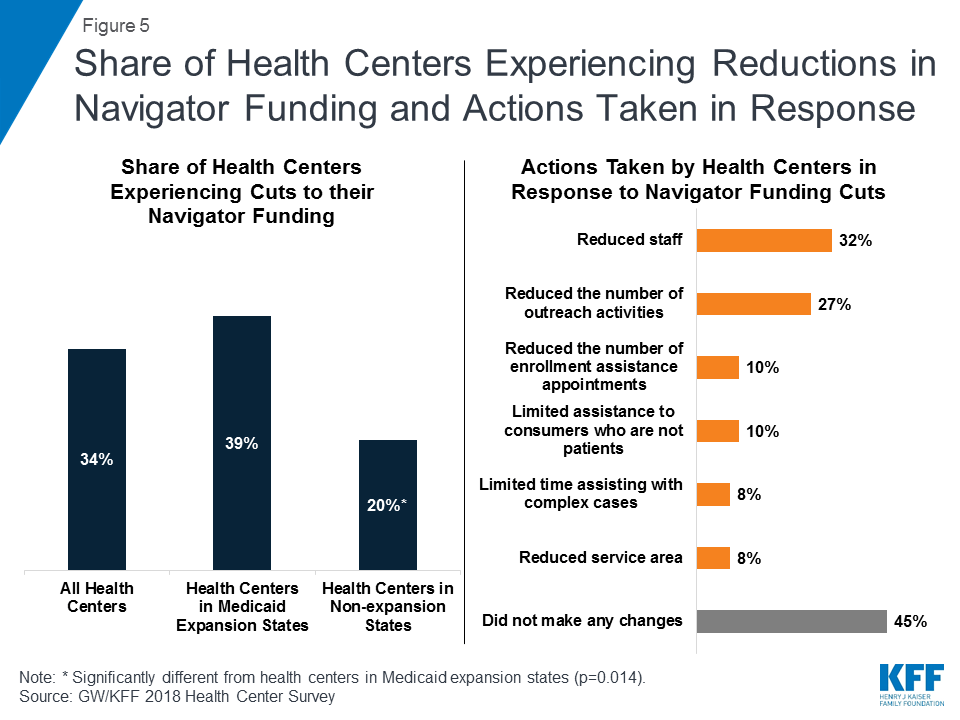
  • Many health centers received state or federal navigator funding and some experienced reductions in that funding. Funding for outreach and enrollment activities is included in the federal Section 330 grants health centers receive. In addition, about four in ten health centers reported receiving state or federal navigator funding in 2018. Of those, 34% said their funding had been cut compared to the previous year. In response to these funding cuts, nearly a third said they reduced staff and 27% reduced the number of outreach activities.
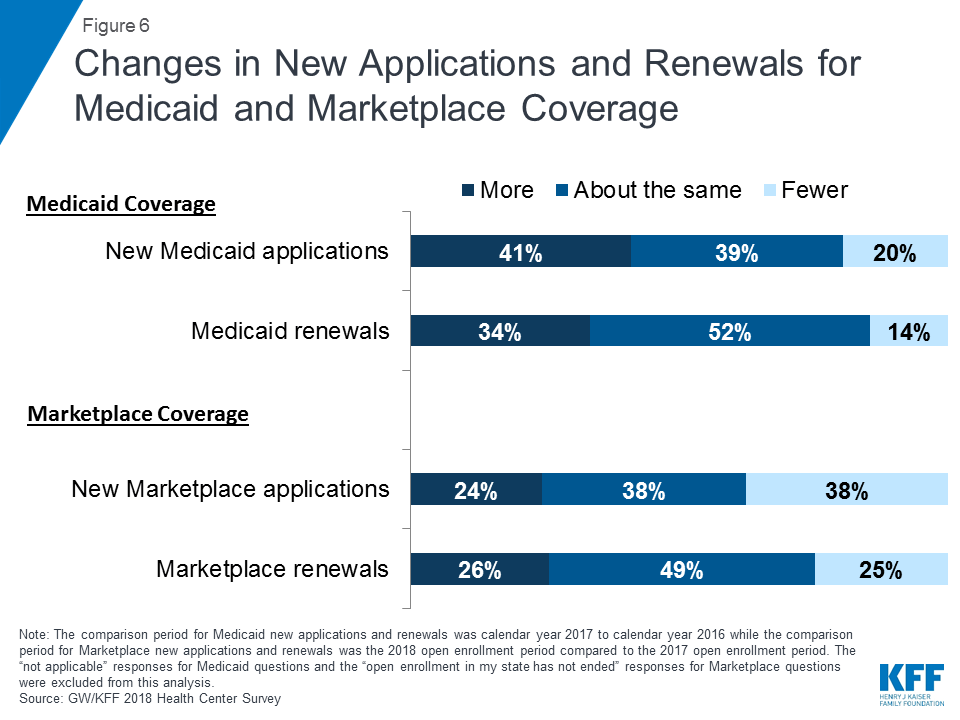
  • Health centers’ support for patients applying for Medicaid remained strong, while assistance with marketplace applications stayed about the same or decreased. Over four in ten health centers said they provided assistance for more new Medicaid applications in calendar year 2017 compared to 2016, and 34% said they helped with more Medicaid renewals. In contrast, less than a quarter of health centers said they helped with more new marketplace applications during the 2018 open enrollment period compared to the 2017 enrollment period, and only 26% said they assisted with more marketplace renewals.
  • Health centers are continuing to expand their services and staffing. The most commonly reported increases for services and staffing in the past year were for mental health services and staff, substance use disorder treatment services and staff, chronic care management services, and dental services and staff.
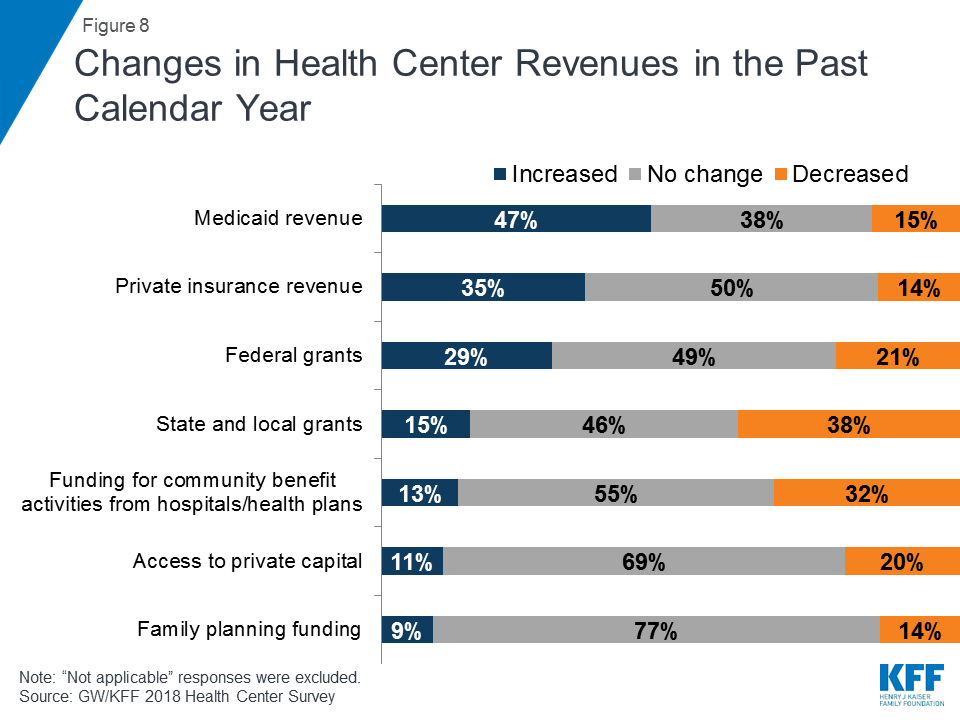
  • Most health centers experienced stable or improved financing from key revenue sources in the past year. Nearly half of health centers reported increases in their Medicaid revenue in the past year and an additional 38% reported that their Medicaid revenue did not change. Following the delay in reauthorizing the Community Health Center Fund in 2017, most health centers reported an increase or no change in their federal grant funding in the past year. Importantly, though, about 20% of health centers experienced a decrease in their federal grant funding.
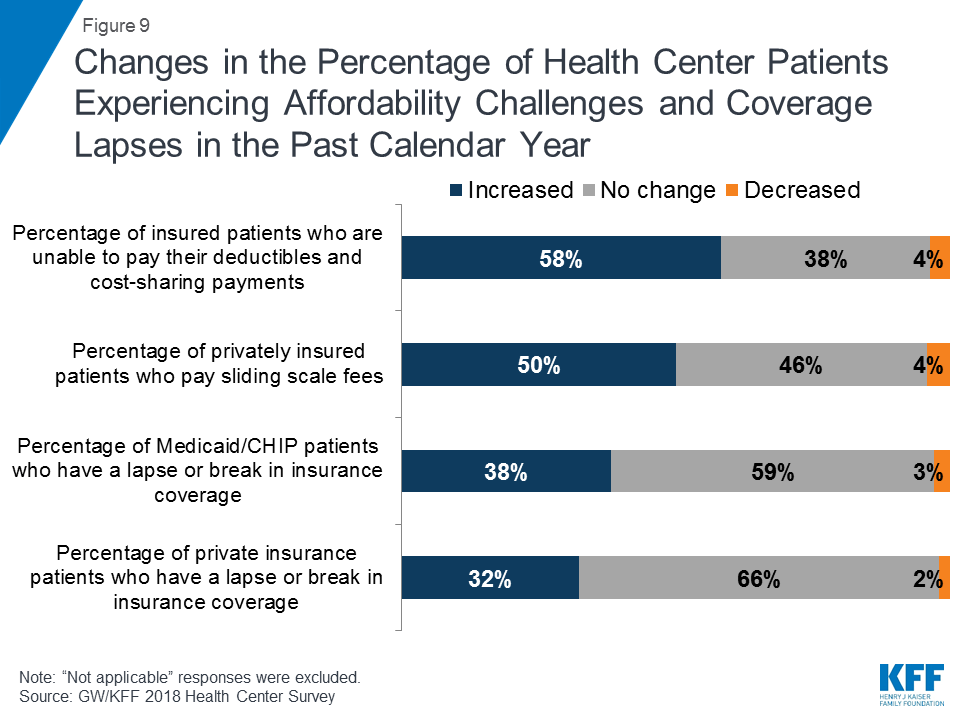
  • Health centers reported increasing financial pressure on privately insured patients and lapses in coverage for Medicaid and privately insured patients. More than half of health centers reported increases in insured patients who are unable to afford their cost-sharing payments and deductibles. Roughly a third of health centers reported that the percentage of privately insured and Medicaid/CHIP patients with lapses in coverage also increased compared to last year.
  • Workforce recruitment, inadequate physical space, and insufficient grant funding are top challenges for health centers. Workforce recruitment is a consistent challenge for health centers and was ranked as a top-three challenge by nearly six in ten health centers. Other commonly-reported top-three challenges were inadequate physical space (36%) and insufficient grant funding (32%) and, among health centers in non-expansion states, high numbers of uninsured patients (42%).

Issue Brief

Introduction

Community health centers provide comprehensive primary care services in some of the most underserved communities in the nation. In 2017, 1,373 health centers operated in over 11,000 sites and served nearly 27.2 million patients.1  Four years following implementation of the ACA’s coverage expansions, health centers continue to play a central role in connecting consumers to expanded Medicaid and marketplace coverage and have experienced significant growth in their service capacity. Assisting community members enroll in health insurance programs for which they may be eligible has long been a core feature of the health centers program.  Building on this commitment, health centers have been actively engaged in the outreach and enrollment efforts under the ACA. In addition, growing revenue associated with improved insurance coverage of health center patients combined with increased grant funding under the ACA, bolstered health centers’ overall financial capacity, enabling them to expand much needed services.2  At the same time, health centers face serious challenges that reflect the poverty and health risks that characterize their patients, challenges related to recruiting sufficient clinical and administrative staff into seriously medically underserved urban and rural communities, and reliance on  two key revenue sources – federal grant funding and Medicaid – that remain vulnerable to political and policy uncertainties.

Health centers faced particular challenges during the most recent open enrollment period. The open enrollment period was shortened in most states3  (ending on December 15, 2017 instead of January 31, 2018), although nine states that run their own marketplaces extended the open enrollment period beyond December 15, 2017.4  In addition, the administration cut the federal government’s advertising budget by 90%, halted Department of Health and Human Services (HHS) staff’s participation in local enrollment events, and reduced navigator grant funding by about 40% below FY 2017 levels.5  Despite these changes, marketplace enrollment fell only slightly to 11.8 million for the 2018 open enrollment period from 12.2 million in 2017.6  At the same time, the Administration’s reduced ACA enrollment efforts increased the importance of health centers’ longstanding’ outreach and enrollment activities that predated the ACA.

This issue brief presents findings from the Kaiser Family Foundation and Geiger Gibson Program in Community Health Policy 2018 Health Center Survey to describe health centers’ experiences under the ACA. It provides a snapshot of health centers’ outreach and enrollment activities for the 2018 open enrollment period, describes strategies that health centers implemented to respond to the shortened open enrollment period, and compares the experiences of health centers in Medicaid expansion and non-expansion states. This brief also describes findings on overall operational and financial capacity as well as ongoing challenges.

Findings

Health Center Experiences with Outreach and Enrollment

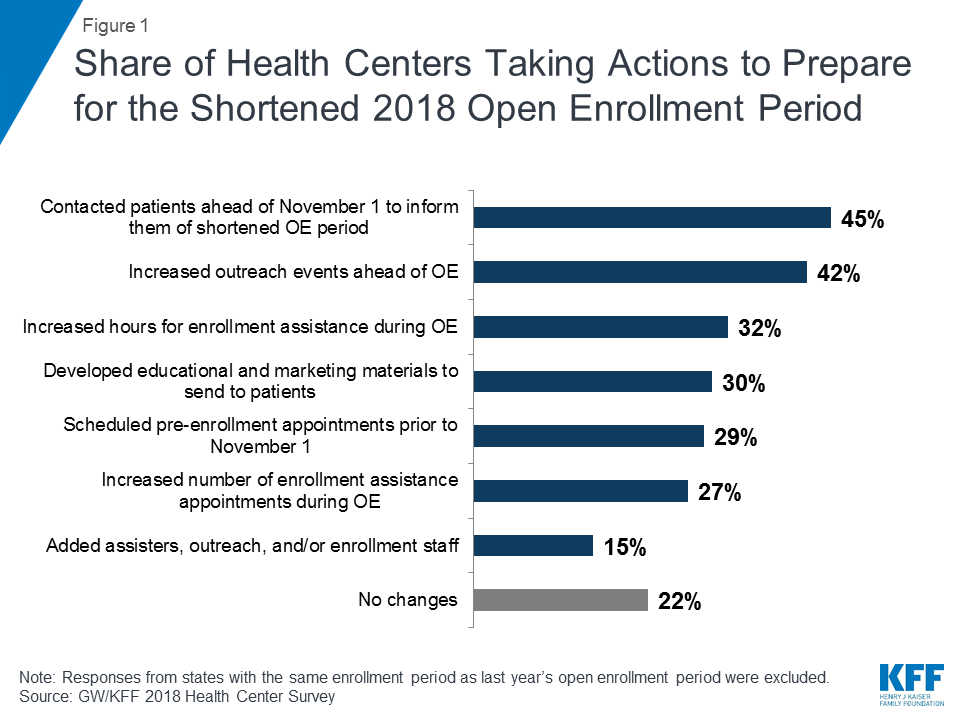
Most health centers took steps to prepare for the shorter open enrollment period in effect in most states. Nearly eight in ten health centers reported taking some action to help them serve the same number of clients as in past years in half as much time. The most common actions were contacting patients ahead of November 1st to inform them of the shortened open enrollment period (45%) and increasing outreach events ahead of open enrollment (42%) (Figure 1). Other actions included increasing hours during open enrollment (32%) and developing educational materials to send to patients (30%).  However, over 20% of health centers reported taking no actions in response to the shortened open enrollment period, and these health centers were located both in states that extended the open enrollment deadline beyond December 15th and in those that did not.

Figure 1: Share of Health Centers Taking Actions to Prepare for the Shortened 2018 Open Enrollment Period

Health centers in Medicaid non-expansion states were significantly more likely to reach out to consumers in advance of the open enrollment period to schedule pre-enrollment appointments (36% vs. 24%) and to contact patients to inform them of the shortened open enrollment period (52% vs. 40%). They were also more likely to add additional outreach and enrollment staff (20% vs. 11%),

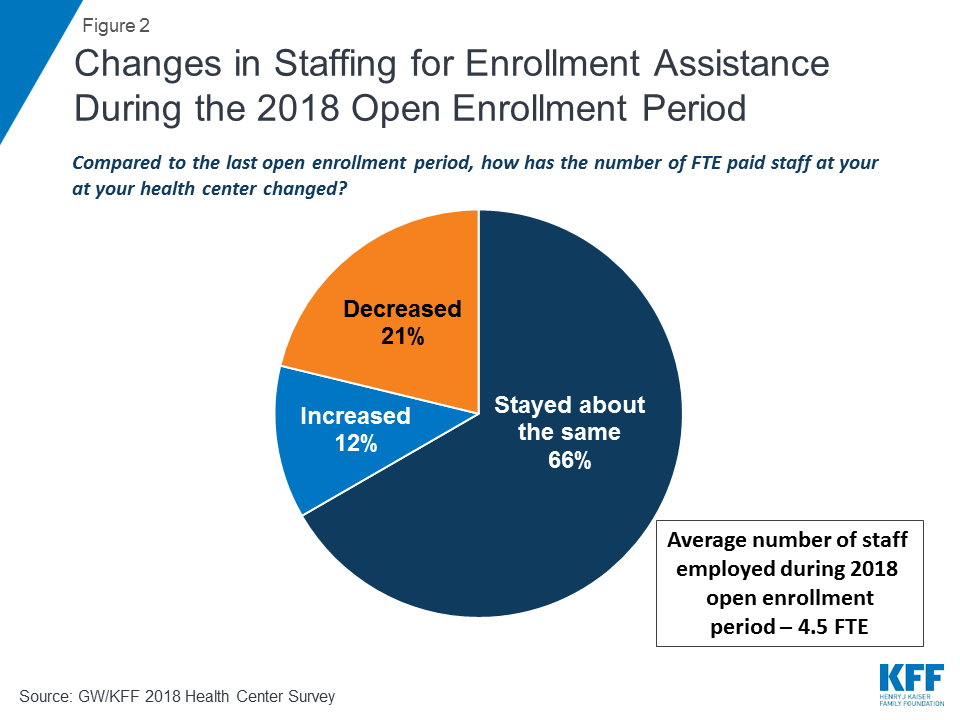
The majority of health centers were able to employ the same level of outreach and enrollment staff as last year. Two-thirds (66%) of health centers reported the number of full-time equivalent (FTE) paid enrollment assistance staff has stayed about the same since the last open enrollment period (Figure 2). On average, health centers employed 4.5 FTE enrollment assistance staff during the open enrollment period and 4.3 FTE staff throughout the year. Health centers in Medicaid expansion states employed more staff both during open enrollment and throughout the year than health centers in non-expansion states (5.0 FTE vs. 3.4 FTE during open enrollment and 4.9 vs. 3.1 FTE throughout the year).

Figure 2: Changes in Staffing for Enrollment Assistance During the 2018 Open Enrollment Period

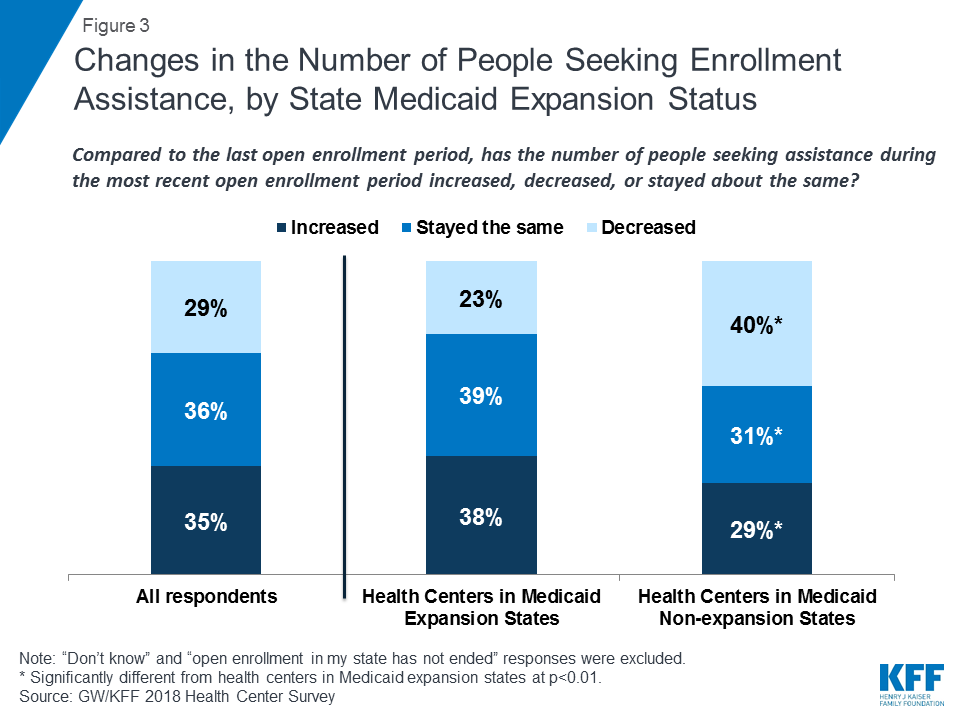
Compared to the previous open enrollment period, health centers served about the same number or more people seeking enrollment assistance. While some policymakers argued that the need for in-person assistance would diminish during the most recent open enrollment period as people became more familiar with how to apply for and enroll in coverage, a majority of health centers reported that the number of people seeking assistance was about the same as, or more than, last year.  Thirty-five percent said the number of people needing help increased while 29% said the number had decreased (Figure 3). The experience differed in Medicaid expansion and non-expansion states. Over three-quarters (77%) of health centers  in Medicaid expansion states said the number of people seeking assistance had increased or stayed the same compared to only 60% of health centers in non-expansion states.

Figure 3: Changes in the Number of People Seeking Enrollment Assistance, by State Medicaid Expansion Status

Most health centers continued to participate in off-site outreach activities. Over nine in ten (93%) health centers indicated that they participated in off-site outreach activities.  Among these health centers, nearly half (47%) reported similar participation in off-site outreach events this enrollment period compared to last year’s enrollment period, while 25% reported participating in more off-site activities than last year. Participating in off-site outreach events enables health center staff to reach consumers in the community who are not patients of the health center.

In addition to eligibility assistance, health centers’ outreach and enrollment staff provided a range of services to support consumers seeking health insurance. Nearly three-quarters (72%) of health centers reported counseling consumers on how to use insurance while over six in ten said they provided health insurance literacy counseling, assisted consumers with appeals of eligibility determinations, provided interpretation services, and assisted consumers with post-enrollment problems regarding billing or denied claims (Figure 4). These services are critical to ensuring consumers can understand and use their insurance to access the care they need. About half (52%) of health centers that reported offering these additional services said they spent about the same amount of time engaging in these activities compared to the last open enrollment period, and 34% reported spending more time.

Figure 4: Additional Services Provided by Enrollment Staff during the 2018 Open Enrollment Period

While funding for outreach and enrollment activities has been incorporated into health centers’ federal grants, many health centers received additional state or federal navigator grant funding and some experienced reductions in those grants. Because enrollment assistance is a requirement of all health centers, grants under Section 330 of the Public Health Service Act (which establishes the program) include modest funding for outreach and enrollment.  In addition, about four in ten (38%) health centers also reported receiving navigator funding, either as a grantee or as a sub-grantee, to provide outreach and enrollment services (Figure 5). Of those that reported receiving this funding, over a third (34%) said that their funds were cut in the 2017-2018 funding year, with health centers in Medicaid expansion states twice as likely to report funding cuts as those in non-expansion states (39% versus 20%). Among health centers whose funding was cut, nearly half (45%) said they did not make any changes in response to the funding cuts. However, about a third (32%) said they reduced staff and 27% reduced the number of outreach activities and events.

Figure 5: Share of Health Centers Experiencing Reductions in Navigator Funding and Actions Taken in Response

Changes in New Applications and Coverage Renewals

Health centers’ support for patients applying for Medicaid remained strong and grew in both expansion and non-expansion states. Over four in ten (41%) health centers said they provided assistance for more new Medicaid applications in calendar year 2017 compared to calendar year 2016, and just over a third (34%) said they helped with more Medicaid renewals (Figure 6).  In contrast, only 20% reported providing assistance for fewer new Medicaid applications and 14% said they helped with fewer Medicaid renewals in 2017. Health centers in Medicaid expansion states were more likely to report seeing increases in new Medicaid applications and renewals; however, health centers in non-expansion states also reported growth in the number of Medicaid applications. Almost half of health centers in Medicaid expansion states (44%) reported an increase in new Medicaid applications in 2017, while in non-expansion states, slightly over one-third (35%) of health centers reported an increase in Medicaid applications (Table 1). Additionally, over a third of health centers in Medicaid expansion states reported more renewals for Medicaid coverage in 2017 compared to about a quarter of health centers in non-expansion states.

Figure 6: Changes in New Applications and Renewals for Medicaid and Marketplace Coverage

In contrast, assistance with marketplace applications and renewals stayed about the same or decreased during the most recent open enrollment period. Fewer than one in four health centers (24%) reported that they assisted with more new marketplace applications compared to the last open enrollment period, and just 26% said that marketplace renewals had increased (Figure 6). In contrast, 38% indicated they assisted with fewer new marketplace applications since last open enrollment. The drop-off was more significant in non-expansion states. A higher percentage of health centers in non-expansion states (45%) reported assisting with fewer new applications for marketplace coverage compared to health centers in Medicaid expansion states (33%). Nearly half of health centers (49%) indicated the number of marketplace renewals remained relatively stable while a quarter said they assisted with fewer marketplace renewals.

Table 1. Changes in New Medicaid and Marketplace Applications and Renewals by State Medicaid Expansion Status
Medicaid Coverage1Health Centers in MedicaidExpansion StatesHealth Centers in MedicaidNon-expansion States
New Medicaid Coverage Applications*
More than last calendar year44%35%
Fewer than last calendar year22%15%
About the same as last calendar year34%49%
Medicaid Coverage Renewals*
More than last calendar year37%26%
Fewer than last calendar year15%14%
About the same as last calendar year48%61%
Marketplace Coverage2Health Centers in MedicaidExpansion StatesHealth Centers in MedicaidNon-expansion States
New Marketplace Coverage Applications*
More than last year’s open enrollment period25%24%
Fewer than last year’s open enrollment period33%45%
About the same as last year’s open enrollment period42%31%
Marketplace Coverage Renewals
More than last year’s open enrollment period25%27%
Fewer than last year’s open enrollment period24%26%
About the same as last year’s open enrollment period51%47%
* Distribution of responses for health centers in non-expansion states is significantly different from health centers in Medicaid expansion states at p<.05.1 “Not applicable” responses were excluded.2 “Open enrollment in my state has not ended” responses were excluded.

General Health Center Capacity and Access

Fueled by the additional revenue flowing from patients’ improved insurance coverage coupled with  growing grant funding under the ACA, health centers are continuing to expand their service capacity. A majority of health centers reported increased capacity for services they provided in the past year. Health centers were most likely to report expanding mental health and substance use disorder treatment services (70% and 69%, respectively) as well as mental health staff (67%) and substance use disorder treatment staff (60%) in the past year (Figure 7). Over half of health centers also reported expanding chronic care management services, dental services, and dental staff. Health centers in Medicaid expansion states were significantly more likely to report increased substance use disorder treatment services (74% versus 59%) in the past year, while health centers in non-expansion states were significantly more likely to report increased family planning staff (25% vs. 14%).

Figure 7: Share of Health Centers Reporting Increased Services and Staffing in the Past Calendar Year

Health centers have taken additional steps to expand access to services, including increasing hours of operation, particularly in Medicaid expansion states, but some struggle to meet the increased demand for care. Almost four in ten health centers reported increasing the number of sites (39%) and hours of operation (36%) (Table 2). Health centers in Medicaid expansion states were significantly more likely to report increased hours of operation (41% versus 29 %) in the past year compared to health centers in non-expansion states. At the same time, health centers also reported increased pressure on access to care for their patients. Just under a third reported increased wait times for new patient appointments (32%) and increased wait times for follow-up appointments (27%), while nearly one in five (19%) reported longer waits in the waiting room for patients with appointments.

Table 2. Share of Health Centers Reporting Efforts to Expand Access and Pressure on Access Increased in the Past Calendar Year by State Medicaid Expansion Status, 2018
All Health Centers Health Centers in MedicaidExpansion StatesHealth Centers in MedicaidNon-expansion States
Expanded access
Increased number of sites39%39%39%
Increased hours of operation36%41%29%*
Increased pressure on access
 Increased waits for new patient appointments32%30%35%
Increased waits for follow-up appointments27%25%32%
Increased waits in the waiting room19%18%20%
* Significantly different from health centers in Medicaid expansion states at p<.05NOTE: Statistical significance is based the percentage reporting increased vs. decreased or no change. “Not applicable” responses were excluded from this analysis.

Health Center Financing

As a result of growing insurance coverage among their patients, most health centers experienced stable or improved financing from key revenue sources in the past year.  Medicaid and Federal Section 330 grants are the most important revenue sources for most health centers, comprising over 60% of total revenues in 2017.7  As Medicaid coverage grew, nearly half (47%) of health centers reported increases in their Medicaid revenue in the past year and an additional 38% reported that their Medicaid revenue did not change (Figure 8). Following the Congressional delay in reauthorizing the Community Health Center Fund in 2017, most health centers reported an increase or no change in their federal grant funding in the past year. Importantly, though, about 20% of health centers experienced a decrease in their federal grant funding. For health centers that are particularly reliant on these grants to finance care to the uninsured, any reductions in funding can affect operations, and the uncertainties created by the delay in reauthorizing grant funds added to the pressures created by grant reliance. These findings were similar for health centers in expansion and non-expansion states.

Figure 8: Changes in Health Center Revenues in the Past Calendar Year

Revenue from private insurance also remained relatively stable. Approximately a third (35%) of health centers reported an increase in their private insurance revenues since last year, while 50% reported no change. Since implementation of the marketplaces in 2014 and as more low-income people have gained private coverage, all health centers, and particularly those in non-expansion states, have seen an increase in revenues from private insurance. Health centers in non-expansion states were significantly more likely to report increased private insurance revenue (44% versus 30%) in the past year compared to health centers in Medicaid expansion states.

Some health centers saw reductions in state and local funding. State and local grants represented about 7% of total revenues in 2017.8  Nearly four in ten (38%) health centers reported decreased revenue from state and local grants in the past year and nearly a third (32%) reported a drop in funding for community benefit activities from local hospitals and health plans (Figure 8). For some of these health centers, these losses may have been made up for by increases in other revenue sources.

Health Center Challenges

Health centers reported increasing financial pressure on privately insured patients.  As a sign of the heightened vulnerability of low-income patients to rising out-of-pocket health care costs, more than half of health centers (58%) reported that the share of their insured patients who were unable to pay their deductibles and cost-sharing payments had increased in the past year. Additionally, half of health centers reported increases in privately insured patients who pay sliding scale fees, presumably for care that is subject to their insurance plans’ deductible or high cost-sharing (Figure 9). These trends have financial implications for health centers by increasing the need to rely on federal grant funding to finance these unreimbursed costs. About a third of health centers reported that the percentage of Medicaid/CHIP and privately insured patients with lapses in coverage also increased compared to last year.

Figure 9: Changes in the Percentage of Health Center Patients Experiencing Affordability Challenges and Coverage Lapses in the Past Calendar Year

Workforce recruitment and insufficient grant funding continue to be top challenges for health centers. Staffing has been a perennial challenge for health centers because of the inherent difficulties in recruiting sufficient staff to high-poverty communities.  Nearly six in ten health centers (58%) said workforce recruitment was one of their top three challenges (Table 3). Given their location in rural and underserved communities, recruiting staff, especially as health centers seek to expand their services, remains a perennial problem. In 2016, workforce recruitment was also the most commonly reported top-three challenge.9  Other challenges facing health centers included inadequate physical space (36%), insufficient grant funding (32%), and high numbers of uninsured patients (26%). Health centers in non-expansion states were significantly more likely than health centers in Medicaid expansion states to rank as their top challenges high numbers of uninsured patients (42% versus 17%) and insufficient grant funding (38% versus 29%).  Perhaps reflecting concern over efforts by a number of states to impose new work, premium, and other requirements on Medicaid enrollees, particularly expansion enrollees, health centers in Medicaid expansion states were significantly more likely to report changes to Medicaid eligibility criteria as one of the top three challenges facing their health center (15% versus 5%).

Table 3. Share of Health Centers Ranking Selected Factors Among Their Top Three Challenges, by State Medicaid Expansion Status, 2018
 ChallengesAll Health Centers Health Centers in MedicaidExpansion StatesHealth Centers in MedicaidNon-expansion States
 Workforce recruitment58%59%57%
 Inadequate physical space36%37%34%
 Insufficient grant funding32%29%38%*
 Workforce retention28%29%25%
 High numbers of uninsured patients26%17%42%*
 Changes to Medicaid reimbursement23%24%21%
 Insufficient insurance reimbursement20%21%18%
 Changes to Medicaid eligibility criteria11%15%5%*
* Significantly different from health centers in Medicaid expansion states at p<.05Source: GW/KFF 2018 Health Center Survey

Discussion

Now four years out from the major expansions in Medicaid and marketplace coverage, health centers are continuing to expand their operational capacity amid a relatively stable financial situation. At the same time, health centers remain financially vulnerable because of reliance on funding sources that may be susceptible to policy and political uncertainties, as reflected in the delay in extending ACA grant funds. Consistent with their mission, health centers also report a strong presence in outreach and enrollment activities. Increased insurance coverage for health centers patients, along with enhanced federal grant funding through the ACA have contributed to a significantly improved financial picture for health centers. Health centers report that they are continuing to grow their capacity in terms of staffing, services, number of sites, and hours of operation.  However, as they seek to expand capacity, health centers continue to face workforce recruitment challenges. Furthermore, while many health centers have experienced increased federal grant funding over the past four years (and 29% reported an increase in the past year), for some, particularly those in non-expansion states, the amount they receive is still insufficient to meet rising health care costs overall as well as the ongoing costs of caring for the uninsured. Together, these challenges create additional pressures and constraints on health centers’ ability to maintain their increased capacity to provide services, including their ability to provide outreach and enrollment support.

Health centers also continue to play an important role in outreach and enrollment assistance for low-income consumers. With funding for enrollment activities included in their federal grants, health centers have been able to maintain staffing and eligibility assistance at levels they had previously reported. As a result, health center staff were able to take steps to prepare their patients and community members for the shorter enrollment periods in effect in most states. They also continued to provide essential services beyond enrollment assistance, including counseling on health insurance literacy and how to use insurance, to ensure their clients are able to use their coverage to access needed health care services.

Looking ahead, health centers will remain critical sources of comprehensive primary care services as well as outreach and enrollment assistance in their communities. With the Community Health Center Fund reauthorized, and the ACA coverage expansions still in place, the financial situation of health centers will likely remain stable in the immediate term. However, the uncertainty over future funding remains; any delays in securing funding could cause disruptions to health center operations. Additionally, if the threat to repeal and replace the ACA resurfaces and the ACA were to be repealed, it would jeopardize future health center growth. Finally, 1115 Medicaid waiver proposals in several states to impose work requirements, premiums and cost-sharing, and time limits on benefits, will restrict Medicaid enrollment, which could lead to coverage losses among health center patients, and further add to the financial uncertainty facing community health centers.

Additional funding support for this brief was provided to the George Washington University by the RCHN Community Health Foundation.

Methods

The 2018 Survey of Community Health Centers’ Experiences and Activities under the Affordable Care Act was conducted by the Geiger Gibson Program in Community Health Policy at the George Washington University (GW) and the Kaiser Family Foundation Program on Medicaid and the Uninsured, with input from the National Association of Community Health Centers (NACHC). The purpose of this survey was to assess the experiences of community health centers in a more mature ACA market. The survey focused on three key issues: (i) health centers’ role in health insurance outreach and enrollment; (ii) how health centers are evolving under the ACA and the financial, professional, and patient care-related challenges they face; and (iii) how health centers are approaching the opioid crisis and the treatment options that are available. A report presenting findings on the role health centers play in addressing the opioid epidemic was published separately.

The online survey was emailed to all CEOs of federally funded community health centers (n=1,337) in the 50 states and the District of Columbia (DC) identified in the 2016 Uniform Data System (UDS), to which all health centers must report annually. The survey was fielded from early January to late February 2018. There were a total of 489 survey responses from 49 states and DC, resulting in a response rate of 37%. Survey respondents and non-respondents were compared on the basis of 2016 UDS variables. Comparisons of 2016 UDS data found no significant differences between survey respondents and non-respondents for location in rural or urban locations, location in Medicaid expansion states, the number of patients served and clinic visits, the percentage of patients who are low-income, the percentage of patients by insurance type, or average total revenue. However, there were significant differences by the percentage of patients who are racial/ethnic minorities, the ratio of total staff FTEs to 10,000 patients, and the total revenue per patient.

The survey data was weighted using 2016 UDS variables for total health center patients, the percentage of their patients reported as racial/ethnic minorities, and total revenue per patient. Bivariate analyses (t-tests and X2 tests) were conducted to test for significant differences by Medicaid expansion status. Findings are presented for all respondents and by location in states that expanded Medicaid and in non-expansion states.

Endnotes

  1. Bureau of Primary Health Care. (2018). 2017 Health Center Data: National Data. Rockville, MD: Health Resources and Services Administration. https://bphc.hrsa.gov/uds/datacenter.aspx?q=tall&year=2017&state=; number of sites based on a GW analysis of 2017 UDS data ↩︎
  2. Rosenbaum, S., Tolbert, J., Sharac, J., Shin, P., Gunsalus, R., & Zur. (2018). Community Health Centers: Growing Importance in a Changing Health Care System. Kaiser Family Foundation. https://modern.kff.org/medicaid/issue-brief/community-health-centers-growing-importance-in-a-changing-health-care-system/ ↩︎
  3.   Nine states with state-run marketplaces extended the open enrollment period beyond December 15, 2017. ↩︎
  4. These states are CA (January 31, 2018), CO (January 12, 2018), CT (December 22, 2017), MA (January 23, 2018), MN (January 14, 2018), NY (January 31, 2018), RI (December 31, 2017), WA (January 15, 2018) and DC (January 31, 2018). ↩︎
  5. Pollitz, K., Tolbert, J., & Diaz, M. Data Note: Changes in 2017 Federal Navigator Funding. Kaiser Family Foundation. https://modern.kff.org/health-reform/issue-brief/data-note-changes-in-2017-federal-navigator-funding/ ↩︎
  6. Kaiser Family Foundation: State Health Facts.  Changes in Marketplace Enrollment, 2017-2018. Data source: Marketplace Open Enrollment Period Public Use Files for February 2017 Effectuated Enrollment Snapshot and February 2018 Effectuated Enrollment Snapshot. Available at https://modern.kff.org/health-reform/state-indicator/change-in-marketplace-enrollment-2017-2018/?currentTimeframe=0&sortModel=%7B%22colId%22:%22Location%22,%22sort%22:%22asc%22%7D ↩︎
  7. GW analysis of data reported in the 2017 UDS National report. Bureau of Primary Health Care. (2018). 2017 Health Center Data: National Data. Rockville, MD: Health Resources and Services Administration. https://bphc.hrsa.gov/uds/datacenter.aspx?q=tall&year=2017&state= ↩︎
  8. Ibid. ↩︎
  9. Rosenbaum, S., Paradise, J., Markus, A. R., Sharac, J., Tran, C., Reynolds, D., & Shin, P. (2017). Community health centers: Recent growth and the role of the ACA. Kaiser Family Foundation. https://modern.kff.org/medicaid/issue-brief/community-health-centers-recent-growth-and-the-role-of-the-aca/ ↩︎

One Year After the Storm: Texas Gulf Coast Residents’ Views and Experiences with Hurricane Harvey Recovery

Authors: Liz Hamel, Bryan Wu, Mollyann Brodie, Shao-Chee Sim, and Elena Marks
Published: Aug 23, 2018

Executive Summary

Survey: A year after #HurricaneHarvey, 3 in 10 affected Texas Gulf Coast residents say their lives remain disrupted

On August 25, 2017, Hurricane Harvey made landfall as a Category 4 hurricane near Rockport, Texas. Hovering over the region for days, the storm dropped record amounts of rainfall, and flooded over 300,000 structures, 500,000 cars, and caused damage in excess of $125 billion.1  In order to understand the needs and circumstances of vulnerable Texans affected by the hurricane, the Kaiser Family Foundation and the Episcopal Health Foundation partnered to conduct two surveys of adults living in 24 counties along the Texas coast that were particularly hard-hit. The first survey, conducted between two and three months after Harvey, was an initial look at how residents were faring in the immediate aftermath of the hurricane. As the one-year anniversary approaches, the current survey seeks to shed light on the longer-term recovery needs of those who are still struggling to put their homes and their lives together nearly one year later. Both surveys allow for examination of the views and experiences of residents in these counties overall, as well as in four distinct geographic regions: Harris County (the county where Houston is located and the largest in terms of population); the counties surrounding Harris that are part of the same Regional Council of Governments (“Outside Harris”); the three counties (Orange, Jefferson, and Hardin) that make up the “Golden Triangle” area east of Houston where the cities of Beaumont, Orange, and Port Arthur are located; and several counties to the southwest of Houston that make up the coastal area including Corpus Christi and Rockport (“Coastal”). In addition to the survey, the partners conducted six focus groups in July 2018 (two each in Houston, Port Arthur, and Dickinson) with low- and middle-income residents who were affected by the storm and who said their lives were still disrupted 11 months later.

Key findings from the survey include:

Nearly one year after Hurricane Harvey, many Texas Gulf Coast residents feel their lives are getting back on track. Seven in ten affected residents now say their lives are largely or almost back to normal, up from 56 percent three months after the storm.

Despite this progress, many residents are still struggling to recover. Among those who experienced property damage or income loss, nearly a quarter say their personal financial situation is worse as a result of Harvey and one in six say their overall quality of life is worse.

While many feel their lives are returning to normal, four in ten affected residents say they are not getting the help they need to recover from the storm, a share that has not declined since the 3-month mark. The biggest areas of need continue to be housing, financial assistance, and help with navigating the different systems for receiving aid.

Affected residents who are Black, have lower incomes, or live in the Golden Triangle area are more likely to say their lives are still disrupted and less likely to say they are getting the help they need with recovery.

One in five residents in the 24-county area experienced severe damage to their home and eight percent remain displaced from their pre-Harvey home. Both of these groups report high rates of ongoing life disruptions along a number of dimensions.

While some affected residents report receiving financial help from FEMA, charities, and other sources, most say they have not received assistance, or that any financial help they have received will cover very little or none of their financial losses. In the wake of Harvey, many affected residents, particularly those who are Black, Hispanic, or have lower incomes, report financial problems such as falling behind in their rent or mortgage, having problems paying for food, taking on extra work, or borrowing money from friends and relatives to make ends meet.

Access to health and mental health services may be an area of unmet needs. While about three in ten affected residents report declines in their own mental health as a result of Harvey, just 8 percent say they or someone in their household has received counseling or mental health services since the storm. In addition, one in six say someone in their household has a health condition that is new or worse as a result of Harvey, and 16 percent say they need help getting health care for themselves or their family.

Along with housing and financial help for those in need, residents of the 24-county area overall (including those who were affected by Harvey and those who weren’t) prioritize preparation for future storms when asked about areas where more resources need to be devoted. While most feel that they themselves, along with local, state, and federal officials are at least somewhat prepared to deal with hurricanes in the future, about half say they have not personally taken any specific steps to prepare for future hurricanes.

The vast majority of the 24-county area residents are not aware that the federal government has provided funding to help Texas with long-term recovery and rebuilding.

Survey: A year after #HurricaneHarvey, 3 in 10 affected Texas Gulf Coast residents say their lives remain disrupted

Key Findings: Introduction

Hurricane Harvey hit the Texas Gulf Coast on August 25, 2017. In the nearly one year since the storm, daily life for many Texans in the affected areas has returned to normal, while others continue to struggle to rebuild their homes, their lives, and their communities.

The widespread and devastating effects of Hurricane Harvey on the Texas Gulf Coast have been well documented. A total of 41 counties in Southeast Texas were designated as federal disaster areas. As of July 25, 2018, the Federal Emergency Management Agency (FEMA) received 887,557 individual housing assistance applications and approved 372,626 applications with a total of $1.6 billion.2  Including the housing assistance program, National Flood Insurance Program settlement, public assistance (infrastructure) projects, SBA low interest disaster loans and other grant programs, FEMA reported that 13.84 billion in federal assistance had been provided to affected Texans.3  In some of the hardest hit communities, many residents remain displaced from their homes, and finding permanent housing for these individuals is a major public policy concern.

Three months after Harvey, the Kaiser Family Foundation and the Episcopal Health Foundation partnered to conduct a representative survey of residents in 24 heavily-impacted Texas counties, in order to provide those working on the recovery effort with reliable information about how residents were affected by the hurricane and what their needs and priorities were for recovery. As a follow-up, the partners jointly conducted the current survey nearly one year after the storm, to shed light on the progress being made, as well as residents’ views on the greatest areas of need as recovery moves from the short-term into the long-term.

Both partners worked together to design the survey and analyze the results. The 24 counties were chosen based on a mapping analysis of Harvey property damage developed by FEMA (see Appendix A Figure 1), in an effort to examine a contiguous area of counties that suffered the largest share of property damage. The region surveyed divides into four groupings of counties: Harris County (the county where Houston is located and the largest in terms of population); the counties surrounding Harris that are part of the same Regional Council of Governments (“Outside Harris”); the three counties that make up the “Golden Triangle” area east of Houston where the cities of Beaumont, Orange, and Port Arthur are located; and several counties to the southwest of Houston that make up the coastal area including Corpus Christi and Rockport (“Coastal”).4 

These 24 counties are home to approximately 7.95 million people, which represents 94 percent of the total population in the 41 counties that were declared as federal disaster areas. This region is incredibly diverse in terms of race and ethnicity (40 percent White, 36 percent Hispanic, 16 percent Black, 6 percent Asian, and 2 percent others). On average about 15 percent of the people in the affected region are officially designated as living in poverty, with wide variations in poverty across the counties.5  These counties are also diverse in their population density; eight of the counties we surveyed were designated as rural counties and 16 as urban counties.

The survey was designed to represent the views of residents living in the region overall, and also to be able to describe the views and experiences of those living in each of the four regions. In order to represent some of the most vulnerable groups affected by the storm, the survey also included oversamples of lower-income residents, Black and Hispanic residents, and those living in the areas that had the largest amount of property damage as reported by FEMA. Results for the region overall have been weighted to reflect the demographics of the overall population. The survey was fielded from late June through late July, roughly 10 to 11 months after Harvey made landfall.

In addition to the survey, the partners conducted six focus groups (two each in Houston, Port Arthur, and Dickinson) on July 24 and 25 with lower- and middle-income residents who experienced damage to their homes and/or a loss of income as a result of Hurricane Harvey, and who said their lives were still very or somewhat disrupted from the storm nearly one year later. The focus group locations were chosen to represent three of the four different county groupings included in the survey, as well as three areas that differ in racial/ethnic makeup, industry, and metropolitan area size. Focus group findings highlighted in this report help provide context and add the human story behind some of the quantitative findings from the survey.

Key Findings: Section 1: Recovery Experiences Among Residents Affected By Harvey

The Big Picture: How Are Those Affected by Harvey Faring Nearly One Year After the Storm?

For purposes of this report, residents who were “affected by Hurricane Harvey” are defined as those who say they incurred damage to their home or vehicle, or that they or someone in their household lost a job, had hours cut back at work, or experienced some other loss of income as a result of Harvey. Overall, six in ten (58 percent) residents of the 24 counties surveyed say they experienced one of these things, a share that is slightly lower than the share who reported these experiences in the first survey three months after the storm, mostly due to a lower share reporting employment disruptions. Consistent with the results of the earlier survey, Black and Hispanic residents, those with lower incomes, and those living in the Golden Triangle and Coastal Counties are more likely to report being affected by the hurricane (see Appendix B for more information).

A year after #Harvey, survey finds affected Texans’ greatest unmet needs include navigating aid systems and financial assistance

Among those who were affected by the storm, many report significant progress in getting their lives back on track. Overall, 70 percent of affected residents say their lives are “largely” or “almost” back to normal, a share that is up from 56 percent eight months ago. Still, three in ten affected residents say their lives are still “very” or “somewhat” disrupted from the storm.

Figure 1: Most Affected Residents Say Their Lives Are Largely or Almost Back to Normal, But 3 in 10 Remain Disrupted

The share reporting that their lives are still disrupted nearly one year after Harvey is highest among two groups: 1) those who evacuated their homes and are still living somewhere different today, a group that represents 8 percent of the total area population and among whom 65 percent say their lives are still disrupted; and 2) those who say their home sustained major damage or was destroyed, representing 19 percent of the total population, with 55 percent saying their lives are still disrupted. These groups, which overlap somewhat but not completely, report higher levels of disruption along a number of dimensions measured in the survey, and key findings for each group are highlighted in a special section below. In addition to these two groups, affected residents who are Black, living in the Golden Triangle area, or have lower incomes are more likely than their counterparts to report that their lives are still disrupted due to the effects of Harvey.

Figure 2: Displaced Residents and Those Whose Homes Had Major Damage Are Most Likely to Say Lives Are Still Disrupted

When the 30 percent of Harvey-affected residents who say their lives are still disrupted are asked to name in their own words the main thing they need for their day-to-day life to return to normal, responses focus on basic needs like home repairs, financial assistance, employment, and transportation. Four in ten (43 percent) mention housing-related issues, including 35 percent who say the main thing they need is for their home to be repaired and 9 percent who say they need to be able to return to their home or find new housing. One-quarter (24 percent) say their biggest need is money or financial assistance, and about one in ten each say they need a job or stable employment (10 percent), or a vehicle or other form of transportation (9 percent).

Figure 3: To Get Back to Normal, Affected Residents Focus on Housing and Financial Assistance

Focus group highlight: Ongoing areas of need

Focus group participants were asked about the problems they currently face and potential solutions in three specific areas: housing, employment, and physical and mental health. Counts of mentions during related group exercises are detailed in Appendix C. Consistent with the survey results, focus group participants stressed the need to make repairs to their home or find a new place to live, and the importance of financial help to make these things happen. For many focus group participants, loss of a vehicle due to Harvey was linked to their ability to work, which in turn is linked to their ability to restore their homes to a livable condition, illustrating how multiple impacts on an individual can contribute to a cycle that makes recovery very difficult.

“We lost both cars. My husband lost his tools. We’re still living with another family. They are 3, we’re 4. It’s 2 rooms. We’re sleeping in the living room. But my husband, he still has not been able to recover his tools. He’s still doing odd jobs here and there. We don’t have enough to go back to an apartment.” – 32-year-old undocumented Hispanic female, Houston

“I lost a vehicle. I lost my way to work. They weren’t too big on coming and picking me up. I’ve been trying to find work. Right now it’s slow. I’m getting way behind on my child support and everything. It’s been bad.” – 29-year-old white male, Dickinson

“I didn’t have a rig truck [so] I couldn’t go to work. Then I did try to file for unemployment and they said that I quit. The company said that I quit because I didn’t have a truck to come to work no more.” – 34-year-old white male, Dickinson

“We just need people to help us, period. Because you’ll call these organizations and nobody still not gonna return no calls until a month or two later. Still no answer.” – 27-year-old Black female, Port Arthur

“Once this left the front page, we became yesterday’s news. As long as it’s on the front page, you had everybody coming down wanting to help poor little old Port Arthur. But once it left the front page, then you’re expected to be back to normal at that point. And it’s not so.” – 59-year-old Black male, Port Arthur

In another sign that many families are well on their way to recovery, most residents who were affected by Harvey report that their personal financial situation and their overall quality of life are about the same as they were before the storm. However, about three in ten affected residents say their current financial situation is worse than it was before the storm, including 23 percent who attribute the decline directly to Hurricane Harvey. Similarly, 17 percent of those who were affected say their overall quality of life is worse now as a result of the storm.

Figure 4: Some of Those Affected by Harvey Say Their Financial Situation and Overall Quality of Life Are Worse as a Result

Black residents and those living in the hard-hit Golden Triangle area are more likely than others to report declines in their financial situation and quality of life due to Harvey. About a third of each of these groups say things are worse on each of these dimensions.

Table 1: Affected Residents’ Financial Situation and Overall Quality of Life After Hurricane Harvey
AMONG TEXAS GULF COAST RESIDENTS AFFECTED BY HURRICANE HARVEY:Percent who say their ____ is worse today as a result of Hurricane Harvey:TotalGeographic RegionRace/EthnicitySelf-reported Income(% of FPL)
Harris CountyOutside HarrisGolden TriangleCoastalWhiteHispanicBlack<200%200%+
Personal financial situation23%22%23%34%22%25%17%31%24%22%
Overall quality of life17171732131811312014

Do Affected Residents Feel They Are Getting the Help They Need?

Ten months after Hurricane Harvey hit, four in ten affected residents (42 percent) say they are not getting the help they need to recover from the storm, roughly the same share who said so in the previous survey conducted three months after Harvey (45 percent). Notably, among those affected by the storm, six in ten Black residents, half of those living in the Golden Triangle, and half of those with self-reported incomes below 200 percent of the Federal Poverty Level (FPL) say they are not getting the help they need.

Figure 5: Black, Low-income, and Golden Triangle Residents Most Likely to Say They’re Not Getting the Help They Need

When it comes to the specific areas in which people affected by Harvey say they need more help, navigating the systems for receiving aid remains a big area of need. About three in ten affected residents (28 percent) say they need more help applying for disaster assistance, a share that has declined only slightly from the three-month mark (34 percent). A similar share (27 percent) say they need help navigating the different systems for receiving aid, and 15 percent say they need help with legal assistance.

The shares of affected residents who say they need more help repairing damage to their homes (24 percent), finding affordable housing (14 percent), finding a job (11 percent), and getting medical care (16 percent) and mental health care (9 percent) have remained at similar levels since the first survey, suggesting that help has been slow to come to those most in need.

Poll: A year after #HurricaneHarvey, 4 in 10 affected Texas Gulf Coast residents say they are still not getting needed help to recover

Figure 6: Many Harvey-Affected Residents Say They Still Need Help in Various Areas

Focus group highlight: Confusion over how to get financial help

The themes of confusion and a need for help with applying for disaster assistance were commonly raised in the focus groups.

“Maybe openly have some people to kind of coach them through where to go. I see some households … they didn’t know where to go or what to do. What’s next? They have no idea, especially older people, single people, they just gave up. … Go to them and say hey, ‘We’re not asking to work against FEMA,’ but say, ‘This is how their system works. This is what you have to do to get to where you got to do.’ I don’t know. Help people take the next step.” – 34-year-old white male, Dickinson

“I immediately did the application for help for the house. I had house insurance but not flood insurance. I didn’t know there were two separate insurances that you had to buy.” – 55-year-old Hispanic female, Houston

“Any time I heard about any help, it had already elapsed. It was over. I didn’t hear about this.” – white female, Dickinson

“FEMA was like just a lot of unnecessary hoops that they make you jump through, right after an emergency … Like you have to have so much paperwork for anything. And a lot of it I didn’t have … The whole entire place flooded. I don’t have any copies of anything because they were destroyed.” – 26-year-old Black female, Dickinson

Serious Housing Issues Remain a Problem for Some Residents

While many Texas Gulf Coast residents report being well on the road to recovery from Harvey, serious housing issues remain a problem for others. As noted above, 19 percent of all 24-county area residents say that their home sustained major damage or was destroyed as a result of Harvey, a share that rises to 27 percent in the Coastal area and 38 percent in the Golden Triangle.

Figure 7: Two in Ten Residents Say Home Had Major Damage or Was Destroyed

Among those who sustained any damage to their home as a result of Harvey, about a third (36 percent) say their home has been restored to the same condition it was in before the storm, while four in ten (41 percent) say it has been restored to a livable condition but not the same as it was before Harvey. One in six (15 percent) of those residents who experienced home damage say their home is still in an unlivable condition 10 months later, a share that rises to 25 percent among Golden Triangle residents whose homes were damaged.

Among those whose homes have not been restored to the same or better condition they were in before Harvey, the largest share (51 percent) say the reason is that they could not afford the cost of the repairs, while 11 percent say they are waiting for insurance money or other financial help to come through, 10 percent are renters who say their landlord has not completed work, and 6 percent say they’ve been unable to find someone to help them do the necessary work on their home.

Figure 8: About Two in Ten Whose Homes Were Damaged Say They Are Still in an Unlivable Condition

Focus group highlight: Challenges related to home repairs

For focus group participants who are still struggling to repair damage to their homes, most mentioned lack of money as a major barrier to being able to complete the work, while others mentioned difficulty finding contractors. Several participants said that the easy part of the work (demolition, basic sheetrock installation) had been done with volunteers, but that the remainder of the work (roofing, floors) required professional help that they couldn’t afford.

“Contractors have been like at a premium. You find a contractor and he says, ‘I can get to you in 3 months.’” – 59-year-old Black male, Port Arthur

“I even found a contractor I liked but I didn’t have the funds to make use of him, you know?” – 47-year-old white male, Dickinson

“We can fix this and fix that. It’s hard to get people to help. That’s the way we fixed the walls. Between my children, my son-in-laws, we [knocked] down walls and we use that money. My issue … is the foundation and the roof. The roof and the foundation has to be a professional.” – 55-year-old Hispanic female, Houston

“The roof guy is gonna put the tiles and with the materials [for $4000]? That’s a good price.” – 34-year-old Hispanic male, Houston

“[Responding to above comment] But I don’t have the $4000. That’s the issue. The thing is there’s no money.” – 55-year-old Hispanic female, Houston

In addition, about one in five (19 percent) of those whose homes were damaged by Harvey (representing 7 percent of all residents in the 24-county area) say that the conditions in the place where they are currently living are not safe for them and their families. Notably, lower-income and Hispanic residents with home damage are more likely than others to say their current living conditions are not safe.

Figure 9: Lower-income and Hispanic Residents with Home Damage More Likely to Say Current Living Conditions Are Not Safe

Among those who feel their living conditions are not safe, about a third (32 percent) say their concern is related to the potential of their home to withstand future storms or flooding, while nearly half (46 percent) mention structural concern such as damage to their roof or ceilings (22 percent), walls or sheetrock (8 percent), floors (7 percent) or other structural damage (9 percent). One in ten (10 percent) of those who feel unsafe say their concern is related to the presence of mold, mildew, or bacteria, while 6 percent say they are living without heat or air conditioning (a potentially major concern in the hot Texas summer), and 5 percent are worried about the presence of insects, snakes, or rodents in their home.

Figure 10: Those Who Feel Homes Are Unsafe Cite Structural Concerns and Worries About Future Flooding

Focus group highlight: Safety of living conditions

Focus group participants who felt unsafe in their homes mostly reported that they didn’t have anywhere else to go. Others said they weren’t necessarily comfortable living in an unfinished house or apartment, but that they were getting used to it and accepting their situation.

“[Moderator: Is the house you’re renting safe?] No, but I ain’t got nowhere else to go.” – 47-year-old Black male, Port Arthur

“I had to stay in my home because I had nowhere to go. I had nowhere to go until it burned down while I was in it. [A fire] burned my house down. It was an electrical fire … I was living in mold. I was living with my floors falling through. I was living with my ceiling falling through.” – white female, Dickinson

“[Still don’t feel safe] because we’re in hurricane season again. I have no sheetrock. I have no insulation in my house and creepy crawly bugs and things like that and I hear stuff at night … I’m not happy. Let me put it like this: I’m not comfortable, but it is what it is. I want it to get better. I’m doing what I can.” – 65-year-old Black female, Port Arthur

“It’s not complete so it’s not up to standard, but like [other participant] said you get used to it, you know, until you can do better.” – 60-year-old Black female, Dickinson

Spotlight on Those with Severe Home Damage

The 19 percent of Texas Gulf Coast residents who experienced major damage or destruction of their home are one of the groups most likely to report continued disruptions to their lives nearly one year after the storm. Similar to other groups, six in ten of these individuals (59 percent) were homeowners and four in ten (39 percent) were renters at the time Harvey hit. Just a quarter (25 percent) say they had flood insurance and about half (53 percent) had homeowners’ or renters’ insurance at the time of the storm.

Those who experienced major home damage have had a much tougher road to recovery in the nearly one year since the storm. They are three times as likely as those who had only minor home damage to say their lives are still disrupted (55 percent versus 18 percent). Fully six in ten say they are not getting the help they need to recover from the storm, compared to 37 percent of those with minor home damage. They are also much more likely than their counterparts to report disruptions to their finances, physical and mental health, and well-being. Four in ten (43 percent) say their personal financial situation is worse as a result of Harvey, and 31 percent say the same about their overall quality of life. Three in ten say their own mental health is worse as a result of the storm, and nearly as many (27 percent) say that someone in their household has a health condition that is new or worse because of Harvey. Thirty percent are living somewhere different than before the storm, and one quarter (26 percent) report that their home remains in an unlivable condition.

Figure 11: Residents with Severe Home Damage More Likely to Experience Ongoing Challenges Following Harvey

Those who report major damage or destruction to their homes are also more likely than others to report needing help in a variety of areas. About half (49 percent) say they need help applying for disaster assistance and more than four in ten need help repairing damage to their homes (44 percent) or navigating the different systems for receiving aid (43 percent). About a quarter also say they need help finding affordable housing (27 percent) and getting legal assistance (26 percent), and many also say they need more help getting medical care (23 percent), finding a job (17 percent), or getting mental health care (15 percent) for themselves or a family member.

Figure 12: Areas of Need Among Those Who Experienced Severe Home Damage

Spotlight on Those Who Evacuated and Have Not Returned to Pre-Harvey Home

While most residents who evacuated during Harvey have been able to return to their homes, 8 percent of all residents in the 24-county area say they evacuated and have not returned to the same place they were living before the storm, rising to 20 percent in the Golden Triangle area. Seven in ten (69 percent) of affected residents who have not returned to their original home say they were renting the place they lived in before Harvey, and four in ten (38 percent) report having incomes below the poverty level. The large majority (75 percent) of this group say their home sustained major damage or was destroyed, but 23 percent say they had only minor or no damage, suggesting that issues beyond just structural damage – such as financial issues and problems with landlords – may have prevented some of these individuals from returning to their pre-Harvey homes.

Figure 13: One in Ten Residents Have Not Returned to the Home They Were Living in Before Harvey

Like the group who experienced major home damage, affected residents who were displaced from their homes by Harvey report experiencing more severe disruptions than others who were affected by the storm. Two-thirds (65 percent) say their lives are still disrupted by Harvey nearly one year later, and a similar share (67 percent) say they’re not getting the help they need to recover. This group also reports a variety of financial problems in the wake of the storm. Nearly six in ten (57 percent) say that since Harvey they’ve had to borrow money from friends or relatives to make ends meet, about half (48 percent) say they’ve fallen behind in paying their rent or mortgage, and four in ten (43 percent) report problems paying for food. Four in ten say both their overall quality of life (43 percent) and their personal financial situation (40 percent) are worse as a result of Harvey, while about a third (34 percent) say their mental health is worse.

Figure 14: Gulf Coast Residents Still Displaced by Harvey More Likely to Experience Many Challenges Following the Storm

For affected residents who have not been able to return to their pre-Harvey home, the biggest areas of need are applying for disaster assistance (53 percent say they need more help), finding someone to help navigate the different systems for receiving aid (45 percent), and finding affordable permanent housing (42 percent).

Figure 15: Areas of Need Among Those Still Displaced from Pre-Harvey Home

Financial Help and Financial Problems Among Those Affected by Harvey

Among Texas Gulf Coast residents who were affected by Hurricane Harvey, four in ten (41 percent) say they applied for disaster assistance from FEMA or the SBA. Of these, four in ten (39 percent) say their application was approved and a similar share (42 percent) say it was denied. While the overall share receiving aid from FEMA or the SBA is small (16 percent of all affected residents), most (60 percent) of those who received this aid say they were satisfied with the amount of money they received, though almost four in ten (37 percent) say they were dissatisfied.

Figure 16: Among Those Receiving FEMA or SBA Aid, Six in Ten Were Satisfied with the Amount, Four in Ten Were Dissatisfied

In addition to federal disaster assistance, about three in ten (28 percent) of affected residents say they have received help paying for food, housing, or health care, or some other type of financial help from a local or national charity since Hurricane Harvey. Hispanic residents are somewhat more likely than white residents to report receiving such help (32 percent versus 24 percent), but otherwise the share who received help doesn’t differ substantially by race, income, or geography.

Figure 17: Almost Three in Ten Affected Residents Report Receiving Financial Help From a Charity or Non-Profit

Despite receiving aid from various sources, most residents who were affected by Harvey do not feel this help will be enough to cover the majority of their financial losses from the storm. Taking into account all sources of financial help including insurance payments, disaster aid, and help from charities, most affected residents (66 percent) say this assistance will cover very little (18 percent) or none (27 percent) of the financial losses they experienced as a result of the storm, or that they haven’t received any type of financial help or payments (21 percent). Just 14 percent say such payments will cover most of their financial losses and another 18 percent say they will cover “just some.” Black residents and those with the lowest incomes are the least likely to say that most or some of their losses will be covered by insurance payments and financial aid.

Figure 18: Lower-income and Black Residents Affected by Harvey Least Likely to Say Financial Assistance Covered Their Losses

Focus group highlight: Financial help and financial problems

Quotes from focus group participants highlight the multiple financial problems residents faced in the wake of the hurricane, and the fact that any aid they received was inadequate to cover the costs they were facing.

“I had 2 jobs when I was pregnant and I was looking for homes to clean. I was cleaning night and day. We had our things. I had a car and everything, and all of a sudden you don’t even have clothes to put on. Living in an apartment, I started thinking, ‘I work so much and I don’t have anything.’” – 32-year-old undocumented Hispanic female, Houston

“Even with the assistance … In my case we were driving back and forth from Winnie. It was the gas, the food. I mean you’re exhausted. You’re on the road trying to survive.” – 53-year-old Black female, Port Arthur

“Well I had to fight them because I lost everything. I had to send them pictures and everything I had because they felt that what I owned was only worth $2000, and I worked all my life for those things. Although they were material, but they were mine. So I had to fight them in order to get what I got from them.” – 53-year-old Black female, Port Arthur

“So the people they sent from FEMA … They would inspect and say, ‘Oh you can fix this with $4,000.’ But they didn’t go to Home Depot to see how much they were charging for sheetrock. They didn’t know the cost of materials.” – 49-year-old undocumented Hispanic female, Houston

“I did get several [bids from contractors], anywhere from $60,000 to $80,000 or more. And the amount that I got from FEMA was not even close. So I stretched it out as far as I could, to take care of home repairs, as well as trying to replace a vehicle, because my vehicle was flooded. And I’ve charged up credit cards as well and pulled money from savings accounts which I’ll probably be taxed on, and my house is still not finished.” – 60-year-old Black female, Dickinson

Affected residents report a variety of financial problems since Harvey. About four in ten (38 percent) say they or someone else in their household has taken on an extra job or worked extra hours since the storm in order to make ends meet, and a similar share (27 percent) say they have borrowed money from friends or relatives. One-third (32 percent) say they have fallen behind in paying their rent or mortgage and three in ten (29 percent) report having problems paying for food. Six in ten (62 percent) of affected residents report at least one of these problems. As Table 2 shows, reported financial problems in the wake of Hurricane Harvey are much more common among affected residents with lower self-reported incomes, as well as among Black and Hispanic residents.

Figure 19: Six in Ten Harvey-Affected Residents Report Experiencing Financial Problems Since the Storm
Table 2: Reported Financial Challenges of Residents Affected by Hurricane Harvey
AMONG TEXAS GULF COAST RESIDENTS AFFECTED BY HURRICANE HARVEY:Percent who say they or any other adult in their household have ____ since Hurricane Harvey hit:TotalSelf-reported Income (% of FPL)Race/Ethnicity
<100%100% to <200%200% to <400%400%+WhiteHispanicBlack
Borrowed money from friends or relatives to make ends meet37%47%45%35%10%28%38%49%
Taken on an extra job or worked extra hours to make ends meet3841463624363543
Fallen behind in paying their rent or mortgage3244382510204039
Had problems paying for food294335215223039
Experienced any of the above problems6274705932516475

Health, Mental Health, and Resilience

Beyond impacts on their housing, employment, and financial situations, some residents report problems with their physical and/or mental health as a result of Hurricane Harvey. Overall, 16 percent of affected residents say they or someone in their household has a health condition that is new or has gotten worse since Harvey. This is similar to the share of affected residents who reported a new or worse health condition in the first survey (17 percent), suggesting that most health effects from the storm began in the early months and many have persisted since then. The most commonly reported health conditions are respiratory problems such as asthma, coughing, or other breathing problems (32 percent of those reporting a health condition), followed by mental health issues like depression and anxiety (26 percent), high blood pressure (10 percent), cardiovascular problems (8 percent), and diabetes (6 percent).

Figure 20: One in Six Say They or a Family Member Have a Health Condition that Is New or Has Gotten Worse Due to Harvey

Residents who were affected by Harvey also report a variety of mental health consequences from the hurricane. About three in ten (31 percent) of affected residents report some negative effect on their mental health, including having a harder time controlling temper (19 percent), feeling their mental health has gotten worse (18 percent), taking a new prescription for a mental health issue (10 percent), or increasing their alcohol use because of Harvey (6 percent). Again, these shares are similar to those reported by affected residents in the first survey (32 percent reported at least one of these problems), suggesting that on balance, there has not been a marked improvement or a further decline in mental health issues among residents who began to feel these effects in the immediate aftermath of the storm.

Figure 21: Three in Ten Report Some Effect on Mental Health Due to Harvey

Despite the relative prevalence of self-reported mental health problems among residents affected by Harvey, few (8 percent) say that they or someone in their household has received any mental health services since the storm, including just 5 percent who say someone received these services related to their experience with Harvey. A similarly small share (11 percent) say there was a time since the hurricane when they thought they or a family member might need mental health services but did not receive them. While these shares are small among affected residents overall, they are somewhat higher among those who say their lives are still disrupted from the storm, those who describe their own mental health as only fair or poor, and those who feel that their mental health has gotten worse as a result of Harvey.

Among those who say there was a time since Harvey when they or a family member did not receive mental health services they thought they might need, half say the main reason was that they could not afford the cost (47 percent), while nearly as many say they did not seek out the services (39 percent).

Figure 22: Few Affected Residents Report Receiving Mental Health Services Since Harvey

Residents of the Golden Triangle area are more likely than those living in other areas to report negative mental health consequences as a result of Hurricane Harvey, particularly due to the fact that a larger share of these residents say they have had a harder time controlling their temper since the storm. However, Golden Triangle residents are not more likely than others to report that someone in their household has received any mental health services since the storm. Notably, Hispanic residents are less likely than both white and Black residents to report declines in their mental health due to Harvey, and less likely to say that someone in their household has received counseling or other mental health services.

Table 3: Affected Residents’ Mental Health After Hurricane Harvey

AMONG TEXAS GULF COAST RESIDENTS AFFECTED BY HURRICANE HARVEY:Percent who say they experienced each of the following since Hurricane Harvey:

TotalGeographic RegionRace/EthnicitySelf-reported Income(% of FPL)
Harris CountyOutside HarrisGolden TriangleCoastalWhiteHispanicBlack<200%200%+
Have had a harder time controlling temper19% 21% 16% 27% 16% 20% 14% 28% 22% 17%
Mental health has gotten worse as a result of Harvey18201523162014252215
Started taking a new prescription medicine for problems with mental health1011871111714128
Increased alcohol use because of Harvey66557541173
Experienced any of the above problems31322642313424373429
Percent who say they or another family member in their household received mental health services since Harvey887111010413107

Focus group highlight: Mental health challenges and services

Focus group participants were chosen to represent one of the hardest-hit groups: those who say their lives are still disrupted nearly one year after the hurricane. The emotions expressed in the groups were often intense, with issues of stress, anxiety, anger, and depression being raised in each group. For some, this stress was a reaction to the physical and financial challenges associated with recovery, while for others, stress was triggered by the difficulty of navigating the processes for receiving financial help. Several participants mentioned the need for better support systems to connect those who are still struggling to piece their lives together.

“Depression … the everyday life after Harvey – like it stopped, for a lot of us. We pick ourselves back up. It’s hard, it’s frustrating, and it’s also depressing.” – 29-year-old Hispanic female, Houston

“Material damages? [Those can be fixed in] two or three years. But emotional? It’s something that you could have to live with for your whole life.” – 37-year-old undocumented Hispanic male, Houston

“I was angry as all hell [about the process for receiving assistance]. I’m not going to lie to you. I’m not going to act out on anybody, but when I see these agencies email you back saying, ‘Come over here and sign up again for Red Cross.’ They’re now doing a $2,000 payment. They did it again, nothing.” – white male, Dickinson

“I think support systems are good. I’m not talking about family. I’m talking about being able to go and talk with people that may be able to help – with not everything, but some things. Sometimes all you’ve got to do is go in to talk to somebody that’s willing to listen. ” – 65-year-old Black female, Port Arthur

“I’m a pretty functional individual, but you know what? This has pulled the rug from under me. I watched them do this to other people. I said this lady is totally exhausted. We really need some prepared people for mental health. I think we’re starting to see it in many avenues. But there are a lot of exhausted people that are still not home.” – 55-year-old Black female, Dickinson

Living through a disaster can have varying effects on the resilience of individuals and communities. While much research on disaster resilience is conducted at the community level, measuring individuals’ self-reported sense of resilience can also be illuminating. For example, ten years after Hurricane Katrina hit New Orleans, most city residents who had lived through the storm felt that the experience had made them better able to cope with future stresses rather than less able to cope.6  The current survey finds a similar situation among Texas Gulf Coast residents affected by Hurricane Harvey – 66 percent say their experiences with the storm have made them better able to cope, while 22 percent say these experiences have made them less able to cope.

However, self-reported resilience differs among affected groups, with lower-income residents, Black residents, and those who experienced at least major damage or who remain displaced from their homes more likely than others to say their Harvey experiences have had a negative effect on their resilience (though majorities of all these groups say the experience has made them better able to cope). However, two other groups stand out as reporting more negative than positive impacts on their ability to cope. Among those who say someone in their household has a health condition that is new or worse since Harvey, about half feel their experiences have made them less able to cope with future stresses, while four in ten say they are better able to cope. The difference is even more dramatic among those who say their own mental health is worse as a result of Harvey, with about twice as many saying they feel less able to cope (62 percent) as saying they feel better able to cope (33 percent).

Figure 23: Most Affected Groups Say Harvey Made Them Better Able to Cope, Except Those Reporting Health or Mental Health Effects

Immigration Issues and Harvey Recovery

Immigrants, particularly those who do not have legal resident status in the U.S., may be more vulnerable than others to the effects of natural disasters, and may find it more difficult to seek or obtain the help they need in the aftermath of an event like Hurricane Harvey. The survey finds that immigrants living in the Texas Gulf Coast area who are likely to be undocumented are more likely than either immigrants with legal resident status or native-born residents to report being affected by Hurricane Harvey.7  Specifically, potentially undocumented immigrants are more likely to report that their home was damaged and that someone in their household lost a job, had hours cut back at work, or lost some other form of income as a result of the storm. However, among those who were affected by the storm, there is not a significant difference by immigration status in the share who say their lives are still disrupted or that they are not getting the help they need.

Table 4: Effects of Hurricane Harvey by Immigration Status
Potentially Undocumented ImmigrantsImmigrants with Legal Resident StatusNative-born Residents
Percent affected by Hurricane Harvey (NET)78%57%56%
home was damaged493637
any household member had job/income loss694435
vehicle was damaged271918
AMONG THOSE AFFECTED BY HURRICANE HARVEY: Percent who say…
…their lives are still disrupted30%28%30%
…they are not getting the help they need505139

The first survey in this series, conducted three months after Harvey, found that over half of residents who are likely to be undocumented immigrants were worried that if they tried to get help in recovering from the hurricane, they might draw attention to their own immigration status or that of a family member. The current survey took a more direct approach to find out how often these worries are actually preventing people from seeking services they need. Among those who are likely to be undocumented immigrants, nearly four in ten (38 percent) say there was a time since Hurricane Harvey when they thought they needed help but avoided seeking help or accessing services because they were afraid of drawing attention to their own or a family member’s immigration status.

Figure 24: Four in Ten Potentially Undocumented Residents Avoided Seeking Help for Fear of Revealing Immigration Status

Focus group highlight: Immigration issues

The two focus groups held in Houston were conducted in Spanish with individuals who were born outside the United States: one with people who report having legal resident status and one with people who are likely to be undocumented. In both groups, people raised concerns about applying for aid without legal status or a social security number. Several participants also raised concerns about potential employers and others taking advantage of people who are undocumented in a post-disaster situation where people are desperate for work.

“I heard that if you applied without papers or documents, they were registering you or recording you. So I was afraid of that. We were afraid it was like a trap. That they were getting that information to locate you.” – 32-year-old undocumented Hispanic female, Houston

“There are people who offer you work, and then after you finish the job you don’t find them anymore. They don’t pay you. [You need] some kind of protection because they don’t want to pay you. You can’t call the police.” – 56-year-old undocumented Hispanic male, Houston

“They were saying there was gonna be a lot of work after the hurricane, but there were many that didn’t pay. There’s a lot of fraud, lot of jobs that were not paid. [Moderator: A lot of exploitation?] Yea. People were needing work and they saw the opportunity” – 49-year-old undocumented Hispanic female, Houston

“Those car companies are abusing people. Especially with people that don’t have legal documents. You have to be very careful. Since we really need cars, and there are a lot of people who are really abusive. They buy cars that are not in good condition.” – 46-year-old Hispanic female, Houston

Key Findings: Section 2: Views On Priorities And Preparedness Among Residents Overall

Preparedness for Future Storms, Housing and Financial Assistance Are Main Focus of Residents’ Priorities

When asked about their priorities for rebuilding and recovery in their area, Texas Gulf Coast residents – including those affected by the hurricane and those who were not – identify many areas where more resources are needed, with the largest focus being on preparedness for future storms and providing financial and housing help to those in need.

The highest-ranking priority for residents overall is development of flood prevention and control strategies; about two-thirds (68 percent) say more resources are necessary in this area. In another forward-looking priority, nearly as many (64 percent) say more resources are necessary for community preparedness for future disasters. Just below these priorities are two items related to basic needs for those recovering from Harvey: getting financial help to people who need it (63 percent) and rebuilding destroyed homes (62 percent). About half say more resources are needed in getting mental health services to those who need them (52 percent, an increase from 42 percent in the first post-Harvey survey), helping small businesses affected by the storm (51 percent), and repairing roads and highways (49 percent, up from 40 percent in the first survey). Four in ten say more resources are needed for repairing damaged schools (44 percent) and rebuilding community spaces like recreation centers and parks (42 percent).

Figure 25: Preparation for Future Storms, Financial and Housing Help Top Residents’ Priority List

Many Residents Are Not Confident that Relief Funding Is Benefiting Those Most in Need

Overall, a slim majority (54 percent) of Texas Gulf Coast residents say they are “very” or “somewhat” confident that the money being spent on hurricane relief in Texas is benefiting the people who need it most. On the other hand, about four in ten (42 percent) say they are either “not too confident” or “not at all confident.”

Among those who personally felt more severe impacts from the storm, however, fewer say they are confident that relief money is benefiting those most in need. For example, while six in ten residents who were not affected by Harvey are confident that funds are going to those who need them most, those who personally experienced property damage or income loss are more evenly split (50 percent confident, 46 percent not confident). Among some of the most heavily impacted groups, including those who say their mental health has worsened as a result of Harvey, that their application for federal assistance was denied, or that someone in their household has a new or worsened health condition due to the storm, roughly two-thirds say they are not confident that the money being spent on hurricane relief in Texas is benefiting the people who need it most.

Figure 26: Some Groups Who Were More Heavily Impacted Are Less Likely to Be Confident Funding is Benefiting Those Most in Need

While Texans in the 24-county area recognize many different groups who have been helped by the relief efforts, some groups are perceived to have been helped more than others. About six in ten think efforts to rebuild the Texas gulf coast area after Hurricane Harvey have done either “a lot” or “some” to help wealthy and middle class people, but four in ten (42 percent) say efforts have done either “not too much” or “nothing at all” to help poor people. Along the same lines, residents are somewhat more likely to say relief efforts have helped people who are white (63 percent) than say the same about people who are African American (55 percent) or Hispanic (53 percent). About half of residents say efforts have done at least some to help people like them, whereas fewer (39 percent) say the same about immigrants. It’s worth noting that roughly one in five residents say they are not sure how much relief efforts have done to help some of these groups.

Figure 27: Residents More Likely to Say Relief Efforts are Benefiting Wealthy/Middle Class and White Residents than Other Groups

In June 2018, the federal government approved a $5 billion federal block grant plan for Hurricane Harvey relief in Texas.8  This plan will allow the public to provide input into how long-term federal funds are spent. One in five residents in the 24 Texas counties surveyed say they are aware that the federal government has provided funding to help Texas with long-term recovery and rebuilding, while 6 percent say it has not provided any funding, and a large majority (73 percent) do not know enough to say. Of the share who are aware of long-term federal funding, roughly half (9 percent of all Texans in the 24-county area) say there is a way for the public to provide input and about a third (7 percent of all residents) say there is no way for the public to provide input.

Figure 28: Most Are Not Aware of Federal Government Funding to Help Texas with Long-Term Recovery

Looking to The Future: Preparedness for Future Storms

With hurricane season once again underway, the survey examined residents’ views on their own preparedness and the preparedness of government officials to deal with future storms. Overall, majorities of residents see officials at each level of government as at least somewhat prepared to deal with future hurricanes. Three-quarters (75 percent) say that both Texas state officials and local officials in their city, town, or county are either “very prepared” or “somewhat prepared” to deal with hurricanes in the future, while about two-thirds (64 percent) say the same about federal government officials.

Figure 29: Most See Government Officials as at Least Somewhat Prepared to Deal with Future Hurricanes

While majorities of residents in each of the four regions surveyed say that local officials are at least somewhat prepared to deal with future hurricanes, those living in the Golden Triangle are somewhat more likely than those in other regions to say officials are “not too” or “not at all” prepared (30 percent versus between 18 and 21 percent in other areas).

Figure 30: Golden Triangle Residents Somewhat Less Likely to Say Local Officials Are Prepared to Deal with Future Hurricanes

On a more personal level, roughly three-quarters of residents also say that they themselves are either “very prepared” (32 percent) or “somewhat prepared” (45 percent) to deal with future hurricanes. However, there are differences by self-reported income and race/ethnicity in how prepared people feel. Residents with lower household incomes below 200 percent of the Federal Poverty Level are almost three times as likely as those with higher incomes to say they are not prepared to deal with hurricanes in the future. Similarly, a larger share of Black and Hispanic residents say the same compared to their white counterparts.

Table 5: Personal Preparedness for Future Hurricanes
Overall, how prepared do you think you, yourself are to deal with hurricanes in the future?TotalGeographic RegionRace/EthnicitySelf-reported Income(% of FPL)
Harris CountyOutside HarrisGolden TriangleCoastalWhiteHispanicBlack<200%200%+
Prepared (NET)77%75%81%78%80%89%63%73%65%88%
Very prepared32313629304024272439
Somewhat prepared45444649494939464249
Not too prepared (NET)21%24%17%21%20%11%35%26%33%12%
Not too prepared121211101071912178
Not at all prepared1012612941714164
NOTE: Don’t know/Refused responses not shown.

Although a large majority of Texas Gulf Coast residents say they feel prepared to deal with future hurricanes, about half (52 percent) say they and their family have not actually taken any steps to do so since last year. The other half (47 percent) say they have taken steps to prepare for future hurricanes, including at least three in ten who say they have prepared a disaster supply kit with emergency supplies (36 percent) or disaster communications plan for their family (30 percent). Fewer say they have made physical changes to their home (16 percent) or purchased additional homeowners’ or renters’ insurance (9 percent).

Figure 31: Half Say They Have Personally Taken Steps to Prepare for Future Hurricanes

The share who say they’ve taken steps to prepare for future hurricanes does not differ by race/ethnicity or income, but residents of the Golden Triangle are somewhat more likely than those in other regions to report taking such steps (see Table 6).

Table 6: Actions Taken to Prepare for Future Hurricanes
TotalGeographic RegionRace/EthnicitySelf-reported Income(% of FPL)
Harris CountyOutside HarrisGolden TriangleCoastalWhiteHispanicBlack<200%200%+
Percent who say they have taken any steps to prepare for future hurricanes in their area:47%46%45%57%52%47%46%46%47%48%

Appendices: Appendix A: Survey And Focus Group Methodology

Survey Methodology

The Kaiser Family Foundation/Episcopal Health Foundation Harvey Anniversary Survey was conducted by telephone June 21 – July 29, 2018 among a random representative sample of 1,651 adults ages 18 and older living in 24 counties along the Texas gulf coast. The counties were chosen based on a mapping analysis of Harvey property damage developed by FEMA, in an effort to examine a contiguous area of counties that suffered the largest share of property damage in 2017. The region was further divided into four groupings of counties: 1) Harris County; 2) Counties surrounding Harris (Liberty, Chambers, Galveston, Brazoria, Matagorda, Wharton, Colorado, Austin, Waller, Fort Bend, Montgomery, and Walker counties); 3) Golden Triangle (Jefferson, Hardin, and Orange counties); and 4) Coastal counties (Nueces, San Patricio, Refugio, Aransas, Calhoun, Victoria, Jackson, and Lavaca counties).

Appendix A – Figure 1. Counties included in survey sample based on FEMA damage assessments

Interviews were administered in English and Spanish, combining random samples of both cellular and landline telephones (note: persons without a telephone could not be included in the random selection process). Sampling, data collection, weighting and tabulation were managed by SSRS in close collaboration with Kaiser Family Foundation and Episcopal Health Foundation researchers. Episcopal Health Foundation paid for the costs of the survey fieldwork, and Kaiser Family Foundation contributed the time of its research staff. Both partners worked together to design the survey and analyze the results.

The sampling procedures were designed to reach set numbers of respondents in each of the four county-groups and to oversample particular vulnerable subpopulations who were likely to require assistance in the aftermath of the hurricane, namely: people who experienced property damage as a result of the hurricane, specifically those with household incomes near or under poverty level, Hispanic residents (in particular, non-native Hispanics), and Black residents. Some respondents were reached by oversampling cellular and landline numbers matching directory-listings in areas where data from the Federal Emergency Management Agency (FEMA) indicated large amounts of property damage due to Harvey. The sampling and screening procedures included an oversample component designed to increase the number of low-income respondents, specifically low-income Hispanic and Black respondents. This included 80 respondents who were reached by calling back respondents in the affected areas who had previously completed an interview on the SSRS Omnibus poll and indicated they fit one of the oversample criteria (based on income and race). In addition, cell phone numbers identified as pre-paid or pay-as-you go were oversampled to reach low-income, Spanish-speaking respondents in areas with a high-density of Hispanic populations.

The dual frame cellular and landline phone sample was generated by Survey Sampling International (SSI) using random digit dial (RDD) procedures. All respondents were screened to verify that they resided in one of the 24 counties covered by this study at the time Harvey hit Texas. For the landline sample, respondents were selected by asking for the youngest adult male or female currently at home based on a random rotation. If no one of that gender was available, interviewers asked to speak with the youngest adult of the opposite gender. For the cell phone sample, interviews were conducted with the adult who answered the phone.

A multi-stage weighting design was applied to ensure an accurate representation of the population of each county-group. The first stage of weighting involved corrections for sample design, including accounting for oversampling of the most-affected areas and the prepaid oversample, as well as non-response for the callback sample. In the second weighting stage, demographic adjustments were applied to account for systematic non-response along known population parameters, within each county-group. Population parameters included gender, age, race, Hispanicity (broken down by nativity), educational attainment, and phone status (cell phone only or reachable by landline). This stage excluded the oversample components. Based on this second stage of weighting, estimates were derived for the share of low-income respondents (Black, Hispanic and other) in the population. The third stage of weighting included all respondents in each county-group and included income-status (low or high) by race/ethnicity based on the previous stage’s outcomes. In the last stage each county-group was weighted to accurately represent its adult-population share within the Affected Area. Weighting parameters were provided by SSI based on recent estimates from the U.S. Census Bureau’s 2016 American Community Sample (ACS) for Harris County and 5-year (2011-2015) cumulative data from the ACS for other county groups. Phone status was derived from the first wave’s sample of respondents for each county-group on the SSRS Omnibus poll.

The margin of sampling error including the design effect for the full sample is plus or minus 3 percentage points. Numbers of respondents and margins of sampling error for key subgroups are shown in the table below. For results based on other subgroups, the margin of sampling error may be higher. Sample sizes and margins of sampling error for other subgroups are available by request. Note that sampling error is only one of many potential sources of error in this or any other public opinion poll. Kaiser Family Foundation public opinion and survey research is a charter member of the Transparency Initiative of the American Association for Public Opinion Research.

GroupN (unweighted)M.O.S.E.
Total1,651+/- 3 percentage points
Harris716+/- 4 percentage points
Outside Harris320+/- 6 percentage points
Golden Triangle303+/- 7 percentage points
Coastal312+/- 6 percentage points
Affected by Harvey1,001+/- 4 percentage points
Harris422+/- 5 percentage points
Outside Harris150+/- 9 percentage points
Golden Triangle214+/- 8 percentage points
Coastal215+/- 8 percentage points

Focus Group Methodology

As part of this project, the Kaiser Family Foundation and the Episcopal Health Foundation conducted focus groups to gather qualitative data from vulnerable populations affected by Hurricane Harvey. Topics covered in the focus groups were similar to those covered in the survey. Two groups each were held in Houston (July 24 and July 25), Port Arthur (July 24), and Dickinson (July 25, 2018). In total, six two-hour groups were conducted with eight participants each.

To qualify for each group, individuals must have said: 1) that their home or the place they were living had major damage or was destroyed as a result of Hurricane Harvey, and 2) that their day-to-day life was still very or somewhat disrupted at the time of the focus group screening. An effort was made to mainly include participants with incomes below 200% of the federal poverty level. However in order to fill the Port Arthur and Dickinson groups, a few participants with somewhat higher incomes were included. Recruitment aimed to target a mix of men and women, and a mix of owners and renters.

The two Houston groups were conducted with Hispanics in Spanish – one of which consisted of participants who self-identified as undocumented immigrants and one with people born outside the U.S. who reported having legal resident status. Participants of all races/ethnicities were recruited for the Port Arthur and Dickinson groups and were interviewed in English. However, reflecting the demographics of Harvey-affected residents in the area, nearly all of the participants in Port Arthur were African American. Participants in Port Arthur and Dickinson were given an incentive of $100, and participants in Houston were given $125 since the groups were conducted in the morning, a more difficult time to recruit for.

ConneXion Research recruited and provided moderator services for each group. The Houston groups were held at ConneXion’s research facility, and the Port Arthur and Dickinson groups were held in meeting rooms at local churches. The screener questionnaire and discussion guide were developed by researchers at the Kaiser Family Foundation and the Episcopal Health Foundation, and translated into Spanish by ConneXion Research. Groups were audio and video recorded with participants’ permission. Focus group costs were paid for by the Episcopal Health Foundation.

Appendices: Appendix B: Share Of Residents Affected By Hurricane Harvey By Geography, Race/ethnicity, And Income

Appendix B Table 1: Share of Residents Affected by Hurricane Harvey
Percent who report the following as a result of Hurricane Harvey:TotalGeographic RegionRace/EthnicitySelf-reported Income(% of FPL)
Harris CountyOutside HarrisGolden TriangleCoastalWhiteHispanicBlack<200%200%+
Home was damaged (NET)38%38%29%57%62%34%43%43%45%35%
        Major damage/destroyed19181638271921202318
        Minor damage18191317341521222116
Vehicle was damaged19211237101519302514
Someone in household experienced income/job loss40443242352754495331
NET affected in any of the above ways 58614872715069697151

Appendices: Appendix C: Focus Group Written Exercise Results

One part of the focus group included an exercise where the moderator asked the following questions and recorded participants’ responses on an easel. The number of groups in which each type of response was mentioned is reported in the tables below.

Appendix C Table 1: In terms of housing, what are the issues or problems you’re having?
CategoryNumber of Groups that Mentioned
Walls/Sheetrock6
Floors6
Furniture4
Foundation4
Kitchen3
Roof3
Doors3
Electricity/Appliances/Light/AC3
Mold2
Apartment/Rental2
Fences2
Ceilings2
Cars1
Fireplace1
Windows1
Gutted houses1
Repairs not getting done1
Gutters1
Bathroom1
Insulation1
Clothes/Linen1
Fixtures1
Appendix C Table 2: In terms of housing, what are the resources or solutions you need for long-term recovery?
CategoryNumber of Groups that Mentioned
Better/reliable/qualified contractors/workers5
Materials/tools/supplies3
Financial help/funding (general)3
Easier access to financial assistance3
Help with insurance3
Drainage/debris removal2
Help with mold2
Debt/mortgage relief/help with credit2
Better training for FEMA inspectors/adjustors2
More help from federal government1
Tax breaks1
Support groups1
Make housing for the homeless available1
Allow individuals to receive aid from multiple groups1
Lower prices1
Appendix C Table 3: In terms of employment, what are the issues or problems you’re having?
CategoryNumber of Groups that Mentioned
Lost employment/lack of employment5
Lack of vehicle/transportation3
Hours cut back2
Slow-down in business2
Forced retirement1
Lost equipment/tools1
Childcare issues1
Lack of resources1
No access to unemployment benefits1
Poor quality jobs1
Employers don’t want to hire people impacted by Harvey1
Anger/mental health1
Living arrangements make job search difficult1
Appendix C Table 4: In terms of employment, what are the resources or solutions you need for long-term recovery?
CategoryNumber of Groups that Mentioned
Vehicle/transportation3
More legal protection for workers2
Provide tools for those who lost them2
Access to credit/capital for small businesses2
Job bank/centralized location for assistance2
Assistance with job search2
Employers be more understanding/allow flexibility2
Assistance from churches1
Better communication1
More help from city/government1
More help from the community1
Hire locally1
Provide more jobs1
Financial help for small businesses1
Simplify process for receiving help1
Help for veterans and disabled1
Access to credit/capital (in general)1
Help with childcare1
Appendix C Table 5: In terms of health, what are the issues or problems you’re having?
CategoryNumber of Groups that Mentioned
Stress5
Asthma/respiratory problems5
Insomnia/sleeping problems4
Depression4
Rashes/infections/skin problems3
Allergies3
Anxiety3
Anger2
Appetite/weight changes2
Headaches2
Mold-related illness1
Exhaustion1
Arthritis1
General mental health1
Heart attack1
Panic attacks1
High blood pressure1
Soreness1
Confusion1
Urinary infection1
Kidney failure1
Less excitement about activities1
Appendix C Table 6: In terms of health, what are the resources or solutions you need for long-term recovery?
CategoryNumber of Groups that Mentioned
Better access to therapy/counseling2
More concern/empathy/listening2
Mobile clinics2
Assistance with process for receiving aid2
Support groups/systems2
Better access to health insurance2
Evaluation of funding/help provided2
Better training for mental health help1
Legal help1
Honesty from local officials1
Better communication/dissemination of information1
Massage/relaxation/spa1
Access to affordable health care1
Hobbies/distractions1
Positive attitude1
Funding to fix houses1
Vote different people into office1
Help for uninsured1
Help with medicine1

Endnotes

  1. National Hurricane Center, Tropical Cyclone Report, May 2018. https://www.nhc.noaa.gov/data/tcr/AL092017_Harvey.pdf ↩︎
  2. FEMA, Housing Assistance Data, accessed July 2018. https://www.fema.gov/media-library/assets/documents/34758 ↩︎
  3. Rebuild Texas, Recovery Tracker, accessed July 2018. https://www.rebuildtexas.today/recovery-tracker/ ↩︎
  4. The counties included in each cluster are: Cluster One: Harris County; Cluster Two (Surrounding Harris): Liberty, Chambers, Galveston, Brazoria, Matagorda, Wharton, Colorado, Austin, Waller, Fort Bend, Montgomery, and Walker counties; Cluster Three (Golden Triangle): Orange, Jefferson and Hardin; and Cluster Four (Coastal): Nueces, San Patricio, Refugio, Aransas, Calhoun, Victoria, Jackson, and Lavaca counties. ↩︎
  5. Analysis of U.S. Census Bureau American Community Survey data. ↩︎
  6. L Hamel, J Firth, M Brodie, New Orleans Ten Years After The Storm: The Kaiser Family Foundation Katrina Survey Project. https://modern.kff.org/report-section/new-orleans-ten-years-after-the-storm-section-4/ ↩︎
  7. The survey used questions to determine the likely immigration status of respondents by asking those who were born outside the U.S. whether they were a permanent resident (i.e. had a green card) when they came to the U.S. or if their status had been changed to permanent resident since arriving. In the current survey, 9 percent of residents in the 24-county area, including 23 percent of Hispanics, said they have not been granted permanent resident status, indicating that they are likely to be undocumented immigrants. ↩︎
  8. The Texas Tribune, Federal government approves Texas plan for long-term Harvey recovery funds, June 2018. https://www.texastribune.org/2018/06/25/hurricane-harvey-long-term-recovery-funds-approved-federal-government/     ↩︎
News Release

Survey: One Year after Hurricane Harvey, 3 in 10 Affected Texas Gulf Coast Residents Say Their Lives Remain Disrupted

About 4 in 10 Affected Residents Say They are Still Not Getting Needed Help; Housing, Financial Assistance and Help Navigating Aid Systems Top List of Unmet Needs

Published: Aug 23, 2018

Nearly a year after Hurricane Harvey swamped the Texas Gulf Coast, a growing share of affected residents say their lives are back on track, but three in 10 (30%) say their lives remain disrupted, finds a new Kaiser Family Foundation/Episcopal Health Foundation survey of residents in 24 hard-hit Texas counties.

Overall the new survey finds 70 percent of affected residents say their lives are largely or almost back to normal, up from 56 percent three months after the storm. Affected residents include those who reported property damage or income loss due to Hurricane Harvey – about six in 10 (58%) of all residents across the 24-county area.

Some, especially those who suffered severe damage to their homes, continue to struggle. The survey finds 8 percent of all residents remain displaced from their pre-Harvey homes. This includes 20 percent of Beaumont/Orange/Port Arthur area residents.

The new KFF/EHF survey is the second to probe the experiences and views of residents in this region, which includes Houston and Harris County; the counties surrounding Harris; the Golden Triangle area east of Houston that includes Beaumont, Orange and Port Arthur; and the coastal counties southwest of Houston that include Corpus Christi and Rockport. The survey also finds income, geographic, and racial/ethnic differences in residents’ recovery and challenges following Harvey.

“This survey shows how much Harvey continues to haunt many across coastal Texas, with significant shares reporting ongoing challenges with their housing, finances and health,” said Drew Altman, president and CEO of the Kaiser Family Foundation. “Residents’ top priorities include both preparing for future storms and providing financial assistance and help rebuilding homes for those who need it.”

“One year later, many of those with the fewest resources are still struggling to bounce back from Harvey’s punch,” said Elena Marks, president and CEO of the Episcopal Health Foundation. “This kind of information is crucial to letting government and other recovery groups know what Texans still need for a long-term comeback.”

While most affected residents say their personal financial situation and quality of life are about the same as they were before the storm, the survey finds that nearly a quarter (23%) say their personal financial situation is worse due to the storm and that one in six (17%) say their overall quality of life is worse because of the storm.

One worrying sign: About four in 10 affected residents (42%) say they are not getting the help they need to recover, essentially unchanged since three months after the storm. Groups most likely to say they aren’t getting the help they need include affected residents who are Black (60%), living in the Golden Triangle (50%), or have self-reported incomes below 200% of the federal poverty level (50%).

The biggest areas of need are applying for financial assistance (28% of affected residents say they need more help), navigating the different systems for receiving aid (27%) and repairing home damage (24%), the survey finds.

Affected residents also say they need more help finding affordable housing (14%), finding a job (11%), and getting health care (16%) and mental health care (9%). These shares are little changed since three months after the first survey, suggesting that help has been slow to come to those most in need.

Residents See Storm Preparedness and Financial and Housing Help as Greatest Priorities

When both affected and unaffected residents across the Texas Gulf Coast were asked about their priorities for rebuilding and recovery in their area, the greatest focus is on preparing for future storms and providing financial and housing help to those in need.

Two-thirds (68%) of residents say more resources are needed for flood prevention and control strategies; nearly as many (64%) say so for community preparedness for future disasters. Ranking just below these priorities are getting financial help to people who need it (63%) and rebuilding destroyed homes (62%).

About half say more resources are needed in getting mental health services to those who need them (52%, up from 42% in previous survey), helping small businesses (51%), and repairing roads and highways (49%, up from 40% in the first survey). Four in 10 say more resources are needed for repairing damaged schools (44%) and rebuilding community spaces like recreation centers and parks (42%).

With the 2018 hurricane season already underway, most residents say that they believe government officials at all levels are at least somewhat prepared to deal with future hurricanes. This includes Texas state officials (75%); local city, town, and county officials (75%) and the federal government (64%).

About three-quarters (77%) also say that they themselves are ready to deal with future hurricanes, though about half (52%) say they have not personally taken any specific steps to prepare.

Three in 10 Affected Residents Say Storm Affected Their Mental Health; Few Getting Help

About three in ten (31%) affected residents report some storm-related negative effects on their mental health, including having a harder time controlling temper (19%), feeling their mental health has gotten worse (18%), taking a new prescription for a mental health issue (10%), or increasing their alcohol use because of Harvey (6%). These shares are similar to those reported three months after Harvey, suggesting there has not been either much improvement or further decline since then.

Despite the relative prevalence of these issues, few (8%) affected residents say that they or someone in their household has received any mental health services since the storm. A similarly small share (11%) say there was a time since the hurricane when they thought they or a family member might need mental health services but did not receive them. These shares are somewhat higher among those who say their lives are still disrupted from the storm.

Some Say Health Effects from the Storm Persist

Overall, one in six (16%) affected residents say they or someone in their household has a health condition that is new or has gotten worse since Harvey. That’s similar to the share reporting health problems three months after the storm, suggesting that many health effects from the storm have lingered. The most commonly reported new or worsening health conditions include respiratory problems such as asthma, coughing or other breathing problems (32% of those reporting a health condition), and high blood pressure (10%).

Other findings include:

  • FEMA assistance. Four in 10 affected residents (41%) say they applied for disaster assistance through the Federal Emergency Management Administration or the Small Business Administration. Among this group, similar shares say their application was approved (39%) or denied (42%). Most who received such aid say they were satisfied with the amount received (60%), but some say they were dissatisfied (37%).
  • Financial help. Taking into account all sources of financial help including insurance payments, disaster aid, and help from charities, most affected residents say this assistance will cover very little (18%) or none (27%) of their financial losses from the storm, or that they haven’t received any financial help (21%). Fewer say such payments will cover most (14%) or “just some” (18%) of their financial losses.
  • Federal aid to local governments. In June, the federal government approved a $5 billion block grant for Texas relief efforts, but the survey finds most residents in the 24 counties don’t know about it. One in five (20%) say they are aware that the federal government has provided funding to help Texas with long-term recovery and rebuilding.

 METHODOLOGY

Designed and analyzed by researchers at the Kaiser Family Foundation and the Episcopal Health Foundation, the Harvey Anniversary Survey was conducted by landline and cellular telephone June 21 – July 29, 2018 among a random representative sample of 1,651 adults ages 18 and older living in 24 Texas counties that suffered large amounts of property damage from Hurricane Harvey according to FEMA reports. The margin of sampling error including the design effect is plus or minus 3 percentage points for the full sample and plus or minus 4 percentage points for the sample of affected residents. For results based on other subgroups, the margin of sampling error may be higher.

Closing the Medicare Part D Coverage Gap: Trends, Recent Changes, and What’s Ahead

Authors: Juliette Cubanski, Tricia Neuman, and Anthony Damico
Published: Aug 21, 2018

As of 2019, Medicare beneficiaries enrolled in Part D prescription drug plans will no longer be exposed to a coverage gap, sometimes called the “donut hole”, when they fill their brand-name medications. The coverage gap was included in the initial design of the Part D drug benefit in the Medicare Modernization Act of 2003 in order to reduce the total 10-year cost of the benefit. Subsequent legislative changes are phasing out the coverage gap by modifying the share of total costs paid in the gap by Part D enrollees and plans and requiring drug manufacturers to provide a discount on the price of brand-name drugs in the gap. This data note presents trends on the Part D coverage gap and discusses recent and proposed changes affecting out-of-pocket costs for Part D enrollees who reach the coverage gap.

Summary

  • In 2016, the most recent year of available data, more than 5 million Part D enrollees without low-income subsidies (LIS) reached the coverage gap, spending $1,569 out of pocket, on average, and receiving an average manufacturer discount of $1,090. Due to provisions in the Affordable Care Act (ACA) to phase out the coverage gap, average out-of-pocket costs for non-LIS Part D enrollees who reach the coverage gap decreased substantially between 2010 and 2011 but have increased somewhat in recent years.
  • Under changes made by the Bipartisan Budget Act of 2018 (BBA), Part D enrollees’ out-of-pocket costs for brands in the gap will decline from 35 percent of total costs in 2018 to 25 percent in 2019—rather than in 2020—while plans’ share of costs for brands will decrease to 5 percent and the manufacturer discount will increase from 50 percent to 70 percent. Recent calls to modify the BBA changes to the coverage gap could lead to higher beneficiary out-of-pocket costs and higher Medicare spending.
  • Between 2019 and 2020, the annual out-of-pocket spending threshold—the amount beneficiaries must spend before the coverage gap ends and catastrophic coverage begins—is projected to increase by $1,250. This is due to the expiration of the ACA provision that slowed the growth rate of this threshold between 2014 and 2019. Enrollees who take only brands in the coverage gap will face $375 in additional direct out-of-pocket costs in 2020, with the remainder covered by the manufacturer discount.
  • Counting the manufacturer discount as beneficiary out-of-pocket spending has contributed to a growing number of non-LIS Part D enrollees qualifying for catastrophic coverage, doubling from just under 500,000 in 2011 to 1.0 million in 2016. This has led to an increase in Medicare Part D spending in recent years, since Medicare pays 80 percent of enrollees’ total drug costs in the catastrophic phase.
  • A Trump Administration proposal to exclude the manufacturer discount from the calculation of out-of-pocket spending would substantially increase Part D enrollees’ out-of-pocket costs and would lead to fewer enrollees qualifying for catastrophic coverage.

Background on the Part D Coverage Gap and Legislative changes since 2006

Under the original design of the Medicare Part D benefit, created by the Medicare Modernization Act of 2003, when Part D enrollees’ total drug spending exceeded the initial coverage limit (ICL), they entered a coverage gap. Enrollees who did not receive low-income subsidies (LIS) were required to pay 100 percent of their drug costs in the coverage gap until their out-of-pocket spending reached the threshold amount that qualified them for catastrophic coverage. (The coverage gap does not apply to beneficiaries who receive low-income subsidies.) In 2007, the first full year of the Part D benefit, 8.3 million Part D enrollees (32 percent of all enrollees) had total drug costs above the initial coverage limit and in the coverage gap (Figure 1). This total includes 3.8 million non-LIS enrollees who were required to pay 100 percent of their drug costs out of pocket in the coverage gap.

Figure 1: The number of Medicare Part D enrollees without low-income subsidies who reached the coverage gap increased from 3.8 million to 5.2 million between 2007 and 2016

Changes in the ACA

The Affordable Care Act (ACA) included a provision to phase out the coverage gap by gradually reducing the share of total drug costs paid by non-LIS Part D enrollees in the coverage gap, from 100 percent before 2011 to 25 percent in 2020. The ACA required plans to pay a gradually larger share of total drug costs, and also required drug manufacturers to provide a 50 percent discount on the price of brand-name drugs in the coverage gap, beginning in 2011. The ACA stipulated that the value of this discount would count towards a beneficiary’s annual out-of-pocket spending.

The ACA also modified the calculation of the annual out-of-pocket spending threshold between 2014 and 2019 so that the threshold amount would grow more slowly during these years (Figure 2). In 2020 and beyond, the threshold will be determined using the pre-ACA calculation. As a result, between 2019 and 2020, Medicare’s actuaries project that the out-of-pocket threshold for catastrophic coverage will increase from $5,100 to $6,350, as discussed further below.

Figure 2: The ACA slowed the growth rate for the annual out-of-pocket threshold between 2014 and 2019; in 2020, the threshold is projected to increase by $1,250 in 2020

Changes in the BBA of 2018

The Bipartisan Budget Act of 2018 (BBA) made additional changes to the coverage gap, accelerating a reduction in beneficiary coinsurance for brands from 30 percent in 2019 to 25 percent that year, and increasing the manufacturer discount from 50 percent to 70 percent, beginning in 2019, a change which is expected to reduce Medicare spending by $11.8 billion over a 10-year (2018-2027) period. In 2019 and later years, Part D plans will cover the remaining 5 percent of costs in the coverage gap, which is a reduction in their share of costs (down from 25 percent that would have been required under the ACA). The manufacturer discount in the coverage gap will continue to count towards beneficiaries’ annual out-of-pocket spending, and will help cover a portion of the projected increase in the annual out-of-pocket spending threshold in 2020 and beyond.

How Many Enrollees have Reached the Coverage Gap?

In 2016, the most recent year for which data are available, 5.2 million Part D enrollees without low-income subsidies faced out-of-pocket spending in the coverage gap, an increase from 3.8 million enrollees in 2007, but the number did not rise steadily over these years (Figure 1).

The number of non-LIS enrollees reaching the gap was relatively stable between 2007 and 2012, averaging 3.8 million over these years, even as the overall number of Part D enrollees increased. In part, this is because the amount of total drug spending required to reach the gap (the ICL) increased over these years, based on annual increases in the rate of growth in Part D per capita costs (Figure 2). Between 2012 and 2013, however, the number of non-LIS enrollees reaching the gap increased from 3.8 million to 4.7 million; the fact that the ICL increased only modestly for 2013 could help to account for this one-year increase in enrollees reaching the gap.

In 2014 and 2015, the number of non-LIS Part D enrollees reaching the gap increased further (to 5.5 million and 5.6 million, respectively), before declining to 5.2 million in 2016. The 2013-2014 increase in the number of enrollees reaching the coverage gap is likely due in part to a reduction in the ICL, which resulted from the negative growth rate (-4.0%) used to update Part D benefit parameters for 2014. The 2014-2015 increase may be due in part to the market entry in late 2013 of relatively expensive breakthrough medications to treat hepatitis C.

How Much Have Enrollees reaching the Coverage Gap Spent Out of Pocket?

In 2016, average out-of-pocket spending by non-LIS Part D enrollees who reached the coverage gap was $1,569, a decrease from the years before the ACA’s changes to the coverage gap took effect (Figure 3). Between 2010 and 2011, when the 50 percent manufacturer discount took effect and plans began covering 7 percent of total generic drug costs in the gap, average out-of-pocket costs for non-LIS enrollees who reached the gap decreased from $1,858 to $1,485. Between 2011 and 2014, average out-of-pocket costs for non-LIS Part D enrollees who reached the coverage gap decreased by $89, and then increased by $174 between 2014 and 2016.

Figure 3: Average out-of-pocket costs paid directly by non-LIS Part D enrollees who reached the coverage gap decreased when the manufacturer discount took effect in 2011

What is the Value of the Manufacturer Discount Received by Part D Enrollees Since 2011?

The manufacturer discount on brand-name drugs in the coverage gap represents valuable financial assistance for Part D enrollees with relatively high drug costs. On a per person basis, non-LIS Part D enrollees who reached the coverage gap in 2016 received an average discount on brand-name medications of $1,090, up from $565 in 2011 (Figure 4).

Figure 4: The value of the manufacturer discount on brand-name drugs in the Part D coverage gap has increased since 2011, along with the average discount per enrollee

With total Part D drug spending increasing over time and more non-LIS beneficiaries reaching the coverage gap, the aggregate discount that Part D enrollees have received on brand-name drugs has also increased—from $2.2 billion in 2011 to $5.7 billion in 2016.

Including the manufacturer discount in the calculation of beneficiary out-of-pocket costs partly explains why more non-LIS Part Denrollees have qualified for catastrophic coverage since 2011 (Figure 5). Non-LIS Part D enrollees move through the coverage gap more quickly because they have to spend less out of their own pockets before qualifying for catastrophic coverage.

Figure 5: Counting the manufacturer discount towards beneficiary out-of-pocket costs has contributed to a rise in the number of non-LIS Part D enrollees who qualify for catastrophic coverage

Between 2011 and 2016, the number of non-LIS Part D enrollees who qualified for catastrophic coverage doubled from 0.5 million to 1.0 million, while their average out-of-pocket costs increased by a relatively modest 6 percent, from $3,004 to $3,196. This trend has contributed to an increase in Medicare Part D spending in recent years, since Medicare pays 80 percent of enrollees’ total drug costs in the catastrophic coverage phase. According to MedPAC, Medicare spending for catastrophic coverage expenses (“reinsurance”) is now the largest, and fastest growing, portion of Part D program spending.

What’s on the Horizon for Beneficiaries who Reach the Coverage Gap?

Closing the Coverage Gap for Brands in 2019

As of 2019, there will no longer be a coverage gap for brand-name drugs, as a result of changes in the BBA. Beneficiary coinsurance for brands in the gap will be 25 percent in 2019, the same share of costs that they face for brands under the standard benefit design before they reach the coverage gap. The coverage gap for generic drugs will not be fully closed until 2020, as scheduled in the ACA. In 2019, beneficiaries will pay 37 percent of the cost of generic drugs, and plans will pay the remaining 63 percent.

Increase in the Annual Out-of-Pocket Spending Threshold in 2020

Between 2019 and 2020, the annual out-of-pocket spending threshold—the amount of out-of-pocket spending Part D enrollees need to incur to exit the coverage gap and qualify for catastrophic coverage—is scheduled to increase by $1,250, from $5,100 to $6,350. As mentioned above, this substantial one-year increase is due to the expiration of the ACA provision that modified the calculation of the annual out-of-pocket spending threshold between 2014 and 2019; in 2020 and beyond, the threshold will be determined using the pre-ACA calculation.

For Part D enrollees who take mostly brands and who reach the coverage gap, most of this increase in out-of-pocket spending will be covered in the form of the 70 percent manufacturer discount in the gap. For enrollees who take only brand-name drugs, the $1,250 increase would consist of $375 in additional direct out-of-pocket costs, with the remainder in the form of the coverage gap discount.

Proposed Changes to the Coverage Gap

Excluding the Manufacturer Discount from Beneficiary Out-of-Pocket Spending

The Trump Administration has proposed several changes to the Part D benefit, including a proposal to exclude the value of the manufacturer discount from the calculation of enrollees’ annual out-of-pocket costs. (The GOP House Budget proposal for FY2019 included the same provision.) The Congressional Budget Office estimated that this proposal would reduce federal spending by $58.5 billion over 10 years. This change would result in a substantial increase in beneficiary out-of-pocket costs, and would lead to fewer Part D enrollees qualifying for catastrophic coverage, similar to the years between 2007 and 2012. If this change was adopted prior to 2020, the $1,250 increase in the annual out-of-pocket spending threshold scheduled to occur in 2020 would be paid entirely by beneficiaries.

Modifying Changes to the Coverage Gap Made by the BBA

There are efforts underway in Congress to modify the coverage gap changes made by the BBA, while also preventing the upcoming steep increase in the out-of-pocket spending threshold. The effort to modify the BBA changes would reallocate payer liability in the coverage gap, motivated in part by pharmaceutical industry concerns about the requirement that they provide a larger discount on brand-name drugs starting in 2019. In addition, there is some concern that the reduced share of brand-name drug costs paid by plans in the coverage gap will weaken their financial incentive to manage enrollees’ costs once they cross the initial coverage limit and enter the coverage gap phase of the benefit.

Legislation has not yet been introduced to modify the BBA coverage gap provisions, and it unclear whether policymakers are contemplating changes to the beneficiary coinsurance rate in the gap, which is scheduled to be 25 percent for brands beginning in 2019. Increasing plans’ share of costs in the coverage gap and reducing the manufacturer discount to something less than 70 percent for 2019 and beyond would lead to higher Medicare spending relative to current law. Similarly, modifying the scheduled increase in the out-of-pocket spending threshold to protect Part D enrollees from a steep increase in out-of-pocket costs would also result in higher Medicare spending.

The Latest Ebola Outbreaks: What Has Changed in the International and U.S. Response Since 2014?

Published: Aug 14, 2018

What has changed about the international and U.S. response to the latest Ebola epidemics? @KaiserFamFound brief explores key factors

This Issue Brief describes what has changed in the broader international Ebola response landscape since 2014, and considers the status of U.S. government (U.S.) engagement in responses to Ebola outbreaks in the Democratic Republic of the Congo (DRC).

Just days after the World Health Organization (WHO) declared the end to an Ebola outbreak in the Equateur Province of DRC, a new, separate outbreak was reported in a different region of that country, centered in the North Kivu Province. Investigations into the full extent of this new outbreak continue, but as of August 11 there have already been 52 cases and 39 deaths reported, making the North Kivu outbreak of equal or even greater magnitude compared to the prior Equateur Province outbreak.

These Ebola outbreaks in DRC are the largest since 2014, when a major Ebola epidemic hit West Africa and highlighted weaknesses in the ability of international institutions and governments to respond to such events. At that time, the U.S. ended up playing a major, leading role in helping to control the outbreak, providing more financial assistance than any other donor, mobilizing large numbers of U.S. staff from multiple departments and agencies, and jump-starting a broader, worldwide effort to strengthen global health security.

So far, the U.S. has played a much less prominent role in responding to these recent DRC outbreaks. While this has led some to raise questions about the U.S. response, suggesting that more engagement from the U.S. was needed, today’s context is quite different compared to 2014, with an improved international response capacity resulting in quicker action by the World Health Organization, the DRC, and other partners, and new tools available to contain outbreaks. The successful containment of the Equateur Province outbreak was yet another indicator that national and global responses have improved since 2014.

Even so, the new outbreak in North Kivu presents some unique, additional complications that are challenging response efforts. North Kivu is a complex and insecure region of the country, making it more difficult to access populations at risk and track suspected Ebola cases and their contacts. The region has a large number of refugees (an estimated 1 million of the 8 million population in the province is comprised of refugees), is home to 100 armed groups (some 20 of which are “highly active”), experiences high levels of population movement and migration, and borders the countries of Uganda and Rwanda.

What is different about international Ebola response capabilities now compared to 2014?

WHO has addressed important shortcomings

The World Health Organization (WHO) is the key international actor in any response to a global public health emergency including a disease outbreak. The agency is designated to serve as the coordinating body for such responses and to also provide technical assistance, expertise, and other material support. While WHO still faces challenges, the agency has undergone important changes in its outbreak response capacities since 2014, many of which were instituted to address the very weaknesses revealed from that experience.

In 2014, according to dozens of published reviews, WHO was slow and ineffective in its early handling of the emerging Ebola outbreak in West Africa. A number of factors contributed to this poor initial response, including: a budget for outbreak response that had been reduced by more than 50% in two years and a corresponding loss of staff with relevant experience; little funding available on a short-term basis to support the cost of an unexpected, major response operation; a bureaucratic structure that made rapid coordination and decision-making difficult; and a leadership vacuum that caused delays in coordinating and directing resources, people, and organizations where and when they were needed.

Since then, multiple steps have been taken and key reforms instituted to address shortcomings, including:

  • WHO reorganized. WHO has reorganized the offices involved in emergency response, which has helped clarify the organization’s role, streamline its deployment of resources during an emergency response, and allow for more staff who are ready to be mobilized during outbreaks;
  • WHO Emergency Fund created. There is now a mechanism allowing WHO to quickly release funds for emergency response, known as the Contingency Fund for Emergencies (CFE). The CFE is funded by donor countries;
  • New leadership engaged in response. The Director-General of WHO, Dr Tedros Adhanom Ghebreyesus (appointed in July 2017) has helped foster organizational changes at the agency, and he and other leaders have been heavily and directly engaged in the Ebola responses. To date they have taken the following actions:
    • In May WHO requested $26 million from international donors to support the response in Equateur Province; this request was met within a few days. By the end of the Equateur outbreak in July, WHO had received over $63 million in response funding from donors and WHO itself released $4 milllion from its CFE. After WHO learned of the new outbreak in North Kivu, it released an additional $2 million from the CFE. As of August 12, WHO had not yet requested a specific amount from donors for the North Kivu response, though a draft response plan estimates that $40 million may be needed and a call to donors could be coming soon.
    • Peter Salama, Deputy Director-General for Emergency Preparedness and Response, has been visiting and working with the DRC since the initial outbreak was identified, and continues to travel and work there in support of the North Kivu outbreak. WHO Director-General Tedros made unprecedented visits to Ebola-affected areas and has provided regular public updates about the response. In North Kivu, he has called for warring parties to allow access to affected communities.
    • WHO staff have worked to harmonize activities among key responders, including the government of the DRC and other multilaterals, such the World Food Programme (providing transportation and logistics support), Gavi, the Vaccine Alliance (supporting deployment of an Ebola vaccine – see more below) and others.
    • Early in the Equateur response, WHO convened an emergency committee meeting at the behest of the Director-General to determine whether the DRC outbreak constituted a public health emergency of international concern; the committee found that, at the time, the outbreak there was concerning but did not meet the criteria for an international emergency. So far there have been no calls for another emergency committee meeting to discuss the North Kivu situation, though it could occur in the future depending on the trajectory of the current outbreak.

The affected country has experience with Ebola outbreaks

The DRC has experienced more Ebola outbreaks – 10, including the current one in North Kivu, since 1976 – than any other country in the world. While it still faces enormous challenges in terms of poor healthcare infrastructure, ongoing civil conflict and political turmoil, limited funding, and some community mistrust of health authorities, the country’s prior experience means it has important resources and capacities available to address Ebola. DRC has been able to respond effectively to recent outbreaks, as it did with the Equateur Province outbreak and a prior outbreak in 2017. These were quickly contained due to rapid action by local authorities, quick testing of samples, early acknowledgement of the outbreak by the government, and coordinated response by local and national health authorities with support of international partners.

In contrast, the three countries at the epicenter of the West African Ebola outbreak in 2014 – Guinea, Liberia, and Sierra Leone – had never before reported an Ebola case. In addition, the disease spread across borders and affected large cities in these countries. The lack of prior exposure to Ebola, coupled with poor outbreak response capacities in these countries generally, meant that needed resources were not in place, such as epidemic response plans, experienced clinicians and epidemiologists, or laboratories with a history of testing for the disease.

An effective Ebola vaccine and new treatment are available and being used

The response to the Equateur Province outbreak marked the first time an Ebola vaccine was used for the purposes of epidemic control, representing an important and historic step forward in efforts to combat the disease. While the vaccine is still considered experimental and for use on an emergency basis only, it has been shown to be very effective in trials, so the DRC and WHO agreed to deploy it for its outbreaks this year. In the Equateur response an estimated 3,300 people were vaccinated, none of whom subsequently developed Ebola, though it is still not clear the extent to which vaccination was responsible for curtailing the outbreak. The North Kivu outbreak is caused by the same type of Ebola as was seen in Equateur, meaning the vaccine can be used to prevent it; the DRC and WHO began vaccinating at risk populations in the region on August 8.

Using an Ebola vaccine presents major logistical and communications challenges, including the fact that the vaccine must be maintained at a very cold temperature and delivered to difficult-to-access areas that have little to no electricity, and that recipients must provide consent after understanding the risks and benefits of receiving the vaccine. Even so, an estimated 98% of people offered the vaccine in the Equateur response agreed to be vaccinated. Other outbreak control measures such as attending patients in special treatment and isolation units, tracing of close contacts of those infected, and education and communication campaigns for affected communities, remain central to stopping transmission as vaccination alone is probably insufficient.

In addition, DRC health authorities announced they are using – for the first time – a new, experimental therapy to treat Ebola patients in the North Kivu outbreak, one which was originally developed by the U.S. National Institutes of Health (NIH).  As of August 14, NIH had shipped 10 doses to DRC already, with 90 more available if requested.

What is different about U.S. government involvement now compared with 2014?

The U.S. has engaged in DRC responses relatively early, though not at the forefront

Multiple US agencies have been involved in the DRC outbreak responses. In the current North Kivu outbreak, the CDC has so far played a supporting role, providing technical assistance. In the Equateur response, CDC also provided epidemiological and other support, USAID provided technical assistance such as mobile laboratories, and the USG overall provided $8 million in assistance. In responses in both regions, the DRC government and WHO, along with key partners such as MSF and the International Red Cross, have been at the forefront, not the U.S.

By contrast, U.S. engagement in West Africa in 2014, as measured by personnel and funding, occurred at a later point compared to the responses in DRC, in part because the affected countries and global community were generally not prepared for that event. In 2014, a team of responders from CDC first arrived in Guinea at the end of March, by which time there were already a reported 112 cases and 70 deaths; the first CDC teams in Liberia arrived there in mid-July when there had already been over 150 cases reported in that country and over 900 cases across the three affected West African nations. Later on, as case numbers grew and two Americans became infected in Liberia in late July, and in the absence of a robust response from other international actors, U.S. involvement dramatically scaled up in West Africa, with a multi-departmental response led by USAID, which included deploying more than 3,700 CDC staff and nearly 3,000 active duty members of the U.S. military to affected countries and, eventually, dedicating unprecedented amounts of funding (see below).

Today, the increased capacity of WHO to address Ebola outbreaks and its quick response in partnership with DRC mean that the current landscape, as well as the potential role for the U.S., may be quite different from four years ago.

Yet, the Administration’s recent budget moves on global disease outbreak prevention and response send mixed messages

The US was the largest donor to the 2014 West African Ebola outbreak. In November 2014, near the epidemic’s peak, the Obama administration requested a large emergency appropriation from Congress to help address the disease, and in December 2014, Congress approved $5.4 billion in emergency funding, the majority of which ($3.7 billion) was designated for international activities. Further, about $1 billion of this $3.7 billion in funding was designated for U.S. global health security programs to help build countries’ capacities over the longer term to prevent, detect, and respond to emerging health threats such as Ebola.

At this point most of the emergency appropriation from 2014 has already been expended or is set to expire at the end of the 2019 fiscal year, and it is an open question as to whether or not additional funds will be requested by the White House and provided by Congress to continue these efforts going forward. The White House submitted a budget rescission proposal on May 8 to reduce remaining Ebola response funds at USAID by $252 million, coincidentally the same day the DRC outbreak was declared; on June 5, this request was withdrawn from the proposal.

Despite questions about funding and the recent rescission request, in its most recent budget proposal to Congress, for FY 19, the White House did include an increase for global health security programs at CDC, the only requested increase for any global health program. Taken together, these recent funding moves have created an air of uncertainty about the U.S. commitment to global health security more broadly, brought into stark relief in the midst of a new Ebola outbreak.

And, no senior U.S. government leader for U.S. international outbreak response has been designated

The situation in DRC is nowhere near as dire as that in West Africa in 2014, but it is worth noting there is currently no senior U.S. government leader designated to lead a U.S. international response, whether it be for Ebola in DRC or any other outbreak that could occur. The Trump Administration had installed a well-known global health expert, Admiral Tim Ziemer, as the lead on biosecurity and global health at the National Security Council (NSC) in 2017, but his position was eliminated as part of an overall reshuffling of NSC staff under the leadership of new National Security Advisor John Bolton; the move was coincidentally announced the same week the first DRC Ebola outbreak was declared. Without this position, other NSC staff have been tapped to lead the U.S. responses to the outbreaks.

In contrast, as the 2014 West African outbreak emerged, a senior Obama administration official – former CDC Director Tom Frieden – took on a highly visible role in the response by visiting the affected countries multiple times, speaking to the media and the public on the topic, and raising concerns about the outbreak to the White House and Congress. As the West Africa epidemic worsened and U.S. support for the international response grew, the Obama administration named Ron Klain the government’s “Ebola Czar” with a mandate to coordinate across U.S. government departments and agencies; critical to his success in this role was the support he received from President Obama and other leaders in the White House and Congress. Whether and how to designate a point person on outbreaks is a debate that predates the DRC Ebola outbreak, but the ongoing outbreak has added some urgency to this discussion.

What happens next?

The Equateur Province outbreak was successfully contained by quick and effective local and international action, and use of new tools such as the vaccine.  The trajectory of the new North Kivu outbreak is unpredictable at this early stage, and how it unfolds will shape how the international community and the U.S. government respond going forward. If Ebola does not spread much further and is quickly contained in North Kivu as it was in Equateur, little additional action would be required from other external actors for this outbreak, save meeting funding needs. However, if the outbreak expands significantly, and especially if it crosses borders, there will likely be more need for external assistance and greater funding, and the U.S. may be asked to scale up its engagement.