JAMA Forum: What Does it Mean to Protect People with Preexisting Conditions?

Author: Larry Levitt
Published: Oct 17, 2018

The latest legal challenge to the Affordable Care Act that threatens to end the law’s protections for people with preexisting conditions has ignited a political firestorm in the run up to November’s midterm elections. In an October 2018 post for the JAMA forum, Larry Levitt examines what candidates are saying and how to evaluate proposals that claim to protect people with preexisting conditions from insurance discrimination.

Other contributions to The JAMA Forum are also available.

News Release

People on Medicare Will Be Able to Choose Among 24 Medicare Advantage Plans and 27 Medicare Part D Drug Plans, on Average, During the Open Enrollment Period for 2019, New Analyses Find

Published: Oct 16, 2018

With Medicare Advantage playing an increasingly larger role in Medicare, the average person on Medicare will be able to choose among 24 plans during the annual Medicare open enrollment period that began Oct. 15, finds a new analysis from KFF (the Kaiser Family Foundation).

The new analysis, Medicare Advantage Plans in 2019: First Look, finds that:

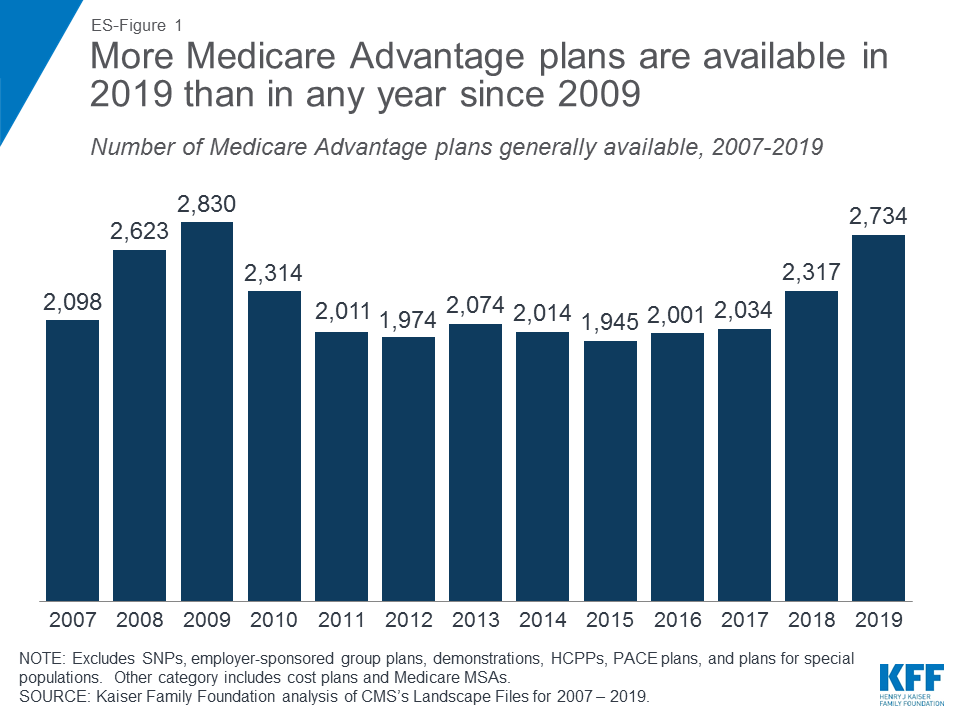
  • Nationally, 2,734 Medicare Advantage plans for general enrollment will be offered in 2019 — more than in any year since 2009.
  • Fourteen new insurers will be entering the Medicare Advantage market for the first time in 2019, and five will be exiting. More than 200 insurers will offer Medicare Advantage plans in 2019.

Medicare Advantage enrollment now exceeds 20 million beneficiaries and has more than doubled in the last decade. The plans, mainly HMOs and PPOs offered by private insurers, are an alternative to traditional Medicare.

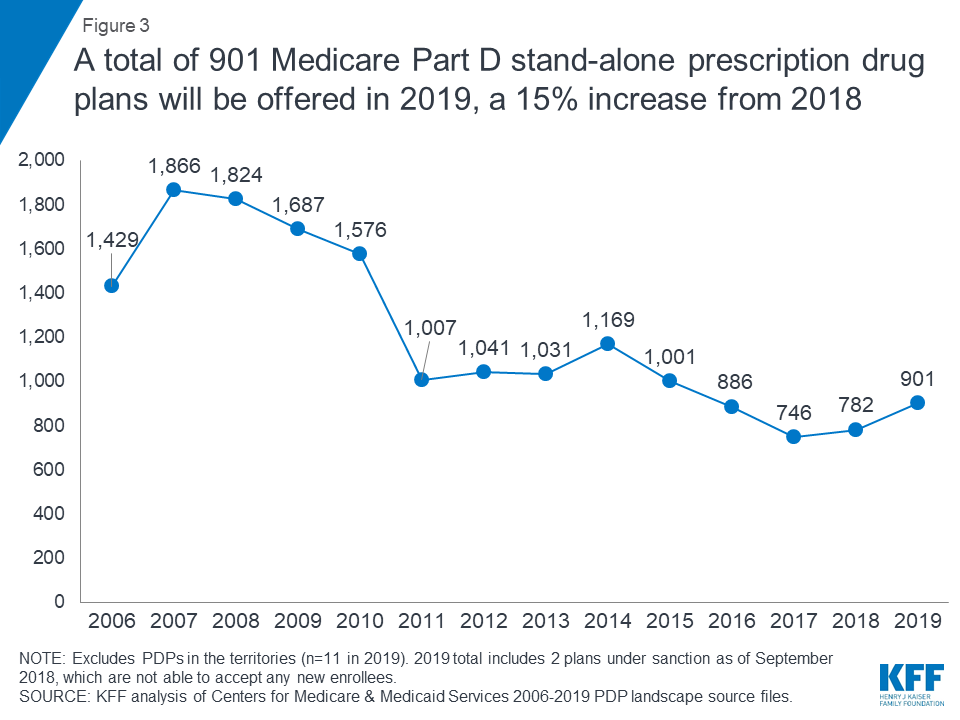
A second analysis, Medicare Part D: A First Look at Prescription Drug Plans in 2019, finds that the average beneficiary will be able to choose among 27 stand-alone Part D plans in 2019, up from 23 in 2018 but well below the peak of 56 plans in 2007. A total of 901 drug plans will be offered next year, the second year in a row with greater plan availability.

Other key findings include:

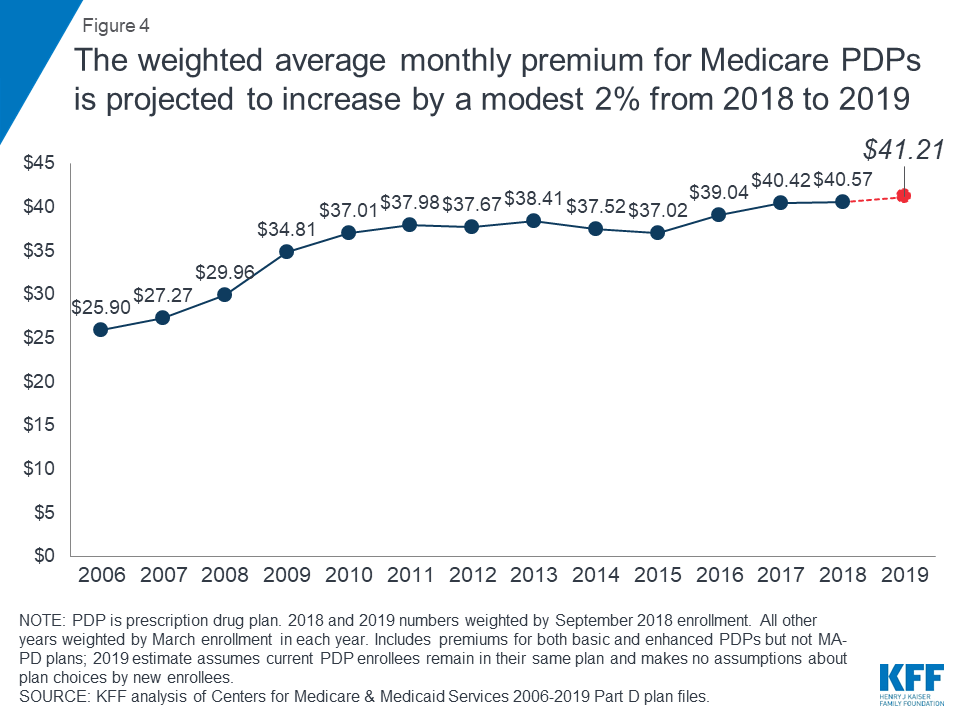
  • Current stand-alone drug plan enrollees are projected to see a modest two percent increase in monthly premiums if they remain in their current plan for 2019, with an average premium of $41.21 per month, up from $40.57 this year. Among the 10 stand-alone drug plans with the most enrollees, average premiums will range from a low of $28 per month for Humana Walmart to a high of $76 per month for Humana Enhanced.
  • Most Part D enrollees will face modest cost-sharing amounts for generic drugs in 2019 but much higher cost sharing for brands and non-preferred drugs. For example, among the 10 largest stand-alone Part D plans, copayments range from $0 to $5 for preferred generics but a coinsurance rate of up to 50 percent for non-preferred drugs.

Also available from KFF is our updated Medicare Part D fact sheet.

Medicare Part D: A First Look at Prescription Drug Plans in 2019

Authors: Juliette Cubanski, Anthony Damico, and Tricia Neuman
Published: Oct 16, 2018

Key Findings

During the Medicare open enrollment period from October 15 to December 7 each year, beneficiaries can enroll in a plan that provides Part D drug coverage, either a stand-alone prescription drug plan (PDP) as a supplement to traditional Medicare, or a Medicare Advantage prescription drug plan (MA-PD), which covers all Medicare benefits, including drugs. This issue brief provides an overview of the 2019 PDP landscape, the largest segment of the Medicare Part D marketplace, with 20.6 million enrollees in 2018.

Current stand-alone #Medicare drug plan enrollees are projected to see a modest two percent increase in monthly premiums if they remain in their current plan for 2019, with an average premium of $41.21 per month, up from $40.57 this year.

Key Findings

  • For 2019, Medicare beneficiaries will have more Part D plan choices than in 2018, including 27 stand-alone PDPs and 21 MA-PDs in their area, on average (excluding MA plans that do not include the drug benefit). A total of 901 PDPs will be offered in the 34 PDP regions in 2019 (plus another 11 PDPs in the territories). This represents an increase of 119 PDPs, or 15 percent, over 2018, and the second year in a row with an increase, after three years of plan reductions.
  • The average monthly PDP premium will increase by a modest 2 percent between 2018 and 2019, to $41.21, weighted by September 2018 enrollment. This estimate, which includes premiums for both basic and enhanced PDPs, is weighted based on current enrollment, assumes current enrollees do not switch, and makes no assumptions about plan choices by new enrollees or reassignment of low-income beneficiaries.
  • For 2019, PDP premiums will vary widely across plans, as in previous years. Among the 10 PDPs with the most enrollees, average premiums will range from a low of $28 per month ($332 per year) for Humana Walmart to a high of $76 per month ($911 per year) for Humana Enhanced (Figure 1).
Figure 1: Average monthly premiums for the 10 most popular Medicare Part D stand-alone PDPs are projected to vary from $28 to $76 in 2019
  • Most Part D enrollees will face modest cost-sharing amounts for generic drugs in 2019 but much higher cost sharing for brands and non-preferred drugs, and a mix of copayments and coinsurance for different formulary tiers. Among the 10 largest PDPs, copayments range from $0 to $5 for preferred generics; $1 to $13 for generics; $25 to $47 for preferred brands; 32% to 50% coinsurance for non-preferred drugs (the maximum allowed for this tier); and 25% to 33% for specialty drugs.
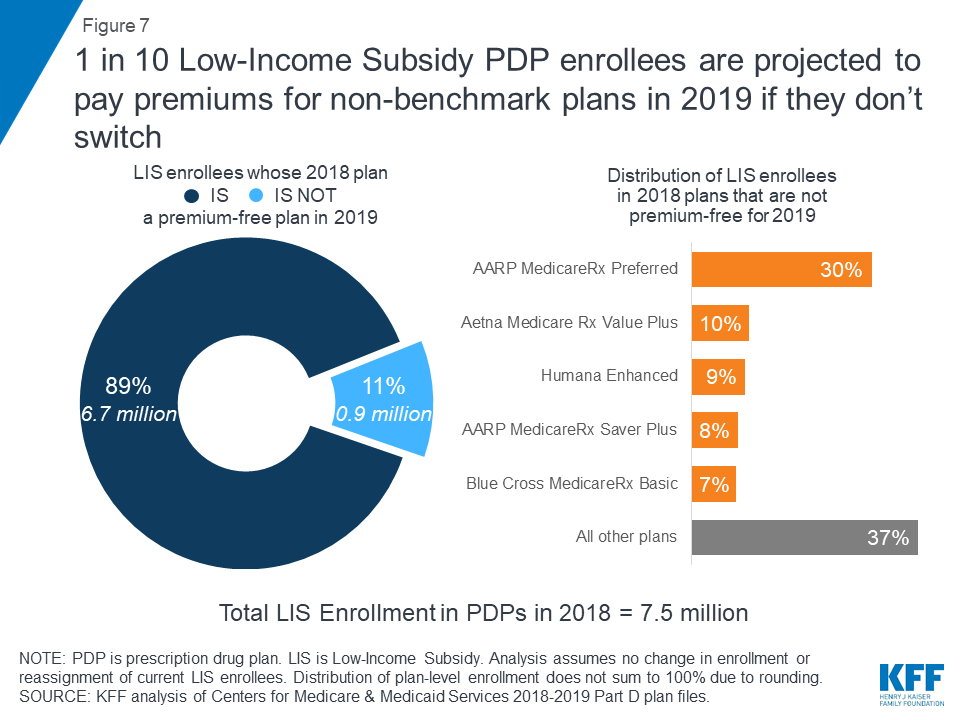
  • Medicare beneficiaries receiving the Low-Income Subsidy (LIS) will have a choice of six premium-free PDPs in 2019, on average, the same as in 2018. In 2019, nearly one million low-income beneficiaries who are eligible for premium-free Part D coverage will pay Part D premiums averaging nearly $28 per month ($333 per year), unless they switch or are reassigned by CMS to premium-free plans.

Findings

Part D Plan Availability

A larger number of Part D plans will be offered in 2019 than in recent years.

  • The average beneficiary will have a choice of 27 PDPs in 2019, up from 23 in 2018, but well below the peak of 56 PDPs in 2007 (Figure 2). In 2019, beneficiaries will also have access to 21 MA-PDs, on average, up from 18 in 2018 (excluding MA plans that do not offer the drug benefit).
Figure 2: The average Medicare beneficiary has a choice of 27 stand-alone drug plans and 21 Medicare Advantage drug plans in 2019
  • A total of 901 PDPs will be offered in the 34 PDP regions in 2019 (plus another 11 PDPs in the territories). This represents an increase of 119 PDPs, or 15 percent, over 2018, and the second year in a row with an increase, after three years of plan reductions (Figure 3).
Figure 3: A total of 901 Medicare Part D stand-alone prescription drug plans will be offered in 2019, a 15% increase from 2018

This increase is likely due to the elimination of the “meaningful difference” requirement for enhanced benefit PDPs offered by the same organization in the same region. Eliminating this requirement means that PDP sponsors no longer have to demonstrate that their enhanced PDPs offered in the same region are meaningfully different in terms of enrollee out-of-pocket costs. In 2019, 61% of PDPs (553 plans) will offer enhanced Part D benefits—an increase from 2018 when 54% of PDPs (421 plans) offered enhanced benefits.

  • The number of PDPs per region in 2019 will range from 22 PDPs in Alaska to 30 PDPs in the Pennsylvania/West Virginia region and California, and will be higher in each of the 34 PDP regions compared to 2018 (see map; Table 1).

Premiums

The national average monthly PDP premium is expected to increase for the fourth year in a row, but only modestly for 2019.

  • The projected average monthly PDP premium for 2019 will be $41.21 (Figure 4). The 2019 premium represents a modest 2 percent projected increase ($0.64) from the weighted average monthly premium of $40.57 in 2018. Since 2006, the first year of the Medicare Part D drug benefit, the weighted average monthly premium for PDPs has increased by 59 percent.
Figure 4: The weighted average monthly premium for Medicare PDPs is projected to increase by a modest 2% from 2018 to 2019
  • Among the 13.0 millionPart D PDP enrollees who are responsible for paying the entire premium (which excludes Low-Income Subsidy (LIS) recipients), many enrollees pay premiums that are well above the national average. In 2019, three in 10 PDP enrollees not receiving the LIS are projected to pay monthly premiums of at least $60 if they stay in their current plans, and more than 280,000 (2 percent of non-LIS enrollees) are projected to pay monthly premiums of at least $100.
  • CMS reported that the average premium for basic Part D coverage offered by PDPs and MA-PDs will be an estimated $32.50 in 2019. Our premium estimate is higher because it is based on PDPs only and includes PDPs offering both basic and enhanced coverage (enhanced plans have higher premiums than basic plans, on average). In addition, our premium estimates are weighted based on current enrollment and do not incorporate any assumptions about plan changes by current enrollees, reassignment of Low-Income Subsidy (LIS) enrollees by CMS, or plan choices by new enrollees.
  • In prior years, the average premium that we have calculated after taking into account enrollment changes made during the open enrollment period has been somewhat lower than our projection based on current enrollment. For example, the weighted average premium calculated in March 2018, after the open enrollment period ended, was $41.24, 5 percent ($2.24) below the projected premium of $43.48 calculated prior to enrollment changes. The reduction is due to current enrollees switching to lower premium plans, new enrollees choosing low-premium plans, and reassignments of some LIS beneficiaries to lower-premium plans.
Premium Variation and Changes for PDPs with the Most Enrollees

PDP premiums will continue to vary widely across plans in 2019, as in previous years.

  • Among the 10 PDPs with the highest enrollment, average PDP premiums in 2019 will range from a low of $28 per month ($332 per year) for Humana Walmart Rx to $76 per month ($911 per year) for Humana Enhanced (Figure 1; Table 2).

Changes to premiums from 2018 to 2019, averaged across regions and weighted by September 2018 enrollment, also vary widely across some of the most popular PDPs, as do the absolute amounts of monthly premiums for 2019.

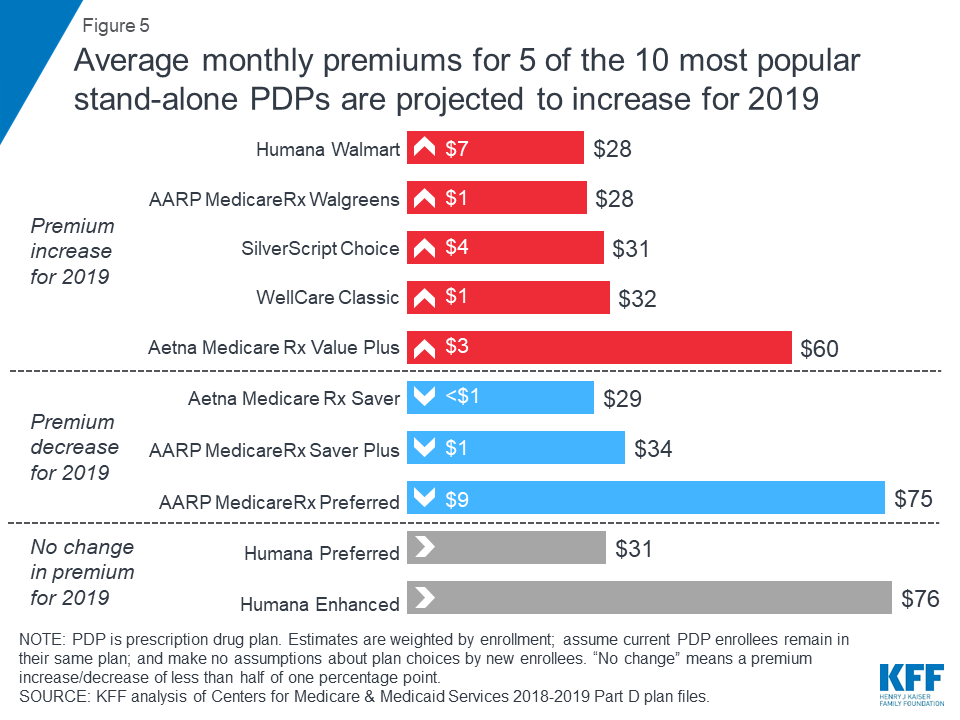
  • Among the 10 largest PDPs, average monthly premiums for 2019 are projected to increase for five plans, decrease for three plans, and remain stable for two plans, based on current enrollment (Figure 5).
Figure 5: Average monthly premiums for 5 of the 10 most popular stand-alone PDPs are projected to increase for 2019
  • The 4.6 million enrollees in SilverScript Choice, the PDP with the most enrollees in 2018, will see a 17 percent increase in their monthly premium for 2019 if they stay in this plan, from $26 to $31, on average. The 2.4 million enrollees in the third largest PDP, Humana Walmart Rx, will face an even larger 37 percent increase in their monthly premium, from $20 to $28, on average—but this is still the lowest premium plan among the top 10 PDPs.
  • In contrast, the 2.5 million enrollees in the second largest PDP, UnitedHealth’s AARP MedicareRx Preferred, will face an 11 percent decrease in the average monthly premium, from $84 to $75. Of the 10 most popular PDPs, this is the largest average premium reduction for 2019—but still the second highest monthly premium for 2019 among the top 10 PDPs. The highest premium among the top PDPs is for Humana Enhanced, with 0.8 million enrollees, at $76 per month in 2019.
Premium Variation by Region

Average PDP monthly premiums for 2019 will vary across the 34 PDP regions.

  • Average PDP premiums will range from $34 per month in Hawaii to $46 per month in California, New Jersey, and New York (see map; Table 1).
  • All 34 PDP regions have at least one PDP with a premium under $20. For example, the Aetna Medicare Rx Select PDP is available in all regions with monthly premiums ranging from $12.20 to $19.20, while the EnvisionRxPlus PDP is available in 13 regions with monthly premiums ranging from $12.90 to $16.50 (but in another 21 regions for premiums ranging from $24.80 to $66.70). At the high end, 6 PDPs, with a total of 86,000 enrollees in 2018 (less than 1% of total PDP enrollment), have monthly premiums of at least $125. The highest is $156 for Blue Rx PDP Complete, which is offered in the Pennsylvania/West Virginia region.
  • Average premiums are projected to be modestly higher in 13 regions, increasing by between $1 and $4. In 2 regions, average premiums will decrease by between $1 and $2, and in 19 regions average premiums will be within $1 of their 2018 average.

Benefit Design and Cost Sharing

In 2019, all PDPs will offer an alternative benefit design, different from the defined standard benefit, which has a $415 deductible (an increase from $405 in 2018) and 25 percent coinsurance for all covered drugs between the deductible and the initial coverage limit. Part D plans must offer either the defined standard benefit or an alternative equal in value (“actuarially equivalent”), which is the basic Part D benefit, and can also provide enhanced benefits. Plans with enhanced benefits can have a lower (or no) deductible, reduced cost sharing, and/or a higher initial coverage limit than under the standard benefit design.

In 2019, virtually all PDPs will have a benefit design with five tiers for covered generic and brand-name drugs and cost sharing other than the standard 25 percent. As of 2019, Part D enrollees will no longer be exposed to a coverage gap, sometimes called the “donut hole”, when they fill their brand-name medications. Under changes made by the Bipartisan Budget Act of 2018, Part D enrollees’ out-of-pocket costs for brand-name drugs between the initial coverage limit and the catastrophic coverage threshold (the coverage gap phase) will decline from 35 percent of total costs in 2018 to 25 percent in 2019—rather than in 2020—while plans’ share of costs for brands will decrease to 5 percent and the manufacturer discount will increase from 50 percent to 70 percent. Enrollees will pay 37 percent of the cost for generic drugs in the gap and plans will pay 63 percent.

Basic versus Enhanced Benefits

  • In 2019, 61 percent of plans will offer enhanced benefits, an increase over 2018 when 53 percent offered enhanced benefits (Table 3). As noted earlier, this increase is likely a response by Part D plan sponsors to the elimination of the requirement to demonstrate a “meaningful difference” (measured by enrollee out-of-pocket costs) between enhanced plans offered by the same firm in the same region. A smaller share of plans (39%) will offer basic Part D benefits in 2019 (compared to 47 percent in 2018), and as in recent years, no plans will offer the defined standard benefit.
  • The weighted average premium in 2019 for enhanced benefit PDPs ($54) is 67 percent higher than the monthly premium for PDPs offering the basic benefit ($32).

Deductibles

  • A larger share of PDPs will charge a deductible in 2019 than in 2018 (71% vs. 63%), with the increase due to a larger share of plans charging a deductible lower than the standard amount (Table 3). More than half of PDPs will charge the standard $415 deductible in 2019 (52%).
  • The weighted average premium in 2019 for PDPs that charge no deductible ($54) is around $20 per month higher than the monthly premium for PDPs that charge the standard deductible ($32) or a partial deductible ($33).

Cost Sharing

  • As in recent years, all PDPs in 2019 will use tiered cost sharing. The typical five-tier design includes tiers for preferred generics, generics, preferred brands, non-preferred drugs (which includes both brands and generics), and specialty drugs. Five-tier formularies have been the most common type since 2013.
  • Overall, PDP cost-sharing amounts in 2019 are relatively similar to 2018 levels (Table 4). For generic tiers, median copayments across PDPs are $1 for the preferred generic tier and $5 for the generic tier.
    • Three of the 10 largest PDPs (AARP MedicareRx Walgreens, Humana Preferred, and WellCare Classic) have a $0 copayment for preferred generic drugs in 2019. Median copayments for generics range from $1 to $13 among the 10 largest PDPs.
  • Most PDPs charge copayments for preferred brand tiers, but nearly one-fourth of PDPs in 2019 (23 percent) charge coinsurance. For preferred brand tiers, the median copayment in 2019 is $40; the median coinsurance rate is 20 percent.
    • Eight of the 10 largest PDPs charge copayments for preferred brands, varying from $25 (AARP MedicareRx Saver Plus) to $47 (Aetna Medicare Rx Value Plus and Humana Enhanced).
  • In 2019, virtually all PDPs are using coinsurance for the non-preferred drug tier. The median coinsurance PDPs charge for non-preferred drugs is 40 percent.
    • Among the top 10 PDPs, coinsurance for non-preferred drugs varies in 2019 from 32 percent (AARP MedicareRx Walgreens) to 50 percent (Humana Enhanced), the maximum allowed for this tier by CMS guidelines (which is higher than the maximum coinsurance allowed for specialty drugs).
  • In 2019, the threshold for drugs to qualify for placement on a specialty tier is $670 for a one-month supply of the drug, the same as in 2017 and 2018. For all PDPs, the specialty tier coinsurance ranges from 25 percent to 33 percent, the maximum allowed by CMS guidelines; most PDPs charge either 25 percent or 33 percent.
    • Five of the top 10 PDPs use 25 percent coinsurance for their specialty tiers, the maximum allowed for plans with a standard deductible; four of the top 10 PDPs charge 33 percent.

Low-income Subsidy (Benchmark) Plans

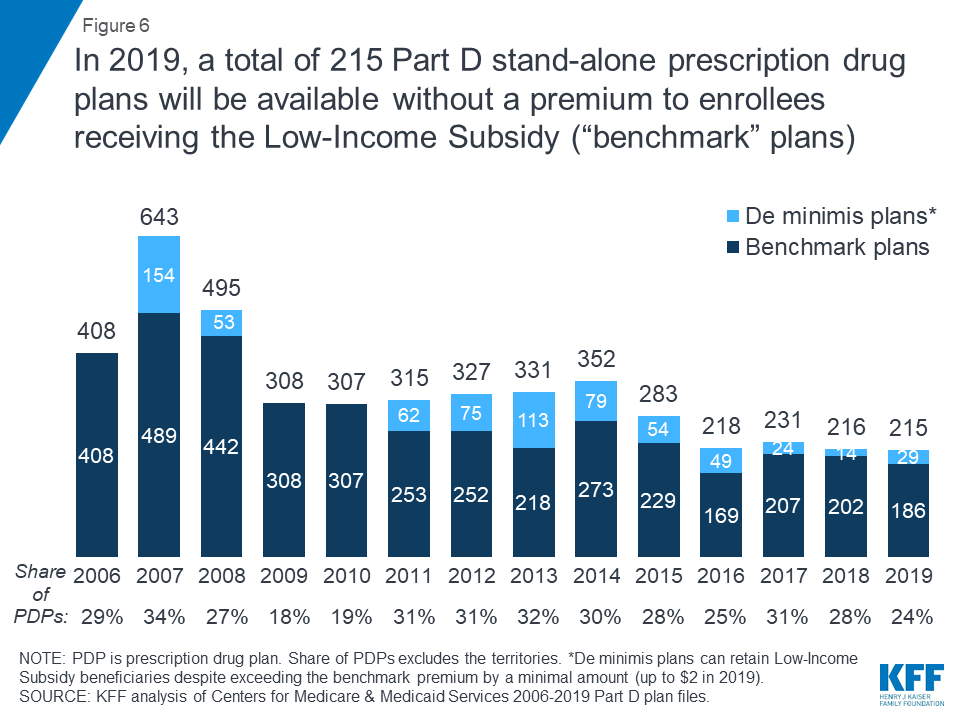
In 2019, 215 plans will be premium-free benchmark plans—that is, PDPs available for no monthly premium to beneficiaries receiving the Low-Income Subsidy (LIS). This total is one less than in 2018 and the lowest number of benchmark plans since Part D started in 2006 (Figure 6, Table 1).

Figure 6: In 2019, a total of 215 Part D stand-alone prescription drug plans will be available without a premium to enrollees receiving the Low-Income Subsidy (“benchmark” plans)
  • On average (weighted by enrollment), LIS beneficiaries have six benchmark plans available to them for 2019, or about one-fifth the average number of PDP choices available overall. All LIS enrollees can select any plan offered in their area, but if they enroll in a non-benchmark plan, they must pay some portion of their chosen plan’s monthly premium.
  • Of the 215 benchmark plans in 2019, 29 plans qualify through the “de minimis” policy—more than the 14 de minimis plans in 2018. The de minimis policy makes it easier for plans to qualify as benchmark plans and retain their current LIS enrollees by allowing them to waive a premium amount of up to $2 above the regional LIS benchmark. Although benchmark plans that qualify through the de minimis policy can keep their existing LIS enrollees, they cannot receive auto-assigned enrollees.

Benchmark Plans by Region

  • The number of benchmark plans available in 2019 will vary by region, from just two benchmark PDPs in Florida (out of 27 PDPs overall) to 10 benchmark PDPs in Arizona (out of 28 PDPs) (see map; Table 1).
  • Benchmark plan availability will be unchanged in 22 of 34 regions between 2018 and 2019. Seven regions will experience a decline of one or two benchmark plans, while five regions will experience an increase of one or two benchmark plans.
  • In 2019, three-quarters of LIS PDP enrollees are projected to be in PDPs operated by four plan sponsors: CVS Health/SilverScript, Humana, UnitedHealth, and Aetna. All four sponsors offer PDPs that qualify as benchmark plans in at least 28 of the 34 PDP regions in 2019.

Impact of Benchmark Plan Changes for Low-Income Subsidy Enrollees

  • Nearly one million LIS beneficiaries—just over one in 10 LIS enrollees in PDPs (11%)—are enrolled in PDPs in 2018 that will not qualify as benchmark plans in 2019 (Figure 7). CMS will reassign these LIS beneficiaries to another plan if they were randomly assigned to their current plan, but those who have chosen their current plan must switch on their own to avoid paying a premium if they remain in their 2018 plan.
Figure 7: 1 in 10 Low-Income Subsidy PDP enrollees are projected to pay premiums for non-benchmark plans in 2019 if they don’t switch
  • These nearly one million LIS beneficiaries face monthly PDP premiums that average almost $28 ($333 per year) if they were to remain in their current plan for 2019. More than 250,000 of these LIS beneficiaries are enrolled in the AARP MedicareRx Preferred PDP, and they will pay a monthly premium of more than $41, on average, if they stay in this PDP for 2019.

Discussion

Our analysis of the Medicare Part D stand-alone drug plan landscape for 2019 shows an increase in plan availability for 2019, along with a modest increase in the average monthly PDP premium. Medicare beneficiaries face more than two dozen PDP choices during this year’s open enrollment period. Some Part D enrollees who choose to stay in their current plans may see lower premiums and lower cost sharing for their drugs, but others will face higher premiums, deductibles, and cost sharing if they remain in their current plans. As in prior years, all Part D enrollees could benefit from the opportunity to compare plans during open enrollment, since plans vary in numerous ways that can have a significant effect on an enrollee’s out-of-pocket spending.

Juliette Cubanski and Tricia Neuman are with the Kaiser Family Foundation.Anthony Damico is an independent consultant.

Methods

This analysis focuses on the Medicare Part D stand-alone prescription drug plan marketplace in 2019 and trends over time. The analysis includes 20.6 million enrollees in stand-alone PDPs. The analysis excludes 16.0 million MA-PD enrollees (non-employer), and another 4.5 million enrollees in employer-group only PDPs and 2.3 million in employer-group only MA-PDs for whom plan premium and benefits data are unavailable.

Data on Part D plan availability, enrollment, and premiums were collected from a set of data files released by the Centers for Medicare & Medicaid Services (CMS) on a regular basis:

  • Part D plan landscape files, released each fall prior to the annual enrollment period
  • Part D plan and premium files, released each fall
  • Part D plan crosswalk files, released each fall
  • Part D contract/plan/state/county level enrollment files, released on a monthly basis
  • Part D Low-Income Subsidy enrollment files, released once annually
  • Medicare plan benefit package files, released each fall
  • Medicare penetration files, released on a monthly basis

Tables

Table 1: Medicare Part D Stand-alone Prescription Drug Plans, Benchmark Plans, and Monthly Premiums, 2018 and 2019
 Number of PDPsNumber of Benchmark PDPsWeighted Average PDP Monthly Premium
State/territory201820192018201920182019
U.S. Total782901216215$40.57$41.21
Alabama252966$41.77$41.10
Alaska192277$38.66$38.32
Arizona23281010$41.45$41.42
Arkansas232644$32.21$35.87
California253057$44.30$45.63
Colorado242667$40.28$40.78
Connecticut222677$40.43$41.91
Delaware2125109$39.14$39.66
District of Columbia2125109$39.14$39.66
Florida212722$44.11$44.76
Georgia242654$37.69$38.80
Hawaii202444$32.91$33.53
Idaho252688$41.25$41.48
Illinois242787$42.11$41.20
Indiana242677$38.24$39.18
Iowa232856$35.53$37.02
Kansas232644$39.54$41.15
Kentucky242677$38.24$39.18
Louisiana212668$36.38$38.51
Maine242677$41.46$40.84
Maryland2125109$39.14$39.66
Massachusetts222677$40.43$41.91
Michigan242999$38.97$38.71
Minnesota232856$35.53$37.02
Mississippi202465$34.98$36.54
Missouri242644$38.79$40.90
Montana232856$35.53$37.02
Nebraska232856$35.53$37.02
Nevada242633$40.42$38.69
New Hampshire242677$41.46$40.84
New Jersey222676$46.83$45.79
New Mexico242777$32.17$35.34
New York202388$45.27$45.77
North Carolina242877$41.35$40.98
North Dakota232856$35.53$37.02
Ohio232667$38.29$40.47
Oklahoma232877$40.95$42.82
Oregon222677$38.74$38.82
Pennsylvania263099$40.67$41.20
Rhode Island222677$40.43$41.91
South Carolina222643$37.09$39.35
South Dakota232856$35.53$37.02
Tennessee252966$41.77$41.10
Texas242775$39.20$38.65
Utah252688$41.25$41.48
Vermont222677$40.43$41.91
Virginia242766$42.17$42.11
Washington222677$38.74$38.82
West Virginia263099$40.67$41.20
Wisconsin252888$42.11$42.44
Wyoming232856$35.53$37.02
Puerto Rico66$44.06$42.32
American Samoa11$5.80$34.70
Guam32$34.85$39.85
Northern Mariana Islands21$24.80$37.20
U.S. Virgin Islands11$41.30$42.60
NOTE: PDP is prescription drug plan. U.S. total count excludes PDPs in the territories. Totals include sanctioned plans closed to new enrollees as of September of prior year. Average monthly premium is weighted by September 2018 enrollment for the region in which the state is located. Benchmark plan counts include “de minimis” plans, which can retain Low-Income Subsidy beneficiaries despite exceeding the benchmark premium by a minimal amount (up to $2 in 2019). Benchmark plans are not shown for the territories because the LIS is not available to residents of the territories.SOURCE: KFF analysis of Centers for Medicare & Medicaid Services 2018-2019 Part D plan files.
Table 2: Enrollment and Premiums for Top 10 PDPs with the Highest Enrollment, 2018 and 2019
Name of PDPType of planSeptember 2018 enrollment (# in millions)Weighted average monthly premiumPercent change
#% of total201820192018-2019
SilverScript ChoiceBasic4.5522.1%$26.34$30.7317%
AARP MedicareRx PreferredEnhanced*2.4612.0$83.56$74.76-11
Humana WalmartEnhanced2.4411.8$20.20$27.6737
Humana PreferredBasic1.648.0$31.16$31.10
AARP MedicareRx Saver PlusBasic1.396.7$35.49$34.06-4
Aetna Medicare Rx SaverBasic1.185.8$29.61$29.20-1
WellCare ClassicBasic0.994.8$30.41$31.654
Humana EnhancedEnhanced0.763.7$75.83$75.89
AARP MedicareRx WalgreensEnhanced0.653.1$26.99$28.074
Aetna Medicare Rx Value PlusEnhanced0.572.8$57.46$60.165
TOTAL FOR ALL PDPS20.58100%$40.57$41.212%
NOTE: PDP is prescription drug plan. Plan names can change from year to year; plans are designated the same if they have the same contract/plan ID. Analysis excludes enrollees in employer group plans. Average premiums are weighted by September 2018 enrollment. “—“ means a premium increase/decrease of less than half of one percentage point. *AARP MedicareRx Preferred is a basic PDP in the territories.SOURCE: KFF analysis of Centers for Medicare & Medicaid Services 2018-2019 Part D plan files.
Table 3: Benefit Designs and Deductibles in Medicare Part D Stand-alone Prescription Drugs Plans, 2018 and 2019
 2018 2019
Share of PDPs offering
Basic benefits47%39%
Enhanced benefits53%61%
Standard deductible52%52%
Lower deductible11%19%
No deductible37%29%
Weighted average monthly PDP premium
Basic benefits$30.90$32.35
Enhanced benefits$54.68$54.13
Standard deductible$29.84$31.82
Lower deductible$33.34$33.15
No deductible$55.07$54.50
NOTE: PDP is prescription drug plan. Average premiums are weighted by September 2018 enrollment.SOURCE: KFF analysis of Centers for Medicare & Medicaid Services 2018-2019 Part D plan files.
Table 4: Median Cost Sharing (Copayments or Coinsurance Rates) for all Medicare Part D Stand-alone Prescription Drug Plans and Top 10 PDPs with the Highest Enrollment, 2018 and 2019
Name of PDPPreferred genericsGenericsPreferred brands*Non-preferred drugsSpecialty drugs
2018201920182019201820192018201920182019
Median for all PDPs$1$1$6$5$37/21%$40/20%40%40%26%26%
Top 10 PDPs
SilverScript Choice$3$3$14$13$42$4246%45%33%33%
AARP MedicareRx Preferred$5$5$12$10$37$4040%40%33%33%
Humana Walmart Rx$1$1$4$423%20%35%35%25%25%
Humana Preferred Rx$0$0$1$120%25%35%37%25%25%
AARP MedicareRx Saver Plus$1$1$3$6$33$2530%33%25%25%
Aetna Medicare Rx Saver$1$1$2$2$30$3035%35%26%27%
WellCare Classic$0$0$1$2$35$3742%41%25%25%
Humana Enhanced$3$5$7$10$42$4744%50%33%33%
AARP MedicareRx Walgreens$0$0$6$5$31$3032%32%25%25%
Aetna Medicare Rx Value Plus$1$1$2$2$47$4750%47%33%33%
NOTE: PDP is prescription drug plan. Estimates are weighted medians for those plans that vary cost sharing by region (weighted by September 2018 enrollment). *Approximately 77% of September 2018 enrollees are in plans with a preferred brand copay and 23% are in plans with a preferred brand coinsurance.SOURCE: KFF analysis of Centers for Medicare & Medicaid Services 2018-2019 Part D plan files.

Medicare Advantage 2019 Spotlight: First Look

Authors: Gretchen Jacobson, Anthony Damico, and Tricia Neuman
Published: Oct 16, 2018

Executive Summary

More than 20 million Medicare beneficiaries (34%) are enrolled in Medicare Advantage plans, which are mainly HMOs and PPOs offered by private insurers as an alternative to the traditional Medicare program. This brief provides an overview of the Medicare Advantage plans that will be available in 2019, based on an analysis of data from the Centers for Medicare and Medicaid Services (CMS). Findings include:

  • Number of Plans. Nationwide, 2,734 Medicare Advantage plans will be available for individual enrollment in 2019 – an increase of 417 plans since 2018. The preponderance of the growth in plans will occur in Florida. The average beneficiary will be able to choose among 24 plans in 2019, up from 21 in 2018. The number of Special Needs Plans (SNPs) will also increase from 630 plans in 2018 to 717 plans in 2019.

    ES-Figure 1: More Medicare Advantage plans are available in 2019 than in any year since 2009
  • Variation in Number of Plans Across Counties. The number of Medicare Advantage plans will vary greatly across counties in 2019, from more than 50 plans in 6 counties (1% of beneficiaries) to two or fewer plans in 246 counties (2% of beneficiaries), including 115 counties (with 1% of beneficiaries) in which no plans will be offered in 2019.
  • Number of Firms. The average beneficiary will be able to choose from plans offered by seven firms in 2019, with large variation across counties. Seven percent of all Medicare beneficiaries will have a choice of plans offered by two or fewer firms while 19 percent of beneficiaries will be able to choose from plans offered by 10 or more firms.
  • Market Entrants and Exits. Fourteen insurers will be entering the Medicare Advantage market for the first time in 2019, offering products in 26 states. Five insurers, together accounting for about 23,000 Medicare beneficiaries in 2018, will be exiting in 2019, four of which offered SNPs in 2018. These firms account for a small share of the insurers offering Medicare Advantage plans in 2019.

Data Note

Plan Offerings in 2019

Number of Plans

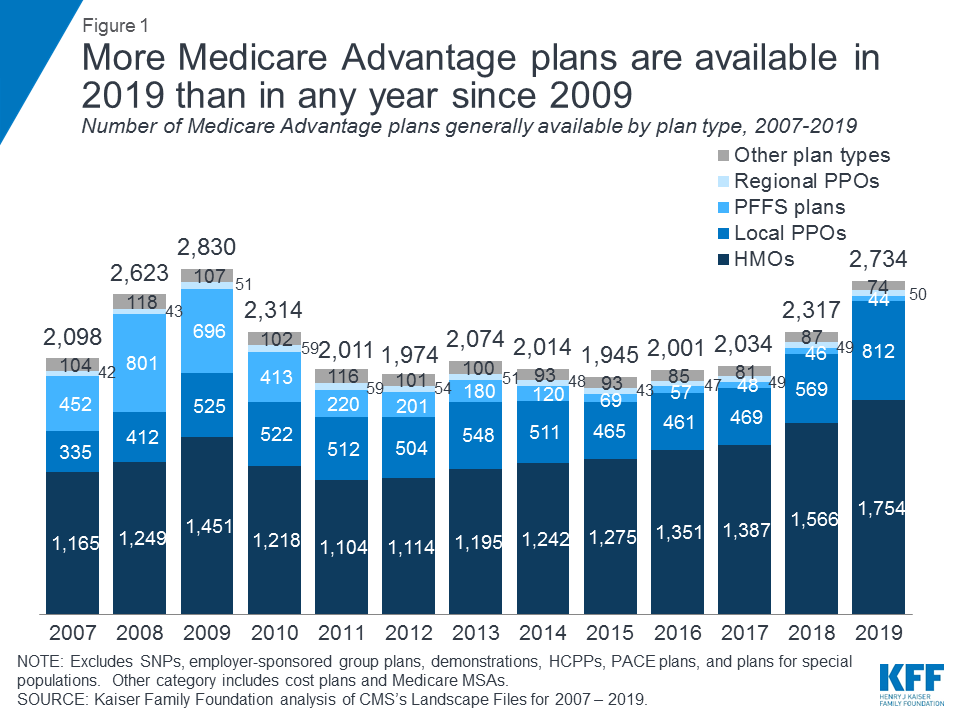
Total Number of Plans. In total, 2,734 Medicare Advantage plans will be available nationwide for individual enrollment in 2019 – a 18 percent increase (417 more plans) from 2018 and the largest number of plans available since 2009 (Figure 1; Table A1). These numbers exclude employer or union-sponsored group plans and Special Needs Plans, which are only available to select populations. The increase mostly reflects an additional 188 HMOs and 243 local PPOs, with three additional Medical Savings Account (MSA) plans and one additional Regional PPO as well. The size of the increase in local PPOs is notable, and more HMOs and local PPOs will be offered in 2019 than any year since 2007. HMOs continue to account for the majority of plans available, and will account for about two-thirds (64%) of all plans offered in 2019. The growth in number of plans varies across states and counties, with the preponderance of the growth in plans occurring in Florida (75 more plans; data not shown). The District of Columbia and Maine will have fewer plans available in 2019 than in 2018 (with 6 fewer and 1 fewer plans, respectively).

Figure 1: More Medicare Advantage plans are available in 2019 than in any year since 2009

In addition to the new plans available for individual enrollment, more Special Needs Plans (SNPs) will be available in 2019, increasing from 630 plans in 2018 to 717 plans in 2019, reflecting an increase in SNPs for beneficiaries dually eligible for Medicare and Medicaid (D-SNPs; 401 plans in 2018 to 465 plans in 2019) and SNPs for people requiring an institutional-level of care (I-SNPs; 97 plans in 2018 to 125 plans in 2019). The number of SNPs for people with chronic or disabling conditions (C-SNPs) will decline from 132 plans to 127 plans between 2018 and 2019. This decline in C-SNPs may be partly due to both the value-based insurance design (VBID) model with the CMS Innovation Center, which allows plans to reduce cost-sharing or offer supplemental benefits for people with chronic conditions to promote high-value services, and the new authority of Medicare Advantage plans that are open for general enrollment to target supplemental benefits to people with certain chronic conditions beginning in 2019. Both of these expanded authorities allow Medicare Advantage plans to offer benefits to people with chronic conditions that have traditionally been offered through C-SNPs.

While many employers and unions also offer Medicare Advantage plans to their retirees, no information about these plans is made available by CMS to the public during the Medicare open enrollment period.

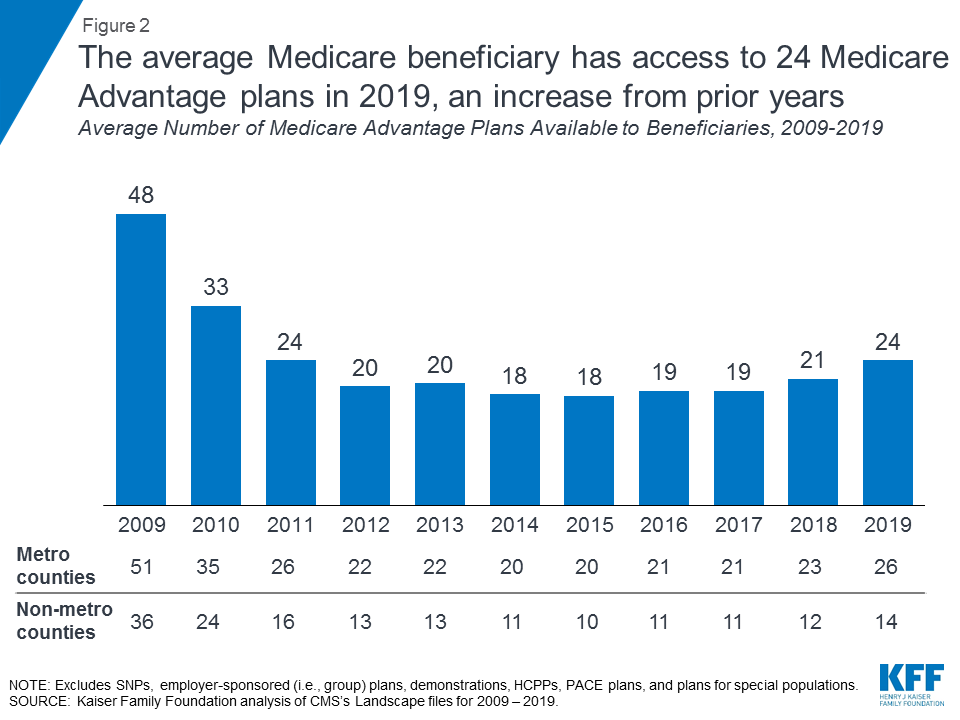
Number of Plans Available to Beneficiaries. In 2019, the average Medicare beneficiary will have access to 24 Medicare Advantage plans available for individual enrollment, the highest number of plans per beneficiary since 2011 (Figure 2). Among the 24 Medicare Advantage plans available to the average Medicare beneficiary, 20 of the plans will include prescription drug coverage (MA-PDs); 90 percent of all Medicare Advantage plans offered will include prescription drug coverage in 2019.

Figure 2: The average Medicare beneficiary has access to 24 Medicare Advantage plans in 2019, an increase from prior years

Variation in the Number of Plans, by Geographic Area.  On average, beneficiaries in metropolitan areas will be able to choose from nearly twice as many Medicare Advantage plans as beneficiaries in non-metropolitan areas (26 plans versus 14 plans, respectively).  In six percent of counties (accounting for 30% of beneficiaries), beneficiaries can choose from more than 30 plans in 2019, including four counties in Ohio (Mahoning, Medina, Trumbull, and Summit) and two counties in Pennsylvania (Bucks and Lancaster) where more than 50 plans will be available (Figure 3). In contrast, in 8 percent of counties (accounting for 2% of beneficiaries), beneficiaries can choose from two or fewer Medicare Advantage plans, including 57 counties in which only one plan will be available to beneficiaries. No Medicare Advantage plans will be offered in 115 counties in 2019, down from 149 counties in 2018; these counties account for one percent of beneficiaries, most of whom live in relatively rural areas in California. Eight other states also have counties in which no Medicare Advantage plans will be offered in 2019 (AK, CO, IA, ID, NE, NV, VA, and WA). Additionally, no Medicare Advantage plans are available in territories other than Puerto Rico.  

[medicare-advantage-county-map]


Access to Medicare Advantage Plans, by Plan Type

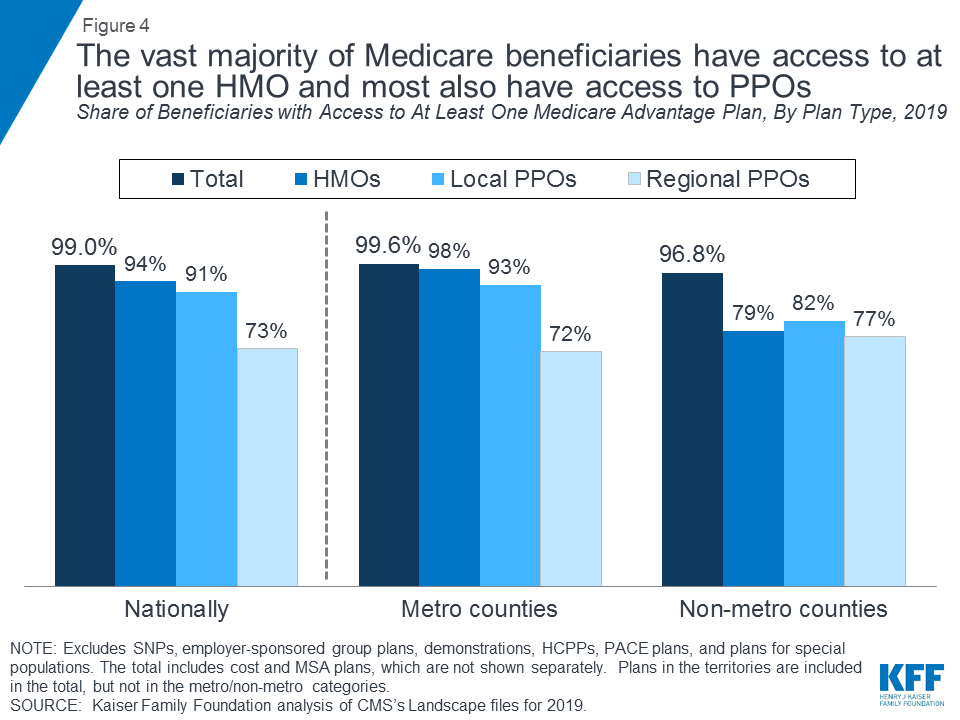
As in recent years, virtually all Medicare beneficiaries (99%) will continue to have access to a Medicare Advantage plan as an alternative to traditional Medicare (Figure 4). Almost all beneficiaries in metropolitan areas (99.6%) and the vast majority of beneficiaries in non-metropolitan areas (97%) will continue to have access to at least one Medicare Advantage plan, similar to percentages in prior years. In non-metropolitan counties, a smaller share of beneficiaries will have access to HMOs or local PPOs, and a slightly larger share of beneficiaries will have access to regional PPOs.

Figure 4: The vast majority of Medicare beneficiaries have access to at least one HMO and most also have access to PPOs

Number of Firms

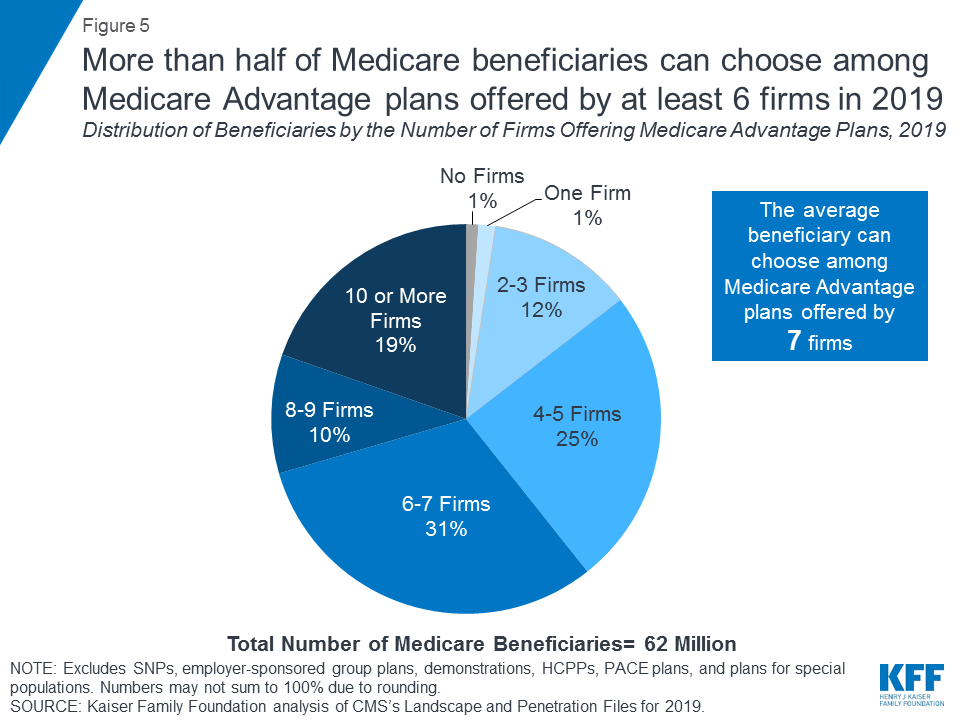
The average Medicare beneficiary will be able to choose from plans offered by 7 firms, on average, in 2019, an increase from 6 firms in 2018 (Figure 5). Nearly one in five beneficiaries (19%) will be able to choose from plans offered by 10 or more firms. The number of firms offering Medicare Advantage plans will be highest in Los Angeles County (14 firms), the New York City boroughs of Kings and Queens (14 firms each), and Miami-Dade County (13 firms). In each of these metropolitan counties, per capita spending for the traditional Medicare and the share of beneficiaries enrolled in Medicare Advantage plans are much higher than the national average. In contrast, in 194 counties, most of which are rural counties with relatively few Medicare beneficiaries, only one firm will offer Medicare Advantage plans in 2019, a reduction from 441 such counties in 2018.

Figure 5: More than half of Medicare beneficiaries can choose among Medicare Advantage plans offered by at least 6 firms in 2019

New Market Entrants and Exits

Medicare Advantage continues to be an attractive market for insurers, with 14 firms entering the Medicare Advantage market for the first time in 2019 (Table A2). Seven the new entrants will be offering HMOs available for individual enrollment, one of which will also offer local PPOs. Eight of the new entrants will be offering SNPs, with five entrants offering I-SNPs, four entrants offering D-SNPs, and one offering C-SNPs for people with diabetes or chronic heart failure.

One of the new entrants, Devoted Health, has received venture capital funding, joining about a dozen other venture capital-funded firms offering Medicare Advantage plans in 2019. Lasso Healthcare will offer MSAs in 17 states, many of which have a relatively small share of beneficiaries in Medicare Advantage plans. MSAs operate similar to Health Savings Accounts, and include few (about 6,000) beneficiaries in 2018. Mutual of Omaha, a large insurance corporation, will be entering both the Medicare Advantage market and the stand-alone prescription drug plan (PDP) market for the first time in 2019.

Five insurers will be exiting the Medicare Advantage market in 2019. Four of these insurers offered D-SNPs in 2018, one of which also offered C-SNPs for people with chronic heart failure in 2018. MedStar, a large health care system in the DC metropolitan area, offered Medicare Advantage plans for several years, but will be exiting the Medicare Advantage market in 2019. While these market exits comprise a relatively small share of the insurers in the Medicare Advantage market (with over 200 insurers, including employer/union sponsored plans as well as other plans), the exits are evidence that not all plans in the Medicare Advantage market are profitable. Together, the five insurers exiting the Medicare Advantage market had about 23,000 enrollees in 2018, far less than one percent of the 20 million beneficiaries enrolled in Medicare Advantage in 2018.

Premiums

The vast majority of Medicare Advantage plans for individual enrollment (90%) will include prescription drug coverage (MA-PDs), and about 45 percent of these plans will charge no premium, other the Part B premium, similar to 2018. Nine out of ten beneficiaries (90%) will have access to a MA-PD with no monthly premium in 2019. The average premium for MA-PDs (not weighted by enrollment) will be $40 per month in 2019, down from $46 per month in 2018. Medicare Advantage enrollees typically choose low premium plans, and enrollment-weighted premiums are often lower than the average premium.

Discussion

More Medicare Advantage plans will be offered in 2019 than any year since 2009. While five insurers will be exiting the Medicare Advantage market, they comprise a relatively small share of the insurers offering Medicare Advantage plans, and include about 0.1 percent of Medicare Advantage enrollees. Fifteen insurers will be entering the market for the first time in 2019 – suggesting that the market remains very attractive to insurers. Some parts of the country (such as Florida) continue to be particularly attractive to insurers. As in prior years, some (mostly rural) counties are less attractive to insurers, with fewer firms and plans available. Overall, less than 1 percent of beneficiaries will not have access to a Medicare Advantage plan in 2019, similar to prior years. As Medicare Advantage enrollment continues to grow, insurers seem to be responding by offering more plans and choices to the people on Medicare.

Gretchen Jacobson and Tricia Neuman are with the Kaiser Family Foundation; and Anthony Damico is an independent consultant.

Tables

Table A1. Availability of Medicare Advantage Plans and Insurers, by State, 2019
StateTotal number of plansAverage number of plans available to beneficiariesAverage number of insurers offering plansShare of beneficiaries with access to at least 1 plan
All plansHMOsLocal PPOs
Nationwide2,73424799%94%91%
Alabama49155100%95%100%
Alaska00N/A0%0%0%
Arizona58218100%95%95%
Arkansas40186100%98%84%
California22027996%96%55%
Colorado49195100%83%94%
Connecticut28246100%100%100%
Delaware10104100%100%100%
DC773100%100%100%
Florida254318100%99%99%
Georgia63196100%84%94%
Hawaii20115100%100%100%
Idaho4416492%90%91%
Illinois101278100%98%93%
Indiana89196100%100%100%
Iowa42114100%92%96%
Kansas50144100%62%77%
Kentucky53134100%87%99%
Louisiana51166100%100%100%
Maine38216100%100%100%
Maryland26104100%90%73%
Massachusetts57286100%99%97%
Michigan74355100%100%100%
Minnesota69266100%100%99%
Mississippi26103100%76%73%
Missouri63184100%85%93%
Montana1453100%79%85%
Nebraska187387%68%68%
Nevada3415597%96%97%
New Hampshire30215100%100%100%
New Jersey49206100%100%100%
New Mexico25124100%58%100%
New York1733510100%100%100%
North Carolina69155100%94%95%
North Dakota19113100%0%50%
Ohio122409100%100%100%
Oklahoma37164100%79%89%
Oregon78217100%96%100%
Pennsylvania160408100%100%100%
Rhode Island14143100%100%100%
South Carolina59155100%99%96%
South Dakota23144100%27%80%
Tennessee57186100%100%100%
Texas137248100%92%94%
Utah30146100%95%93%
Vermont982100%100%100%
Virginia78134100%95%90%
Washington10623691%90%84%
West Virginia33195100%100%100%
Wisconsin97246100%99%90%
Wyoming521100%3%3%
Note: Excludes SNPs, employer-sponsored group plans, demonstrations, HCPPs, PACE plans, and plans for special populations. N/A indicates not applicable. Nationwide totals include Puerto Rico and other territories.Source: Kaiser Family Foundation analysis of CMS Landscape File, 2019.

Table A2. Entrants and Exiting Insurers in Medicare Advantage Markets, by Plan Type and Plan Locations, 2019
Company NameTotal Number of Plans OfferedOffering Plans for Individual Enrollment?Offering Special Needs Plans (SNPs)?States in Which Plans Are Offered
HMOs?Local PPOs?Other?D-SNPsC-SNPsI-SNPs
New Entrants
American Health Advantage2XOK and TN
BayCare Health Plans2XFL
Clear Spring Health9XXCO, IL, NC, and VA
Devoted Health10XFL
Doctors HealthCare Plans, Inc.4XXXFL
Health Pointe of New York, LLC1XNY
Integra Managed Care4XNY
Lasso Healthcare3X (MSA)AZ, AR, DE, HI, IL, IN, KS, MD, MS, MT, NC, ND, PA, SD, TX, UT, and WY
Longevity Health Plan2XIL, NY
Mutual of Omaha4XKY, OH, and TX
Nascentia Health Plus3XXNY
Solis Health Plans8XXFL
Valor Health Plan1XOH
Vitality Health Plan of California3XCA
Exiting Insurers
Catholic Health Initiatives4XAR, KY, NE, and OH
FamilyCare Health2XXOR
Jewish Guild for the Blind1XNY
MedStar Family Choice, Inc6XXXDC and MD
Premier Health Plan3XXOH
Note: D-SNPs are plans for people dually eligible for Medicare and Medicaid; C-SNPs are plans for people with certain chronic conditions; and I-SNPs are plans for people that require an institutional level of care. MSAs are Medicare Medical Savings Accounts. Catholic Health Initiatives includes subsidiaries RiverLink Health, HeartlandPlains Health, and QualChoice Advantage.Source: Kaiser Family Foundation analysis of CMS Landscape Files for 2018 and 2019.

2019 Premium Changes on ACA Exchanges

Authors: Rabah Kamal, Cynthia Cox, Michelle Long, Ashley Semanskee, Marco Ramirez, and Larry Levitt
Published: Oct 11, 2018

Insurers submit filings every year to state regulators detailing their plans to participate in the Affordable Care Act marketplaces (also called exchanges). These filings include information on the premiums insurers plan to charge in the coming year and which areas they plan to serve. Each state or the federal government reviews premiums to ensure they are accurate and justifiable before the rate goes into effect, though regulators have varying types of authority and states make varying amounts of rate review information public.

This analysis looks at lowest-cost bronze, second lowest-cost silver, and lowest-cost gold premiums in the 50 states and the District of Columbia. (Our analyses from 2018, 2017, 2016, 2015, and 2014 examined changes in premiums and participation in these states and major cities since the exchange markets opened nearly four years ago.) The second lowest-cost silver plan serves as the benchmark for premium tax credits (which subsidize premiums for low and modest income exchange enrollees) and is the only plan that offers reduced cost sharing for lower-income enrollees. About 63% of marketplace enrollees are in silver plans this year, and 29% are enrolled in bronze plans.

Rates and plan offerings for 2019 have been finalized, and Open Enrollment is underway. Open Enrollment for ACA-compliant coverage for 2019 runs from November 1st through December 15th in most states.

Premium Changes

The tables below show final 2018 and 2019 premiums for a major city in each of the 50 states and Washington, D.C.

Table 1 below shows monthly premiums before applying a tax credit for the lowest-cost bronze, second lowest-cost silver, and lowest-cost gold plans insurers are offering on the ACA exchanges for 2019.

Table 1: Monthly Unsubsidized Bronze, Benchmark, and Gold Premiums for a 40 Year Old Non-Smoker
 State Major CityLowest Cost BronzeBefore Tax Credit2nd Lowest Cost SilverBefore Tax CreditLowest Cost GoldBefore Tax Credit
20182019% Change from 201820182019% Change from 201820182019% Change from 2018
Alabama Birmingham$372$327-12%$546$525-4%$612$6161%
AlaskaAnchorage$526$461-12%$709$696-2%$759$655-14%
ArizonaPhoenix$405$333-18%$513$426-17%$621$574-8%
ArkansasLittle Rock$309$3204%$378$3811%$424$46911%
CaliforniaLos Angeles$247$28114%$360$3764%$398$4052%
Colorado Denver$338$336-1%$413$46613%$459$4805%
Connecticut Hartford$306$297-3%$484$428-12%$545$542-1%
DelawareWilmington$473$449-5%$591$68516%$706$672-5%
DC Washington$271$31617%$324$39321%$385$42611%
FloridaMiami$297$33212%$442$4471%$456$4764%
GeorgiaAtlanta$371$316-15%$421$4405%$465$4977%
HawaiiHonolulu$336$3617%$456$50310%$449$4694%
Idaho Boise$290$282-3%$463$4793%$464$4803%
IllinoisChicago$305$3288%$411$384-7%$488$442-9%
Indiana Indianapolis$323$3508%$366$3773%$501$498-1%
IowaCedar Rapids$570$429-25%$702$7243%$781$528-32%
KansasWichita$344$3759%$484$5299%$445$4859%
KentuckyLouisville$282$274-3%$397$370-7%$446$50613%
LouisianaNew Orleans$363$336-7%$409$384-6%$509$484-5%
MainePortland$337$335-1%$513$485-5%$570$5822%
Maryland Baltimore$314$298-5%$456$419-8%$449$408-9%
MassachusettsBoston$233$2518%$305$3215%$347$334-4%
Michigan Detroit$219$2253%$332$3330%$341$3554%
Minnesota Minneapolis$259$238-8%$327$300-8%$410$343-16%
Mississippi Jackson$492$474-4%$551$542-2%$687$648-6%
MissouriSt. Louis$281$32516%$465$421-9%$636$566-11%
MontanaBillings$334$321-4%$503$5224%$561$499-11%
NebraskaOmaha$532$473-11%$752$8219%$753$586-22%
NevadaLas Vegas$291$2920%$384$369-4%$416$404-3%
New HampshireManchester$391$303-23%$475$402-15%$524$444-15%
New JerseyNewark$322$279-13%$411$348-15%$646$538-17%
New Mexico Albuquerque$258$241-7%$401$342-15%$331$3341%
New York New York$416$4211%$510$58715%$595$69717%
North CarolinaCharlotte$491$361-26%$667$536-20%$703$548-22%
North DakotaFargo$254$2779%$298$38830%$382$3923%
Ohio Cleveland$244$2648%$319$3273%$376$4006%
OklahomaOkla. City$377$334-11%$685$6860%$690$486-30%
Oregon Portland$271$2969%$380$4149%$401$4399%
PennsylvaniaPhiladelphia$401$370-8%$636$465-27%$539$517-4%
Rhode Island Providence$198$2159%$311$3368%$300$3238%
South CarolinaColumbia$393$4053%$562$6037%$590$6073%
South DakotaSioux Falls$346$330-5%$453$448-1%$509$5212%
Tennessee Nashville$351$342-3%$585$486-17%$824$813-1%
TexasHouston$270$2866%$399$393-2%$426$47612%
UtahSalt Lake City$283$271-4%$517$510-1%$578$5841%
Vermont Burlington$422$4261%$505$62223%$569$5843%
Virginia Richmond$327$37916%$482$4994%$719$499-31%
Washington Seattle$264$31921%$339$38012%$406$4367%
West VirginiaHuntington$410$47516%$478$53111%$623$68310%
WisconsinMilwaukee$434$372-14%$568$563-1%$666$570-14%
WyomingCheyenne$534$531-1%$796$7960%$657$6600%
SOURCE: Kaiser Family Foundation analysis of premium data from insurer rate filings to state regulators, healthcare.gov, and state plan finders

Table 2 shows the monthly premium tax credit for a 40-year-old making $30,000 per year living in a major city in each of the 50 states and Washington, D.C.

Table 2: Monthly Advanced Premium Tax Credit Amount for a 40 Year Old Non-Smoker Making $30,000 / Year
StateMajor City20182019% Change from 2018
AlabamaBirmingham$344$319-7%
AlaskaAnchorage$550$525-5%
Arizona Phoenix$310$220-29%
ArkansasLittle Rock$177$173-2%
California Los Angeles$158$1708%
Colorado Denver$214$26021%
Connecticut Hartford$283$224-21%
DelawareWilmington$388$47823%
DC Washington$117$18155%
FloridaMiami$241$2410%
GeorgiaAtlanta$216$2338%
HawaiiHonolulu$265$31519%
Idaho Boise$261$2724%
IllinoisChicago$209$177-15%
Indiana Indianapolis$163$1715%
IowaCedar Rapids$501$5183%
KansasWichita$283$32214%
KentuckyLouisville$177$164-7%
LouisianaNew Orleans$207$177-14%
Maine Portland$311$278-11%
Maryland Baltimore$250$215-14%
MassachusettsBoston$104$11511%
Michigan Detroit$131$127-3%
Minnesota Minneapolis$126$94-25%
MississippiJackson$349$336-4%
MissouriSt. Louis$263$214-19%
MontanaBillings$302$3165%
NebraskaOmaha$551$61411%
NevadaLas Vegas$182$162-11%
New HampshireManchester$273$196-28%
New Jersey Newark$209$141-33%
New Mexico Albuquerque$200$134-33%
New York New York$308$36920%
North CarolinaCharlotte$465$330-29%
North DakotaFargo$97$18086%
Ohio Cleveland$116$1203%
OklahomaOkla. City$484$480-1%
Oregon Portland$174$20518%
PennsylvaniaPhiladelphia$434$259-40%
Rhode Island Providence$109$12918%
South CarolinaColumbia$359$39711%
South DakotaSioux Falls$252$242-4%
Tennessee Nashville$381$280-27%
TexasHouston$198$186-6%
UtahSalt Lake City$313$300-4%
Vermont Burlington$341$45333%
Virginia Richmond$281$2924%
Washington Seattle$135$17731%
West VirginiaHuntington$262$30516%
WisconsinMilwaukee$366$356-3%
WyomingCheyenne$595$589-1%
SOURCE: Kaiser Family Foundation analysis of premium data from insurer rate filings to state regulators, healthcare.gov, and state plan finders

Table 3 shows monthly premiums after applying a tax credit for the lowest-cost bronze, second lowest-cost silver, and lowest-cost gold plans insurers are offering for 2019.

Table 3: Monthly Subsidized Bronze, Benchmark, and Gold Premiums for a 40 Year Old Non-Smoker Making $30,000 / Year
 State Major CityLowest Cost BronzeAfter Tax Credit2nd Lowest Cost SilverAfter Tax CreditLowest Cost GoldAfter Tax Credit
20182019% Change from 201820182019% Change from 201820182019% Change from 2018
AlabamaBirmingham$27$8-70%$201$2062%$268$29711%
AlaskaAnchorage$1$10%$159$1718%$209$130-38%
ArizonaPhoenix$96$11318%$203$2061%$311$35414%
ArkansasLittle Rock$132$14711%$201$2083%$248$29619%
CaliforniaLos Angeles$89$11125%$201$2062%$239$236-1%
Colorado Denver$124$77-38%$200$2063%$246$221-10%
Connecticut Hartford$23$73217%$201$2041%$262$31821%
DelawareWilmington$86$0-100%$203$2061%$319$194-39%
DC Washington$154$135-12%$207$2133%$269$245-9%
FloridaMiami$56$9163%$201$2062%$215$23610%
GeorgiaAtlanta$156$82-47%$205$2060%$249$2636%
HawaiiHonolulu$71$46-35%$191$187-2%$184$154-16%
Idaho Boise$29$10-66%$202$2072%$203$2082%
IllinoisChicago$96$15157%$202$2062%$279$265-5%
Indiana Indianapolis$160$17912%$203$2061%$338$327-3%
IowaCedar Rapids$69$0-100%$201$2062%$280$11-96%
KansasWichita$62$52-16%$201$2062%$162$1620%
KentuckyLouisville$104$1106%$219$206-6%$269$34227%
LouisianaNew Orleans$156$1581%$201$2062%$302$3061%
MainePortland$26$57119%$203$2061%$259$30317%
Maryland Baltimore$64$8330%$206$204-1%$199$193-3%
MassachusettsBoston$129$1365%$201$2062%$243$219-10%
Michigan Detroit$88$9811%$201$2062%$211$2288%
Minnesota Minneapolis$133$1448%$201$2062%$284$249-12%
MississippiJackson$143$138-3%$201$2062%$338$312-8%
MissouriSt. Louis$18$110511%$201$2062%$373$351-6%
MontanaBillings$32$5-84%$201$2062%$259$184-29%
NebraskaOmaha$0$00%$201$2062%$202$0-100%
NevadaLas Vegas$109$13019%$201$2062%$233$2424%
New HampshireManchester$118$107-9%$201$2062%$250$248-1%
New Jersey Newark$113$13721%$202$2072%$438$397-9%
New Mexico Albuquerque$58$10784%$201$2083%$131$19952%
New York New York$108$52-52%$202$2188%$287$32814%
North CarolinaCharlotte$26$3118%$201$2062%$238$219-8%
North DakotaFargo$157$96-39%$201$2083%$286$212-26%
Ohio Cleveland$128$14312%$203$2061%$259$2798%
OklahomaOkla. City$0$00%$201$2062%$206$6-97%
Oregon Portland$97$91-6%$206$2091%$227$2343%
PennsylvaniaPhiladelphia$0$111NA$201$2062%$105$258146%
Rhode Island Providence$89$86-3%$202$2072%$191$1942%
South CarolinaColumbia$34$9-74%$203$2061%$230$211-8%
South DakotaSioux Falls$94$88-6%$201$2062%$257$2799%
Tennessee Nashville$2$633050%$204$2061%$443$53320%
TexasHouston$72$10039%$201$2062%$228$29027%
UtahSalt Lake City$0$00%$204$2103%$265$2847%
VermontBurlington$81$0-100%$164$1693%$228$131-43%
Virginia Richmond$47$8785%$201$2062%$438$207-53%
Washington Seattle$130$1429%$204$2030%$272$259-5%
West VirginiaHuntington$148$16914%$216$2265%$361$3774%
WisconsinMilwaukee$68$16-76%$202$2062%$300$213-29%
WyomingCheyenne$0$00%$201$2062%$62$7013%
SOURCE: Kaiser Family Foundation analysis of premium data from insurer rate filings to state regulators, healthcare.gov, and state plan finders

As insurers set rates for 2019, they considered the repeal of the individual mandate penalty (which goes into effect this coming year) and the proliferation of short-term, limited duration (STLD) health plans. In the absence of a penalty for not purchasing insurance, some people currently purchasing individual market insurance are expected to either stop purchasing any insurance or switch to non-ACA compliant STLD plans. It is likely that those who leave the regulated individual insurance market will be relatively healthy on average, which will increase premiums in 2019 more than would otherwise be the case.

In a separate analysis of what insurers explicitly reported in their 2019 rate filings, we find that premiums for all ACA-compliant plans — including those sold both on- and off-exchange — will on average be 6 percent higher than they otherwise would have been if it were it not for the repeal of the individual mandate penalty and the expansion of short-term and association health plans. In particular, ACA silver-level plans sold in the marketplaces will cost an average of 16 percent more than they otherwise would have, due to the combined effects of the loss of ACA cost-sharing reduction payments, the repeal of the ACA’s individual mandate penalty, and the expansion in the availability of more loosely-regulated plans. For example, the 2019 benchmark silver plan premiums for a 40-year-old on healthcare.gov would have averaged $427 per month in 2019, instead of the $495 per month recently reported by the Department of Health and Human Services. The analysis also finds that the average rate increase due to individual mandate uncertainty in 2018 was 5 percent among insurers who reported factoring in expected non-enforcement of the individual at the time.

Methods

Data were collected from health insurer rate filing submitted to state regulators, healthcare.gov, and state plan finders. These submissions are publicly available for the states we analyzed. Most rate information is available in the form of a SERFF filing (System for Electronic Rate and Form Filing) that includes a base rate and other factors that build up to an individual rate. In states where filings were unavailable, we gathered data from tables released by state insurance departments. All premiums in this analysis are at the rating area level, and some plans may not be available in all cities or counties within the rating area. Rating areas are typically groups of neighboring counties, so a major city in the area was chosen for identification purposes.

News Release

Implications of “Medicare for All” and “Public Plan” Strategies: New Brief and Interactive Tool Summarize Legislative Proposals and Key Issues

Published: Oct 10, 2018

The idea of expanding the role of government programs such as Medicare and Medicaid has received renewed attention on Capitol Hill and on the campaign trail this year as policymakers consider ways to expand health insurance coverage and moderate health care costs.

Lawmakers have introduced eight such proposals in the current Congress. They range from bills that would create a new, all-encompassing national health insurance program (sometimes called “Medicare-for-All”) to less sweeping measures that would create a new public plan option to supplement private sources of coverage and existing public programs. A new issue brief from KFF (the Kaiser Family Foundation) summarizes key features of these proposals and highlights their similarities and differences. It also compares the policy implications and tradeoffs involved in these proposals, and examines the plans’ potential implications for consumers, health care providers and payers. An accompanying interactive tool allows users to compare key elements of the proposals in a side-by-side format.

Although unlikely to advance during the remainder of the current session, the proposals could serve as prototypes for legislation in a future Congress. They illustrate the range of options that may emerge in the coming years. Greatly simplified, the current bills fall into four general categories:

  • Two proposals would create Medicare-For-All, a single national health insurance program for all U.S. residents  (Senator Sanders, S. 1804; Rep. Ellison, H.R. 676)
  • Three proposals would create a  new public plan option, based on Medicare, that would be offered to individuals and some or all employers through the ACA marketplace  (Rep. Schakowsky, H.R. 635/Sen. Whitehouse, S.194; Sen. Bennett, S. 1970/Rep. Higgins, H.R. 4094; Sen. Merkley, S. 2708/Rep. Richmond, H.R. 6117)
  • Two proposals would create a  Medicare buy-in option for older individuals not yet eligible for the current Medicare program (Sen. Stabenow, S. 1742; Rep. Higgins, H.R. 3748); and
  • One proposal would create a Medicaid buy-in option that states can elect to offer to individuals through the ACA marketplace. (Sen Schatz S. 2001 and Rep. Lujan, H.R. 4129)
News Release

Poll: Colorado Voters’ Top Issues for Gubernatorial Race Are Education, Health Care and Housing

Most Residents See the State’s Economy as Improving, But View Health Care and Housing Costs as Getting Worse

Published: Oct 10, 2018

Colorado voters most often cite education, health care and housing costs as the top issues for the state’s gubernatorial candidates to discuss ahead of the November elections, finds a new Kaiser Family Foundation/Colorado Health Foundation (KFF/CHF) poll.

The poll of more than 1800 residents reveals Coloradans’ views on a wide range of issues leading into the 2018 midterm elections and highlights differences related to health and quality of life among key demographic subgroups, including geography, income, race/ethnicity and partisan identification.

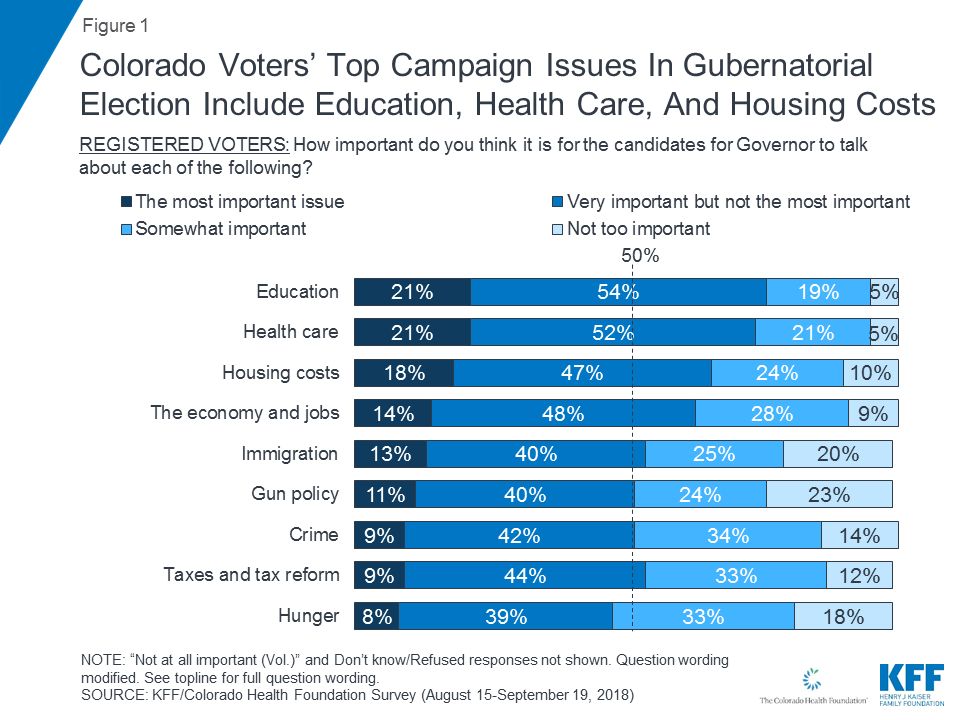
Among voters, about one in five cite each of education (21%), health care (21%), and housing costs (18%) as a top issue in the gubernatorial race. Fewer voters cite economy and jobs (14%), immigration (13%), gun policy (11%), crime (9%), taxes and tax reform (9%), and hunger (8%) as top issues.

The poll shows a partisan divide over the importance of health care, as seen nationally in other KFF polls. Republicans are least likely to say health care is the most important issue (12%), ranking the issue tied with education as fourth behind immigration, the economy and jobs, and housing costs. A third of Colorado Democratic voters (33%) say health care is the most important issue, making it their top issue, and nearly one in five independents (18%) rank health care as their most important issue, ranking second just behind education.

When voters who say health care is an important issue are asked what specifically about health care they would like the candidates to discuss, four in ten Colorado voters (41%) cite health care costs – at least four times as many as name any other health care issue.

“For Colorado voters, affordable housing and education are right up there with health care as top issues in the governor’s race,” KFF President and CEO Drew Altman said. “One lesson is that top issues in state elections often can look quite different than in national polls, though health care emerges among the top tier in both.”

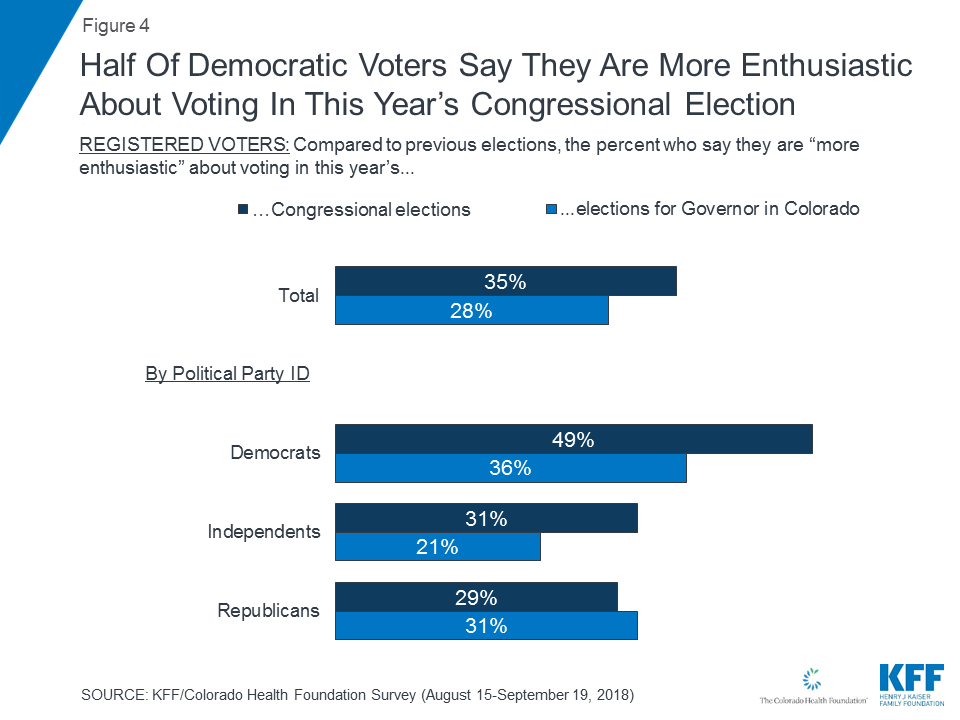
The poll suggests Colorado Democrats are more motivated to vote in November’s Congressional elections than others. Nearly half (49%) say they are “more enthusiastic” about voting in the Congressional elections this year, compared to about three in 10 Republicans (29%) and independents (31%).

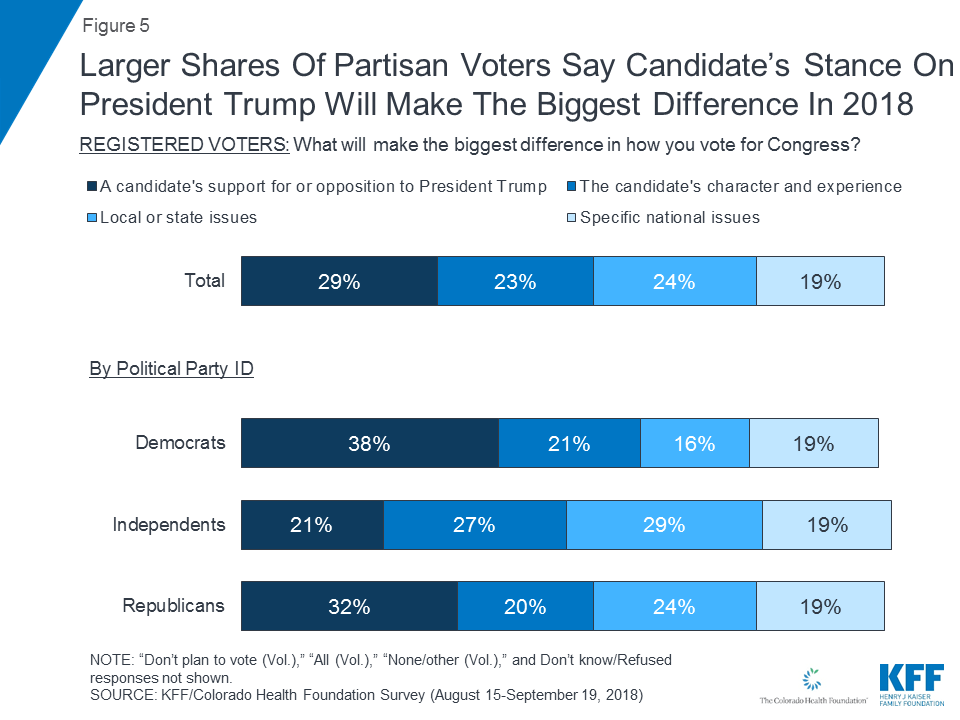
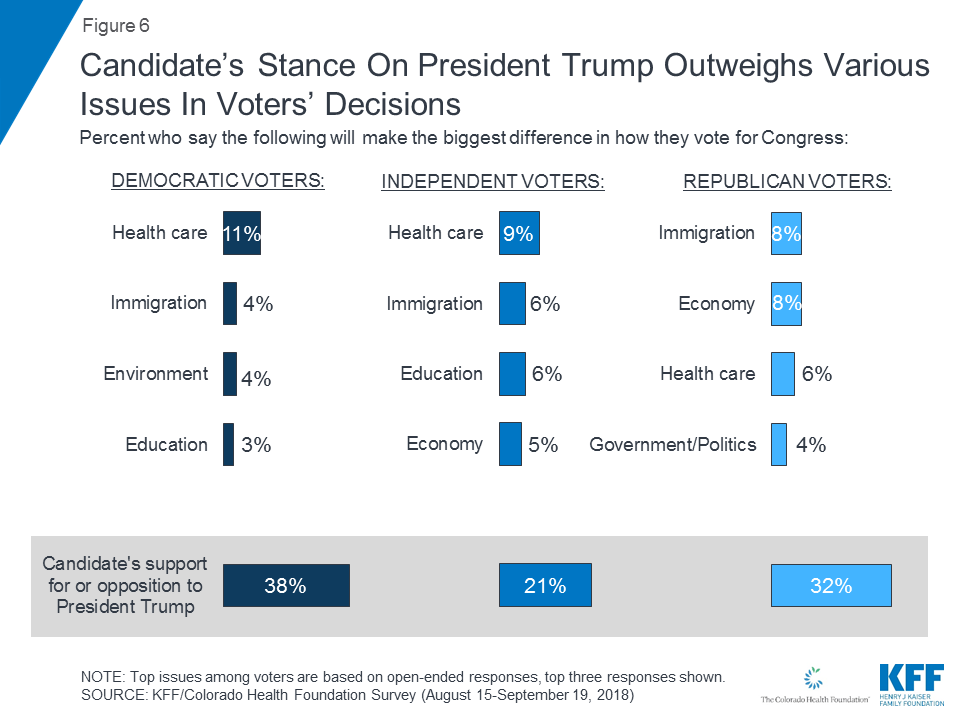
For many Colorado voters, President Trump could play a significant role in the election. More voters say that a candidate’s support for or opposition to President Trump is the biggest factor in their Congressional vote (29%) than say the same about a candidate’s character and experience (23%), local or state issues (24%), or specific national issues (19%).

Coloradans See Housing Costs, Substance Abuse and Health Care Costs Getting Worse

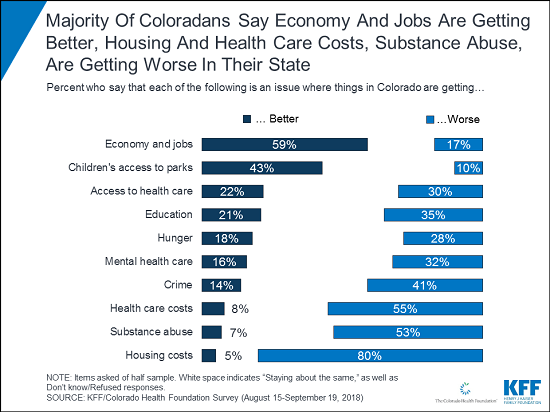
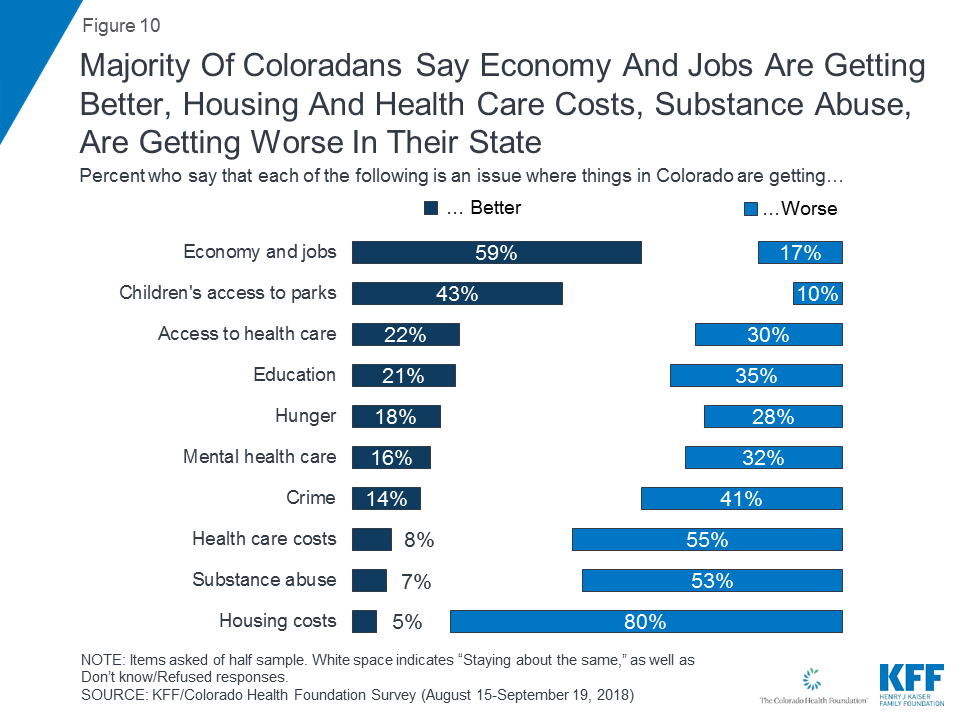
Overall Coloradans are optimistic about the state’s economy and job market, with six in 10 (59%) saying the economy is getting better in the state. On the other hand, most Coloradans say that housing costs (80%), health care costs (55%), and substance abuse (53%) are getting worse.

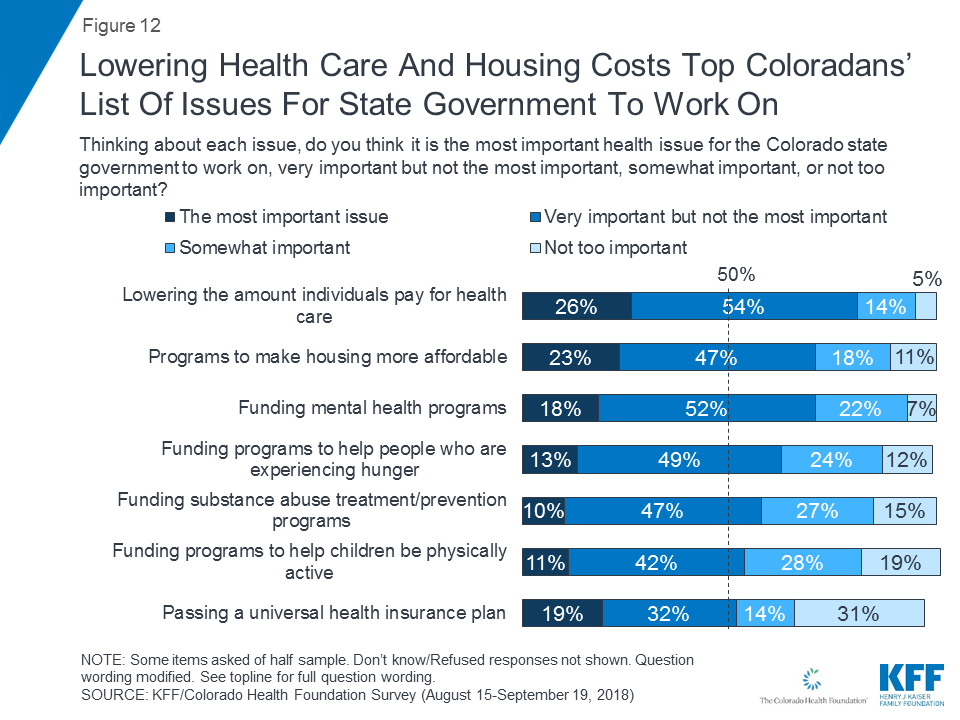
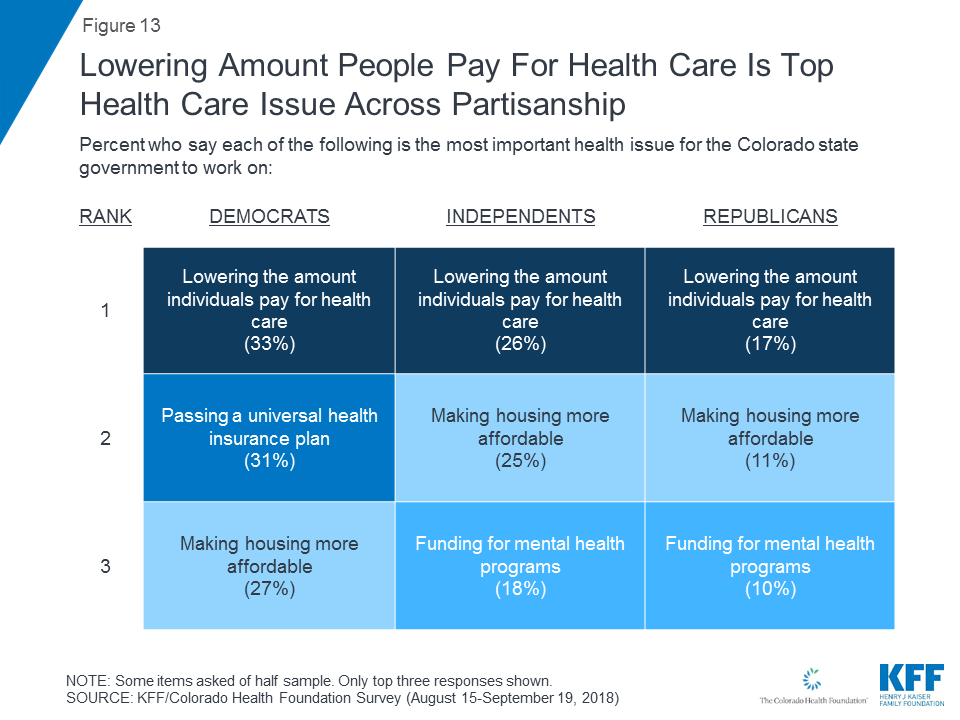
When asked about a series of priorities for state government, residents rank health care costs at the top of the list. Eight in 10 (80%) cite lowering what people pay for health care as at least “very important” for the state government to address.

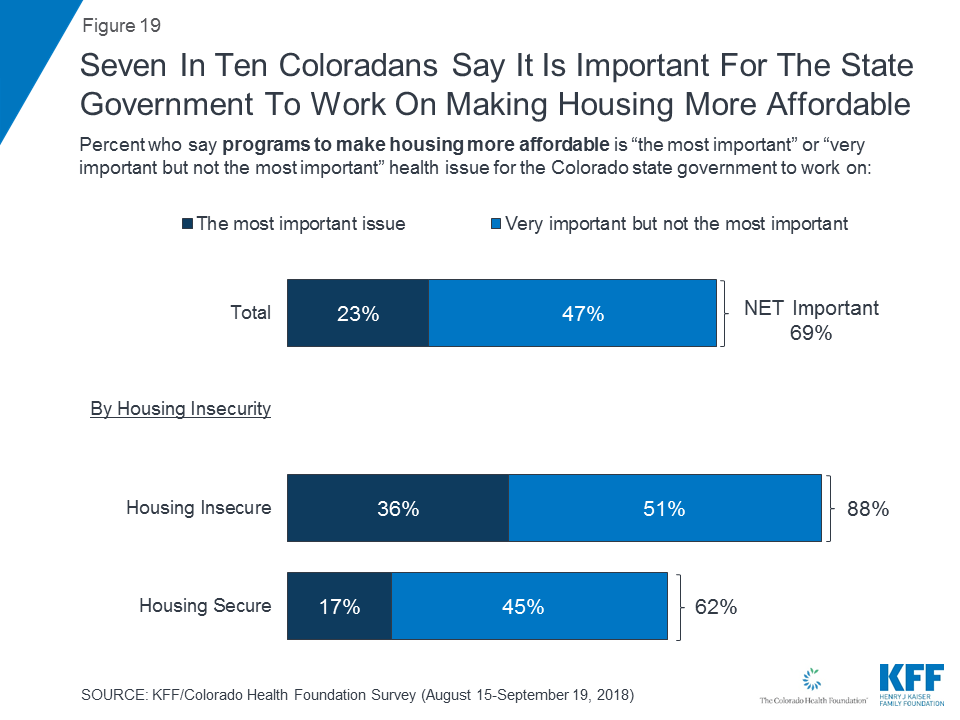
Seven in 10 say the same about making housing more affordable (69%) and funding mental health programs (70%). Fewer, but still a majority, say so about programs to address hunger (62%), substance abuse treatment and prevention (58%) and programs to help children be physically active (52%).

Health care costs rank among the top state government priorities across most demographic groups in Colorado. Notably, however, half (52%) of Black residents and one-third (33%) of those with incomes less than $40,000 name housing costs as their top priority.

Three in 10 Coloradans Worry about Losing Their Home Due to Its Cost

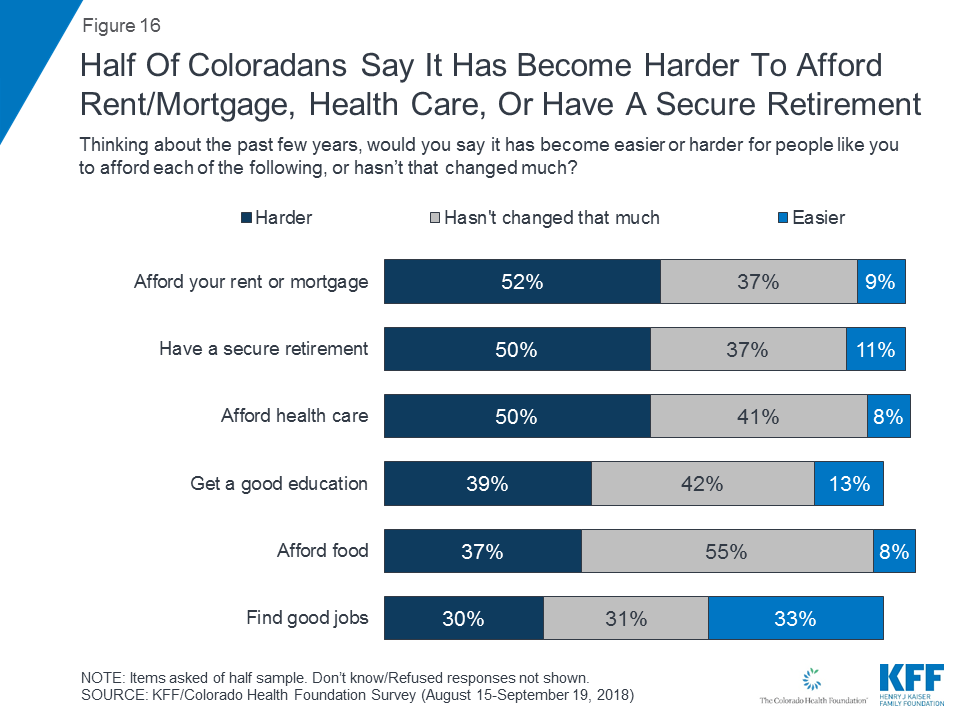
Half of Coloradans report that it has become harder for residents to afford their rent or mortgage in recent years (52%). In addition, nearly three in 10 (28%) say they worry that they might lose their home because they can’t afford their monthly payments, including one in eight (12%) who are “very worried.”

These housing worries are worse among residents in the Denver/Boulder area, where two thirds (65%) of residents say it has become more difficult to afford their rent and mortgage costs, and about a third (35%) worry about losing their home because they can’t afford their monthly payments.

Most Coloradans Report Being in Excellent or Very Good Health, But There is Significant Variation by Income

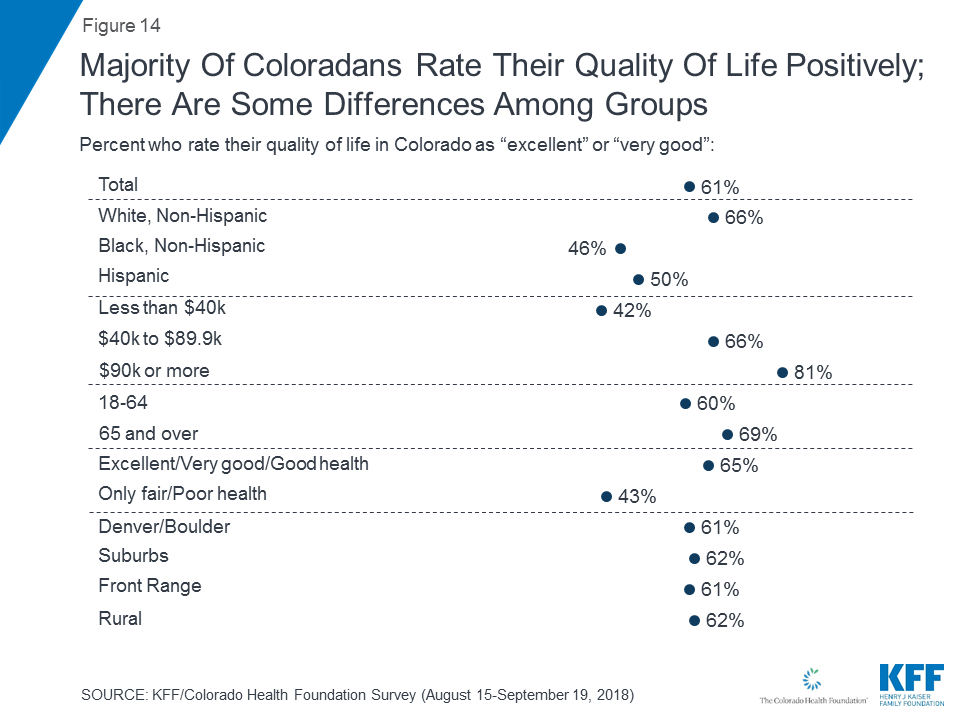
The survey finds most Coloradans say that their health (53%) and mental health (64%) are “excellent” or “very good,” with variations by income and race/ethnicity.

For example, fewer than half of those earning less than $40,000 report that their general health (38%) or their mental health (47%) is “excellent” or “very good,” compared to majorities of those with higher incomes. Black and Hispanic residents are also less likely than Whites to report “excellent” or “very good” health overall. There is little variation by region.

“Not every Coloradan feels they and their family can attain a good quality of life, particularly if they are living on lower incomes or are Black or Hispanic. That’s a sign of inequity that is negatively influencing the health of our state overall,” said Colorado Health Foundation President and CEO Karen McNeil-Miller. “Even with an expanding economy, our state’s work of bringing affordable health care and housing within reach for all Coloradans remains unfinished business. Coloradans want and expect the next elected leaders of Colorado to prioritize addressing these challenges.”

Other key findings include:

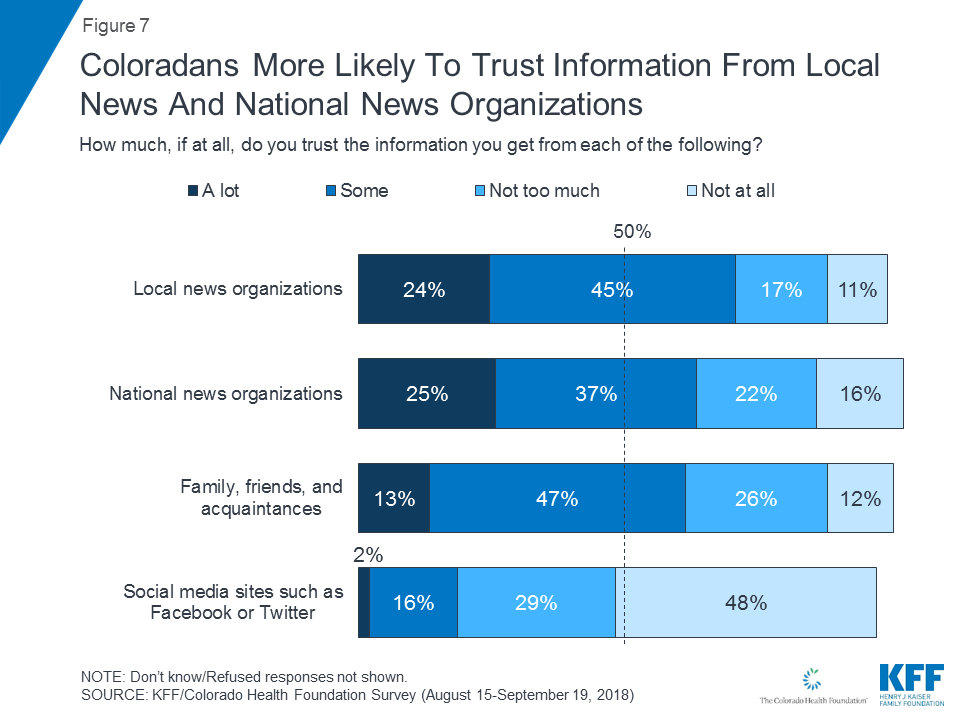
  • Local media are Colorado’s most trusted news source. Seven in 10 (69%) Coloradans say they have at least some trust in local news organizations. Majorities say the same about news from family and friends (60%) and national media organizations (62%). Far fewer trust the information they get from social media such as Facebook or Twitter (18%).
  • Coloradans split on how well state’s health system works. While most Coloradans (65%) say their families’ current health care needs are being met, nearly equal shares agree (46%) and disagree (45%) that the state’s health care system is meeting the needs of most Coloradans.
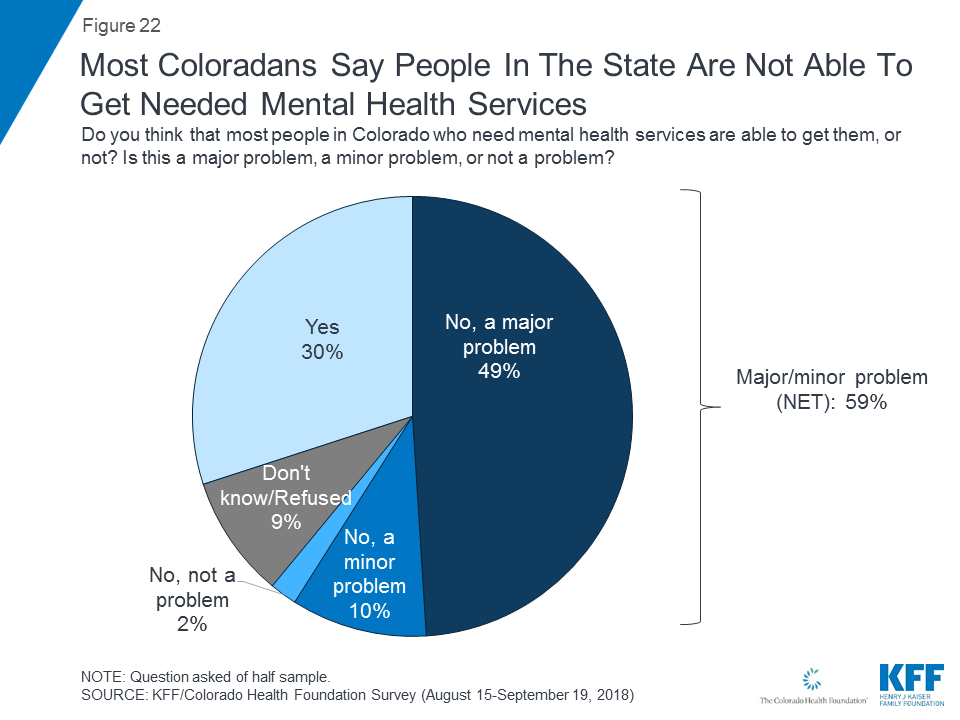
  • Most Coloradans view access to mental health services as a problem. Overall six in 10 (61%) say that most people in the state who need mental health services are not able to get them. This includes about half (49%) of all residents who view lack of access to mental health services as a “major problem.”
  • Costs and coverage pose barriers to mental health and substance abuse services. One in five Coloradans (20%) say there was a time when they or another family member thought they might need mental health or substance abuse services but did not get them. Many in this group say that they couldn’t afford the cost of treatment and/or that their insurance wouldn’t cover it.

Designed and analyzed by researchers at the Kaiser Family Foundation in consultation with the Colorado Health Foundation, Coloradans’ Perspectives on Health, Quality of Life, and Midterm Elections was conducted by landline and cellular telephone August 15 – September 19, 2018 among a random representative sample of 1,803 adults ages 18 and older living in Colorado. The margin of sampling error including the design effect for the full sample is plus or minus 3 percentage points. For results based on other subgroups, the margin of sampling error may be higher.

Filling the need for trusted information on national health issues, KFF (the Kaiser Family Foundation) is a nonprofit organization based in San Francisco, California.

The Colorado Health Foundation is bringing health in reach for all Coloradans by engaging closely with communities across the state through investing, policy advocacy, learning and capacity building. For more information, please visit www.coloradohealth.org.

Coloradans’ Perspectives on Health, Quality of Life, and Midterm Elections

Authors: Ashley Kirzinger, Bryan Wu, Liz Hamel, Mollyann Brodie, Taryn Fort, Kyle Legleiter, and Alexis Weightman
Published: Oct 10, 2018

Executive Summary

The Kaiser Family Foundation and Colorado Health Foundation collaborated to conduct a survey of Coloradans examining a wide range of issues leading into the 2018 midterm elections, with special attention to health care and housing.

Poll: Colorado Voters’ Top Issues for Gubernatorial Race Are Education, Health Care and Housing

KFF has been tracking the role of health care throughout the 2018 election cycle, and Colorado, with an open gubernatorial election and many contested congressional races, provides unique insight into how the issue may play out next month. Similar to KFF national polling, the affordability of health care is among the top issues for Colorado voters. One-fifth of voters say health care is the top issue for the 2018 gubernatorial candidates to talk about during their campaigns, with the issue ranking higher for Democratic voters compared to independent voters or Republican voters. When voters are asked what explicitly about health care they would like the gubernatorial candidates to discuss, four in ten voters offer health care costs as the most important issue for the candidates to discuss. Health care costs outrank all other health care issues by a margin of at least four to one.

In Colorado and nationally, KFF polling has found that Democrats have an edge when it comes to voter enthusiasm in the upcoming elections. In Colorado, while Democrats have a slight edge in voter enthusiasm when it comes to the gubernatorial election, they have a stronger edge in the congressional elections. Nearly half of Democratic voters in Colorado say they are “more enthusiastic” about voting in the Congressional election this year than previous elections compared to smaller shares of Republican voters and independent voters. In addition, Coloradans’ midterm voting intentions appear to be largely driven by views on President Trump, with substantial shares of voters saying a candidate’s support for or opposition to President Trump will make the biggest difference in their 2018 vote choice.

Most Coloradans See the State’s Economy as Improving, But View Health Care and Housing Costs as Getting Worse, @KaiserFamFound / @COHealthFDN poll finds

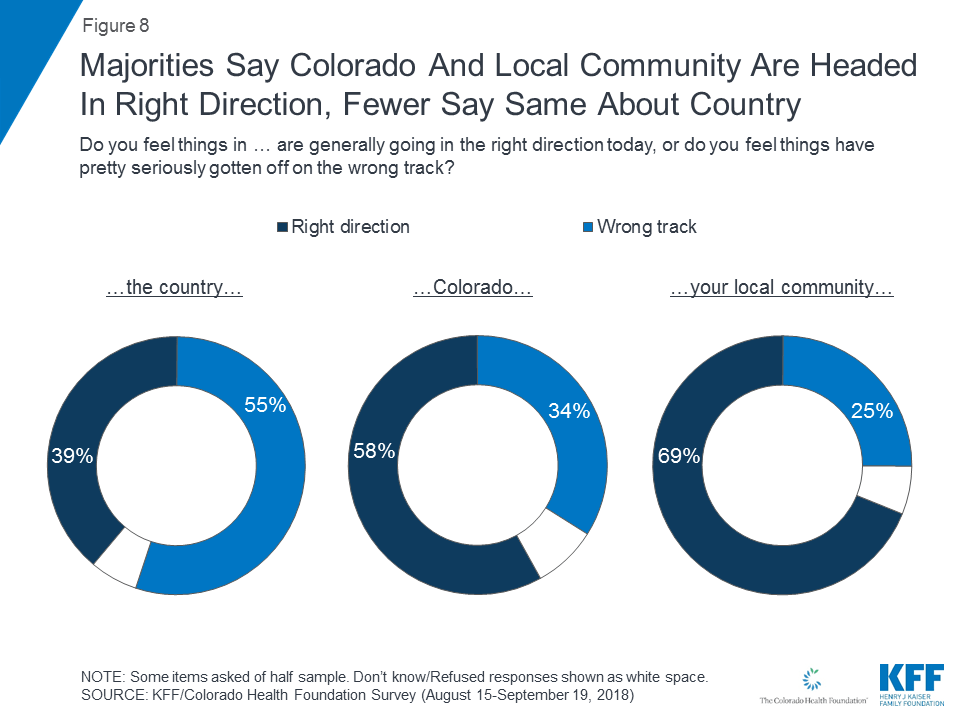
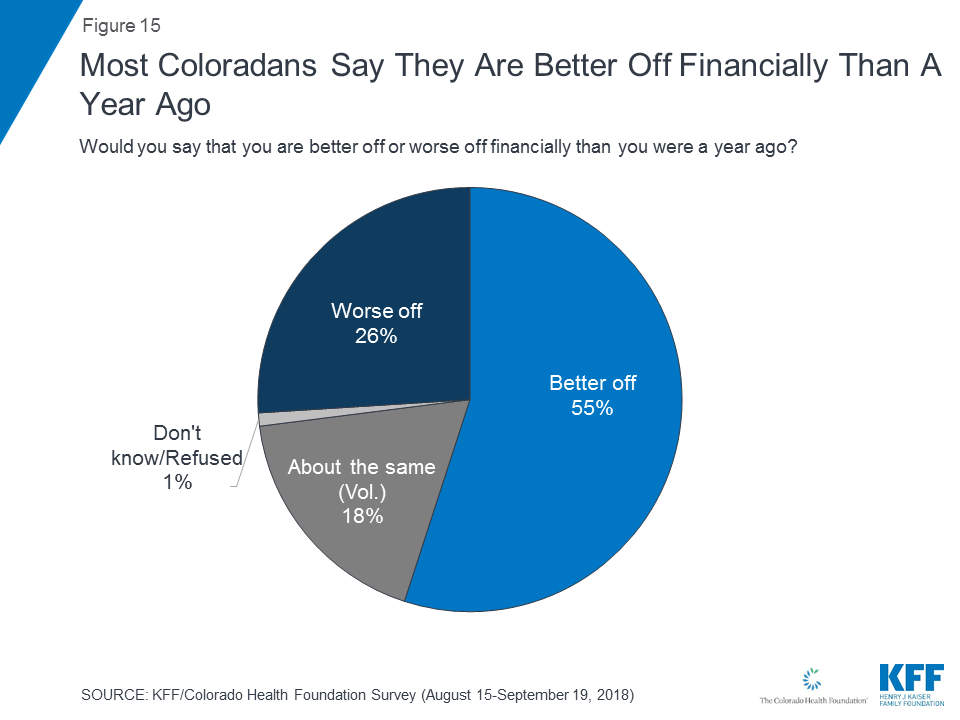
Coloradans generally have a positive outlook for the future of both the state and their own local communities, with majorities saying things are going in the right direction. Perceptions of the economy may be driving these positive attitudes, with six in ten Colorado residents saying the economy and jobs is one area where things in Colorado are getting “better” (including three in ten who say it is getting “much better”) compared to 17 percent who say it is getting “worse.” In addition, slightly more than half of Coloradans (55 percent) say they are personally “better off” financially than they were a year ago, while one-fourth (26 percent) say they are “worse off” and one in five (18 percent) say their financial situation is about the same. Yet, there are some differences among key demographic groups with less than half of those earning less than $40,000 annually and Black residents reporting they are better off financially now than they were a year ago.

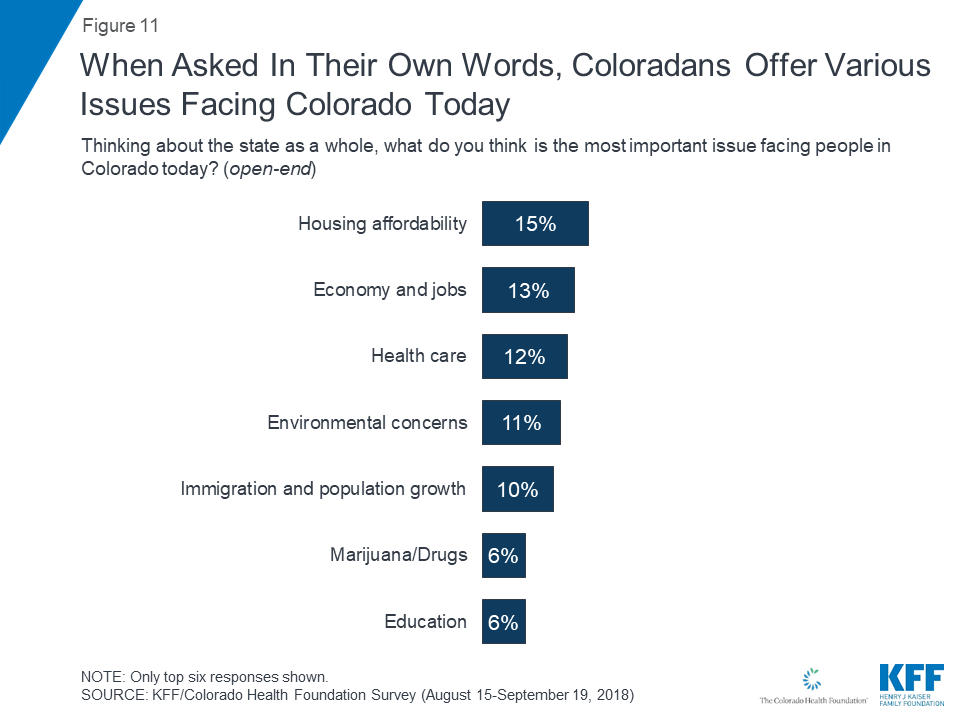
Despite this general optimism about the economy, health care and housing affordability weigh heavily on the minds of Coloradans. A majority of Coloradans say housing costs (80 percent), substance abuse (53 percent), and health care costs (55 percent) are areas where things are getting “worse” in Colorado. In addition, half of Coloradans report that over the past few years, it has become harder for people like them to afford their rent or mortgage or afford health care. Majorities of Coloradans say lowering the amount individuals pay for health care and making housing more affordable are at least “very important” for the state government to work on; about a quarter each choose health care costs and affordable housing as the “most important issue” for the Colorado state government.

Moving past the 2018 midterms, nearly three in ten Coloradans are worried that they might lose their home because they cannot afford their monthly housing costs, with a larger share of residents living in the Denver and Boulder areas saying it has become harder for them recently to afford their rent or mortgage than in other regions. In addition, about one-third of Denver and Boulder residents say they are either “very worried” or “somewhat worried” that they might lose their home because they cannot afford the monthly rent or mortgage.

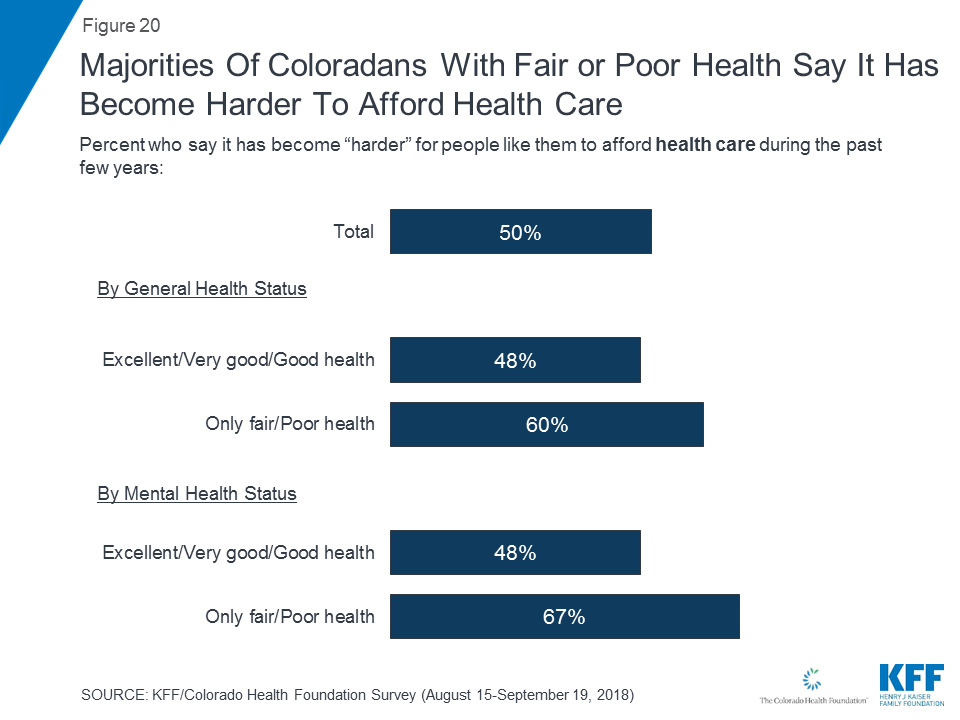
Half of Coloradans say it has gotten harder for people like them to afford health care and this is consistent across key demographic groups, with similar shares of Coloradans, regardless of race/ethnicity, income, or region saying it has gotten harder to afford health care in recent years. Moreover, while about two-thirds of Coloradans say the current Colorado health care system is meeting their family’s needs, one in five say there was a time when they or another family member thought they might need mental health or substance abuse services but did not get them – mainly due to costs.

Key Findings: Section One: 2018 Midterm Elections

Health care is among the top campaign issues for Colorado voters, with one-fifth of voter saying education (21 percent), health care (21 percent), and housing costs (18 percent) are the top issues for the 2018 gubernatorial candidates to talk about. Ranking slightly lower are issues such as the economy and jobs (14 percent), immigration (13 percent), gun policy (11 percent), crime (9 percent), taxes and tax reform (9 percent), and hunger (8 percent).

Figure 1: Colorado Voters’ Top Campaign Issues In Gubernatorial Election Include Education, Health Care, And Housing Costs

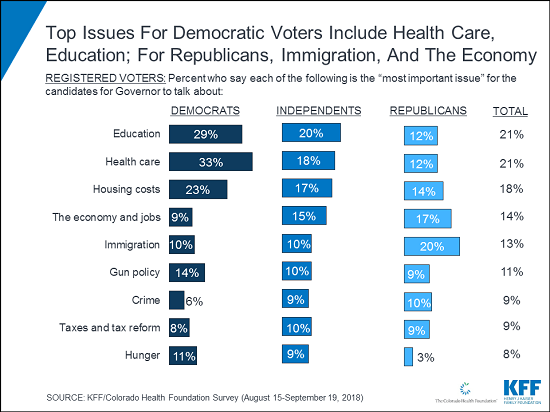
Similar to the national election landscape, health care is among the top issues Democratic voters in Colorado want to hear the gubernatorial candidates discuss while it ranks lower for Republican voters. One-third of Democratic voters say health care is the most important issue for candidates for Governor to talk about during their campaigns, compared to one in five independents (18 percent) and an even smaller share of Republicans (12 percent). The top issues Republican voters want to hear the gubernatorial candidates talk about are immigration (20 percent) and the economy and jobs (17 percent).

Figure 2: Top Issues For Democratic Voters Include Health Care, Education; For Republicans, Immigration, And The Economy

When voters are asked what explicitly about health care they would like the gubernatorial candidates to discuss, four in ten (41 percent) voters offer health care costs as the most important issue for the candidates to discuss. Health care costs outrank all other health care issues by a margin of at least four to one.

Figure 3: Health Care Costs Are A Top Health Care Issue For Colorado Voters

Most voters (59 percent) – including half of Democratic voters (51 percent) and six in ten Republican voters (58 percent) say they are equally as enthusiastic about voting in this gubernatorial election compared to previous ones, while similar shares of Democratic voters (36 percent) and Republican voters (31 percent) say they are “more enthusiastic” about voting this year. Few (about one in ten) voters say they are “less enthusiastic” about voting this year.

While Democrats only have a slight edge when it comes to voter enthusiasm in the gubernatorial election, they have a strong lead in the congressional elections in Colorado. Nearly half of Democratic voters (49 percent) say they are “more enthusiastic” about voting in the Congressional election this year than in previous elections compared to three in ten Republican voters (29 percent) and one-fourth of independent voters (31 percent).

Figure 4: Half Of Democratic Voters Say They Are More Enthusiastic About Voting In This Year’s Congressional Election

President Trump’s Role in the 2018 Midterm Election

Colorado residents, like the country overall, have polarized opinions of the president with six in ten Coloradans (57 percent) disapproving of the job President Trump is doing while four in ten approve (38 percent).

Like most midterm elections, the 2018 election is turning out to be a referendum on President Trump and his agenda. When issues are put up against other voting factors, a larger share of voters say a congressional candidate’s stance on the president will make the biggest difference in how they vote. Three in ten (29 percent) voters say a “candidate’s support for or opposition to President Trump” will make the biggest difference in how they vote for Congress this year, while fewer say “local or state issues” (24 percent), “a candidate’s character and experience” (23 percent), or “specific national issues” (19 percent) will make the biggest difference. Four in ten Democratic voters (38 percent) and nearly one-third of Republican voters (32 percent) say a candidate’s support for or opposition to President Trump will make the biggest difference in their congressional vote choice. Smaller shares – about one five – say either “specific national issues” or “local or state issues” will make the biggest difference. Independent voters are less likely than partisan voters to say “a candidate’s support for or opposition to President Trump” will make the biggest difference (21 percent).

Figure 5: Larger Shares Of Partisan Voters Say Candidate’s Stance On President Trump Will Make The Biggest Difference In 2018

Across all partisans, voters say a candidate’s stance on President Trump will make a bigger difference in how they vote for Congress this year than any specific national, state, or local issue including health care.

Figure 6: Candidate’s Stance On President Trump Outweighs Various Issues In Voters’ Decisions

Gearing up for the 2018 midterm elections, more than half of Coloradans say they trust the information they get from local news organizations (69 percent), national news organizations (62 percent), or family and friends (60 percent) at least “some” or “a lot.” Fewer Coloradans trust the information they get from social media sites such as Facebook or Twitter (18 percent).

Figure 7: Coloradans More Likely To Trust Information From Local News And National News Organizations

Key Findings: Section Two: Coloradans’ Outlook And Priorities For State Government

Moving past the midterm elections, Coloradans have a positive outlook for the future of both the state and their own local communities. Six in ten Coloradans (58 percent) say things in Colorado are “generally going in the right direction today” while one-third (34 percent) say things have “pretty seriously gotten off on the wrong track.” Seven in ten (69 percent) say things in their local community are going in the right direction compared to one-quarter who say things are off on the wrong track. These results run somewhat counter to how Coloradans feel about the country generally, where a slight majority (55 percent) say things are off on the wrong track, while four in ten (39 percent) say things are going in the right direction.

Figure 8: Majorities Say Colorado And Local Community Are Headed In Right Direction, Fewer Say Same About Country

Coloradan’s outlook for their local community, state, and the country are largely driven by partisanship, with most Democrats holding a positive outlook for the state (67 percent) compared to about half of independents (52 percent) and Republicans (48 percent). Republicans, on the other hand, are more positive in their outlook for the country, with seven in ten (69 percent) saying things in the country, generally, are going in the right direction compared to one-third of independents (34 percent) and an even smaller share of Democrats (14 percent). Regardless of partisanship, about seven in ten Coloradans say things in their local community are headed in the right direction.

Figure 9: Democrats Have Positive Outlook For Colorado; Republicans Hold Positive Outlook About The Country

Coloradans View Economy Improving, Concerns Remain About Housing, Health Care Costs, and Substance Abuse

Recent reports have consistently ranked Colorado’s economy as one of the best in the country with an overall unemployment rate well below the national average.1  In fact, six in ten Colorado residents say the economy and jobs is one area where things in Colorado are getting “better” (including about three in ten who say it is getting “much better”) compared to 17 percent who say it is getting “worse.” On the other side, a majority of Coloradans say housing costs (80 percent), substance abuse (53 percent), and health care costs (55 percent) are issues that are getting “worse” in Colorado. In many areas including access to health care, education, hunger, mental health care, and crime, significant shares of Coloradans say things are staying about the same.

Figure 10: Majority Of Coloradans Say Economy And Jobs Are Getting Better, Housing And Health Care Costs, Substance Abuse, Are Getting Worse In Their State

Priorities for the State Government

When asked to say in their own words what is the most important issue facing people in the state, Coloradans offer responses touching on a wide range of issues including housing affordability (15 percent), economy and jobs (13 percent), health care (12 percent), environmental concerns (11 percent), and immigration and population growth (10 percent).

Figure 11: When Asked In Their Own Words, Coloradans Offer Various Issues Facing Colorado Today

Republicans are more likely to offer immigration and population growth (16 percent) as the most important issue facing the state, while Democrats and independents are more likely to offer housing-related issues (16 percent and 17 percent, respectively). Similar to previous KFF national polling, Democrats in Colorado are more likely to offer health care (16 percent) as the most important issue compared to both independents (11 percent) and Republicans (10 percent).

Priorities For State Government

When asked about various things the state legislature might do within health care and other areas, all are seen as important by a majority of Coloradans, with health care affordability rising to the top of the list. Eight in ten Coloradans say lowering the amount individuals pay for health care is the “most important” or a “very important” issue for the state government to work. About seven in ten also say that it is at least “very important” for the Colorado state government to work on programs to make housing more affordable and on funding for mental health programs. Fewer, but still a majority, say the same about funding for programs to help people who are experiencing hunger (62 percent), substance abuse treatment and prevention programs (58 percent), programs to help children be physically active (52 percent), and passing a universal health insurance plan, in which all Colorado residents would get their coverage from a single state government plan (51 percent).

Figure 12: Lowering Health Care And Housing Costs Top Coloradans’ List Of Issues For State Government To Work On

While there are differences in how partisans in Colorado view health care priorities for the state legislature, lowering the amount individuals pay for health care is the top health care issue among Democrats (33 percent), independents (26 percent), and Republicans (17 percent). Democrats also prioritize passing a universal health insurance plan (31 percent), while one in five independents (18 percent) say funding for mental health programs is “the most important health issue” for the Colorado state government to work on. Across most health issues provided, fewer Republicans say they are the “most important” for the state to work on.

Figure 13: Lowering Amount People Pay For Health Care Is Top Health Care Issue Across Partisanship

Lowering the amount individuals pay for health care ranks among the top issues for the state government to work on across demographic groups such as region2 , race/ethnicity, gender, or self-reported income level. Notably however, half of Black residents (52 percent) say programs to make housing more affordable is the most important issue as do one-third of those earning less than $40,000 annually.

Table 1: Top Health Care Issues for State Legislature by Key Demographics
Percent who say the following is the most important issue for the Colorado state government to work on:RegionRace/EthnicitySelf-reported income
Denver/BoulderSuburbsFront RangeRuralWhite, Non-HispanicBlack, Non-HispanicHisp.<$40k$40k–$89.9k$90k+
Lowering the amount individuals pay for health care30%25%23%28%25%32%29%28%27%23%
Programs to make housing more affordable25241925205227332511
Funding for mental health programs20191518162722211814
Funding for programs to help people who are experiencing hunger1414121311192121147
Funding for substance abuse treatment/prevention programs1310109822181497
Funding for programs to help children be physically active121010108221914117
Passing a universal health insurance plan 21 21 17181743 21 24 20 14

Key Findings: Section Three: Quality Of Life In Colorado And Affordability Of Housing

Most Coloradans (61 percent) rate their quality of life as either “excellent” or “very good.” Yet, there are some differences by income and health status with less than half of those earning less than $40,000 annually (42 percent) or in fair or poor health (43 percent) reporting the same.

Figure 14: Majority Of Coloradans Rate Their Quality Of Life Positively; There Are Some Differences Among Groups

Similar to perceptions of the state’s economic situation, slightly more than half of Coloradans (55 percent) say they are “better off” financially than they were a year ago, while one-fourth (26 percent) say they are “worse off” and one in five (18 percent) say their financial situation is about the same.

Figure 15: Most Coloradans Say They Are Better Off Financially Than A Year Ago

There are some differences among key demographic groups, with about half (47 percent) of individuals who report earning a household income of less than $40,000 annually saying they are “better off” compared to 56 percent of those earning between $40,000 and $89,999 and seven in ten (69 percent) of those earning $90,000 or more annually. In addition, four in ten Black residents report being “better off” compared to larger shares of both white Coloradans (55 percent) and Hispanic residents (59 percent). There are no significant differences by regions of the state.

Table 2: Personal Economic Situation by Key Demographics
Would you say that you are better off or worse off financially than you were a year ago?RegionRace/EthnicitySelf-reported income
Denver/BoulderSuburbsFront RangeRuralWhite, Non-HispanicBlack, Non-HispanicHispanic<$40k$40k–$89.9k$90k+
Better off55%55%57%53%55%40%59%47%56%59%
About the same (Vol.)17181818192216161915
Worse off27262528263924372416
NOTE: Don’t know/Refused responses not shown.

Half of Coloradans report that over the past few years, it has become harder for people like them to afford their rent or mortgage (52 percent), have a secure retirement (50 percent), or afford health care (50 percent). Fewer (about four in ten) say the same about getting a good education or affording food. Three in ten Coloradans (28 percent) say it has become harder to find good jobs.

Figure 16: Half Of Coloradans Say It Has Become Harder To Afford Rent/Mortgage, Health Care, Or Have A Secure Retirement

Increased Concerns over Housing Affordability

Three in ten Coloradans say they are worried that they might lose their home because they cannot afford their monthly housing costs (rent or mortgage), including one in eight (12 percent) who say they are “very worried” and 16 percent who say they are “somewhat worried.” Seven in ten Coloradans are either “not too worried” (23 percent) or “not at all worried” (47 percent) about losing their home over the next year.

Figure 17: About Three In Ten Coloradans Are Housing Insecure And Are Worried About Losing Their Home Due To The Cost

Regional Differences In Housing COncerns

Personal concerns about housing affordability appear to be somewhat more prominent in the Denver and Boulder areas compared to other regions of the state. A larger share of residents living in the Denver and Boulder areas say it has become harder for them to afford their rent or mortgage (65 percent) than in other regions. In addition, about one-third (35 percent) of Denver and Boulder residents say they are either “very worried” or “somewhat worried” that they might lose their home because they cannot afford the monthly rent or mortgage.

Figure 18: Denver And Boulder Residents More Likely To Report Increased Problems Affording Housing

Individuals who are housing insecure, meaning they are worried about losing their home in the next year because they cannot afford their rent or mortgage, are more likely to say programs to make housing more affordable is a top health issue for the Colorado state legislature to work on. Nine in ten (88 percent) Coloradans who are housing insecure say these programs are either the “most important” or “very important but not the most important” issue for the state to work on compared to six in ten (62 percent) Coloradans who are housing secure.

Figure 19: Seven In Ten Coloradans Say It Is Important For The State Government To Work On Making Housing More Affordable

Key Findings: Section Four: Health Care Concerns Include Affordability, Mental Health And Substance Abuse

Half of Coloradans say it has gotten harder for people like them to afford health care, and this is consistent across key demographic groups with similar shares of Coloradans, regardless of race/ethnicity, income, or region saying it has gotten harder to afford health care in recent years. Yet, larger shares of individuals who report being in either fair or poor health generally (60 percent) or describe their mental health status as either fair or poor (67 percent), say it has become “harder” to afford health care during the past year.

Figure 20: Majorities Of Coloradans With Fair or Poor Health Say It Has Become Harder To Afford Health Care

Moreover, while most Coloradans (65 percent) say their current family’s health care needs are being met, there are some concerns about whether the system is meeting most Coloradans’ health care needs. Nearly equal shares agree (46 percent) and disagree (45 percent) that the current health care system is meeting the needs of most Coloradans. This is consistent with findings from the 2017 Colorado Health Access Survey.

Figure 21: Coloradans Say Current Health Care System Is Meeting Their Needs, Concerned About Meeting Others’ Needs

There are some differences in perceptions of the Colorado health care system by region and income. Individuals living in the Front Range region or Rural region are less likely to agree that the current Colorado health care system is meeting their own family’s needs (60 percent and 58 percent, respectively) compared to those living in the Denver and Boulder area (71 percent) or the Suburbs (71 percent). Three-fourths (72 percent) of individuals earning more than $90,000 annually agree the current Colorado health care system is meeting their family’s needs compared to nearly six in ten of those earning less than that.

Table 3: Perceptions of Colorado Health Care System by Key Demographics
Percent who agree that the current Colorado health care system is meeting the needs of…RegionRace/EthnicitySelf-reported income
Denver/BoulderSuburbsFront RangeRuralWhite, Non-HispanicBlack, Non-HispanicHispanic<$40k$40k–$89.9k$90k+
…them and their family members71%71%60%58%64%74%69%63%62%72%
…most Coloradans46494443445052474545

Consistent with previous health policy research, this survey finds a strong connection between income and self-reported health status. A smaller share of those who earn a household income of less than $40,000 annually report either “excellent” or “very good” health and mental health. Less than half of those earning less than $40,000 report that their general health (38 percent) or their mental health (47 percent) is “excellent” or “very good,” compared to majorities of those earning $40,000 or more annually. Yet, a significant share of these lower-income residents also report that their general health and mental health is “good,” and less than one-third report their health status as either “only fair” or “poor.” Self-perceived general health also differs by race/ethnicity, with four in ten Black and Hispanic residents (40 percent each) saying their health is “excellent” or “very” good compared with almost six in ten white residents (57 percent).

Table 4: Perceptions of Own Health Status by Key Demographics
Percent who say the following is “excellent” or “very good”:RegionRace/EthnicitySelf-reported income
Denver/BoulderSuburbsFront RangeRuralWhite, Non-HispanicBlack, Non-HispanicHispanic<$40k$40k–$89.9k$90k+
Their health57%53%51%50%57%40%40%38%56%68%
Their mental health61626764666359476780

Mental Health and Substance Abuse

A majority of Coloradans (61 percent) say that most people in the state who need mental health services are not able to get them while three in ten say they are able to get them. Of those who say people in the state are not able to get the mental health services they need, most (59 percent of total) say this is either a “major problem” (49 percent of total) or a “minor problem” (10 percent of total), while few (2 percent of total) say this is “not a problem.”

Figure 22: Most Coloradans Say People In The State Are Not Able To Get Needed Mental Health Services

Fewer – but still four in ten (44 percent) – say most people in Colorado who need substance abuse services are not able to get the services they need. Of these, most (about one-third of total) say this a major problem while one in ten overall (9 percent) say this is a minor problem. Four in ten (43 percent) say they think most people who need these services are able to receive them.

Figure 23: Four In Ten Coloradans Say People In The State Are Not Able To Get Needed Substance Abuse Services

One in five Coloradans say there was a time when they or another family member thought they might need mental health or substance abuse services but did not get them. Individuals say they did not get mental health or substance abuse services because they could not afford the cost (13 percent), insurance would not cover it (11 percent), they were afraid or embarrassed to seek care (9 percent), or they did not know where to get care (8 percent).

Figure 24: One In Five Say They Or Family Member Did Not Get Mental Health Or Substance Abuse Services They Needed

Appendices

Appendix A: Survey Methodology

Survey Methodology

The Kaiser Family Foundation and Colorado Health Foundation Coloradans’ Perspectives on Health, Quality of Life and Midterm Elections was conducted by telephone August 15 – September 19, 2018 among a random representative sample of 1,803 adults age 18 and older living in the state of Colorado (note: persons without a telephone could not be included in the random selection process). Interviews were administered in English and Spanish, combining random samples of both landline (584) and cellular telephones (1,219, including 825 who had no landline telephone). Sampling, data collection, weighting and tabulation were managed by SSRS in close collaboration with Kaiser Family Foundation researchers. Colorado Health Foundation paid for the costs of the survey fieldwork, and Kaiser Family Foundation contributed the time of its research staff. KFF researchers led the survey design and analysis with frequent consultation with the CHF team.

The sampling and screening procedures included Registration-Based Sampling (RBS) and re-contact components, both designed to increase the number of registered voters and to specifically increase the number of Hispanic and Black registered voters. The sample included 464 respondents from the Registration-Based Sampling component, using an updated Colorado voter-registration database obtained through Aristotle. It also included 77 respondents who were reached by calling back respondents in Colorado who had previously completed an interview on either the SSRS Omnibus poll or the Kaiser Health Tracking Polls and indicated they fit one of the oversample criteria (either Black respondents or Hispanic registered voters living in Colorado).

The dual frame cellular and landline phone sample was generated by Marketing Systems Group (MSG) using random digit dial (RDD) procedures. All respondents were screened to verify that they resided in Colorado. For the landline sample, respondents were selected by asking for the youngest adult male or female currently at home based on a random rotation. If no one of that gender was available, interviewers asked to speak with the youngest adult of the opposite gender. For the cell phone sample, interviews were conducted with the qualifying adult who answered the phone.

A multi-stage weighting design was applied to ensure an accurate representation of the Colorado adult population. The first stage of weighting involved corrections for sample design, including accounting for the oversampling of registered voters and non-response within the RBS frame, a correction for the oversampling of telephone exchanges known to have higher incidences of Blacks and Hispanics, the likelihood of non-response for the re-contacted sample, and an adjustment to account for the fact that respondents with both a landline and cell phone have a higher probability of selection. In the second weighting stage, demographic adjustments were applied to the RDD sample to account for systematic non-response along known population parameters. Population parameters included gender, age, race, Hispanicity (broken down by nativity), educational attainment, phone status (cell phone only or reachable by landline), and state region. Based on this second stage of weighting, estimates were derived for registration status by race (Black, Hispanic, else) in the Colorado population. The last stage of weighting included RBS and re-contact respondents and included registration status by race based on the previous stage’s outcomes. Weighting parameters were based on estimates from the U.S. Census Bureau’s March 2016 American Community Survey (ACS), and telephone use (cell phone-only, landline-only, dual-user) was based on data for Colorado from the 2016 National Health Interview Survey. A final post-hoc adjustment was included in the weighting procedure to maintain consistency with existing health coverage estimates, based on Kaiser Family Foundation 2016 estimates for adults under 65.

The margin of sampling error including the design effect for the full sample is plus or minus 3 percentage points. For results based on subgroups, the margin of sampling error may be higher. Sample sizes and margins of sampling error for subgroups are available by request. Note that sampling error is only one of many potential sources of error in this or any other public opinion poll. Kaiser Family Foundation public opinion and survey research is a charter member of the Transparency Initiative of the American Association for Public Opinion Research.

GroupN (unweighted)M.O.S.E.
Total1803+/- 3 percentage points
Democrats571+/- 5 percentage points
Independents630+/- 5 percentage points
Republicans434+/- 6 percentage points
Total voters1585+/- 3 percentage points
Democratic voters528+/- 5 percentage points
Independent voters534+/- 5 percentage points
Republican voters404+/- 6 percentage points

Appendix B: Regions of the State

In order to compare responses from different regions of the state, counties were categorized into four different regions: Denver/Boulder, Suburbs, Front Range, Rural. Some counties included in the Front Range category are categorized by the U.S. Census Bureau as “rural,” but for the purpose of this analysis in order to provide a more nuanced breakdown of the geographic area of the state, they were included in the Front Range category. 

Figure 25: Appendix B: State Regions
GroupN (unweighted)M.O.S.E.
Region
Denver/Boulder346+/- 7 percentage points
Suburbs532+/- 5 percentage points
Front Range625+/- 5 percentage points
Rural300+/- 7 percentage points

Endnotes

  1. According to the U.S. Department of Labor’s Bureau of Labor Statistics (https://www.bls.gov/eag/eag.co.htm), the unemployment rate in Colorado is 2.9 percent, well below the national average of 3.9 percent. ↩︎
  2. To see a geographic breakdown of which counties are included in the three regions included in this analysis, see Appendix B. ↩︎

Medicare-for-All and Public Plan Buy-In Proposals: Overview and Key Issues

Authors: Tricia Neuman, Karen Pollitz, and Jennifer Tolbert
Published: Oct 9, 2018

Introduction

As policymakers debate next steps for expanding health insurance coverage and lowering health costs, some have introduced legislation that would broaden the role of public programs, such as Medicare and Medicaid. During the 115th Congress, eight such proposals were introduced, ranging from bills that would create a new national health insurance program for all U.S. residents, replacing virtually all other sources of public and private insurance (Medicare-for-All), to more incremental approaches that would create a new public plan option, as a supplement to private sources of coverage and public programs.

What does “Medicare for All” mean? Our brief summarizes key issues and legislative proposals as this policy debate has received renewed attention on Capitol Hill and on the campaign trail this year.

These eight legislative proposals differ in ways that have important implications for consumers, health care providers and payers, including employers, states, the federal government, and taxpayers. Key policy differences relate to eligibility, the size and scope of the public plan, covered benefits and cost sharing, premiums, subsidies for premium and cost sharing, cost containment strategies, and the likely interactions with current public programs and private sources of coverage. They also vary in their level of detail; some bills, according to their sponsors, are intended to serve as blueprints for reform, and are expected to include greater specificity over time. Given the timing of the legislative calendar, these bills are unlikely to advance in the current Congressional session; however, they illustrate the range of options that will likely serve as prototypes for legislation that may be introduced in the next session of Congress.

Greatly simplified, these public plan proposals fall into four general categories:

  • Two proposals would create Medicare-For-All, a single national health insurance program for all U.S. residents (Senator Sanders, S.1804; Rep. Ellison, H.R. 676);1 
  • Three proposals would create a new public plan option, based on Medicare, that would be offered to individuals and some or all employers through the ACA marketplace (The Choice Act by Rep. Schakowsky, H.R. 635, and Sen. Whitehouse, S. 194); The Medicare-X Choice Act by Sen. Bennett, S. 1970, and Rep. Higgins, H.R.4094; and the Choose Medicare Act by Sen. Merkley, S. 2708 and Rep. Richmond, H.R. 6117)
  • Two proposals would create a Medicare buy-in option for older individuals not yet eligible for the current Medicare program (Sen. Stabenow, S. 1742; Rep. Higgins, H.R. 3748); and
  • One proposal would create a Medicaid buy-in option that states can elect to offer to individuals through the ACA marketplace. (Sen Schatz, S. 2001 and Rep. Luján, H.R. 4129).

This policy brief summarizes key features of these proposals, highlights similarities and differences, and discusses key questions, trade-offs and potential implications. Several of these proposals have both a House and Senate sponsor; throughout the document, we refer to the sponsor who first introduced the legislation.

Issue Brief

Overview of Current Proposals

Medicare-for-All

Medicare-for-All, an approach championed most recently by Senator Sanders in the Senate and Representative Ellison in the House, represents the most sweeping proposed change to the U.S. health insurance system among these proposals. Once fully implemented, a single, federal, government-administered program would provide coverage to all U.S. residents. Medicare-for-All would replace virtually all other sources of private health coverage (employment-sponsored plans and insurance offered inside and outside ACA marketplaces) and most public programs, including Medicare, Medicaid and CHIP. Medicare-for-All would result in a major shift in the way in which health care is financed in the U.S. — away from households, employers and states to the federal government and taxpayers.

The new Medicare-For-All program would cover all medically necessary services, with defined categories of benefits to be covered, as well as dental and vision services — a broader definition of benefits than is currently covered by Medicare or by the ACA essential health benefits. Under the Ellison bill, the new public plan would also cover long-term services and supports (LTSS), whereas under the Sanders bill, Medicaid would continue to provide LTSS. The Sanders bill would have the public plan cover all reproductive health services, including abortion, and would repeal the Hyde Amendment. Under both bills, there would be no premium or cost-sharing requirements, other than limited cost sharing (up to $200 per year) on prescription drugs to encourage the use of generics under the Sanders bill. The Sanders bill would establish a beneficiary ombudsman program to help consumers with complaints, grievances, and requests for information, and to track and identify for the Secretary of Health and Human Services issues and problems in payment or coverage policies.

Both Medicare-for-All proposals would establish a global budget for health expenditures. In addition, they would create a national fee schedule to make payments to hospitals and other facilities, doctors and other health professionals, and prohibit balance billing. The Sanders bill would establish a fee schedule consistent with Medicare payment rates, and a new process for updating such rates. The Ellison bill would take a somewhat different approach, establishing Medicare payment rates through negotiations between providers and State and regional directors, subject to the approval of the Medicare director. The Sanders bill would leave an option for providers and patients to enter into private contacts instead of using Medicare, while the Ellison bill has no similar provision. The Ellison bill would prohibit participation in Medicare by for-profit hospitals and facilities and by investor-owned provider practices. Both bills would require the Secretary to negotiate drug prices with manufacturers

The on-budget cost of the new Medicare-for-All program would be partially offset by the elimination of current federal spending obligations for public programs (e.g., Medicare, Medicaid, CHIP), tax expenditures for employer-sponsored coverage and subsidies for ACA marketplace coverage. Both bills envision administrative savings associated with having one payer, and with having a single, Medicare-for-All fee schedule with lower rates than would otherwise be paid by employers and private insurers. The Ellison bill generally describes new revenue sources to cover additional costs; the Sanders bill, as drafted, does not specify further financing, although other financing options are described in a separate white paper.

The Sanders bill envisions a four-year phase-in period for implementation. During this time, a transitional public plan option, similar to Medicare, would be offered through the marketplace with enhanced income-related subsidies available. Also during the phase-in period, the current Medicare program would be enhanced with a new out-of-pocket limit on annual cost sharing for Medicare-covered services, coverage of dental and vision benefits, and by expediting Medicare coverage for people with disabilities on SSDI by eliminating the 24-month waiting period.

Federal Public Plan Option

Three proposals would establish a federal public plan option to build upon, rather than replace, the current blend of private insurance and public coverage. In general, the bills aim to address some of the shortcomings in ACA marketplaces by giving individuals and employers a new option that may provide more affordable coverage. Two of these proposals invoke Medicare in naming the public plan (Medicare Part E and Medicare-X); the Schakowsky bill incorporates many of Medicare’s features in the public plan, without using its name.

Under all three bills, the public plan option would be offered alongside private insurance through the ACA marketplace to individuals and small employers eligible to purchase coverage there. Two of the bills would also offer the public plan in the individual and small group markets outside of the marketplace. The Merkley bill would further extend eligibility to large employers who could obtain coverage under the public plan on behalf of their employees, while remaining in compliance with ACA requirements. The Merkley bill would allow large employers to buy fully insured large group policies from Medicare Part E, transferring risk to the public program. It would also allow self-insured group plans to retain risk and contract with Medicare Part E for third-party administrative services, such as paying claims and establishing a provider network and fee schedule. The Bennet bill would phase in the public program, beginning in areas with limited competition.

All three bills would make the public plan eligible for marketplace premium and cost-sharing subsidies for eligible individuals. The Merkley bill would expand income eligibility for both premium and cost-sharing subsidies throughout the marketplace and enhance these subsidies for all participants by tying them to Gold-level plans. None of the bills would affect ACA subsidies for small employers.

Under each of the three proposals, the new public plan would cover (at a minimum) all ACA essential health benefits. The Merkley Medicare Part E plan would also cover all Medicare benefits (Parts A, B, and D), all reproductive services, and abortion. The Schakowsky and Bennet bills would offer the public plan at all ACA metal levels and would apply the ACA annual out-of-pocket limit on cost sharing. Under the Merkley bill, the public plan would be offered at the Gold metal tier, and all marketplace subsidies would be tied to the Gold tier (vs. the Silver tier under current law), which would result in reduced cost sharing for most marketplace participants. The Merkley bill would also enhance financial protections under the current Medicare program by adding an out-of-pocket limit on cost sharing, which could affect program spending and premiums.

All three bills would set the public plan premium to cover all costs for covered benefits and require the public plan to follow ACA rating rules. The Merkley bill would also extend ACA rating rules to the large group market, a departure from current law.

Two of the proposals contain new consumer assistance provisions. The Schakowsky bill would establish an office of the ombudsman for the public plan to educate consumers about this coverage option and help them resolve complaints and grievances. The Merkley bill would authorize direct federal spending for marketplace navigator programs (vs current law funding by marketplaces) at funding levels needed to address capacity limitations. The Merkley bill also would require employers that do not offer health benefits to refer their employees to navigators.

All three proposals would require hospitals, physicians and other health care providers participating in Medicare to participate in the new public plan; this would result in a broad network of providers because the vast majority of all hospitals and physicians participate in the current Medicare program. The Schakowsky and Bennet bills would also require Medicaid providers to participate in the public plan which would include pediatricians and others who may be less likely to treat the current Medicare population. Providers would have the ability to opt out of participating in the public plan without penalty under the Schakowsky bill. The three proposals would also require the Secretary to allow other providers to participate in the public plan – an important consideration in providing health coverage for children, and for meeting the needs of individuals with special needs.

All three bills would extend Medicare payment rates, or some variation on those rates, to providers participating in the public plan to help lower the overall cost of the program, which in turn would reduce premiums and out-of-pocket cost sharing for patients. The Schakowsky proposal would have the Secretary negotiate rates with providers, using Medicare payment rates as a back-up, if negotiations are not successful. The Bennet proposals would use Medicare rates for the new Medicare-X plan, and authorize the Secretary to increase rates by up to 25% in rural areas. The Merkley proposal directs the Secretary to negotiate payment rates for Medicare Part E, between Medicare and private insurance plan rates.

None of the public plan option bills specifically prohibits balance billing by physicians and other providers who treat patients enrolled in the public plan; however to the extent that they adopt Medicare payment rates and rules, these bills would appear to apply Medicare limits on balanced billing to the public plan. Under current rules, participating providers agree to accept assignment for all of their Medicare patients, and are prohibited from balance billing; non-participating providers do not agree to accept assignment for all patients or all services, and may choose to charge patients higher fees, up to a certain limit.

All three bills acknowledge ongoing public concern about prescription drug costs by authorizing the Secretary to negotiate drug prices for the new public plan; two of the three proposals (Bennet and Merkley) would extend this policy to the current Medicare program. Under current law, the Secretary is prohibited from negotiating payments with drug manufacturers on behalf of Medicare Part D enrollees. The Merkley proposals is the only one of the three bills to include a failsafe to leverage lower drug prices under Medicare Part E and the current Medicare program. If negotiations are not successful in obtaining an appropriate price as determined by the Secretary, prices would be paid based on the lesser of those paid by the Veterans Administration or the federal supply schedule. In other respects, the three bills do not change the current Medicare program, other than the limit on out-of-pocket spending added to the current Medicare program under the Merkley proposal.

Medicare Buy-in for Older Adults

Two proposals focus specifically on creating a new Medicare buy-in option for older adults – ages 55-64 in the Stabenow bill and 50-64 in the Higgins bill. These proposals would give eligible individuals the option to buy into Medicare. (This differs from an alternative approach that would simply lower the age of Medicare eligibility from age 65 to age 50 or 55.) The Higgins bill would also allow adults ages 50-64 who are eligible for job-based coverage to elect the Medicare buy-in option, and allow employers to pay Medicare premiums on their behalf – a feature that could expand the number of older working individuals who select the buy-in option.

Under the Stabenow bill, enrollment in the buy-in plan would be managed by Medicare, while under the Higgins bill enrollment in the buy-in plan would be conducted through the marketplace. Both bills would allow marketplace subsidies to apply to the buy-in plan for individuals otherwise eligible for subsidies, so the marketplace would continue to be the place where people apply for financial assistance.

Under both bills, the Medicare buy-in plan would offer Medicare benefits rather than ACA benefits. Under both bills, Medicare cost-sharing standards would apply, with no annual out-of-pocket limit on cost sharing for individuals who enroll in Medicare (unless they enroll in private Medicare Advantage plans (assuming current rules apply) or qualify for cost-sharing subsidies through the marketplace. Both proposals would give buy-in enrollees the option to buy Medicare Advantage plans instead of fee-for-service coverage, and both would require private Medigap policies to be offered on a guaranteed-issue basis to buy-in enrollees. In other words, older adults not yet eligible for the current Medicare program would potentially have access to private marketplace plans, private Medicare Advantage plans, and traditional Medicare (Parts A, B and D) with an option to purchase Medigap – each with different guaranteed benefits, rating rules, premium and cost-sharing subsidies and provider networks.

Under both bills, rating rules for the buy-in plan would be somewhat different from those for marketplace plans. The bills would set the buy-in premium to cover the full cost of benefits provided under Medicare Parts A, B and D for enrollees, plus administrative expenses. The Stabenow bill would establish a single, national premium while the Higgins bill would apply a geographic adjustment. Neither proposal would adjust buy-in premiums for age, in contrast to current marketplace rules.

Buy-in enrollees would be eligible for ACA-based premium and cost-sharing subsidies. The Higgins bill would also enhance cost-sharing subsidies available through all Silver plans in the marketplace and would extend these subsidies to individuals with income up to 400% of the federal poverty level (FPL). When buy-in enrollees become eligible for the current Medicare program, at age 65, premium and cost-sharing subsidies, and other coverage features, would revert to those applicable to Medicare beneficiaries under current law.

Marketplace premium subsidy amounts would be calculated somewhat differently for buy-in enrollees. Presumably because rating rules would be different than for other private plans, the Medicare buy-in option would not “compete” with other marketplace plans to be the second-lowest-cost Silver plan; rather the Secretary would determine how subsidies would be calculated for buy-in enrollees.

Both proposals would require all Medicare participating providers and facilities to participate in the buy-in plan for older adults; and, to help constrain costs, reimburse hospitals, physicians and other participating providers using Medicare payment rates, which typically are lower and less variable than the rates paid by commercial insurers. Using Medicare payment rates would tend to make the buy-in plan more cost competitive relative to private plan options. Though the bills do not address balance billing specifically, by adopting Medicare provider payment rules, it appears that Medicare limits on balance billing would also apply to enrollees in the buy-in plan.

The Higgins proposal would also authorize the Secretary to negotiate lower drug prices for the buy-in population and for the current Medicare program – the only change in the bill that would directly affect the current Medicare program.2 

The Higgins bill would make other changes aimed at stabilizing the private individual insurance market. It would establish a federal reinsurance program to help cover high-cost medical claims, and reauthorize the temporary ACA risk corridor program through the year 2020. It also would appropriate $500 million per year, in 2018 through 2020, for consumer assistance programs to raise awareness about new subsidy and coverage options and help people enroll.

Both bills specify that the buy-in program would be financially separate from the current Medicare program, and that benefits under the current program, and the Medicare trust funds would not be affected. The Higgins proposal establishes a separate trust fund for the purpose of collecting premiums and making payments for services provided to individuals enrolled in the Medicare buy-in plan. The Higgins proposal establishes a separate trust fund for the purpose of collecting premiums and making payments for services provided to individuals enrolled in the Medicare buy-in plan.

State Public Plan Option

The public plan option envisioned under the Schatz bill would build on the Medicaid program rather than Medicare. Under this approach, states would have the option of creating a Medicaid buy-in program that would be offered through the marketplace alongside other private plans.

For states that elect this option, the bill would allow individuals at all income levels to buy into Medicaid, as long as they are not enrolled in other coverage. The Medicaid buy-in option would be offered as a Silver-level plan through the marketplace. Medicaid buy-in enrollees would receive an alternative benefit package (ABP), which includes the ACA essential health benefits, and could be defined by states to include the full Medicaid benefit package.

States may set premiums for the public plan that are “actuarially fair.” States may vary premiums by the same factors as ACA marketplace plans (age, geography, family size and tobacco use). Deductibles and other cost sharing amounts would also be determined by the electing state to be actuarially fair, with an annual out-of-pocket limit on cost sharing (set at $7,350 in 2018).

The bill does not require that premiums and cost-sharing payments cover the full costs of the buy-in program. Instead, states would receive federal matching payments for any costs for the Medicaid buy-in program that are not covered by premiums and cost-sharing payments. With this flexibility, states could promote enrollment in the public plan by setting premiums lower than commercial plans, and count on the federal government to make up some of the cost; though as under the current Medicaid program, they would be required to finance the state share of these costs. The bill also provides an enhanced 90% federal matching rate for administrative costs associated with the buy-in program.

This proposal would extend current law ACA premium and cost-sharing subsidies to people purchasing Medicaid buy-in coverage. In addition, it would cap premiums for the public plan at 9.5% of family income, which would make the Medicaid buy-in option more affordable than other marketplace plans for people with incomes above 400% FPL, the eligibility threshold for premium tax credits.

The Medicaid buy-in would rely on Medicaid participating providers, including Medicaid managed care organizations (MCOs) to deliver services. In an effort to improve access to care in the Medicaid program, including the buy-in option, the bill would require Medicaid to use Medicare payment rates as a floor for paying primary care providers and would appropriate $100 billion in grants to states to enhance Medicaid provider payment rates. The grants would be available to all states, not just those establishing a buy-in program.

Additionally, the bill would extend to any state newly adopting the Medicaid expansion the 100% federal funding for three years and the phase-down of federal funding to 90%.

Key Policy Considerations

The eight bills introduced during the 115th Congress are similar in that they would each establish a public program, yet they differ in ways that could have significant implications for consumers, payers, health care professionals, and the federal budget. As of yet, CBO has not formally estimated the effects of these bills on costs or coverage. Below are key questions regarding the policy implications and tradeoffs involved in these various proposals.

1. how would the proposals provide and expand coverage?

These eight proposals span a broad spectrum in terms of eligibility rules that are likely to affect the number of people who would gain coverage and the size of the public program. The two Medicare-for-All proposals would build a single, national public program, replacing all other forms of coverage, to cover all individuals residing in the U.S. The Medicare-for-All bills would adopt a broader definition of eligibility than is used for Medicare, Medicaid or marketplace plans, which limit eligibility based on citizenship and immigration status, potentially benefiting millions of lawfully present and undocumented immigrants.

The three federal public plan proposals would offer a public option to augment the current mix of public and private sources of coverage. Among these three plans, the Merkley proposal would extend eligibility to all U.S. residents, permit large and small employers to offer public plan coverage, and enhance cost-sharing subsidies, all of which could lead to larger public plan enrollment than under the two other public plan proposals. None of the public plan proposals would address the coverage gap that persists in states that have not expanded Medicaid, in which more than two million adults have incomes too high to qualify for Medicaid eligibility yet below the lower limit of 100% FPL for marketplace premium tax credits.

The two Medicare buy-in proposals for older adults who are not yet eligible for the current Medicare program would likely lead to a smaller public plan than the aforementioned proposals due to age restrictions. Of these two proposals, the Higgins bill could reach a larger number of older adults because it defines eligibility somewhat more broadly (ages 50-64, rather than age 55-64), allows employers to pay premiums for their older employees if they opt in, and enhances premiums and cost-sharing subsidies.

The Medicaid buy-in proposal would make the public plan an option for states. This approach would limit its availability to residents of states that elect to establish a Medicaid buy-in.

2. How would the proposals affect the affordability of coverage for consumers?

While the ACA has made significant inroads in reducing the number of people without health insurance, affordability challenges have continued, particularly among people with significant health needs. In 2017, more than one-in-four insured non-elderly adults skipped or delayed care due to costs or had problems paying out-of-pocket medical bills; among the insured in fair to poor health, nearly one-in-three faced such affordability problems. The Medicare-for-All bills take the most comprehensive approach to improving affordability by eliminating premiums and cost-sharing requirements, and adding benefits, such as dental and vision. However, these costs would ultimately be shifted back to some individuals in the form of higher taxes, meaning some people would end up paying more while others would pay less.

Several of the other bills would address affordability issues in the marketplace by enhancing premium and cost-sharing subsidies for currently eligible individuals, by capping premiums for individuals not eligible for premium tax credits, and, in some cases, by making more people eligible for subsidies. Limits on provider payments (Medicare payment rates) would be expected to put downward pressure on premiums and other costs. Two of the bills would enhance financial protections for individuals by prohibiting balance billing by providers. The others are silent on balance billing, although to the extent those proposals use Medicare or Medicaid provider payment rates, they would appear to incorporate into the public plan limits and prohibitions on balance billing that apply under those programs today.

In addition, one of the bills would address the financial burden of health care for people covered under the current Medicare program by adding an annual out-of-pocket limit. Virtually all of the proposals aim to make prescription drugs more affordable for people in both the current Medicare program and the new buy-in proposal by giving the Secretary the authority to negotiate lower drug prices.

3. How would the proposals affect marketplace coverage?

As of early 2018, more than 14 million people obtained non-group coverage through ACA marketplaces or outside in the individual market. The introduction of a new public plan could change marketplace dynamics and premiums. Premiums for the public plan could be higher or lower than private marketplace plans depending on a number of factors, including the level of fees paid to providers, rating rules, the comparability of benefits, and other features. For example, as noted above, the use of Medicare provider payments in the public plan would put downward pressure on costs, which would likely lead to lower premiums for coverage under the public plan compared to marketplace plans.

At the same time, the methodology used to set premiums could potentially mitigate the cost advantage of the public plan. Premiums for a Medicare buy-in for older adults could conceivably be higher than premiums for marketplace plans for people of a similar age because the risk pool is restricted to older, higher-cost adults. Further, if the public plan uses a uniform, national premium and private insurers set premiums based on local costs, the public plan could be more competitive in high cost areas, and less competitive in low cost areas. To the extent that the rules for setting premiums are not aligned for private plans and the public program, individuals may be more attracted to one over the other, potentially destabilizing the marketplaces.

Several of the public plan option proposals include provisions to stabilize or strengthen marketplaces generally – for example, by enhancing the value of cost-sharing subsidies, establishing new risk-stabilization programs, and/or by enhancing consumer enrollment assistance and outreach.

4. How would the proposals affect private employer-sponsored health coverage?

Currently, a majority of the non-elderly U.S. population – more than 150 million people – have job-based health benefits. The Medicare-for-All bills would replace employment-based (and virtually all other forms of coverage) with the new plan. The other six public plan proposals would retain a role for employer-sponsored coverage, while giving employers access to the public plan to varying degrees. Under one proposal, all employers, including large employer-sponsored plans, could opt to obtain coverage under the public plan on behalf of their employees. Others would allow small (but not large) employers to offer the public plan to their employees by purchasing public plan coverage through the small group market or the SHOP marketplace. One plan would allow employers to pay premiums on behalf of their enrollees who choose to opt into the public plan, a departure from current law.

If employers are able to reduce health costs by offering coverage under the public plan, the public plan could take on a relatively large role as a source of coverage. Employers could realize savings by gaining access to the lower provider payment rates in the public plan. In addition, although none of the bills allow employers to selectively enroll high-cost enrollees in the public plan, employers with higher than average medical costs might realize savings by shifting their employees to the public plan, which in turn could lead to adverse selection and higher costs in the public plan. Most of these bills also would retain current law rules that make people ineligible for subsidies if they are eligible for employer-sponsored coverage that meets minimum standards; this “firewall” would limit the ability of individuals to shift from job-based coverage into the public plan.

5. Would the new public plan options be the same as the current Medicare program?

Six of the eight bills invoke Medicare’s name for the public plan, likely in part because Medicare enjoys broad support among the public. Yet, the proposed public plans differ from the current Medicare program in several ways, including covered benefits, the methodology used to calculate premiums, and the availability of premium and cost-sharing subsidies. The two Medicare buy-in bills for older adults would adopt current Medicare benefits and cost sharing for the public plan; the two Medicare-for-All bills would cover far more expansive benefits; and the other proposals align either with ACA-required essential health benefits or with a combination of ACA and Medicare benefits.

None of the bills would set premiums for the public plan using the same methodology used in the current Medicare program. In general, the proposals set premiums for public plan enrollees to cover 100% of benefit costs, including administrative expenses. In contrast, premiums for the current Medicare program are not set to cover full program costs. Further, the buy-in bills tend to use premium and cost-sharing subsidies, and eligibility levels, established for the ACA marketplace, rather than those that apply to people covered under the current Medicare program (such as those used for the Medicare Savings Programs or the Part D low-income subsidy program.) To the extent public plan enrollees receive more generous subsidies, lower-income individuals would face a financial “cliff” when they age onto the current Medicare program.

The Medicare-for-All and public plan proposals tend to track the current Medicare program when it comes to provider participation and in using Medicare provider payment rates to leverage overall savings in health spending (with some variation, as noted below).

6. How would the proposals affect the current Medicare program?

Six of the eight public plan proposals leave the current Medicare program generally intact, with the notable exception of the Medicare-for-All bills that would replace the current Medicare program with a new and more comprehensive Medicare program. Four of the public plan bills would modify rules pertaining to the Medicare Part D benefit, by allowing the Secretary to negotiate drug prices. One proposal would enhance the current Medicare program by adding an out-of-pocket limit to Medicare Parts A, B and D, which would help align financial protections under the new and existing Medicare programs, but would also lead to higher Medicare spending and higher premiums. The Sanders bill would enhance the current Medicare program during an interim implementation phase, by adding an out-of-pocket limit, covering vision and dental, and by expediting eligibility for people with disabilities.

Several of the public plan buy-in bills include explicit language to protect the Medicare trust funds and Medicare benefits from changes made under the proposal.

7. How would the proposals affect the current Medicaid and CHIP programs?

The two Medicare-for-All proposals would replace or fundamentally restructure Medicaid’s role in providing health coverage to low-income and other vulnerable populations. The Ellison proposal would eliminate Medicaid entirely while the Sanders bill would retain Medicaid for purposes of providing long-term services and supports. The Sanders bill would impose requirements on states to maintain eligibility standards and expenditures on long-term services and supports at 2017 levels. Both proposals would eliminate the CHIP program.

The remaining bills, including the Medicaid buy-in bill, would leave the Medicaid and CHIP programs intact. The Schatz proposal would address Medicaid provider payment rates and access-to-care issues by requiring states to increase payments to primary care providers and by providing funding for states to increase payments to other providers. However, the one-time allocation of federal grant funds to finance the state share of the payment increase would not likely compensate states for the increased costs associated with the payment rate increase over the long term.

The proposals also mostly do not address the failure of 17 states to adopt the ACA’s Medicaid expansion. One proposal would extend the 100% federal financing to states newly adopting the expansion to encourage state action, while the two Medicare-for-All bills would federalize coverage for all low-income adults.

8. How would the proposals address the needs of specific populations?

While the bills intend to improve the affordability, and in some cases, the comprehensiveness, of health coverage, in general they vary in how they would address the specific needs of special populations, such as children, women of reproductive age, and people with disabilities and high health care needs,

Children, in particular, have special needs and special providers that serve them. While most of the bills incorporate the ACA’s 10 essential health benefits, which include pediatric services and dental and visions services for children, none of the bills define a specific benefit package for children. Except for the two Medicare-for-All proposals, the other bills would retain the Medicaid and CHIP programs and their important role in covering low-income children. However, the special EPSDT protections provided to children through the comprehensive coverage requirements in Medicaid are not extended to children who would gain coverage under Medicare-for-all, the federal public plans, or the Medicaid buy-in plan. The three public plan proposals recognize the importance of including providers that serve children in the plan networks, by requiring participation of both Medicare and Medicaid providers and/or including a process for allowing other providers to participate.

For people with disabilities and high health care needs, the adequacy of health plan provider networks matters can be especially important. Most marketplace plans today and a smaller share of job-based plans used closed or narrow provider networks. By contrast, nearly all of the public plan proposals would significantly expand provider networks for their enrollees. Proposals that eliminate or lower out-of-pocket costs, which several of the proposals do, would remove or reduce cost as a barrier to accessing care for those with high health care needs. While most of the proposals would retain Medicaid as the primary payer of long-term services and supports for people with disabilities, one proposal (Ellison) would incorporate these services into the plan’s benefit package. It also proposes a payment methodology that emphasizes the provision of long-term services and supports and mental health services in community-based settings, thus significantly expanding access to these services.

Finally, several bills specify that reproductive services, including abortion, should be a covered benefit and some bills (Sanders; Merkley) include explicit language to repeal the Hyde amendment restrictions on public funding for abortion. The Hyde amendment, first adopted more than 40 years ago, prohibits federal funds from being used for abortion, other than in the case of rape, incest or if the pregnancy is determined to endanger the life of the woman. If the Hyde amendment is not repealed and if its restrictions attach to the public plan, then fewer women of reproductive age could have access to abortion services in the future. Numerous efforts to repeal the Hyde amendment have failed in the past.

9. How would the proposals affect payments to providers?

Most of these proposals would result in broader use of Medicare rates – or some similar approach — to reimburse hospital and medical care. In general, the proposals would adopt a fee schedule for the public plan with the goal of reducing total health spending (and premiums) by reducing high fees paid by commercial insurers relative to Medicare, and, in the case of Medicare-for-All, by eliminating excess administrative costs attributable to having multiple payers, with multiple fee schedules and multiple rules pertaining to coverage. The Medicare-for-All proposals would establish global budgets, under which there would be a fee schedule for providers. The public plan and Medicare buy-in proposals typically adopt Medicare payment rates, or anchor their provider rates to Medicare levels in some fashion, which would tend to be lower than private insurance and higher than Medicaid.

The impact of using Medicare payment rates on provider revenues would vary across the eight proposals, with the greatest effect under the Medicare-for-All proposals. Under the Medicare-for-All plans, the shift toward a payment system that is tied more directly to Medicare rates could significantly lower revenues for hospitals, physicians and other providers. The reduction in payments for private patients would be offset partially by the higher fees paid to providers for Medicaid and previously uninsured patients – a change that would be particularly beneficial to health care professionals who care for those patients. The public plan buy-in proposals would also have an effect on provider revenue, but to a lesser extent, depending on the number of additional patients covered under the new public plan.

The Schatz proposal, which builds on Medicaid rather than Medicare, would increase payments to primary care providers to Medicare rates, and establish a $100 billion fund to increase Medicaid reimbursement rates generally in order to expand provider participation.

10. What cost containment features are in the proposals?

Despite the recent slowdown in health care spending, health care costs are projected to increase at a faster pace than general inflation in the future. All of the bills include provisions that would restrain the growth in health care spending in varying ways. The Medicare-for-All bills would establish global budgets for health care. All of the bills would expand the use of Medicare provider payment rates (or a variation of Medicare rates) by applying them to providers participating in the public plan. Where public plans compete with private plans for enrollees, this could create an incentive for commercial insurers to reduce the relatively high and variable fees they currently pay and reduce overall costs. Most proposals would authorize the Secretary to negotiate drug prices for the public plan and for the current Medicare program, recognizing strong public support to address the high cost of pharmaceuticals. In addition, most of the plans would encourage payment and delivery system reforms that aim to improve quality and reduce costs.

11. What are the costs and potential trade-offs?

As noted above, CBO has not yet published estimates of how these proposals would affect health coverage or federal costs. All of the bills contain at least some provisions, such as expansion of current marketplace subsidies, or enhancements to current Medicare or Medicaid programs, that would result in new federal spending. At the same time, these proposals, to varying degrees, would also result in reductions in out-of-pocket spending for individuals, by broadening eligibility rules, reducing premiums and/or cost-sharing liability, improving benefits, and limiting or eliminating balance billing and – by extension – surprise medical bills. Proposals that significantly reduce patient out-of-pocket spending would tend to increase use of services and overall health spending. Some proposals could also result in significant savings for states and employers. Some of the proposals, notably the two Medicare-for-All bills, would result in a significant redistribution of costs, particularly after taxes are taken into account, which would create winners and losers, and tradeoffs that are likely to arise as the debate moves forward

The Medicare-for-All bills include features to rein in health spending, such as global budgets, a Medicare-like fee schedule, and administrative savings that would derive from having a single payer, but would increase on-budget federal spending by expanding coverage to more people and by enhancing the coverage people get under the public plan. Federal spending would increase as costs are shifted from households, employers and states to the federal government.

The public buy-in plans aim to give individuals and, in some instances, employers a more affordable option, that limit, to varying degrees, the on-budget costs for the federal government. They generally require enrollee premiums to cover 100% of program costs, including administrative expenses. Other features of these proposals, however, would likely impact cost estimates, such as premium and cost-sharing subsidies for public plan enrollees, premium and cost-sharing enhancements for private marketplace enrollees, and benefit enhancements for the current Medicare program.

Under all of the bills, hospitals, physicians and other health care professionals would shoulder some of the cost, assuming the public plan uses Medicare payment rates, rather than the higher rates typically paid by commercial insurers. Commercial insurers themselves could lose revenue depending on the size of the public plan; the impact would be far greater under Medicare-for-All than under some of the public plan options. The introduction of a public plan option could also have adverse effects on private insurance industry profits and jobs, although the Medicare-for-all proposals include provisions to address potential job loss. It is also possible that insurers could gain opportunities under some proposals, such as the Medicare buy-in bills, which would enable insurers to offer Medicare Advantage plans to adults who have not reached age 65. Further, if the Medicare buy-in plan draws higher-cost people away from private marketplace coverage, and premiums for younger enrollees decline (favorable selection), insurers may be able to expand their footprint in the marketplace.

Formal cost estimates, with specified financing, are needed by policymakers to fully assess the cost implications and the magnitude of tradeoffs involved for consumers, who are also taxpayers, and for other payers.

12. How would the proposals be financed?

The two Medicare-for-All proposals acknowledge the need for financing to cover the costs of the new program, after taking offsets into account. Senator Sanders released a white paper discussing financing options; Rep Ellison’s bill lists sources of financing that would be tapped to cover expenses (e.g. increase personal income tax on top 5% of earners). Both proposals envision a major shift in the way in which health care is financed in the U.S., away from households, employers, and states to the federal government (and taxpayers). Such a shift would no doubt create winners and losers, relative to the current system.

As noted above, several of the public plan buy-in proposals would have premiums cover the costs of covered benefits for people who buy into the public plan, although the financing for additional costs (not yet estimated) are not specified. The Schatz Medicaid buy-in bill would finance the public plan with a combination of premiums and other revenues along with federal Medicaid matching payments. How these additional federal costs will be financed is not specified.

Discussion

With health care reemerging as an issue for voters in the mid-term elections, the debate over the role of public programs in our health care system appears to be intensifying. Current proposals offer a range of approaches from those that would transform the existing system by creating a new national, Medicare-for-All plan to more incremental approaches that would offer a new public plan option alongside existing private coverage and public programs. With many details yet to be provided, these proposals raise a number of questions, the answers to which will have important implications for consumers, health care professionals, and health care payers, including employers, states, and the federal government. While these proposals are not expected to advance in their current form, they highlight the range of approaches that will likely emerge in legislation in the new session of Congress following the 2018 elections.

Public polling indicates that proposals to create a national Medicare-for-All plan or to expand Medicare through a public plan option or buy-in receive favorable ratings. However, public opinion is malleable when information is presented in support of or in opposition to the proposals, suggesting that the specifics of how plans are designed and communicated will matter to future public support.
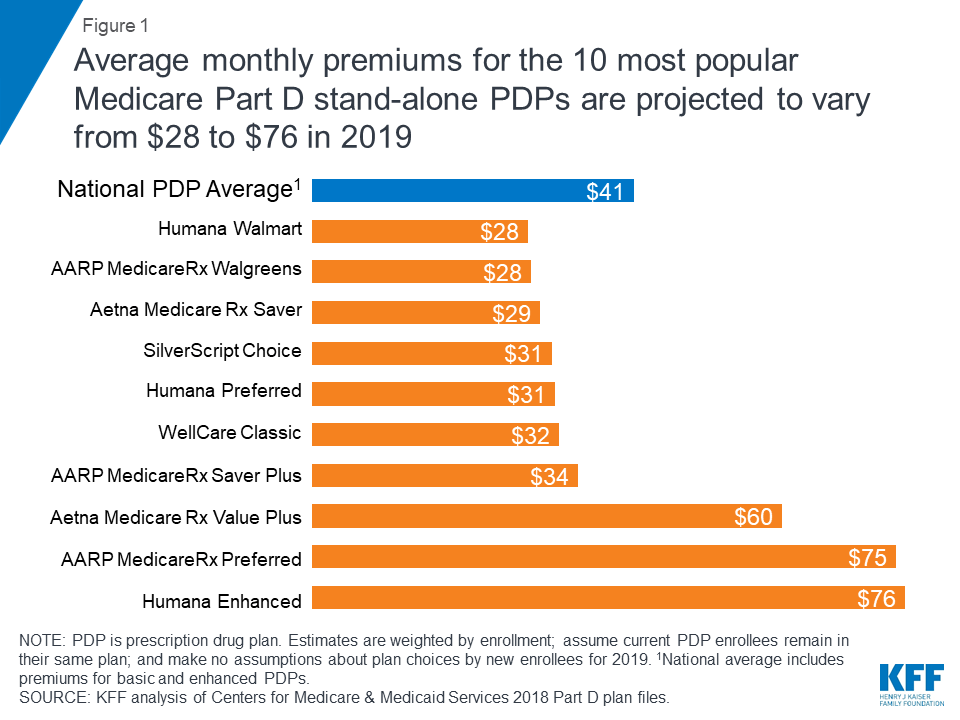
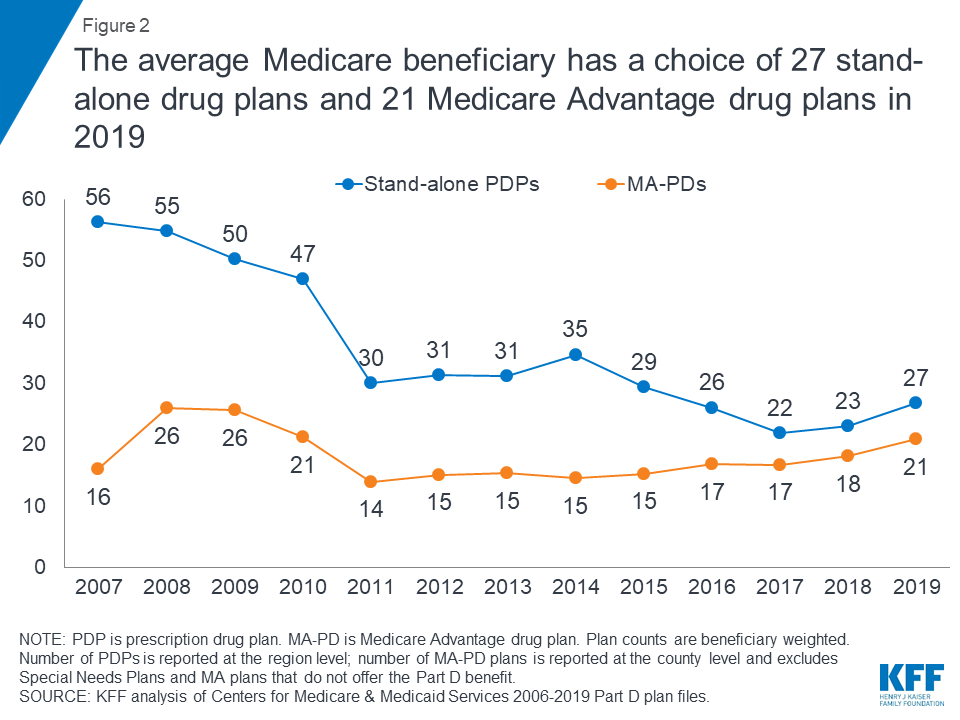
Endnotes

  1. H.R. 676 was introduced originally by Representative Conyers. On March 7, 2018, Representative Ellison received unanimous consent to be considered the first sponsor. ↩︎
  2. The Stabenow bill does not include a provision to authorize the Secretary to negotiate lower drug prices; however, Senator Stabenow has co-sponsored other legislation that would do so. ↩︎
News Release

The Implementation of Work Requirements in Arkansas Has Been Complex and Many Medicaid Enrollees Are Not Aware of New Rules or Face Obstacles in Complying

Published: Oct 9, 2018

The implementation of Medicaid work requirements in Arkansas has been complex, with many Medicaid enrollees still not aware of program changes despite substantial outreach.  In addition, an online reporting requirement is proving difficult for many enrollees due to limited knowledge of the requirements as well as lack of computer literacy and internet access, according to a new analysis from KFF (the Kaiser Family Foundation).

Since Arkansas became the first state to implement Medicaid work requirements in June, more than 4,300 residents have lost coverage due to the work and reporting requirements and another 5,000 are at risk of losing their insurance should they fail to report for another month. Additional follow-up is needed to understand the circumstances leading to coverage loss.  The analysis of the state’s early experience with work and reporting requirements is based on publicly available data and information as well as interviews conducted in August and September with state officials, health plans, providers, and beneficiary advocates.

The analysis finds that telephone calls, emails, social media and online videos may have a limited reach as accurate phone numbers are often not available and enrollees may not have access to computers or internet.  Low literacy levels and the complexity of the process are also factors making outreach and education difficult.  Arkansas’ requirement that enrollees set up an online account and report work activities or exemptions monthly is a barrier for many enrollees who have low computer literacy and lack computers, email or internet access.  Interviewees noted additional obstacles to work such as transportation and lack of jobs for people with low educational levels.

The early experience in Arkansas can show other states considering similar policies the challenges and implications.  New Hampshire and Indiana have approved waivers for Medicaid work requirements, and 10 other states have waivers pending at the Centers for Medicare and Medicaid Services. A federal court blocked Kentucky’s Medicaid work requirements waiver and sent it back to the U.S. Department of Health and Human Services.

Monitor developments with our Medicaid waiver tracker. For more quantitative data on implementation of the new requirements in Arkansas, see An Early Look at State Data for Medicaid Work Requirements in Arkansas, released by KFF last month.