Kaiser Health Tracking Poll – November 2017: The Politics of Health Insurance Coverage, ACA Open Enrollment
Findings
KEY FINDINGS:
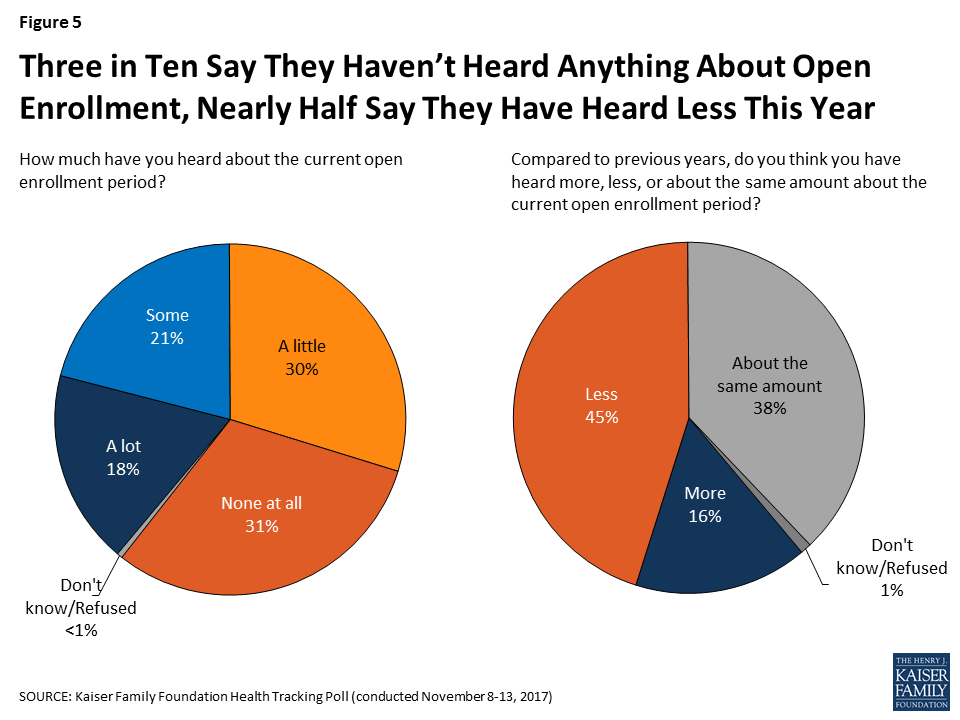
- This month marks the start of the ACA’s fifth open enrollment period for individuals who purchase health plans on their own. The November Kaiser Health Tracking Poll finds three in ten of the public saying they haven’t heard anything at all about the current open enrollment period. Three in ten Americans say they have heard “a little” while four in ten say they have heard either “some” (21 percent) or “a lot” (18 percent). About half of the public (45 percent) say they have heard less about open enrollment this year compared to previous years while four in ten (38 percent) say they have heard “about the same amount.”
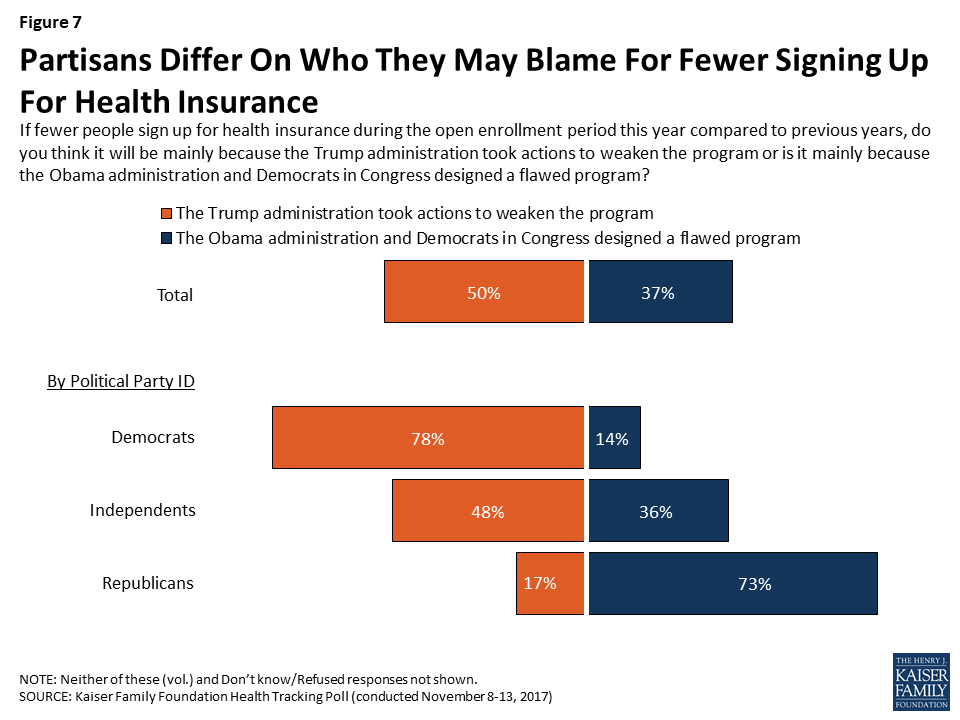
- Half think that if fewer people sign up for health insurance this year it is mainly because of the actions taken by the Trump administration, while four in ten (37 percent) say it is mainly because the Obama administration and Democrats in Congress designed a flawed program. These attitudes are largely driven by party identification with eight in ten Democrats (78 percent) saying fewer sign-ups would mainly result from actions of the Trump administration and three-fourths of Republicans placing blame on the flawed program designed by the Obama administration and Democrats.
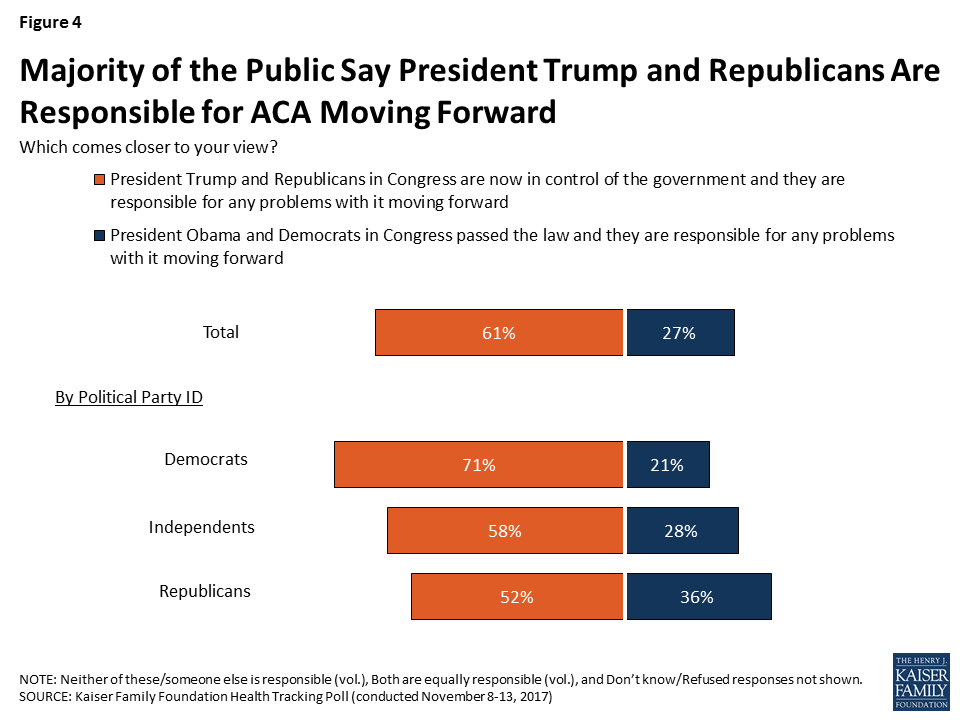
Poll: 61% of public says President Trump and Republicans in Congress are responsible for the ACA going forward
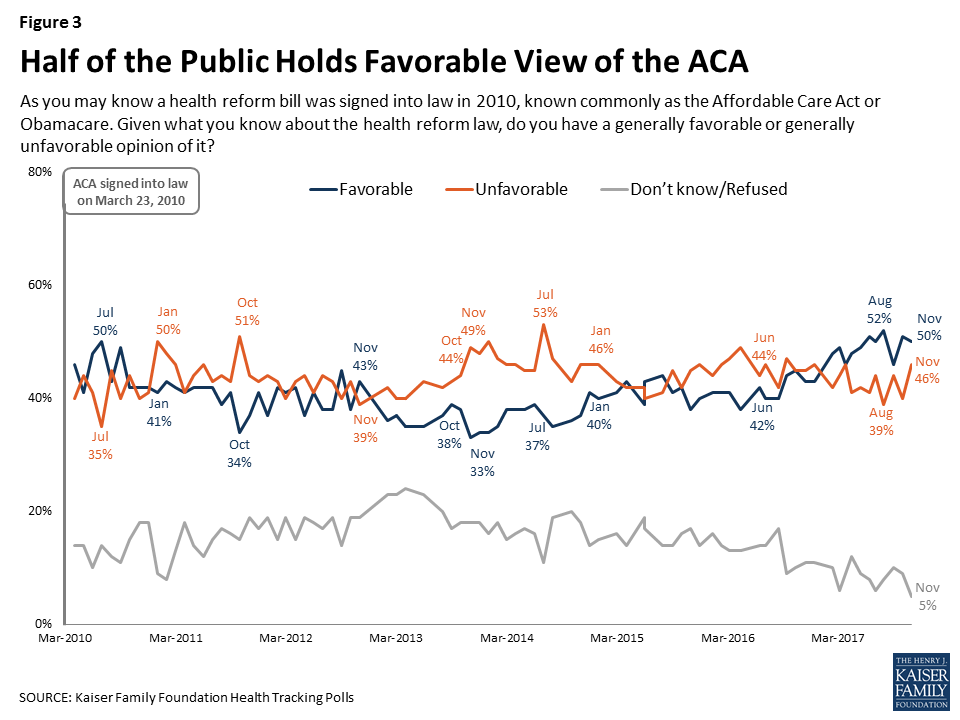
- The public are divided in their view of the ACA with similar shares of the public holding favorable views (50 percent) as unfavorable views (46 percent). These attitudes are largely partisan with eight in ten Republicans (81 percent) reporting an unfavorable opinion of the law and eight in ten Democrats (80 percent) reporting a favorable opinion. Despite their overall views of the ACA, the majority of the public (61 percent) – including most Democrats (71 percent), independents (58 percent), and half of Republicans (52 percent) – say that because President Trump and Republicans in Congress are now in control of the government, they are responsible for any problems with the health care law moving forward.
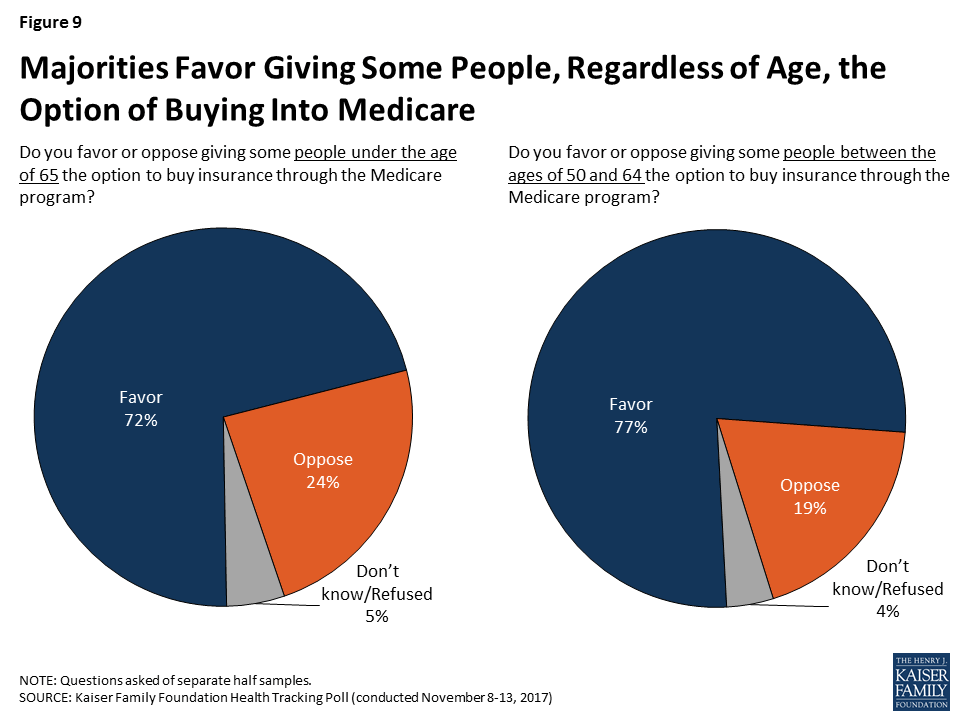
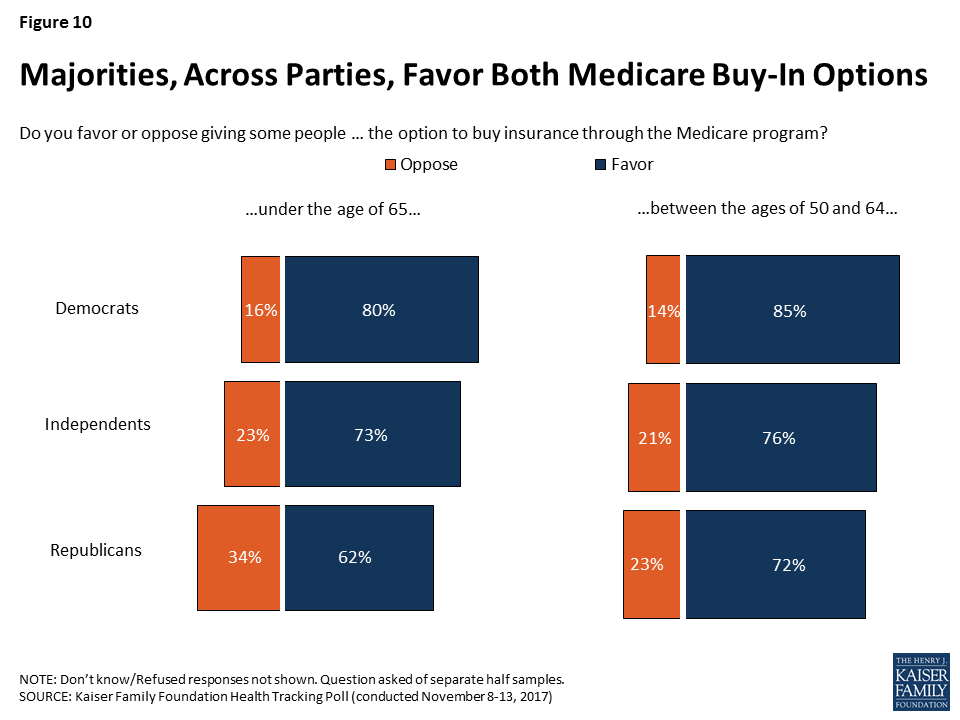
- This month’s tracking poll also examines public support for two variations of a Medicare buy-in proposal. More than seven in ten of the public favors both proposals with a slightly larger share favoring a proposal that would limit the Medicare buy-in option to those between the ages of 50 and 64 years old (77 percent compared to 72 percent who support a buy-in for people of all ages). While there has not yet been a large-scale public debate on a Medicare buy-in proposal, these results provide some indication of where opinions would land if either of these proposals gains prominence.
President Trump and the Affordable Care Act
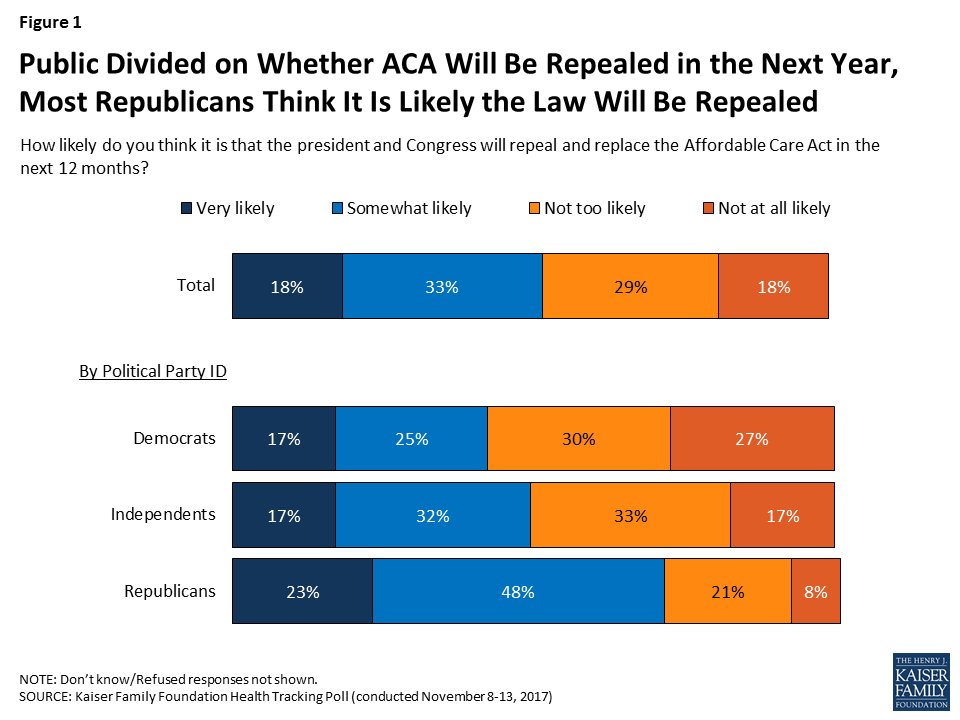
The November Kaiser Health Tracking Poll finds that while repealing the 2010 Affordable Care Act (ACA) is viewed as a lesser priority among the overall public, it is still seen as a top priority for President Trump and Congress by half of Republicans but falls behind other priorities such as strengthening immigration controls (69 percent) and providing funding for places in the U.S. affected by hurricanes (52 percent). Half of the public (51 percent) – including seven in ten Republicans – think it is either “very likely” or “somewhat likely” that the president and Congress will repeal the ACA in the next 12 months.
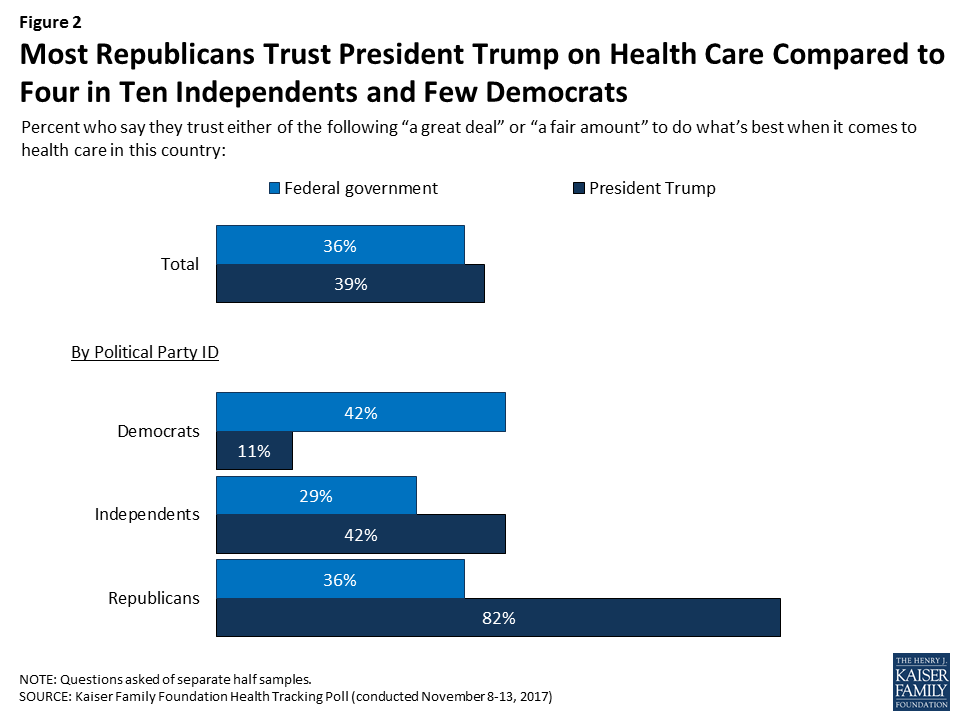
Majority of Republicans Trust President Trump to do What’s Best When it Comes to Health Care
This month’s tracking poll examines who the public trust to do what’s best for the country when it comes to health care. When comparing trust in President Trump to the overall federal government when it comes to health care, larger shares of Republicans and independents trust President Trump at least a fair amount (82 percent and 42 percent) compared to the federal government (36 percent and 29 percent). On the other hand, four in ten Democrats (42 percent) say they trust the federal government while a much smaller share (11 percent) say they trust President Trump to do what’s best when it comes to health care in this country.
The majority of the public (60 percent) – including majorities of Democrats (89 percent) and independents (57 percent) – do not trust President Trump to do what’s best when it comes to health care in this country. When it comes to the federal government more generally, majorities across parties do not trust the federal government to do what’s best (58 percent of Democrats, 64 percent of Republicans, and 70 percent of independents).
| Table 1: Trust in President Trump and Federal Government in Health Care by Party Identification | ||||
| How much do you trust …to do what’s best when it comes to health care in this country? | Total | Party ID | ||
| Democrats | Independents | Republicans | ||
| …President Trump… | ||||
| A great deal | 18% | 8% | 15% | 43% |
| A fair amount | 20 | 3 | 27 | 39 |
| Not very much | 21 | 26 | 26 | 9 |
| Not at all | 39 | 63 | 31 | 8 |
| …the federal government… | ||||
| A great deal | 9 | 12 | 9 | 7 |
| A fair amount | 27 | 30 | 20 | 28 |
| Not very much | 33 | 34 | 32 | 38 |
| Not at all | 30 | 24 | 38 | 26 |
| NOTE: Don’t know/Refused responses not shown. | ||||
Views of the ACA And Who Is Responsible for the Law Continue to be Driven by Party Identification
This month’s tracking poll finds the public divided in its view of the ACA, with similar shares of the public holding favorable views (50 percent) as unfavorable views (46 percent). These attitudes are highly partisan with eight in ten Republicans (81 percent) reporting an unfavorable opinion of the law and eight in ten Democrats (80 percent) reporting a favorable opinion. Independents remain divided in their views towards the law (50 percent hold an unfavorable view while 43 percent hold a favorable view).
Most Know ACA Is Still in Effect
With recent talk of ACA repeal and President Trump making statements declaring the law to be “dead” and “finished,”1 some of the public may be confused about whether the law remains in effect. The November poll finds about eight in ten (78 percent) of the public are aware that the ACA is still in effect while one in ten (12 percent) incorrectly say the law has been repealed and is no longer in effect and 10 percent are not sure. The share who are aware the law is still in effect has decreased somewhat from August 2017 (five percentage points).
Despite their overall views of the ACA, the majority of the public (61 percent) – including most Democrats (71 percent), independents (58 percent), and half of Republicans (52 percent) – say that because President Trump and Republicans in Congress are now in control of the government, they are responsible for any problems with the health care law moving forward. Fewer (27 percent) say that because President Obama and Democrats in Congress passed the law, they are responsible for any problems with it.
The Affordable Care Act’s 2018 Open Enrollment
This month marks the start of the ACA’s fifth open enrollment period for individuals who purchase health plans on their own. According to the Centers for Medicare and Medicaid Services, 876,788 people signed up for insurance through the federal marketplace through the second week, which is slightly more than in previous years.2
Three in ten (31 percent) of the public say they haven’t heard anything at all about the current open enrollment period – including three in ten uninsured Americans. Three in ten Americans say they have heard “a little” while four in ten say they have heard either “some” (21 percent) or “a lot” (18 percent). Half of the public (45 percent) and the uninsured (52 percent) say they have heard less about open enrollment this year compared to previous years, while four in ten of the public (38 percent) and one-third of the uninsured (34 percent) say they have heard “about the same amount.” There are no differences across Democrats, independents, and Republicans, with pluralities of all partisans saying they have heard less this year compared to previous years.
Compared to last month’s Kaiser Health Tracking Poll, a larger share of the public now say they have heard or seen advertisements either from an insurance company or that provided information about how to get health insurance. Between October and November, the share who say they saw ads in the past 30 days from an insurance company attempting to sell health insurance increased slightly from from 34 percent to 41 percent, while the share who say they saw ads that provided information about how to get health insurance under the ACA increased from 20 percent to 32 percent.

Who Is To Blame if Fewer People Enroll in Health Insurance?
Some experts are concerned that fewer people may sign up for health insurance from the ACA marketplaces this year because of a shorter enrollment period and decreased outreach from the Trump administration. Half of the public think that if fewer people sign up for health insurance this year, it will mainly be because of the actions taken by the Trump administration, while nearly four in ten (37 percent) say it will mainly be because the Obama administration and Democrats in Congress designed a flawed program. These attitudes are largely driven by party identification with eight in ten Democrats (78 percent) blaming actions taken by the Trump administration and while three-fourths of Republicans (73 percent) blaming flaws in the program designed by the Obama administration and Democrats in Congress. A larger share of independents think that if fewer people sign up this year, it will be mainly because of the actions of the Trump administration (48 percent) rather than because Democrats designed a flawed program (36 percent).
Medicare
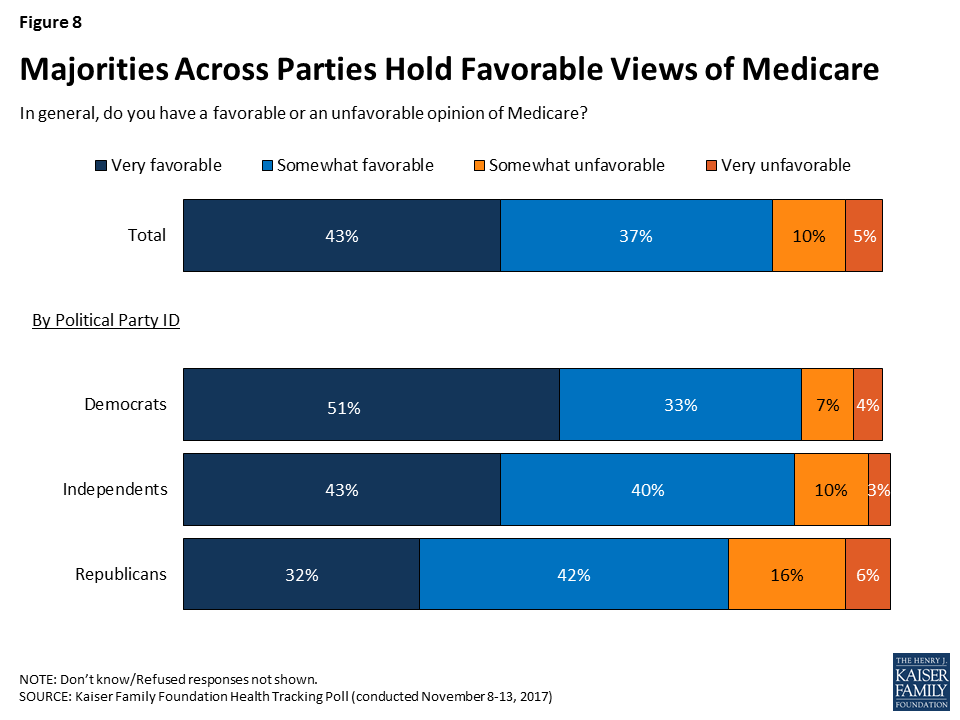
While attitudes towards the ACA are largely driven by party identification, opinions towards Medicare, the government health insurance program for adults 65 or older and for younger adults with long-term disabilities, are positive across partisans. Overall, a majority of the public (80 percent) and most Democrats (85 percent), independents (83 percent), and Republicans (74 percent) hold favorable views towards Medicare.
Medicare Buy-In Proposal
One proposal being put forth by Democratic lawmakers is to allow individuals under the age of 65 to buy health insurance through Medicare. This month’s tracking poll examined public support for two variations of this proposal: allowing some individuals under the age of 65 to buy into the Medicare program and allowing individuals between the ages of 50 and 64 to buy into the Medicare program. More than seven in ten of the public favors both proposals, with a slightly larger share favoring the proposal that limits a Medicare buy-in option to those between the ages of 50 and 64 years old (77 percent compared to 72 percent).
Among Republicans, a majority also favor both proposals, with a larger share saying they favor the option of allowing individuals between the ages of 50 and 64 years old to buy into Medicare (72 percent) than the option without an age restriction (62 percent).
The Malleability of Attitudes Towards Medicare Buy-In Proposal
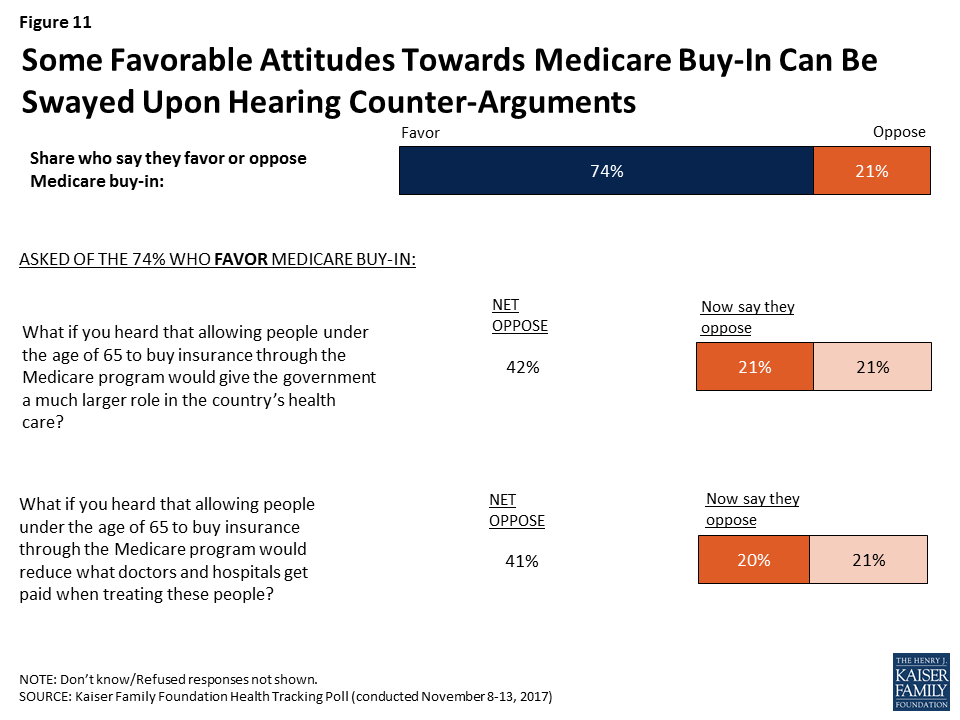
While there has not yet been a large-scale public debate on a Medicare buy-in proposal, there is some indication of where these opinions would land if either of these proposals becomes part of the public debate. Among the three-fourths of the public who favor a Medicare buy-in proposal (either one with an age restriction or not), about a quarter change their minds after hearing that allowing people to buy into Medicare could give the government a much larger role in the country’s health care system (21 percent of the public, overall) or hearing that it could reduce what doctors and hospitals get paid when treating these people (20 percent of the public, overall). Majorities of the public continue supporting a Medicare buy-in even after hearing counter-arguments.
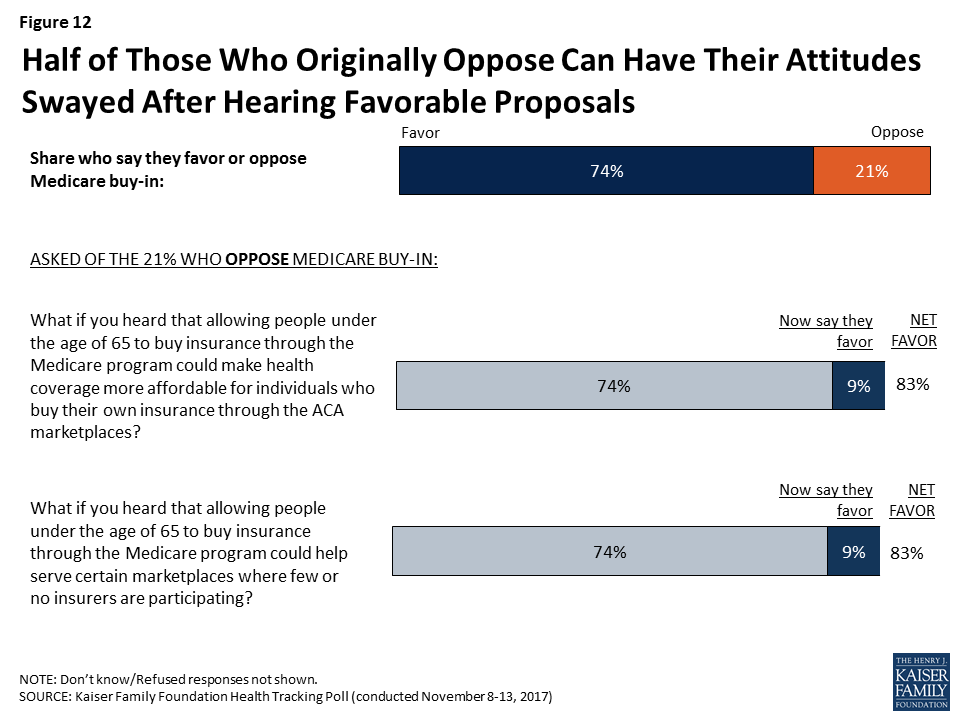
On the other hand, among the share of the public who initially opposed a Medicare buy-in proposal, about four in ten change their minds after hearing that allowing people to buy into Medicare could make health coverage more affordable for individuals who buy their own insurance through the ACA marketplaces (9 percent of the public, overall) or that this could help serve certain marketplaces where few or no insurers are participating (9 percent of the public, overall).
The Impact of Labels on Support for Health Care Policies
Politicians have long been using a variety of terms to describe the idea of expanding health insurance coverage to all Americans including recent discussion of “Medicare-for-all” during the 2016 presidential election. This month’s tracking poll explores the public’s reaction to a few of these terms and finds six in ten of the public say they have a positive reaction to the term “Medicare-for-all” (62 percent), “universal health coverage” (61 percent), and “national health plan” (57 percent). Fewer report a positive association to “single payer health insurance system” (48 percent) or “socialized medicine” (44 percent).
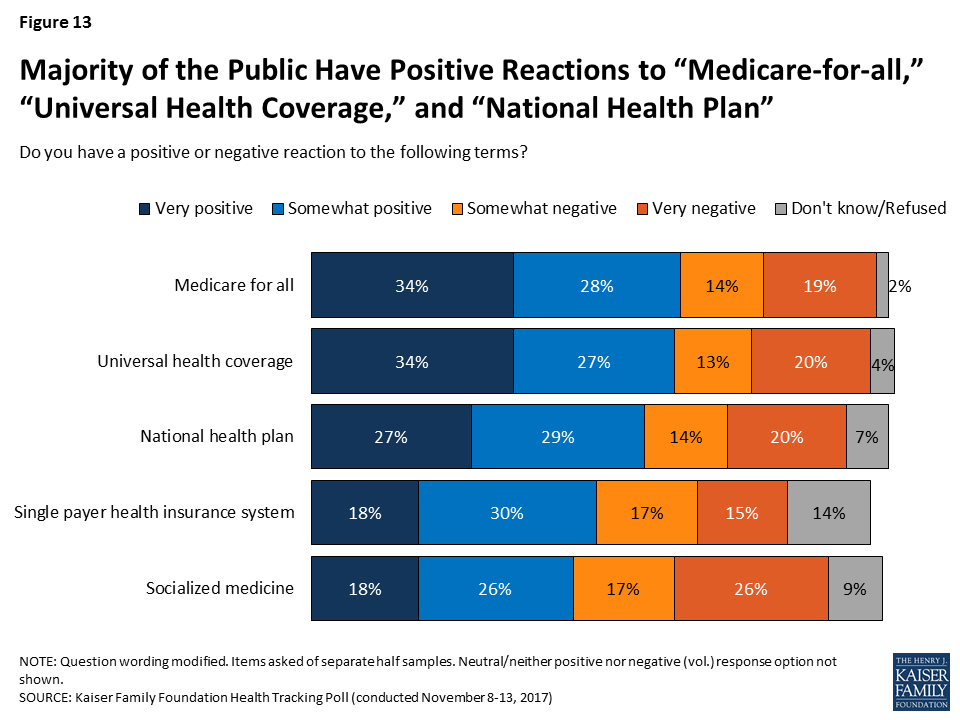
Similar to the overall public, a larger share of Democrats and independents report positive reactions to“Medicare-for-all,” “universal health coverage,” than the other terms provided. Still, a majority of Democrats say they have a positive reaction to the terms “national health plan,” “socialized medicine,” and “single payer health insurance system.” Majorities of Republicans have a negative reaction to most of these terms, with the highest share (80 percent) reacting negatively to “socialized medicine.”
| Table 2: In Health Care, Reactions Vary Depending on Labeling | ||||
Do you have a positive or negative reaction to the following terms? | Party ID | |||
| Democrats | Independents | Republicans | ||
| Medicare-for-all | Positive | 83% | 63% | 33% |
| Negative | 13 | 32 | 64 | |
| Universal health coverage | Positive | 86 | 59 | 34 |
| Negative | 9 | 36 | 61 | |
| National health plan | Positive | 71 | 60 | 34 |
| Negative | 18 | 31 | 62 | |
| Single payer health insurance system | Positive | 59 | 47 | 37 |
| Negative | 23 | 30 | 45 | |
| Socialized medicine | Positive | 67 | 46 | 14 |
| Negative | 17 | 44 | 80 | |
Methodology
This Kaiser Health Tracking Poll was designed and analyzed by public opinion researchers at the Kaiser Family Foundation (KFF). The survey was conducted November 8th-13th 2017, among a nationally representative random digit dial telephone sample of 1,201 adults ages 18 and older, living in the United States, including Alaska and Hawaii (note: persons without a telephone could not be included in the random selection process). Computer-assisted telephone interviews conducted by landline (415) and cell phone (786, including 482 who had no landline telephone) were carried out in English and Spanish by SSRS of Media, PA. Both the random digit dial landline and cell phone samples were provided by Marketing Systems Group (MSG). For the landline sample, respondents were selected by asking for the youngest adult male or female currently at home based on a random rotation. If no one of that gender was available, interviewers asked to speak with the youngest adult of the opposite gender. For the cell phone sample, interviews were conducted with the adult who answered the phone. KFF paid for all costs associated with the survey.
The combined landline and cell phone sample was weighted to balance the sample demographics to match estimates for the national population using data from the Census Bureau’s 2016 American Community Survey (ACS) on sex, age, education, race, Hispanic origin, and region along with data from the 2010 Census on population density. The sample was also weighted to match current patterns of telephone use using data from the July-December 2016 National Health Interview Survey. The weight takes into account the fact that respondents with both a landline and cell phone have a higher probability of selection in the combined sample and also adjusts for the household size for the landline sample. All statistical tests of significance account for the effect of weighting.
The margin of sampling error including the design effect for the full sample is plus or minus 3 percentage points. Numbers of respondents and margins of sampling error for key subgroups are shown in the table below. For results based on other subgroups, the margin of sampling error may be higher. Sample sizes and margins of sampling error for other subgroups are available by request. Note that sampling error is only one of many potential sources of error in this or any other public opinion poll. Kaiser Family Foundation public opinion and survey research is a charter member of the Transparency Initiative of the American Association for Public Opinion Research.
| Group | N (unweighted) | M.O.S.E. |
| Total | 1,201 | ±3 percentage points |
| Party Identification | ||
| Democrats | 398 | ±6 percentage points |
| Republicans | 298 | ±7 percentage points |
| Independents | 392 | ±6 percentage points |
Endnotes
- R. Savransky, The Hill, Trump: There is no such thing as Obamacare anymore, October 2017, http://thehill.com/policy/healthcare/355658-trump-there-is-no-such-thing-as-obamacare-anymore ↩︎
- Centers for Medicare and Medicaid Services, Weekly Enrollment Snapshot: Week Two, Available at https://www.cms.gov/Newsroom/MediaReleaseDatabase/Fact-sheets/2017-Fact-Sheet-items/2017-11-15.html?DLPage=1&DLEntries=10&DLSort=0&DLSortDir=descending ↩︎