KFF designs, conducts and analyzes original public opinion and survey research on Americans’ attitudes, knowledge, and experiences with the health care system to help amplify the public’s voice in major national debates.
At a time when debate is beginning about a national Medicare-for-all plan and other approaches to expanding coverage through public programs, this month’s KFF Health Tracking poll examines Americans’ early opinion on a range of options under consideration.
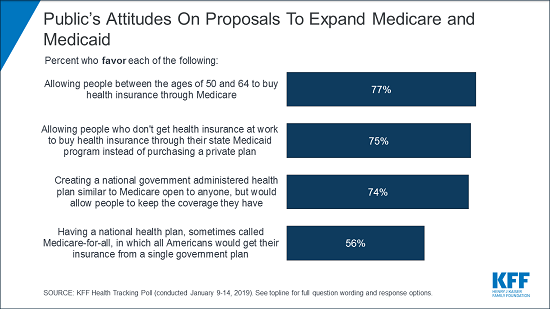
The poll finds majority support for four different approaches:
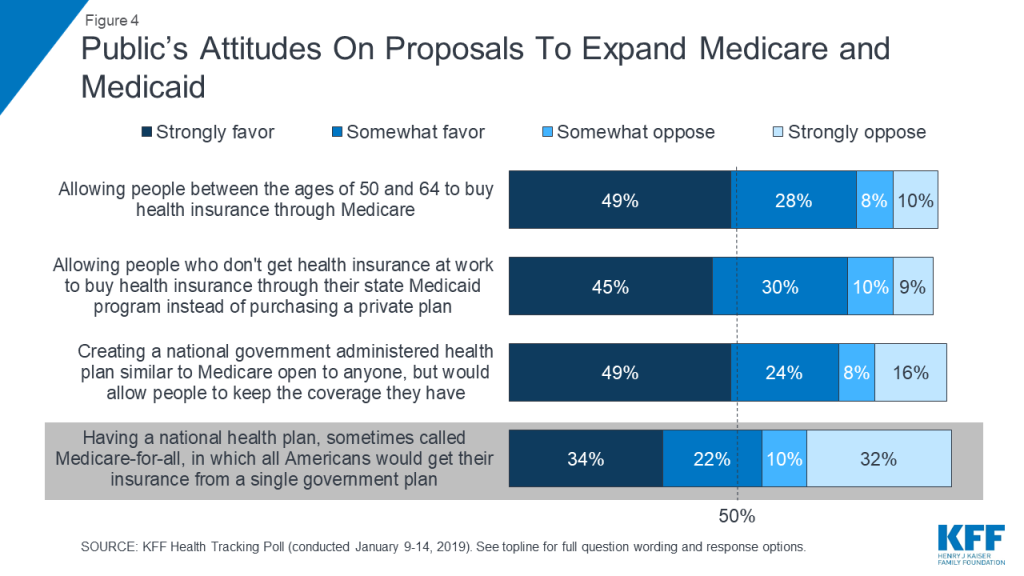
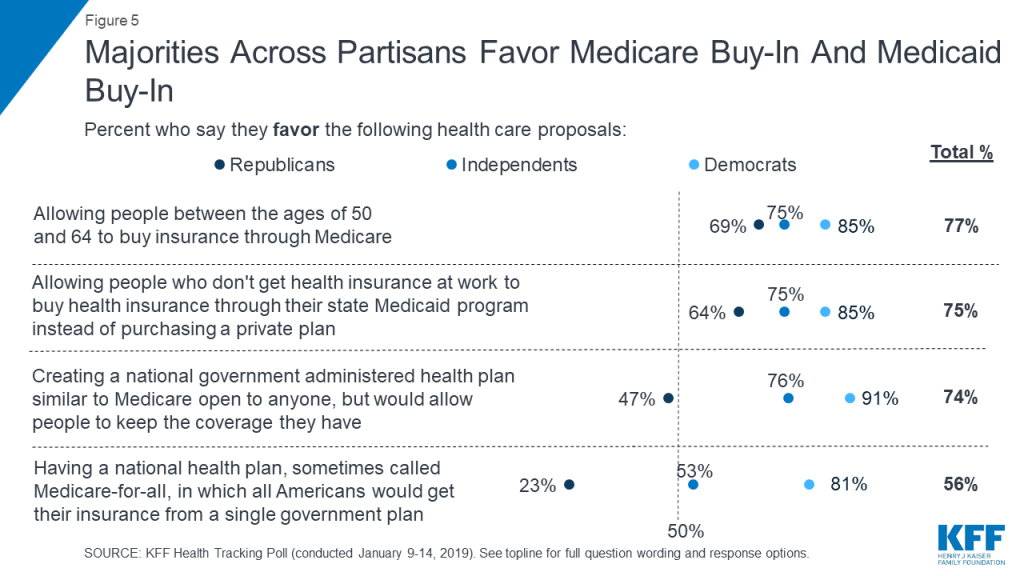
77 percent of the public, including most Republican (69%), favor allowing people between the ages of 50 to 64 to buy health insurance through Medicare;
75 percent, including most Republicans (64%), favor allowing people who aren’t covered by their employer to buy insurance through their state’s Medicaid program;
74 percent, including nearly half of Republicans (47%), favor a national government plan like Medicare that is open to anyone, but also would allow people to keep the coverage they have if they want to; and
56 percent, including nearly a quarter of Republicans (23%), favor a national plan called Medicare-for-all in which all Americans would get their insurance through a single government plan.
Views Shift Significantly When People Hear Arguments For and Against Medicare-for-All
This month’s poll also probes attitudes after hearing common arguments for and against a national Medicare-for-all plan that could play a role in a future legislative debate. The results show how the public’s attitudes can shift significantly depending on what arguments people hear.
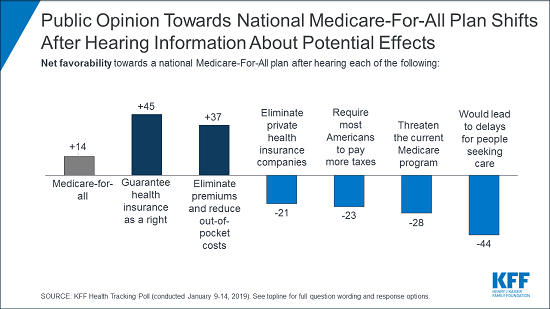
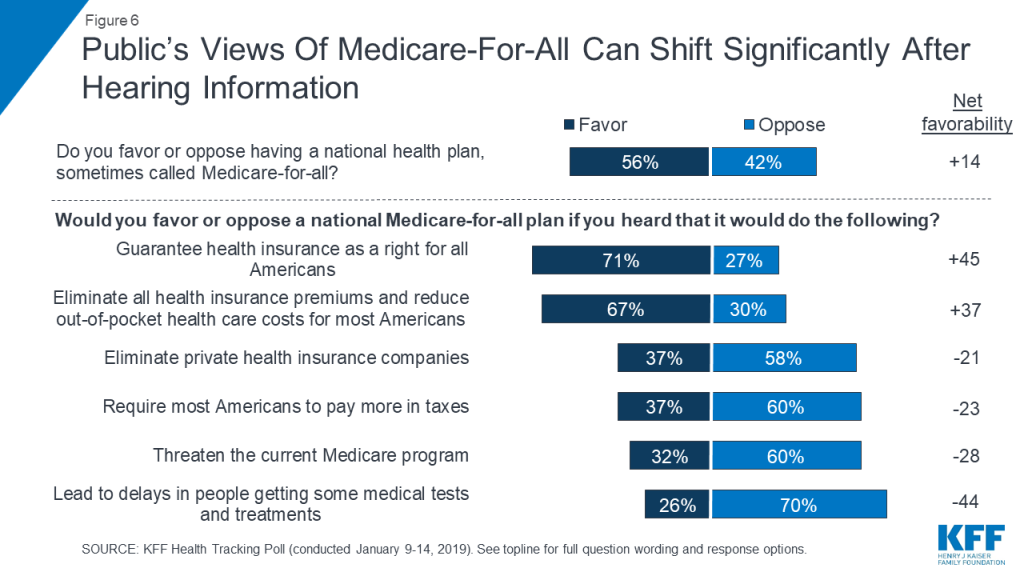
Medicare-for-all starts with net favorability rating of +14 percentage points (56% who favor it, minus 42% who oppose it). This jumps to +45 percentage points when people hear the argument that this type of plan would guarantee health insurance as a right for all Americans. However, views turn negative and net favorability falls to -44 percentage points when people hear the argument that it would lead to delays in some people getting medical tests and treatments.
Partisans Have Different Health Priorities for Congress Except All Agree on Lowering Drug Prices
The poll also gauges the public’s health care priorities for Congress.
When asked to choose a top priority, Democrats rank ensuring the Affordable Care Act’s protections for people with pre-existing conditions first (31%), ahead of other priorities such as passing Medicare-for-all (20%), and lowering prescription drug costs (20%).
Independents rank preserving the ACA’s pre-existing condition protections as Congress’ top health priority (24%) along with lowering prescription drug costs (20%). Repealing and replacing the ACA ranks as a top priority for Republicans (27%) along with lowering prescription drug costs (20%).
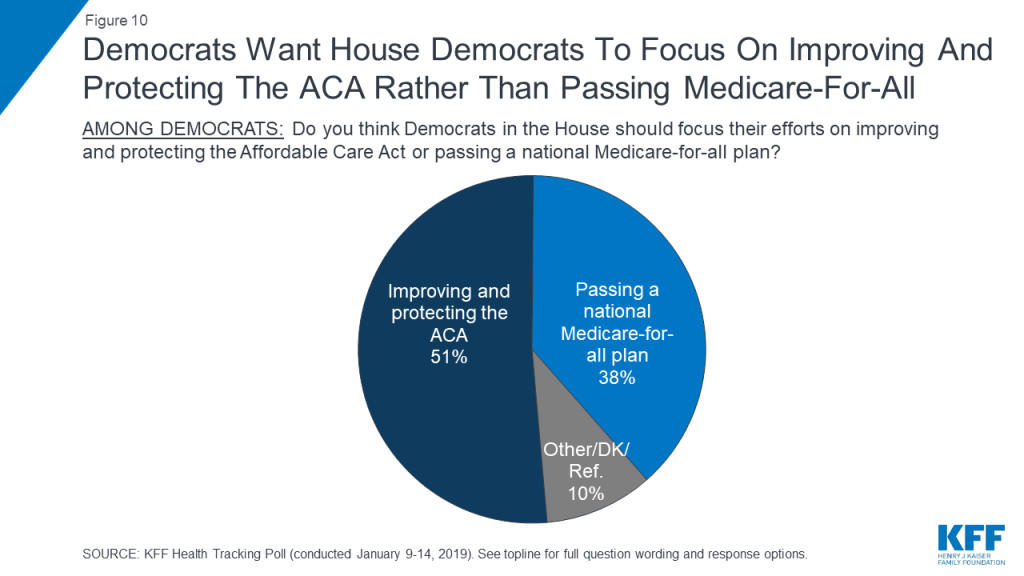
When Democrats were asked whether their party’s new House majority should focus on improving and protecting the ACA or passing a Medicare-for-all plan, half (51%) say the ACA and nearly four in 10 (38%) choose Medicare-for-all.
Most Unaware of a Federal Judge’s Ruling that Would Invalidate the Entire ACA if Upheld
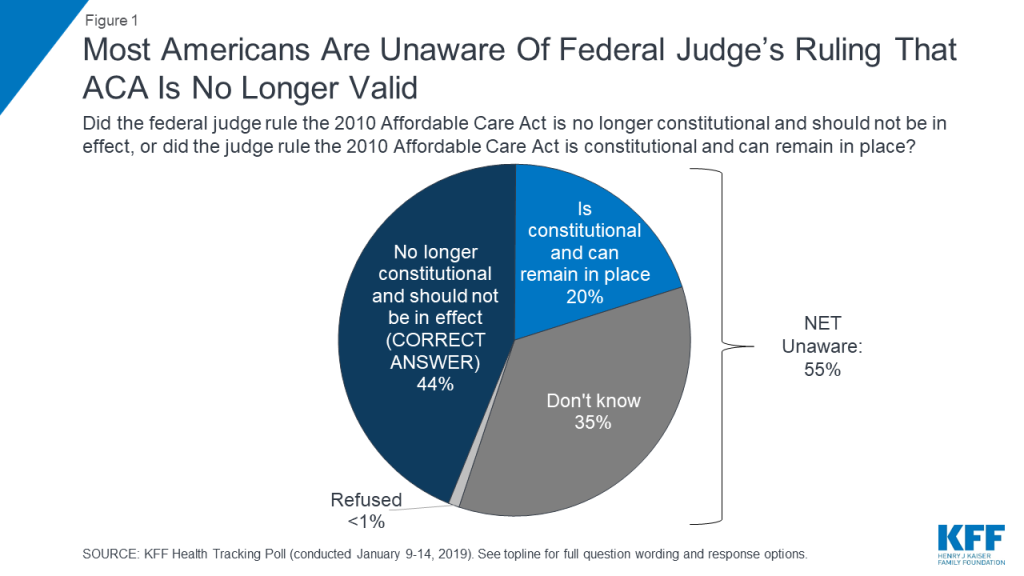
The poll finds that less than half (44%) of the public are aware of a December ruling by a federal judge in Texas that the ACA is invalid and should not be in effect.
The judge ruled in favor of a challenge filed by Republican state attorneys general that the entire law is invalid because Congress eliminated the tax penalty for not having health insurance. The ACA remains in effect pending an appeal by Democratic state attorneys general.
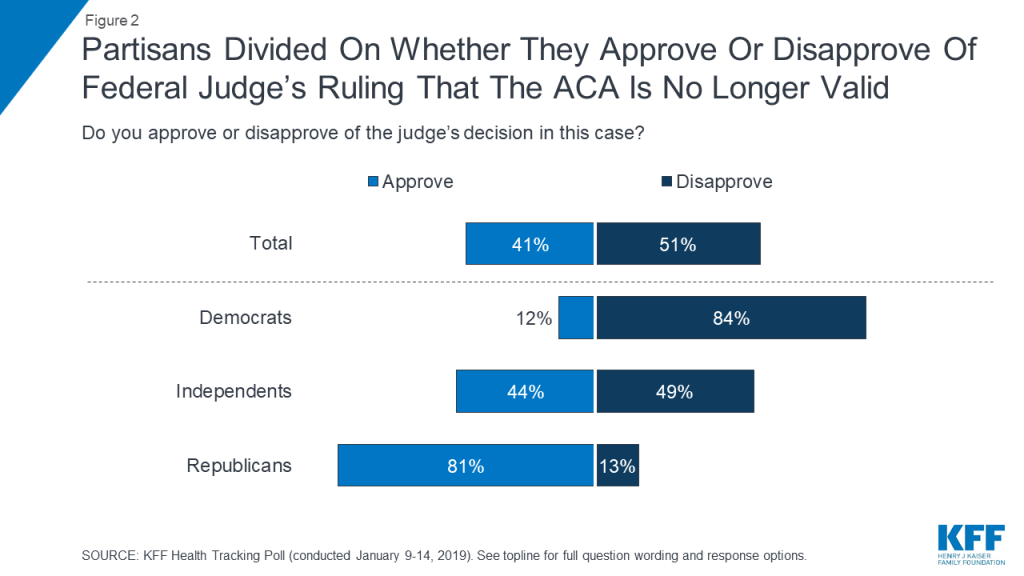
When told that the ruling deemed the ACA was invalid and should not be in effect, more Americans disapprove (51%) than approve (41%) of the ruling, with a sharp partisan split mirroring the public’s overall views of the law.
Designed and analyzed by public opinion researchers at the Kaiser Family Foundation, the poll was conducted from January 9-14, 2019 among a nationally representative random digit dial telephone sample of 1,190 adults. Interviews were conducted in English and Spanish by landline (285) and cell phone (905). The margin of sampling error is plus or minus 3 percentage points for the full sample. For results based on subgroups, the margin of sampling error may be higher.
Half of the public disapproves of the recent decision in Texas v. United States, in which a federal judge ruled that the 2010 Affordable Care Act (ACA) is unconstitutional and should not be in effect. While the judge’s ruling is broader than eliminating the ACA’s protections for people with pre-existing conditions, this particular issue continues to resonate with the public. Continuing the ACA’s protections for people with pre-existing conditions ranks among the public’s top health care priorities for the new Congress, along with lowering prescription drug costs.
This month’s KFF Health Tracking Poll continues to find majority support (driven by Democrats and independents) for the federal government doing more to help provide health insurance for more Americans. One way for lawmakers to expand coverage is by broadening the role of public programs. Nearly six in ten (56 percent) favor a national Medicare-for-all plan, but overall net favorability towards such a plan ranges as high as +45 and as low as -44 after people hear common arguments about this proposal.
Poll: Majorities favor a range of proposed options to expand public health coverage, including Medicare buy-in and #MedicareForAll
Larger majorities of the public favor more incremental changes to the health care system such as a Medicare buy-in plan for adults between the ages of 50 and 64 (77 percent), a Medicaid buy-in plan for individuals who don’t receive health coverage through their employer (75 percent), and an optional program similar to Medicare for those who want it (74 percent). Both the Medicare buy-in plan and Medicaid buy-in plan also garner majority support from Republicans (69 percent and 64 percent).
Moving forward, half of Democrats would rather see the new Democratic majority in the U.S. House of Representatives focus their efforts on improving and protecting the ACA (51 percent), while about four in ten want them to focus on passing a national Medicare-for-all plan (38 percent).
Figure 1: Most Americans Are Unaware Of Federal Judge’s Ruling That ACA Is No Longer Valid
Texas v. United States: The Future of the Affordable Care Act
On December 14, 2018, a federal district court judge in Texas issued a ruling challenging the future of the 2010 Affordable Care Act (ACA).The judge sided with Republican state attorneys general and ruled that, since the 2017 tax bill passed by Congress zeroed out the penalty for not having health insurance, the ACA is invalid. Democrat attorneys general have already taken actions to appeal the judge’s ruling in the case and, due to the government shutdown, the 5th Circuit Court of Appeals has paused the case. Currently, the ACA remains the law of the land. If this ruling is upheld, the consequences will be far-reaching.1 Less than half of the public (44 percent) are aware of the judge’s ruling that the ACA is unconstitutional and most (55 percent) either incorrectly say that the judge ruled in favor of the ACA (20 percent) or are unsure (35 percent).
Overall, a larger share of the public disapprove (51 percent) than approve (41 percent) of the judge’s ruling that the ACA is not constitutional. This is largely divided by party identification with a majority of Republicans (81 percent) approving of the decision while a majority of Democrats disapproving (84 percent). Independents are closely divided (49 percent disapprove v. 44 percent approve).
Figure 2: Partisans Divided On Whether They Approve Or Disapprove Of Federal Judge’s Ruling That The ACA Is No Longer Valid
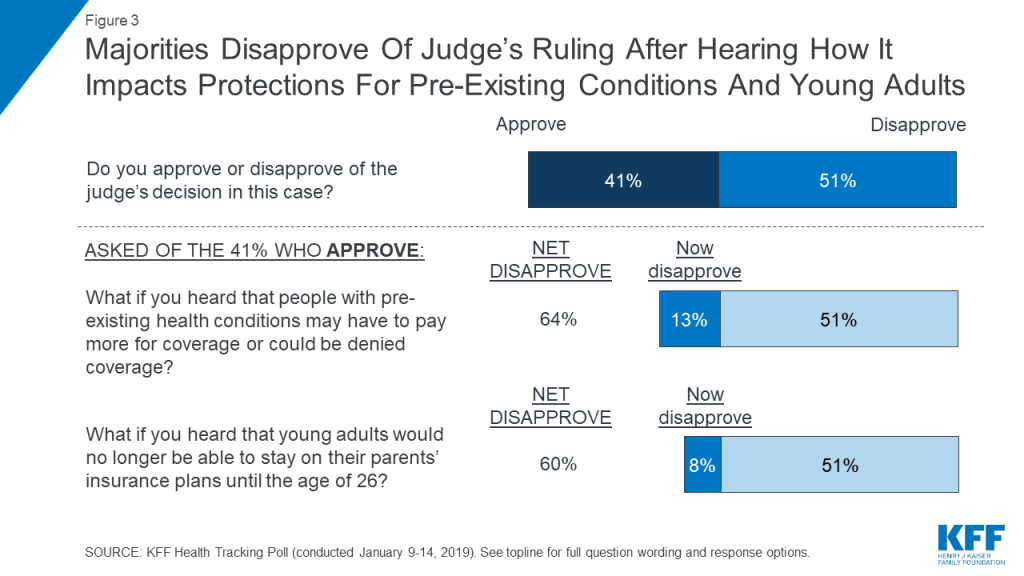
The Trump administration had originally announced that as part of Texas v. United States, it would no longer defend the ACA’s protections for people with pre-existing medical conditions. While the judge’s ruling was broader than just the ACA’s pre-existing condition protections, KFF polling finds attitudes can shift when the public hears that these protections may no longer exist. Among those who originally approve of the federal judge’s ruling, about three in ten (13 percent of the public overall) change their mind after hearing that this means that people with pre-existing conditions may have to pay more for coverage or could be denied coverage, bringing the share who disapprove of the judge’s ruling to nearly two-thirds (64 percent) of the public.2
Fewer – but still about one-fifth (8 percent of total) – change their minds after hearing that as a result of this decision, young adults would no longer be able to stay on their parents’ insurance until the age of 26, bringing the total share who disapprove of the judge’s ruling to 60 percent.
Figure 3: Majorities Disapprove Of Judge’s Ruling After Hearing How It Impacts Protections For Pre-Existing Conditions And Young Adults
Overall, a slight majority of the public hold a favorable view of the ACA (51 percent) while four in ten continue to hold unfavorable views. (INTERACTIVE)
Public’s Views of Democratic Health Care Agenda
With the new Democratic majority in the U.S. House of Representatives, this month’s KFF Health Tracking Poll examines the public’s view of Congressional health care priorities including a national health plan.
Proposals to Expand Health Care Coverage
Most of the public favor the federal government doing more to help provide health insurance for more Americans and one way for lawmakers to expand coverage is by broadening the role of public programs, such as Medicare or Medicaid. The Kaiser Family Foundation has been tracking public opinion on the idea of a national health plan since 1998 (see slideshow). More than twenty years ago, about four in ten Americans (42 percent) favored a national health plan in which all Americans would get their insurance from a single government plan. In the decades that followed, there has been a modest increase in support – especially since the 2016 presidential election and Bernie Sanders’ rallying cry for “Medicare-for-all.” The most recent KFF Health Tracking Poll finds 56 percent of the public favor “a national health plan, sometimes called Medicare-for-all, where all Americans would get their insurance from a single government plan” with four in ten (42 percent) opposing such a plan.
Larger majorities favor more incremental changes to the health care system including a Medicare buy-in plan for adults between the ages of 50 and 64 (77 percent), a Medicaid buy-in plan for individuals who don’t receive health coverage through their employer (75 percent), and an optional program similar to Medicare for those who want it (74 percent).
Figure 4: Public’s Attitudes On Proposals To Expand Medicare and Medicaid
A majority of Democrats and independents favor all of these proposals, but only the Medicare buy-in plan for adults 50 and older and the Medicaid buy-in for individuals who don’t receive health coverage through their employer receive a majority of support from Republicans (69 percent and 64 percent, respectively).
Figure 5: Majorities Across Partisans Favor Medicare Buy-In And Medicaid Buy-In
MALLEABILITY in Attitudes Towards National Health Plan and Lingering Confusion About Possible Impacts
This month’s KFF Health Tracking Poll finds the net favorability of attitudes towards a national Medicare-for-all plan can swing significantly, depending on what arguments the public hears.
Depending on what arguments people hear, the public’s views of #MedicareForAll can swing from 71% in favor to 70% opposed highlighting the importance of any future legislative debate
Net favorability towards a national Medicare-for-all plan (measured as the share in favor minus the share opposed) starts at +14 percentage points and ranges as high as +45 percentage points when people hear the argument that this type of plan would guarantee health insurance as a right for all Americans. Net favorability is also high (+37 percentage points) when people hear that this type of plan would eliminate all premiums and reduce out-of-pocket costs. Yet, on the other side of the debate, net favorability drops as low as -44 percentage points when people hear the argument that this would lead to delays in some people getting some medical tests and treatments. Net favorability is also negative if people hear it would threaten the current Medicare program (-28 percentage points), require most Americans to pay more in taxes (-23 percentage points), or eliminate private health insurance companies (-21 percentage points).
Figure 6: Public’s Views Of Medicare-For-All Can Shift Significantly After Hearing Information
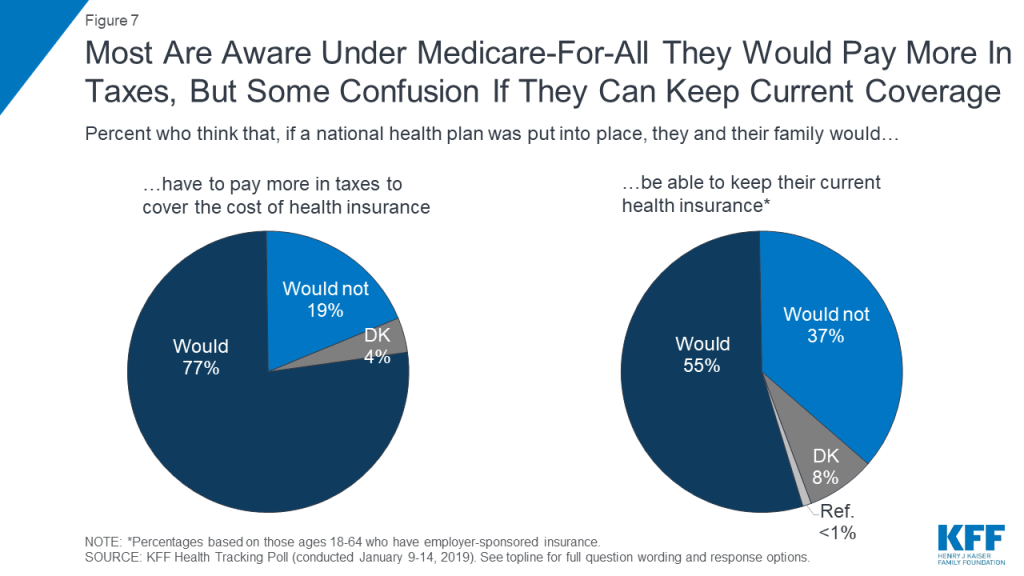
While most Americans (77 percent) are aware they would have to pay more in taxes to cover the cost of health insurance if a national Medicare-for-all plan was put into place, there is some confusion about whether people would be able to keep their current health insurance. Most people under the age of 65 and who currently have employer-sponsored insurance say that if a national health plan was put into place, they would be able to keep their current coverage (55 percent) while about four in ten (37 percent) are aware they would not be able to keep their current coverage.
Figure 7: Most Are Aware Under Medicare-For-All They Would Pay More In Taxes, But Some Confusion If They Can Keep Current Coverage
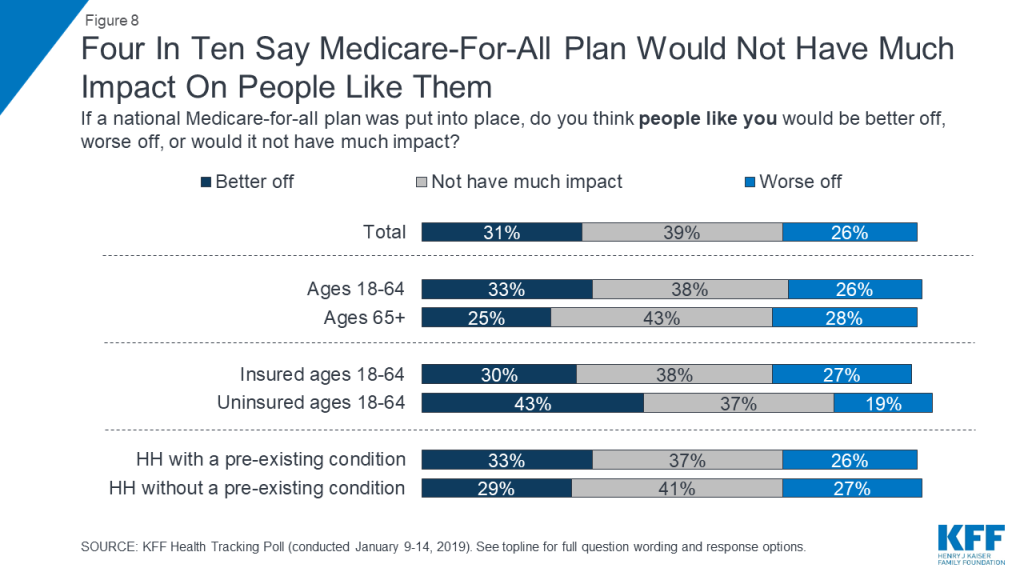
And while majorities say low-income people and people who currently don’t have health insurance would be “better off” if a national Medicare-for-all plan was put into place, there is less certainty among the public about how much it would impact them, personally. Across demographic groups, about four in ten say that if a national Medicare-for-all plan was put into place it “would not have much impact” on them.
Figure 8: Four In Ten Say Medicare-For-All Plan Would Not Have Much Impact On People Like Them
Medicare-for-all And Seniors
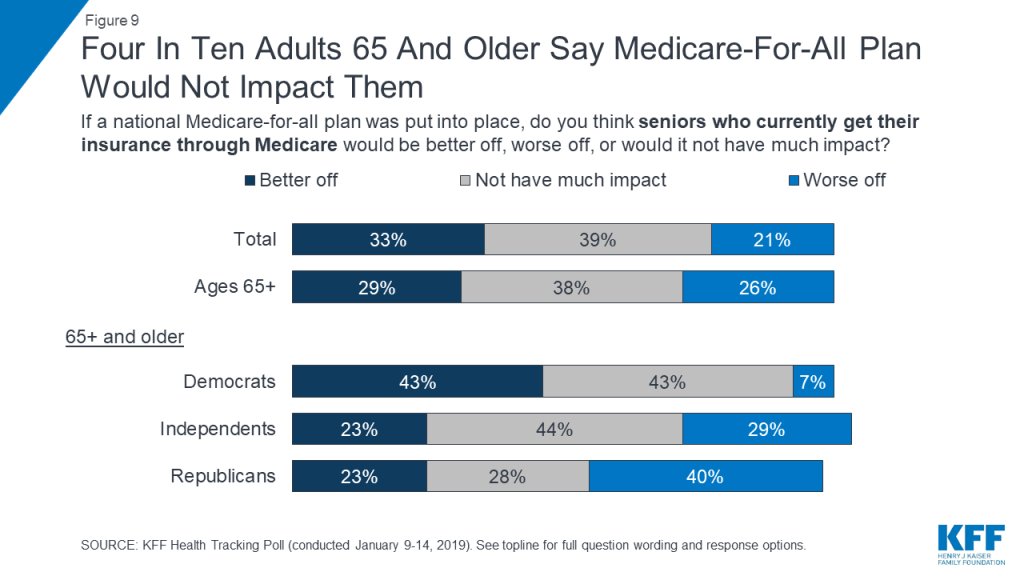
On October 10th, 2018, President Trump wrote an op-ed in USA Today arguing that a Medicare-for-all plan would “end Medicare as we know it and take away benefits they have paid for their entire lives.”3 One-fourth of adults 65 and older (26 percent) say seniors who currently get their insurance through Medicare would be “worse off” if a national Medicare-for-all plan was put into place. Four in ten Republicans, ages 65 and older, say seniors who currently get health coverage through Medicare would be “worse off” under a national Medicare-for-all plan. Overall, a larger share of the public say a Medicare-for-all plan will “not have much impact” on seniors (39 percent) or say that they would be “better off” (33 percent) than say seniors would be “worse off” (21 percent).
Figure 9: Four In Ten Adults 65 And Older Say Medicare-For-All Plan Would Not Impact Them
Democrats Want Democratic Lawmakers to Focus on ACA Rather than Medicare-for-all
Despite the recent attention on proposals to expand Medicare or Medicaid, when asked to choose Democrats would rather the new Democratic majority in the U.S. House of Representatives focus their efforts on “improving and protecting the ACA” rather than “passing a national Medicare-for-all plan.” Half (51 percent) of Democrats say House Democrats should focus on the ACA while four in ten (38 percent) say they should focus on passing a national Medicare-for-all plan. The share of Democrats who want Congress to focus on passing a national Medicare-for-all plan is down 10 percentage points from March 2018.
Figure 10: Democrats Want House Democrats To Focus On Improving And Protecting The ACA Rather Than Passing Medicare-For-All
Partisans Have different health priorities for Congress, Except for Prescription Drug Prices
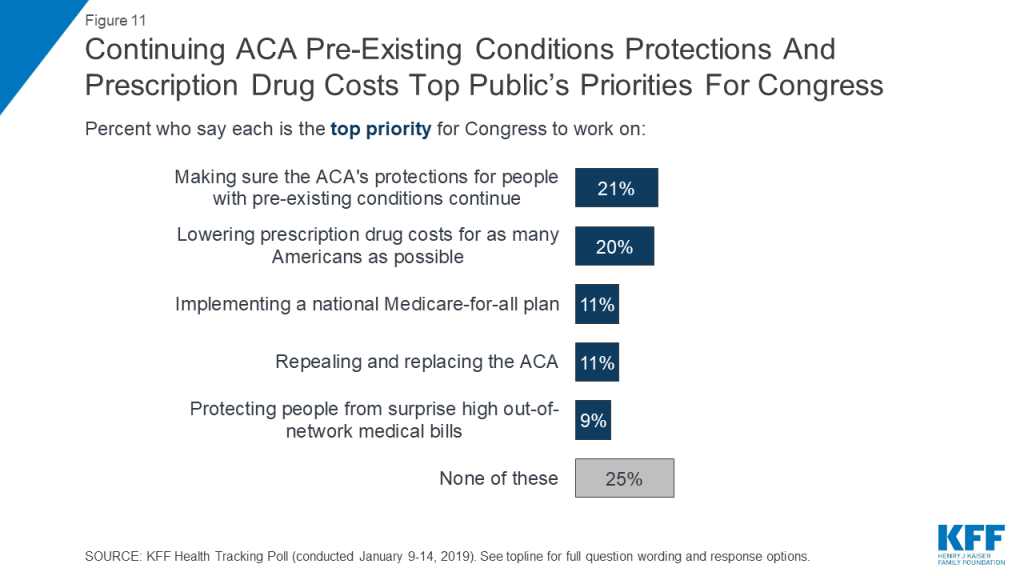
A majority of the public say it is either “extremely important” or “very important” that Congress work on lowering prescription drug costs for as many Americans as possible (82 percent), making sure the ACA’s protections for people with pre-existing health conditions continue (73 percent), and protecting people with health insurance from surprise high out-of-network medical bills (70 percent). Fewer – about four in ten – say repealing and replacing the ACA (43 percent) and implementing a national Medicare-for-all plan (40 percent) are an “extremely important” or “very important” priority. When forced to choose the top Congressional health care priorities, the public chooses continuing the ACA’s pre-existing condition protections (21 percent) and lowering prescription drug cost (20 percent) as the most important priorities for Congress to work on. Smaller shares choose implementing a national Medicare-for-all plan (11 percent), repealing and replacing the ACA (11 percent), or protecting people from surprise medical bills (9 percent) as a top priority. One-fourth said none of these health care issues was their top priority for Congress to work on.
Figure 11: Continuing ACA Pre-Existing Conditions Protections And Prescription Drug Costs Top Public’s Priorities For Congress
Continuing the ACA’s pre-existing condition protections is the top priority for Democrats (31 percent) and ranks among the top priorities for independents (24 percent) along with lowering prescription drug costs, but ranks lower among Republicans (11 percent). Similar to previous KFF Tracking Polls, repealing and replacing the ACA remains one of the top priority for Republicans (27 percent) along with prescription drug costs (20 percent).
Table 1: Pre-Existing Condition Protections and Prescription Drug Costs Top Public’s Health Care Priorities for Congress; Republicans Still Focused on ACA Repeal
Percent who say the following is the top priority for Congress to work on:
Total
Democrats
Independents
Republicans
Making sure the ACA’s pre-existing condition protections continue
21%
31%
24%
11%
Lowering prescription drug costs for as many Americans as possible
20
20
20
20
Implementing a national Medicare-for-all plan
11
20
8
3
Repealing and replacing the ACA
11
3
7
27
Protecting people from surprise high out-of-network medical bills
9
4
10
8
Note: If more than one priority was chosen as “extremely important,” respondent was forced to choose which priority was the “most important.”
The Role of Independents in the Democratic Health Care Debate
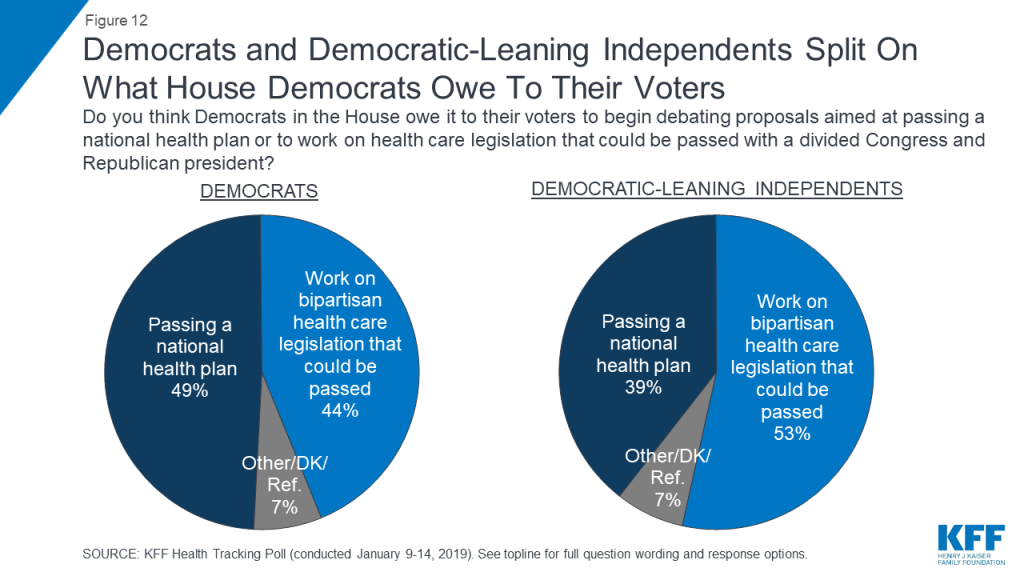
One of the major narratives coming out of the 2018 midterm elections was the role that health care was playing in giving Democratic candidates the advantage in close Congressional races. Consistently throughout the election cycle, KFF polling found health care as the top campaign issue for both Democratic and independent voters. While a majority of Democrats want the new Democratic majority in the U.S. House of Representatives to focus on improving and protecting the ACA, Democratic-leaning independents have more divided opinions of the future of 2010 health care law. These individuals – who tend to be younger and male – would rather Democrats in Congress focus efforts on passing a national Medicare-for-all plan (54 percent) than improving the ACA (39 percent) – which is counter to what Democrats overall report. In addition, when asked whether House Democrats owe it to their voters to begin debating proposals aimed at passing a national health plan or work on health care legislation that can be passed with a divided Congress and a Republican President, Democrats are divided (49 percent v. 44 percent) while Democratic-leaning independents prioritize House Democrats working on bipartisan health care legislation (53 percent) over debating national health plan proposals (39 percent).
Figure 12: Democrats and Democratic-Leaning Independents Split On What House Democrats Owe To Their Voters
Methodology
This KFF Health Tracking Poll was designed and analyzed by public opinion researchers at the Kaiser Family Foundation (KFF). The survey was conducted January 9th-14th 2019, among a nationally representative random digit dial telephone sample of 1,190 adults ages 18 and older, living in the United States, including Alaska and Hawaii (note: persons without a telephone could not be included in the random selection process). The sample included 278 respondents reached by calling back respondents that had previously completed an interview on the KFF Tracking poll more than nine months ago. Computer-assisted telephone interviews conducted by landline (285) and cell phone (905, including 575 who had no landline telephone) were carried out in English and Spanish by SSRS of Glen Mills, PA. To efficiently obtain a sample of lower-income and non-White respondents, the sample also included an oversample of prepaid (pay-as-you-go) telephone numbers (20% of the cell phone sample consisted of prepaid numbers) as well as a subsample of respondents who had previously completed Spanish language interviews on the SSRS Omnibus poll (n=8). Both the random digit dial landline and cell phone samples were provided by Marketing Systems Group (MSG). For the landline sample, respondents were selected by asking for the youngest adult male or female currently at home based on a random rotation. If no one of that gender was available, interviewers asked to speak with the youngest adult of the opposite gender. For the cell phone sample, interviews were conducted with the adult who answered the phone. KFF paid for all costs associated with the survey.
The combined landline and cell phone sample was weighted to balance the sample demographics to match estimates for the national population using data from the Census Bureau’s 2017 American Community Survey (ACS) on sex, age, education, race, Hispanic origin, and region along with data from the 2010 Census on population density. The sample was also weighted to match current patterns of telephone use using data from the January-June 2018 National Health Interview Survey. The weight takes into account the fact that respondents with both a landline and cell phone have a higher probability of selection in the combined sample and also adjusts for the household size for the landline sample, and design modifications, namely, the oversampling of prepaid cell phones and likelihood of non-response for the re-contacted sample. All statistical tests of significance account for the effect of weighting.
The margin of sampling error including the design effect for the full sample is plus or minus 3 percentage points. Numbers of respondents and margins of sampling error for key subgroups are shown in the table below. For results based on other subgroups, the margin of sampling error may be higher. Sample sizes and margins of sampling error for other subgroups are available by request. Note that sampling error is only one of many potential sources of error in this or any other public opinion poll. Kaiser Family Foundation public opinion and survey research is a charter member of the Transparency Initiative of the American Association for Public Opinion Research.
Consistently, KFF polling has found that slightly more than half of Americans (55 percent) report living in a household with a family member with a pre-existing condition. ↩︎
A new KFF issue brief examines the international and U.S. response to the ongoing Ebola outbreak in the Democratic Republic of Congo, now the second largest ever recorded, as authorities struggle to contain the virus’ spread amid violence in an active combat zone.
Conflict in the Ebola-affected region has impeded the response from the start, but conditions worsened following the DRC’s contested national elections in December. The brief notes the limited U.S. role with restricted deployment of key personnel due to safety concerns.
In this article for The Lancet, KFF’s Joshua Michaud and Kellie Moss, and 11 co-authors examine the varied roles, responsibilities, and approaches of militaries in global health, drawing on examples and case studies across peacetime, conflict, and disaster response environments.
The article reviews the militaries’ capabilities to promote global health goals, including research, surveillance, medical expertise and the rapid, large-scale deployment for logistics, transportation, and security. It examines limitations, including the strategic, operational, and tactical objectives that support their security and defense missions but can conflict with humanitarian and global health objectives. The article also summarizes policies that can help close the gap between military and civilian actors and catalyze the contributions of all participants in order to enhance global health.
The article was published online on January 17, 2019, and is part of a special section on security and global health in The Lancet. To access the article at no charge, register for an online account at The Lancet.
In addition to KFF’s Joshua Michaud and Kellie Moss, the article’s other coauthors are Derek Licina of the U.S. Army/Regional Health Command-Pacific; Ron Waldman of the Milken Institute School of Public Health, George Washington University; Adam Kamradt-Scott of University of Sydney; Maureen Bartee, of the U.S. Centers for Disease Control and Prevention; Matthew Lim of the U.S. Naval Medical Research Center; Jamie Williamson of the International Committee of the Red Cross; Frederick Burkle of the Harvard Humanitarian Initiative, Harvard T.H.Chan School of Public Health; Christina Polyak of the U.S. Military HIV Research Program/The Henry Jackson Foundation; Nick Thomson of Johns Hopkins University/University of Melbourne; David L. Heymann of Chatham House/London School of Hygiene and Tropical Medicine; and Louis Lillywhite of Chatham House.
The Society of Actuaries and KFF have partnered together to address the rising cost of health care in the United States through Initiative 18/11. The title reflects data showing the U.S. spends roughly 18% of its gross domestic product on health care, while the rest of the developed world spends roughly 11%.
More than 30 thought leaders from throughout the health care community gathered at KFF’s Washington DC offices on March 7, 2018, for the initiative’s inaugural event. This conference report details that day’s event and outlines next steps for Initiative 18|11.
In November 2018, the Centers for Medicare and Medicaid Services (CMS) released new Medicaid and Children’s Health Insurance Program (CHIP) application processing time data, which show how quickly states are completing eligibility determinations.1 The Affordable Care Act (ACA) established streamlined Medicaid and CHIP enrollment and renewal processes that utilize electronic data matches to verify eligibility, facilitating individuals’ ability to access and maintain coverage and providing opportunities for administrative improvements in states. This brief analyzes the CMS application processing time data and uses the 2018 Kaiser Family Foundation survey of state Medicaid and CHIP eligibility and enrollment policies to examine selected eligibility and enrollment policies by application processing time.2 It finds:
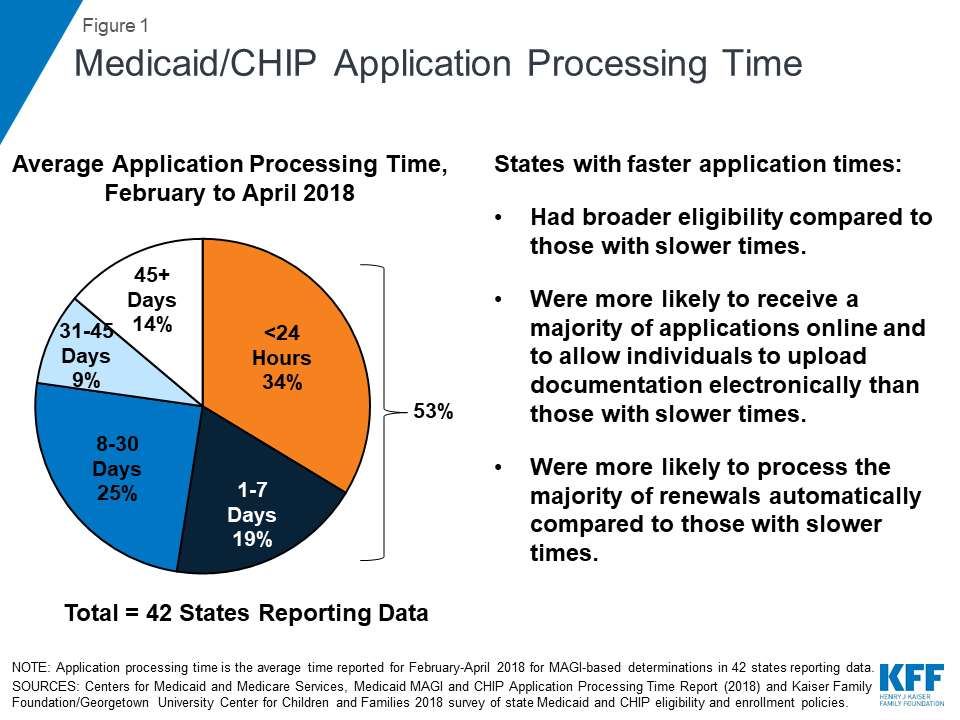
Across the 42 states reporting data for February to April 2018, on average, over half (53%) of applications were processed within 7 days, including over a third (34%) processed in real-time (less than 24 hours) (Figure 1).
The ACA required states to streamline and updgrade their Medicaid eligibility and enrollment systems. Across 42 states reporting data, on average 53% of applications were processed within 7 days, including 34% that were processed in less than 24 hours.
States varied in how quickly they processed applications. On average, states that adopted the ACA Medicaid expansion processed applications faster than non-expansion states.
States with faster application processing generally had broader eligibility compared to slower states. They also were more likely to receive most of their applications online and to allow individuals to upload documentation electronically, which may facilitate faster application processing. Further, likely reflecting effective electronic data matching capabilities, states with faster application processing also were more likely to process the majority of renewals automatically.
Figure 1: Medicaid/CHIP Application Processing Time
States’ ability to make real-time eligibility determinations illustrates the significant progress achieved in streamlining and modernizing enrollment under the ACA. However, there remains significant variation across states and opportunities for continued improvement. Recent waivers in some states to add eligibility and enrollment restrictions, including work reporting requirements, could reverse the progress achieved in streamlining enrollment, resulting in additional barriers to coverage and coverage losses.
Background
In addition to expanding coverage through the Medicaid expansion and Health Insurance Marketplaces, the ACA established streamlined Medicaid eligibility and enrollment policies3 and coordinated application and enrollment processes for Medicaid, CHIP and the Marketplaces. Through these streamlined policies and significant federal and state investments in technology, states have adopted a single streamlined application for health coverage programs, implemented online and telephone applications, and increased use of electronic data matching to verify data in lieu of requiring paper documentation, such as paystubs, from individuals. These changes support faster and, in some cases, real-time eligibility determinations and automated renewals, facilitating individuals’ ability to access and maintain coverage and providing opportunities for states to realize administrative efficiencies and increased accuracy of determinations and renewals. The technology upgrades also provided new opportunities to improve data collection and reporting capacity.
Capitalizing on the improved data reporting potential arising from eligibility system upgrades, in 2013, CMS established a new set of Medicaid and CHIP Eligibility and Enrollment Performance Indicators intended to facilitate data-driven program management and improvement.4 However, states faced challenges producing data consistent with the reporting requirements, since many had already completed their system builds by the time CMS released the measures or were still operating on older legacy systems.5 Since October 2013, CMS has been publishing monthly Medicaid and CHIP Application, Eligibility Determinations and Enrollment reports that include a subset of the performance indicators, including the number of applications submitted, the number of eligibility determinations made, and the number of individuals enrolled in Medicaid and CHIP. 6 The quality and completeness of these data have improved over time as states have continued to refine their eligibility systems and reporting capabilities. In November 2018, CMS released the first Medicaid MAGI and CHIP Application Processing Time Report, which it describes as the first in a series of periodic updates.7 These new data on application processing time mark continued progress in reporting of the performance indicators. However, there are remaining indicators that CMS has not yet reported.
The new report includes data on Medicaid/CHIP application processing time for Modified Adjusted Gross Income (MAGI)-based determinations between February and April 2018 for 42 states. It defines application processing time as the number of calendar days that elapsed between the date that the state agency received an initial application and the date of final eligibility determination.8 Under federal rules, states have up to 45 days to make eligibility determinations for MAGI groups, which include children, pregnant women, parents and expansion adults. CMS notes that application processing time data are constantly changing and influenced by state policies and practices and external factors, including application volume and state policy and practices around verification of information, staffing and the level of automation in a state’s eligibility system.
Findings
Application Processing Time
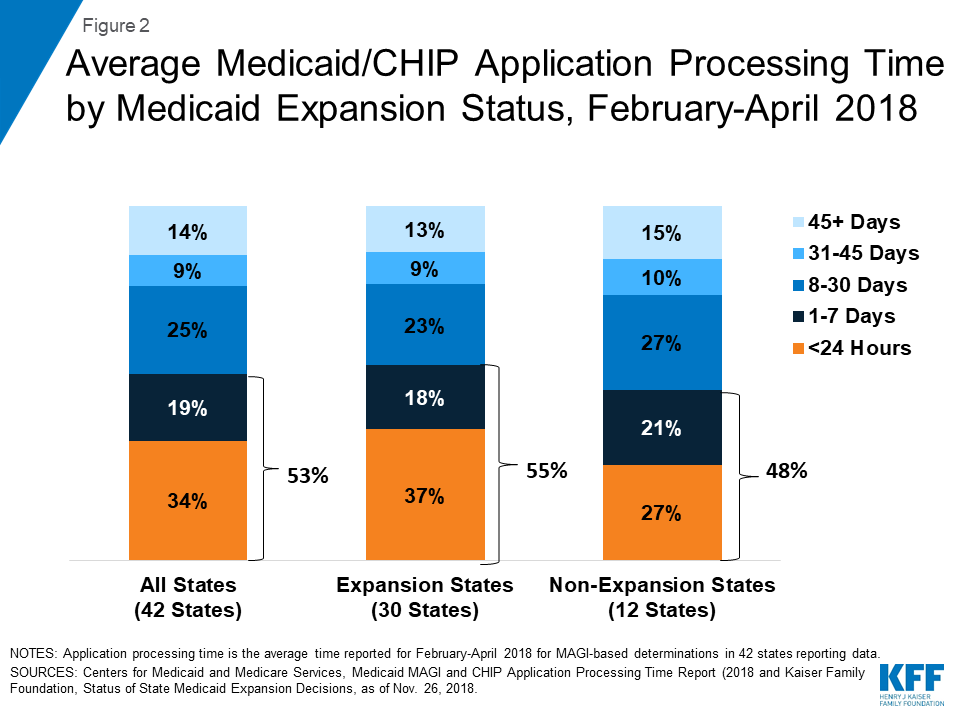
The CMS report shows that, among the 42 states reporting data for February to April 2018, the average share of applications processed in less than 7 days was 53%, including an average of 34% processed in less than 24 hours (Figure 2).9 On average, states processed 14% of applications in over 45 days, beyond the timeframe specified under federal rules. Application processing time varied widely across states (Appendix Table 1).
Figure 2: Average Medicaid/CHIP Application Processing Time by Medicaid Expansion Status, February-April 2018
On average, states that adopted the ACA Medicaid expansion reported faster application processing times compared to non-expansion states (Figure 2). Among the 30 expansion states reporting data, the average share of applications processed in less than 7 days was 55%, including an average of 37% processed in less than 24 hours. In the 12 non-expansion states reporting data, the average share of applications processed in less than 7 days was 48%, including an average of 27% processed in less than 24 hours.
Eligibility and Enrollment Policies and Processes
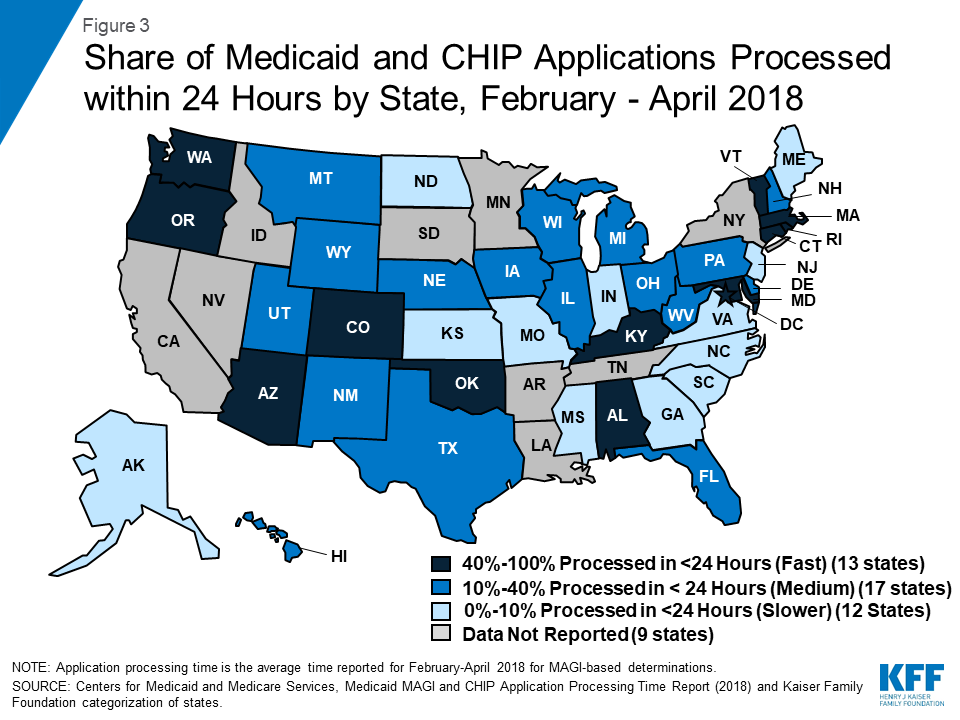
We classified states as having fast, medium, or slower application processing times based on the average share of applications processed within less than 24 hours between February and April 2018 (Figure 3). There were 13 fast states that processed more than 40% of applications in less than 24 hours, 17 medium states that processed 10%-40% of applications in less than 24 hours, and 12 slower states that processed less than 10% of applications in less than 24 hours. We then used data from the 2018 Kaiser Family Foundation national survey of Medicaid and CHIP eligibility and enrollment policies to examine selected eligibility and enrollment policies by states’ application processing time (Appendix Table 2).
Figure 3: Share of Medicaid and CHIP Applications Processed within 24 Hours by State, February – April 2018
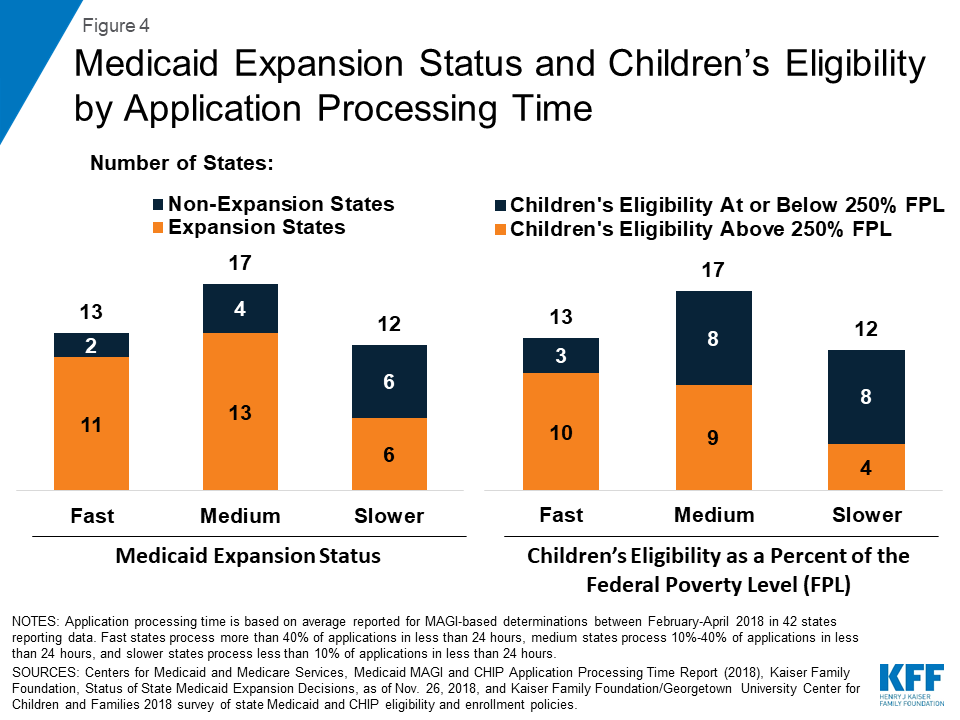
States that had fast or medium application processing times generally had broader eligibility than slower states. The majority of states with fast or medium application processing times have adopted the ACA Medicaid expansion to adults and expanded children’s Medicaid/CHIP eligibility to above 250% FPL (Figure 4). In contrast, among the 12 slower states, only half (6) have adopted the Medicaid expansion, and four have expanded children’s eligibility to above 250% FPL.
Figure 4: Medicaid Expansion Status and Children’s Eligibility by Application Processing Time
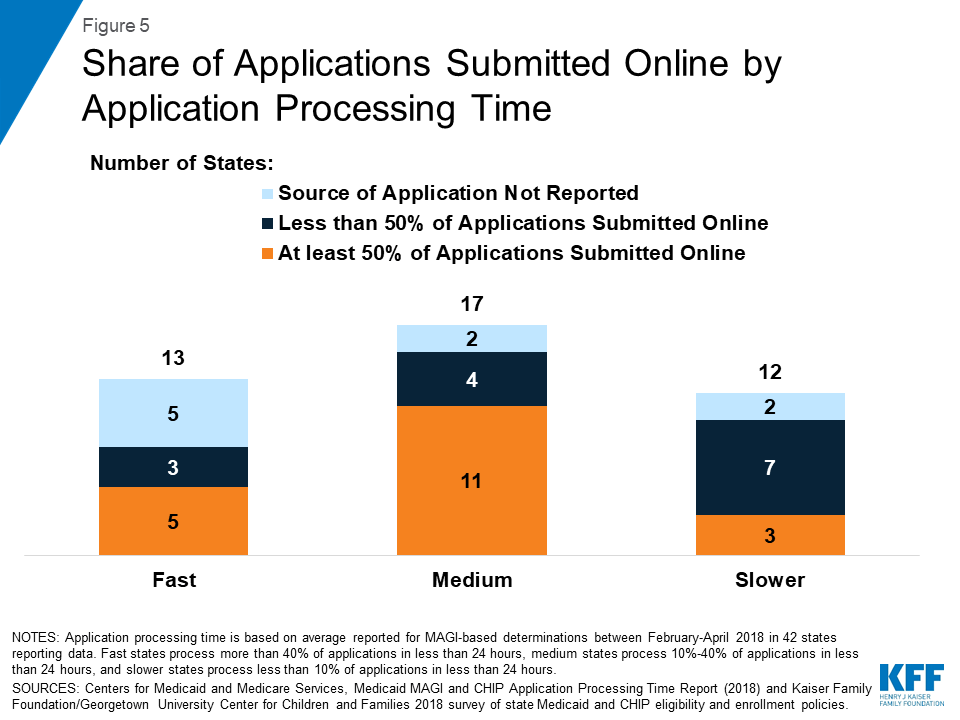
The majority of states with fast or medium application processing times reported receiving at least half of their applications online among those reporting data on mode of application (Figure 5). In the ten slower states reporting data on mode of application, three indicated that they receive more than half of applications online.
Figure 5: Share of Applications Submitted Online by Application Processing Time
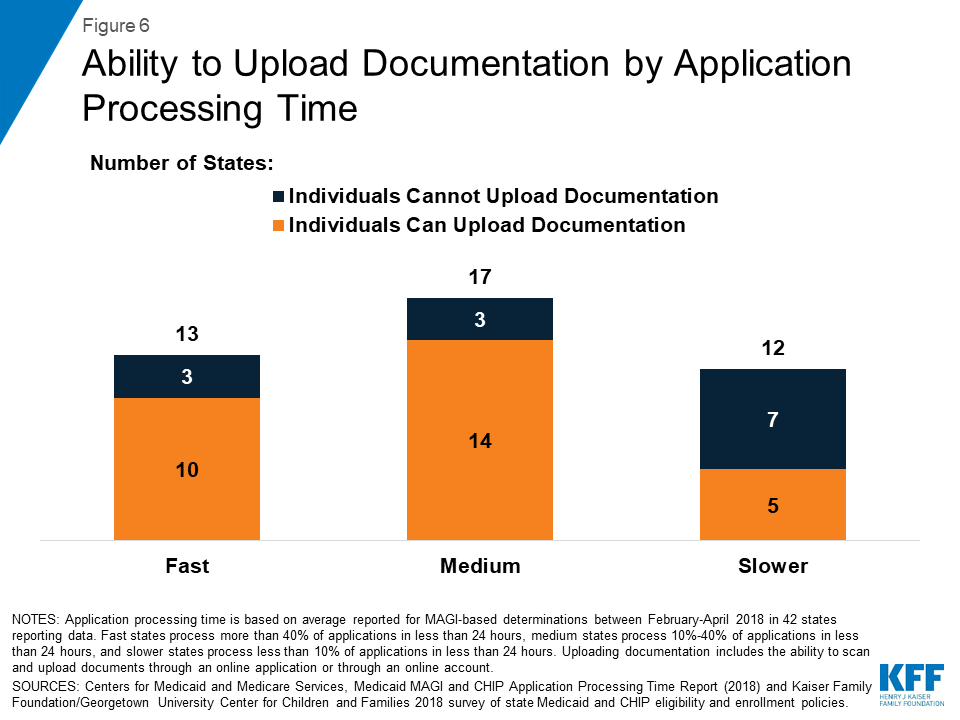
Most states with fast and medium application processing times allow individuals to upload required documents electronically as part of the online application or through an online account (Figure 6). Among the 12 slower states, 5 provide options for individuals to upload documentation electronically.
Figure 6: Ability to Upload Documentation by Application Processing Time
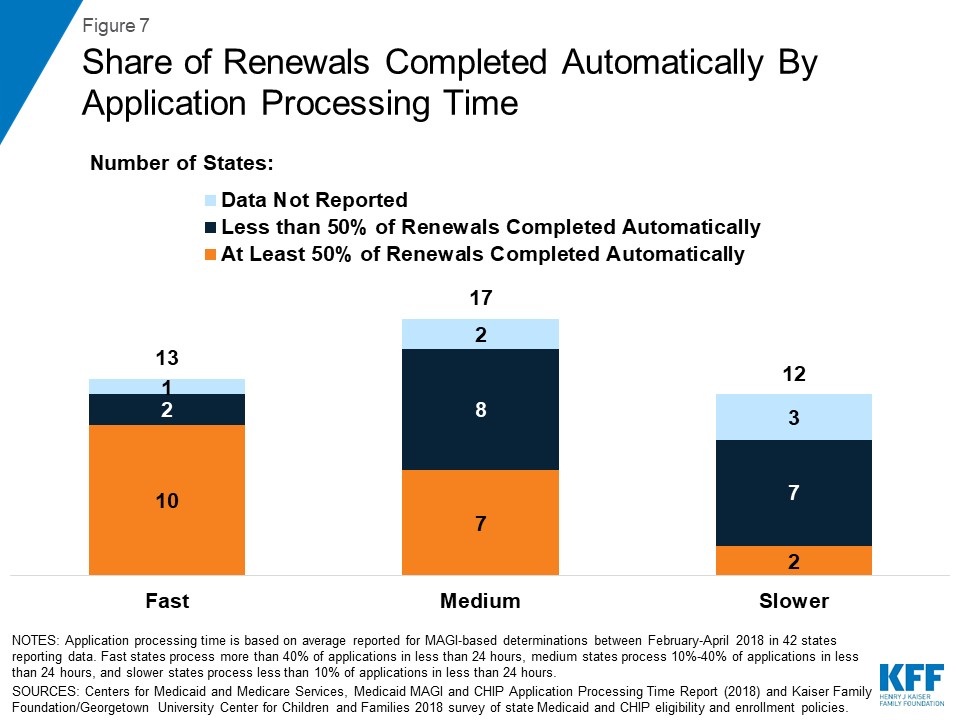
States with faster application processing times also were more likely to report completing most renewals automatically. Most states that had fast application processing time reported completing at least half of their renewals automatically (Figure 7). Less than half of states with medium processing time who reported data on automated renewals reported that they complete the majority of their renewals automatically, and only 2 of the 9 slower states that reported data on automated renewals reported completing more than half of renewals automatically.
Figure 7: Share of Renewals Completed Automatically By Application Processing Time
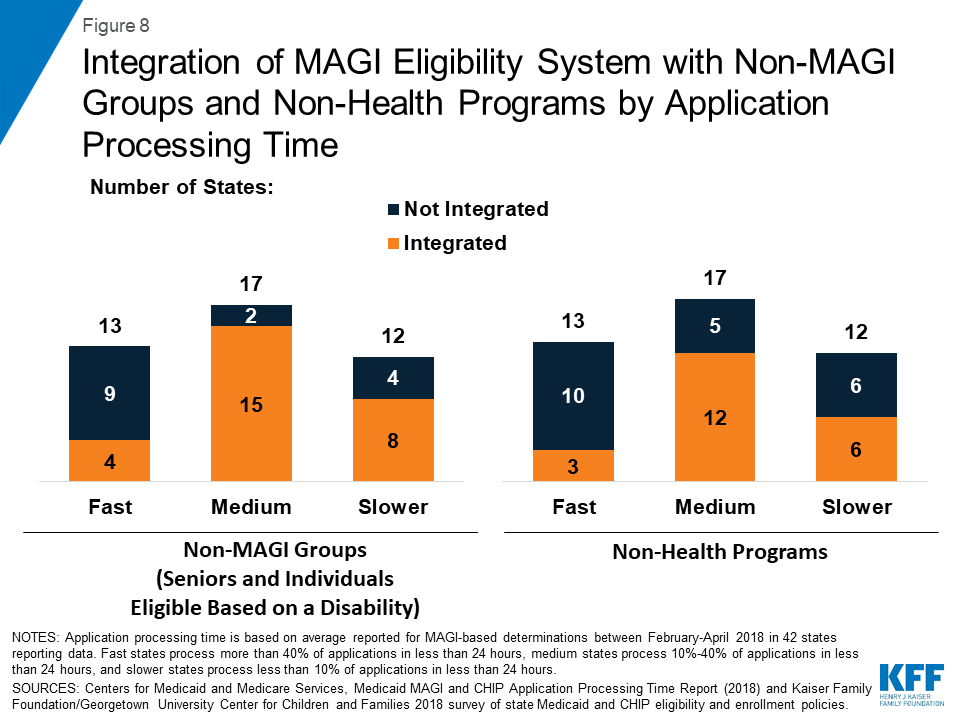
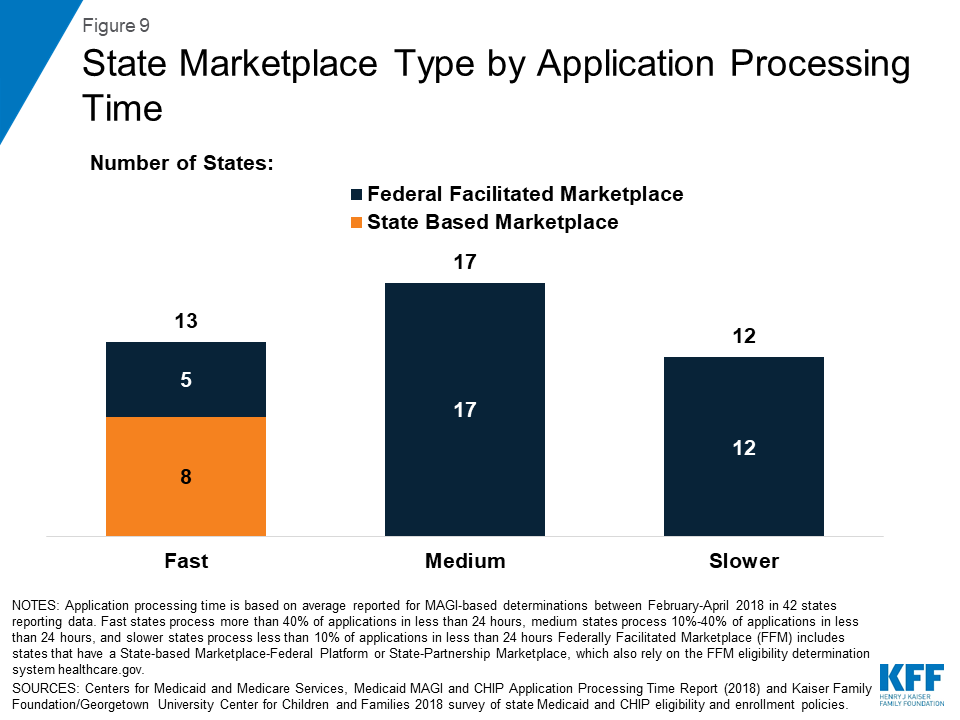
Few states with fast application processing times had their MAGI Medicaid eligibility determination system integrated with non-MAGI groups or non-health programs, and most had a state-based Marketplace (SBM) (Figures 8 and 9). A larger share of states with medium and slower application processing times had their MAGI Medicaid eligibility systems integrated with non-MAGI groups and/or non-health programs, and all of these states rely on the Federally-Facilitated Marketplace (FFM, healthcare.gov) for eligibility determinations. This variation reflects differing approaches states took to upgrade processes and systems in response to the ACA. Prior to the ACA, states’ eligibility systems generally included all Medicaid groups and most included non-health programs, such as Temporary Assistance for Needy Families (TANF) and Supplemental Nutrition Assistance Program (SNAP).10 The ACA required states to use a new MAGI-based financial methodology to determine Medicaid eligibility for pregnant women, children, parents, and expansion adults, to apply streamlined eligibility and enrollment processes to MAGI groups, and to align and coordinate MAGI eligibility determinations and enrollment with the Marketplaces. States continue to apply their pre-ACA financial eligibility methodologies to non-MAGI groups (seniors and individuals eligible based on a disability) and have the option to apply some of the streamlined processes to non-MAGI groups. To implement the ACA policies, some states separated MAGI eligibility determinations from non-MAGI groups and non-health programs, often integrating them into newly built SBM systems. Others did not separate MAGI groups from other groups or programs when they upgraded their systems. Over the past few years, a number of states have reintegrated non-MAGI groups and non-health programs into their upgraded systems, and states continue to focus on reintegration as they refine their systems.11
Figure 8: Integration of MAGI Eligibility System with Non-MAGI Groups and Non-Health Programs by Application Processing TimeFigure 9: State Marketplace Type by Application Processing Time
Conclusion
In November 2018, CMS released new state data on MAGI Medicaid and CHIP application processing time. These data reflect continued progress in reporting of performance indicators that CMS established in 2013 to facilitate data-driven program management and improvement. The data show that, across the 42 states reporting data for February to April 2018, on average, over half (53%) of applications were processed within 7 days, including over a third (34%) processed in less than 24 hours.
There was significant variation across states in how quickly they process applications. States with faster application processing generally had broader eligibility compared to those with slower application processing. They also were more likely to receive the majority of their applications online and allow individuals to upload documentation electronically, which may facilitate faster application processing. Further, consistent with their ability to process applications quickly, they also were more likely to process the majority of renewals automatically, likely reflecting effective electronic data matching capabilities. States with faster application processing times were less likely than states with medium or slower application processing times to have their MAGI Medicaid eligibility systems integrated with non-MAGI groups (seniors and individuals eligible based on a disability) or non-health programs. This variation reflects states’ differing approaches to upgrade systems and processes in response to the ACA eligibility determination and enrollment policies, which vary for MAGI and non-MAGI groups. A number of states plan to reintegrate non-MAGI groups and non-health programs into their upgraded systems in the future, which may contribute to improvements in processing of eligibility determinations for other groups and programs and facilitate access to services for individuals.12
The ability for states to make real-time eligibility determinations, as demonstrated by these new data, illustrates the significant progress states have made in streamlining and automating enrollment processes under the ACA. Through the ACA’s streamlined policies and state efforts, the Medicaid enrollment and renewal experience has moved from a paper-based, manual process that could take days and weeks in some states to a modernized, technology-driven approach that can happen in real-time through electronic data matches to verify eligibility criteria.13 These changes facilitate individuals’ ability to access and maintain coverage and provide opportunities for states to realize administrative efficiencies and increase accuracy of determinations and renewals. However, there remains significant variation across states in application processing time, and continued opportunities for improvement to ensure states complete all MAGI eligibility determinations within 45 days, as required under federal rules. Recent waivers in some states to add eligibility and enrollment restrictions, including work reporting requirements, could reverse the progress achieved in streamlining enrollment, resulting in additional barriers to coverage and coverage losses.
Appendix
Appendix Table 1: Application Processing Time by State
State
Average Share of Applications Processed by Time, February – April 2018
Appendix Table 2: Eligibility and Enrollment Policies and Processes by Application Processing Time
State
Adopted ACA Medicaid Expansion?
Children’s Eligibility
Upload Documents
MAGI system integrated with:
Marketplace Type
% Renewals that are Automated
Non-MAGI Groups
Non-Health Programs
Fast (>40% of Applications Processed in Less than 24 Hours)
Alabama
No
317%
No
No
No
FFM
75%+
Arizona
Yes
205%
Yes
Yes
No
FFM
50-75%
Colorado
Yes
265%
Yes
Yes
Yes
SBM
75%+
Connecticut
Yes
323%
Yes
No
No
SBM
50-75%
District of Columbia
Yes
324%
Yes
No
No
SBM
75%+
Kentucky
Yes
218%
Yes
Yes
Yes
SBM-FP
50-75%
Maryland
Yes
322%
Yes
No
No
SBM
50-75%
Massachusetts
Yes
305%
No
No
No
SBM
<25%
Oklahoma
No
210%
Yes
No
No
FFM
25-50%
Oregon
Yes
305%
Yes
No
No
SBM-FP
NR
Rhode Island
Yes
266%
Yes
Yes
Yes
SBM
75%+
Vermont
Yes
317%
No
No
No
SBM
50-75%
Washington
Yes
317%
Yes
No
No
SBM
50-75%
Medium (10% – 40% of Applications Processed in Less than 24 Hours)
Delaware
Yes
217%
No
Yes
Yes
Partnership
<25%
Florida
No
215%
Yes
Yes
No
FFM
25-50%
Hawaii
Yes
313%
Yes
Yes
No
FFM
50-75%
Illinois
Yes
318%
Yes
Yes
Yes
Partnership
<25%
Iowa
Yes
380%
No
No
No
Partnership
50-75%
Michigan
Yes
217%
Yes
No
No
Partnership
75%+
Montana
Yes
266%
Yes
Yes
Yes
FFM
50-75%
Nebraska
Yes
218%
Yes
Yes
Yes
FFM
<25%
New Hampshire
Yes
323%
Yes
Yes
Yes
Partnership
<25%
New Mexico
Yes
305%
Yes
Yes
Yes
SBM-FP
50-75%
Ohio
Yes
211%
Yes
Yes
Yes
FFM
75%+
Pennsylvania
Yes
319%
Yes
Yes
Yes
FFM
<25%
Texas
No
206%
Yes
Yes
Yes
FFM
NR
Utah
Yes
205%
Yes
Yes
Yes
FFM
50-75%
West Virginia
Yes
305%
No
Yes
Yes
Partnership
<25%
Wisconsin
No
306%
Yes
Yes
Yes
FFM
<25%
Wyoming
No
205%
Yes
Yes
No
FFM
NR
Slower (<10% of Applications Processed in Less than 24 Hours)
Alaska
Yes
208%
No
No
No
FFM
NR
Georgia
No
252%
Yes
Yes
Yes
FFM
<25%
Indiana
Yes
262%
No
Yes
Yes
FFM
50-75%
Kansas
No
241%
Yes
Yes
Yes
FFM
25-50%
Maine
Yes
213%
No
Yes
Yes
FFM
NR
Mississippi
No
214%
Yes
Yes
No
FFM
25-50%
Missouri
No
305%
No
No
No
FFM
<25%
New Jersey
Yes
355%
No
Yes
No
FFM
<25%
North Carolina
No
216%
No
Yes
Yes
FFM
50-75%
North Dakota
Yes
175%
Yes
No
No
FFM
NR
South Carolina
No
213%
No
No
No
FFM
25-50%
Virginia
Yes
205%
Yes
Yes
Yes
FFM
25-50%
Notes: NR indicates state did not report data. FFM is the Federally Facilitated Marketplace, SBM-FP is a State-based Marketplace-Federal Platform and Partnership is a State-Partnership Marketplace, which also rely on the FFM eligibility determination system healthcare.gov.Sources: Centers for Medicaid and Medicare Services, Medicaid MAGI and CHIP Application Processing Time Report (2018); Kaiser Family Foundation, Status of State Medicaid Expansion Decisions, Nov. 26, 2018, and Kaiser Family Foundation/Georgetown University Center for Children and Families, Medicaid and CHIP Eligibility, Enrollment, Renewal, and Cost Sharing Policies as of January 2018: Findings from a 50-State Survey (2018),
The data exclude redeterminations, determinations based on changes in circumstances, presumptive eligibility determinations, and final determinations made by the Federally-Facilitated Marketplace (FFM); however, they include states’ final determinations for applications received as an assessment from the FFM. ↩︎
These data represent the averages of the reported share of applications processed within the specified timeframes across states. In its report, CMS reports national totals, which represent the total share of applications processed within the specified timeframes across all reporting states. ↩︎
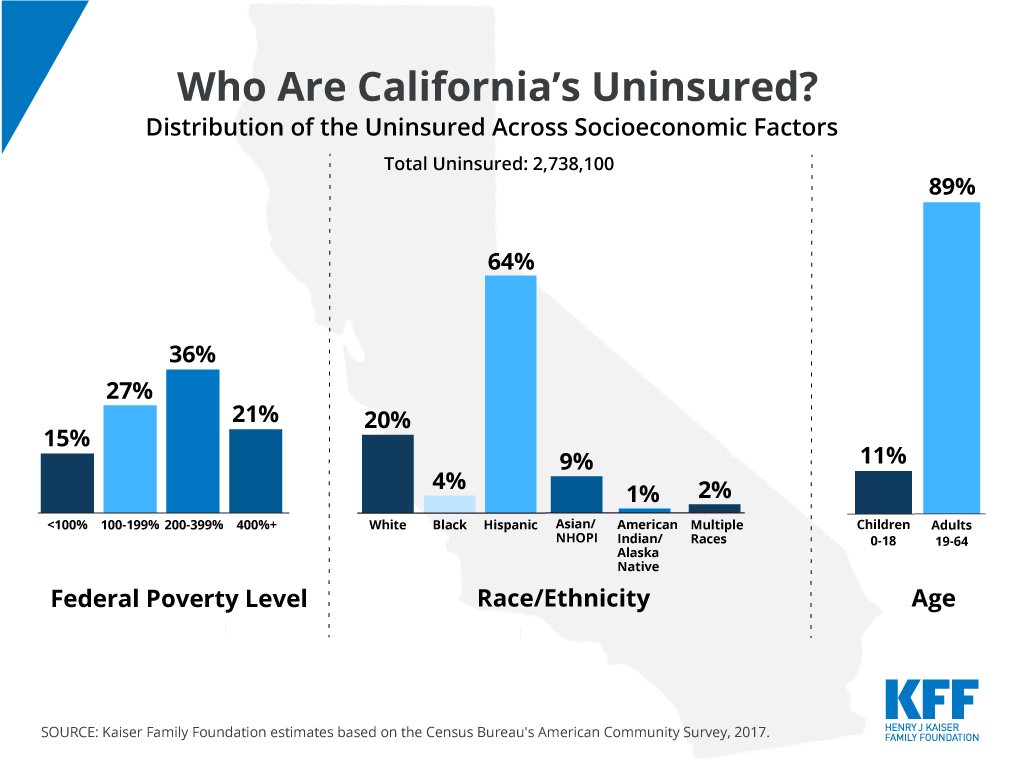
NOTE: Includes nonelderly individuals ages 0 to 64. The US Census Bureau’s poverty threshold for a family with two adults and one child was $19,730 in 2017. NHOPI refers to Native Hawaiians and Other Pacific Islanders. Persons of Hispanic origin may be of any race; all other race/ethnicity groups are non-Hispanic.
California’s newly sworn-in Governor Gavin Newsom announced a proposal for broad changes to the state’s health care system almost immediately after taking the oath of office this week. Those announcements ranged from state plans to negotiate drug prices for Medi-Cal (California’s Medicaid) patients and other state programs and private purchasers to expanding Medi-Cal’s coverage of undocumented immigrants to pursuing greater flexibility from the federal government to implement a single payer system. But plans to increase coverage through an individual mandate in the state and expanding Affordable Care Act (ACA) subsidies to higher incomes build most directly upon the law’s foundation.
Larry Levitt, Senior Vice President for Health Reform at KFF, answers three questions from Chelsea Rice, KFF’s digital strategist, about what these policies could mean for the state and nationwide.
1) Gov. Newsom plans to expand ACA Marketplace subsidies to incomes between 400 and 600% of the federal poverty level to help more individuals afford insurance on California’s state-based insurance exchange. Why is this population being targeted?
Levitt: Middle-class people with incomes greater than 400% of the poverty level — $48,560 for a single person and $100,400 for a family of four — are not eligible for any help paying their premiums under the Affordable Care Act (ACA). This group has borne the brunt of recent premium increases, and some have dropped coverage as a result. In California, people with incomes at or above 400% of the federal poverty level represent 21% of the state’s uninsured. There’s widespread agreement that non-group insurance has been increasingly priced out of reach for the middle-class, but little agreement over what to do about that. Conservatives have advocated loosening up on regulation to bring premiums down. For example, short-term plans expanded by the Trump administration have lower premiums because they don’t cover pre-existing conditions and provide skimpier benefits than ACA plans. Liberals have advocated expanding subsidies to make coverage more affordable, like Gov. Newsom’s proposal.
2) Enacting a state-level individual mandate, Gov. Newsom says, will pay for these expanded subsidies. How would that financing work?
Levitt: A state-level individual mandate – replacing the federal penalty that was repealed beginning this year — would have several effects. First, people who are uninsured would pay a penalty, and those revenues could be used by the state to pay for expanded premium subsidies. Second, it would encourage more people to get insurance. As more people sign up for individual insurance through the ACA marketplace — known as Covered California in the state — the federal cost of premium subsidies will rise. More people might also sign up for Medicaid (known as Medi-Cal in California) and employer coverage. Third, it’s likely that the additional people who sign up for insurance would be healthier than average, which would lead to lower premiums in the state. Insurers reported that they boosted individual market premiums by 6% in 2019 to account for repeal of the federal individual mandate penalty and expansion of short-term plans, both of which are expected to reduce the number of healthy enrollees in the market.
3) How could California’s plan affect the national debate about health reform?
Levitt: Gov. Newsom has proposed expanding coverage to young undocumented adults, increasing ACA subsidies, restoring the individual mandate penalty, and has also called for the federal government to give the state flexibility to move towards a single payer system. This positions him as strong counterpoint to President Trump on health care while covering a proportion of the 7% of Californians who remain uninsured. Interestingly, there may be more agreement on the need to address high prescription drug prices, though maybe not on the specific steps to do that. California is one of several states moving ahead with health reform initiatives as we enter a period of expected gridlock in DC. It’s often the case that states serve as models for each other, and as templates for later national reforms.