How Quickly are States Connecting Applicants to Medicaid and CHIP Coverage?
Summary
In November 2018, the Centers for Medicare and Medicaid Services (CMS) released new Medicaid and Children’s Health Insurance Program (CHIP) application processing time data, which show how quickly states are completing eligibility determinations.1 The Affordable Care Act (ACA) established streamlined Medicaid and CHIP enrollment and renewal processes that utilize electronic data matches to verify eligibility, facilitating individuals’ ability to access and maintain coverage and providing opportunities for administrative improvements in states. This brief analyzes the CMS application processing time data and uses the 2018 Kaiser Family Foundation survey of state Medicaid and CHIP eligibility and enrollment policies to examine selected eligibility and enrollment policies by application processing time.2 It finds:
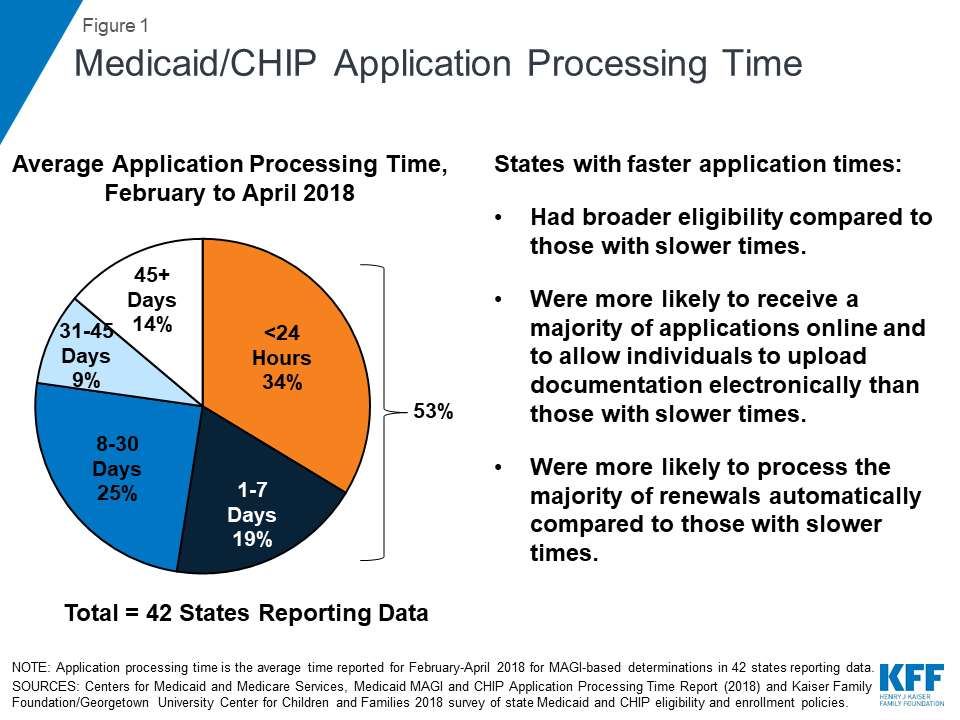
- Across the 42 states reporting data for February to April 2018, on average, over half (53%) of applications were processed within 7 days, including over a third (34%) processed in real-time (less than 24 hours) (Figure 1).
The ACA required states to streamline and updgrade their Medicaid eligibility and enrollment systems. Across 42 states reporting data, on average 53% of applications were processed within 7 days, including 34% that were processed in less than 24 hours.
- States varied in how quickly they processed applications. On average, states that adopted the ACA Medicaid expansion processed applications faster than non-expansion states.
- States with faster application processing generally had broader eligibility compared to slower states. They also were more likely to receive most of their applications online and to allow individuals to upload documentation electronically, which may facilitate faster application processing. Further, likely reflecting effective electronic data matching capabilities, states with faster application processing also were more likely to process the majority of renewals automatically.
States’ ability to make real-time eligibility determinations illustrates the significant progress achieved in streamlining and modernizing enrollment under the ACA. However, there remains significant variation across states and opportunities for continued improvement. Recent waivers in some states to add eligibility and enrollment restrictions, including work reporting requirements, could reverse the progress achieved in streamlining enrollment, resulting in additional barriers to coverage and coverage losses.
Background
In addition to expanding coverage through the Medicaid expansion and Health Insurance Marketplaces, the ACA established streamlined Medicaid eligibility and enrollment policies3 and coordinated application and enrollment processes for Medicaid, CHIP and the Marketplaces. Through these streamlined policies and significant federal and state investments in technology, states have adopted a single streamlined application for health coverage programs, implemented online and telephone applications, and increased use of electronic data matching to verify data in lieu of requiring paper documentation, such as paystubs, from individuals. These changes support faster and, in some cases, real-time eligibility determinations and automated renewals, facilitating individuals’ ability to access and maintain coverage and providing opportunities for states to realize administrative efficiencies and increased accuracy of determinations and renewals. The technology upgrades also provided new opportunities to improve data collection and reporting capacity.
Capitalizing on the improved data reporting potential arising from eligibility system upgrades, in 2013, CMS established a new set of Medicaid and CHIP Eligibility and Enrollment Performance Indicators intended to facilitate data-driven program management and improvement.4 However, states faced challenges producing data consistent with the reporting requirements, since many had already completed their system builds by the time CMS released the measures or were still operating on older legacy systems.5 Since October 2013, CMS has been publishing monthly Medicaid and CHIP Application, Eligibility Determinations and Enrollment reports that include a subset of the performance indicators, including the number of applications submitted, the number of eligibility determinations made, and the number of individuals enrolled in Medicaid and CHIP. 6 The quality and completeness of these data have improved over time as states have continued to refine their eligibility systems and reporting capabilities. In November 2018, CMS released the first Medicaid MAGI and CHIP Application Processing Time Report, which it describes as the first in a series of periodic updates.7 These new data on application processing time mark continued progress in reporting of the performance indicators. However, there are remaining indicators that CMS has not yet reported.
The new report includes data on Medicaid/CHIP application processing time for Modified Adjusted Gross Income (MAGI)-based determinations between February and April 2018 for 42 states. It defines application processing time as the number of calendar days that elapsed between the date that the state agency received an initial application and the date of final eligibility determination.8 Under federal rules, states have up to 45 days to make eligibility determinations for MAGI groups, which include children, pregnant women, parents and expansion adults. CMS notes that application processing time data are constantly changing and influenced by state policies and practices and external factors, including application volume and state policy and practices around verification of information, staffing and the level of automation in a state’s eligibility system.
Findings
Application Processing Time
The CMS report shows that, among the 42 states reporting data for February to April 2018, the average share of applications processed in less than 7 days was 53%, including an average of 34% processed in less than 24 hours (Figure 2).9 On average, states processed 14% of applications in over 45 days, beyond the timeframe specified under federal rules. Application processing time varied widely across states (Appendix Table 1).
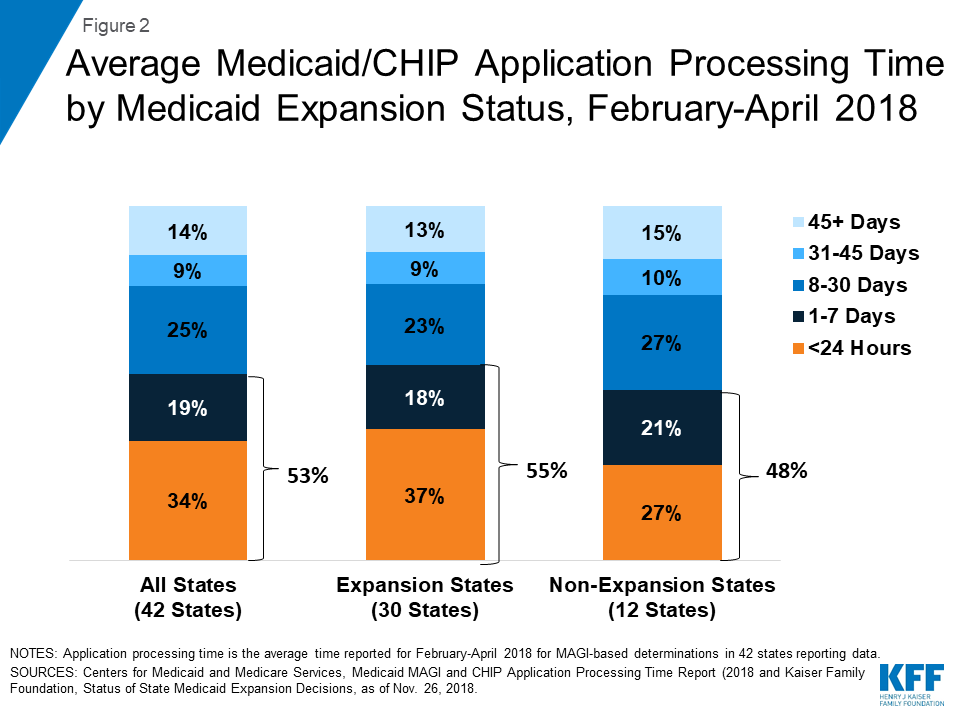
On average, states that adopted the ACA Medicaid expansion reported faster application processing times compared to non-expansion states (Figure 2). Among the 30 expansion states reporting data, the average share of applications processed in less than 7 days was 55%, including an average of 37% processed in less than 24 hours. In the 12 non-expansion states reporting data, the average share of applications processed in less than 7 days was 48%, including an average of 27% processed in less than 24 hours.
Eligibility and Enrollment Policies and Processes
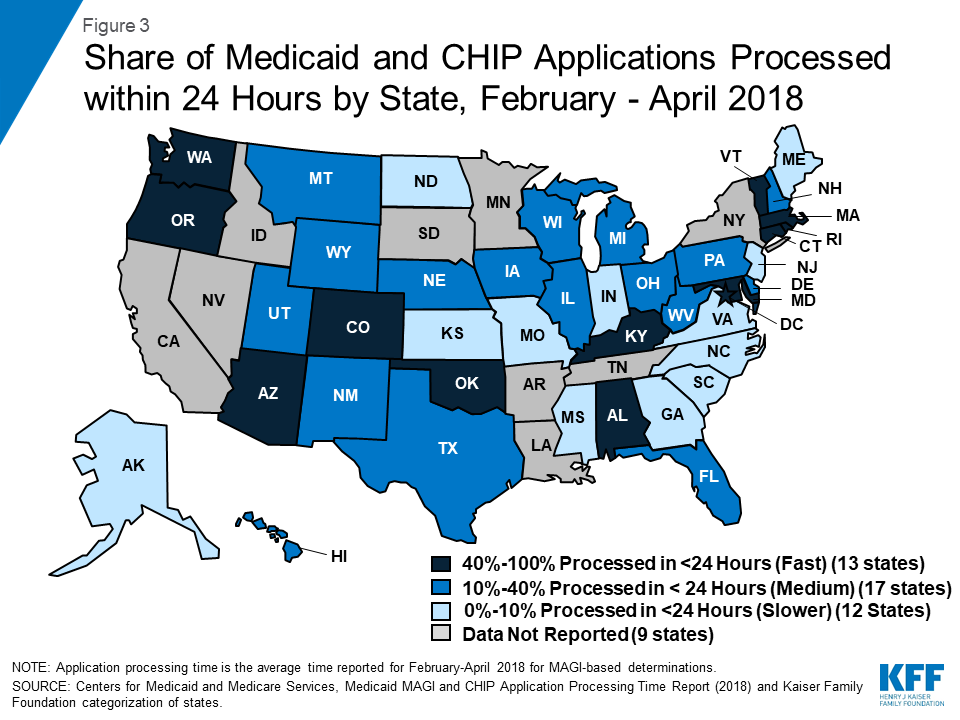
We classified states as having fast, medium, or slower application processing times based on the average share of applications processed within less than 24 hours between February and April 2018 (Figure 3). There were 13 fast states that processed more than 40% of applications in less than 24 hours, 17 medium states that processed 10%-40% of applications in less than 24 hours, and 12 slower states that processed less than 10% of applications in less than 24 hours. We then used data from the 2018 Kaiser Family Foundation national survey of Medicaid and CHIP eligibility and enrollment policies to examine selected eligibility and enrollment policies by states’ application processing time (Appendix Table 2).
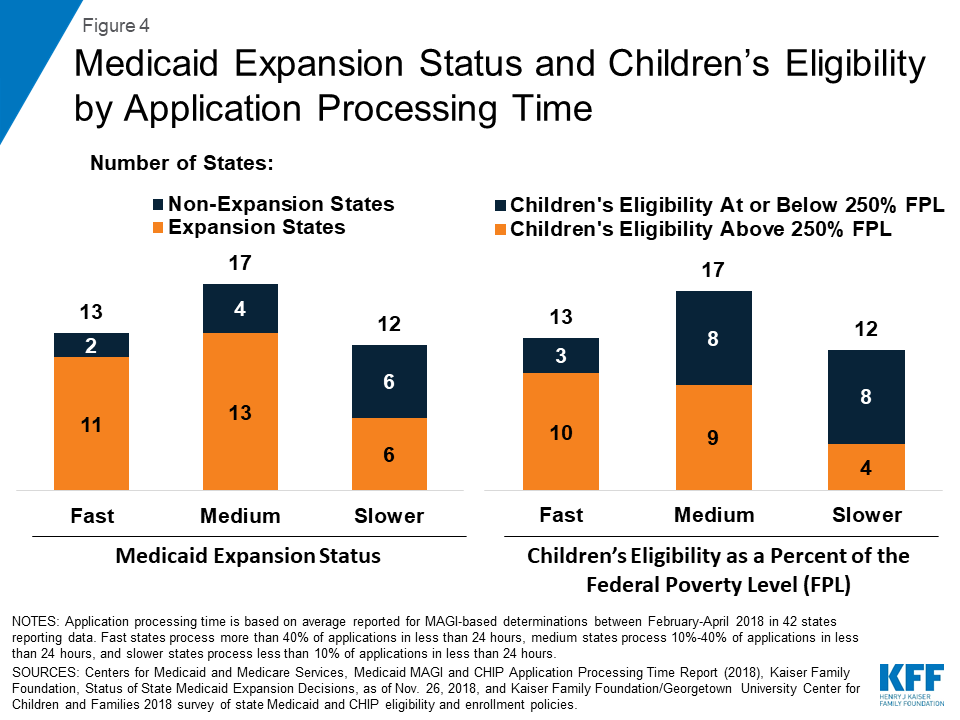
States that had fast or medium application processing times generally had broader eligibility than slower states. The majority of states with fast or medium application processing times have adopted the ACA Medicaid expansion to adults and expanded children’s Medicaid/CHIP eligibility to above 250% FPL (Figure 4). In contrast, among the 12 slower states, only half (6) have adopted the Medicaid expansion, and four have expanded children’s eligibility to above 250% FPL.
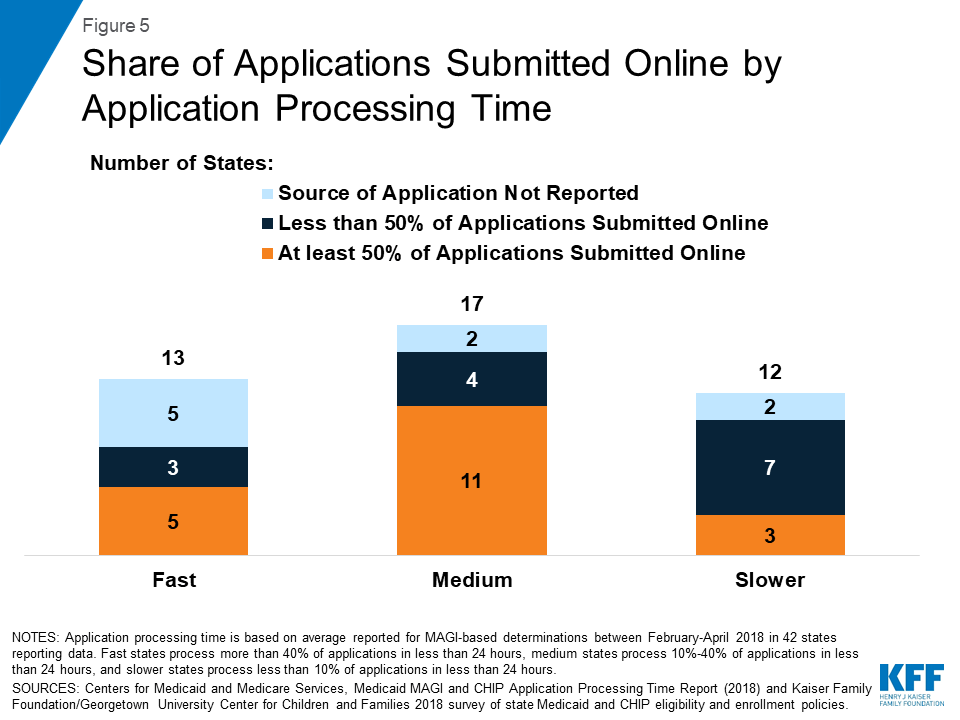
The majority of states with fast or medium application processing times reported receiving at least half of their applications online among those reporting data on mode of application (Figure 5). In the ten slower states reporting data on mode of application, three indicated that they receive more than half of applications online.
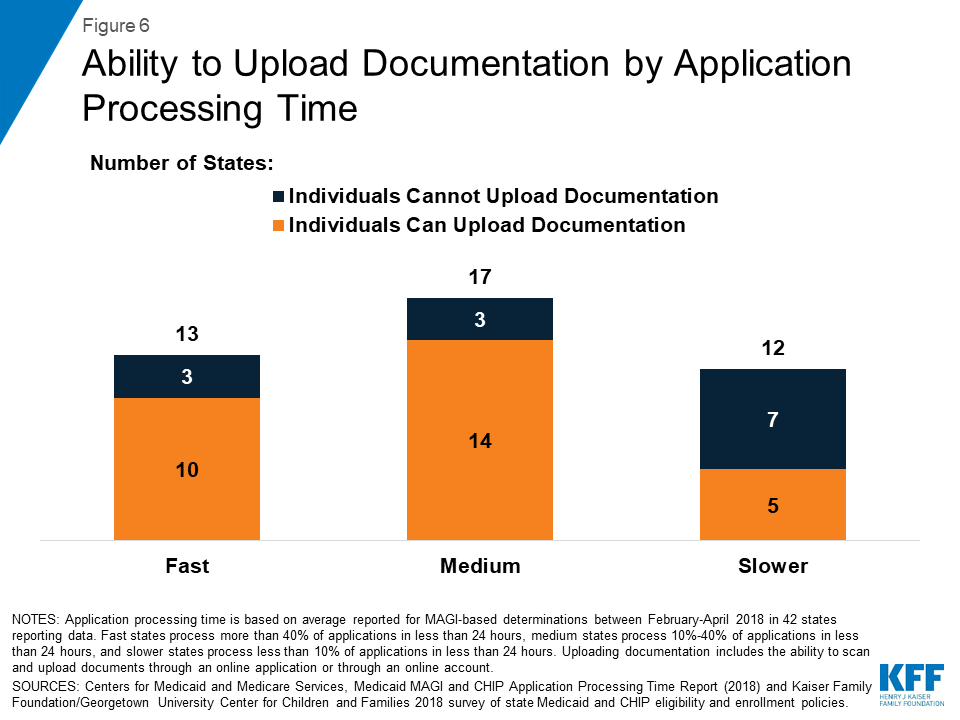
Most states with fast and medium application processing times allow individuals to upload required documents electronically as part of the online application or through an online account (Figure 6). Among the 12 slower states, 5 provide options for individuals to upload documentation electronically.
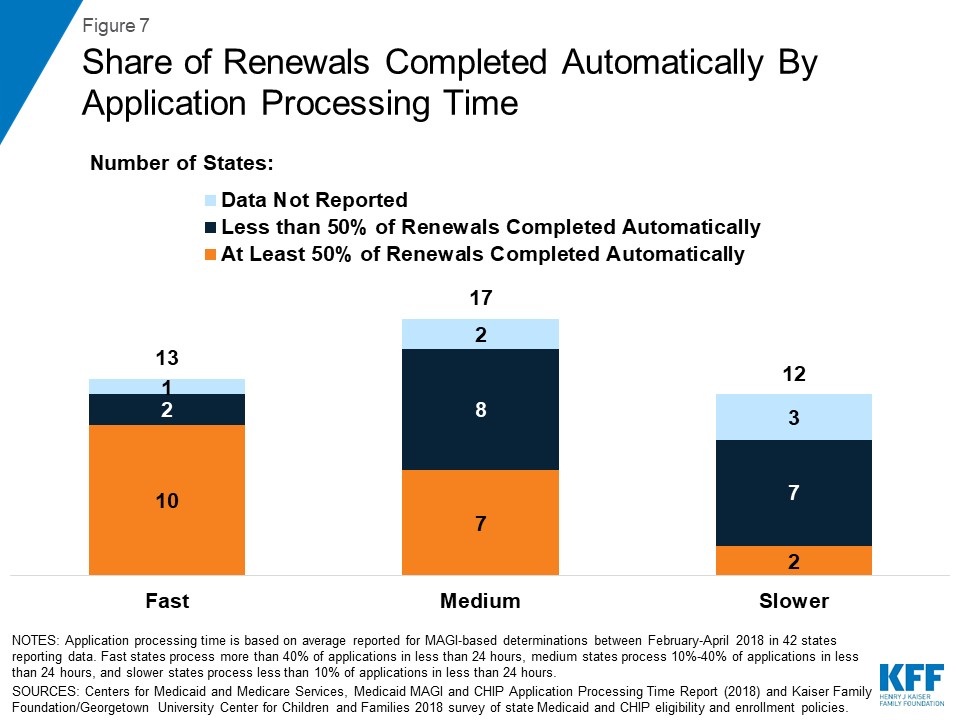
States with faster application processing times also were more likely to report completing most renewals automatically. Most states that had fast application processing time reported completing at least half of their renewals automatically (Figure 7). Less than half of states with medium processing time who reported data on automated renewals reported that they complete the majority of their renewals automatically, and only 2 of the 9 slower states that reported data on automated renewals reported completing more than half of renewals automatically.
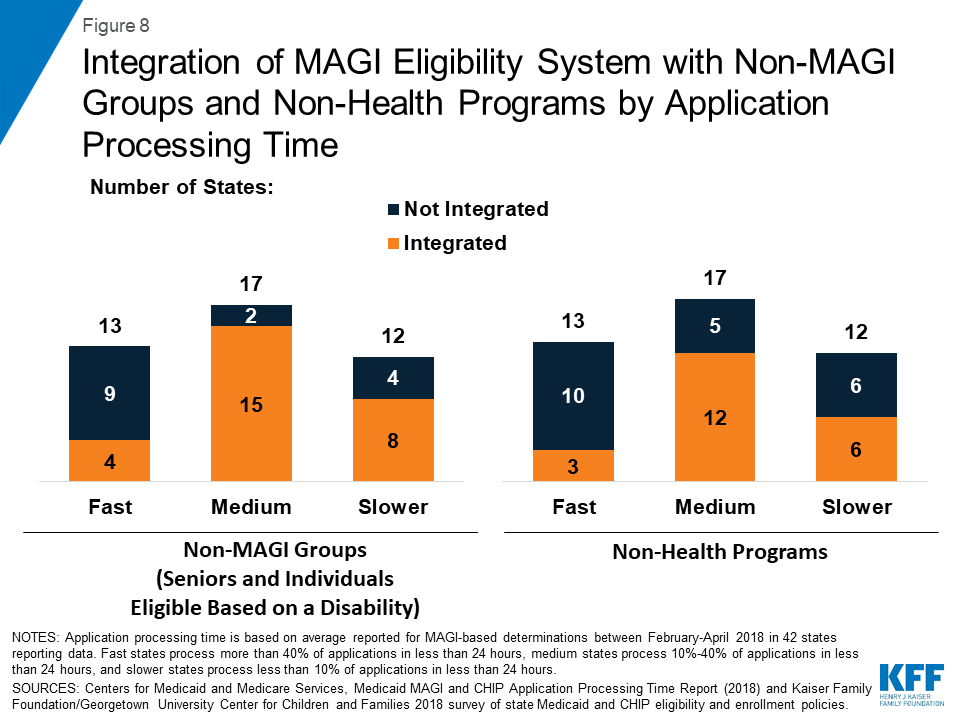
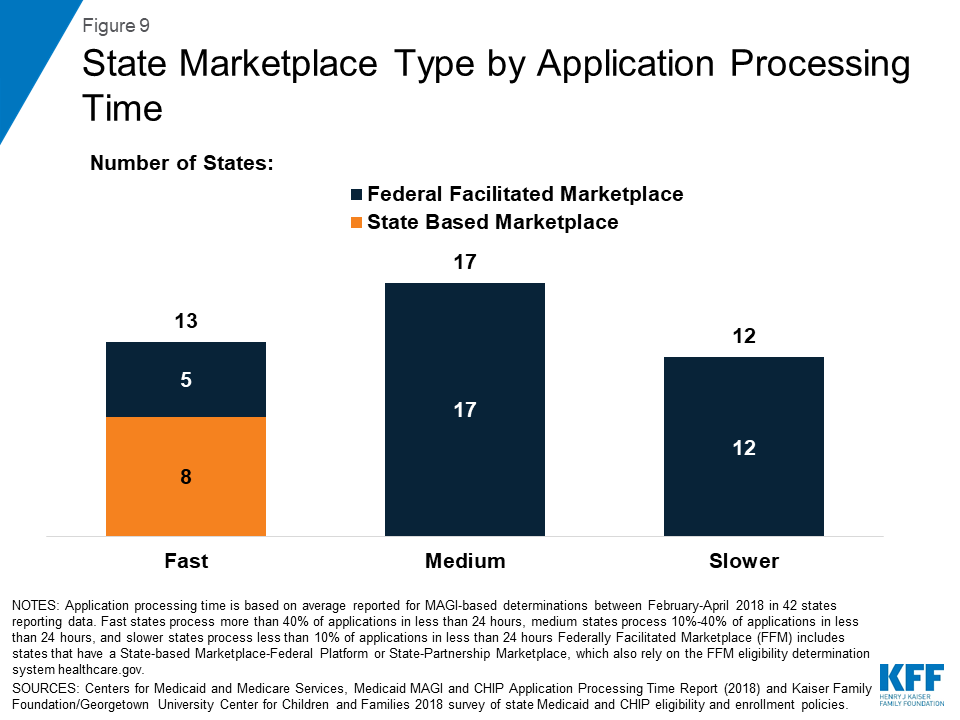
Few states with fast application processing times had their MAGI Medicaid eligibility determination system integrated with non-MAGI groups or non-health programs, and most had a state-based Marketplace (SBM) (Figures 8 and 9). A larger share of states with medium and slower application processing times had their MAGI Medicaid eligibility systems integrated with non-MAGI groups and/or non-health programs, and all of these states rely on the Federally-Facilitated Marketplace (FFM, healthcare.gov) for eligibility determinations. This variation reflects differing approaches states took to upgrade processes and systems in response to the ACA. Prior to the ACA, states’ eligibility systems generally included all Medicaid groups and most included non-health programs, such as Temporary Assistance for Needy Families (TANF) and Supplemental Nutrition Assistance Program (SNAP).10 The ACA required states to use a new MAGI-based financial methodology to determine Medicaid eligibility for pregnant women, children, parents, and expansion adults, to apply streamlined eligibility and enrollment processes to MAGI groups, and to align and coordinate MAGI eligibility determinations and enrollment with the Marketplaces. States continue to apply their pre-ACA financial eligibility methodologies to non-MAGI groups (seniors and individuals eligible based on a disability) and have the option to apply some of the streamlined processes to non-MAGI groups. To implement the ACA policies, some states separated MAGI eligibility determinations from non-MAGI groups and non-health programs, often integrating them into newly built SBM systems. Others did not separate MAGI groups from other groups or programs when they upgraded their systems. Over the past few years, a number of states have reintegrated non-MAGI groups and non-health programs into their upgraded systems, and states continue to focus on reintegration as they refine their systems.11
Conclusion
In November 2018, CMS released new state data on MAGI Medicaid and CHIP application processing time. These data reflect continued progress in reporting of performance indicators that CMS established in 2013 to facilitate data-driven program management and improvement. The data show that, across the 42 states reporting data for February to April 2018, on average, over half (53%) of applications were processed within 7 days, including over a third (34%) processed in less than 24 hours.
There was significant variation across states in how quickly they process applications. States with faster application processing generally had broader eligibility compared to those with slower application processing. They also were more likely to receive the majority of their applications online and allow individuals to upload documentation electronically, which may facilitate faster application processing. Further, consistent with their ability to process applications quickly, they also were more likely to process the majority of renewals automatically, likely reflecting effective electronic data matching capabilities. States with faster application processing times were less likely than states with medium or slower application processing times to have their MAGI Medicaid eligibility systems integrated with non-MAGI groups (seniors and individuals eligible based on a disability) or non-health programs. This variation reflects states’ differing approaches to upgrade systems and processes in response to the ACA eligibility determination and enrollment policies, which vary for MAGI and non-MAGI groups. A number of states plan to reintegrate non-MAGI groups and non-health programs into their upgraded systems in the future, which may contribute to improvements in processing of eligibility determinations for other groups and programs and facilitate access to services for individuals.12
The ability for states to make real-time eligibility determinations, as demonstrated by these new data, illustrates the significant progress states have made in streamlining and automating enrollment processes under the ACA. Through the ACA’s streamlined policies and state efforts, the Medicaid enrollment and renewal experience has moved from a paper-based, manual process that could take days and weeks in some states to a modernized, technology-driven approach that can happen in real-time through electronic data matches to verify eligibility criteria.13 These changes facilitate individuals’ ability to access and maintain coverage and provide opportunities for states to realize administrative efficiencies and increase accuracy of determinations and renewals. However, there remains significant variation across states in application processing time, and continued opportunities for improvement to ensure states complete all MAGI eligibility determinations within 45 days, as required under federal rules. Recent waivers in some states to add eligibility and enrollment restrictions, including work reporting requirements, could reverse the progress achieved in streamlining enrollment, resulting in additional barriers to coverage and coverage losses.
Appendix
| Appendix Table 1: Application Processing Time by State | |||||
| State | Average Share of Applications Processed by Time, February – April 2018 | ||||
| <24 Hours | 1-7 Days | 8-30 Days | 31-45 Days | 45+ Days | |
| Average (42 States) | 34% | 19% | 24% | 9% | 14% |
| Alabama | 75% | 16% | 8% | 1% | 1% |
| Alaska | 10% | 26% | 25% | 6% | 34% |
| Arizona | 46% | 12% | 21% | 17% | 5% |
| Colorado | 51% | 24% | 18% | 3% | 4% |
| Connecticut | 90% | 7% | 3% | 0% | 1% |
| Delaware | 28% | 33% | 39% | 0% | 0% |
| District of Columbia | 79% | 5% | 11% | 5% | 1% |
| Florida | 38% | 22% | 31% | 5% | 4% |
| Georgia | 3% | 7% | 18% | 12% | 59% |
| Hawaii | 29% | 23% | 26% | 3% | 19% |
| Illinois | 21% | 15% | 27% | 10% | 27% |
| Indiana | 5% | 6% | 48% | 28% | 13% |
| Iowa | 14% | 39% | 42% | 3% | 2% |
| Kansas | 1% | 14% | 45% | 9% | 30% |
| Kentucky | 56% | 9% | 12% | 12% | 12% |
| Maine | 7% | 3% | 10% | 38% | 42% |
| Maryland | 95% | 4% | 1% | 0% | 0% |
| Massachusetts | 68% | 10% | 8% | 1% | 14% |
| Michigan | 40% | 29% | 23% | 7% | 1% |
| Mississippi | 2% | 17% | 44% | 23% | 15% |
| Missouri | 1% | 23% | 26% | 6% | 44% |
| Montana | 25% | 21% | 28% | 9% | 18% |
| Nebraska | 18% | 11% | 30% | 18% | 22% |
| New Hampshire | 11% | 51% | 34% | 2% | 2% |
| New Jersey | 3% | 27% | 34% | 13% | 23% |
| New Mexico | 40% | 17% | 25% | 11% | 8% |
| North Carolina | 0% | 25% | 24% | 40% | 10% |
| North Dakota | 4% | 24% | 43% | 17% | 12% |
| Ohio | 14% | 16% | 32% | 11% | 27% |
| Oklahoma | 100% | 0% | 0% | 0% | 0% |
| Oregon | 45% | 16% | 12% | 13% | 14% |
| Pennsylvania | 15% | 23% | 53% | 6% | 3% |
| Rhode Island | 77% | 9% | 11% | 3% | 1% |
| South Carolina | 0% | 62% | 26% | 3% | 10% |
| Texas | 19% | 26% | 47% | 5% | 2% |
| Utah | 23% | 36% | 36% | 4% | 2% |
| Vermont | 75% | 1% | 2% | 1% | 21% |
| Virginia | 3% | 8% | 17% | 16% | 56% |
| Washington | 87% | 4% | 6% | 1% | 2% |
| West Virginia | 27% | 36% | 29% | 5% | 3% |
| Wisconsin | 39% | 16% | 34% | 11% | 1% |
| Wyoming | 40% | 22% | 21% | 6% | 11% |
| SOURCE: Centers for Medicaid and Medicare Services, Medicaid MAGI and CHIP Application ProcessingTime Report (2018), https://www.medicaid.gov/state-overviews/magi-and-chip-application-processing-time/index.html. | |||||
| Appendix Table 2: Eligibility and Enrollment Policies and Processes by Application Processing Time | |||||||
| State | Adopted ACA Medicaid Expansion? | Children’s Eligibility | Upload Documents | MAGI system integrated with: | Marketplace Type | % Renewals that are Automated | |
| Non-MAGI Groups | Non-Health Programs | ||||||
| Fast (>40% of Applications Processed in Less than 24 Hours) | |||||||
| Alabama | No | 317% | No | No | No | FFM | 75%+ |
| Arizona | Yes | 205% | Yes | Yes | No | FFM | 50-75% |
| Colorado | Yes | 265% | Yes | Yes | Yes | SBM | 75%+ |
| Connecticut | Yes | 323% | Yes | No | No | SBM | 50-75% |
| District of Columbia | Yes | 324% | Yes | No | No | SBM | 75%+ |
| Kentucky | Yes | 218% | Yes | Yes | Yes | SBM-FP | 50-75% |
| Maryland | Yes | 322% | Yes | No | No | SBM | 50-75% |
| Massachusetts | Yes | 305% | No | No | No | SBM | <25% |
| Oklahoma | No | 210% | Yes | No | No | FFM | 25-50% |
| Oregon | Yes | 305% | Yes | No | No | SBM-FP | NR |
| Rhode Island | Yes | 266% | Yes | Yes | Yes | SBM | 75%+ |
| Vermont | Yes | 317% | No | No | No | SBM | 50-75% |
| Washington | Yes | 317% | Yes | No | No | SBM | 50-75% |
| Medium (10% – 40% of Applications Processed in Less than 24 Hours) | |||||||
| Delaware | Yes | 217% | No | Yes | Yes | Partnership | <25% |
| Florida | No | 215% | Yes | Yes | No | FFM | 25-50% |
| Hawaii | Yes | 313% | Yes | Yes | No | FFM | 50-75% |
| Illinois | Yes | 318% | Yes | Yes | Yes | Partnership | <25% |
| Iowa | Yes | 380% | No | No | No | Partnership | 50-75% |
| Michigan | Yes | 217% | Yes | No | No | Partnership | 75%+ |
| Montana | Yes | 266% | Yes | Yes | Yes | FFM | 50-75% |
| Nebraska | Yes | 218% | Yes | Yes | Yes | FFM | <25% |
| New Hampshire | Yes | 323% | Yes | Yes | Yes | Partnership | <25% |
| New Mexico | Yes | 305% | Yes | Yes | Yes | SBM-FP | 50-75% |
| Ohio | Yes | 211% | Yes | Yes | Yes | FFM | 75%+ |
| Pennsylvania | Yes | 319% | Yes | Yes | Yes | FFM | <25% |
| Texas | No | 206% | Yes | Yes | Yes | FFM | NR |
| Utah | Yes | 205% | Yes | Yes | Yes | FFM | 50-75% |
| West Virginia | Yes | 305% | No | Yes | Yes | Partnership | <25% |
| Wisconsin | No | 306% | Yes | Yes | Yes | FFM | <25% |
| Wyoming | No | 205% | Yes | Yes | No | FFM | NR |
| Slower (<10% of Applications Processed in Less than 24 Hours) | |||||||
| Alaska | Yes | 208% | No | No | No | FFM | NR |
| Georgia | No | 252% | Yes | Yes | Yes | FFM | <25% |
| Indiana | Yes | 262% | No | Yes | Yes | FFM | 50-75% |
| Kansas | No | 241% | Yes | Yes | Yes | FFM | 25-50% |
| Maine | Yes | 213% | No | Yes | Yes | FFM | NR |
| Mississippi | No | 214% | Yes | Yes | No | FFM | 25-50% |
| Missouri | No | 305% | No | No | No | FFM | <25% |
| New Jersey | Yes | 355% | No | Yes | No | FFM | <25% |
| North Carolina | No | 216% | No | Yes | Yes | FFM | 50-75% |
| North Dakota | Yes | 175% | Yes | No | No | FFM | NR |
| South Carolina | No | 213% | No | No | No | FFM | 25-50% |
| Virginia | Yes | 205% | Yes | Yes | Yes | FFM | 25-50% |
| Notes: NR indicates state did not report data. FFM is the Federally Facilitated Marketplace, SBM-FP is a State-based Marketplace-Federal Platform and Partnership is a State-Partnership Marketplace, which also rely on the FFM eligibility determination system healthcare.gov.Sources: Centers for Medicaid and Medicare Services, Medicaid MAGI and CHIP Application Processing Time Report (2018); Kaiser Family Foundation, Status of State Medicaid Expansion Decisions, Nov. 26, 2018, and Kaiser Family Foundation/Georgetown University Center for Children and Families, Medicaid and CHIP Eligibility, Enrollment, Renewal, and Cost Sharing Policies as of January 2018: Findings from a 50-State Survey (2018), | |||||||
Endnotes
- “Medicaid MAGI and CHIP Application Processing Time Report,” Centers for Medicare and Medicaid Services, https://www.medicaid.gov/state-overviews/magi-and-chip-application-processing-time/index.html, accessed November 2018. ↩︎
- Tricia Brooks, Karina Wagnerman, Samantha Artiga, and Elizabeth Cornachione, Medicaid and CHIP Eligibility, Enrollment, Renewal, and Cost Sharing Policies as of January 2018: Findings from a 50-State Survey, (Washington, DC: Kaiser Family Foundation, March 2018), https://modern.kff.org/medicaid/report/medicaid-and-chip-eligibility-enrollment-renewal-and-cost-sharing-policies-as-of-january-2018-findings-from-a-50-state-survey/. ↩︎
- Samantha Artiga, MaryBeth Musumeci and Robin Rudowitz, Medicaid Eligibility, Enrollment Simplification, and Coordination under the Affordable Care Act: A Summary of CMS’s March 23, 2012 Final Rule, (Washington, DC: Kaiser Family Foundation, December 2012), https://modern.kff.org/medicaid/issue-brief/medicaid-eligibility-enrollment-simplification-and-coordination-under-the-affordable-care-act-a-summary-of-cmss-march-23-2012-final-rule/ ↩︎
- Vikki Wachino, Cheryl Camillo, Samuel Stromberg, Samantha Artiga and Robin Rudowitz, An Introduction to Medicaid and CHIP Eligibility and Enrollment Performance Measures, (Washington, DC: Kaiser Family Foundation, January 2014), https://modern.kff.org/report-section/an-introduction-to-medicaid-and-chip-eligibility-and-enrollment-performance-measures-issue-brief/ ↩︎
- Ibid. ↩︎
- Medicaid & CHIP Monthly Applications, Eligibility Determinations, and Enrollment Reports: January 2014 – September 2018 (preliminary), Centers for Medicare and Medicaid Services, as of November 30, 2018. ↩︎
- “Medicaid MAGI and CHIP Application Processing Time Report,” Centers for Medicare and Medicaid Services, https://www.medicaid.gov/state-overviews/magi-and-chip-application-processing-time/index.html, accessed November 2018. ↩︎
- The data exclude redeterminations, determinations based on changes in circumstances, presumptive eligibility determinations, and final determinations made by the Federally-Facilitated Marketplace (FFM); however, they include states’ final determinations for applications received as an assessment from the FFM. ↩︎
- These data represent the averages of the reported share of applications processed within the specified timeframes across states. In its report, CMS reports national totals, which represent the total share of applications processed within the specified timeframes across all reporting states. ↩︎
- Martha Heberlein, Tricia Brooks, Joan Alker, Samantha Artiga and Jessica Stephens, Getting into Gear for 2014: Findings from a 50-State Survey of Eligibility, Enrollment, Renewal, and Cost-Sharing Policies in Medicaid and CHIP, 2012-2013, (Washington, DC: Kaiser Family Foundation, January 2013), https://modern.kff.org/medicaid/report/getting-into-gear-for-2014-findings-from-a-50-state-survey-of-eligibility-enrollment-renewal-and-cost-sharing-policies-in-medicaid-and-chip-2012-2013/. ↩︎
- Tricia Brooks, Karina Wagnerman, Samantha Artiga, and Elizabeth Cornachione, Medicaid and CHIP Eligibility, Enrollment, Renewal, and Cost Sharing Policies as of January 2018: Findings from a 50-State Survey, (Washington, DC: Kaiser Family Foundation, March 2018), https://modern.kff.org/medicaid/report/medicaid-and-chip-eligibility-enrollment-renewal-and-cost-sharing-policies-as-of-january-2018-findings-from-a-50-state-survey/. ↩︎
- Ibid. ↩︎
- Ibid. ↩︎