KFF designs, conducts and analyzes original public opinion and survey research on Americans’ attitudes, knowledge, and experiences with the health care system to help amplify the public’s voice in major national debates.
A new national survey conducted by the Kaiser Family Foundation and George Washington University finds few of the nation’s community health centers report they can handle a significant increase in patients. Less than one in five clinics report that they could increase their patient caseload by 25 percent or more in the next year. This finding suggests that community health centers may be challenged to fill the void if Planned Parenthood, the nation’s largest network of freestanding family planning clinics, were excluded as a Medicaid or Title X provider, as proposed by the Trump Administration’s budget, and Congressional leadership.
The survey provides a comprehensive look at the provision of reproductive health care to low-income women by community health centers. It assesses the availability of family planning services at health centers during a period of considerable political debate over the future of federal family planning funding through Medicaid and Title X.
Other highlights from the survey include:
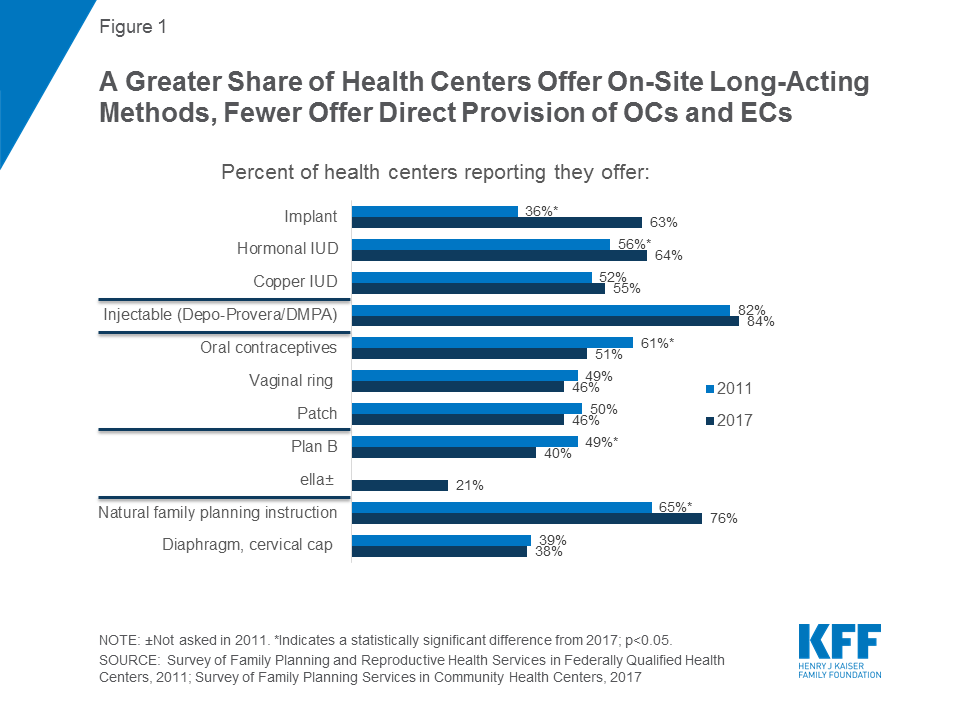
Onsite provision of the most effective, long-acting methods of contraception at health centers rose between 2011 and 2017, from 36 percent to 63 percent for contraceptive implants and from 56 percent to 64 percent for hormonal IUDs.
Over the same time period, however, the share of centers that dispense oral contraceptives onsite declined to 51 percent from 61 percent. Fewer than half of clinics provide onsite emergency contraception, and many do not prescribe it at all.
Only 1 in 4 health centers offers their patients onsite access to all of the most effective family planning methods, which is the standard for high quality family planning care. Centers that receive Title X funding are considerably more likely to provide a wider range of onsite contraceptive services and follow the evidence-based best practices for high quality family planning care currently required by the Title X program.
Community Health Centers and Family Planning in an Era of Policy Uncertainty
Authors:
Susan F. Wood, Julia Strasser, Jessica Sharac, Janelle Wylie, Thao-Chi Tran, Sara Rosenbaum, Caroline Rosenzweig, Laurie Sobel, and Alina Salganicoff
Introduction. Community health centers play a major role in furnishing publicly funded reproductive health care, including family planning services, to women living in low-income and medically underserved communities. Community health center patients are overwhelmingly low-income, members of a racial or ethnic minority group, and disproportionately female. In 2016, nearly one-third of all low-income women of childbearing age obtained care at a community health center. Since the health centers program was first enacted into law in 1975, voluntary family planning has been a required service.
Study purpose and methods. Building on earlier research conducted by George Washington University in 2011, this study examines the current state of community health centers’ family planning services. Its purpose is to assess the scope and onsite availability of family planning services, how health centers are incorporating evidence-based recommended best practices into their activities, how participation in the Title X family planning program might affect the scope and quality of health center family planning services, and to document barriers to care. The study is based on a survey, conducted between May and July 2017, of health centers in all 50 states and the District of Columbia. Since health centers on average deliver care at over seven sites, the survey gave special focus to each respondent’s largest service site offering family planning services onsite. The survey yielded a 41 percent response rate.
Key findings. Virtually all health centers (97 percent) reported that their largest comprehensive medical sites offered family planning services. Among the study’s key findings:
Scope and comprehensiveness of care: About half the sites provide short-acting, effective methods onsite, including oral contraceptives (OCs), the contraceptive ring, and the contraceptive patch, and over half provide long-acting methods onsite, including hormone-releasing IUDs, the copper IUD, and implant. Between 2011 and 2017, the proportion of sites offering onsite long-acting contraception rose from 36 percent to 63 percent for the implant and 56 percent to 64 percent for hormonal IUDs. Over the same time period, however, the percentage offering onsite oral contraceptives declined from 61 percent to 51 percent. Fewer than half provide emergency contraception onsite, and many do not prescribe or refer for it at all. Onsite provision of Plan B (available without a prescription) has significantly decreased from 2011. One in four health centers offers all seven of the most effective family planning methods onsite, while nearly half (48 percent) provide all seven methods either onsite or by prescription.
Promoting access to services and counseling. Two-thirds of health centers offer access to initial contraceptive visits on a same-day and walk-in basis. In 2017, 68 percent of health center sites offered same-day/walk-in initial contraceptive visits for new patients and 89 percent for established patients. Most health centers follow current patient screening and counseling recommendations: 76 percent report that they ask about the childbearing plans for female patients of childbearing age, 85 percent routinely screen sexually active women age 25 or younger for chlamydia, and 80 percent routinely screen women of childbearing age for intimate partner violence.
Family planning staffing. Health centers are less reliant on physicians for family planning counseling than they were in 2011. Three quarters report that physicians provide family planning counseling, down from 85 percent in 2011.
Special population services. Sixty-three percent of health centers offer services for adolescents, up substantially from 47 percent in 2011, and are more likely today than previously to maintain special confidentiality protections for minors.
The role of Title X funding: Across virtually all measures of performance, the receipt of additional Title X funding lifted performance. Twenty-six percent of respondents report that their largest family planning sites also receive Title X funding. In keeping with the more dedicated mission of Title X grantees and detailed family planning requirements of Title X, Title X-funded sites consistently show a larger range of onsite contraceptive methods across all types of methods, including natural family planning instruction and emergency contraception. Title X-funded health center sites are substantially more likely – 48 percent compared to 15 percent of sites not receiving Title X funding – to offer all seven of the most effective methods onsite. Title X-funded sites also consistently show greater incorporation of evidence-based best practice methods, including prescribing oral contraceptives without requiring a pelvic exam and use of the “quick start” method for oral contraception that ensures that women who seek it have more rapid access to effective contraception. Title X-funded sites are also more likely to follow best practices related to screening and counseling. Title X-funded sites are also far more likely – 43 percent compared to 16 percent – to have health counselors or educators providing family planning counseling.
Expanded onsite services; limited additional capacity: As their services have grown – especially related to provision of long-acting contraceptives – health centers simultaneously are referring fewer patients to freestanding family planning clinics. Half of respondents reported increased demand for family planning services in the past five years, and the majority responded with staffing increases to support this demand. In 2011, 78 percent of health centers with family planning clinics in their service area reported referring patients to them; by 2017, this figure had declined to 36 percent. Sites without Title X funding more typically refer patients, whose care becomes their direct responsibility under Title X. Health centers reported limited capacity to accept new patients; 51 percent reported that they could increase patient capacity but only between 10 and 24 percent; only 6 percent reported that they could absorb a 50 percent or greater patient increase.
Expanded services; remaining barriers. Reported major barriers to meeting patients’ family planning and reproductive health needs focus on the challenges of affordability for patients and the financial resources needed to maintain a robust family planning practice. Nationally, 23 percent of health center patients remain uninsured, a percentage that is higher in non-ACA Medicaid expansion states (36 percent). Twenty-five percent reported the lack of insurance coverage among patients as a major barrier, 28 percent reported high patient out-of-pocket costs as a major barrier issue, and 19 percent reported inadequate insurance payments as a major barrier. One in four health centers (24 percent) reported the high cost of stocking contraceptives onsite as a major barrier, and twenty percent reported high patient demand for other primary care services at their largest site as a major barrier. Nineteen percent reported a lack of staff trained in IUD/implant procedures as a major barrier.
Implications. Community health centers are vital to low-income women’s access to primary and preventive healthcare services, including family planning services. Family planning has been a required service under the community health center program since its beginning and remains a crucial component of health care for women of reproductive age (15-44). This survey finds that since 2011, the share of health centers offering long acting contraceptive methods has grown. At the same time, health centers that also participate in the Title X program are more likely to offer a broad range of methods and engage in higher quality practices such as use of the quick start method for oral contraceptives and same day walk-in services. This suggests that targeted supplemental funding tied to clear performance expectations may yield positive, measurable results in preventive primary care. Expanding the availability of targeted family planning quality improvement funds as a direct part of the health centers program would be consistent with the Balanced Budget Act of 2018, which, in extending health center grant funding, explicitly allows HHS to spend funds on targeted primary care quality improvement. On February 23, 2018, the Trump Administration released the funding opportunity announcement (FOA) for Title X family planning grants. This funding announcement does not require that grantees adhere to evidence based standards for quality family planning that were promulgated by the Office of Population Affairs and Centers for Disease Control and Prevention. This study finds that health centers that participate in Title X are those that offer the highest quality family planning services. Any weakening of the evidence-based requirements for Title X grantees may result in a significant loss of access to the most effective contraceptive methods for low-income women, men, and teens.
A majority of health centers also reported in this study that they are unable to accept a major increase in new patients. This is particularly important to note in light of recent proposals to block Planned Parenthood from the Medicaid program and redirect funds to other providers, such as community health centers. The FOA for Title X funding released in February 2018 gives preference to clinics that provide primary health care and family planning services in the same location. In addition, as this survey suggests, these health centers may not have the capacity to fill the void if Planned Parenthood were excluded as a Medicaid or Title X provider.
Strategies that will elevate the standards of family planning services offered by health centers have the potential to have high impact on many of the challenges facing women’s health. Promoting the availability of high quality family planning services reduces unintended pregnancy and abortion rates, improves birth outcomes, and allows women to make informed and independent reproductive choices to improve their health and their future wellbeing.
Report
Introduction
Community health centers play a major role in furnishing reproductive health care to women living in low-income and medically underserved communities. Along with independent freestanding family planning clinics including Planned Parenthood health centers (which also may receive Title X funding), and local public health agencies, community health centers are part of a publicly supported provider network that serve an estimated one in three low-income women.1 The CDC defines family planning services as encompassing: contraception to reduce unintended pregnancy and abortion rates and promote appropriate birth spacing; pregnancy testing and counseling; infertility counseling and screening; preconception health care to promote better infant and maternal outcomes and to improve women’s and men’s health; and sexually transmitted disease (STD) screening and treatment services.2
Family planning services at community health centers are supported through a combination of patient revenues, health insurance, and grant funding, including the federal community health center program, as well as other federal, state, and local public health grants. Medicaid represents the most important source of health coverage among patients served by publicly supported clinics; in 2016, Medicaid insured two in five (42 percent) low-income women.3
This report, an update of an earlier study conducted in 2011,4 presents the key findings of a national survey of community health centers and their role in the provision of family planning and related services to low-income women, men, and teens.
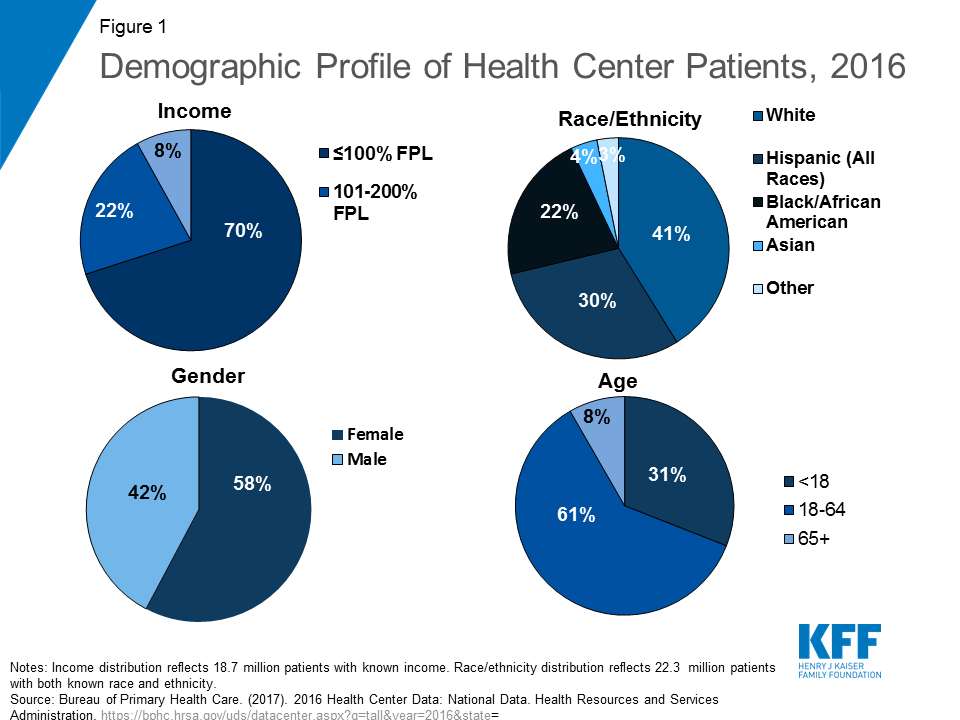
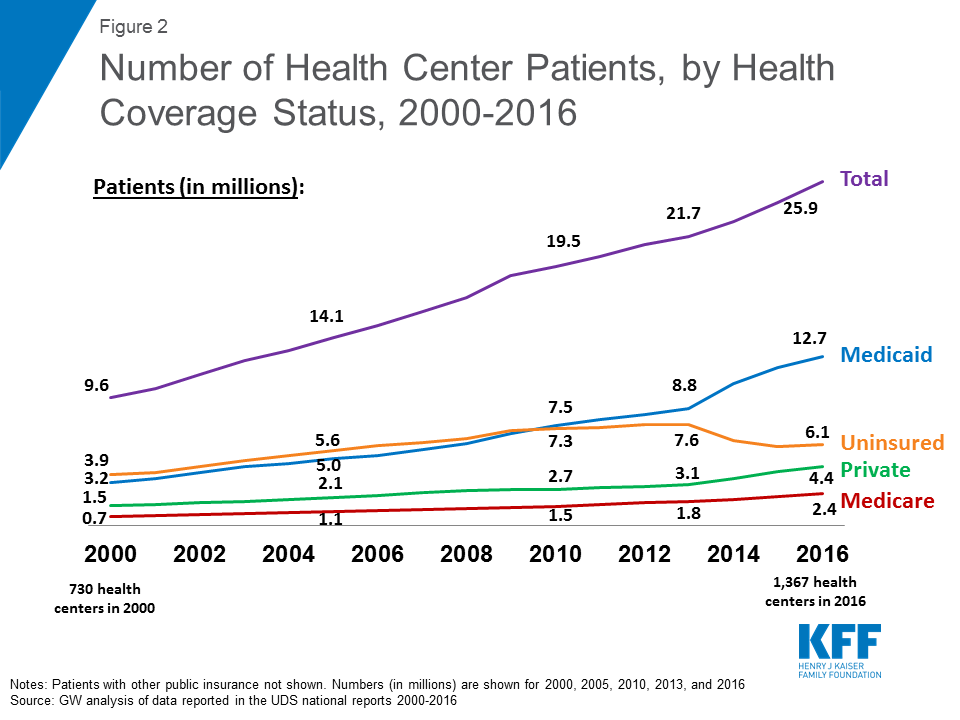
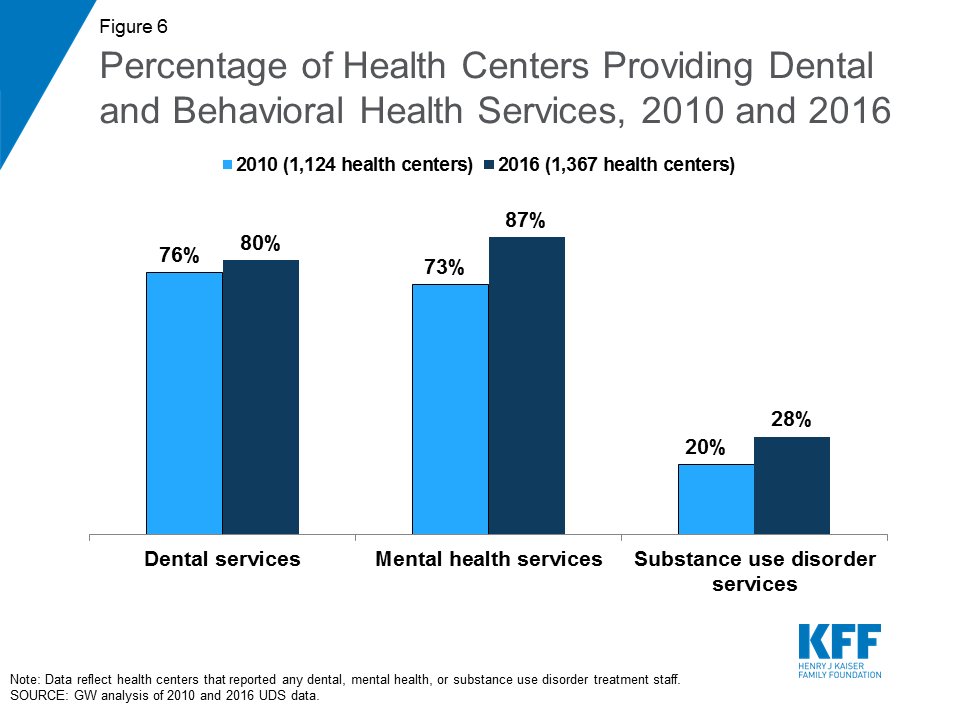
Located in communities experiencing high poverty, elevated health risks, and a shortage of primary health care, community health centers offer comprehensive primary health care and adjust the fees charged to patients in accordance with their ability to pay. In recent years, community health centers have experienced steady growth primarily as a result of two major federal policy reforms: the Affordable Care Act (ACA) Medicaid expansion; and an expanded investment in community health center grant funding under the ACA. Between 2010 and 2016, the number of community health centers grew from 1,124 to 1,367, the number of sites, from 6,949 to 10,404, and the number of patients, from 19.5 million to 25.9 million.5
Fifty-six percent of all community health center grantees are in urban communities, while the remainder are rural or suburban. Community health center patients are overwhelmingly low-income, members of a racial or ethnic minority group, and disproportionately female. In 2016, three in ten, or about 6.2 million, low-income women6 of childbearing age (ages 15-44) obtained care at a community health center.7
In recognition of the importance of family planning to population and women’s health, Section 330 of the Public Health Service Act, which authorizes the community health center program, has specified “voluntary family planning” as a required service since 1975 when8 the program was first authorized. As with other required community health center services, however, the law and implementing regulations and guidelines do not define the exact scope of services that must be provided to patients. Rather, community health centers are given significant leeway to determine the precise mix and scope of the required family planning services they will offer.9 This is in contrast with the federal Title X program, a block grant administered by the HHS Office of Population Affairs (OPA), and the only federal program specifically dedicated to supporting the provision of family planning services. In return for federal support, the Title X program requires that its grantees meet very specific performance criteria. In addition to providing women, men, and teens with a broad range of contraceptive services and supplies and other preventive, screening, and treatment services, Title X grantee clinics must follow special federal confidentiality protections and are expected to adhere to national Quality Family Planning Guidelines (QFP).10 About a quarter of all community health centers also participate in Title X; as a condition of grant eligibility, these community health centers must follow the more expansive Title X standards outlined for the provision of family planning services. The majority of community health centers, however, are bound only by the Section 330 requirements. As a result, there is considerable variation in the scope of services provided at community health centers across the country.
Study Purpose and Methodology
This study, conducted by researchers at George Washington University’s Jacobs Institute of Women’s Health and Geiger Gibson Program in Community Health Policy, and the Kaiser Family Foundation, builds on a 2011 study to examine the role of community health centers in the provision of family planning services.11 It comes at a time of enormous community health center growth and increased utilization of preventive services as a result of the ACA’s Medicaid and insurance expansions. It also comes at a time of significant pressure to withdraw federal support to other key providers of publicly supported family planning services, in particular, Planned Parenthood. Using data collected in 2017, the study is designed to examine the way in which the provision of family planning services by community health centers has changed, if at all, during an important time in the evolution of the family planning safety net.
This study sought to gain greater insight into the extent to which community health centers’ family planning services have evolved as patient needs and standards of practice have changed. In particular, we were interested in how community health centers were responding to the growing emphasis and acceptance of long-acting reversible contraception (LARC) and clinical practice standards that promote rapid access to other effective forms of contraception. We also sought to learn more about the barriers community health centers face in the provision of family planning services to their patients and whether, as was documented in the 2011 study, Title X continues to be associated with more robust community health center family planning programs.
As was done in 2011, researchers surveyed all federally funded community health centers operating in the 50 states and the District of Columbia based upon data drawn from the federal 2015 Uniform Data System (UDS), a national reporting system that includes community health centers. The survey was conducted between mid-May and the end of July 2017. To ensure representativeness in terms of size and location, the results were weighted by US Census region and health center size. As with the 2011 survey, respondents were asked certain questions about the availability of family planning services across all sites, but the focus of the questionnaire was the practices and policies of their largest comprehensive medical site at which family planning services are available.
The study included statistical analyses to determine what effects, if any, might be associated with the following factors: participation in the Title X family planning program; health centers’ location in an ACA Medicaid expansion or non-expansion state; health center size;12 and geographic location.13 In the case of questions asked in both 2011 and 2017, we present current survey results along with those from our earlier study. All results described in this brief are statistically significant (at p < 0.05), unless otherwise noted.
Community health centers in all 50 states and the District of Columbia responded to the survey for a total of 546 responses out of 1,345 federally funded health centers in the 2015 UDS, a 41 percent response rate. The health centers that responded to the survey are generally similar to non-responding health centers in terms of size and location; there were no significant differences between health centers that responded to the survey and non-responders for rural vs. urban location, number of patients served, or number of patient visits.14
Key Findings
Onsite Access to Contraceptive Methods
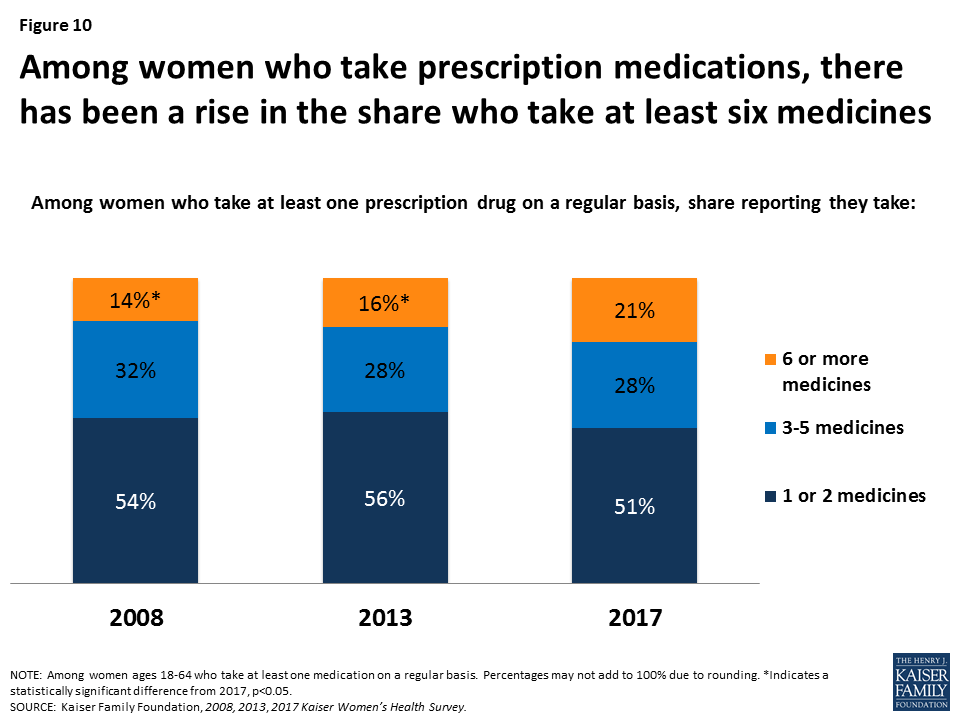
Many health centers provide highly effective contraceptive methods onsite; the provision of long-acting methods has increased since 2011, while onsite oral contraceptive provision has dropped. Consistent with federal requirements and similar to our earlier findings, virtually all health centers (97 percent) reported that their largest comprehensive medical sites offered family planning services. Providing contraception onsite facilitates access to care, reducing barriers including the time and costs required to travel to an outside pharmacy or to another clinic. As in 2011, the contraceptive method most commonly offered onsite was the contraceptive injection (Depo Provera), a short acting method that protects against unintended pregnancy for three months (Figure 1). Over half of health center sites in the survey report providing long-acting methods onsite, including hormone-releasing IUDs (Mirena, Skyla, Liletta), the copper IUD (Paragard), and the implant (Nexplanon). A significantly higher percentage of sites provide the implant and hormonal IUDs than in 2011, with the largest increase in provision of the contraceptive implant from 36 percent in 2011 to 63 percent in 2017. About half the sites provide short-acting, effective methods onsite, including oral contraceptives (OCs), the contraceptive ring, and the contraceptive patch. However, the percentage of sites offering onsite access to OCs decreased from 61 percent in 201115 to 51 percent in 2017.
Figure 1: A Greater Share of Health Centers Offer On-Site Long-Acting Methods, Fewer Offer Direct Provision of OCs and ECs
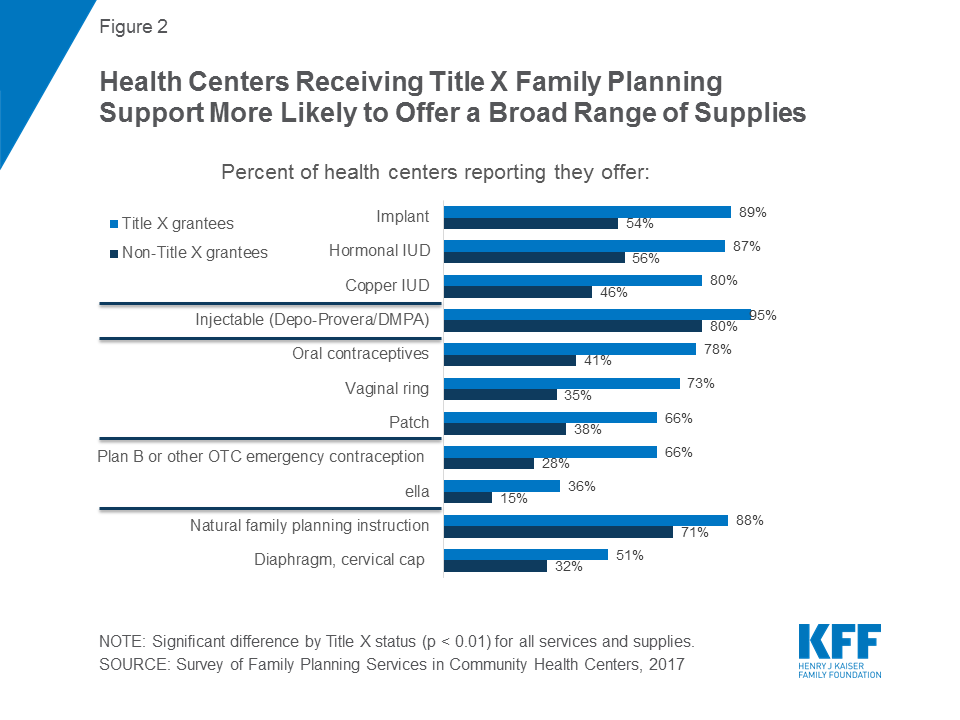
About one-quarter of respondents (26 percent) reported that their largest health center site receives Title X funding. The federal Title X program funds increase the resources available to health centers to operate high quality, accessible family planning programs, and establishes important performance standards with respect to contraceptive access, adherence to certain best practices, and the use of special safeguards for certain highly vulnerable populations.
Sites with Title X funding consistently provide a larger range of contraceptive methods dispensed onsite, including emergency contraception. Particularly striking are differences related to the availability of highly effective, long-acting contraceptives. Health centers that received Title X funds were consistently more likely to offer the contraceptive implant (89 percent versus 54 percent) and hormonal (87 percent versus 56 percent) and copper (80 percent versus 46 percent) IUDs, compared with health centers that do not receive Title X funding (Figure 2). For all contraceptive methods, clinics that receive Title X funding are more likely to provide them onsite, even after controlling for location in a Medicaid expansion state, size, and urban vs. rural/suburban location (see Table A in Appendix). In particular, onsite dispensation of oral contraceptives – a low cost, and still the most widely used, method – is strikingly higher for Title X funded sites (78 percent) compared to those without Title X funding (41 percent).
Figure 2: Health Centers Receiving Title X Family Planning Support More Likely to Offer a Broad Range of Supplies
Onsite provision of hormonal IUDs rose significantly among Title X sites, a 13 percentage point gain from 2011 to 2017. While onsite provision of the long-acting contraceptive implant increased significantly across both types of sites, the largest difference can be seen in Title X clinics; 89 percent of health centers with Title X funding now offer implant services onsite compared to 51 percent in 2011 (Table 1). In non-Title X sites, the percentage rose from a far lower 31 percent in 2011 to 54 percent in 2017.
While the availability of onsite oral contraceptive pills fell overall since 2011, it dropped significantly among clinics that do not receive Title X funding. Among all health centers, the onsite provision of oral contraceptive pills has dropped significantly from 61 percent in 2011 to 51 percent in 2017. There was a significant decrease among non-Title X-funded health centers, from 53 percent in 2011 to 41 percent in 2017. Title X sites also experienced a decrease, from 85 percent to 78 percent, but this decrease was not statistically significant (Table 1).
Table 1: Differences in family planning services or supplies dispensed/provided onsite, by Title X funding status and survey year(2011 and 2017)
Non- Title X grantee site
Title X grantee site
Oral contraceptives (OCs)
2011
53%*
85%
2017
41%
78%
Hormonal IUDs
2011
50%
74%*
2017
56%
87%
Copper IUD
2011
45%
73%
2017
46%
80%
Implant
2011
31%*
51%*
2017
54%
89%
Injectable
2011
78%
92%
2017
80%
95%
Patch
2011
43%
70%
2017
38%
66%
Ring
2011
42%*
68%
2017
35%
73%
Diaphragm, cervical cap
2011
35%
52%
2017
32%
51%
Natural family planning instruction
2011
57%*
86%
2017
71%
88%
Plan B
2011
35%*
83%*
2017
28%
66%
NOTE: *Indicates a statistically significant difference from 2017, p<0.05.
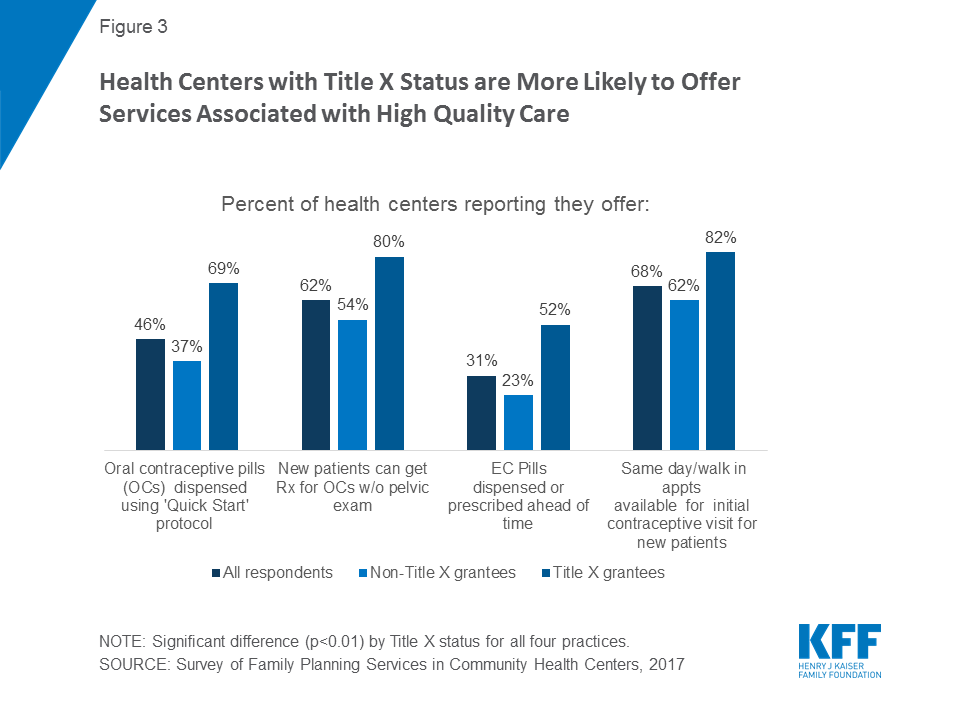
Fewer than half of the largest health center sites provide emergency contraception onsite, and many do not prescribe or refer for it at all. Onsite provision of Plan B16 has significantly decreased since 2011. Only two in five sites provide onsite access to levonorgestrel, an over-the-counter (OTC) EC pill, the most well-known brand name of which is Plan B, down from roughly half (49 percent) of all health centers in 2011. One in five (21 percent) health centers currently provides onsite access to ulipristal acetate, the prescription EC (brand name: ella). Emergency contraception (EC) is an important component of contraceptive care, and reducing access barriers is essential in preventing unintended pregnancy. Depending on the type of EC (levonorgestrel or ulipristal acetate), a woman must take it within either 72 hours or 120 hours of unprotected sex or contraceptive failure. Quality family planning guidelines recommend that providers dispense EC onsite by providing or prescribing EC in advance for a woman to take home or to obtain without returning to the clinic.
Onsite access to emergency contraception is greater at sites receiving Title X funding, although for both types of sites, access to prescribed emergency contraceptives at health centers is low. About two-thirds (66 percent) of Title X sites offered Plan B or other over the counter EC onsite, compared with less than one-third of non-Title X sites (28 percent). Onsite provision of Plan B has decreased significantly among both Title X and non-Title X sites since 2011 when 83 percent and 35 percent of health centers provided this service, respectively. Title X sites (36 percent) were also more likely to provide ella onsite than non-Title X sites (15 percent). Notably, 15 percent and 28 percent of all sites do not dispense, prescribe, or refer for plan B or ella, respectively.17 Less than one-third of the largest sites (31 percent) provide or prescribe EC ahead of time; however, Title X sites do so at twice the rate of non-title X sites (52 percent vs 23 percent, respectively) (Figure 3).18
Figure 3: Health Centers with Title X Status are More Likely to Offer Services Associated with High Quality Care
Rural or suburban health centers are less likely to provide the full range of contraceptive methods onsite. Rural or suburban health centers are significantly less likely than urban health centers to provide hormonal and copper IUDs, the implant, the patch, and both types of emergency contraception onsite, although even at urban health centers, fewer than half (48 percent) provide onsite over the counter (Plan B) emergency contraception. (Figure 4).
Figure 4: Urban Health Centers More Likely to Offer On Site LARC Methods and Emergency Contraception
Adherence to Best Practice Standards for Family Planning Services
Although a significant number of women rely on birth control pills, a considerable number of health centers have not yet adopted best practices related to the provision of OCs, such as prescribing oral contraceptives without requiring a pelvic exam, adopting the “quick start” method, and dispensing a one-year supply at a time.19 Only about three in five sites participating in the survey (62 percent) reported that they provide oral contraceptives without first requiring a pelvic exam, and less than half of health centers (46 percent) report using the “quick start” method. Current clinical guidelines recommend the “quick start” method when it comes to the initiation of oral contraceptives, which entails initiating birth control pills immediately, without regard to the timing of a woman’s menstrual cycle. Sites receiving Title X funds and sites in urban locations are more likely to allow patients to begin oral contraception without a pelvic exam. Title X sites are also more likely to use the “quick start” method (Figure 3).
In addition, under older standards of practice, clinicians typically prescribed or provided birth control pills only one month to three months at a time; today’s clinical recommendations now suggest providing at least three months or up to one year of oral contraceptives during a single visit to minimize the likelihood that patients will experience gaps, which increase the risk of unintended pregnancy.20 Only 30 percent of health centers that provide OCs onsite reported allowing patients to obtain a full year’s supply of OCs at a single visit, with no significant difference by Title X status. More rural/suburban health centers that provide OCs onsite allow patients to pick up one year of oral contraceptive pills at a time than urban health centers (38 percent versus 23 percent).
Roughly two-thirds of health center sites offer access to family planning services for new patients on a same-day and walk-in basis. Eighty-nine percent of the largest health center sites have same-day or walk-in contraceptive visits for established patients, and 68 percent maintain a walk-in policy for new patients. Clinical experts recommend providing same-day family planning services in order to reduce unnecessary barriers to obtaining family planning care. Waiting to receive contraceptive care places patients at greater risk of unintended pregnancy, and for most patients, there is no clinical need to delay initiation of access to the contraceptive of choice. Health centers with Title X status (82 percent) are more likely to offer same-day and walk-in appointments for initial contraceptive visits to new patients compared to health centers without Title X status (62 percent).
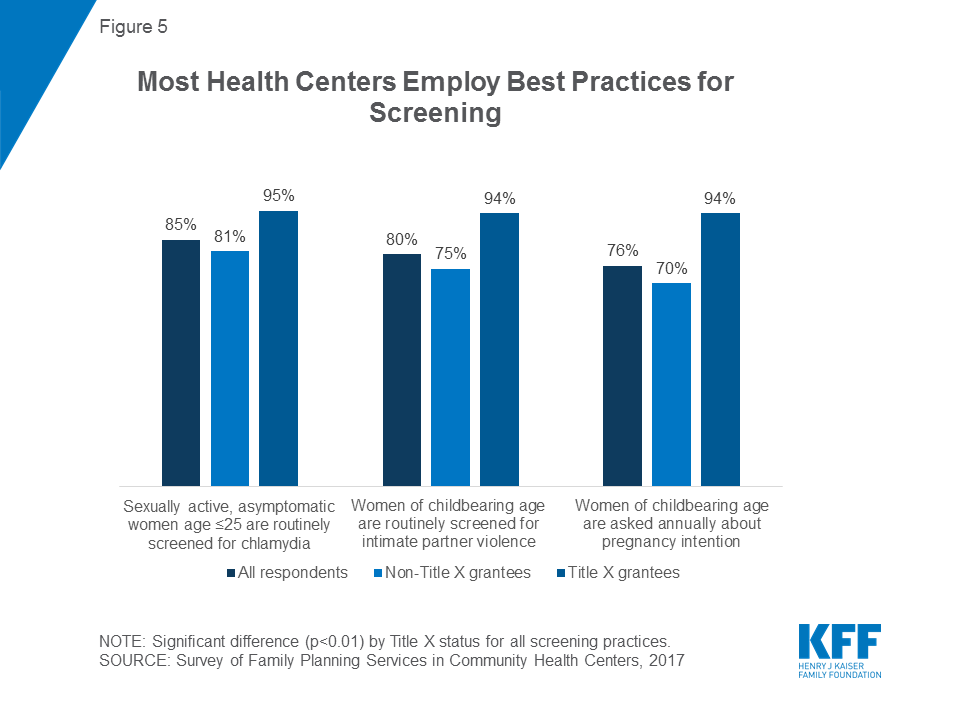
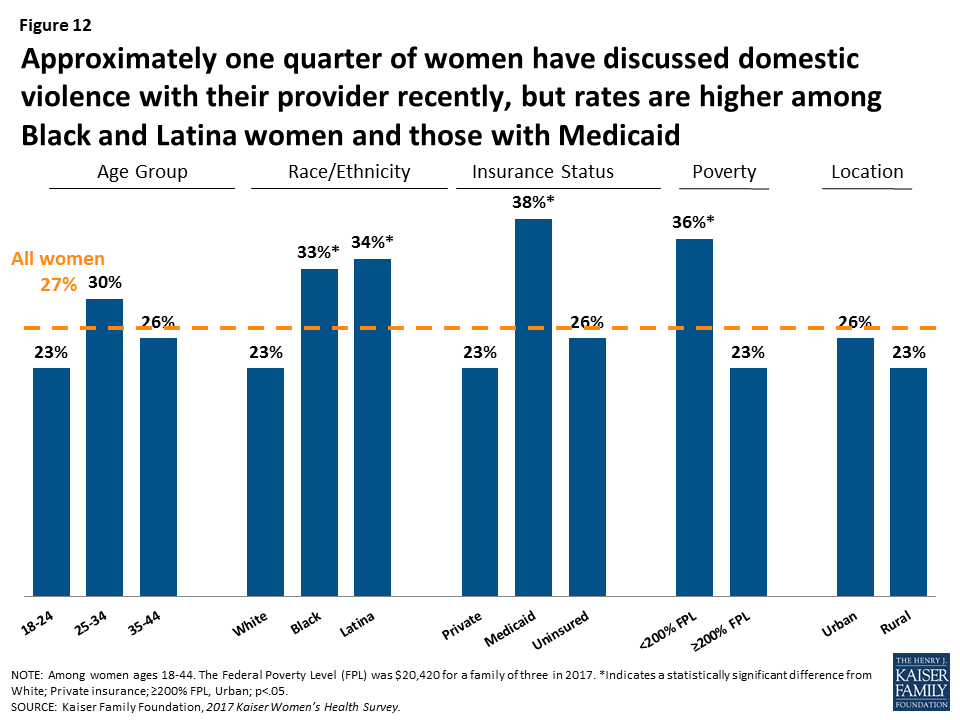
Most health centers follow current guidance on counseling approaches to pregnancy intentions, screening for intimate partner violence, and clinical screenings for sexually transmitted infections. Current clinical guidance recommends asking women annually about pregnancy intention so that clinicians can work with women to determine the contraceptive method that best fits their reproductive plans.21 Seventy-six percent of health centers reported that their largest site asks women annually about pregnancy intention. The US Preventive Services Task Force (USPSTF) and Quality Family Planning (QFP) Guidelines also recommend that providers routinely screen sexually active women age 25 or younger for chlamydia because, if left untreated, infection can result in infertility,22 and the majority of health centers (85 percent) currently do so. Finally, 80 percent routinely screen women of childbearing age for intimate partner violence, a practice recommended in the QFP Guidelines, the Women’s Preventive Services Initiative, and the USPSTF.23 Title X-funded sites are more likely to conduct these screening services than non-Title X health centers (Figure 5). Additionally, urban health center sites are more likely than rural/suburban sites to perform routine screenings for chlamydia among sexually active women age 25 or younger (93 percent versus 78 percent) and intimate partner violence among women of childbearing age (85 percent versus 75 percent).
Figure 5: Most Health Centers Employ Best Practices for Screening
Health centers rely less on physicians for patient counseling than they did in 2011. Three quarters of health centers (76 percent) use physicians to provide family planning counseling, down from 85 percent in 2011. In 2017, health centers are more likely to use advanced practice clinicians such as physician assistants, nurse practitioners, or certified nurse midwives than physicians to provide clinical exams (95 percent versus 86 percent) and pelvic exams (94 percent versus 86 percent). In light of the surging demand for health center care and physician staffing shortages, it is not surprising to see health centers relying more on other qualified clinicians and less on physicians for certain tasks. Furthermore, it may allow health centers to save money, as physicians bill at a higher rate than advanced practice clinicians.
Few health centers rely on health counselors or educators for family planning counseling, but Title X health centers are significantly more likely to use health counselors or educators than non-Title X health centers, a trend that has persisted since 2011. Family planning counselors or educators are an important part of family planning care because they provide patients with an opportunity to discuss questions or concerns about family planning separate from the traditional visit model. Only one in four sites (24 percent) usually provide counseling by health counselors or educators. However, the percentages are vastly different for Title X health centers, where 43 percent report using a health counselor or educator, and for non-Title X health centers, where 16 percent report using one. These shares remain consistent from 2011 when 44 percent of Title X and 14 percent of non-Title X sites used a health counselor or educator.
Services tailored to adolescents are a feature at six in ten health centers, as is adherence to standards designed to ensure confidentiality of care furnished to adolescents. Adolescents represent an especially vulnerable population but can be protected by measures such as maintaining confidentiality through separate contact information for communications regarding family planning services. Over 60 percent of sites offer contraceptive services tailored specifically for adolescents, collaborate with other entities on outreach activities to adolescents to meet their family planning needs, and/or maintain separate contact information for communications regarding family planning services for adolescents. A higher share of sites offer services tailored to adolescents (63 percent in 2017 compared to 47 percent in 2011), and collaborate with other entities and maintain specialized confidentiality procedures for minors than in 2011 (Table 2). About one quarter of health centers (23 percent) reported that their largest site also provides family planning services at school-based health centers (data not shown).
Table 2: Share of Health Centers Reporting Services for Adolescents, 2011 and 2017
2011
2017
Offers contraceptive services tailored specifically for adolescents
47%*
63%
Collaborates with other entities on outreach activities to adolescents to meet their family planning needs
52%*
65%
Maintains separate contact information for communications regarding family planning services for adolescents
48%*
67%
NOTE: *Indicates a statistically significant difference from 2017, p<0.05.
A very small subset of health centers offers multiple contraceptive methods and services onsite, and health centers with Title X funding are more likely to do so. One in four health centers (24 percent) provides all seven of the most effective family planning methods24 onsite, and about half (48 percent) provide all seven methods either onsite or by prescription (Figure 6). Significant differences emerge when examining these findings by Title X funding status. Among health center sites that also receive Title X funding, 48 percent offer all seven methods onsite, while 72 percent offer all seven methods either onsite or by prescription. The performance of non-Title X sites is much more limited: only 15 percent of non-Title X health centers offer all seven methods onsite, while 40 percent offer them either onsite or by prescription.
Figure 6: Health Centers with Title X Status are More Likely to Provide Effective Family Planning Methods Onsite and to Offer Services Associated with High Quality Care
The proportion of health centers adhering to all best practices for providing contraception (the oral contraception quick start method, providing oral contraceptives without a pelvic exam, and providing emergency contraceptive ahead of time) is low (21 percent). Only 13 percent of non-Title X health centers do so, compared to 42 percent of Title X health centers. Finally, only six percent of all health centers show the highest level of performance, that is, they offer all seven effective methods onsite, follow all three contraceptive best practices, and offer same-day family planning visits for new patients. As with other performance indicators, Title X makes a big difference: two percent of non-Title X health center sites can be thought of as optimal performers compared to 17 percent of sites that also receive Title X funding.
Capacity to Absorb New Patients/ Referrals to Freestanding Family Planning Clinics
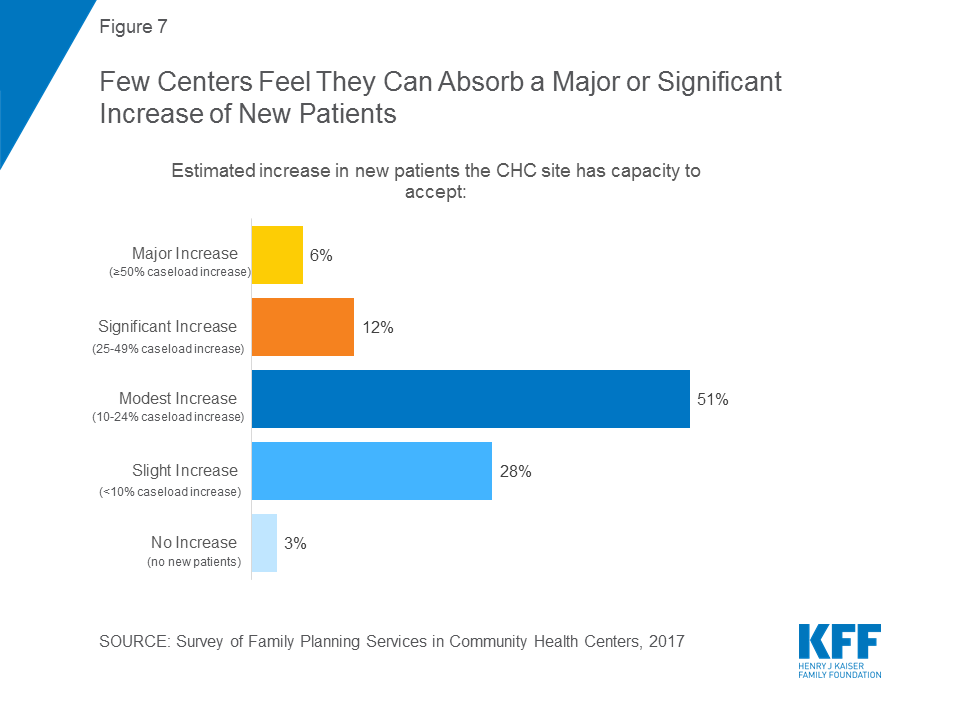
Few health centers report they can absorb a significant number of new patients given current staffing and space constraints. The recent health center expansion resulting from the ACA has occurred simultaneously with a marked decline in the number of freestanding family planning clinics.25 The majority of survey respondents (51 percent) said that – at most – they would be able to increase their new patient capacity between 10 and 24 percent (Figure 7). Only 6 percent reported that they could absorb a 50 percent or greater patient increase. These figures are consistent with findings from a study conducted in Texas following the reduction in access to publicly supported family planning services26 that shows the challenges in growing capacity at remaining providers quickly or substantially enough to overcome the loss of independent family planning clinics.
Figure 7: Few Centers Feel They Can Absorb a Major or Significant Increase of New Patients
Health centers are providing substantially fewer referrals to freestanding family planning clinics than in 2011. In 2017, among health centers that reported they had a freestanding family planning clinic in their community, only 36 percent reported regularly making referrals to such a clinic. By comparison, in our 2011 study, 78 percent of health centers reported regularly making referrals among those that reported a freestanding family planning clinic in their community.
In 2017, 24 percent of all health centers reported that referral was not an option because there was no family planning clinic in their community, a similar proportion to 2011. The lack of referral options in 2017 was far more common in rural and suburban health centers (40 percent) compared to urban health centers, only 7 percent of which reported no referral clinics. Referrals are more commonly reported by sites that do not get Title X funding (43 percent versus 13 percent among those that receive Title X funding).
Referrals may be falling for several reasons. One is the growth in health centers and expanded capacity to furnish services onsite, particularly more complex procedures such as those involved in LARC methods. Another factor may be the reduction in the number of freestanding family planning clinics locally.27 Other reasons may be changes in care-seeking preferences of family planning patients (a desire to obtain all needed services in one place) and changes in overall standards of primary care practice, with a greater emphasis on the role of community health centers as comprehensive health homes.
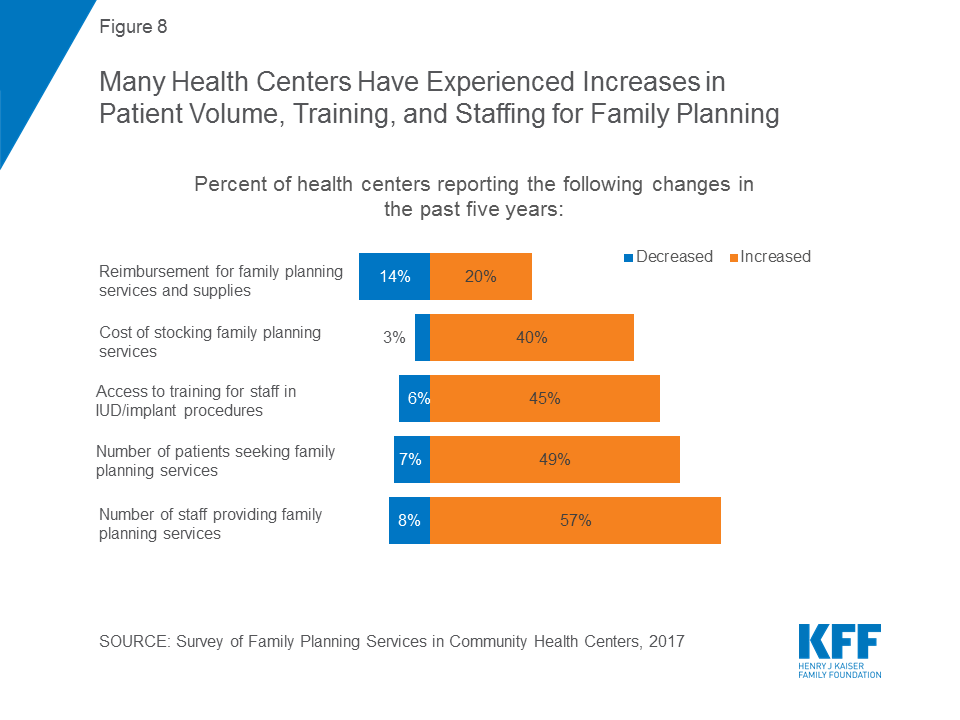
When asked to describe how their family planning services have changed in the past five years, health centers identify several factors, including reimbursement, staffing, and patient volume. Patient demand for family planning services rose for 49 percent of health centers; this was notable for both Title X grantees (64 percent) and, to a significantly lesser extent, for non-Title X sites (42 percent). In parallel, far more health centers reported family planning staffing increases (57 percent) than decreases (8 percent) (Figure 8). Access to training for staff in IUD and implant procedures rose. This was significantly different for Title X sites, where 62 percent reported an increase in access to training for staff, compared to 39 percent of sites that do not receive Title X funds. Nearly half (45 percent) of all health center sites report a decline in the number of uninsured patients, consistent with the reduction in the number of uninsured resulting from the ACA coverage expansions. A sizable minority of sites (40 percent) reported experiencing increases in the costs of stocking family planning supplies, and this was significantly higher among those that participated in Title X (51 percent) than those that did not (37 percent), likely because a higher share of Title X sites offered more costly methods like IUDs onsite.
Figure 8: Many Health Centers Have Experienced Increases in Patient Volume, Training, and Staffing for Family Planning
Barriers to Providing High Quality Family Planning Care
Health centers report several major barriers to meeting patients’ family planning and reproductive health needs at their largest sites, most of which are related to the affordability of care for patients and the cost to the health center of maintaining a robust family planning practice. Twenty-five percent reported the lack of insurance coverage among patients as a major barrier, while 28 percent reported high patient cost-sharing as an issue (Table 3). In terms of their ability to maintain robust programs, one in four health centers (24 percent) reported the high cost of stocking contraceptives onsite as a major barrier. Twenty percent reported high patient demand for other primary care services at their largest site as a major barrier, which kept them from focusing additional resources on family planning. Nineteen percent reported a lack of staff trained in IUD/implant procedures as a major barrier, and 19 percent reported inadequate insurance payments. Lack of culturally and/or linguistically appropriate materials or services (3 percent), lack of stocking space (7 percent), lack of staff (11 percent), or religious or moral concerns among staff or board members (4 percent) were reported as barriers by a smaller share of health centers.
Table 3 : Share of Health Centers Experiencing Major Barriers to the Provision of Family Planning Services, 2017,by Title X and ACA Medicaid Expansion
All respondents
Title X status
ACA Medicaid Expansion Status
Non-Title X grantee sites
Title X grantee sites
Sites in non-expansion states
Sites in ACA Medicaid expansion states
High out of pocket costs for patients
28%
31%*
17%
39%*
21%
Lack of insurance coverage among patients
25%
28%*
17%
41%*
15%
High cost to have contraceptives in stock
24%
29%*
9%
22%
26%
High patient demand for other primary care services
20%
23%
15%
22%
20%
Lack of staff trained in IUD/implant procedures
19%
22%*
9%
21%
18%
Inadequate insurance reimbursement/payments
19%
22%*
12%
28%*
15%
NOTE: *Indicates a statistically significant difference between Title X and non-Title X grantee sites and between sites in non-expansion states and ACA Medicaid expansion states, p<0.05.
Title X-funded sites are significantly less likely than those that do not receive Title X funding to report certain barriers. Title X sites are less likely to report a lack of insurance coverage among patients, high out-of-pocket costs for patients, a lack of staff trained in IUD/implant procedures, the high cost of keeping contraceptives in stock, or inadequate insurance payments as major barriers to meeting the family planning and reproductive health needs of their patients. The latter four findings hold true even after controlling for location in a Medicaid expansion state, size, and urban vs. rural/suburban location (see Table B in Appendix). In addition, rural/suburban health centers are more likely to report a lack of staff trained in IUD/implant procedures (27 percent) as a major barrier, more than double the share of urban health centers that do (10 percent). Small health centers28 are also more likely to report this barrier, compared to large health centers (24 percent versus 14 percent). However, large health centers (23 percent) are more likely than small health centers (15 percent) to report that inadequate reimbursement is a major barrier to meeting the needs of their community.
Health centers in Medicaid expansion states are less likely to experience certain barriers to providing family planning care, especially barriers related to insurance and costs of care. While 41 percent of sites in non-expansion states experience the lack of insurance coverage among their patients as a major barrier, this percentage drops to 15 percent in states that have expanded Medicaid. Similarly, high out-of-pocket costs for patients are a major barrier in 39 percent of non-expansion state sites but in only 21 percent of expansion state sites. Significant differences between sites in expansion and non-expansion states persist after controlling for Title X grantee status, size, and urban vs. rural/suburban location (see Table B in Appendix).
Implications
Family planning and related services are essential to the health of women and families. For this reason, provision of high quality family planning services ought to be central to community health centers’ mission, not only because family planning is a required service but because community health centers play such a central role in women’s health. Thirty percent of all low-income women of reproductive age rely on community health centers, and women of reproductive age represent one quarter (26 percent) of all community health center patients. As community health centers have grown, and as other sources of accessible, affordable family planning services have shrunk, community health centers’ role in family planning has become increasingly important.
In thousands of communities, residents continue to rely on independent family planning clinics, which remain an essential part of the primary care landscape. Indeed, as the referral findings in this report suggest, many community health centers depend on collaboration with independent family planning clinics to help meet the sexual and reproductive health needs of their communities.
This report shows some of the ways in which community health center family planning services have strengthened. Between 2011 and 2017, the proportion of community health centers offering highly effective contraceptive implants onsite increased significantly among both Title X and non-Title X funded community health centers. However, the evidence also shows wide variation in health centers’ ability to meet women’s reproductive health care needs. These findings suggest that while some health centers have strengthened their services and performance, others fall short of the broad range of contraceptive methods and simplified access to care that are considered essential to modern, high quality family practice performance.
It is clear from this survey that Title X participation makes a significant difference in community health center performance. Some of this difference can be attributable to the fact that Title X grantees are dedicated to providing family planning services and have access to additional resources targeted to upgrading and improving family planning care. One would expect more dedicated and specially trained staff to provide a wider array of onsite services commensurate with Title X requirements. In addition, unlike Title X, Section 330 of the Public Health Service Act leaves many of the key details of clinical practice to community health centers, which in turn may contribute to highly variable care. Given their obligations to patients of all ages and their limited operational resources, community health centers must continually balance resource allocation against the full scope of community need, but the result is that some clinics fall short in meeting current standards of family planning care. As suggested by the FOA for Title X funding, the Trump Administration is changing the evidence -based requirements for Title X clinics, which will have severe implications for the provision of quality family planning at Title X clinics.
Some of the differences between community health centers that do and do not receive Title X funding are striking. Some involve relatively low practice transformation strategies to update older and outdated practices; these strategies should be well within reach regardless of the availability of additional Title X funding. For example, it is not clear why only half or fewer than half of all community health centers offer onsite access to oral contraceptives (51 percent) or emergency contraception (40 percent for plan B or other OTC EC); indeed, between 2011 and 2017, onsite oral contraceptive dispensing dropped by 17 percent, and a sizable minority of clinics do not dispense, prescribe, or refer for EC (15 percent for Plan B and 28 percent for ella). Nor is it clear why only 62 percent of community health centers report that new patients can secure a prescription for oral contraceptives without a pelvic exam and only 31 percent of community health centers will dispense or prescribe emergency contraception ahead of time. These practices are now considered the standard in the field and are elements of high quality care that require the introduction of healthcare efficiencies rather than major new resources. The value of focusing on relatively modest efficiency changes in the provision of family planning services that can improve access and quality thus emerges as an important report conclusion.
Important differences remain with respect to community health center size and rural/suburban or urban location, but measurable improvements involving highly effective family planning services have occurred in recent years. Similarly, over three-quarters of community health centers report that they routinely screen young women for chlamydia, screen for intimate partner violence, and ask about pregnancy intention. These numbers suggest the beneficial effects of evidence-based quality performance measures and the systematic introduction of best practices and the extent to which careful focus on performance can translate into greater quality.
It is particularly important to note the finding that only half of community health centers say they can handle a modest (10 to 24 percent) increase in patient capacity, and almost three in ten say they can only accommodate a slight (less than 10 percent) increase in new patients. A common theme among proposals to block Planned Parenthood from the Medicaid program is the redirection of funds to other providers, such as community health centers, with the expectation that other clinics could meet the needs of those formerly served by Planned Parenthood. However, this survey suggests that these health centers may not have the capacity to fill the void if Planned Parenthood were excluded as a Medicaid or Title X provider. In addition, this survey shows that many health centers are not providing the full range of methods to which women need access. Other studies have found that Planned Parenthood clinics are more likely to offer women the full range of contraceptive and family planning services. This survey confirms that many health centers not only do not feel equipped to absorb many new patients; many also do not offer the broad scope of services that are part of the current standard of high quality family planning care.
Finally, this study shows the value of a program such as Title X – not only as a vital source of funding for clinics that focus on reproductive health and ensuring access to comprehensive contraceptive methods but also as means for leveraging performance improvement among health centers that focus more broadly on the provision of primary care. Given the limited amount appropriated to Title X and the ongoing need for Title X funding in communities across the nation, a possible approach to improve the scope of family planning offered by all community health centers would be to dedicate a specified proportion of 330 funding to assist health centers in achieving specific family planning performance improvement. A strategy that combines supplemental funding with clear family planning improvement performance expectations is a permissible activity under the health center program itself.
Section 50901 of the Balanced Budget Act of 2018 (Pub. L. 115-123), which extends the Affordable Care Act’s health center grant fund through the end of Fiscal Year 2019, explicitly authorizes HHS to use a portion of these additional funds to make targeted improvements in primary health care quality improvement. The health centers program has successfully used this targeted supplemental grant approach for other high community needs such as maternity care, substance use addiction treatment, mental health, and oral health. Based on this study’s findings regarding the impact of dedicated Title X funding, and in view of community health centers’ central role in the health of low income women of childbearing age, a well-designed family planning initiative as central part of the health center program itself can be expected to promote the availability and quality of health center family planning services.
Appendix
Table A: Adjusted odds ratios for prescribing or dispensing contraceptive methods onsite
Title X grantee
Large site
Urban
Medicaid expansion state
Oral contraceptives (OCs)
5.17*
1.52
1.18
0.75
Hormonal IUDs
4.30*
1.67*
1.76*
1.05
Copper IUD
4.24*
1.98*
1.66*
1.18
Implant
6.31*
1.72*
1.28
1.00
Injectable
4.84*
1.64
0.68
1.07
Patch
3.04*
1.50
1.34
1.06
Ring
4.47*
1.32
1.15
0.95
Diaphragm, cervical cap
2.17*
1.35
1.00
0.96
Natural family planning instruction
2.91*
1.42
1.09
1.26
Plan B
4.09*
1.11
1.67*
2.40*
ella
2.97*
1.13
1.95*
1.75
NOTE: *p<0.05.
Table B: Adjusted odds ratios for major barriers to meeting the family planning and reproductive health needs of patients
Title X grantee
Large site
Urban
Medicaid expansion state
Lack of insurance coverage among patients
0.60
0.97
1.07
0.26*
High out of pocket costs for patients
0.53*
1.05
0.89
0.46*
High patient demand for other primary care services
Gavin, L., Moskosky, S., Carter, M., Curtis, K., Glass, E., Godfrey, E., Marcell, A., Mautone-Smith, N., Pazol, K., Tepper, N. (2014). Providing Quality Family Planning Services Recommendations of CDC and the U.S. Office of Population Affairs. Retrieved from: https://www.cdc.gov/mmwr/pdf/rr/rr6304.pdf. Accessed March 22, 2017. ↩︎
Wood, S., Goldberg, D., Beeson, T., Bruen, B., Johnson, K., Mead, H., … Rosenbaum, S. (2013). Health Centers and Family Planning: Results of a Nationwide Study. Retrieved from: http://hsrc.himmelfarb.gwu.edu/sphhs_policy_facpubs/60. Accessed January 11, 2017. ↩︎
Data derived from the Health Resources and Services Administration, Uniform Data System; calculations by GW ↩︎
42 U.S.C. § 254b(b)(1)(A) and (k)(3) (Because “look-alike” is conditioned on satisfaction of all federal health center requirements, family planning also would be a required service at look-alike health centers as well.) ↩︎
Wood, S., Goldberg, D., Beeson, T., Bruen, B., Johnson, K., Mead, H., … Rosenbaum, S. (2013). Health Centers and Family Planning: Results of a Nationwide Study. Retrieved from: http://hsrc.himmelfarb.gwu.edu/sphhs_policy_facpubs/60. Accessed January 11, 2017. ↩︎
Categories: at or above the median number of patient visits (15,000) reported at the site in calendar year 2016. ↩︎
UDS does not include a category for suburban, and location is defined by health center self-report. At the site level, 60 percent were urban and 40 percent were rural, while at the grantee level, 56 percent were urban and 44 percent were rural (source: GW analysis of 2016 Uniform Data System [UDS] data). ↩︎
Upon re-analysis of the 2011 data, some findings differed slightly (<1%) from previously published percentages due to rounding. ↩︎
Gavin, L., Moskosky, S., Carter, M., Curtis, K., Glass, E., Godfrey, E., Marcell, A., Mautone-Smith, N., Pazol, K., Tepper, N. (2014). Providing Quality Family Planning Services Recommendations of CDC and the U.S. Office of Population Affairs. Retrieved from https://www.cdc.gov/mmwr/pdf/rr/rr6304.pdf. Accessed March 22, 2017. ↩︎
Gavin, L., Moskosky, S., Carter, M., Curtis, K., Glass, E., Godfrey, E., Marcell, A., Mautone-Smith, N., Pazol, K., Tepper, N. (2014). Providing Quality Family Planning Services Recommendations of CDC and the U.S. Office of Population Affairs. Retrieved from: https://www.cdc.gov/mmwr/pdf/rr/rr6304.pdf. Accessed March 22, 2017. ↩︎
Gavin, L., Moskosky, S., Carter, M., Curtis, K., Glass, E., Godfrey, E., Marcell, A., Mautone-Smith, N., Pazol, K., Tepper, N. (2014). Providing Quality Family Planning Services Recommendations of CDC and the U.S. Office of Population Affairs. Retrieved from: https://www.cdc.gov/mmwr/pdf/rr/rr6304.pdf. Accessed March 22, 2017. ↩︎
Gavin, L., Moskosky, S., Carter, M., Curtis, K., Glass, E., Godfrey, E., Marcell, A., Mautone-Smith, N., Pazol, K., Tepper, N. (2014). Providing Quality Family Planning Services Recommendations of CDC and the U.S. Office of Population Affairs. Retrieved from: https://www.cdc.gov/mmwr/pdf/rr/rr6304.pdf. Accessed March 22, 2017. ↩︎
The seven effective methods include: hormonal IUDs, copper IUDs, the implant, the injectable, oral contraceptives, the contraceptive ring, and the contraceptive patch. ↩︎
Ku, L., Cartwright-Smith, L., Sharac, J., Steinmetz, E., Lewis, J., & Shin, P. (2012). Deteriorating access to women’s health services in Texas: potential effects of the Women’s Health Program affiliate rule. Geiger Gibson/RCHN Community Health Foundation Research Collaborative, George Washington University. Policy Research Brief No. 31. Retrieved from: http://www.rchnfoundation.org/?p=913↩︎
In this March 2018 post for The JAMA Forum, Larry Levitt unpacks the elements of a single payer health plan to understand its policy aims and how they might be accomplished, as well its political opportunities and vulnerabilities.
Other contributions to The JAMA Forum are also available.
A new nationally-representative survey of women from the Kaiser Family Foundation finds that coverage rates for women are at all-time highs and use of preventive services is on the rise, but many women still face a wide range of affordability and other access challenges. Conducted in the summer and fall of 2017, the survey provides a national overview of women’s health care coverage, access, affordability, and experiences among nonelderly women (ages 18 to 64) in the U.S.
Highlights include:
Affordability and Access to Care
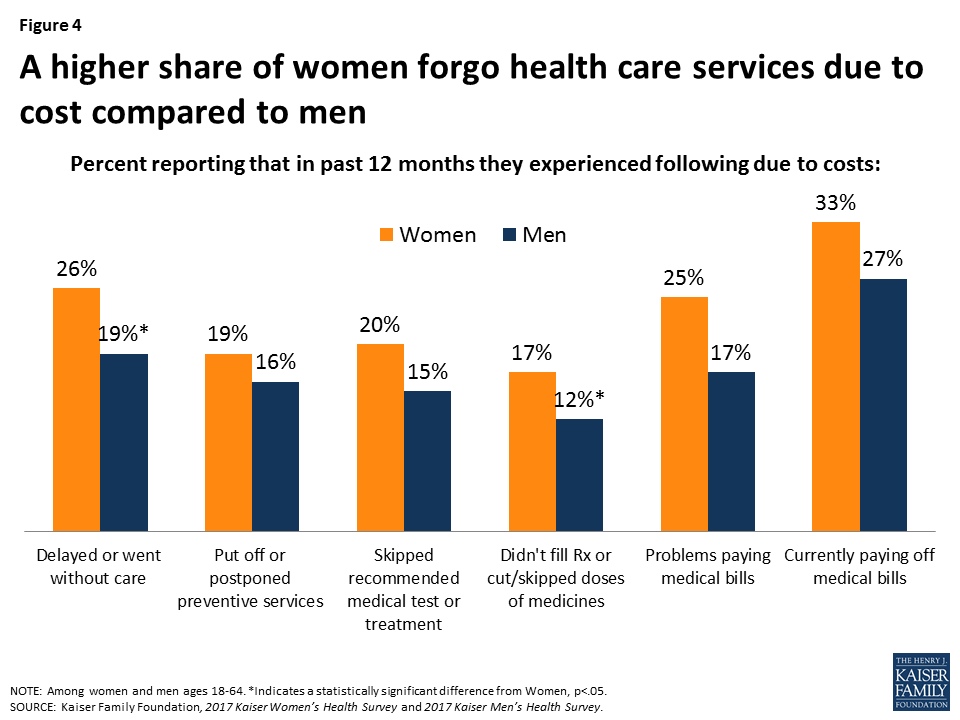
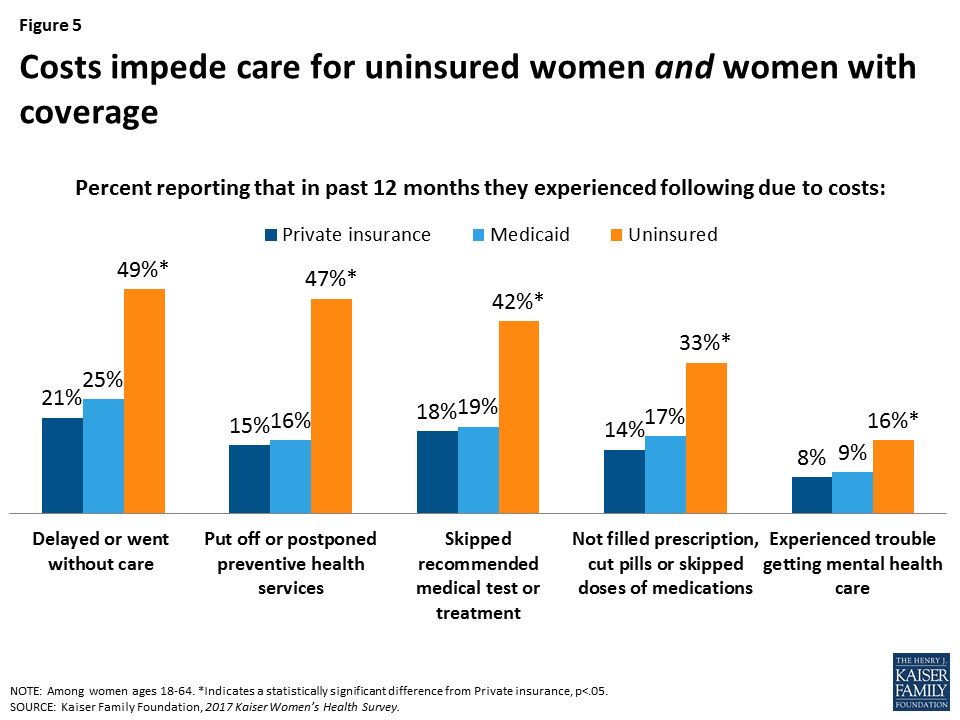
Despite increases in coverage under the ACA, 26 percent of women report that they delayed or went without care due to cost in 2017. This was a problem for half of uninsured women (49%) compared to 21 percent of privately insured women and 25 percent of women on Medicaid.
In addition, 23 percent of all women and 34 percent of low-income women say they didn’t receive timely care because they couldn’t take time off work.
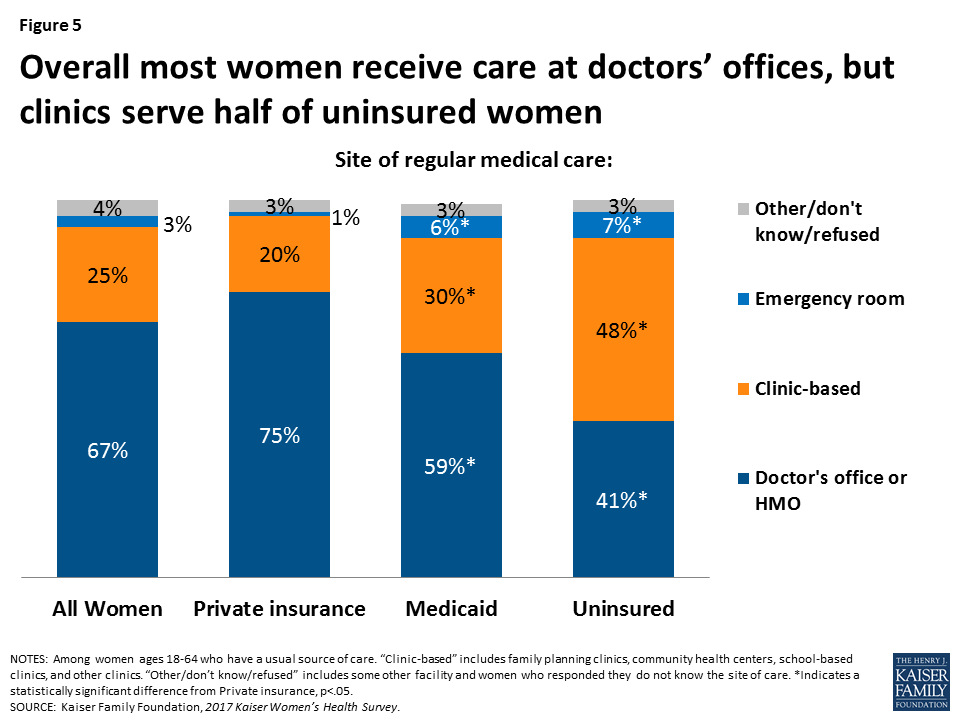
While most women (67%) report that they get their care from doctor’s offices, 48 percent of uninsured women, 43 percent of Latinas, and 26 percent of African American women rely on clinics for their care.
Reproductive and Sexual Health
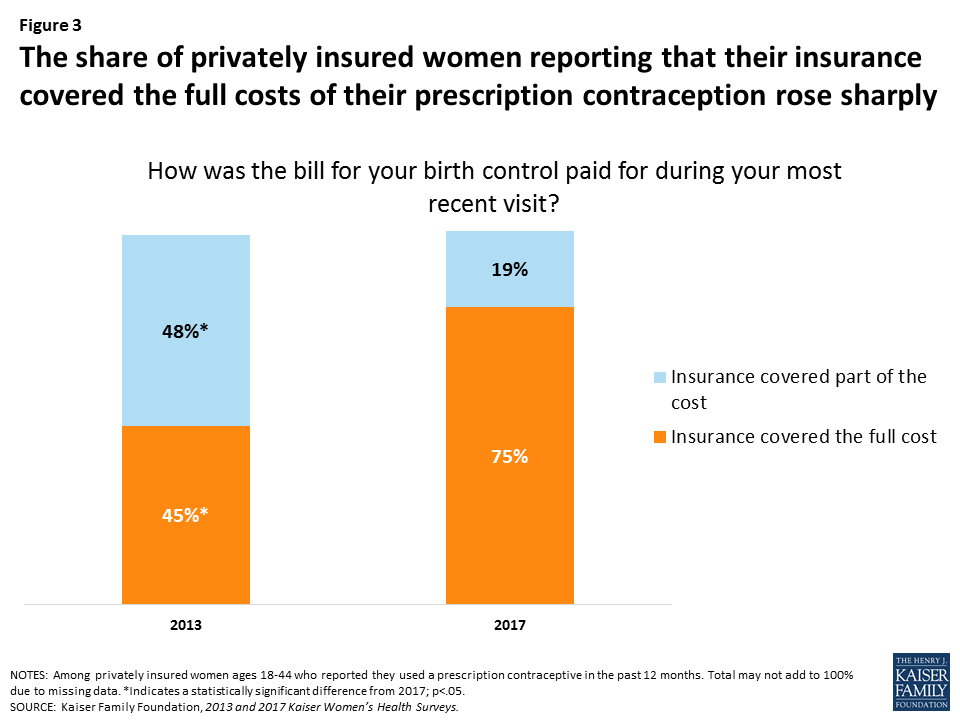
75 percent of privately insured women ages 18-44 using prescription contraception report that their insurance covers the full cost of contraceptives, up sharply from 45 percent in 2013 before the ACA required most private plans to provide no-cost coverage of contraceptive services.
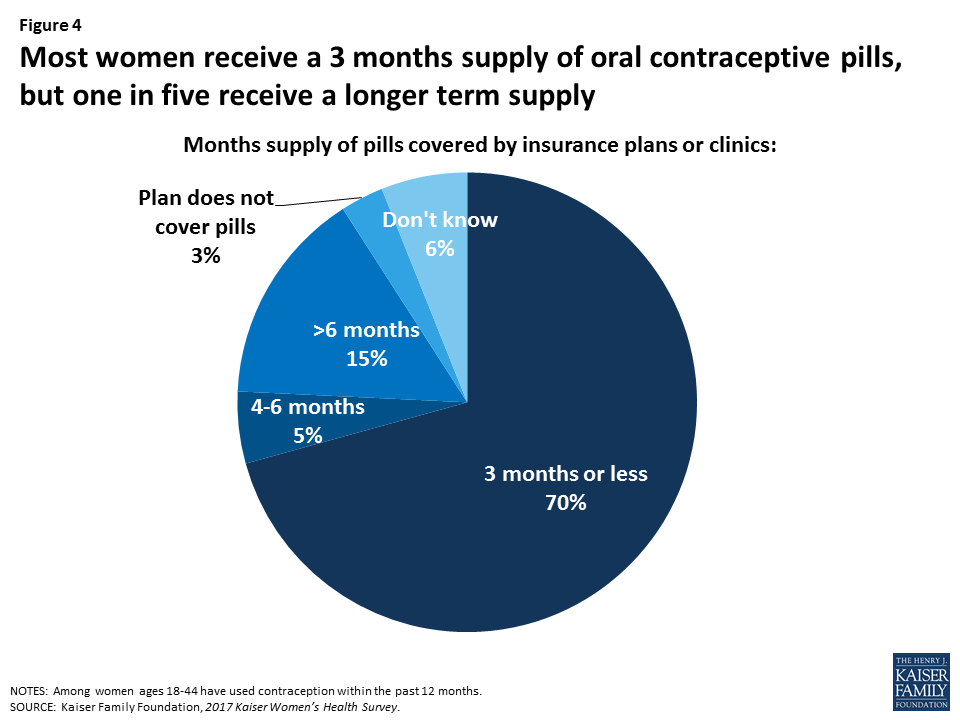
Most women who use oral contraceptives report that their plan or clinic provides up to a 3 month supply (70%), but 25 percent of women reported that they missed a pill because they could not get their next pack in time.
Preventive Care
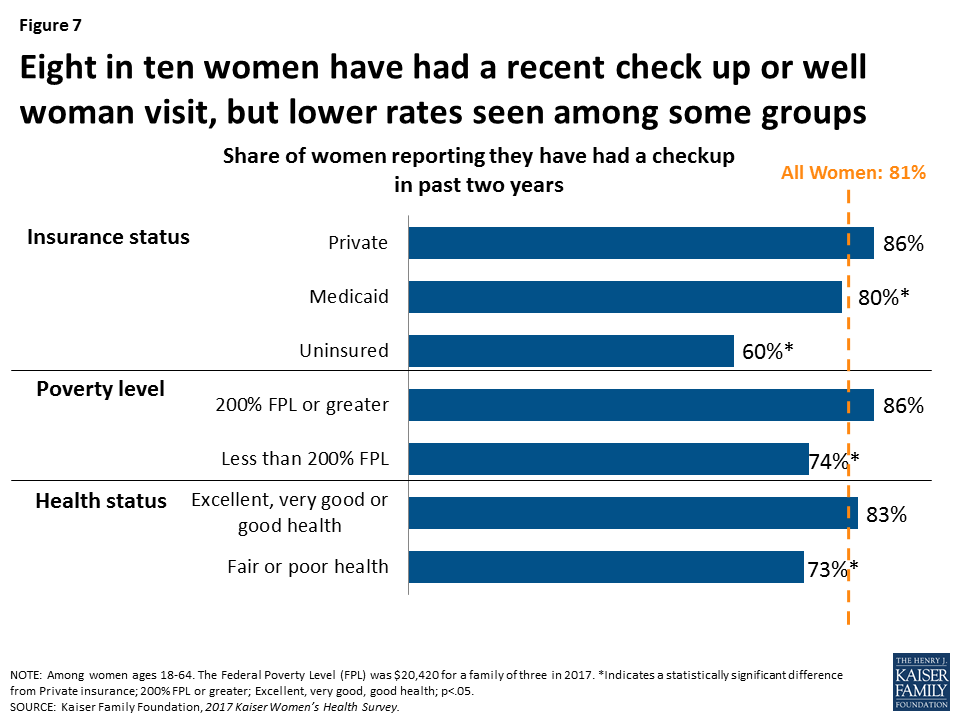
81 percent of women reported that they had a checkup or well woman visit in the past two years, which the ACA requires no-cost coverage for.
Provider counseling on some topics have risen, with 75 percent of women reporting that clinicians discussed diet, exercise, or nutrition with them in the prior three years, up from 56 percent in 2004. Counseling rates for drug and alcohol use (40%) and intimate partner violence (27%) have also risen, but are still quite low.
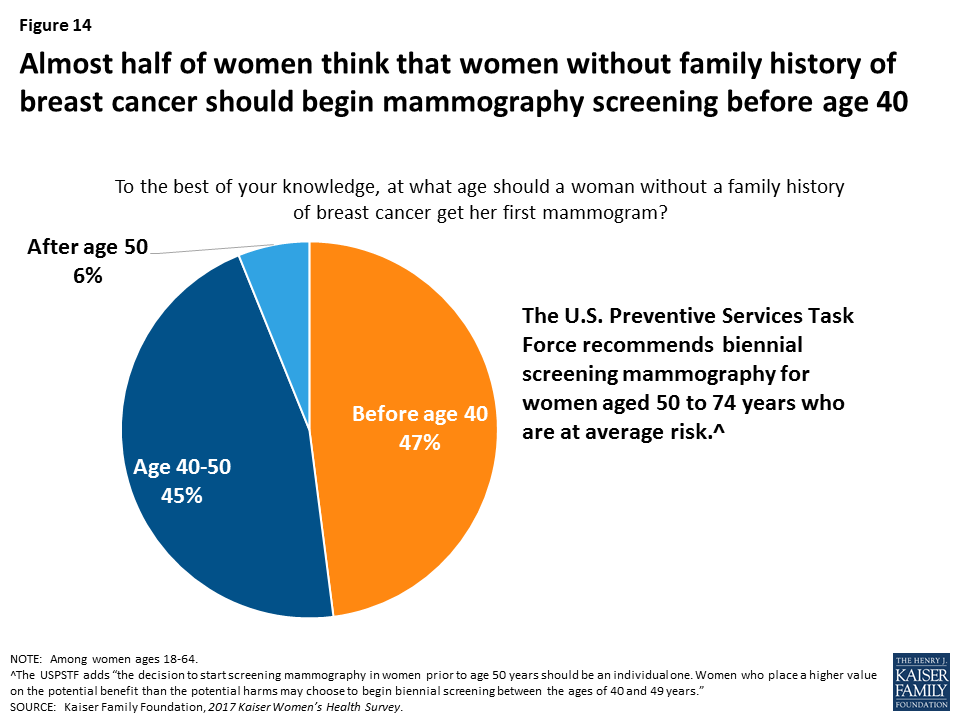
47 percent of women say that women without family history of breast cancer should begin mammography screening before age 40. Guidelines from several professional organizations recommend starting at age 40 or later.
Work and Family Health
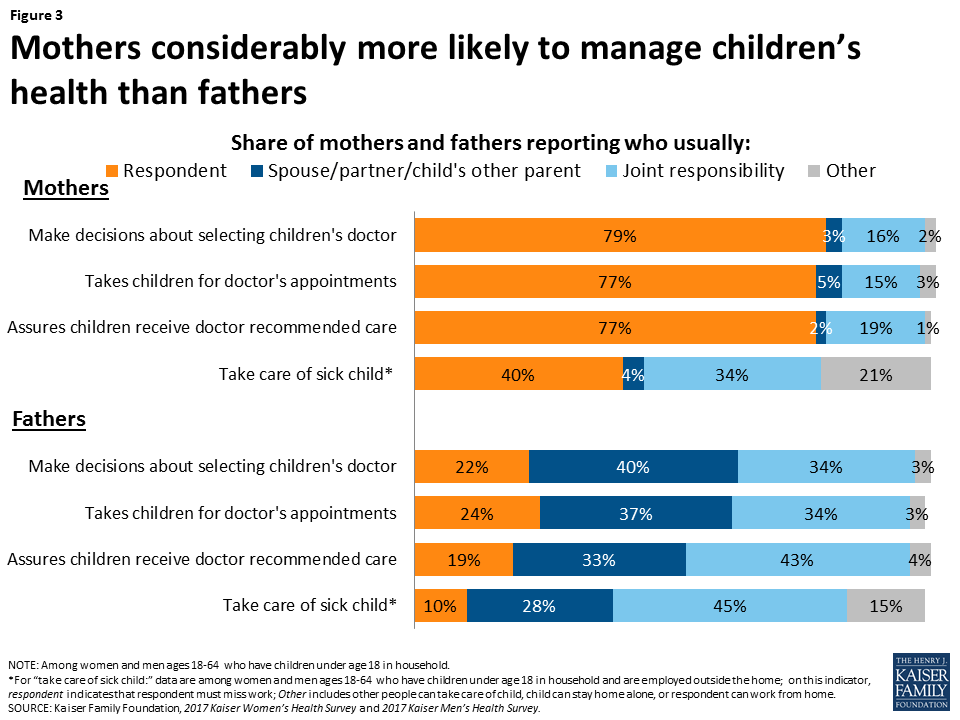
In most households, women manage children’s health care needs: About three-quarters of mothers report taking charge of health care responsibilities such as taking children to appointments and getting follow up care.
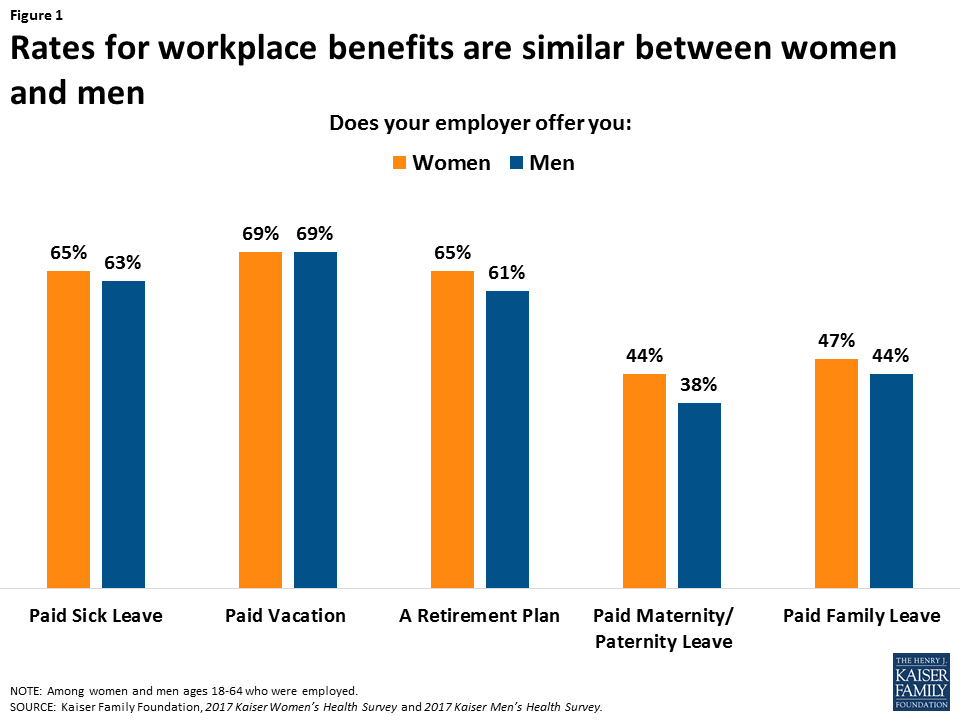
About two-thirds of women report that their employers offer paid sick leave (65%) and paid vacation (69%), but far fewer have paid maternity leave (44%) or paid family leave (44%).
The 2017 Kaiser Women’s Health Survey was conducted from July 26 to September 27, 2017 among a nationally representative sample of 2,751 women ages 18 to 64 living in the United States. The survey was designed and analyzed by KFF staff; fieldwork was conducted by Princeton Survey Research Associates International (PSRAI). Telephone interviews conducted by landline and cell phone were carried out in English and Spanish. The margin of sampling error is plus or minus 2.8 percentage points.
Health care is a central component of women’s lives, affecting their ability to care for themselves and their families, play a part in their communities, and participate in the workforce and earn a living. Access to comprehensive, affordable, and high quality care is essential for women to address their health care needs – which change across their lifespans. Women’s access to care is shaped by a wide range of factors, including federal and state health care policies. The passage of the Affordable Care Act (ACA) in 2010 marked a significant change in the availability and affordability of coverage and care for millions of formerly uninsured women and men.
The 2017 Kaiser Women’s Health Survey, a nationally-representative survey of women ages 18 to 64 finds that coverage rates for women are at all-time highs and use of preventive services is on the rise, but many women still face a wide range of affordability and other access challenges. This survey is the latest in a periodic series of surveys on women’s health conducted by the Kaiser Family Foundation approximately every four years since 2001. The new survey was conducted in the summer and fall of 2017 and included a nationally representative sample of 2,751 women ages 18 to 64. In addition, a shorter survey of 600 men ages 18 to 64 was conducted and key findings are included for comparison. The findings presented in this report examine women’s coverage, access, and affordability of care, their connections to the health care delivery system and use of preventive care, use of reproductive health services, and responsibilities caring for family health needs.
Executive Summary
Introduction
Health care is a central component of women’s lives, affecting their ability to care for themselves and their families, play a part in their communities, and participate in the workforce and earn a living. Access to comprehensive, affordable, and high quality care is essential for women to address their health care needs – which change across their lifespans. Women’s access to care is shaped by a wide range of factors, including federal and state health care policies. The passage of the Affordable Care Act (ACA) in 2010 marked a significant change in the availability and affordability of coverage and care for millions of formerly uninsured women and men. In addition to expanding coverage to more uninsured individuals, the law included provisions to address long-standing insurance practices that were discriminatory and had a disproportionate effect on women. Now all plans must include maternity benefits, are barred from gender rating where women are charged more than men for the same plan, and must cover, without cost sharing, recommended preventive services such as contraceptives.
The Kaiser Family Foundation has conducted the Kaiser Women’s Health Survey approximately every four years since 2001 to provide a look into the range of women’s health care experiences, especially those that are not typically addressed by most surveys. The findings presented in this report examine women’s coverage, access, and affordability of care, their connections to the health care delivery system and use of preventive care, use of reproductive health services, and responsibilities caring for family health needs. The survey was conducted in the summer and fall of 2017 and included a nationally representative sample of 2,751 women ages 18 to 64. In addition, a shorter survey of 600 men ages 18 to 64 was conducted and key findings are included for comparison.
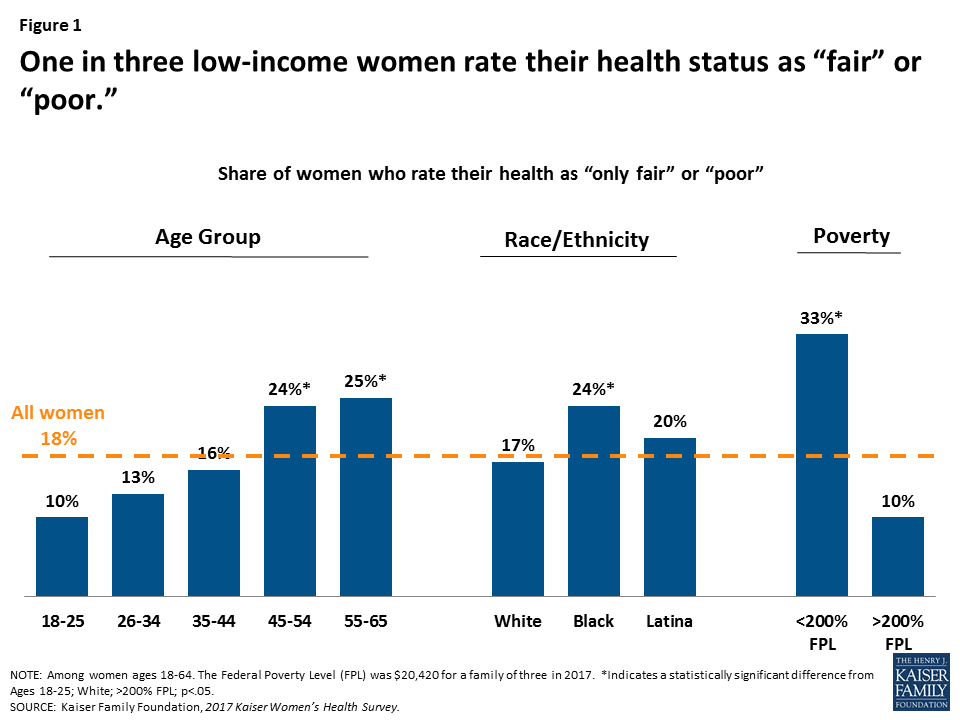
The 2017 survey compares findings to earlier years when possible and highlights differences for uninsured, low-income, and minority women–groups of women that have been historically underserved. Nearly three in ten women ages 18 to 64 live in households that are below 200% of the federal poverty level (FPL) which was $20,420 for a family of three in 2017. Nearly two in five women identify as racial and ethnic minorities (13% Black, 16% Latina, and 9% Asian or Other) and half are in their childbearing years. A sizable minority of women also report that their health is fair or poor (18%) and over four in ten have a health condition that requires monitoring and treatment (45%). For these women in particular, access to health care is an essential and ongoing concern. Key findings include:
Coverage and Access
The share of women with health coverage has increased since the ACA was implemented, but one in ten women remain uninsured.
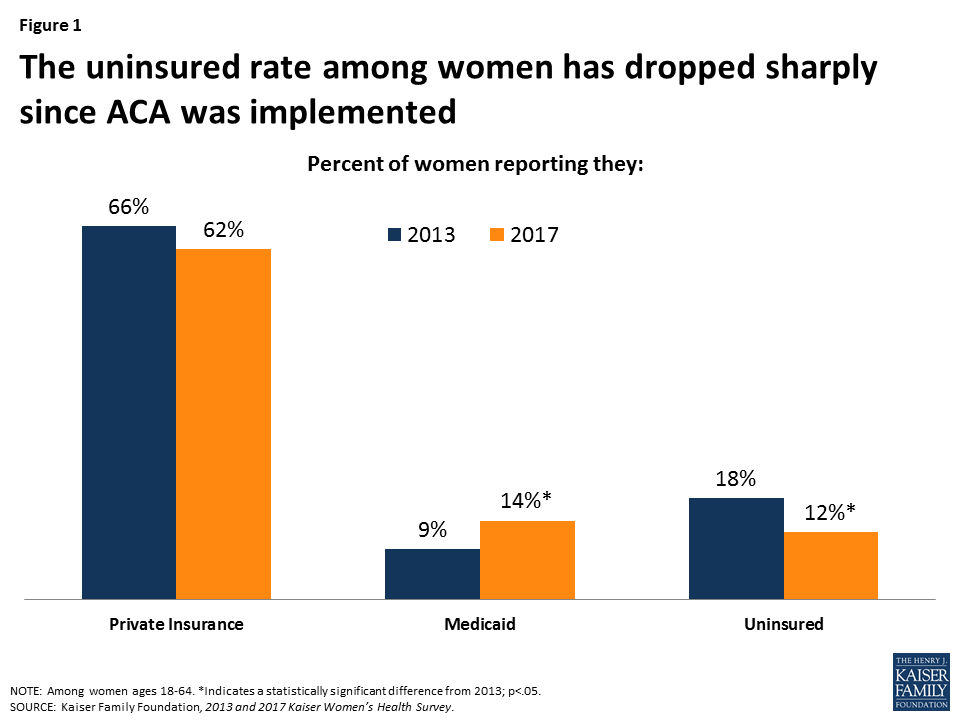
The Kaiser Women’s Health Survey finds that approximately one in ten (12%) non-elderly adult women report being uninsured in 2017, down from 18% in 2013 (Figure 1). An additional 8% of women who were insured at the time of the survey had a lapse in coverage in the prior year. Most women are still insured through a private plan, either employer sponsored or one they bought on their own; however, the greatest increase in coverage occurred through the expansion of the Medicaid program, which now covers 14% of women ages 18 to 64, up from 9% in 2013.
Figure 1: The uninsured rate among women has dropped sharply since ACA was implemented
Despite expansions in coverage, many women still experience cost-related barriers to care and face medical bills that force them to make difficult tradeoffs. For some women, logistical problems such as a lack of childcare or difficulty taking time off work pose barriers to care.
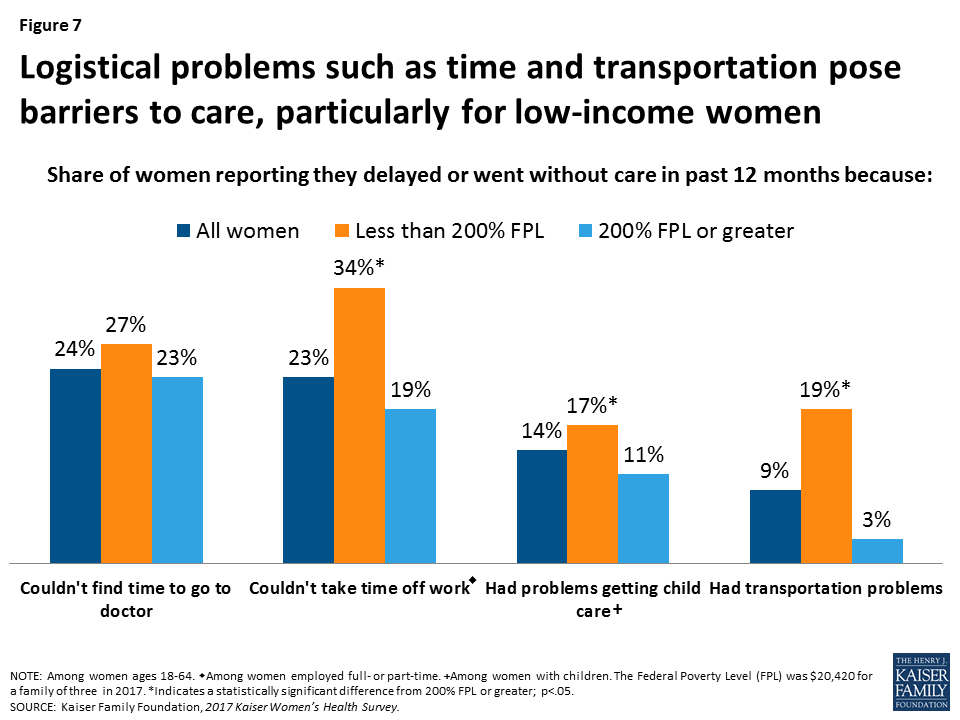
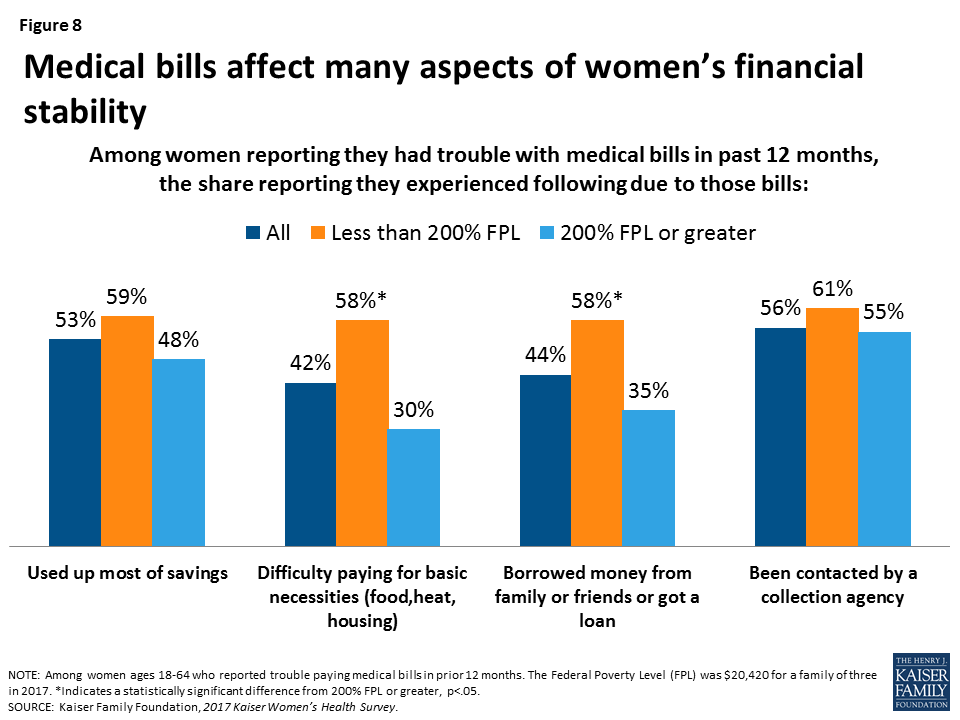
Roughly one in four (26%) women report that they delayed or went without care in the prior year due to costs. This rises to half of uninsured women (49%), and is also the case for 25% of women with Medicaid and 21% with private insurance. One in four women report trouble paying medical bills in the last year, and a substantial share say they used up most of their savings or borrowed money to pay off bills. About one in four women report they did not obtain care because they could not find the time (24%) or take time off work (23%) (Figure 2). Some women go without or delay care because of problems with childcare (14%) or transportation (9%). These barriers are more common among low-income women.
Figure 2: Logistical problems such as time and transportation pose barriers to care, particularly for low-income women
Delivery System
Most women have a usual place and provider they go to for care, but uninsured and low-income women have weaker connections to the delivery system.
The vast majority of women say they have a place to go when they need care (83%), have a doctor that they see regularly (79%), and have seen a provider in the past two years (90%). These rates remain consistent since 2013. Uninsured women in general have much weaker connections to the health care system, with about half reporting they have a regular site of care (55%) and clinician (49%). Women who are younger, Latina, or low-income are also less likely to have these connections to the health care system.
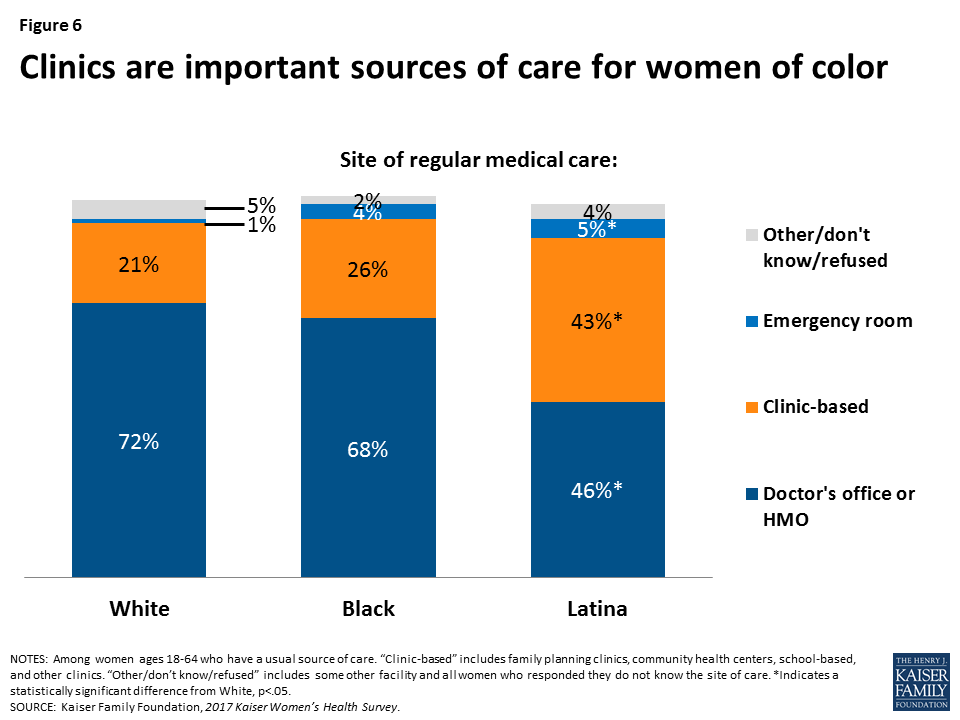
Most women get their care from doctors’ offices, but clinics are particularly important for women of color, low-income women, and the uninsured.
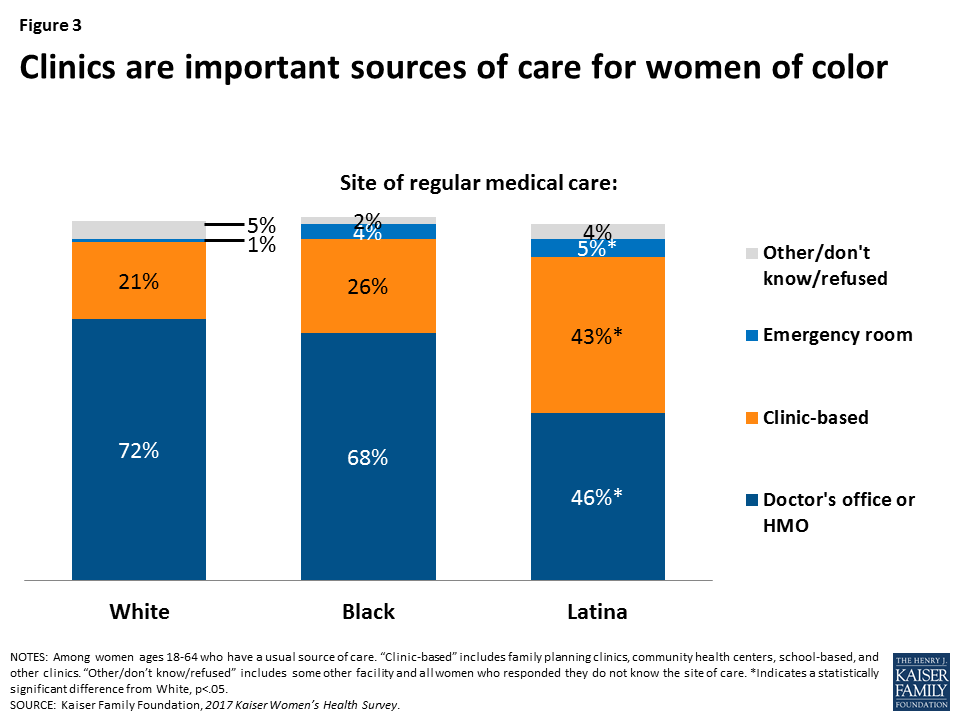
Two-thirds of women who have a usual source of care receive their care at a doctor’s office. A quarter of women seek care at a clinic, such as a community health center. Latina women (43%) and women covered by Medicaid (30%) are more likely to go to a clinic as their usual site of care (Figure 3).
Figure 3: Clinics are important sources of care for women of color
Rates of provider counseling for several health issues such as diet, smoking, and alcohol or drug use have increased over the past several years.
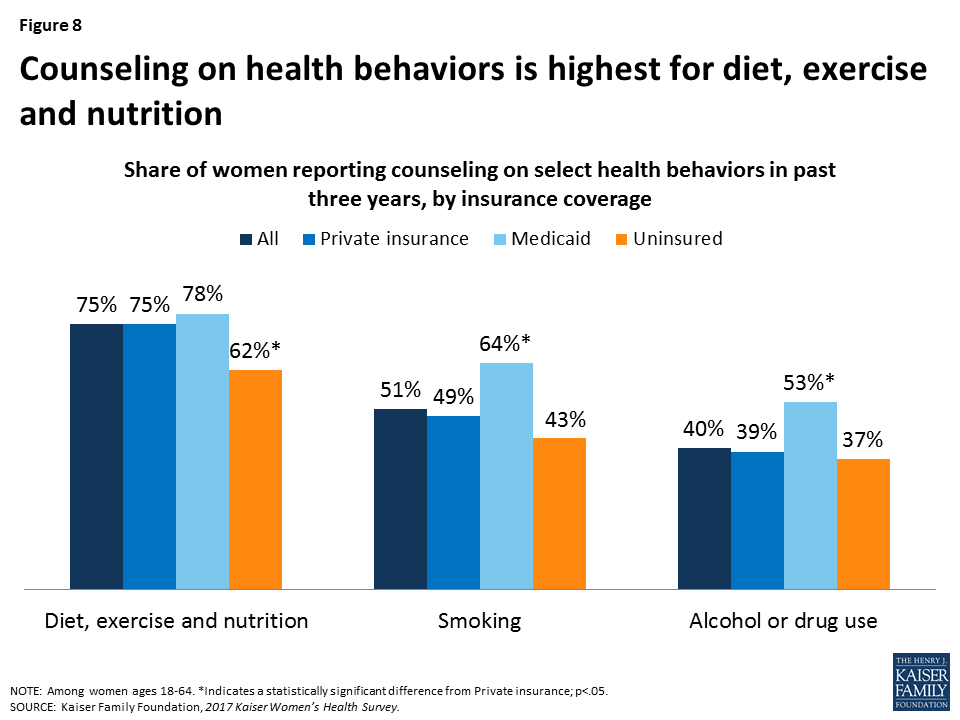
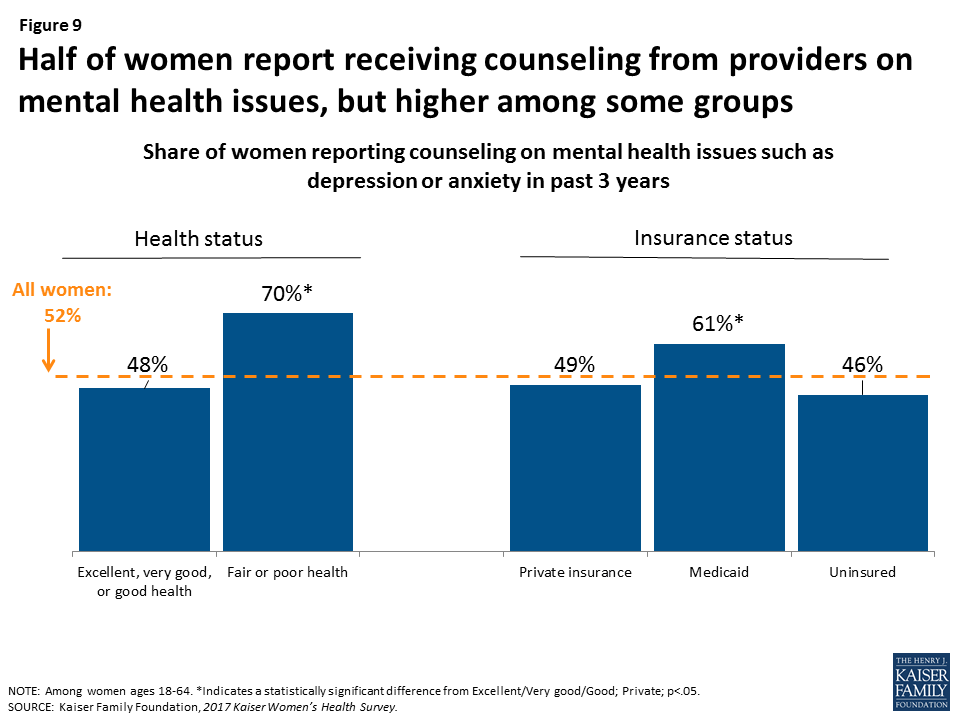
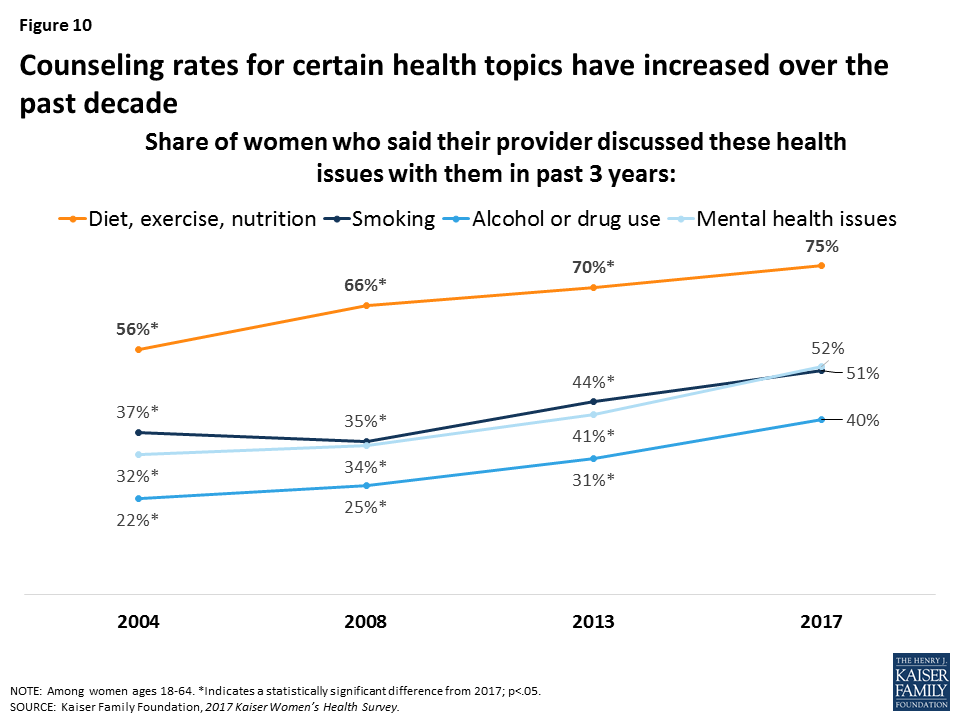
Professional organizations such as the U.S. Preventive Services Task Force (USPSTF) recommend providers discuss a wide range of preventive health topics in the primary care setting, including diet and exercise, alcohol misuse, and smoking. Diet, exercise, and nutrition remains the most frequently discussed health issue, with 75% of women saying a provider has discussed this topic with them in the past three years, up from 56% in 2004 (Figure 4). Rates of provider counseling on other issues are lower, including for smoking (51%), alcohol and drug use (40%), and mental health (52%), but have been rising steadily for more than a decade.
Figure 4: Counseling rates for certain health topics have increased over the past decade
Many women think that women should begin screening tests for breast and cervical cancers at an earlier age than recommended by national groups.
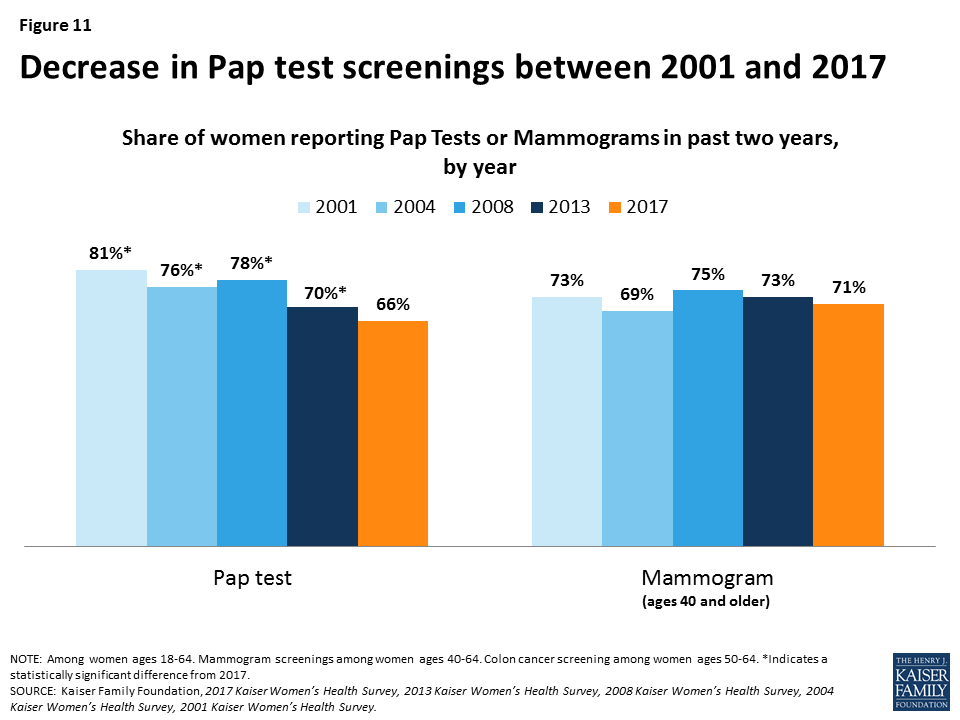
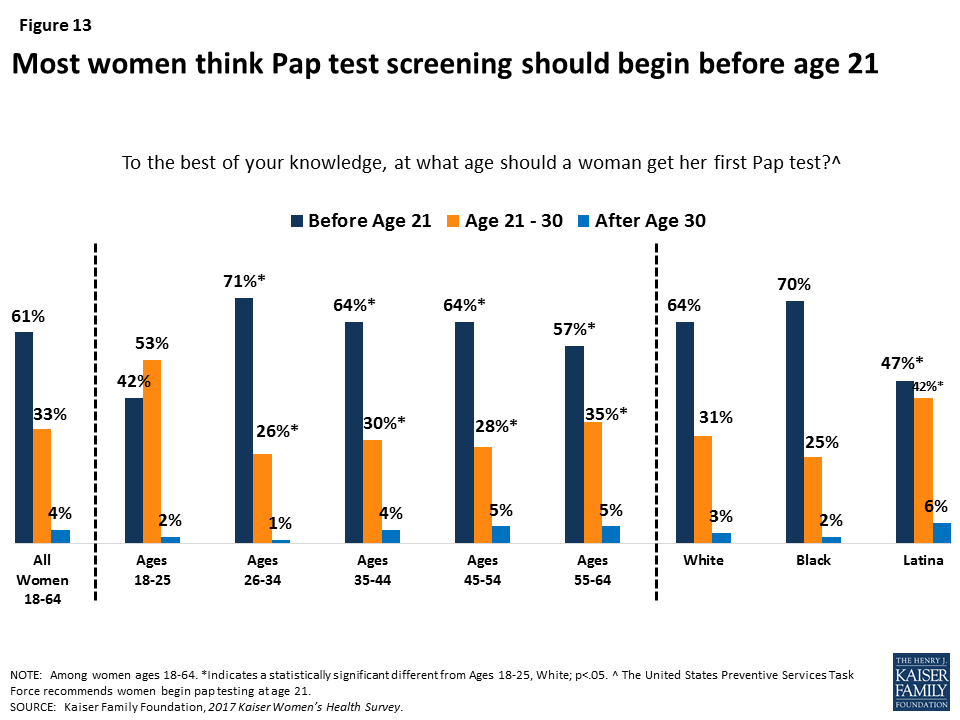
While most women have had cancer screenings in the past two years, including mammograms (71%) and Pap tests (66%), knowledge of national recommendations for cancer screenings is low. Most women (61%) think that a woman should get her first Pap test before the age of 21, and almost half (47%) think that a woman without a family history of breast cancer should get her first mammogram before the age of 40 (Figure 5), even though the USPSTF recommends first Pap test at age 21 and first mammogram for average risk women at age 50.
Figure 5: Almost half of women think that women without family history of breast cancer should begin mammography screening before age 40
Reproductive and Sexual Health
The share of privately insured women who reported that their insurance paid for the full costs of their prescription contraceptives increased significantly since 2013.
The ACA requires most plans to provide no-cost coverage for FDA-approved prescription contraceptive services and supplies for women. In 2017, three-fourths (75%) of privately insured women ages 18-44 who use prescription contraception reported that their insurance fully covered the cost of contraceptives (Figure 6). Another 19% said their insurance paid for part of the costs. This represents a large increase in no-cost contraceptive coverage since 2013, due in part to plans losing their grandfathered status and coming into compliance with the ACA’s contraceptive coverage requirement.
Figure 6: The share of privately insured women reporting that their insurance covered the full costs of their prescription contraception rose sharply
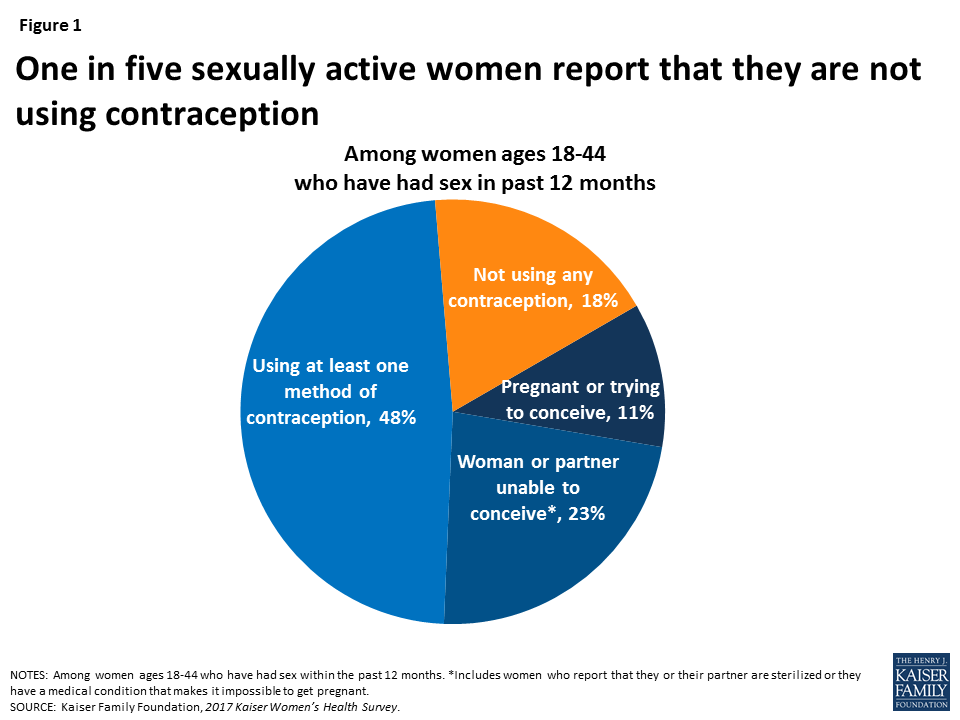
One in five sexually active women report that they are not using contraception, which puts them at higher risk for unintended pregnancy.
Contraception is a critical component of healthcare for reproductive-age women. However, nearly one in five (18%) sexually active women ages 18-44 are not using any method of contraception and are at high risk for unintended pregnancy. About half (48%) of women ages 18-44 report that they or their partners used at least one contraceptive method, one in ten (11%) are pregnant or trying to conceive, and one in five (23%) women report that they or their partner have had a sterilization procedure or cannot become pregnant. Among sexually active women who have used contraceptives in the past year, nearly six in ten (59%) report using male condoms and 40% have used oral contraceptives. Smaller shares report using other methods, such as IUDs and injectables.
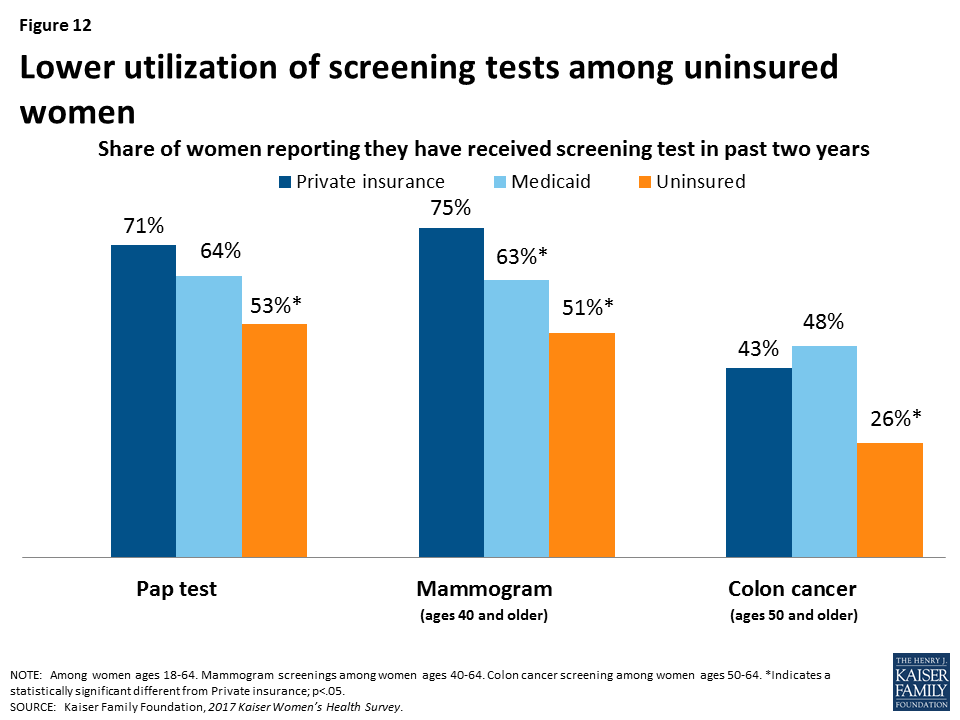
Most women get their gynecologic and contraceptive care from private doctors’ offices, but a significant share of low-income and uninsured women go to clinics for this care.
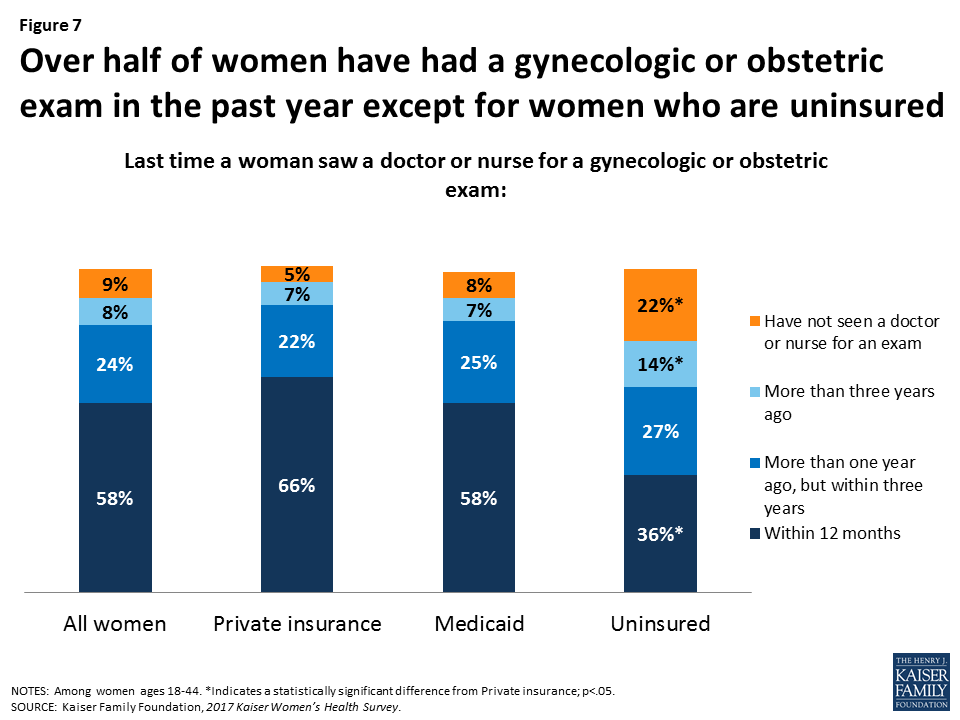
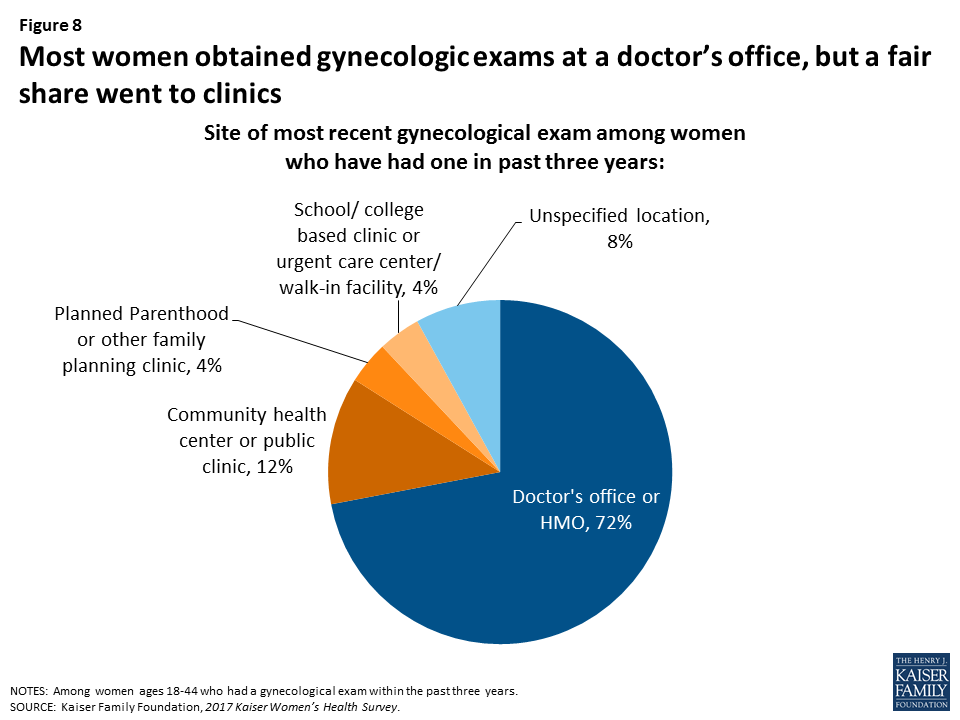
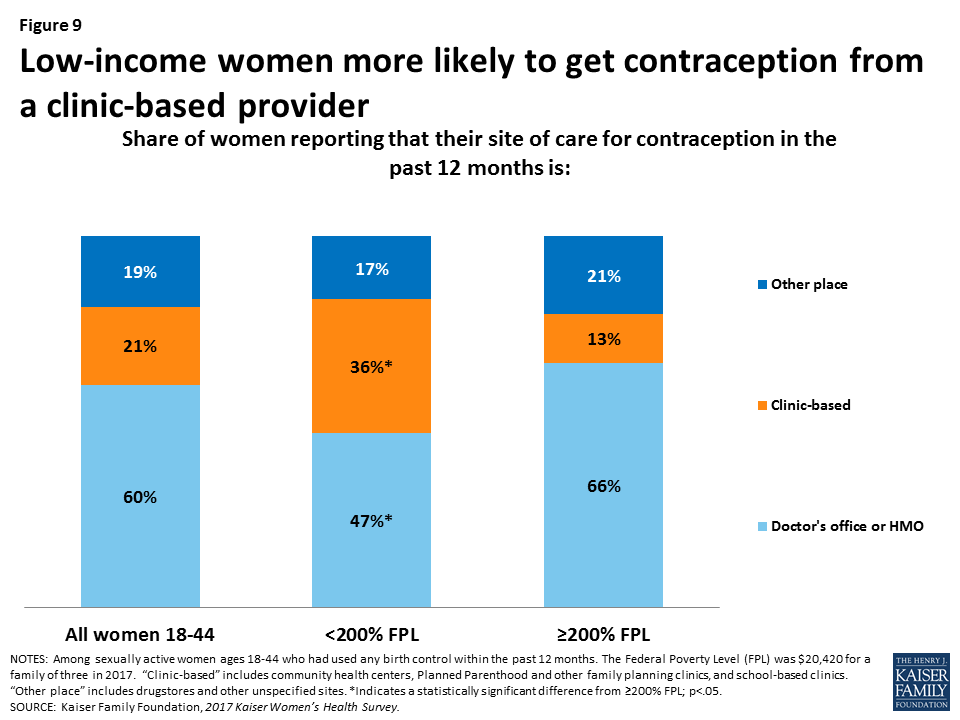
Seven in ten (72%) women ages 18-44 report that their most recent gynecologic exam took place at a doctor’s office or HMO. Roughly one in ten (12%) women report that they went to a community health center or other public clinic; However, this rate is higher among some groups – 30% of Latinas, 23% of rural women, 34% of uninsured women, 23% of low-income women, and 19% of women who have Medicaid reported going to these clinics for their most recent gynecologic exam. These patterns persist in where women get their contraception care. Six in ten women obtain contraception from a private doctor or HMO, while one in five go to a clinic and another one in five go somewhere else, such as a drug store for condoms. Among low-income women, however, more than one-third (36%) report obtaining contraceptives at a clinic. One in three women ages 18-44 report that they have ever visited a Planned Parenthood clinic for health care services.
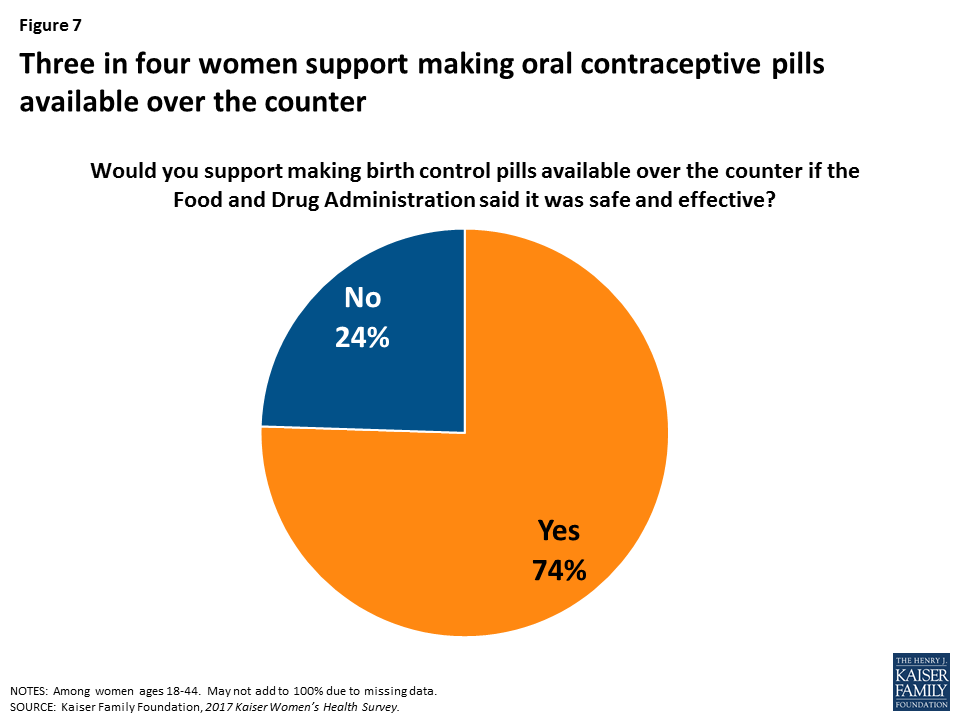
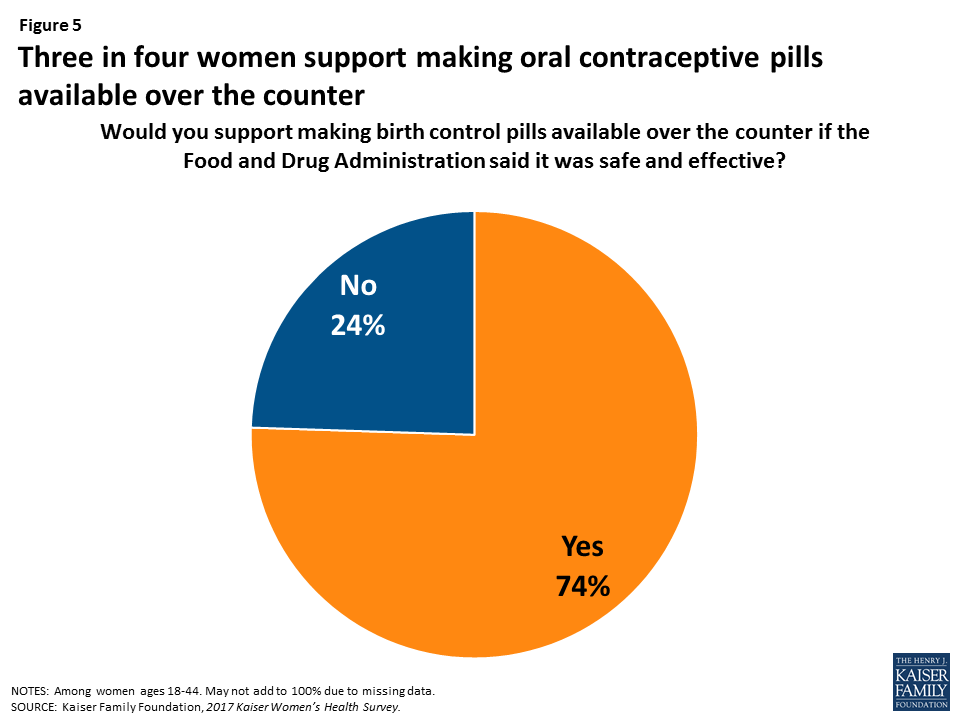
Three-fourths of women support over-the-counter access to oral contraceptive pills. Today, very few women get their contraception through direct pharmacy access or using an app.
Research suggests that over the counter access to oral contraceptives would increase the use of contraception and facilitate continuity of use; however currently, oral contraceptives are only available by prescription, usually from a doctor’s office. Among women of reproductive age, three-fourths (74%) support making oral contraceptives available over the counter if the FDA said it was safe and effective (Figure 7).
Figure 7: Three in four women support making oral contraceptive pills available over the counter
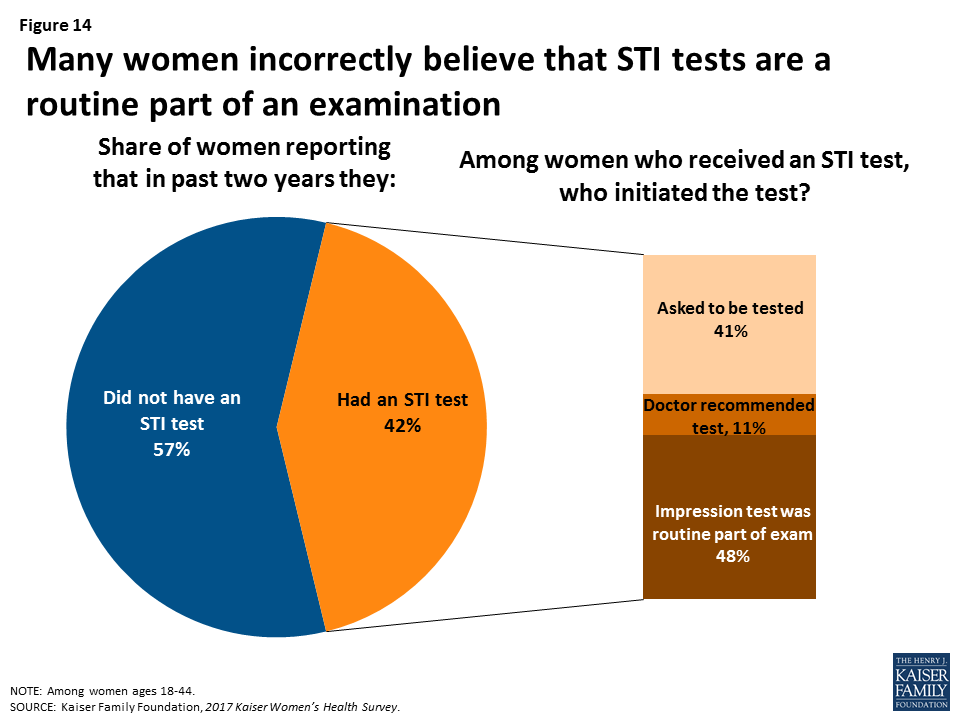
Some states have passed laws allowing women to get a contraceptive prescription directly from a pharmacist without seeing a doctor. In addition, several startups have developed online apps that allow women to get a prescription and order contraception to be delivered to their home or a nearby pharmacy. However, when asked how they obtained oral contraceptives and the patch, almost all women (95%) stated they obtained these methods from a doctor or clinic prescription rather than from a pharmacy or an online app.
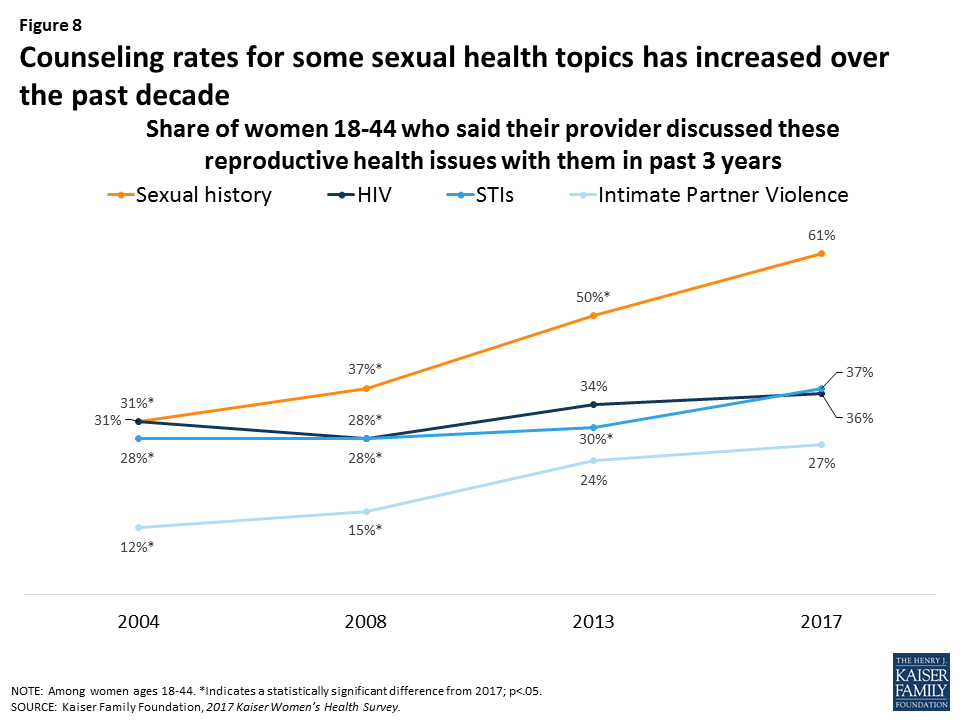
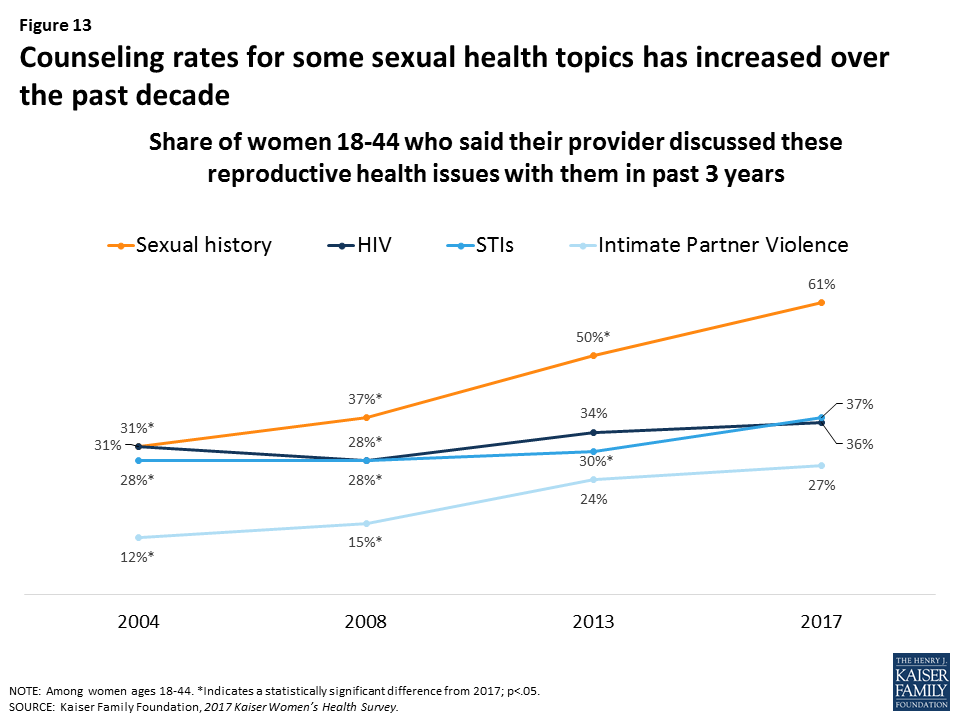
Provider counseling rates on sexual health topics have increased over time, but many women still report that their provider has not spoken with them about intimate partner violence.
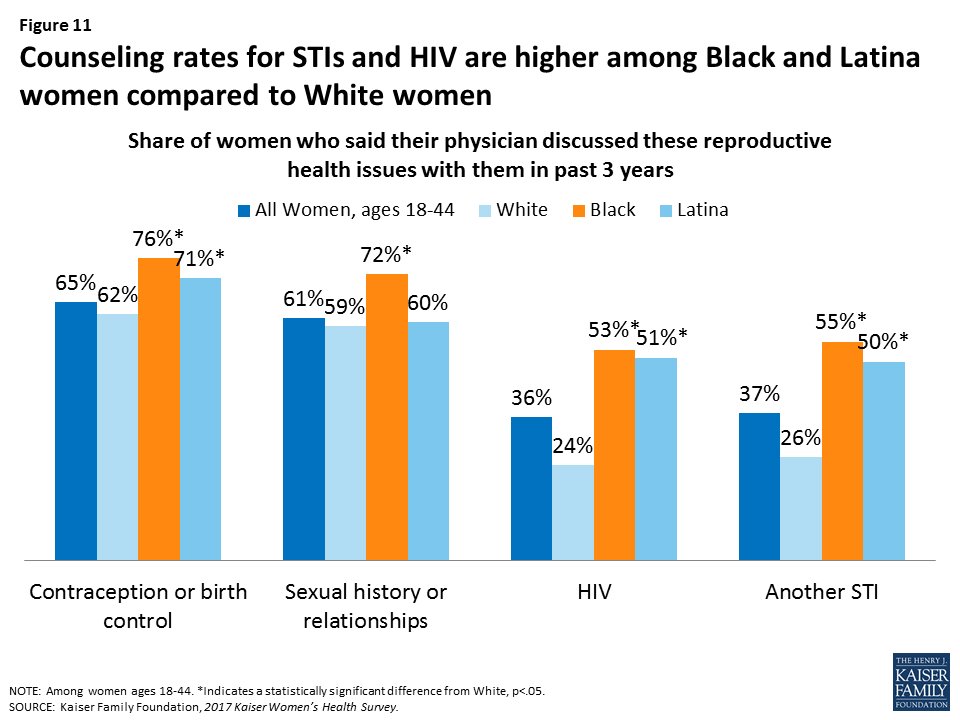
In 2004, less than a third of women reported recently speaking with a provider about their sexual history, but this has risen sharply to six in ten women (61%) in 2017 (Figure 8). Despite the ACA’s no-cost coverage for intimate partner violence (IPV) screening, provider counseling on violence however remains low at 27% but this is up from 12% in 2004. Counseling rates on HIV and STIs have risen modestly.
Figure 8: Counseling rates for some sexual health topics has increased over the past decade
Work and Family Health
Employer benefits such as paid leave can help women meet their personal and family health care needs while also fulfilling their work responsibilities. However, benefits are not equally available to all workers.
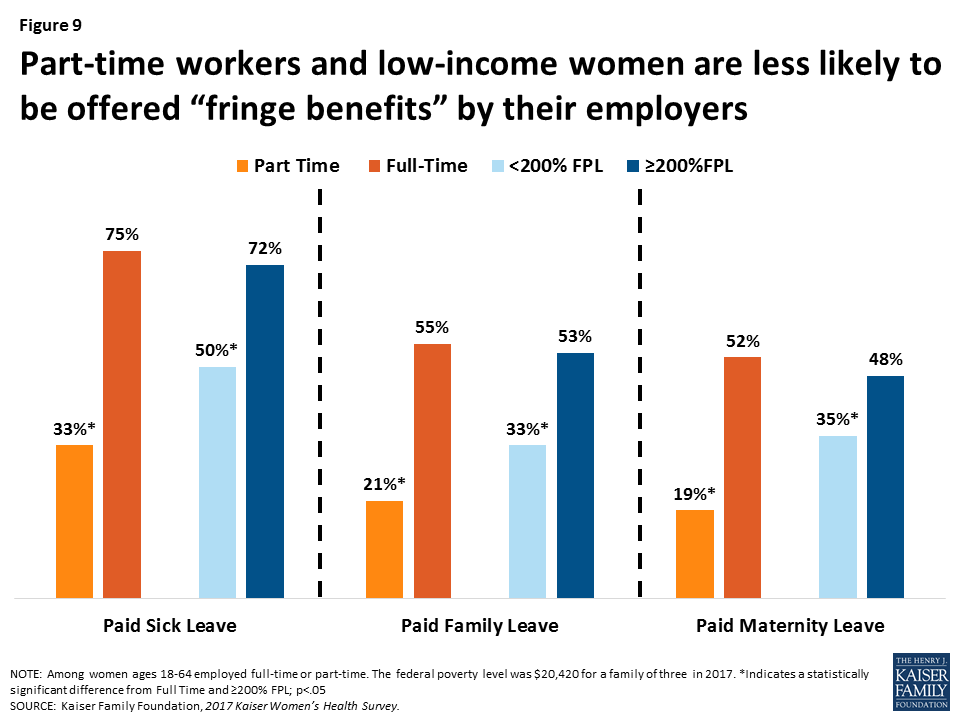
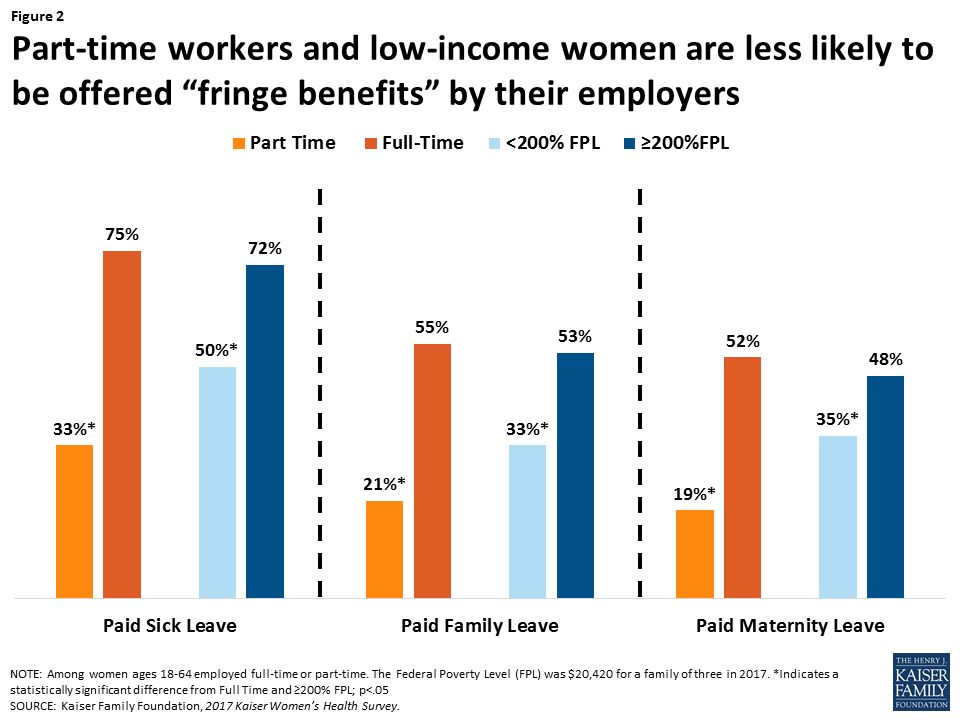
About two-thirds of working women report that their employer offered them paid sick leave (65%), while almost half are offered paid maternity leave (44%) and paid family leave (47%). However, low-income women and part-time employees are less likely to be offered these benefits (Figure 9).
Figure 9: Part-time workers and low-income women are less likely to be offered “fringe benefits” by their employers
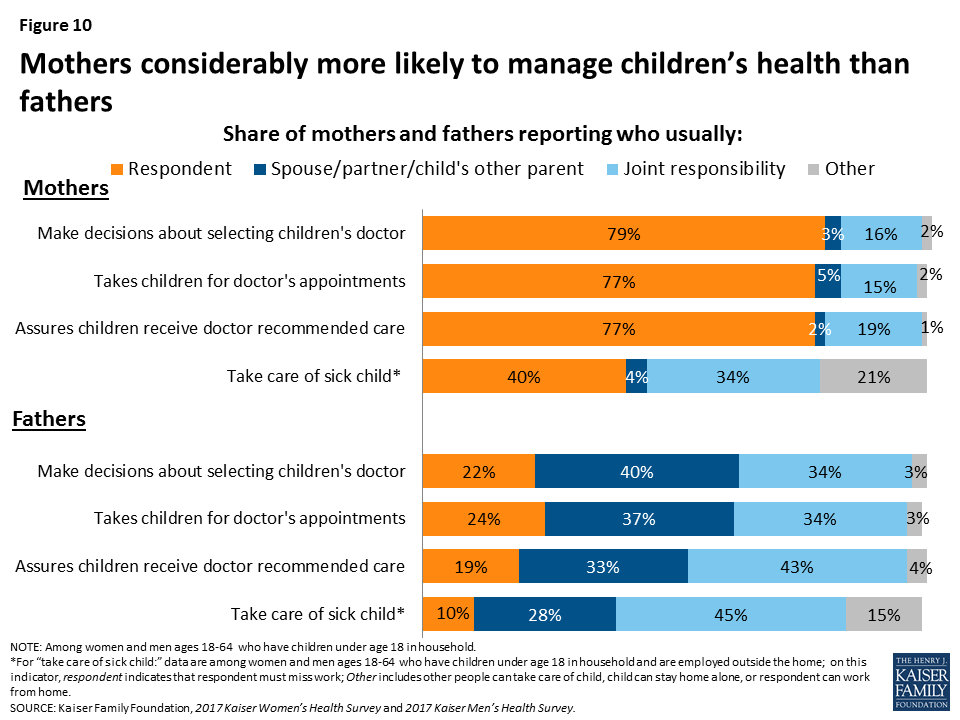
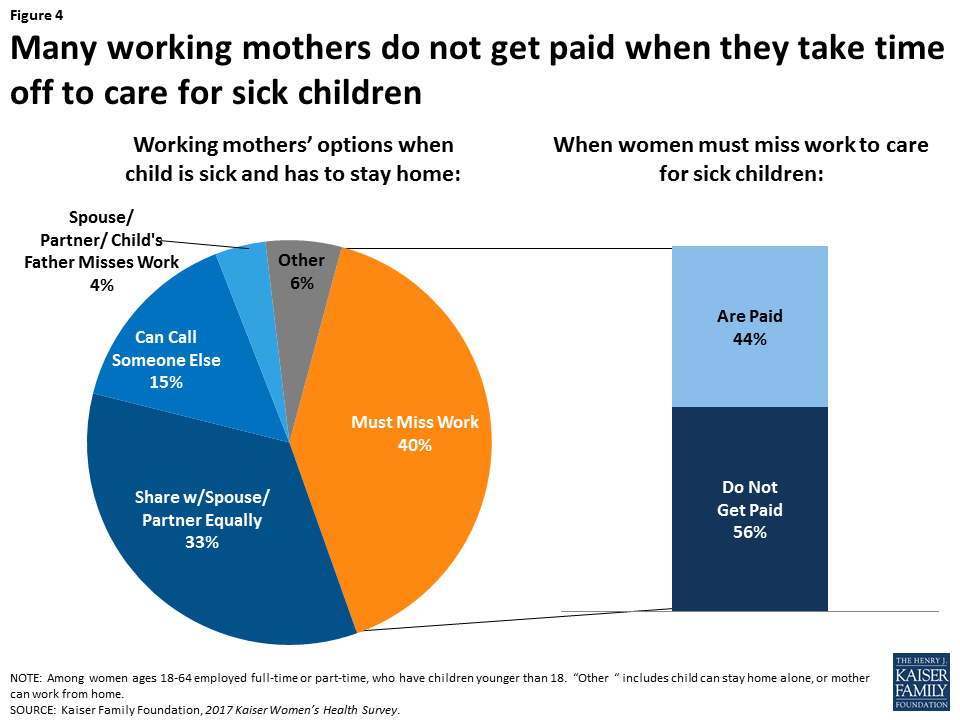
In most households, women are the managers of their families’ health care needs. Many working mothers lose pay when they take time off to care for sick children.
About three-quarters of mothers report that they are the ones who usually take charge of health care responsibilities such as choosing their children’s provider (79%), taking them to appointments (77%), and following through with recommended care (77%), compared to approximately a fifth of fathers who report they take care of these tasks (Figure 10). These rates have remained relatively unchanged for the past decade. Among working mothers, four in ten (40%) say they must take time off work and stay home when their children are sick. Among this group, more than half (56%) report they are not paid for that time off.
Figure 10: Part-time workers and low-income women are less likely to be offered “fringe benefits” by their employers
Conclusion
Women have much at stake in how the health care system operates. Seven years after the passage of the ACA in 2010, nine in ten women have health insurance coverage, more than ever before. Most women report having a regular place and clinician they go to for care, and counseling rates on a range of health issues have increased over the past decade. In addition, the majority of women who use contraception have full coverage without cost sharing under the ACA’s preventive services requirement.
However, it is important to recognize the ways in which the provision of healthcare can still improve. One in ten women remain uninsured, with higher rates among low-income women and women of color. Uninsured women have fewer connections to the health care delivery system and lower use of preventive services such as screening tests and provider counseling. A substantial share of women also continue to report that out of pocket costs limit their ability to see providers when they need to, obtain recommended tests and treatments, and adhere to medication protocols. Among reproductive-age women, one in five remain at high risk for unintended pregnancy despite increased coverage for contraception. All of this must be considered in the context of women’s lives. As mothers, most are in charge of addressing children’s health care needs. In addition, some women report they do not have time, or other supports, such as transportation and childcare, to obtain timely care. As the ACA and the Medicaid program face future challenges, some of the progress in coverage made in the past decade may be eroded, and more women could become uninsured and have difficulty accessing needed health care services.
Methodology
Summary
The 2017 Kaiser Women’s Health Survey obtained telephone interviews with a nationally representative sample of 2,751 women ages 18 to 64 living in the United States. The survey was designed and analyzed by staff at the Kaiser Family Foundation, and fieldwork was conducted by Princeton Survey Research Associates International (PSRAI). Interviews were done in English and Spanish by Princeton Data Source LLC from July 26 to September 27, 2017. Interviews were conducted via landline (nLL=963) and cell phone (nC=1,788; including 1,255 without a landline phone). Statistical results are weighted to correct known demographic discrepancies. The margin of sampling error for the complete set of weighted data is ±2.8 percentage points.
Sample Design
A combination of landline and cellular random digit dial (RDD) samples was used to represent all women ages 18 to 64 in the United States who have access to either a landline or cellular telephone. Both samples were provided by Survey Sampling International, LLC (SSI) according to PSRAI specifications. The samples were disproportionately-stratified to reach more low-income women and to increase the incidence of African-American and Latina respondents. To supplement the RDD samples, 188 interviews were completed using callback sample collected from recent PSRAI Omnibus surveys, national general population surveys of 1,000 interviews with adults that are usually fielded every other week.
As many as 7 attempts were made to contact every sampled telephone number. Sample was released for interviewing in replicates, which are representative subsamples of the larger sample. Using replicates to control the release of sample ensures that complete call procedures are followed for the entire sample. Calls were staggered over times of day and days of the week to maximize the chance of making contact with potential respondents. Each phone number received at least one daytime call if needed. Only female interviewers were used on this project. For the landline sample, interviewers first asked to speak with an adult female who was at home and age screening was done on that individual. Once a female was on the phone, they were asked their age and screened accordingly. Females were asked their age and screened accordingly. All eligible women reached on cell phones were offered a post-paid cash reimbursement of $5 to participate in the study.
Weighting and Analysis
Weighting is generally used in survey analysis to adjust for effects of the sample design and to compensate for patterns of nonresponse that might bias results. The weighting was accomplished in multiple stages to account for (a) the disproportionately-stratified samples, (b) the overlapping landline and cell sample frames, (c) household composition, and (d) differential non-response associated with sample demographics. The telephone usage parameter was derived from an analysis of recent national surveys conducted by PSRAI. All other weighting parameters were derived from the Census Bureau’s 2015 American Community Survey (ACS) PUMS data.
The survey’s margin of error is defined as the largest 95% confidence interval for any estimated proportion based on the total sample — the one around 50%. The margin of error for the entire sample of women ages 18-64 is ±2.8 percentage points and +3.8 percentage points for the sample of women ages 18-44. It is important to remember that sampling fluctuations are only one possible source of error in a survey estimate.
Women now comprise nearly half of the nation’s workers, and 70% of mothers with children under age 18 are in the labor force. The U.S. Census Bureau reports that median earnings for women are only 81% of men’s earnings, a gap that has persisted for several years. Policy makers across the political spectrum have forwarded proposals to shore up economic security for working families. Much of the national discussion has focused on policies related to income, such as minimum wage, tax credits, salary transparency, job training, and the wage gap, all of which are important issues for women. For many working women, economic security also encompasses health issues, including workplace benefits such as insurance coverage, paid sick leave, and paid family leave. It is also related to women’s roles as mothers and the primary managers of their children’s health care. This brief presents data on employer benefits and women’s roles in caring for families’ health from the 2017 Kaiser Women’s Health Survey, a nationally representative survey of women and men ages 18 to 64, conducted in the summer and fall of 2017.
Workplace Benefits
So called “fringe benefits” such as paid leave and health insurance help employees meet their personal and family health care needs while also fulfilling their work responsibilities. About two-thirds of working women report that their employer offers them paid sick leave (65%), paid vacation (69%) and a retirement plan (65%), while almost half are offered paid maternity leave (44%) and paid family leave (47%). Men report receiving those same benefits in similar rates (Figure1).
Figure 1: Rates for workplace benefits are similar between women and men
Benefits, however, are not equally available to all workers. Low-income women, women who are employed part-time, and women who live in rural areas are less likely to be offered these benefits. The disparity in workplace benefits is particularly stark between full and part-time workers (Figure 2). Among women part-time workers, 33% report they were offered paid sick leave compared to 75% of full-time workers, 21% were offered paid family leave (55% full-time workers), and 19% were offered paid maternity leave (52% full-time workers). Half of low-income women reported they were offered paid sick leave, and about one in three reported they were offered paid family leave and paid maternity leave. Only about a third of women living in rural areas reported their employer offered paid family leave and maternity leave compared to roughly half of women living in urban areas (see Appendix Table 1).
Figure 2: Part-time workers and low-income women are less likely to be offered “fringe benefits” by their employers
Parental Roles for Children’s Health
In most households, women are the managers of their families’ health care needs, as illustrated clearly in Figure 3. Among mothers, about three-quarters report that they are the ones who usually take charge of health care responsibilities such as choosing their children’s provider (79%), taking them to appointments (77%), and following through with recommended care (77%), compared to approximately a fifth of fathers who report they take care of these tasks. These rates have not changed significantly over the past decade. There are some variations between groups of women by marital status and education level (Appendix Table 2). This pattern has not changed since the Kaiser Women’s Health Survey was first conducted in 2001.
Figure 3: Mothers considerably more likely to manage children’s health than fathers
Mothers and fathers differ somewhat on their assessment of their involvement in children’s health care. While fathers are more likely to report that their partners take care of their children’s health needs than themselves, they are also more likely than mothers to report that it is a joint responsibility.
Impact of Children’s Health Needs on Working Parents
This gender difference extends to working parents as well. Four in ten working mothers (40%) say they must take time off work and stay home when their children are sick, four times the share of men who say this is the case (10%). Over one-third of both mothers and fathers say they share responsibility for these tasks.
Caring for children’s health has tangible economic consequences, especially for women. Among the mothers who must miss work when their children are sick, 56% are not paid for that time off (Figure 4), up significantly from 45% in 2004. Considering that nearly one-fifth of children miss more than a week due to illness or injury, this is a relatively common occurrence with potentially negative economic implications for working mothers.
Figure 4: Many working mothers do not get paid when they take time off to care for sick children
Mothers in part-time jobs are more likely to report they have to miss work when their child is sick (51%) compared to about a third (36%) of their full-time counterparts. Low-income mothers who must miss work when their child is sick are also far more likely to lose pay (73%) compared to higher income mothers (47%). Additionally, there is a large disparity in workplace benefits, with offer rates of paid sick leave and paid vacation significantly lower among mothers who are low-income or part-time employees (Table 1).
Table 1: Employer Benefits and Family Health
Does your employer offer you:
When your child is sick do you:
Paid sick leave
Paid family leave
Have to miss work
Lose pay when you miss work
Mothers <200% FPL (Low income)
56%*
40%*
43%
73%*
Mothers ≥200% FPL (Higher Income)
70%
54%
38%
47%
Mothers Full-Time Employment
76%
58%
36%
49%
Mothers Part-Time Employment
34%*
22%*
51%*
n/a
NOTES: Among women ages 18-64 who have children under 18. The Federal Poverty Level (FPL) was $20,420 for a family of three in 2017. Some estimates are “n/a” because point estimates do not meet the minimum standards for statistical reliability *Indicates a statistically significant difference from >200% FPL and Full Time; p<.05.SOURCE: Kaiser Family Foundation, 2017 Kaiser Women’s Health Survey.
Conclusion
The landmark Family and Medical Leave Act (FMLA) has been in place for more than 20 years, and gives eligible employees up to 12 weeks of unpaid leave to care for seriously ill family members, the arrival of a child, and job protection when an employee returns from family or medical leave. However, many working women simply cannot afford to take extended leave without pay. While there is no national paid leave policy, five states and DC have enacted laws offering eligible employees partial paid family leave. In addition to paid family leave, several cities across the nation as well as nine states and DC, require some level of paid sick days, which enables women to take time off without losing pay when they or their children get a minor illness and need to stay home for short periods.
Women have always been the primary caregivers for their family’s health needs, be it for their children, parents, or other family members. The Kaiser Women’s Health Survey finds that there has been relatively little change over time in the share of women employees who receive workplace benefits, such as paid leave, retirement plans, and paid sick days. For many women, missing work when they or their children have a cold or upset stomach has a cost. The price is especially high for low-income working mothers, who have fewer financial resources, and often limited workplace benefits.
The authors would like to thank Anthony Damico, an independent consultant, for his assistance with survey analysis.
Appendix Table 1: Employer Benefits
Does your employer offer you:
Paid Sick Leave
Paid Family Leave
Paid Maternity Leave
Paid Vacation
A Retirement Plan
All women 18-64
65%
47%
44%
69%
65%
White
66%
47%
42%
71%
68%
Black
68%
54%
58%*
73%
72%
Latina
66%
45%
42%
61%*
50%*
Private Insurance
73%
54%
50%
77%
73%
Medicaid
40%*
18%*
27%*
38%*
34%*
Uninsured
44%*
26%*
22%*
51%*
38%*
<200% FPL
50%*
33%*
35%*
55%*
47%*
≥200% FPL
72%
53%
48%
75%
72%
Full-Time Employment
75%
55%
52%
80%
74%
Part-Time Employment
33%*
21%*
19%*
31%*
32%*
<High School
41%
17%
14%
44%
20%
High School Graduate
56%
37%*
40%*
62%*
56%*
Some College
67%*
51%*
44%*
74%*
69%*
College Graduate
71%*
53%*
51%*
72%*
71%*
Urban
68%
51%*
48%*
72%*
65%
Suburban
65%
48%*
47%*
70%
67%
Rural
60%
37%
29%
61%
58%
Fair/Poor Health
60%
46%
39%
62%
47%*
Good/ Excellent Health
66%
47%
45%
70%
67%
Women with children <18
65%
49%
46%
66%
62%
Women without children <18
67%
53%
54%
72%
68%
NOTES: Among women ages 18-64 employed full time or part time. The Federal Poverty Level (FPL) was $20,420 for a family of three in 2017. *Indicates a statistically significant difference from White, Private Insurance, >200% FPL, Full Time, <High School, Rural, and Good/Excellent; p<.05.SOURCE: Kaiser Family Foundation, 2017 Kaiser Women’s Health Survey.
Appendix Table 2: Family Health
Mothers who responded that they usually:
Make decisions about selecting their children’s doctor
Make sure their children get the care doctor recommends
Take children to doctor’s appointments
Must miss work when their children are ill^
All women 18-64
79%
77%
77%
40%
White
83%
79%
77%
43%
Black
78%
85%
81%
38%
Latina
74%
71%
75%
43%
Married
75%
72%
73%
37%
Divorced
90%*
90%*
89%*
n/a
Never Married
89%*
90%*
87%*
n/a
<200% FPL
79%
79%
79%
43%
≥200% FPL
81%
76%
76%
38%
Full-Time Employment
83%
76%
70%
36%
Part-Time Employment
81%
81%
84%*
51%*
Not Employed
71%*
75%
81%*
–
<High School
67%*
70%*
75%
n/a
High School Graduate
74%*
75%*
72%
37%
Some College
86%
85%
82%
44%
College Graduate
80%
74%*
76%
35%
Urban
80%
80%
78%
41%
Suburban
76%*
76%
76%
43%
Rural
87%
75%
75%
31%
Fair/Poor Health
73%
78%
75%
n/a
Good/ Excellent Health
80%
77%
77%
38%
NOTES: Among women with children under the age of 18. ^Among women with children under 18 and who reported they were employed. The Federal Poverty Level (FPL) was $20,420 for a family of three in 2017. Some estimates are “n/a” because they do not meet the minimum standards for statistical reliability. *Indicates a statistically significant difference from Married, Full-Time employment, Some College, and Rural, p<.05SOURCE: Kaiser Family Foundation, 2017 Kaiser Women’s Health Survey.
Women’s ability to access the care they need depends greatly on the availability of high quality providers in their communities as well as their own knowledge about maintaining their health through routine checkups, screenings, and provider counseling. This brief presents findings from the 2017 Kaiser Women’s Health Survey, a nationally representative survey of women ages 18 to 64 on their health status, relationships to regular providers and sites of care, and the frequency at which they receive routine preventive care. The Kaiser Family Foundation has conducted surveys on women’s health care in 2001, 2004, 2008, and 2013. This brief focuses on findings from the newest 2017 survey and presents some findings compared to earlier years.
Health Status
The vast majority of women report good or excellent health, but higher shares of older and poorer women experience health problems.
When asked to describe their own health, most women (82%) rate it positively (excellent, very good, or good). Conversely, almost one in five women (18%) describe their health as “only fair” or “poor.” As women age, they are more likely to rate their health as fair or poor. Higher shares of low-income women and Black women also report fair or poor health (Figure1). A third of low-income women rate their health as fair or poor. Some of these women have high healthcare needs, yet they are more likely to lack coverage or the means to afford the care they require.
Figure 1: One in three low-income women rate their health status as “fair” or “poor.”
Many women are managing chronic conditions or living with disabilities that limit daily activities.
Nearly half of non-elderly adult women report they have a health condition that requires some degree of ongoing care, monitoring, or medication (Figure2). This rate rises steadily with age, increasing to two-thirds (65%) of women ages 55-64.
Figure 2: Almost half of women report they have a health condition that needs ongoing monitoring, care or medication
Almost one in five women (18%) say they have a disability or condition that keeps them from participating fully in work, school, or other activities (Figure3). As with other health status indicators, this increases as women age and is more common among rural women (22%) compared to those who live in urban environments (15%).
Figure 3: Almost one in five women report they have a disability or health condition that limits their daily activities
Usual Source of Care
The vast majority of women have seen a medical provider in the past two years.
Nine in ten (90%) women have seen a doctor or provider in the past two years, remaining constant from 2013 (91%). However, fewer uninsured women (67%), Latina women (81%) and women with incomes less than 200% FPL (85%) have recent visits for medical care than the average (data not shown).
Eight in ten women report they have a usual place they go to and a clinician they see for care.
A usual source of care is associated with increased use of preventive care and better health outcomes. Eight in ten women report they have a usual place of care and a regular clinician they see for care (Table 1). Rates are higher among older women, rising to 90% among those ages 55 to 64. White and Black women also are more likely to identify a usual site of care or provider compared to Latina women. Most women with private insurance report a regular place (87%) or clinician (84%) they go to for care, as do women with Medicaid (84% and 78%, respectively). Uninsured women are much less likely to have stable connections to care, with just about half reporting they have a regular place (55%) and clinician (49%) for care.
Table 1: Share of women who identify a regular place or clinician they go to for care, by selected characteristics
All Women
Age Group
Poverty Level
Race/Ethnicity
18-25
26-34
35-44
45-54
55-64
<200% FPL
≥200% FPL
White
Black
Latina
Share of women reporting a place they usually go to when they are sick or need advice about health
83%
73%
74%
84%*
88%*
90%*
79%*
85%
85%
83%
73%*
Share of women reporting a regular clinician they see for care
79%
64%
69%
82%*
86%*
90%*
73%*
83%
82%
86%
66%*
NOTES: Among women ages 18-64. The Federal Poverty Level (FPL) was $20,420 for a family of three in 2017. *Indicates a statistically significant difference from 18-25, ≥200% FPL, White; p<.05.SOURCE: Kaiser Family Foundation, 2017 Kaiser Women’s Health Survey.
About 46% of women have more than one provider (not including a dentist or mental health professional) they see on a regular basis. This is much less common among women age 18-25 (27%), Latina women (28%), and uninsured women (22%). The most common types of secondary providers are Ob-gyns (46%) and other medical specialists (33%).
A higher share of women living in rural areas see a physician assistant or nurse practitioner for routine care than those living in urban communities. Most women who report having a regular provider say their provider is an internist or family practitioner (75%). This is true in all locales, but there are some differences. Nearly one in four (24%) women in rural settings say their regular provider is a physician assistant or nurse practitioner, compared to 13% of women who live in urban environments. (Figure 4).
Figure 4: Women in rural areas are more likely than those in urban areas to report they see a physician assistant or nurse practitioner regularly
About one in ten women reported they did not obtain care when they needed it because they lacked a regular provider or a provider would not accept her insurance plan.
While most women have a regular provider, over one in ten do not, which can hinder their ability to obtain timely care. Among uninsured women, a quarter (26%) stated they delayed or went without care because they did not have a regular provider (Table 2). This was also the case for 18% of women with Medicaid and 16% of Latinas. Younger women also reported this barrier at higher rates than older women. Younger women with insurance were also more likely to report trouble finding a provider that would take their insurance. Provider participation in Medicaid in some states is much lower than for private insurance, and nearly three in ten women (29%) with Medicaid stated they had difficulty finding a provider that would accept their coverage.
Table 2: Barriers to care for women, by selected characteristics
All
Insurance Type
Race/Ethnicity
Age Group
Share of women reporting they delayed or went without care in past 12 months due to:
Private
Medicaid
Uninsured
White
Black
Latina
18-25
26-34
35-44
45-54
55-64
Didn’t have a regular doctor or provider
12%
8%
18%*
26%*
11%
10%
16%*
20%*
16%*
10%
11%*
6%
Had difficulty finding a provider that would accept her insurance plan
12%
8%
29%*
_
11%
10%
13%
18%*
16%*
8%
11%
9%
NOTES: Among women ages 18-64. *Indicates a statistically significant difference from Private, White, Ages 55-64, p<.05.SOURCE: Kaiser Family Foundation, 2017 Kaiser Women’s Health Survey.
Site of Care
Most women seek care at doctors’ offices, but clinics are important sites of care for underserved communities, particularly for women of color and those without insurance.
Two-thirds (67%) of women ages 18-64 with a usual source of care state they obtain their care at a doctor’s office or HMO (Figure5). Another quarter obtain care at a clinic, such as a community health center. A small share (3%) cite the emergency room as their site of care. The pattern is similar among women with Medicaid, albeit a slightly lower share going to doctors’ offices (59%) and higher share going to clinics (30%). For uninsured women, the pattern is notably different, with almost half (48%) seeking care at a clinic. Women of color report also doctors’ offices as their leading site of care (Figure6), but a considerably higher share of Latina women (43%) rely on clinics compared to White women (21%).
Figure 5: Overall most women receive care at doctors’ offices, but clinics serve half of uninsured womenFigure 6: Clinics are important sources of care for women of color
There is a lot of discussion about how to reduce the inappropriate use of the emergency room for primary care services. While this is more common among women with Medicaid (6%) and those who are uninsured (7%), it still reflects a very small fraction of the population.
General Check-ups and Provider-Patient Counseling
Provider visits can give women an opportunity to talk with clinicians about a broad range of issues, including preventing illness, the role of lifestyle factors, and management of chronic illnesses. Under the ACA, new plans must cover at least one annual “well woman visit,” which the IOM Committee on Clinical Preventive Services for Women recommended could specifically cover a range of topics, such as assessment of diet and physical activity, preconception care, prenatal care, and screening for STIs.
The majority of women have had a recent checkup or well woman visit.
Eight in ten (81%) women have had a well-woman visit in the past two years (Figure7), remaining constant from 2013 (82%). However, uninsured women (60%), women with incomes less than 200% FPL (74%), and women in poorer health (73%), are less likely to have had a recent checkup. Rates are similar among racial groups, although Black women (91%) report they have had a recent well woman visit at a higher rate than White (81%) or Latina (78%) women do.
Figure 7: Eight in ten women have had a recent check up or well woman visit, but lower rates seen among some groups
Most women reported that they went to an internist or family practitioner (43%) or an Ob-gyn (40%) for their well woman visit. There are differences by age group. Among women ages 18-44, almost half (47%) reported seeing an Ob-gyn and 37% saw an internist or family practitioner for their well woman visit. Among women ages 45 to 64, 50% reported going to an internist or family practitioner and 31% to an Ob-gyn. About one in ten women (12%) report that they saw a nurse practitioner or physician assistant for their well woman visit, with no significant differences by age group.
Rates of counseling on health behaviors are highest for diet, exercise, and nutrition.
Counseling on health-related behaviors such as diet, smoking, and alcohol use can be an important component of women’s primary care. Consistent with other national trends, the highest rate of preventive counseling addresses diet and nutrition, which 75% of women have discussed with a provider in the past three years (Figure 8). Only half (51%) of women report having discussed smoking and four in ten (40%) have discussed alcohol or drug use with a provider in the past three years. Across the board, women covered by Medicaid report the highest rates of counseling. In addition, younger women and those in poorer health have higher counseling rates compared to their counterparts (Table 3).
Figure 8: Counseling on health behaviors is highest for diet, exercise and nutrition
Table 3: Counseling rates on select health behaviors, by age group and health status
All Women
Age Group
Health Status
Race/Ethnicity
18-44
45-64
Fair or poor
Excellent to good
White
Black
Latina
Diet, exercise, and nutrition
75%
75%
74%
80%*
73%
73%
82%
75%
Smoking
51%
54%
47%*
60%*
49%
50%
57%
51%
Alcohol or drug use
40%
46%
34%*
44%
40%
37%
45%
46%*
NOTES: Among women ages 18-64. *Indicates a statistically significant difference from 18-44, Excellent to good, White; p<.05.SOURCE: Kaiser Family Foundation, 2017 Kaiser Women’s Health Survey.
Half of women have talked recently with a provider about mental health issues, representing an increase since 2013.
Most plans must adhere to the Mental Health Parity Act, which requires that plans cover mental health treatment and treatment for other medical conditions equally. Depression and anxiety affect many women in particular over their lifetimes, and the USPSTF recommends depression screening, but there is not a recommendation for frequency. Half (52%) of women report having discussed mental health issues, such as anxiety or depression, in the past three years, up from 41% in 2013 (Figure 9). In 2017, about half of White (53%), Black (52%), and Latina (49%) women report they discussed mental health issues with a provider in the prior three years, up from 42% of White and Black women and 39% of Latina women in 2013. As with other counseling topics, the rate is higher among women who are sicker or covered by Medicaid. There were no significant differences by age.
Figure 9: Half of women report receiving counseling from providers on mental health issues, but higher among some groups
There has been an increase in patient counseling over the past several years.
The share of women who report they have spoken with a provider about various health issues has risen over the past decade. In 2004, a third (32%) of women reported recently speaking with a provider about mental health issues, rising to more than half of women (52%) in 2017 (Figure 10). Provider counseling on smoking increased similarly from 37% in 2004 to 51% in 2017. Diet, exercise, and nutrition remains the most frequently discussed health issue, and while there has been a lot of attention about provider roles in curbing alcohol and drug misuse in light of the current opioid crisis, counseling on alcohol or drug use continues to be the least discussed issue.
Figure 10: Counseling rates for certain health topics have increased over the past decade
Screening Tests
Use of preventive services can lead to early identification of conditions when they are more responsive to early interventions. This is especially true for some types of cancers and cardiovascular conditions. For example, the U.S. Preventive Services Task Force (USPSTF) recommends routine mammograms and pap tests to identify breast and cervical cancers respectively. The USPSTF also recommends regular screenings for colon cancer for women ages 50 and older. All of these services are covered by most private plans under the ACA’s preventive services coverage requirements and by most state Medicaid programs.
Rates of preventive screening tests are higher among women with insurance.
Most women have had cancer screenings in the past two years, including mammograms (71%) and Pap tests (66%), with variation by age group. Rates of Pap tests have been decreasing since 2001, likely due to changes in the recommendations and guidelines for cervical cancer screening, which reduced the frequency and narrowed the age group for testing compared to earlier guidelines (Figure 11). Rates of screening for colon cancer remain lower, with four in ten (41%) women ages 50 or older reporting a recent colorectal screening.
Figure 11: Decrease in Pap test screenings between 2001 and 2017
Uninsured women have consistently lower use of all screening tests (Figure 12). While 75% of women, age 40 and older, with private insurance and 63% of women with Medicaid have had a mammogram in the past two years, only 51% of uninsured women age 40 and older did. Just over half of uninsured women (53%) have had a Pap test in the past two years, compared to 71% of women with private insurance and 64% of women covered by Medicaid. Among women age 50 and older, rates of colon cancer screenings are highest among women covered by Medicaid (48%) and women with private insurance (43%), compared to a quarter (26%) of uninsured women.
Figure 12: Lower utilization of screening tests among uninsured women
Many women think that women should begin screening tests for breast and cervical cancers at an earlier age than recommended by national groups.
The U.S. Preventive Services Task Force (USPSTF) recommends cervical cancer screenings for women age 21-65 by Pap smear every three years for women with normal screenings (Table4). However, most women (61%) think that a woman should get her first pap test before the age of 21 (Figure13). Young women ages 18-25 as well as Latinas are more likely to state that screening should begin between 21 and 30 years old. Some of the generational difference may be because recommendations for Pap screening have changed in the past decade, and older women may still recall the older guideline, which did recommend that women begin pap screening at a younger age.
Figure 13: Most women think Pap test screening should begin before age 21
The USPSTF recommends breast cancer screenings for women without a family history for women ages 50 and older every two years. However, guidelines surrounding mammography have been debated fiercely in recent years. Professional organizations vary in their recommendations, and some still recommend screening beginning at age 40 or 45. Regardless, almost half (47%) of women say that a woman without a family history of breast cancer should get her first mammogram before the age of 40 (Figure14). This is more common among young women 18-25 (64%) compared to women ages 26-34 (48%), 35-44 (34%), 45-54 (43%), and 55-64 (51%). This is also more common among low-income women (54%) than among their higher income (43%) counterparts (data not shown).
Figure 14: Almost half of women think that women without family history of breast cancer should begin mammography screening before age 40
Table 4: USPSTF national recommendations for preventive cancer screenings for average risk women
Screening Service
Population
Frequency
Breast cancer screening
Women ages 50-74*
Mammography every 2 years.
Colorectal cancer screening
Adults age 50 – 75
Varies based on procedure.
Cervical cancer screening
Women age 21 – 65
Pap smear every 3 years for women age 21 – 65 or combination of Pap smear and HPV test every 5 years for women age 30 to 65.
NOTES: *The USPSTF adds “the decision to start screening mammography in women prior to age 50 years should be an individual one. Women who place a higher value on the potential benefit than the potential harms may choose to begin biennial screening between the ages of 40 and 49 years.”
Conclusion
Most women report having a place and provider where they seek care, and most have had a recent doctor’s visit. However, connections to the delivery system are more tenuous for low-income and uninsured women, who are less likely to report a recent visit or regular site of care. Private doctors’ offices continue to be the most common site of care for women. Nonetheless, clinics play a critical role for many, especially women of color, women insured by Medicaid, and the uninsured. This is particularly important in light of recent public policy debates about whether public funding should be eliminated for specialized family planning clinics, such as Planned Parenthood that also offer abortion services.
The ACA prioritized prevention by requiring insurance plans to cover without any out of pocket costs routine checkups and several screening tests for women. Most women report they have had a well woman visit in the past two years, but similar to other measures, rates are lower among low-income and uninsured women. While the share of women that received provider counseling on various health issues has increased since 2013, just about 40-50% of women report they have talked to a provider about mental health, smoking, and alcohol or drug use in recent years. There is also very little awareness about national recommendations for initiation of routine screenings such as the Pap test and mammogram.
Since the Affordable Care Act (ACA) went into effect, there has been a sharp drop in the uninsured rate among women, along with major increases in Medicaid and private insurance coverage. In 2013, the Kaiser women’s health survey found nearly one in five non-elderly women were uninsured. By 2017, this had dropped to one in ten. Just as before the ACA, uninsured rates are higher among subgroups of women, particularly those who are low-income and Latina.
While coverage is a major factor for women’s access to care, many other factors play a role as well, including insurer practices, out of pocket costs, and provider availability. This brief presents findings from the 2017 Kaiser Women’s Health Survey, a nationally representative survey of women ages 18 to 64 on their coverage, use, and access to health care services. The Kaiser Family Foundation has conducted surveys on women’s health care in 2001, 2004, 2008, and 2013. This brief focuses on findings from the newest 2017 survey and also presents some findings compared to earlier years.
Coverage
The share of women with health coverage has increased since the ACA was implemented; however, approximately one in ten women remain uninsured in 2017.
The Kaiser Women’s Health Survey finds that approximately one in ten (12%) non-elderly adult women report being uninsured in 2017, down from 18% in 2013, and consistent with estimates from other large national surveys (Figure 1). Most women (62%) are covered by a private insurance policy, either through an employer-sponsored plan or one that they purchase on their own. The ACA’s coverage expansion also included a large expansion in eligibility for Medicaid, which now covers 14% of women ages 18 to 64.
Figure 1: The uninsured rate among women has dropped sharply since ACA was implemented
Approximately one in five women are either currently uninsured or were without coverage at some point in the prior year.
In addition to the one in ten (12%) women who remain uninsured in 2017, another 8% are currently insured but report that there was some period in the prior year when they were without any coverage (Table1). Women can be uninsured for periods as a result of job loss or change, premium prices becoming unaffordable, or in the case of dependent coverage, a spouse’s job loss, divorce, or widowhood. Spells without insurance are more common among low-income women who have lower coverage rates to begin with. Low-income women are more likely to work part-time or part-year, work in a low wage job that lacks health benefits, or live in a household without an attachment to the workplace, all of which can affect coverage stability. Women with poorer self-reported health status are almost twice as likely as those in better health to have gone without insurance at some point in the prior year.
Table 1: Share of women 18-64 currently uninsured or uninsured for some period of time in the past 12 months
All
Insurance Type
Race/Ethnicity
Poverty Level
Health Status
ESI
Individual
Medicaid
White
Black
Latina
<200% FPL
>200% FPL
Excellent to good
Fair or poor
Currently uninsured
12%
—
—
—
8%
12%
28%*
19%*
8%
12%
16%
Time in past 12 months without insurance
8%
6%
10%
15%*
6%
11%*
13%*
14%*
5%
7%
13%*
NOTES: Among women ages 18-64 with insurance at time of survey. The Federal Poverty Level (FPL) was $20,420 for a family of three in 2017. *Indicates a statistically significant difference from Employer Sponsored Insurance (ESI), White, ≥200% FPL, Excellent to good, p<.05.SOURCE: Kaiser Family Foundation, 2017 Kaiser Women’s Health Survey.
Many women with insurance report their plans would not pay for treatments or did not include doctors they wanted to see as part of their networks.
Insurance companies and employers have great discretion over what services they cover, the out of pocket costs they charge for covered benefits, and the network of clinicians their beneficiaries can see.
Among women covered by employer-sponsored insurance, approximately one in five (21%) reported that their plan would not pay anything for care she or a family member thought was covered (Figure2). Similarly, one in five women reported their plan did not include a particular doctor she wanted to see in network. Rates were similar among women who purchased insurance on their own, but were higher among women covered by Medicaid. Approximately four in ten women with ESI (38%) and individual insurance (40%) reported their plan paid less than they expected for a medical bill. This was less common among women with Medicaid, but still a problem for 20%. While co-payments and co-insurance are routine charges in the private insurance market, they are less common in the Medicaid program.
Figure 2: Women with insurance experience limits with coverage
Three in ten women with employer-sponsored insurance (29%) and one-third of women with individual policies or Medicaid reported their plan would not cover a particular prescription medicine or they had to pay a very expensive co-pay to obtain it.
A sizeable share of women with insurance report paying out of pocket for screening tests, despite the ACA’s requirement for coverage of preventive services without cost sharing.
The ACA requires most plans to cover certain preventive services at no cost. These services include cancer screenings such as Pap tests, mammograms, and colonoscopies. However, one in five women reported paying out of pocket costs for a recent Pap test, 13% for a mammogram, and 7% for a colon cancer screening (Figure 3). Almost one in four (23%) women with private insurance paid out of pocket for a Pap test as did 16% for a mammogram. Some women are enrolled in grandfathered plans that are not subject to the preventive services coverage requirement. Furthermore, some women may be seeking care out of network or the primary reason for their visit may not be preventive, both of which are stipulations for no cost coverage. Very few women covered by Medicaid said they had to pay out of pocket for preventive services, but many uninsured women who likely have no coverage for these services report paying for Pap and mammogram screenings. Some uninsured women can get no-cost care for Pap smears or mammograms through the Breast and Cervical Cancer Screening program that is operated by the Centers for Disease Control and Prevention (CDC), but many go without care because of affordability concerns.
Figure 3: A sizeable share of women pay out of pocket for preventive services, but women covered by Medicaid do at significantly lower rates
Access Challenges
While coverage plays a large role in access to care, there are many other factors that affect whether or not a woman uses services. These include out of pocket costs, provider availability and capacity, as well as logistical issues such as transportation and finding time to make it to medical appointments. The ACA attempted to alleviate some of the financial barriers through a variety of requirements on insurers, including full cost coverage for preventive services, cost-sharing subsidies for lower income families, and prohibiting insurer lifetime caps on coverage. However, many women report barriers that are related to issues outside of the health care system, such as workplace benefits and flexibility, childcare, and transportation.
Out of pocket costs limit access to care for women and men, but more commonly among women.
While women and men both feel the impact of health costs, such as insurance premiums, co-payments, and deductibles, they can be particularly burdensome for women who on average earn lower wages, have fewer financial assets, accumulate less wealth, and have higher rates of poverty than men. Roughly one in four (26%) women and one in five (19%) men have had to delay or forego care in the past year due to cost (Figure 4). Because of costs, approximately one in five women have postponed preventive care (19%), skipped a recommended test or treatment (20%), or made medication tradeoffs such as not filling a prescription or cutting dosages (17%). One in four women report that they have had problems paying medical bills (25%) in the prior year and one in three are currently paying off medical bills (33%).
Figure 4: A higher share of women forgo health care services due to cost compared to men
Costs are particularly burdensome for uninsured and low-income women and those in fair or poor health.
For uninsured women in particular, health costs are a sizeable barrier to care. Half (49%) of uninsured women went without or delayed care because of the costs (Figure5). Almost as many postponed preventive services (47%) and 42% skipped a recommended medical test or treatment. One in three uninsured women did not fill a prescription and/or skipped or cut pills, and roughly one in six (16%) reported they experienced problems obtaining mental health care because of cost.
Figure 5: Costs impede care for uninsured women and women with coverage
However, many women with coverage also experience affordability challenges that limit their access to care. For example, nearly one in five women with private insurance (18%) or Medicaid (19%) skipped a test or treatment because of the costs and many experienced other cost barriers as well. State Medicaid programs are permitted to charge nominal cost sharing amounts, which can be an obstacle since women on the program have very low incomes by definition, and even a few dollars can pose a barrier to receiving care. Low-income women and those in poorer health who generally have greater health needs experience some cost-related barriers at twice the rate of their counterparts with higher incomes and better health status. Rates of cost barriers are similar across racial/ethnic groups (Table2).
Table 2: Cost barriers to health care for women, by selected characteristics
Health Status
Poverty Level
Race/Ethnicity
Share of women reporting that in past 12 months they experienced following due to costs:
Excellent to good
Fair or Poor
<200% FPL
>200% FPL
White
Black
Latina
Delayed or went without care
22%
43%*
39%*
19%
25%
25%
27%
Postponed preventive services
17%
29%*
28%*
15%
19%
16%
18%
Skipped a recommended medical test or treatment
18%
34%*
29%*
16%
22%
22%
19%
Didn’t fill a prescription or skipped or cut pills
13%
35%*
25%*
14%
17%
18%
16%
Had problems getting mental health care
8%
17%*
14%*
8%
10%
9%
7%
NOTES: Among women ages 18-64. The Federal Poverty Level (FPL) was $20,420 for a family of three in 2017. *Indicates a statistically significant difference from Excellent to Good, >200% FPL, White, p<.05.SOURCE: Kaiser Family Foundation, 2017 Kaiser Women’s Health Survey.
Fewer low-income women report cost to be a barrier to care, but it is still a challenge for many. In 2017, approximately a quarter of low-income women reported that costs was a reason that they postponed preventive services (28%) or skipped medication doses (25%), but this is a drop from 2013 when approximately one-third of women reported these barriers (Figure6). Since 2013, millions of low-income women have gained coverage, both through Medicaid expansion as well as private plans in ACA Marketplaces, which may explain part of this decline.
Figure 6: Cost barriers have declined modestly among low-income women
Women face logistical barriers to obtaining health care related to their roles as mothers and employees.
Costs and affordability are not the only barriers to health care for women. Lack of time and flexibility with work can pose a challenge in getting care for a sizeable fraction of women. Nearly one in four women report that they did not obtain care they needed because they did not have time (24%) and because they could not take time off work (23%) (Figure 7). Transportation and childcare also present as barriers to care but to a lesser degree. These barriers affect women of all income levels, but low-income women more commonly experience childcare and transportation problems. One-third of low-income women (34%) also reported they missed or delayed care because they could not take time off work, compared to one in five higher income women (19%). Consistent with the disparities by poverty level, some barriers are reported more frequently among women of color, and those in fair or poor health (Table 3).
Figure 7: Logistical problems such as time and transportation pose barriers to care, particularly for low-income women
Table 3: Logistical barriers to care for women, by race/ethnicity and health status
Race/Ethnicity
Health Status
Share of women reporting they delayed or wentwithout care in past 12 months because they:
White
Black
Latina
Fair or Poor
Excellent to Good
Couldn’t find time to go to doctor
24%
23%
21%
23%
25%
Couldn’t take time off work
21%
25%
25%
34%*
21%
Had problems getting child care
14%
10%
20%
11%
14%
Had transportation problems
6%
15%*
12%*
21%*
6%
NOTES: Among women ages 18-64. *Indicates a statistically significant difference from White, Excellent to good, p<.05.SOURCE: Kaiser Family Foundation, 2017 Kaiser Women’s Health Survey.
Impact of Medical Bills
Women and their family members can face problems paying medical bills for a variety of reasons. Some women incur significant medical expenses because of an unexpected health event such as cancer, or an illness or injury that limits a woman’s ability to work and earn income to pay off bills. Women who are uninsured do not have coverage to offset the charges and may even be charged higher rates than insured women are. However, women with Medicaid and with private insurance may also have difficulties paying medical bills, which can include charges for out of network care and coverage limits or exclusions.
One in three women reported that they have unpaid medical bills.
There are several reasons women might report they have outstanding bills including they have not yet received the bill, their insurer has yet to approve the claim, or they cannot afford to pay what they owe. Outstanding medical bills are more common among those with greater health needs as well as those with lower incomes to pay the bills. This includes roughly four in ten Black women (44%), those in poorer health (45%), those who live in rural areas (39%), and four in ten low-income women (40%) (Table 4).
Table 4: Rates of unpaid medical bills, by selected characteristics
All Women
Race/Ethnicity
Location
Poverty Level
Health Status
Share of women reporting:
White
Black
Latina
Urban
Rural
<200% FPL
>200% FPL
Excellent to good
Fair or Poor
Currently have unpaid medical bills or bills being paid off
33%
32%
44%*
26%
29%
39%*
40%*
31%
30%
45%*
NOTE: Among women ages 18-64. The Federal Poverty Level (FPL) was $20,420 for a family of three in 2017. *Indicates a statistically significant difference from White, Urban, >200% FPL, Excellent to good, p<.05.SOURCE: Kaiser Family Foundation, 2017 Kaiser Women’s Health Survey.
One in four women say they or a family member had problems paying medical bills in the past year.
One in four women stated that they or a member of their family had trouble paying medical bills in the past year (Table 5). This share rises to 28% of women ages 26 to 34 and nearly a third (32%) of women ages 45 to 54. It is not surprising that more uninsured (37%) and low-income (34%) women report problems paying bills, given that they do not have coverage or as many financial resources to cover their bills.
Table 5: Share of women who have had trouble paying medical bills in past year, by selected characteristics
All Women
Age Group
Insurance Type
Poverty Level
Share of women reporting:
18-25
26-34
35-44
45-54
55-64
Private
Medicaid
Uninsured
<200% FPL
>200% FPL
They or family member had trouble paying medical bills in past 12 months
25%
18%
28%*
23%
32%*
24%
24%
21%
37%*
34%*
22%
NOTES: Among women ages 18-64. The Federal Poverty Level (FPL) was $20,420 for a family of three in 2017. *Indicates a statistically significant difference from Ages 18-25, Private, ≥200% FPL; p<.05.SOURCE: Kaiser Family Foundation, 2017 Kaiser Women’s Health Survey.
Medical bills can force women to make tradeoffs in paying for other basic necessities such as food or financial ones such as borrowing money and lowering credit standing.
Medical bills can have tangible consequences on other aspects of women’s lives. Among those who reported trouble paying bills, more than half said they used up most of their savings or had been contacted by a collection agency as a result (Figure 8). A little over four in ten reported they had difficulty paying for other necessities such as food (42%) or that they borrowed money to pay off bills (44%). Most of these consequences were more common among low-income women, who have fewer resources to pay off bills.
Figure 8: Medical bills affect many aspects of women’s financial stability
Use of Prescription Medicines
Over half (55%) of women take at least one prescription medicine on a regular basis. Fewer women of color rely on prescription medications to manage a medical condition.
Prescription drugs help many women treat and manage chronic conditions and acute illnesses. Prescription medicines can also play an important role in prevention for women, particularly contraception. More than half (55%) of women report they take at least one prescription medicine on an ongoing basis (Table6). This includes women who take oral contraceptives. However, 45% of women report that they do not take any prescription medicines. Over half of Black, Latina, and urban women report that they do not take any prescription medications on a regular basis.
Almost three in ten women (28%) report taking one or two prescription medications, 15% report taking three to five medications, and one in ten women (11%) report they take at least six medications on an ongoing basis. Almost four in ten (38%) women who rate their health status as fair or poor take at least six medications. Women covered by Medicaid (18%), low-income women (17%), and those who live in rural areas (15%) are also more likely than their counterparts to take at least six medications on a routine basis.
Table 6: Prescription medication use among women, by selected characteristics
All Women
Race/Ethnicity
Poverty Level
Location
Insurance Type
Health Status
Share of women 18-64 reporting that on a regular basis they take:
White
Black
Latina
<200%FPL
≥200% FPL
Urban
Rural
Private
Medicaid
Uninsured
Fair to Poor
Excellent to Good
No prescription medication
45%
40%
53%*
57%*
47%
43%
53%
37%*
43%
46%
62%*
24%
50%*
1 or 2 prescription medications
28%
30%
19%*
26%
19%*
33%
27%
24%
34%
20%*
17%*
15%
31%*
3 to 5 prescription medications
15%
17%
14%
11%*
16%
16%
11%
22%*
15%
15%
11%
14%
16%
6 or more prescription medications
11%
12%
14%
5%*
17%*
8%
8%
15%*
6%
18%*
10%
38%
5%*
NOTES: Among women ages 18-64. Totals may not add to 100% due to rounding. The Federal Poverty Level (FPL) was $20,420 for a family of three in 2017. *Indicates a statistically significant difference from White, ≥200% FPL, Urban, Private, Excellent to good p<.05.SOURCE: Kaiser Family Foundation, 2017 Kaiser Women’s Health Survey.
One in four women report they had to pay higher cost sharing than they expected or that insurance stopped covering a drug they take.
The cost of prescription drugs is one of the top health care concerns among the American public. Insurance companies have great leverage over the drug benefits they include in their policies. They can raise out of pocket costs, change the drugs they cover, and drop drugs from policies at any time and without notifying beneficiaries. Among privately insured women who say they take a prescription drug on a regular basis, about one in four (26%) reported that in the prior year their cost for the prescriptions rose or that their insurer dropped coverage for a drug they were taking (Figure 9). This was more commonly experienced by women ages 45-54 (31%) and 55-64 (32%) than women ages 18-44 (23%). It is also more common among White (30%) and Black (29%) women than Latinas (13%).
Figure 9: Some women with face unexpected out of pocket costs for medicines they take on a regular basis
The share of women who take six or more prescription medications has increased over the past decade.
The proportion of women who report taking any prescription medicines has remained relatively steady from 51% in 2008 to 55% in 2017 (data not shown). Among that group, the share who take at least six medicines has risen from 14% in 2008 to 21% in 2017 (Figure10). Almost two-thirds (63%) of this group rate their health as fair or poor, but over one-third (37%) rate their health positively (Figure11).
Figure 10: Among women who take prescription medications, there has been a rise in the share who take at least six medicinesFigure 11: Women who take at least six different medicines are more likely to be older and in poorer health
Conclusion
Seven years after the passage of the ACA, nine in ten women have health coverage, more than ever before. On many measures, women with insurance have better access to care, but some still face barriers such as services that are not covered, expensive cost sharing, and providers that do not accept their coverage. Affordability continues to be a challenge, with many women reporting they could not afford to obtain preventive care, treatments, or prescription medicines because of the out of pocket costs. In addition, some barriers are outside the health care system and result because women do not have time to seek care or do not have workplaces that support them taking time off to go for appointments.
Reproductive and sexual health is an integral component of women’s general health and well-being. The ACA has afforded more women the opportunity to seek and obtain reproductive health care by expanding access to Medicaid and affordable coverage. In addition, the law requires than plans cover a broad range of recommended preventive services including contraceptive care and STI screening services without cost sharing, critical elements of women’s health care. Plans were required to offer no-cost coverage for prescription contraceptives to women with private insurance starting in August 2012. Coverage for other preventive services, such as counseling and testing for STIs, are also now required benefits in private insurance plans and covered by Medicaid in most states. Women have a choice of providers, and while most seek care at private doctors’ offices, a substantial share go to clinics that are Medicaid participating providers such as community health centers and Planned Parenthood clinics for their reproductive and sexual health care.
This brief presents selected findings from the 2017 Kaiser Women’s Health Survey, a nationally representative survey of women conducted in the summer and fall of 2017. The survey also covered a wide range of topics related to women’s coverage, use, access, and experiences with the health care system. This brief presents survey findings on coverage and use of reproductive and sexual health services among women ages 18 to 44 years old. The data presented is from the newest 2017 survey, but some findings presented in this brief include trends from earlier surveys that the Kaiser Family Foundation conducted in 2004, 2008, and 2013.
Use of Contraceptives
Nearly one in five sexually active women of reproductive age report that they are not using contraception, despite reporting that they do not want to become pregnant.
For women with reproductive capacity, but who want to avoid an unintended pregnancy, contraception is an essential health service. An estimated 18% of sexually active women ages 18 to 44, however, are not using contraception and are at high risk for unintended pregnancy (Figure1). Among reproductive-age women who have had sex in the past year, half (48%) report that they or their partners used at least one reversible contraceptive method. One in ten (11%) are pregnant or trying to conceive, and nearly a quarter (23%) of women report that they or their partners have had a sterilization procedure or cannot become pregnant.
Figure 1: One in five sexually active women report that they are not using contraception
Women who do not use contraception are more likely to be low-income than women who use contraception.
Among sexually active women who are not pregnant or actively trying to conceive, almost half (46%) are low-income, compared to about a third (34%) of women who do use contraception or have had a sterilization (Table1). However, in some ways, women at risk for unintended pregnancy are similar to women who do use contraception. There are no significant differences in age composition, insurance coverage, or race/ethnicity between the two groups.
Table 1: Characteristics of sexually active women who use contraception compared to those who do not use contraception and do not want to be pregnant
Use Contraceptives (woman or partner used contraceptives)
Do not use contraceptives (at high risk for unintended pregnancy)
Characteristics:
Age Group
18-24 years
18%
24%
25-44 years
82%
76%
Race/Ethnicity
White
57%
53%
Black
12%
16%
Latina
22%
21%
Insurance Type
Private
65%
62%
Medicaid
16%
15%
Uninsured
12%
15%
Poverty Level
<200% FPL
34%
46%*
>200% FPL
66%
54%*
NOTES: Among women ages 18-44 who were sexually active in past year and say they were not pregnant or trying to get pregnant. Race/Ethnicity and Insurance columns do not sum to 100% because respondents identifying as “Other Non-Hispanic” or stating “Other Public” coverage not shown. The Federal Poverty Level (FPL) was $20,420 for a family of three in 2017. *Indicates a statistically significant difference from Use Contraceptives; p<.05.SOURCE: Kaiser Family Foundation, 2017 Kaiser Women’s Health Survey.
Condoms and oral contraceptives are the most commonly used forms of contraception.
While all forms of FDA approved contraception can reduce the risk of unintended pregnancy when used correctly, they vary in their use and effectiveness. Women are encouraged to consider a range of issues when choosing a contraceptive method in order to find the one that is most effective but also fits best within their beliefs and lifestyle. Condoms can protect against STIs and are widely available through many outlets without a prescription. Oral contraceptives, often referred to as the Pill, require prescriptions and are hormonal, and therefore cannot be used or tolerated by all women. Other methods include injectables, implants, patches, and the vaginal ring, which deliver different doses of hormones. Intrauterine Devices (IUD) are devices that are inserted into a woman’s uterus by a provider and some types also include hormones. They can last up to 5 years or longer and are among the most effective methods of reversible contraception. Under the ACA’s preventive services provision, most private plans are required to cover each of the 18 FDA-approved methods of contraception as prescribed for women without cost sharing. Medicaid also prohibits cost-sharing for all family planning services.
Among sexually active women who use contraception, just over half (57%) rely on one method and just under half (42%) use more than one method. Women most frequently report that they have used condoms or birth control pills in the past year, a rate that has remained consistent since 2013. Nearly six in ten (59%) sexually active women who have used contraceptives in the past year report using male condoms, four in ten (40%) have used oral contraceptive pills, and about one in five (24%) used an IUD (Table2). Younger women ages 18-24 rely on the pill (60%) or condoms (79%) at greater rates than those who are 25 and older.
Table 2: Types of contraceptives women report they or partners used in past 12 months, by age
All Women
Age Group
Types of contraception used within the past 12 months
18-24
25-34
35-44
Male condoms
59%
79%
56%*
48%*
Oral contraceptives
40%
60%
34%*
34%*
IUD
24%
16%
27%
25%
Injectables
9%
13%
9%
5%
Implants
8%
14%
7%
4%
Other
10%
13%
11%
8%
NOTES: Among women ages 18-44 who were sexually active in past year and used contraceptives in past year. Women may use more than one form of contraception. Oral contraceptives include birth control pills. IUD is an intrauterine device such as Mirena, Skyla, or Paragard. Injectables include Depo-Provera. Implants include Implanon or tubes in arm. Other methods include vaginal ring and the topical patch. *Indicates a statistically significant difference from 18-24; p<.05.SOURCE: Kaiser Family Foundation, 2017 Kaiser Women’s Health Survey.
Preventing pregnancy is the leading reason for contraceptive use, but more than one-third of women also use them to manage a medical condition.
The majority of women ages 18-44 use contraception to prevent pregnancy (59%), but 13% use it to manage a medical condition, and 22% use it both to prevent pregnancy and to manage a medical condition (Figure2). Some women use hormonal contraceptives to manage other conditions, such as acne, irregular menstrual cycle, and endometriosis. This likely affects women’s choices in the types of contraceptives they select. There have been a number of efforts to establish new avenues for obtaining prescription contraceptives, such as from online apps or pharmacists who are now able to prescribe certain contraceptives in some states. However, when asked how they obtained oral contraceptives and the patch, almost all women (95%) stated they obtained these methods from a doctor or clinic prescription rather than directly from pharmacy or from an online app.
Figure 2: Many women use contraception to prevent pregnancy and manage medical conditions
Contraceptive Coverage
Three-fourths of privately insured women who used contraception in the past year say they had full contraceptive coverage, a sharp rise since 2013.
In 2012, the Affordable Care Act (ACA) required all new private plans to cover, without cost sharing, the full range of contraceptives and services approved by the Food and Drug Administration (FDA) as prescribed for women. In 2017, approximately three-fourths (75%) of privately insured women ages 18-44 who use contraception reported that their insurance fully covered the cost of contraceptives (Figure 3). Another 19% said their insurance paid for part of the costs. Partial coverage could represent women who are enrolled in an older private plan that is still “grandfathered” from the ACA requirements, who used a particular contraceptive that is not covered by the requirement (such as a brand name drug), or who obtained care outside of the plan’s network. Most (92%) women with private insurance stated they did not have any trouble getting insurance to pay for prescribed contraceptives. Only 5% reported that they had problems getting their insurance to pay.
The share of privately insured women with full contraceptive coverage has sharply increased since 2013 when 45% of insured women who used prescription contraception reported their insurance paid the full cost and almost half had only partial coverage.
Figure 3: The share of privately insured women reporting that their insurance covered the full costs of their prescription contraception rose sharply
Among women who use oral contraceptives, most typically receive 3 months’ supply at a time.
Women who use oral contraceptives must take a pill every day; therefore having an adequate supply is important for consistent and effective use. One quarter (25%) of women reported that they have missed a pill because they were not able to get their next pack in time. Among women who have used oral contraceptives in the past year, most (70%) report their insurance plan or clinic allows them only to receive three months or less at a time (Figure4). However, 15% of women reported their plan allows them to get a supply that lasts six months or longer. This has been an area of public policy activity in recent years, with several states now requiring private plans and Medicaid to provide women up to 12 months’ supply.
Figure 4: Most women receive a 3 months supply of oral contraceptive pills, but one in five receive a longer term supply
The vast majority of women support making oral contraceptives available over the counter (OTC).
Research suggests that OTC access to oral contraceptives would increase the use of contraception and facilitate continuity of use; however currently, oral contraceptives are only available by prescription, usually from a doctor’s office. Among women of reproductive age, three-fourths (74%) support making oral contraceptives available over the counter if the FDA said it was safe and effective (Figure 5). Support remains at this level across age, race, income, and insurance type subgroups.
Because the federal contraceptive coverage requirement applies only to prescription methods, new federallegislation or administrative changes to the ACA’s preventive services policy would be needed to include over the counter contraceptives as a no cost benefit.
Figure 5: Three in four women support making oral contraceptive pills available over the counter
Awareness about emergency contraception has been rising over the past decade.
Emergency contraception (EC), which is contraception that can be used after sex to prevent pregnancy, has been available in the U.S. since 1999. There are multiple forms, including the copper IUD, Plan B® pills (levonorgestrel), and another pill, known by the brand name ella® (ulipristal acetate). Copper IUDs and ella® both require a prescription, but Plan B® is available over the counter and has generic equivalents. As with other contraceptives, most private plans are required to cover prescriptions for EC without cost sharing under the ACA’s preventive services policy.
There has been growing awareness about EC pills over the past decade (Figure6). In 2004, three-quarters of reproductive-age women reported they had heard of EC pills, and that share has now climbed to more than nine in ten women (93%). Among this group, about one in ten (8%) report they bought or used EC pills in the prior year. Use is highest among women in their late teens or early twenties, Latina women, and women living in urban areas (Table3).
Figure 6: Awareness of emergency contraception has increased over the years
Table 3: Emergency contraception, use and awareness
All Women
Age Group
Race/Ethnicity
Location
Poverty Level
18-24
25-34
35-44
White
Black
Latina
Urban
Rural
<200%FPL
≥200%FPL
Have heard of emergency contraception (EC)
93%
92%
93%
94%
97%
94%
91%*
94%
93%
90%*
97%
Have taken or bought EC in the past year^
8%
14%*
10%*
2%
5%
5%
12%*
11%
4%*
7%
8%
NOTES: ^Among women ages 18-44 who had heard of emergency contraception. Emergency contraception, sometimes called morning-after pills, include Plan B or Ella. The Federal Poverty Level (FPL) was $20,420 for a family of three in 2017. *Indicates a statistically significant difference from 35-44, White, urban, ≥200% FPL; p<.05SOURCE: Kaiser Family Foundation, 2017 Kaiser Women’s Health Survey.
A small share of women with employer-sponsored insurance are in plans sponsored by faith-based organizations.
The ACA requires that all private plans, including employer-sponsored plans, cover the full cost of prescription contraceptives for women. This policy has been challenged in the courts since it was put in place as some employers with religious or moral objections to contraception claim that the policy violates their religious rights. In October 2017 the Trump Administration greatly broadened the exemption from this requirement that was available for any employer that objects to contraceptive coverage for religious or moral reasons. While currently blocked from implementation, if this policy is ultimately adopted, it has the potential for very large impact, given that employer-based plans cover the majority of women. In the Kaiser Women’s Health Survey, 6% of women with employer-sponsored insurance say that the employer is faith-based or affiliated with a faith-based organization. These employers and other employers who object to contraception for other reasons could qualify for an exemption if the October 2017 regulations are implemented.
Site of Care for Sexual Health Services
Six in ten reproductive-age women have had a gynecologic or obstetric visit in the past year.
Most women ages 18-44 (58%) report seeing a provider for a gynecologic or obstetric visit in the past year (Figure 7). This rate is higher among women with private insurance (66%) and Medicaid (58%) and far lower among uninsured women (36%). One in seven (14%) uninsured women reported that their last visit was more than 3 years ago, twice the rate of women with private insurance (7%) and Medicaid (7%). Just 9% of women ages 18-44 reported they had never seen a provider for gynecologic or obstetric care. However, 22% of uninsured women reported they had never seen one, almost three times the rate of women with Medicaid (8%) and more than four times the rate of women with private insurance (5%).
Figure 7: Over half of women have had a gynecologic or obstetric exam in the past year except for women who are uninsured
The majority of women get their gynecologic care in private doctors’ offices or HMOs, but clinics play an important role for certain groups of women.
Most women (83%) report that their last reproductive health visit was for gynecologic care or a check-up and 16% report it was for prenatal or pregnancy care. Among the women who report they have had a gynecologic exam in the past three years, 72% report that their most recent exam took place at a doctor’s office or HMO. Roughly one in ten (12%) women report that they went to a public health clinic or community health center (Figure 8). However, this rate is higher among some groups – 30% of Latinas, 23% of rural women, 34% of uninsured women, and 19% of women who have Medicaid reported going to these clinics for their most recent exam (Table4).
Figure 8: Most women obtained gynecologic exams at a doctor’s office, but a fair share went to clinics
Table 4: Site of most recent gynecologic exam among women, by selected characteristics
Age Group
Insurance Type
Race/Ethnicity
Location
Poverty Level
Site of most recent visit
18-44
18-24
25-44
Private
Medicaid
Uninsured
White
Black
Latina
Urban
Rural
<200% FPL
≥200% FPL
Doctor’s office or HMO
72%
59%
75%*
81%
59%*
46%*
81%
71%
53%*
73%
64%
58%*
82%
Community health center or public clinic
12%
14%
12%
8%
19%*
34%*
5%
13%*
30%*
13%
23%*
23%*
5%
Other place
15%
27%
13%*
12%
22%*
21%
13%
16%
17%
15%
13%
19%
13%
NOTES: Among women ages 18-44 who have had an exam in the past three years. Other place includes other types of clinics such as Planned Parenthood centers, school-based clinics, and other locations such as emergency departments. Columns may not sum to 100% due to rounding. The Federal Poverty Level (FPL) was $20,420 for a family of three in 2017. *Indicates a statistically significant difference from ages 18-24; Private, White, Urban, ≥200% FPL; p<.05.SOURCE: Kaiser Family Foundation, 2017 Kaiser Women’s Health Survey.
There are differences in the patient populations that seek gynecologic care at doctors’ offices compared to clinics.
Community health centers and other publicly funded clinics have a commitment to delivering care to underserved communities, and this is reflected in their patient population. More than half (56%) of women who obtained gynecologic exams at community health centers are low-income, compared to about a quarter (28%) of women at private doctors’ offices (Table 5). Latina and Black women accounted for 48% of clinic patients, while making up less than a third (31%) at doctors’ offices. Coverage patterns also differ. Private insurance is the leading payer at both sites, but less than half of women at clinics (46%) are privately insured compared to 72% of women at doctors’ offices. Medicaid covers nearly a quarter (24%) of women at clinics, and one in five are uninsured (19%).
Table 5: Characteristics of women who obtained a gynecologic exam in prior three years
Characteristics:
Doctor’s Office
Clinic or Health Center
Age Group
18-24
15%
29%*
25-34
40%
40%
35-44
45%
31%*
Race/Ethnicity
White
61%
36%*
Black
16%
16%
Latina
15%
32%*
Other
8%
16%*
Poverty Level
<200% FPL
28%
56%*
≥200% FPL
72%
44%*
Insurance Type
Private
72%
46%*
Medicaid
14%
24%*
Uninsured
6%
19%*
NOTES: Among women ages 18-44 who have had a gynecologic exam in the past three years. The Federal Poverty Level (FPL) was $20,420 for a family of three in 2017. *Indicates a statistically significant difference from doctor’s office; p<.05.SOURCE: Kaiser Family Foundation, 2017 Kaiser Women’s Health Survey.
Most women go to a doctor’s office or HMO for contraception care; however, among low-income women, over one-third get their contraceptives from a clinic-based provider.
As with gynecologic care, most women obtain contraception at private doctors’ offices but there are differences between subgroups. Overall, more than half (60%) of women got their birth control care from a doctor or HMO, 21% from a clinic-based provider such as a community health center, Planned Parenthood clinic or other family planning clinic. A large share of women (19%) also report going to some other place for their contraception, which includes drugstores and clinics in retail outlets. Among low-income women however, roughly one in three (36%) get contraception at a clinic based-provider. Comparatively, among women who are at or above 200% FPL, only 13% get their contraceptives from a clinic-based provider (Figure9). The outcome of current debates about the future of federal financing of family planning services, including Medicaid reimbursements to Planned Parenthood clinics, will have a disproportionate impact on low-income women’s access to contraception.
Figure 9: Low-income women more likely to get contraception from a clinic-based provider
A third of reproductive-age women report that they have ever visited a Planned Parenthood clinic for health care services.
One in three women ages 18-44 report having ever visited a Planned Parenthood clinic for health care services (Figure10). This is higher among women in fair or poor health, with almost one half (45%) reporting they have ever visited a Planned Parenthood clinic, compared to 32% of women in good, very good or excellent health. Rates do not differ significantly by race/ethnicity or type of insurance.
Figure 10: One-third of women report having ever visited a Planned Parenthood for health care services
Counseling and Screening
A higher share of women report provider counseling for contraception than for sexual history, sexually transmitted infections (STIs), and HIV.
An important element of reproductive and sexual health care is the counseling and education that health care clinicians can offer patients. Counseling allows clinicians to provide patient education, screen for high-risk behaviors, social determinants that could affect health outcomes, and identify the need for additional testing or treatment. Some factors that are associated with poor reproductive and sexual health outcomes are preventable or avoidable. It is estimated that nearly half of all pregnancies in the U.S. are unintended. In addition, there are approximately 20 million new cases annually of STIs, such as chlamydia, gonorrhea, and HPV, and many reached record-breaking levels in 2016. Most Medicaid programs and private plans include coverage for provider counseling on a wide range of sexual health topics, including STIs, contraception use, and partner violence.
Despite these public health challenges and the recommendations of professional groups, counseling on many of these topics is not routine among women of reproductive age. While most reproductive-age women report having had a recent conversation with a provider about contraception (65%) and sexual history (61%), fewer report having discussed HIV (36%) and other STIs (37%). Overall, counseling rates are higher among Black and Latina women (Figure 11). While women who have private insurance report the highest rates of counseling on contraception and sexual history, women covered by Medicaid report significantly higher rates of counseling on HIV and other STIs (Table 6). Lower-income women and those who live in urban settings report higher rates of discussion on HIV and STIs. Only one-third of women between the ages of 40-64 said a clinician had discussed symptoms of menopause with them in the past three years.
Figure 11: Counseling rates for STIs and HIV are higher among Black and Latina women compared to White women
Table 6: Share of women who said their physician discussed these reproductive health issues with them in past three years, by selected characteristics
All Women
Insurance Type
Poverty Level
Age Group
Location
Reported having discussed in past 3 years
Private
Medicaid
Uninsured
≥200% FPL
<200% FPL
18-24
25-34
35-44
Urban
Rural
Contraception or birth control
65%
70%
61%
55%*
69%
62%
69%*
74%*
54%
66%
60%
Sexual history or relationships
61%
63%
60%
50%*
61%
63%
70%*
68%*
48%
62%
55%
HIV
36%
29%
50%*
38%
30%
43%*
42%*
37%
30%
41%
27%*
Another STI
37%
34%
48%*
36%
32%
46%*
48%*
40%*
28%
43%
32%*
Menopause^
34%
33%
37%
34%
33%
37%
–
–
34%
32%
46%
NOTES: ^All topics are among women ages 18-44, except Menopause, which is among women, ages 40-64. The Federal Poverty Level (FPL) was $20,420 for a family of three in 2017. *Indicates a statistically significant difference from Private, ≥200% FPL, Ages 35-44, Urban; p<.05. – indicates data not available.SOURCE: Kaiser Family Foundation, 2017 Kaiser Women’s Health Survey.
Despite the high rate of sexual violence on women in the U.S., few women report they have talked with a provider about intimate partner violence.
More than 1 in 3 adult women in the United States (36%) have experienced rape, physical violence, and/or stalking by an intimate partner in their lifetime. Intimate partner violence (IPV), also called domestic or dating violence, can affect women at any point in their lives, but rates are highest among women in their reproductive years.
It has long been recognized that clinicians can play an important role in the identification and treatment of women who have suffered from violence, and one of the preventive services that the ACA covers without cost sharing is provider counseling on IPV. While there have been advances in the health care system’s handling of IPV and newly developed screening tools for providers to use, it is still far from routine for providers to raise the issue of violence with women. A little more than a quarter (27%) of women say they have discussed domestic or dating violence in the past three years with their provider (Figure12). Counseling rates are higher among women of color, low-income women, and those covered by Medicaid.
Figure 12: Approximately one quarter of women have discussed domestic violence with their provider recently, but rates are higher among Black and Latina women and those with Medicaid
Provider counseling rates on many sexual health topics are on the rise.
There has been a rise in counseling rates on some sexual health topics over the past decade, particularly sexual history and intimate partner violence (Figure 13). In 2004, less than a third of women reported recently speaking with a provider about their sexual history, but this has risen sharply to six in ten women (61%) in 2017. Provider counseling on violence remains relatively low at 27%, but this is up from 12% in 2004. Counseling rates on HIV and STIs have risen more modestly.
Figure 13: Counseling rates for some sexual health topics has increased over the past decade
Approximately four in ten women report recent screenings for HIV and other STIs, but many incorrectly assume they are being tested.
Along with counseling, several professional groups and government agencies, including the USPSTF, the Institute of Medicine, and the Centers for Disease Control and Prevention, recommend that women in their reproductive years be tested for STIs such as chlamydia, gonorrhea and HIV. Knowing one’s status is important to receive early treatment and prevent transmission to sexual partners. STI and HIV tests are covered without cost sharing in new private plans under the ACA’s preventive services coverage requirements and are typically covered by most Medicaid programs.
Approximately four in ten women report that they have had a test for HIV (42%) or other STIs (42%) in the past two years; however, roughly half (49%) of these women assumed this test was a routine part of an examination—which is often not the case (Figure 14). Therefore, the actual screening rate is likely lower than the share of women who report being tested. This may cause women to believe they do not have an STI when in fact they have not actually been tested.
Figure 14: Many women incorrectly believe that STI tests are a routine part of an examination
Screening rates for HIV and other STIs were higher among women of color, women covered by Medicaid, and women living in urban areas (Table 7). Black women reported asking to be tested for HIV and other STIs at higher rates, whereas Latina and White women were more likely to have the impression it was a routine part of the exam.
Table 7: Receipt of sexual health screening tests, by race/ethnicity, insurance status, poverty level
All Women
Race/Ethnicity
Insurance Type
Poverty Level
Reported having test in past 2 years
White
Black
Latina
Private
Medicaid
Uninsured
<200%FPL
≥200%FPL
HIV Test
42%
33%
66%*
51%*
38%
58%*
39%
54%*
36%
Thought test was routine part of exam
49%
52%
35%*
60%*
50%
47%
48%
47%
49%
Doctor recommended test
11%
9%
11%
10%
12%
6%
12%
11%
11%
Asked to be tested
40%
38%
54%*
29%
38%
47%
40%
42%
39%
STI Tests
42%
37%
63%*
45%
41%
54%*
31%
50%*
39%
Thought test was routine part of exam
48%
50%
31%*
66%*
47%
48%
59%
42%
52%
Doctor recommended test
11%
9%
12%
8%
10%
9%
6%
10%
11%
Asked to be tested
41%
41%
57%*
26%*
42%
43%
34%
47%
37%
NOTES: Among women ages 18-44. The Federal Poverty Level (FPL) was $20,420 for a family of three in 2017. *Indicates a statistically significant difference from White; Private insurance; ≥200% FPL, p<.05.SOURCE: Kaiser Family Foundation, 2017 Kaiser Women’s Health Survey.
Conclusion
This survey finds that a sizeable share of sexually active women are not using any contraception and are at greater risk for unintended pregnancy. Provider counseling rates on many topics such as a woman’s sexual history and STIs, have increased over time, but many women still report that their provider has not spoken with them about important issues, such as intimate partner violence. Publicly supported clinics, including community health centers and Planned Parenthood sites, play an important role in providing reproductive and family planning care for uninsured women and women of color. The ACA’s requirement for contraceptive coverage without cost sharing has reached a large swath of women, who now do not pay any out of pocket costs for contraception.
However, the Trump Administration’s health policy agenda proposes many changes that would affect women’s access to reproductive health care. The Administration has proposed new regulations that would extend the number of employers who may be exempted from the contraceptive coverage requirement because of religious or moral objections. The Administration has also expressed support for withdrawing federal reimbursements for services that Planned Parenthood provides to low-income women including Medicaid and Title X family planning funds. These policies would cripple the ability of Planned Parenthood to continue to provide care that women need and use, and would disproportionately limit access to low-income and minority women.
Community health centers are a key component of our health care system, providing essential access to comprehensive primary care in underserved communities. The health center program has experienced significant growth over time, particularly since the enactment of the Affordable Care Act (ACA), which expanded coverage options for many low-income health center patients and provided increased funding for health centers through the Community Health Center Fund (CHCF). With the enhanced ACA funding, health centers have expanded their service delivery capacity to meet the growing demand for care among new and existing patients. Drawing on federal health center data from 2016 and the Health Center Patient Survey from 2009 and 2014, this brief describes health centers and their patients in 2016 and examines changes in access to care and utilization of services by health center patients following implementation of the ACA coverage expansions in 2014. Key findings include:
#CommunityHealthCenters are a key component of the health care system, providing access to comprehensive primary care in underserved communities. The health center program has experienced significant growth, particularly since the enactment of the #ACA
Health centers are an important source of primary care for Medicaid and uninsured patients. In 2016, health centers served 25.9 million patients at over 10,400 urban and rural locations. Just under half (49%) of health center patients were covered by Medicaid and nearly a quarter (23%) were uninsured. Nationally, one in six Medicaid enrollees received care at a health center.
Medicaid and Federal Section 330 grant funds account for the majority of health center revenues. Medicaid is the largest source of funding for health centers, accounting for 43% of total health center revenue. Federal grants represent the next largest source of funding at 19%. These federal grant funds support care to uninsured and underinsured patients and enable health centers to provide services not covered by other payers. Health centers in states that did not expand Medicaid under the ACA are more reliant on federal grant funds. For these health centers, federal grant funding accounts for over a quarter of total revenues.
Health centers in Medicaid expansion states have greater operational capacity and serve more patients than health centers in non-expansion states. State decisions on the Medicaid expansion have had service delivery implications for health centers. Health centers in Medicaid expansion states reported higher Medicaid revenues on average and higher revenues overall than health centers in non-expansion states. These higher revenues enabled health centers in expansion states to serve over a quarter more patients and provide nearly 50% more patient visits. Health centers in expansion states also employed more staff on average and were more likely to provide a broader array of services, including mental health, substance use disorder, and vision services.
The ability of health center patients to access needed care improved following implementation of the ACA coverage expansions. Despite concerns raised by policy experts that the ACA coverage expansions would lead to an inability to get needed care and longer waits for care, fewer health center patients reported facing barriers to care in 2014 compared to 2009. The share of patients reporting an inability to obtain needed medical care dropped by one-third (from 23% to 15%) and the share reporting a delay in getting needed care dropped by over a quarter. Patients reported similar improvements in access to dental care, and these improvements occurred for both Medicaid and uninsured patients.
Utilization of certain preventive services by health center patients increased. Along with improvements in accessing needed care, health center patients also reported increased utilization of certain preventive services, including flu shots and physical exams. Over half of adult health center patients said they received a flu shot in 2014, up from just 39% in 2009. Nearly 7 in 10 reported receiving a physical exam in 2014 compared to 63% in 2009. Uninsured patients were also significantly more likely to have received a dental exam in 2014 than in 2009 (42% vs. 33%).
Issue Brief
Introduction
Community health centers play an increasingly important role in the US health care system. Launched in 1965 as a small experiment in bringing comprehensive primary care to rural and urban medically underserved communities, health centers have grown steadily over five decades following studies showing their effectiveness, not only in creating access to health care but in improving health on a community-wide basis.1 Today’s health centers offer a wide range of services spanning a full spectrum of care for conditions that can be successfully managed in community settings. Services found at health centers range from basic preventive medical and dental care to advanced treatment for serious and chronic physical and mental health conditions.
This issue brief provides a 2016 snapshot of health center patients and operations, including the services they furnish, their staffing, and their financial characteristics. It also examines changes in access to care and utilization of services by health center patients following the implementation of the coverage expansions through the Affordable Care Act (ACA) in 2014.
Findings
National Profile of Health Centers
Health centers serve a large and diverse patient population. In 2016, federally-funded community health centers served 25.9 million children and adults—more than one in twelve people—in over 10,400 urban and rural locations. An additional 58 community health centers supported with state and local funding cared for more than 738,000 patients.2
The demographic profile of health center patients reflects how health centers, authorized under Section 330 of the Public Health Service Act, serve communities in need. By law, health centers must operate in or serve communities considered medically underserved because of elevated poverty and health risks and a shortage of primary health care providers. In 2016, over nine in ten (92%) health center patients had income at or below 200% of the federal poverty level, including 70% who had incomes at or below 100% of the federal poverty level or $20,780 for a family of three in mainland U.S. in 20183 (Figure 1). Because racial and ethnic minority Americans are more likely to live in medically underserved areas, they represent a greater share of health center patients. In 2016, nearly six in ten health center patients were from racial or ethnic minority groups, while only 41% of patients were non-Hispanic White. Hispanics comprised 30% of all patients, Black/African American patients represented 22%, and 7% were other races, including Asians and American Indian and Alaska Natives. The majority of health center patients were female and working-age adults; however, 31% of health center patients were children under 18, reflecting the important role health centers play in providing access to care for poor children and their families.
Figure 1: Demographic Profile of Health Center Patients, 2016
Growth in the number of health centers over time has led to a substantial increase in the number of patients who receive care at health centers. Since 2000, the number of health centers has increased from 730 to 1,367 in 2016. At the same time, the number of patients served surged from 9.6 million in 2000 to 25.9 million in 2016 (Figure 2). While the number of patients has grown steadily since 2000, the pace of growth for patients with health coverage, especially those with Medicaid, increased following the implementation of the ACA in 2014. In contrast, the number of uninsured patients nearly doubled from 2000 to 2010 and then fell in the wake of implementation of the ACA.
Figure 2: Number of Health Center Patients, by Health Coverage Status, 2000-2016
Nearly half of health center patients overall are covered by Medicaid. Medicaid is the most important source of health coverage for health center patients. In 2016, 49% of patients were covered by Medicaid (Figure 3). Another 17% had private insurance, including coverage through the Marketplaces, while 9% had Medicare. Despite increases in coverage from the ACA, 23% of health center patients were uninsured in 2016.
Figure 3: Health Coverage of Health Center Patients, by State Medicaid Expansion Status, 2016
Furthermore, health centers represent a key source of health care for Medicaid patients. In 23 states and the District of Columbia, health centers serve at least 15% of the population with Medicaid or Children’s Health Insurance Program (CHIP) coverage, and in six states and the District of Columbia, more than one in four people with Medicaid use health centers (Figure 4). Nationally, one in six Medicaid enrollees receives care through a health center.4
Figure 4: Proportion of Medicaid/CHIP Enrollees Receiving Care at Health Centers, 2016
Coverage of health center patients differs in Medicaid expansion and non-expansion states. State Medicaid expansion decisions affect the coverage of health center patients. In states that expanded Medicaid, over eight in ten patients have health coverage, and over half are covered by Medicaid. In contrast, less than two-thirds of health center patients in non-expansion states have health coverage, and only one-third has Medicaid coverage (Figure 3). A slightly higher share of patients in non-expansion states has private coverage (20% vs. 16%). However, because marketplace subsidies are not available to individuals with income below 100% FPL, which leaves millions of poor adults in the Medicaid coverage gap, health center patients in non-expansion states are more likely to be uninsured than those in expansion states. In 2016, over one in three health center patients in non-expansion states was uninsured compared to less than one in five in expansion states.
Medicaid and Federal 330 grants account for the majority of health center revenues. Health centers depend on a number of revenue sources, but revenue from Medicaid and federal Section 330 grant funds dominate. Medicaid represents the single largest source of funding, accounting for 43% of total health center revenues in 2016 (Figure 5). Federal Section 330 grants, funded through a combination of annual appropriations and the Community Health Center Fund,5 represent the next largest source of revenue at 19%. These federal grants make it possible for health centers to reach uninsured populations and to offer services for which there is no source of insurance coverage, such as adult dental care, covered under Medicaid on a comprehensive basis in only 15 states in 2016.6 Grant funding also supports health centers’ obligation to discount their charges in accordance with patients’ ability to pay (a legal requirement of the health center program). Critical not only for uninsured patients, but also for those enrolled in private insurance plans that have large deductibles and other out-of-pocket costs, these discounts ensure access to affordable care for health center patients.
Figure 5: Sources of Health Center Revenue, by State Medicaid Expansion Status, 2016
Health centers in Medicaid expansion states have higher revenue and greater operational capacity than those in non-expansion states. In 2016, average revenues for health centers in Medicaid expansion states were over 60% higher than for health centers in non-expansion states ($20.1 million vs. $12.4 million). The primary sources of those revenues also differ. Medicaid is a more important source of funding in expansion states, accounting for 48% of health center revenue compared to 29% of revenues in non-expansion states. By contrast, health centers in non-expansion states are more reliant on Section 330 grant funding to support their operations. These grant funds represent over a quarter of total revenues in non-expansion states compared to 16% in expansion states.
The higher revenue available to health centers in Medicaid expansion states translates into significantly higher average number of patients served, increased number of delivery sites, larger staffs, and a broader range of services provided (Table 1). In 2016, health centers in expansion states served 20,471 patients compared to 16,143 patients at health centers in non-expansion states and provided 49% more clinic visits (86,045 vs. 57,913). In addition, they employed 170 full-time equivalent (FTE) staff compared to 118 FTE staff at health centers in non-expansion states. Health centers in expansion states were also more likely to provide substance use disorder and/or mental health services and vision care services than health centers in non-expansion states.
Table 1: Health Center Profile, by State Medicaid Expansion Status in 2016
Health Center Profile
Medicaid Expansion States
Non-expansion States
Health Center Characteristics (averages)
Total Revenues*
$20.1 million
$12.4 million
Number of delivery sites*
8
7
Patients*
20,471
16,143
Patient visits*
86,045
57,931
Total staff (FTE)*
170
118
Share of Health Centers Offering the Following Services
Substance use disorder and/or mental health services*
91%
79%
Dental services
81%
79%
Vision care services*
27%
18%
SOURCE: GW analysis of 2016 UDS data.* Difference between Medicaid expansion and non-expansion states is significant at p<.05.
Health centers provide a range of services to meet patient needs. In 2016, health centers reported 104 million patient visits. Of these visits, over two-thirds (68%) were medical care visits, and 14% were dental care visits (Table 2). Mental health and substance use disorder services accounted for nearly 10% of all patient visits that year, while assistance in enabling access to other necessary care accounted for 6% of all visits. Over the years, the mix of health center services also has changed, reflecting both the evolution of the health center program and changing patient needs. In 2010, 76% of health centers offered dental care; by 2016, the share had grown to 80%. The proportion of health centers offering mental health services grew from 73% to 87% over this time period, while the proportion offering substance use disorder services increased to one in four (28%) by 2016, up from 20% in 2010 (Figure 6). The share of health centers providing addiction services is likely higher as the 28% reported here only include those health centers with staff dedicated to treating substance use disorders; it does not include health centers that do not have dedicated staff, but where primary care physicians are providing medication-assisted treatment or other addiction treatment services.
Figure 6: Percentage of Health Centers Providing Dental and Behavioral Health Services, 2010 and 2016
Health centers are major employers in their communities. In 2016, health centers employed 207,656 FTE staff. These staff included 12,419 physicians, 60,035 nurse practitioners, physician assistants, nurses, and other medical services personnel, 16,142 dental professionals, 20,497 staff furnishing enabling services, and 10,355 staff providing mental health and substance use disorder services, including treatment for opioid addiction.7 In addition, health insurance enrollment assistance always has been a basic requirement for all health centers; in 2016, health centers employed 4,535 eligibility assistance workers.8 Since 2013, health center eligibility workers have assisted more than 12 million community residents with insurance enrollment.9
The National Health Service Corps (NHSC), which provides scholarship and loan repayment assistance to support training of primary health care medical and dental professionals, represents a key source of health center staffing. There are currently 8,153 FTE providers employed by the NHSC10 and community health centers account for about half of NHSC sites.11 According to HRSA estimates, NHSC assignees account for 19% of clinical staff working at health centers.12
Table 2: Patient Visits by Type of Service, 2010-2016
Patient Visits
2010
2016
Total visits
77 million
104 million
Medical care
73%
68%
Dental care
12%
14%
Mental health services
6%
8%
Substance use disorder services
1%
1%
Vision/other professional services
2%
3%
Enabling services
6%
6%
SOURCE: GW analysis of 2010 and 2016 UDS data.
Access to Care for Health Center Patients
Following implementation of the ACA, fewer health center patients reported they could not get the care they needed. Leading up to the implementation of the ACA’s coverage expansions in 2014, many experts expressed concern over whether primary care providers, especially safety net providers, had the capacity to ensure access to care for the millions of people who would gain coverage through the expansion of Medicaid and the Marketplaces. They feared that while low-income adults might gain coverage, they would face long wait times or other barriers to getting needed care. Recently released data from the Health Center Patient Survey from 2014 indicates that health center patients experienced fewer barriers to accessing needed care following the coverage expansions in 2014 compared to 2009. Specifically, between 2009 and 2014, the proportion of nonelderly adult health center patients reporting an inability to obtain medical and dental care declined significantly, from 23% to 15% for medical care and 45% to 34% for dental care (Figure 7). The share reporting they could not access needed prescription drugs increased slightly; however, this change was not significant.
Figure 7: Self-reported Inability to Obtain Necessary Health Services for Nonelderly Adult Health Center Patients, 2009 and 2014
Examining these trends by patient health insurance status reveals that the share of uninsured patients reporting an inability to get medical services dropped by nearly half from 37% in 2009 to 20% in 2014 (Appendix Table 1). This significant improvement in the ability of uninsured patients to access medical care may be the result of efforts by health centers to expand their capacity with funding made available by the ACA. This finding also underscores the importance of federal grant funding in supporting health centers’ commitment to serving uninsured patients. While Medicaid patients did not experience the same degree of improvement in their ability to access medical services, they were less likely than uninsured patients to report inability to access care (14% vs. 20% in 2014). However, Medicaid patients experienced significant improvements in access to dental care.
The share of patients reporting delays in getting needed health care services also declined, but some health center patients continue to face challenges in getting the care they need. Increases in insurance coverage through the ACA also did not result in longer wait times for health services, as some policymakers feared. From 2009-2014, the proportion of health center patients reporting delays in obtaining needed medical and dental care and prescription drugs also declined (Figure 8). However, despite improvements in coverage, in the first year of full implementation of health reform some health center patients continued to face challenges getting needed care in a timely manner, possibly because of a surge in people seeking care as insurance reforms rapidly took effect. These challenges were particularly prominent in the case of dental care, with roughly a third of patients reporting an inability to obtain care and a third reporting delays in obtaining care. Additionally, over one in five health center patients reported not being able to get needed prescription drugs in 2014. This barrier may result from restrictive drug formularies, particularly for Marketplace plans, but also for Medicaid in some states.
Figure 8: Self-reported Delays in Obtaining Necessary Health Services for Nonelderly Adult Health Center Patients, 2009 and 2014
Utilization of preventive services increased among health center patients from 2009 to 2014. Health center patients in 2014 were more likely than those in 2009 to report having received a flu shot and having had a physical exam during the previous year (Figure 9). Uninsured patients were also significantly more likely to have had a physical exam and a dental exam in 2014 than in 2009 (Appendix Table 2). These changes are likely a reflection of increases in insurance coverage, which not only facilitates access to many necessary services but also increases health centers’ capacity to provide both physical and dental health care to all patients, regardless of their insurance status.
Figure 9: Past-year Utilization of Select Preventive Services among Nonelderly Adult Health Center Patients, 2009 and 2014
Emerging Opportunities and Challenges
In a rapidly changing health care environment, important opportunities and challenges for health centers continue to emerge. Health centers reach 26 million people, but more than 90 million live in medically underserved communities.13 As the principal program for anchoring primary health care in underserved communities, continued growth in the health center program will broaden access to care in these communities, particularly given the strong evidence of the role of primary health care in a high performing health system. However, growth depends on steady, reliable revenue in order to hire staff, to expand the range of services offered, and to add hours and locations. Given the communities in which health centers operate, Medicaid and federal section 330 grants represent the two most important sources of revenue.
The recent delay in extending the Community Health Center Fund (CHCF), which provides 70% of all grant funding on which health centers rely in order to support the cost of uncovered services and populations, underscores the impact funding uncertainty can have on the ability of health centers to serve their patients. The CHCF expired on September 30, 2017 and was not renewed until February 9, 2018. Preliminary data from a 2018 survey of community health centers revealed that health centers had begun taking a number of actions in response to the funding delay, and many more were considering actions.14 Nearly two-thirds reported they had or would institute a hiring freeze and 57% said they would lay off staff. Six in ten reported they were canceling or delaying capital projects and other investments and nearly four in ten said they were considering eliminating or reducing dental health and mental health services. With the CHCF reauthorized for two years, it is likely that many health centers will halt or reverse these decisions; however, their responses highlight the challenge funding uncertainty poses to the ability of health centers to sustain their operations.
Looking ahead, the resolution of the funding cliff is important, but it is also relatively short-term. Preventing future cliffs that have a disruptive effect on essential health center operations will help sustain the program over time and better ensure stability within the primary care system, a crucial dimension of access and quality. One approach under discussion would extend the period of funding for health centers and the National Health Service Corps similar to the 10-year funding approach now established for CHIP. This strategy could enable health centers to make long-term operational decisions without concern over whether funding would be available from one year to the next.
State decisions on the ACA Medicaid expansion have also had a significant effect on the capacity of health centers to serve low-income communities. Health centers in states that expanded Medicaid have more sites, serve more patients, and are more likely to provide behavioral health and vision services than health centers in non-expansion states. The service delivery implications of 18 states opting not to expand Medicaid continue to limit health center capacity.
Finally, increasing access to care remains a key focus for health centers. Findings from the Health Center Patient Survey indicate that access to needed care for health center patients improved overall in the immediate period following implementation of the ACA. Increases in insurance coverage among health center patients, along with enhanced investment in the health center program, contributed to improvements in the ability of patients to get the care they need and in reduced delays in obtaining needed care. Access to preventive services, including annual physicals and flu shots, also improved. However, some patients continue to face barriers to care, particularly uninsured patients. Maintaining recent coverage gains through the Medicaid expansion and the Marketplaces and continued stable funding for health centers are important to ensuring patients in medically underserved and rural communities can access the care they need.
Additional funding support for this brief was provided to the George Washington University by the RCHN Community Health Foundation.
Methods
The data sources that informed this analysis include the federal Uniform Data System (UDS) as well as the Health Center Patient Survey. The UDS collects detailed data from health centers annually, including patient demographics, services provided, clinical processes and outcomes, patients’ use of services, costs, and revenues. The data presented in this brief were collected in 2016, the most recent year for which data are available. Analyses by Medicaid expansion status were based upon states’ status by the end of 2016, when 19 states15 had not yet adopted the Medicaid expansion. Analyses by Medicaid expansion do not include data on health centers in US territories.
The Health Center Patient Survey (HCPS) provides patient-level data on a number of measures, including sociodemographic characteristics, health conditions, health behaviors, access to and utilization of health care services, and satisfaction with health care services. HCPS data are collected every five years using in-person, one-on-one interviews and provide a nationally representative overview of patients who receive care at health centers. The data presented in this brief were drawn from 2009 and 2014, the first year of available data following implementation of the ACA coverage expansions. The analysis is restricted to nonelderly adults (age 18-64), the subset of patients most affected by the Medicaid expansion.
In both years of the HCPS, all participants were asked whether they or their doctor believed they needed various types of health services, including medical care, dental care, and prescription medication. They were also asked whether they were unable to obtain or delayed in obtaining these services. This treatment could have been delivered by the health center or by another health care provider. Participants were also asked about past-year health services utilization for a number of measures, including flu shots, physical exams, and dental exams.
Appendix
Appendix Table 1: Share of Patients Reporting Problems Obtaining Health Services, 2009 and 2014
All Health Center Patients
Patients with Medicaid
Uninsured Patients
2009
2014
2009
2014
2009
2014
Inability to obtain necessary care
Medical care
23%
15%*
17%
14%
37%
20%*
Dental care
45%
34%
45%
30%*
50%
50%
Prescription drugs
19%
22%
16%
19%
27%
29%
Delays in obtaining necessary care
Medical care
23%
17%*
20%
17%
30%
20%
Dental care
44%
32%*
44%
28%
48%
43%
Prescription drugs
27%
24%
25%
22%
31%
30%
* Difference between 2009 and 2014 is significant at p<.05.SOURCE: GW and Kaiser Family Foundation analysis of 2009 and 2014 Health Center Patient Survey Data
Appendix Table 2: Share of Patients Receiving Certain Preventive Health Services, 2009 and 2014
All Health Center Patients
Patients with Medicaid
Uninsured Patients
2009
2014
2009
2014
2009
2014
Received a flu shot
39%
51%*
46%
55%
33%
39%
Had a physical exam
63%
69%*
72%
70%*
52%
66%*
Had a dental exam in past year
45%
50%
58%
53%
33%
42%*
* Difference between 2009 and 2014 is significant at p<.05.SOURCE: GW and Kaiser Family Foundation analysis of 2009 and 2014 Health Center Patient Survey Data
Endnotes
Karen Davis and Cathy Schoen, Health and the War on Poverty (Brookings Press, 1977) ↩︎
AL, FL, GA, ID, KS, ME, MS, MO, NE, NC, OK, SC, SD, TN, TX, UT, VA, WI, WY; Maine has since decided to expand but was counted as a non-expansion state in this analysis. Louisiana expanded in July 2016 and is counted as a Medicaid expansion state in this analysis. ↩︎