Digging Into the Data: What Can We Learn from the State Evaluation of Healthy Indiana (HIP 2.0) Premiums
Issue Brief
Indiana initially implemented the ACA’s Medicaid expansion through a Section 1115 waiver in February 2015. Indiana’s waiver included important changes from federal law regarding enrollment and premiums. The initial waiver expired, and Indiana received approval for a waiver extension in February, 2018 which continues most components of HIP 2.0 and adds some new provisions related to enrollment and premiums. This brief looks at available data from the state’s evaluation of premiums prepared by The Lewin Group (as well as other reporting to CMS) to highlight what is known about the impact of these policies to date. We review these data to identify potential implications for changes in the recent Indiana renewal and for other states considering similar provisions. Key findings include the following:
- The state evaluation shows that more than half (55%) of all of those eligible to pay premiums under HIP 2.0 during the first two years of implementation failed to do so, resulting in negative consequences.
- For those with incomes at or below 100% FPL, 57% or nearly 287,000 people were moved from a more comprehensive to a more limited benefit package for failing to pay a HIP 2.0 premium during the first two years of Indiana’s waiver. 1
- Among those with incomes above 100% FPL, over half (51%) of those determined eligible for HIP 2.0 did not make premium payments (over 46,000 people never enrolled in coverage because they never paid their first premium and another 13,550 people successfully enrolled in HIP 2.0 but later lost coverage for failing to pay a premium during the first two years of HIP 2.0).
- The top two reasons cited by people who never enrolled in or lost HIP 2.0 coverage were affordability and confusion about the payment process.
- Many people who never got or lost HIP 2.0 coverage for failing to pay a premium were uninsured.
The data and findings have implications for the new provisions included in the Indiana renewal that include a tobacco premium surcharge, a lock-out for failure to timely renew and a work requirement . These changes could make premiums unaffordable for more individuals and result in potentially eligible people losing coverage. Recent quarterly reporting suggests that 28% of disenrollments were due to failure to complete or comply with redeterminations, so many could be subject to a coverage lock-out. These data as well as data about confusion in making premium payments could signal that administrative, paperwork or process barriers could affect individuals subject to new work requirements. Eligible individuals may experience problems in documenting their work status or navigating an exemption resulting in eligible individuals losing coverage. Understanding the implications of existing waiver policies in Indiana and tracking implications of the renewal policies could also help inform other states considering similar policies.
Introduction
Indiana initially implemented the ACA’s Medicaid expansion through a Section 1115 waiver in February 2015. The waiver modified Indiana’s pre-ACA limited coverage expansion waiver (HIP 1.0). Unlike other states that implemented the ACA’s Medicaid expansion through a waiver, Indiana’s demonstration also changes the terms of coverage for non-expansion adults (low-income parents and those eligible for Transitional Medical Assistance, TMA). Indiana’s waiver included important changes from federal law regarding enrollment and premiums2 , specifically:
- Charging monthly premiums, paid into a health account, for expansion adults and low-income parents;
- Delaying the effective coverage period until the 1st premium payment, or for those from 0-100% FPL, after the expiration of a 60-day payment period;
- Enrolling adults who pay premiums in HIP Plus, an expanded benefit package with co-payments only for non-emergency use of the ER while enrolling beneficiaries at or below 100% FPL who fail to pay premiums in HIP Basic, a more limited benefit package with state plan level co-payments for most services; and
- Disenrolling and imposing a 6-month coverage “lock-out” on those with incomes from 101-138% FPL who fail to pay premiums after a 60-day grace period. Individuals cannot re-enroll in coverage until after the coverage lock-out period has ended.
Like other states that have expanded Medicaid, Indiana experienced a reduction in the number of uninsured residents and a large gain in Medicaid enrollment. Between 2013 and 2016, the nonelderly uninsured rate fell by 7.0 percentage points in Indiana, larger than both the national average decrease of 5.2 percentage points and the 5.5 percentage point decrease in all Medicaid expansion states. As of December 2017, there were nearly 397,000 beneficiaries enrolled in HIP 2.0.3 Overall, 83% of enrollees had incomes at or below 100% FPL (44% with incomes below 5% FPL).4
The initial waiver expired, and Indiana received approval for a waiver extension in February, 2018 which continues most components of HIP 2.0 and adds some new provisions. A detailed summary of the provisions included in the recent approval can be found here, but key changes to HIP 2.0 related to enrollment and premiums approved on February 1, 2018 include:
- Increasing premiums by 50% for all tobacco users beginning in their second year of enrollment;
- Disenrolling most adults who do not timely complete the eligibility renewal process; in addition, these adults are locked out of coverage for 3 months;
- Changing premiums to a tiered structure instead of a flat 2% of income; and
- Conditioning Medicaid eligibility for most adults on meeting a work requirement beginning in 2019.
This brief looks at available data from the state’s evaluation of premiums (as well as other reporting to CMS) to highlight what is known about the impact of these policies to date. In addition, we review these data to help inform potential implications related to changes in the recent Indiana renewal and for other states considering similar provisions.
Key Findings
Overall, more than half (55%) of all of those eligible to pay premiums under Indiana’s waiver during the first two years of implementation failed to do so, resulting in negative consequences. Data from the state evaluation show that 55% of the 590,315 individuals eligible to pay a premium between February, 2015 and November, 2016, did not do so. The consequences for failing to make a payment differ by income.5 The rate of non-payment was higher among individuals with incomes at or below 100% FPL with 57% failing to make a premium payment compared to 51% of those with incomes above 100% FPL that did not make a payment. In addition, recent monthly data show that as of December, 2017 over 20,000 people were “conditionally eligible” meaning they had been found eligible for Medicaid in Indiana, but were not yet enrolled due to failure to pay premiums. Over half (54%) of those conditionally eligible had no or very low incomes, below 5% FPL (less than $607 per year for an individual in 2018); another 26% had income between 6-100% FPL, and 20% had income above 100% FPL.6
Among those with incomes below 100% poverty, 57% or nearly 287,000 people were moved from the more comprehensive to the more limited benefit package for failing to pay a HIP 2.0 premium during the first two years of Indiana’s waiver. 7 People with incomes at or below the federal poverty level do not have to pay premiums to get or maintain coverage under Indiana’s waiver. If people at this income level choose to pay premiums, they receive HIP Plus benefits, which include vision, dental, and expanded prescription drug coverage; if they do not pay premiums, they receive HIP Basic benefits, without the additional Plus covered services and with point-of-service copayments.
Over half (51%) of those with income above 100% FPL determined eligible for HIP 2.0 never enrolled in coverage or lost coverage for failure to pay premiums (Figure 1). Without Indiana’s waiver, these people would have been enrolled in coverage after they were found eligible and would have retained coverage without having to pay a premium.
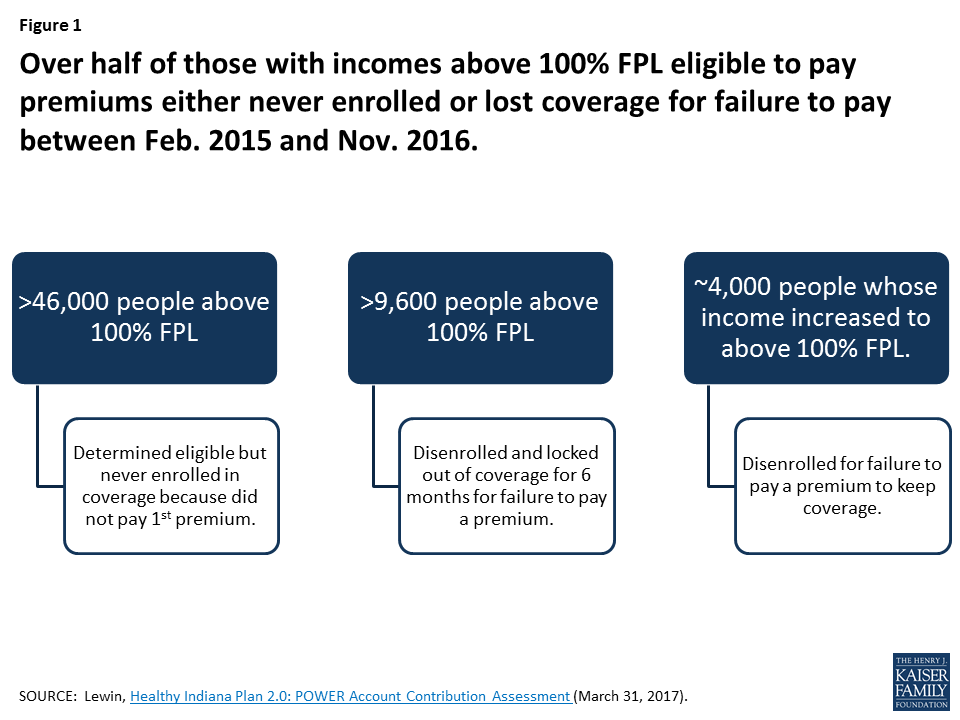
- Over 46,000 people were determined eligible for HIP 2.0, but never enrolled in coverage because they never paid their first premium during the first two years of HIP 2.0.8 These data are reported in the state’s evaluation of premiums under the waiver from February, 2015 through November, 2016. These people are required to pay a premium to get and keep coverage under Indiana’s waiver because they have income above the federal poverty level. The evaluation refers to them as “Never Members.”
- Another 13,550 people successfully enrolled in HIP 2.0 but later lost coverage for failing to pay a premium during the first two years of HIP 2.0.9 As noted above, monthly premium payments are required for people from 100-138% FPL to get and keep coverage under Indiana’s waiver. Of this group, over 9,600 people were disenrolled from coverage and prevented from re-enrolling (locked out) for six months because they had income above 100% FPL and missed a premium payment. The state evaluation report refers to this group as “Leavers.” About 4,000 other people had their income increase from below the federal poverty level to above the federal poverty level, making them newly subject to premiums to keep coverage; this group was disenrolled for not paying a premium to keep coverage but was not subject to the 6-month lock-out.
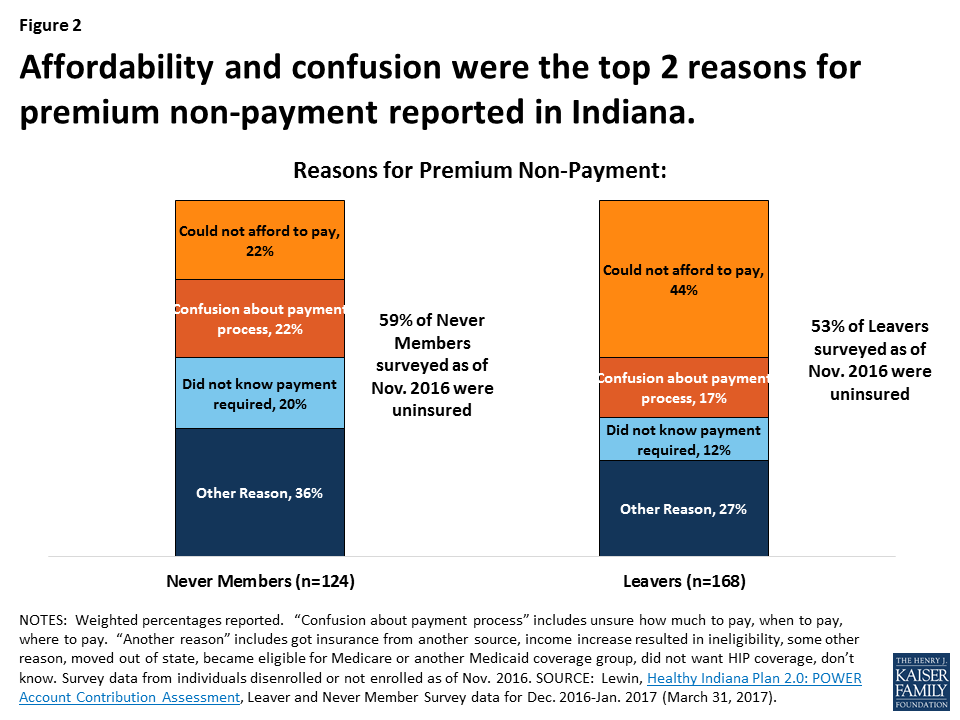
The top two reasons cited by people who never enrolled in or lost HIP 2.0 coverage were affordability and confusion about the payment process (Figure 2). More than 1 in 5 (22%) of those who never made an initial premium payment to effectuate coverage and more than 2 in 5 (44%) of those who were disenrolled for missing a payment said that they could not afford to pay in survey results included in the state evaluation report. Another 22 percent of those who never made an initial payment and 17 percent of those who were disenrolled for missing a payment said that they were confused about how much, when or where to pay.10
Many people who never got or lost HIP 2.0 coverage for failing to pay a premium were uninsured. The Leaver and Never Member surveys also asked respondents whether they had health insurance coverage after leaving HIP. Forty-seven percent of Leaver respondents and 41 percent of Never Member respondents reported that they had insurance coverage at the time of the survey; that would leave 53 percent of Leavers and 59 percent of Never members without coverage or uninsured.
One in four HIP Plus enrollees report receiving help paying premiums, most often from a family member. Data in the state’s evaluation show that among those who reported paying a premium, 24% reported receiving help from a third party to do so. Enrollees were most likely to report receiving help from a family member (87%) or a friend (24%) (individuals could select more than one source of help). Very few enrollees reported receiving help from an employer or a charity or religious organization.11
Implications for the HIP 2.0 Renewal
CMS recently renewed Indiana’s HIP 2.0 waiver for another three years, from February, 2018 through December, 2020. The waiver renewal continues many of the policies already implemented, such as the delay of coverage until the first premium is paid and disenrollment and a 6-month coverage lock-out for those over the poverty level who miss a premium payment. As a result, data about the number of people who are eligible for coverage but never enroll or lose coverage due to failure to pay a premium will be important to continue to monitor to determine the waiver’s impact on coverage and implications for the number of uninsured. In addition, the waiver renewal includes some new policies, approved for the first time, which also could affect eligible people’s ability to obtain or maintain coverage, as described below.
The new waiver authority to increase premiums through a tobacco surcharge could make premiums unaffordable for more individuals. Under the waiver renewal, Indiana will charge even higher premiums for some enrollees by implementing a 50% surcharge on tobacco users beginning in their second year of enrollment.12 This surcharge increases premiums above 2% of income. For example, people with income from 76-100% FPL ($769-$1,012/month for a household of 1 in 2018) will face standard premiums of $15 per month under Indiana’s waiver renewal. The tobacco surcharge increases premiums to $22.50 per month at this income level, which exceeds 2% of income. This surcharge could apply to nearly half of demonstration enrollees.13 Existing data show that affordability and confusion about payment are key factors for individuals not paying premiums.
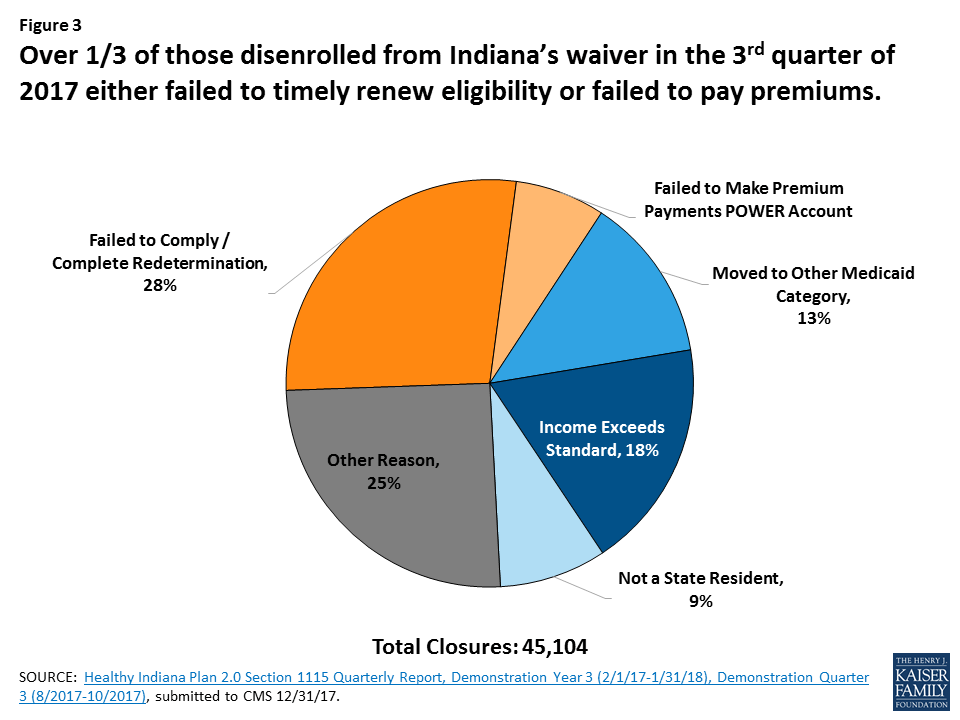
The waiver renewal allows Indiana to impose a 3 month coverage lock out on expansion adults who fail to timely renew coverage, which could result in eligible people losing coverage. If this policy were in effect from August through October, 2017, the most recent quarter with available disenrollment data, nearly one in three (28%) of those disenrolled or nearly 13,000 people would have lost coverage and not been allowed to re-apply for three months, even if eligible (Figure 3). While some people may lose coverage at renewal because they no longer meet eligibility criteria, many remain eligible but may have experienced a problem with misdirected paperwork, failure to receive a notice in the mail (for example if they recently moved or are homeless), or were unable to successfully renew coverage because they needed assistance navigating the process due to a disability. These new actions run counter to ACA changes that sought to simplify and streamline the eligibility renewal process to retain more eligible people in coverage. Indiana’s renewal lockout could result in gaps in coverage for eligible people who have difficulty completing the renewal process.
Data about disenrollment due to failure to complete or comply with renewals and data showing confusion around premiums indicate that administrative requirements create barriers to coverage. If individuals are getting disenrolled due to problems with renewals or confusion around premium payments, similar administrative, paperwork or process barriers are likely to arise when new work requirements that also were part of the Indiana waiver renewal are implemented. Individuals who may be meeting the work requirement or trying to prove they are exempt may experience barriers in documenting their work status or navigating an exemption. This will likely result in eligible individuals losing coverage and possibly becoming uninsured.
Conclusion
Data from the state evaluation of premiums can help to inform the future implementation of waivers in Indiana and Kentucky and provide lessons for other states that may consider seeking similar provisions. In addition to assessing how many people are not enrolled or are locked out or lose coverage for failing to pay premiums it is important to monitor the impact of higher premiums under the tobacco surcharge and the impact of the 3-month lockout for failure to timely renew coverage. Stakeholders also may want to assess state processes and criteria for identifying people who are medically frail or have disabilities or meet other good cause exemptions to determine how difficult these processes are to navigate, especially because similar processes for exemptions would apply to the new work requirements.
A recent GAO review of Medicaid waivers showed that complete and timely evaluations from the states were not required, so conclusive results were not available. In addition, federal evaluations were limited due to data challenges and results were not available to the public. As more Medicaid enrollees and dollars are part of Section 1115 demonstration waivers, and states are making changes that have implications for eligible people to obtain and maintain coverage, monitoring, data and state and federal evaluations will become more critical in understanding how waivers are reshaping Medicaid coverage. While not required under the evaluations, it will also be important to monitor administrative costs and resources required to implement premium and enrollment related provisions and the effect on cost from changes in enrollment.
Endnotes
- The Lewin Group, Health Indiana Plan 2.0: POWER Account Contribution Assessment (March 31, 2017), https://www.medicaid.gov/Medicaid-CHIP-Program-Information/By-Topics/Waivers/1115/downloads/in/Healthy-Indiana-Plan-2/in-healthy-indiana-plan-support-20-POWER-acct-cont-assesmnt-03312017.pdf. The distribution of the 55% does not add to 100% because individuals may be enrolled in more than one category over the period. ↩︎
- Under federal law, states may charge premiums for enrollees with incomes above 150% of the federal poverty level (FPL), including children and adults. Enrollees with incomes below 150% FPL may not be charged premiums. Overall, premium and cost sharing amounts for family members enrolled in Medicaid may not exceed 5% of household income. This 5% cap is applied on a monthly or quarterly basis. Samantha Artiga, Petry Ubri, and Julia Zur. The Effects of Premiums and Cost Sharing on Low-Income Populations: Updated Review of Research Findings. Kaiser Family Foundation, June 2017. https://modern.kff.org/medicaid/issue-brief/the-effects-of-premiums-and-cost-sharing-on-low-income-populations-updated-review-of-research-findings/ ↩︎
- HIP CMS Metrics, 12/19/2017. https://www.medicaid.gov/Medicaid-CHIP-Program-Information/By-Topics/Waivers/1115/downloads/in/Healthy-Indiana-Plan-2/in-healthy-indiana-plan-support-20-2017-dec-metrics-rpt-12192017.pdf ↩︎
- Ibid. ↩︎
- The Lewin Group, Health Indiana Plan 2.0: POWER Account Contribution Assessment (March 31, 2017), https://www.medicaid.gov/Medicaid-CHIP-Program-Information/By-Topics/Waivers/1115/downloads/in/Healthy-Indiana-Plan-2/in-healthy-indiana-plan-support-20-POWER-acct-cont-assesmnt-03312017.pdf. About 2,500 people experienced more than one negative consequence for failing to pay a premium, according to the state’s evaluation: they applied and were determined eligible for coverage but never enrolled because they never paid their first premium, and then later re-applied, enrolled, paid, but then were disenrolled for missing a subsequent payment, or vice versa. ↩︎
- HIP CMS Metrics, 12/19/2017. https://www.medicaid.gov/Medicaid-CHIP-Program-Information/By-Topics/Waivers/1115/downloads/in/Healthy-Indiana-Plan-2/in-healthy-indiana-plan-support-20-2017-dec-metrics-rpt-12192017.pdf ↩︎
- The Lewin Group, Health Indiana Plan 2.0: POWER Account Contribution Assessment (March 31, 2017), https://www.medicaid.gov/Medicaid-CHIP-Program-Information/By-Topics/Waivers/1115/downloads/in/Healthy-Indiana-Plan-2/in-healthy-indiana-plan-support-20-POWER-acct-cont-assesmnt-03312017.pdf. The distribution of the 55% does not add to 100% because individuals may be enrolled in more than one category over the period. ↩︎
- Ibid. ↩︎
- Ibid. ↩︎
- Ibid. ↩︎
- Ibid. State quarterly reports note that data on employers and non-profits with formal arrangements to make premium payments on behalf of enrollees do not include those with informal arrangements such as family or friends. ↩︎
- The waiver requires health plans to conduct active outreach and member education related to tobacco-cessation benefits and provides that the tobacco surcharge will be removed in the following year if a beneficiary informs the state that they have stopped using tobacco. Indiana’s waiver renewal also changes standard premiums from a flat 2% of income to premium tiers, a change that the state requested citing administrative complexity of the original premium structure. ↩︎
- Centers for Disease Control and Prevention, Morbidity and Mortality Weekly Report, State Medicaid Expansion Tobacco Cessation Coverage and Number of Adult Smokers Enrolled in Expansion Coverage – United States, 2016 (Dec. 9, 2016), https://www.cdc.gov/mmwr/volumes/65/wr/mm6548a2.htm. ↩︎