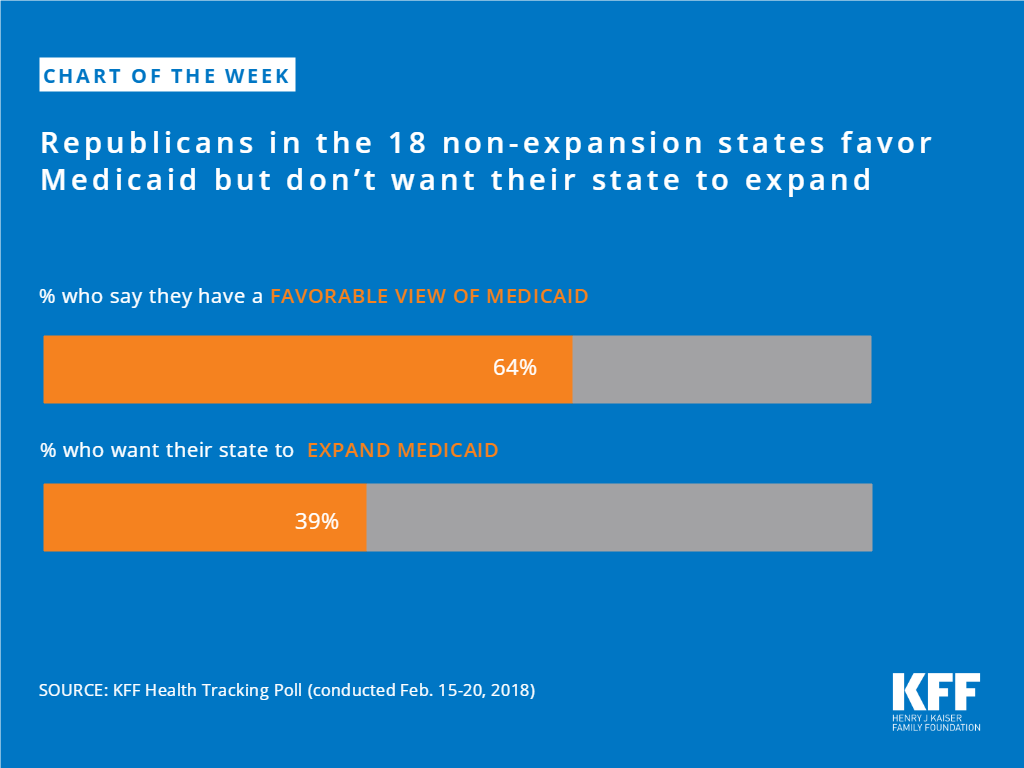
Republicans in the 18 non-expansion states favor Medicaid but don’t want their state to expand
The independent source for health policy research, polling, and news.
Key Takeaways
This 16th annual 50-state survey provides data on Medicaid and the Children’s Health Insurance Program (CHIP) eligibility, enrollment, renewal and cost sharing policies as of January 2018. It shows:
This 16th annual 50-state survey provides data on Medicaid and the Children’s Health Insurance Program (CHIP) eligibility, enrollment, renewal and cost sharing policies as of January 2018. It takes stock of how the programs have evolved as the fifth year of implementation of the Affordable Care Act (ACA) begins, discusses policy changes made during 2017, and looks ahead to issues that may affect state policies moving forward. It is based on a survey of state Medicaid and CHIP officials conducted by the Kaiser Family Foundation and the Georgetown University Center for Children and Families. State data are available in Appendix Tables 1-20.
KFF’s 50-state survey provides comprehensive data on Medicaid and CHIP eligibility, enrollment, renewal, premium, and cost sharing policies for each state as of January 2018.
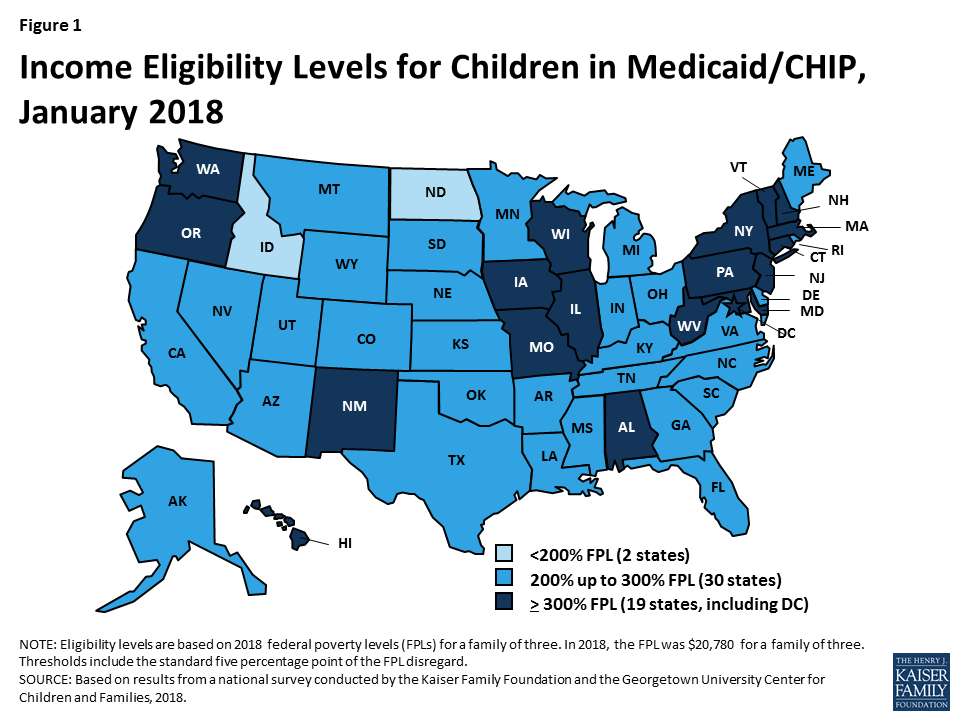
Medicaid and CHIP eligibility for children and pregnant women has remained robust under the ACA. Reflecting expansions prior to the ACA, all but two states cover children with incomes up to at least 200% FPL ($41,560 per year for a family of three in 2018) through Medicaid and CHIP (Figure 1), and 34 states cover pregnant women up to at least 200% FPL. Eligibility levels for children and pregnant women did not change significantly under the ACA. The ACA protected children’s eligibility under its maintenance of effort (MOE) provision, which requires states to maintain eligibility levels for children that are at least as high as those in place when the ACA was enacted in 2010. The recent ten-year extension of CHIP continues the MOE. Under this legislation, the MOE will only apply to children in families with incomes at or below 300% FPL (305% FPL after the five percentage point of income disregard) after October 1, 2019, although states can maintain current higher eligibility levels and receive federal matching funds.
Over time, states have continued to take up options to expand coverage to targeted groups that primarily focus on children and pregnant women. These include options like expanding access to coverage for lawfully residing immigrant children and pregnant women without a five-year waiting period and covering dependents of state employees in CHIP. Many of these options were available to states before the ACA, but states have continued to take up these options since implementing the ACA to increase access to and minimize gaps in coverage.
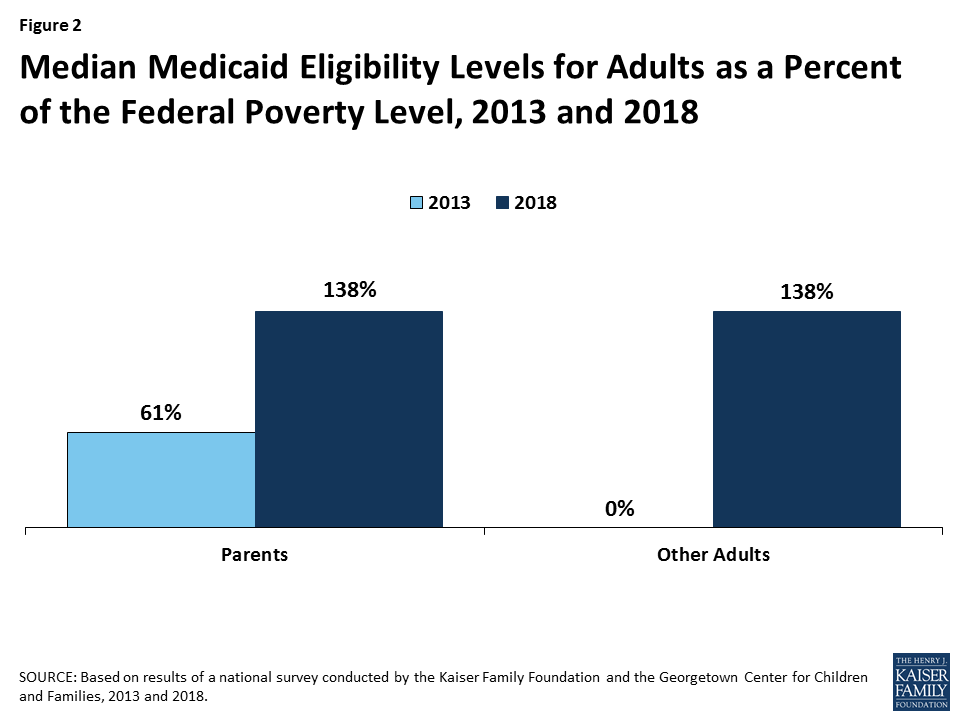
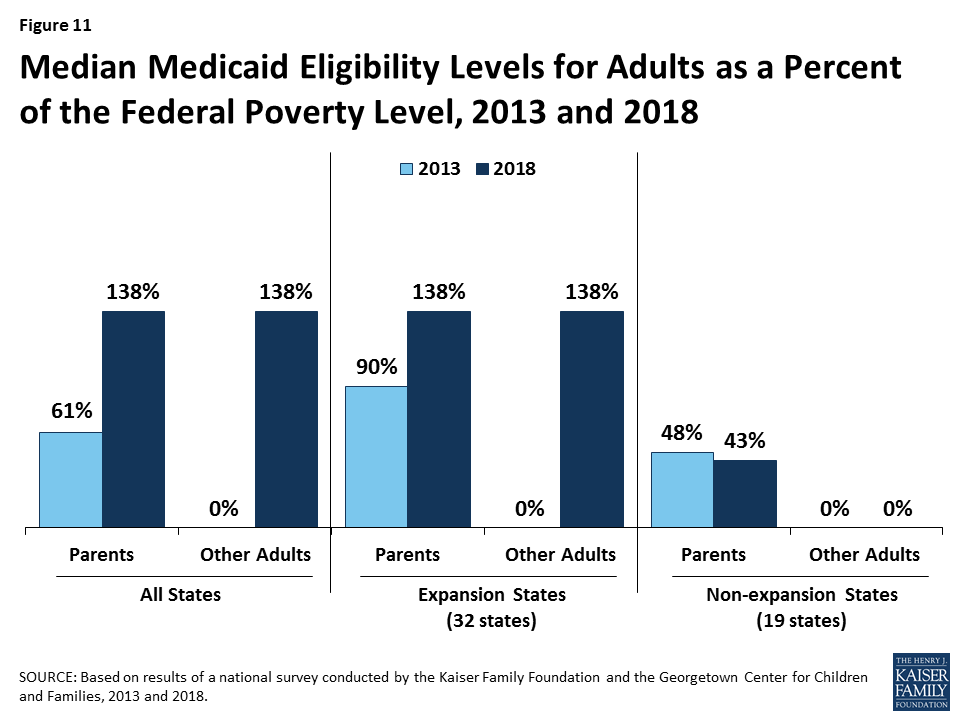
As of January 2018, 32 states have implemented the Medicaid expansion, which significantly increased eligibility for parents and other adults. Under the ACA, the median eligibility level for parents across states increased from 61% FPL ($11,913 per year for a family of three) in 2013 to 138% FPL ($28,676 per year for a family of three) in 2018 (Figure 2). The median eligibility level for other adults increased from 0% FPL ($0 per year for an individual) to 138% FPL ($16,753 per year for an individual) between 2013 and 2018, since adults without dependent children were not eligible for Medicaid under federal rules prior to the ACA.
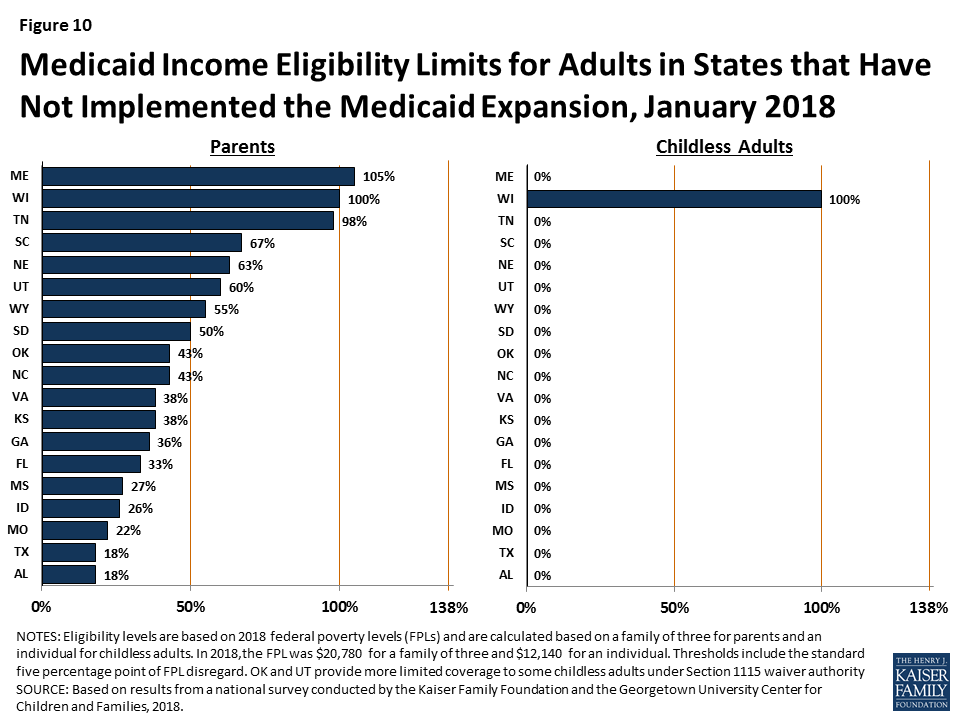
In the 19 states that have not implemented the Medicaid expansion, eligibility for parents and other adults is very limited. In 17 of these states, parent eligibility is limited to less than the poverty level, including 11 states that limit parent eligibility to less than half of poverty, which is just over $10,000 per year for a family of three (Figure 3). Other adults remain ineligible for Medicaid regardless of their income in all of these states, except Wisconsin. In these states, 2.4 million poor adults fall into a coverage gap because they earn too much to qualify for Medicaid but not enough to receive subsidies for Marketplace coverage, which become available at 100% FPL.1

Eligibility remained largely stable during 2017, with a few states making changes. During 2017, Maine adopted the Medicaid expansion through a ballot initiative, but it has not yet been implemented. In addition, Utah increased parent eligibility from 45% FPL to 60% FPL and obtained a waiver that expanded coverage to a limited number of adults without dependent children with incomes below 5% FPL who have behavioral health needs. In contrast, at the direction of the state legislature, Connecticut reduced parent eligibility from 150% FPL to the Medicaid expansion limit of 138% FPL. Outside of these changes, a few states adopted targeted options to expand coverage, while others discontinued use of certain coverage options.
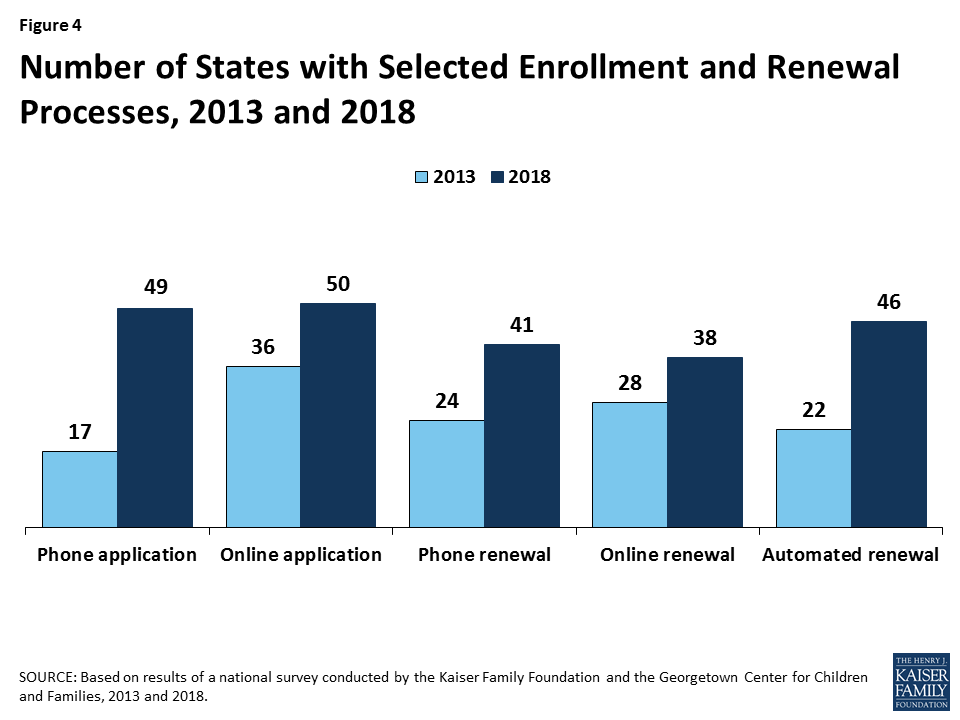
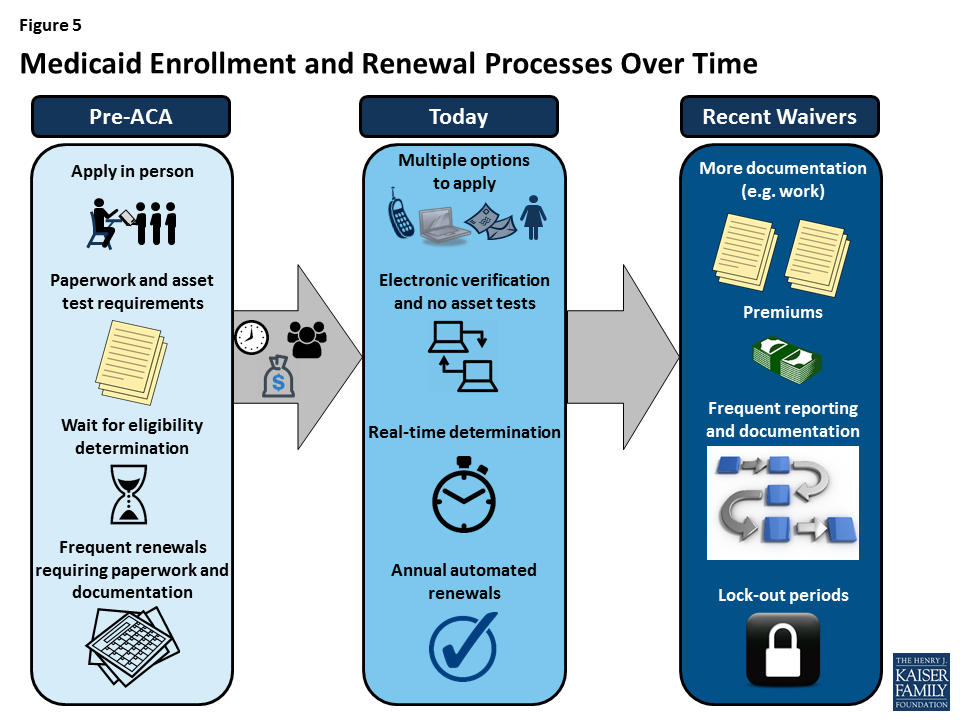
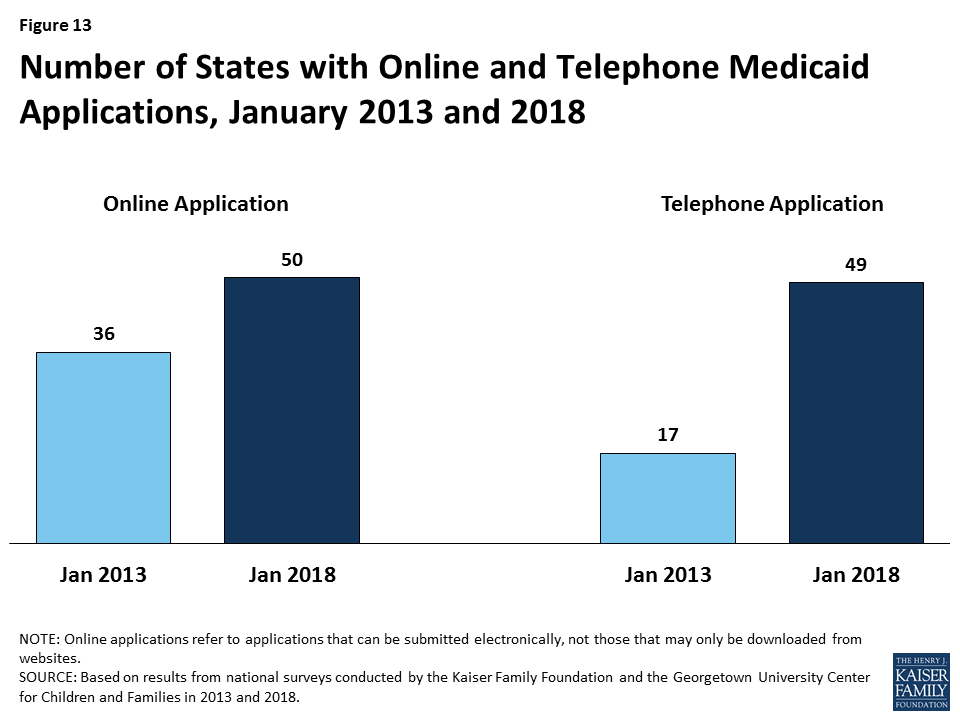
Under the ACA, most states have transformed their Medicaid and CHIP enrollment and renewal processes to provide a modernized, streamlined experience as outlined in the ACA. In addition to expanding Medicaid to low-income adults, the ACA established electronic data-driven, streamlined enrollment and renewal processes for Medicaid and CHIP across all states. The ACA also provided enhanced federal funding to support states in replacing or upgrading their antiquated eligibility systems to implement these new processes. Before the ACA, individuals could not apply for Medicaid by phone or online in many states and typically had to provide documentation like pay stubs and wait weeks for an eligibility determination. Further, they often had to repeat these steps at renewal. Through major investments of time and resources, most states have largely realized the streamlined processes established by the ACA. As of January 2018, individuals can apply for and renew Medicaid online or by phone in nearly every state (Figure 4). In 40 states, individuals can receive a real-time eligibility determination within 24 hours without having to submit pay stubs or documentation when the state can electronically verify information. Nearly all states also are using electronic data matches to renew coverage without the individual having to submit paperwork.
In 2017, some states continued to advance enrollment and renewal processes, but states also focused attention and resources on other priorities. Some states continued to implement simplifications and enhancements to their processes and systems. Several additional states implemented real-time determinations or automated renewals and a few states continued progress to reintegrate Medicaid eligibility determinations for seniors and people with disabilities and non-health programs into their upgraded systems. Many other changes were incremental, such as expanding features of online applications and accounts and increasing the share of applications that receive real-time determinations. This leveling off of continued advancement in part reflects that states have largely achieved improved processes now that they are five years into implementation. However, other policy proposals over the past year, including proposals to repeal the ACA, change the financing and structure of Medicaid, and an extended gap in federal funding for CHIP, may have shifted attention away from the focus on improvements to enrollment and renewal processes.
Premiums and cost sharing remain limited for most Medicaid enrollees. Consistent with previous years, premiums and cost sharing are more prevalent in CHIP, which covers families with incomes above Medicaid eligibility limits. Premiums and cost sharing for most Medicaid enrollees remain limited, reflecting federal requirements designed to ensure enrollees do not face financial barriers to coverage and care. However, through recent waivers, several states have implemented higher premiums than otherwise allowed under federal rules, with some including lockout periods for non-payment of premiums.
Coverage for children and pregnant women will likely remain strong, bolstered by a ten-year extension in federal funding for CHIP. After a four-month lapse in funding, Congress extended federal funding for CHIP for ten years, providing states stable funding to maintain children’s coverage. The legislation also extended the MOE provision that requires states to maintain Medicaid and CHIP eligibility levels for children through 2027. After October 1, 2019, the MOE will only apply to children in families with income at or below 300% FPL (305% FPL after accounting for the five percentage point of income disregard) although states may keep current eligibility at a higher level and receive federal CHIP matching funds. The legislation continues the 23 percentage point enhanced federal match rate for CHIP established by the ACA through 2019, but phases down the match rate to the regular CHIP rate in 2021.
There could be continued gains in eligibility for adults if additional states adopt the Medicaid expansion, but some may add new requirements or restrictions for adults as a condition of expanding coverage. As noted, Maine adopted the Medicaid expansion through a ballot initiative in 2017, although it has not yet been implemented. Additional states may move forward with the expansion over the coming year, which would reduce the number of poor uninsured adults that currently fall into the coverage gap in non-expansion states. States moving forward with expansion may seek waivers to add requirements or restrictions for adults as a condition of expanding.
Proposals to make significant changes to Medicaid’s structure and financing are likely to continue to be debated. While efforts to cap and limit Medicaid financing stalled in 2017, proposals to restructure Medicaid and reduce federal spending are likely to reemerge. The President’s FY2019 budget proposes reductions to Medicaid and some Congressional leaders continue to express interest in reducing spending on entitlement programs, including Medicaid and Medicare. Changes to the financing and structure of Medicaid would have significant implications for the coverage gains achieved for children and adults to date. Moreover, uncertainty around the future of the program could limit state interest in continuing efforts to expand coverage and improve enrollment and renewal processes.
Waivers and other proposed changes require complex documentation and costly administrative processes for adults that run counter to simplified enrollment and renewal processes states have implemented under the ACA. Recently approved and proposed Section 1115 waivers include new restrictions and requirements for adults such as work requirements, premiums, cost sharing, time limits on coverage, drug screening and testing requirements, asset tests, more frequent redeterminations, waivers of reasonable promptness and retroactive eligibility, and lockout periods. In addition, the President’s FY2019 budget proposes to allow states once again to require individuals to meet an asset test and to provide documentation to verify citizenship and immigration status before receipt of Medicaid, although states already must verify citizenship and immigration status under current law. Research and previous state experience shows that such changes would likely create barriers for eligible individuals to obtain and maintain coverage and access needed care. They also will be complex and costly for states to implement.
Taken together, the survey data show that Medicaid and CHIP continue to provide a strong base of coverage for our nation’s low-income children and pregnant women. There have been significant gains in eligibility for parents and other adults under the ACA Medicaid expansion, but gaps in coverage remain in states that have not implemented the expansion. Through major investments of time and resources, states have largely realized modernized, streamlined enrollment and renewal processes as outlined in the ACA, which have created a more consumer-friendly experience for individuals and reduced administrative burdens for states. Looking ahead, coverage for children and pregnant women will remain strong, bolstered by a ten-year extension in federal funding for CHIP. Opportunity remains for states to expand eligibility for parents and other adults by implementing the Medicaid expansion. States may continue to refine and enhance enrollment and renewal processes, but some states are seeking to include new requirements and restrictions for adults that require complex documentation and administrative processes, which would likely create barriers for eligible individuals to obtain and maintain coverage and access needed care.
This 16th annual 50-state survey provides data on Medicaid and the Children’s Health Insurance Program (CHIP) eligibility, enrollment, renewal and cost sharing policies as of January 2018. It takes stock of how the programs have evolved as we enter into the fifth year of implementation of the ACA, discusses policy changes made during 2017, and looks ahead to issues that may affect state policies moving forward.
The report is based on a telephone survey of state Medicaid and CHIP program officials conducted by the Kaiser Family Foundation and the Georgetown University Center for Children and Families during January 2018. It includes findings in three key areas: Medicaid and CHIP Eligibility, Enrollment and Renewal Processes, and Premiums and Cost Sharing. State-specific information is available in Appendix Tables 1-20. The report includes policies for children, pregnant women, parents, and other adults under age 65; it does not include policies for groups covered through Medicaid eligibility pathways for seniors and individuals with disabilities.
As of January 2018, 49 states cover children with incomes up to at least 200% FPL ($41,560 per year for a family of three in 2018) through Medicaid and CHIP, including 19 states that cover children with incomes at or above 300% FPL ($62,340 per year for a family of three in 2018) (Figure 6). Only two states (Idaho and North Dakota) limit children’s Medicaid and CHIP eligibility to lower incomes. The median income eligibility limit for children is 255% FPL ($52,989 per year for a family of three in 2018). Across states, the upper Medicaid/CHIP eligibility limit for children ranges from 175% FPL in North Dakota to 405% FPL in New York. Children’s eligibility levels remained stable under the ACA, reflecting its maintenance of effort (MOE) provision that requires states to maintain eligibility levels for children that are at least as high as those in place when the ACA was enacted in 2010. The recent ten-year extension of CHIP continues the MOE. Beginning after October 1, 2019, the MOE will only apply to children in families with incomes at or below 300% FPL (305% FPL after the five percentage point of income disregard), although states can maintain current eligibility above that level and receive federal CHIP matching funds.

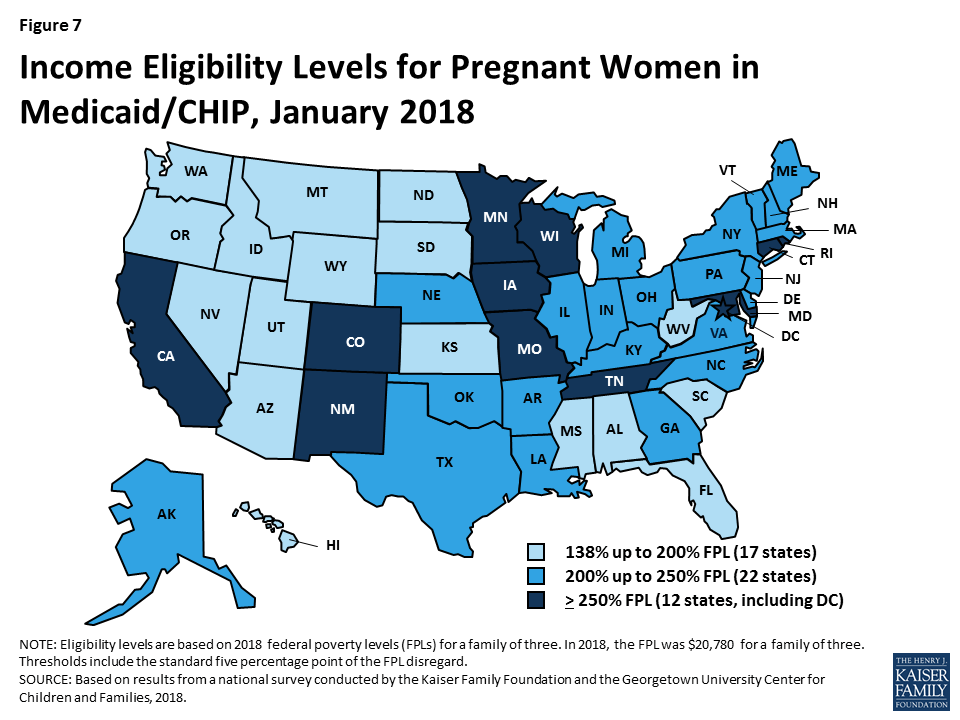
All states cover pregnant women with incomes up to at least 138% FPL ($28,676 per year for a family of three in 2018), and 34 states cover pregnant women with incomes at or above 200% FPL ($41,560 per year for a family of three in 2018) as of January 2018 (Figure 7). Across states, eligibility for pregnant women ranges from 138% FPL in Idaho and South Dakota to 380% FPL in Iowa. These eligibility levels reflect extensions in coverage through CHIP in five states (Colorado, Missouri, New Jersey, Rhode Island, and Virginia). Similar to eligibility levels for children, eligibility for pregnant women remained largely stable across states under the ACA.
As of January 2018, 32 states cover parents and other adults with incomes up to at least 138% FPL ($28,676 per year for a family of three and $16,753 per year for an individual in 2018) under the ACA Medicaid expansion to low-income adults (Figures 8 and 9). The District of Columbia extends eligibility beyond the expansion limit to parents with incomes up to 221% FPL and other adults with incomes up to 215% FPL, and Alaska covers parents with incomes up to 139% FPL. In addition, Minnesota and New York use the ACA Basic Health Program option to cover adults with incomes between 138% and 200% FPL, rather than having individuals in this income range access coverage through the Marketplace.
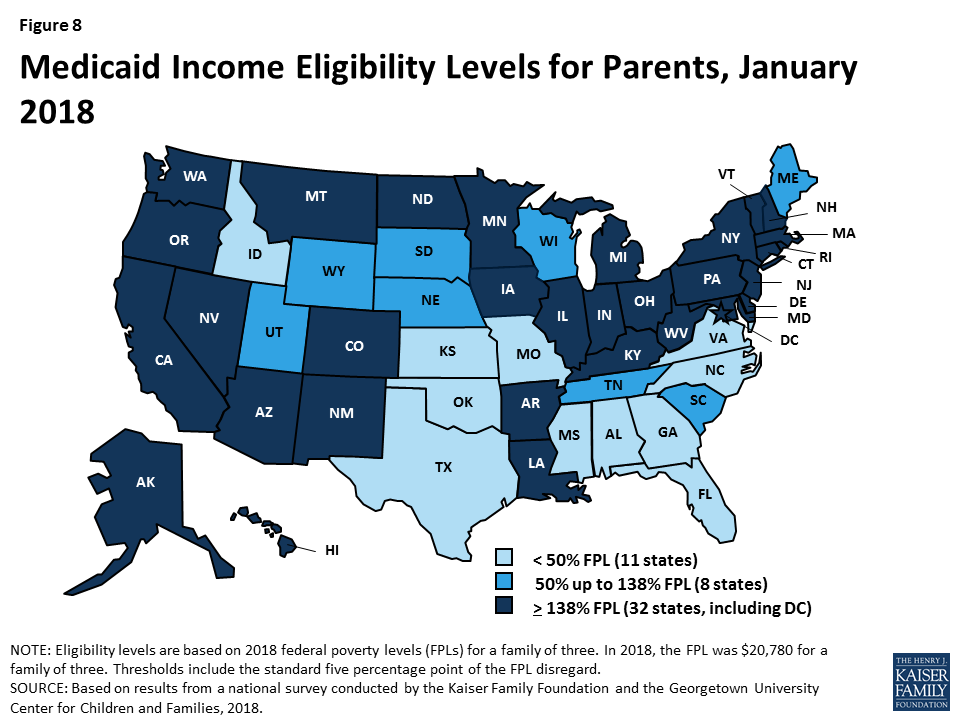
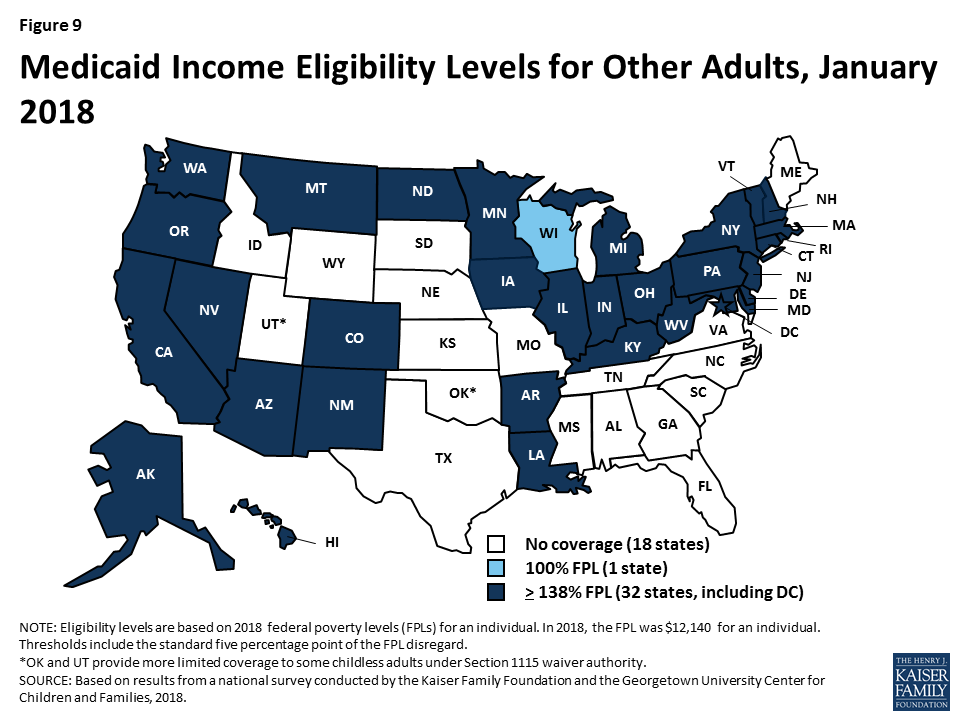
In the 19 states that have not expanded Medicaid, parent eligibility is limited to those with very low incomes and other adults generally remain ineligible, leaving many in a coverage gap. Among non-expansion states, the median eligibility level for parents is 43% FPL ($8,935 per year for a family of three in 2018), and other adults remain ineligible for Medicaid regardless of income, except in Wisconsin. Only Maine and Wisconsin cover parents at or above 100% FPL ($20,780 per year for a family of three in 2018), while 11 states limit parent eligibility to less than half the poverty level (Figure 10). Alabama and Texas have the lowest parent eligibility levels at 18% FPL or $3,740 per year for a family of three in 2018. Given these limited eligibility levels, 2.4 million poor adults fall into a coverage gap in non-expansion states.2 These adults earn too much to qualify for Medicaid but not enough to qualify for subsidies for Marketplace coverage, which become available at 100% FPL.
Eligibility for parents and other adults has significantly increased compared to before the ACA, and the disparity in eligibility for adults in expansion and non-expansion states widened. Prior to the ACA, 34 states limited parent eligibility to less than 100% FPL, including 16 states that had eligibility limits below half of poverty. Moreover, before the ACA, states could not cover other low-income adults with federal Medicaid funds; as such, they generally were not eligible except in some states that obtained waivers. The ACA Medicaid expansion significantly increased eligibility for both parents and other adults. Across states, the median eligibility level for parents increased from 61% FPL ($11,913 per year for a family of three) in 2013 to 138% FPL ($28,676 per year for a family of three) in 2018 (Figure 11). Median eligibility increased from 0% to 138% FPL ($0 to $16,753 per year for an individual) for other adults. States that implemented the Medicaid expansion began with broader eligibility for adults compared to non-expansion states before the ACA. As of 2013, expansion states had a median parent eligibility level of 90% versus 48% in non-expansion states. This gap widened with the expansion.
Eligibility levels remained largely stable during 2017. During 2017, Maine adopted the Medicaid expansion through a ballot initiative, but it has not yet been implemented. . In addition, Utah increased parent eligibility from 45% FPL to 60% FPL and obtained a waiver that expanded coverage to a limited number of adults without dependent children with incomes below 5% FPL who have behavioral health needs.3 In contrast, at the direction of the state legislature, Connecticut reduced parent eligibility from 150% FPL to the Medicaid expansion limit of 138% FPL. Outside of these changes, eligibility levels for parents, adults, children, and pregnant women remained stable.
Over time, states have continued to take up options to expand coverage to targeted groups that primarily focus on children and pregnant women. Many of these options were available to states before the ACA, but states have continued to adopt them since implementing the ACA to minimize gaps in and increase access to coverage.
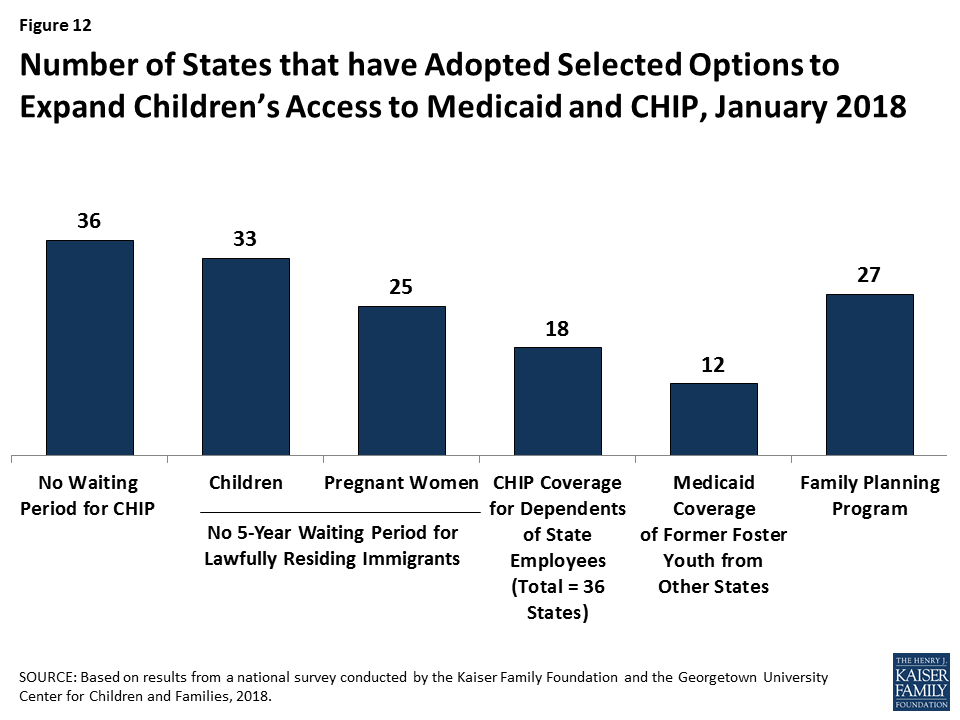
During 2017, a few states continued to adopt targeted options to expand coverage while others discontinued use of certain coverage options. For example, Arkansas and South Carolina took up the option to eliminate the five-year waiting period for lawfully residing immigrant children and pregnant women, Maine began covering dependents of state employees in CHIP, Delaware added coverage for former foster children from other states, and Georgia increased eligibility for its family planning program from 205% FPL to 216% FPL. In contrast, several states phased out coverage of former foster youth from other states (Louisiana, Montana, and New York). Iowa ended its Medicaid family planning program, but is now covering family planning services with state-only funds.
In addition to expanding Medicaid to reach many previously ineligible low-income adults, the ACA established streamlined, modernized enrollment and renewal processes for low-income children and adults across all states (Box 1). The policies and practices standardized by the ACA drew on previous innovations some states pursued that proved effective and efficient for enrolling and retaining eligible children in coverage. Many states needed to make major upgrades to or replace antiquated eligibility systems to implement these new processes. The federal government supported the development of these systems by providing 90% federal match for their development and by only requiring non-health programs to pay the incremental add-on costs to be integrated into the updated Medicaid eligibility systems.
Box 1: Key Medicaid and CHIP Enrollment and Renewal Policies Established Under the ACA
Since the ACA was enacted, states have invested significant time and resources to upgrade or build new eligibility systems and re-engineer their business processes. As outlined in the findings below, with these efforts, the Medicaid enrollment and renewal experience has moved from a paper-based, manual process that could take days and weeks in some states to a modernized, technology-driven approach that can happen in real-time through electronic data matches to verify eligibility criteria. States use these same methods to automate the renewals without requiring enrollees to complete forms or submit paperwork when they can verify information through electronic data matches. Five years into implementation, leading states are now using automated processes to verify and renew eligibility for a majority of applicants and enrollees.
In 2017, states continued to advance enrollment and renewal processes but also focused attention and resources on other priorities. Some states continued to implement simplifications and enhancements to their processes and systems. Several additional states implemented real-time determinations or automated renewals and a few states reintegrated eligibility determinations for seniors and people with disabilities and non-health programs into their upgraded systems. Many other changes were incremental, such as expanding features of online applications and accounts and increasing the share of applications that receive real-time determinations. This leveling off of continued advancement in part reflects that states have largely achieved improved processes now that they are five years into implementation. However, other policy proposals over the past year, including proposals to repeal the ACA, change the financing and structure of Medicaid, and an extended gap in federal funding for CHIP, may have shifted attention away from the focus on improvements to enrollment and renewal processes.
Individuals can apply for Medicaid online and by phone in nearly all states as of January 2018. To facilitate access to coverage, under the ACA, states must provide multiple application methods for individuals, including online, by phone, by mail, and in person. Prior to the ACA, some states had made progress offering online applications for Medicaid, but only 36 states had online applications that could be completed using an electronic signature, and less than a third of states (17) allowed applicants to apply over the phone (Figure 13). As of January 2018, Tennessee is the only state without an electronic application and telephone applications are available in 49 states.
In some states, online applications have become the predominant mode of application for individuals, but use of the online application varies across states and other application modes remain important. At least 50% of Medicaid applications are submitted online in 20 of the 39 states that were able to report the share of applications received online. However, in other states, online applications account for just a small share of applications. Telephone applications represent a smaller share of applications, less than 25% in most of the states able to report these data. As such, other application modes, including in person and mail, remain important, particularly for individuals who lack access to high speed internet or who feel more comfortable applying in-person.
States have expanded consumer friendly features of online applications over time. In all 50 states with an online application, applicants can start, stop, and return to finish the application at a later time (Figure 14). In addition, states have increasingly added the ability for individuals to upload electronic copies of documentation with their application if needed. Between 2013 and 2018, the number of states with this functionality grew from 15 to 34, including Utah, which added this option in 2017.
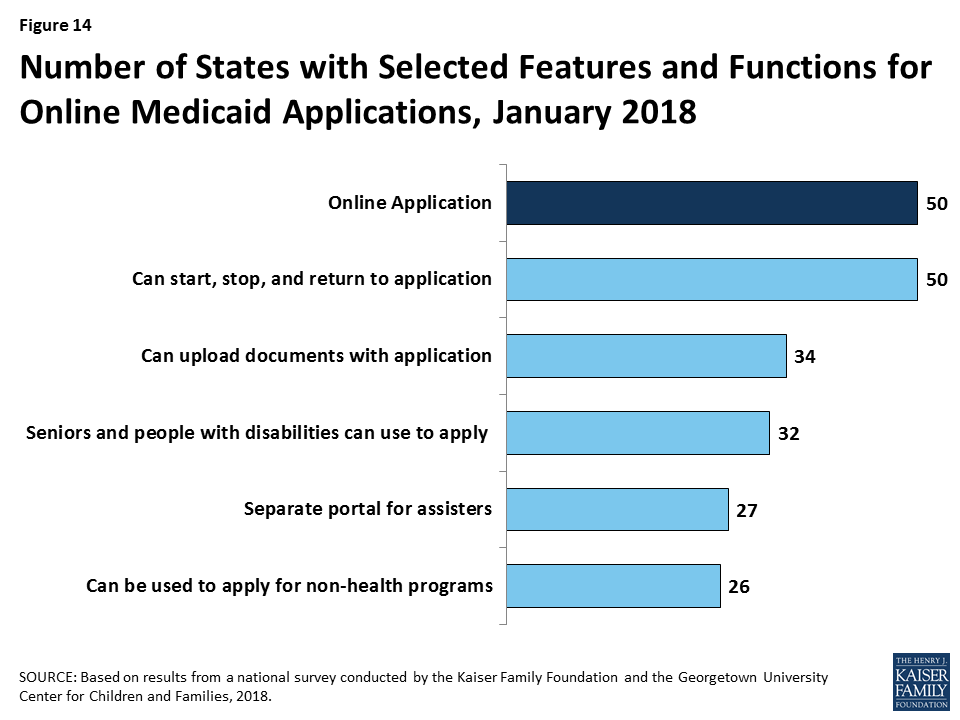
The number of states offering a multi-benefit online application is growing, but individuals still must complete separate applications for Medicaid and non-health programs in about half of states. As of January 2018, 32 states offer an online application for all Medicaid groups, including seniors and people with disabilities. Individuals can also apply for a non-health program, such as SNAP or TANF, using the online application in more than half of the states. These counts include Ohio, which added a multi-benefit application that incorporates SNAP and TANF, and New Jersey, which added seniors and individuals with disabilities to its Medicaid application for low-income children and adults during 2017.
Just over half of the states (27) have a web portal or secure login that enables consumer assisters to submit applications on behalf of consumers they help. In 2017, Utah added a portal for consumer assisters. This functionality helps states track, monitor, and report the work of assisters. In some states, these portals have additional functions or features that support the work of assisters, such as the ability to check a renewal date. Providing assisters with more tools may help reduce workloads on state administrative staff, for example, if assisters are able to update addresses and other information.
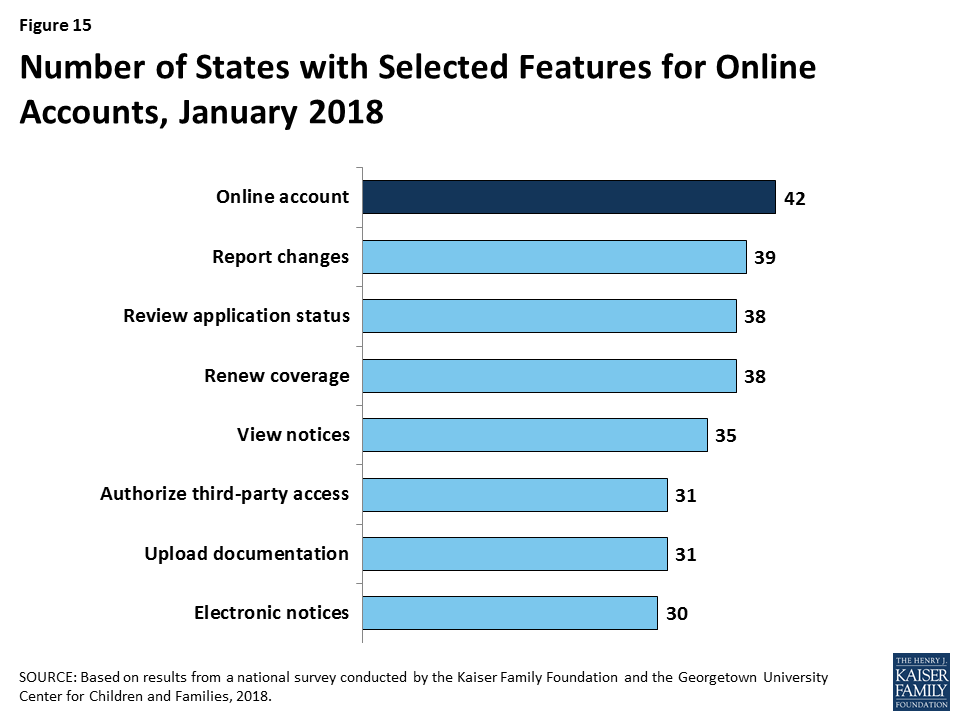
Many states provide online accounts for enrollees to manage their Medicaid coverage, and states have expanded the features and functions of these accounts over time. Online accounts create administrative efficiencies by reducing mailing costs, call volume, and manual processing of updates such as an address change. They also provide enrollees increased autonomy to manage and monitor their coverage. Between 2013 and 2018, the number of states providing online accounts grew from 36 to 42. As of January 2018, these online accounts offer a wide array of functions (Figure 15). Although many states have made online accounts available to enrollees, it is unclear what share of enrollees use these accounts on a regular basis.
In more than half of states, individuals can access online applications and accounts through mobile devices, but many of the applications and accounts do not have mobile-friendly formatting. As of January 2018, individuals in 31 states can complete and submit the online Medicaid application through a mobile device. Eleven of these states have designed a mobile-friendly version of the application and/or developed a mobile “app” for individuals to apply through a mobile device. Similarly, in 30 of the 42 states with online accounts, enrollees can access their account through a mobile device. In 14 of these states there is a mobile-friendly version of the account and/or the state has created an “app.” A number of states indicate that they plan to enhance mobile access to online applications and accounts in the future.
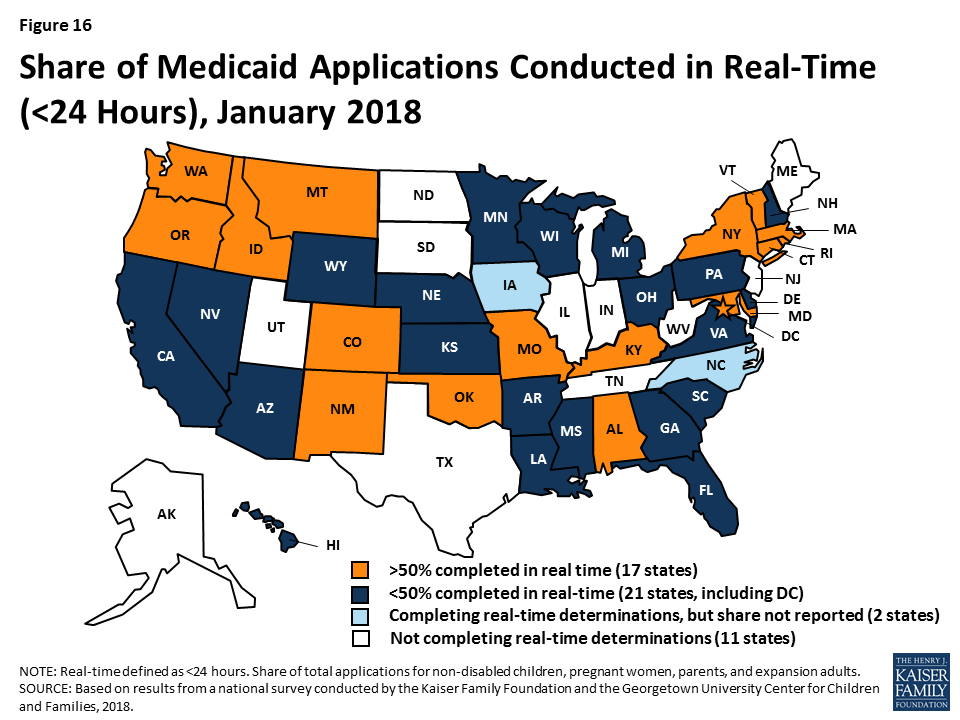
As of January 2018, 40 states are able to make real-time Medicaid eligibility determinations (defined as within 24 hours). This count reflects the addition of Georgia, which began determining eligibility in real-time in 2017. Prior to the ACA, states could verify some information electronically, like Social Security information or dates of birth, but for other aspects of eligibility, particularly income, eligibility workers often had to review paper documents like pay stubs or manually look up information in other data sources. This process often resulted in backlogs of applications, follow-up requests for information, and delays associated with matching up applications with verification documents. Today’s upgraded eligibility systems are able to check against other electronic data sources in real-time or overnight, providing timely eligibility decisions and reducing burdens for both individuals and staff. As state systems and processes have matured, they are able to process an increasing share of applications in real time. As of January 2018, at least 50% of applications receive a real-time determination in 17 of the 38 states that complete real-time determinations and were able to report this data (Figure 16), up from 15 in 2017. This count includes 11 states that report over 75% of applications receive a real-time decision, up from nine states in 2017.
When making Medicaid and CHIP eligibility determinations, all states verify citizenship or qualified immigration status of applicants, as well as income. States must verify citizenship or qualified immigration status for individuals prior to enrollment, although individuals who attest to a qualified status must be given a reasonable amount of time to provide documentation if eligibility cannot be confirmed electronically. States also must verify income. Nearly all states (44 states) verify income prior to enrollment, while seven states complete the verification after enrollment. Verification policies for other eligibility criteria, such as age/date of birth, state residency, and household size, vary across states, reflecting state options to confirm this information before or after enrollment or to accept self-attestation of information. If a state has any data that conflicts with the self-attestation, it must validate the information.
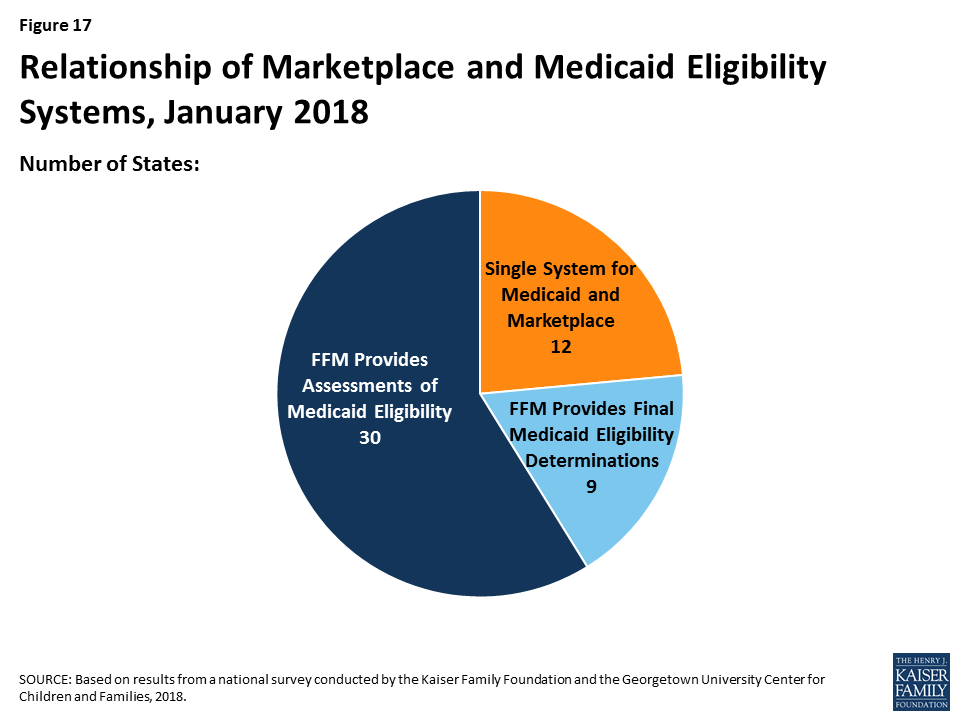
Reflecting ACA provisions for states to coordinate coverage across insurance affordability programs, all states have their Medicaid eligibility system integrated with or connected to CHIP and Marketplace systems. Prior to the ACA, half of states with separate CHIP programs (16 of 38) had separate eligibility systems for Medicaid and CHIP. As of January 2018, nearly all (34 of the 36) states with a separate CHIP program use a single system for Medicaid and CHIP. States’ integration and coordination with Marketplace systems varies reflecting differences in Marketplace structure (Figure 17). Most states with State-based Marketplaces (SBMs) (12 of 17) use the same system for Medicaid and Marketplace coverage. The other five SBM states rely on the Federally-Facilitated Marketplace’s (FFM’s) technology platform (Healthcare.gov) for Marketplace coverage, as do the remaining 34 FFM states. States using Healthcare.gov must electronically transfer data with the FFM to coordinate Medicaid and Marketplace coverage. Nine of these states have authorized the FFM to make final Medicaid eligibility determinations and enroll individuals in Medicaid immediately after receiving data from the FFM. In the other 30 states, the FFM preliminarily assesses Medicaid or CHIP eligibility and then the state may check state data sources or request additional documentation before completing the eligibility determination. When the ACA was first implemented, there were significant problems with account transfers that contributed to delays in Medicaid or CHIP enrollment. As of January 2018, only two states report ongoing, regular delays or difficulties with transfers.
States are reintegrating Medicaid eligibility determinations for seniors and people with disabilities and non-health programs into their upgraded systems, but Medicaid eligibility remains separate from non-health programs in more than half of states, limiting the ability to coordinate services across programs. Given the complexity and resources associated with updating eligibility systems and processes, when states first implemented new systems and policies, many focused on groups directly affected by the ACA changes, including children, pregnant women, parents, and expansion adults. As such, when states rolled out new systems, most continued to process determinations for seniors and people with disabilities and non-health programs through their old systems. Therefore, Medicaid eligibility determinations were separated from non-health programs in many states. As new systems have matured, a growing number of states have reintegrated determinations for individuals with disabilities and seniors and non-health programs into their upgraded systems (Figure 18). As of January 2018, 30 states use one system to determine eligibility for all Medicaid groups, including New Jersey, which integrated seniors and people with disabilities into its system in 2017. In 23 states, the Medicaid system includes at least one non-health program, including Kansas and Ohio, which added some non-health programs in 2017. However, in more than half of states, Medicaid eligibility remains separate from non-health programs, limiting the ability to coordinate services for individuals across programs.

Some states have taken up the option to provide presumptive eligibility, which can help facilitate access to coverage for individuals who cannot have their eligibility verified in real-time. Presumptive eligibility is a longstanding option in Medicaid and CHIP that allows states to authorize qualified entities—such as community health centers or schools—to make a temporary eligibility determination to expedite access to care for children and pregnant women while the full application is processed. The ACA broadened the use of presumptive eligibility in two ways. First, it allowed states that provide presumptive eligibility for children or pregnant women to extend the option to parents, adults, or other groups. Second, the ACA gave hospitals nationwide the authority to determine eligibility presumptively for all non-disabled individuals under age 65. Use of presumptive eligibility for children and pregnant women has remained largely stable under the ACA. As of January 2018, 20 states use the option for children and 30 states use it for pregnant women. A total of 15 states are utilizing the new option provided by the ACA to expand presumptive eligibility to other groups, including parents and other adults.
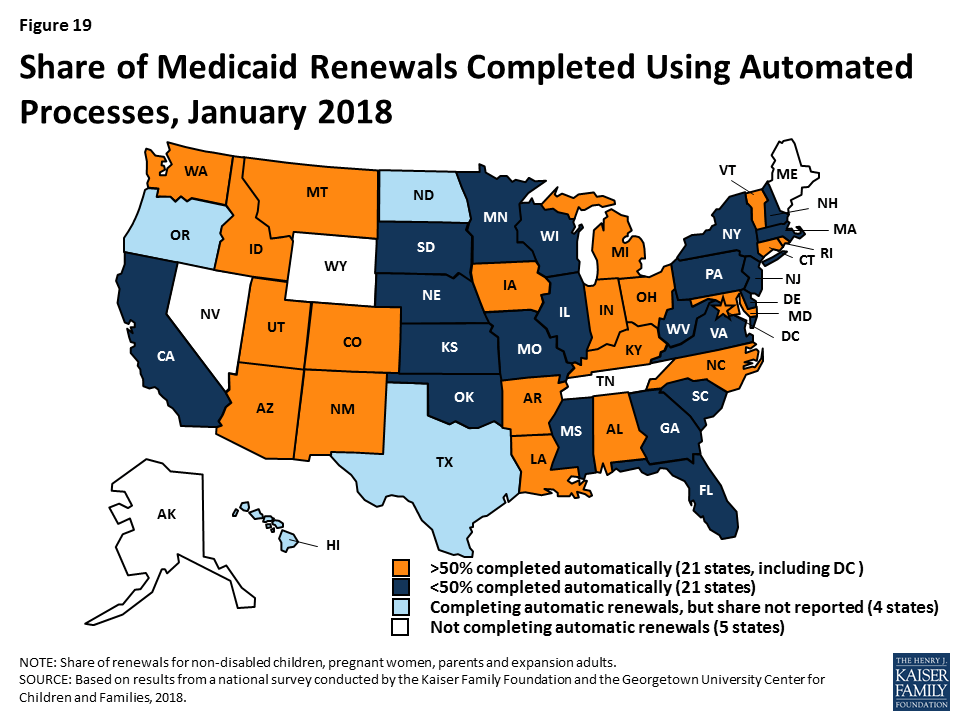
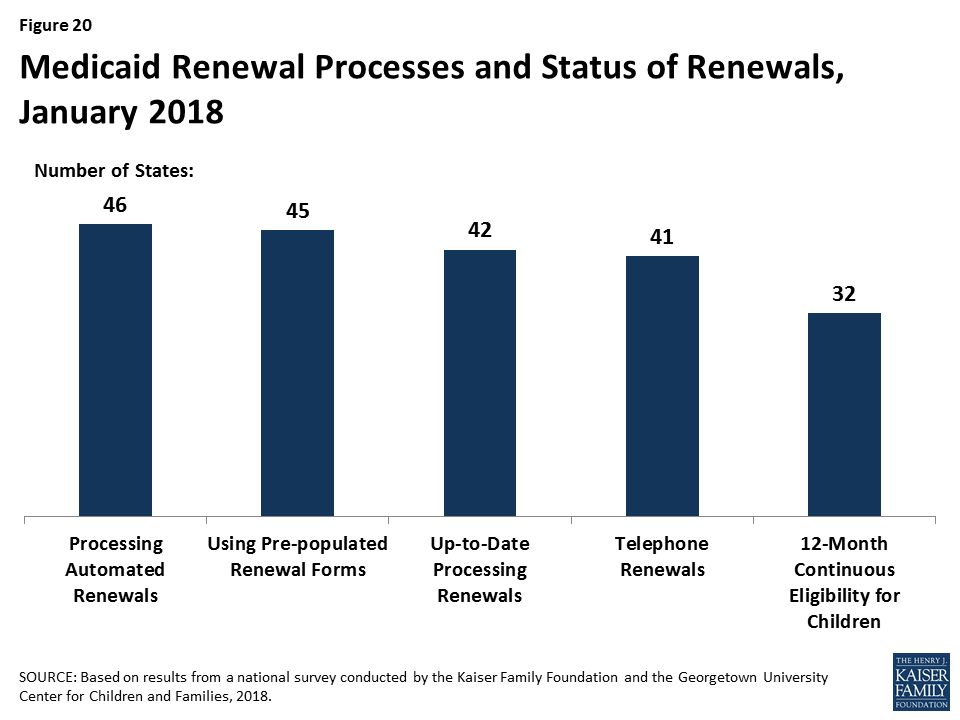
As of January 2018, 46 states use electronic data matches to automatically renew coverage in Medicaid and CHIP without requiring enrollees to submit paperwork. This reflects the implementation of automated renewals in four states (Illinois, Iowa, Oregon, and Wisconsin) during 2017. Similar to data-driven enrollment under the ACA, states are using electronic data matches to renew coverage when possible without requiring an individual to fill out a renewal form or provide documentation. This approach minimizes paperwork for individuals and reduces workloads for states. As of January 2018, among the 42 states completing automated renewals and able to report the share of renewals completed through automatic processes, 21 states reported that more than 50% of renewals are completed automatically, up from 19 in 2017 (Figure 19). This includes seven states that complete more than 75% of renewals automatically. Continued state progress in conducting automated renewals has enabled states to largely resolve backlogs or delays in renewals.
Forty-five states use prepopulated forms to facilitate renewal when a state is not able to complete an automatic renewal through electronic data sources (Figure 20). In 14 states, the state populates the form with updated sources of data from electronic data matches. In cases where the automatic renewal process is unable to affirm ongoing eligibility, 41 states allow individuals to renew by phone, compared to 24 states that offered telephone renewals in 2013.
More than half of states have taken up the option to support stable coverage for children by providing 12-month continuous eligibility. Since prior to the ACA, states have had an option to provide 12-month continuous eligibility for children. Continuous eligibility promotes retention and reduces “churn” – that is, individuals moving on and off coverage due to small income changes, which can be administratively costly and result in gaps in health care access. Many quality measures require at least 12 months of continuous enrollment, so the policy also enhances states’ ability to assess quality of care. As of January 2018, 32 states provide 12-month continuous eligibility to children. In addition, Montana and New York offer 12-month continuous eligibility to parents and other adults under Section 1115 waiver authority.
Given that Medicaid and CHIP enrollees have limited ability to pay out-of-pocket costs due to their modest incomes, federal rules establish parameters for premiums and cost sharing for Medicaid and CHIP enrollees (Box 2). Some states charge higher premiums for adults than otherwise allowed under federal rules through waivers, and additional states have proposed waivers to charge higher premiums and/or cost sharing.
Box 2: Medicaid and CHIP Premium and Cost Sharing Rules
Premiums in Medicaid. States may charge premiums for children and adults with incomes above 150% FPL. Medicaid enrollees with incomes below 150% FPL may not be charged premiums.
Cost Sharing in Medicaid. States may charge cost sharing for adults in Medicaid, but allowable charges vary by income (Table 1). Cost sharing cannot be charged for emergency, family planning, pregnancy-related services in Medicaid, preventive services for children, or for preventive services in Alternative Benefit Plans in Medicaid, which have been defined as essential health benefits. In addition, children with incomes below 133% FPL generally cannot be charged cost sharing.
Limit on Out-of-Pocket Costs. Overall, premium and cost sharing amounts for family members enrolled in Medicaid may not exceed 5% of household income.
Premiums and Cost Sharing in CHIP. States have somewhat greater flexibility to charge premiums and cost sharing for children covered by CHIP, although there remain limits on the amounts that can be charged, including an overall cap of 5% of household income.
| Table 1: Allowable Cost Sharing Amounts for Adults in Medicaid by Income | |||
| <100% FPL | 100% – 150% FPL | >150% FPL | |
| Outpatient Services | up to $4 | up to 10% of state cost | up to 20% of state cost |
| Non-Emergency use of ER | up to $8 | up to $8 | No limit |
| Prescription Drugs | Preferred: up to $4Non-Preferred: up to $8 | Preferred: up to $4Non-Preferred: up to $8 | Preferred: up to $4Non-Preferred: up to 20% of state cost |
| Inpatient Services | up to $75 per stay | up to 10% of state cost | up to 20% of state cost |
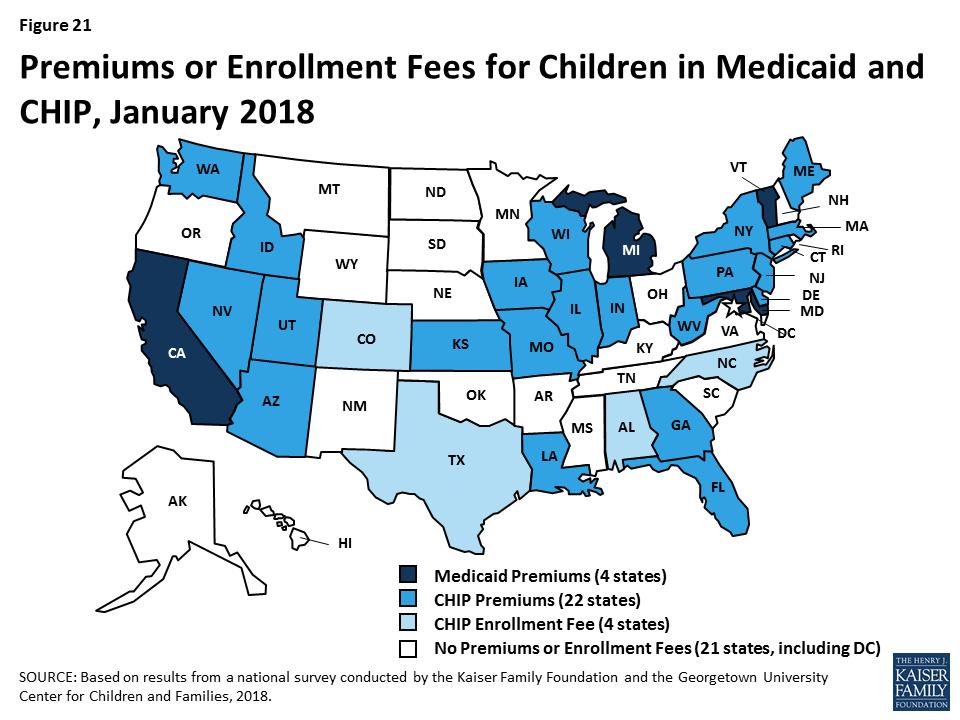
Some states have eliminated premiums for children since implementing the ACA, and the ACA protected children from premium increases. Prior to the ACA in 2013, five states charged premiums or enrollment fees for children in Medicaid, and 30 of 38 states with separate CHIP programs charged premiums or enrollment fees. Under the ACA, states were required to move older children with incomes between 100%-138% FPL from CHIP to Medicaid, which does not allow premiums for children below 150% FPL. In eight states, children were no longer charged premiums due to this transition. The ACA MOE also protected children from new premiums or premium increases.5 Between 2013 and 2018, Minnesota and Rhode Island eliminated premiums for children in Medicaid, and Oregon eliminated premiums in CHIP. California, Michigan, and Vermont eliminated their separate CHIP programs and moved all children from CHIP to Medicaid, although they still charge premiums in Medicaid for higher-income children. Reflecting these changes, as of January 2018, four states charge premiums or enrollment fees for children in Medicaid, and 26 of 36 states with separate CHIP programs charge premiums or enrollment fees (Figure 21). Premiums begin for children with incomes between 133% and 150% in eight states, and for children with incomes at or above 150% FPL in 22 states. Of the total, 30 states that charge premiums or enrollment fees for children in Medicaid and/or CHIP, 11 states charge premiums or fees that are family-based and 14 other states have a family maximum amount.
The ACA limited lockout periods in CHIP to minimize gaps in coverage for children. In Medicaid, states must provide enrollees a minimum 60-day grace period before cancelling coverage for non-payment of premiums, and states cannot delay re-enrollment or require enrollees to repay outstanding premiums as a condition of reenrollment. In contrast, CHIP programs must provide a minimum 30-day grace period and may impose a “lockout period” during which a child who has been disenrolled is not allowed to reenroll. Prior to the ACA, CHIP lockout periods ranged from one to six months in the 12 states that imposed them. The ACA limited lockout periods to no more than 90 days; 15 states have a lock out period in CHIP as of January 2018.
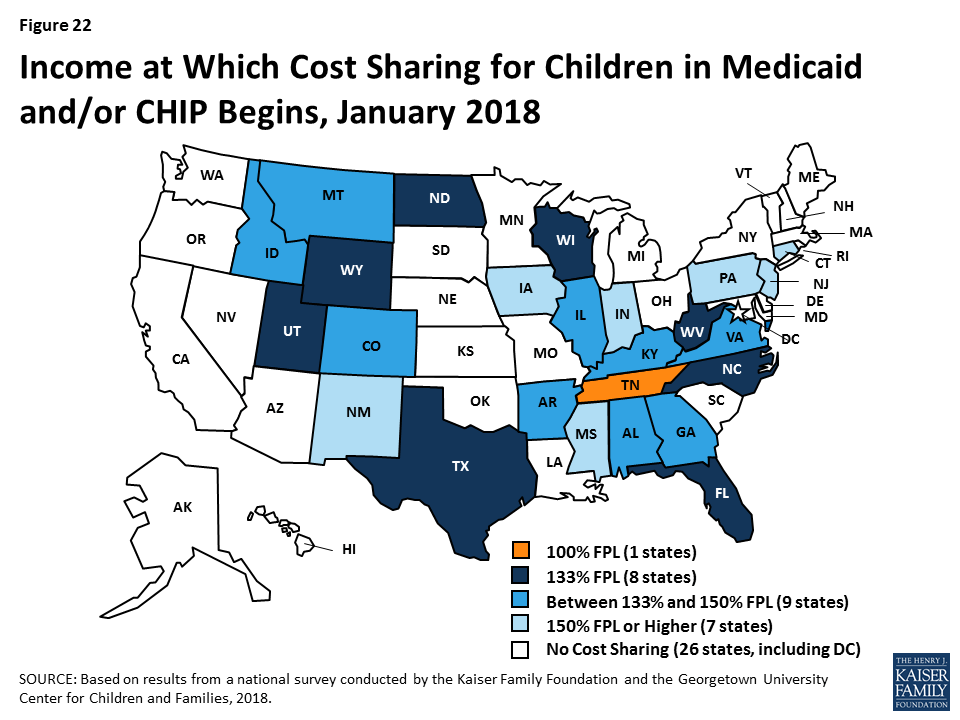
Cost sharing for children remains more prevalent in CHIP compared to Medicaid. Between 2013 and 2018, four states (California, Delaware, Louisiana and Oregon) eliminated copayments for children. As of 2018, three states charge cost sharing for children in Medicaid, and 24 of the 36 states with separate CHIP programs charge cost sharing. In eight states, cost sharing begins at the federal minimum level of 133% FPL, while 16 states begin cost sharing at a higher income (Figure 22). Tennessee has a longstanding waiver that allows it to begin cost sharing at 100% FPL. The number of states charging cost sharing varies by income and service.
Most states do not charge premiums for parents and other adults, but some states charge higher premiums than otherwise allowed under federal rules through waivers. In most states, eligibility levels for parents and other adults are below the levels at which states can charge premiums or cost sharing. However, as of January 2018, five states (Arkansas, Indiana, Iowa, Michigan, and Montana) charged premiums or monthly contributions that are not otherwise allowed under federal rules through waivers.
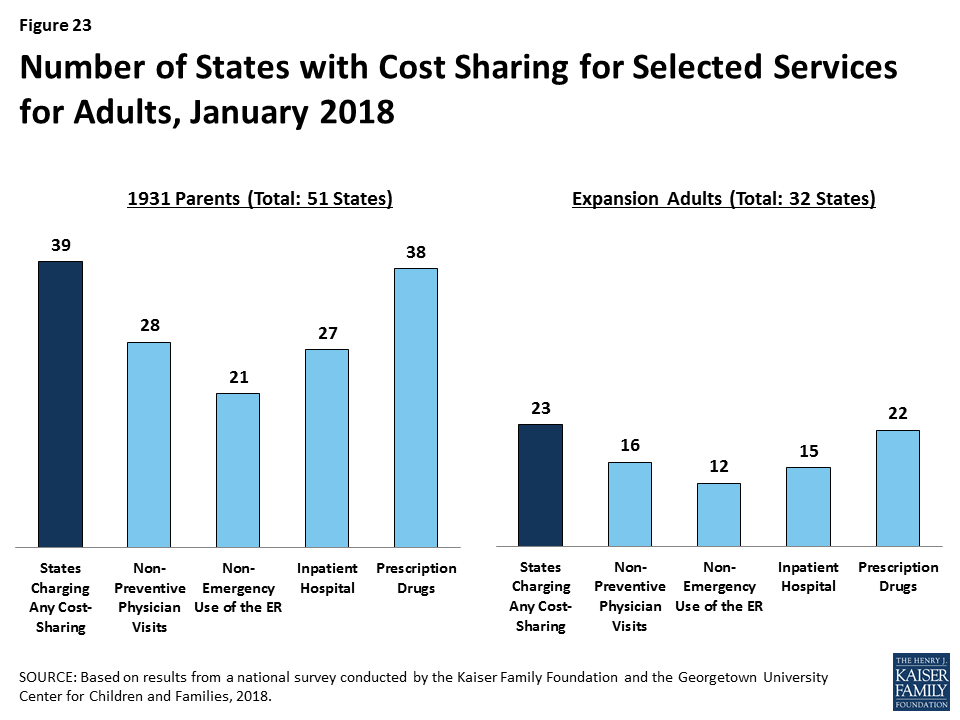
Most states charge cost sharing for parents and other adults in Medicaid. A total of 39 states charge cost sharing for parents and 22 of the 32 Medicaid expansion states charge cost sharing for expansion adults (Figure 23). Most cost sharing amounts remain nominal consistent with federal law. Indiana had received waiver approval to charge a higher copayment for non-emergent use of the emergency room, which was in place as of January 2018. However, the state subsequently removed this copayment when it renewed its waiver. As noted below, other states are seeking to charge higher copayments through waivers.
Coverage for children and pregnant women will likely remain strong, bolstered by a ten-year extension in federal funding for CHIP. At the end of September 2017, federal funding for CHIP ended beginning a four-month lapse in federal funding before Congress passed legislation that extended federal funding for ten years. The extension in federal funding enables states to maintain coverage for children and pregnant women and continues the ACA MOE provision that requires states to maintain Medicaid and CHIP eligibility levels for children through 2027. After October 1, 2019, the MOE will only apply to children in families with incomes at or below 300% FPL (305% FPL after accounting for the five percentage point income disregard). The 14 states that have CHIP eligibility above 305% FPL can maintain higher eligibility levels and receive federal CHIP matching funds, but they could reduce eligibility to 305% FPL at that time or later. The legislation continues the 23 percentage point enhanced federal match rate for CHIP established by the ACA through 2019 to give states time to plan for a phase down to the regular CHIP matching rate in 2021.
There could be continued gains in eligibility for adults if additional states adopt the Medicaid expansion, but some may add new requirements or restrictions for adults as a condition of expanding coverage. As noted, Maine adopted the Medicaid expansion through a ballot initiative in 2017, although it has not yet been implemented. Additional states may move forward with the expansion over the coming year, which would reduce the number of poor uninsured adults that currently fall into the coverage gap in non-expansion states. Some states examining the potential to expand coverage to adults may also seek waivers adding new requirements or restrictions for adults as a condition of expanding coverage. A substantial body of research shows that Medicaid expansion results in significant coverage gains and reductions in uninsured rates, improvements in access to care and families’ financial security, and economic benefits to states and providers.
Proposals to make significant changes to Medicaid’s structure and financing are likely to continue to be debated. While proposals to cap and limit Medicaid financing stalled in 2017, proposals to restructure Medicaid and reduce federal spending are likely to reemerge. The President’s FY2019 budget proposes reductions to Medicaid and some Congressional leaders continue to express interest in reducing spending on entitlement programs, including Medicaid and Medicare. Changes to the financing and structure of Medicaid would have significant implications for the coverage gains achieved for children and adults to date. Moreover, uncertainty around the future of the program could limit state interest in continuing efforts to expand coverage and improve enrollment and renewal processes.
Waivers and other proposed changes require complex documentation and administrative processes for adults that run counter to simplified enrollment and renewal and increase costs for individuals (Figure 24). Recently approved and proposed Section 1115 waivers include new restrictions and requirements for adults such as work requirements, premiums, increased cost sharing, time limits on coverage, drug screening and testing requirements, asset tests, more frequent redeterminations, waivers of reasonable promptness and retroactive eligibility, and lockouts for failure to pay premiums or provide timely information about changes in circumstances or for renewal. To date, CMS has approved certain eligibility and enrollment restrictions as part of ACA Medicaid expansion waivers; in some cases, provisions also apply to other groups, including very low-income parents eligible through traditional eligibility pathways. Many of these provisions had not yet been implemented as of January 2018, although waivers of retroactive eligibility and reasonable promptness and higher premiums had been implemented in some states. In addition, the President’s FY2019 budget proposes to allow states once again to require individuals to meet an asset test and to provide documentation to verify citizenship and immigration status before receipt of Medicaid, although states already must verify citizenship and immigration status under current law. These provisions run counter to the streamlined processes states have put in place under the ACA. Research and previous state experience shows that such changes would likely create barriers for eligible individuals to obtain and maintain coverage and access needed care. They also will be complex and costly for states to implement.

Taken together, the survey data show that Medicaid and CHIP continue to provide a strong base of coverage for our nation’s low-income children and pregnant women. There have been significant gains in eligibility for parents and other adults under the ACA Medicaid expansion, but gaps in coverage remain in states that have not implemented the expansion. Through major investments of time and resources, states have largely realized modernized, streamlined enrollment and renewal processes as outlined in the ACA, which have made the processes more consumer-friendly for individuals and reduced administrative burdens for states. In 2017, some states continued to take up targeted expansions in coverage and improvements to enrollment and renewal processes, although there was some leveling off of continued advancement and states focused attention on other priorities. Looking ahead, coverage for children and pregnant women will remain strong, bolstered by a ten-year extension in federal funding for CHIP. Opportunity remains for states to expand eligibility for parents and other adults by implementing the Medicaid expansion. States may continue to refine and enhance enrollment and renewal processes, but some states are seeking to include new requirements and restrictions for adults that require complex documentation and administrative processes, which would likely create barriers for eligible individuals to obtain and maintain coverage and access needed care.
Table 2: Waiting Period for CHIP Enrollment, January 2018
Table 3: State Adoption of Optional Medicaid and CHIP Coverage for Children, January 2018
Table 8: Features of Online Medicaid Accounts, January 2018
Table 9: Mobile Access to Online Medicaid Applications and Accounts, January 2018
Table 11: Coordination between Medicaid and Other Systems, January 2018
Table 12: Presumptive Eligibility in Medicaid and CHIP, January 2018
Table 14: Premium, Enrollment Fee, and Cost Sharing Requirements for Children, January 2018
Table 15: Premiums and Enrollment Fees for Children at Selected Income Levels, January 2018
Table 16: Disenrollment Policies for Non-Payment of Premiums in Children’s Coverage, January 2018
Six months after hurricanes Irma and Maria made landfall across Puerto Rico and the U.S. Virgin Islands, local officials described progress but also a long road to full recovery of the U.S. territories’ health care systems, economies and infrastructure during a public briefing Monday at the Kaiser Family Foundation’s Washington D.C. offices.
An archived webcast of the 90-minute briefing on the status of the recovery on the islands, with a focus on their health care systems, can be viewed online at kff.org. Officials from both territories said new federal Medicaid money recently approved by Congress will be critical to continuing recovery efforts and financing health care delivery. However, they expressed concerns about fiscal challenges the territories will face when that funding runs out in 2019.
Health care practitioners and administrators noted that although hospitals and clinics have resumed operations, capacity remains limited and the territories face increasing supply challenges due to the loss of health professionals leaving the islands. In a new video, released at the briefing and recorded earlier this month during a visit by KFF experts to Puerto Rico and the U.S. Virgin Islands, residents spoke of enduring trauma and mental health challenges, continued disruption to their jobs and housing, unstable outages and reduced tourism and other business activity and employment. A companion report also provides a six-month check-up on how the territories are doing after the storms.
Diane Rowland, the Executive Vice President of KFF, moderated the event, and KFF experts Barbara Lyons and Samantha Artiga shared insights from a recent fact-finding visit to the territories. Rep. Stacey Plaskett (D-U.S. Virgin Islands) provided remarks. Panelists included Joshua Barnes, Acting Director of Recovery, Office of Emergency Management, Office of the Assistant Secretary for Preparedness and Response, U.S. Department of Health & Human Services; Rafael Rodríguez-Mercado, M.D., Secretary of Health for Puerto Rico; Ivonne Rivera-Hernández, Executive Director of HealthproMed, a community health center in Puerto Rico; and Bernard A. Wheatley, Chief Executive Officer of the Schneider Regional Medical Center, U.S. Virgin Islands.
The kff.org web page with the archived webcast of the briefing also links to presentation slides, speaker bios and written remarks from Rep. Jenniffer González-Colón (R-Puerto Rico).
Under the Affordable Care Act, Medicaid expansion and non-expansion states alike have implemented streamlined Medicaid enrollment systems that facilitate real-time eligibility determinations and automated renewals, according to a new 50-state survey from the Kaiser Family Foundation.
Before the ACA, individuals could not apply for Medicaid by phone or online in many states. They typically had to provide paper documentation like pay stubs and wait weeks for an eligibility determination – and do it all over again at renewal. In 2018, 50 states take online applications (up from 36 in 2013), 49 allow phone applications (up from 17) and 46 have automated renewal (up from 22), finds KFF’s 16th annual survey of Medicaid and CHIP eligibility, enrollment, renewal and cost sharing policies.
Individuals in most states now can receive a real-time eligibility determination in less than 24 hours without having to submit pay stubs when the state is able to verify information through electronic data matches with trusted data sources. Looking ahead, recent approved and proposed Section 1115 waivers in some states seeking to implement work requirements, premiums and cost sharing and lockout periods in Medicaid would require new documentation and costly administrative processes that could add new administrative complexity in affected states.
The new survey provides comprehensive data on Medicaid and CHIP eligibility, enrollment, renewal, premium, and cost sharing policies for each state as of January 2018. It also discusses policy changes during 2017 and looks ahead to emerging issues for states. Other key survey findings include:
The full report, Medicaid and CHIP Eligibility, Enrollment, Renewal and Cost Sharing Policies as of January 2018: Findings from a 50-State Survey, includes detailed tables with state-by-state data in the appendix. Also available at kff.org is a recently released companion analysis, Implications of Emerging Waivers on Streamlined Medicaid Enrollment and Renewal Processes.
On August 25, 2017, Hurricane Harvey began devastating large parts of the Texas Gulf Coast region. In order to provide policymakers, funders, and others working on the recovery effort with reliable information about how Texas residents were affected by Hurricane Harvey and what their needs and priorities are when it comes to recovery, the Kaiser Family Foundation and the Episcopal Health Foundation partnered to conduct a representative survey of residents in 24 counties along the Texas Gulf Coast that were heavily impacted by property damage from the storm. Using data from the survey, this brief gives an overview of the views and experiences of immigrants who were living in Texas Gulf Coast counties that were affected by Hurricane Harvey1 . For a variety of reasons, including potential language barriers, lack of social ties, and fears of drawing attention to their own or someone else’s legal resident status, immigrants may be more vulnerable to the effects of natural disasters and their aftermath compared to those who were born in the United States. This summary aims to highlight immigrants’ experiences with Harvey in order to better understand the particular needs of this potentially vulnerable population both in recovering from Harvey and preparing for future storms. A full report on the survey can be found here.
Analysis: Immigrants living along Texas Gulf Coast were more likely than U.S.-born neighbors to suffer employment or income losses after #HurricaneHarvey
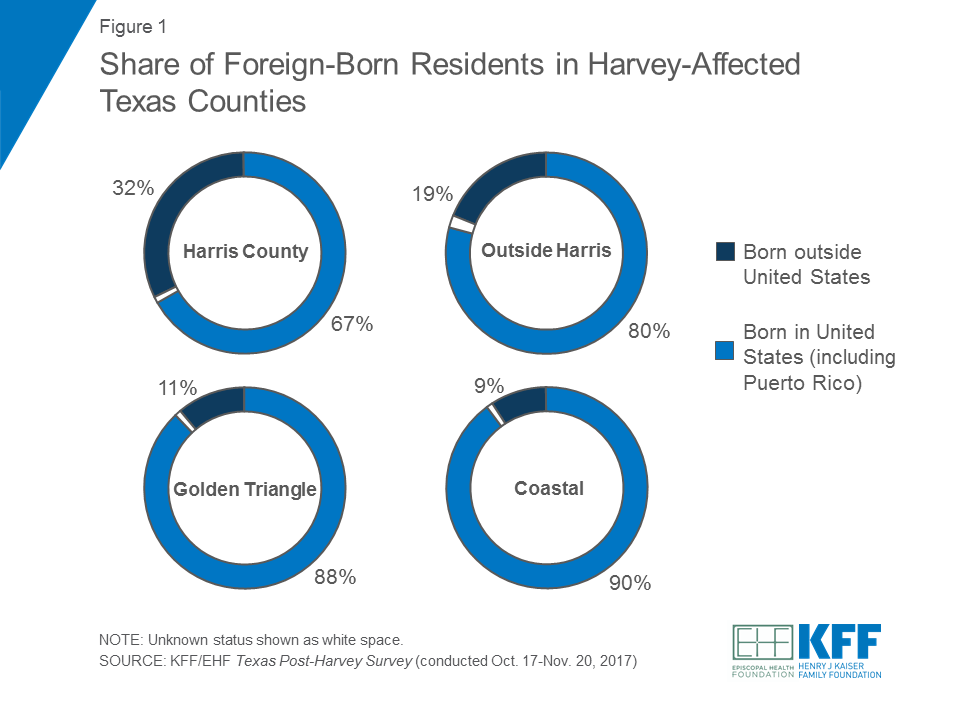
Across the 24 Texas counties included in the survey, a quarter of adult residents said they were born outside the United States. The share identifying as immigrants was highest in Harris County (32 percent), followed by the counties surrounding Harris (19 percent). In the Golden Triangle and Coastal areas, roughly one in ten said they were born outside the United States.2
In the 24-county region, there are a number of characteristics that distinguish immigrants from their native-born counterparts. Some of these differences may point to the potential vulnerability of foreign-born residents in recovering from storms such as Harvey.
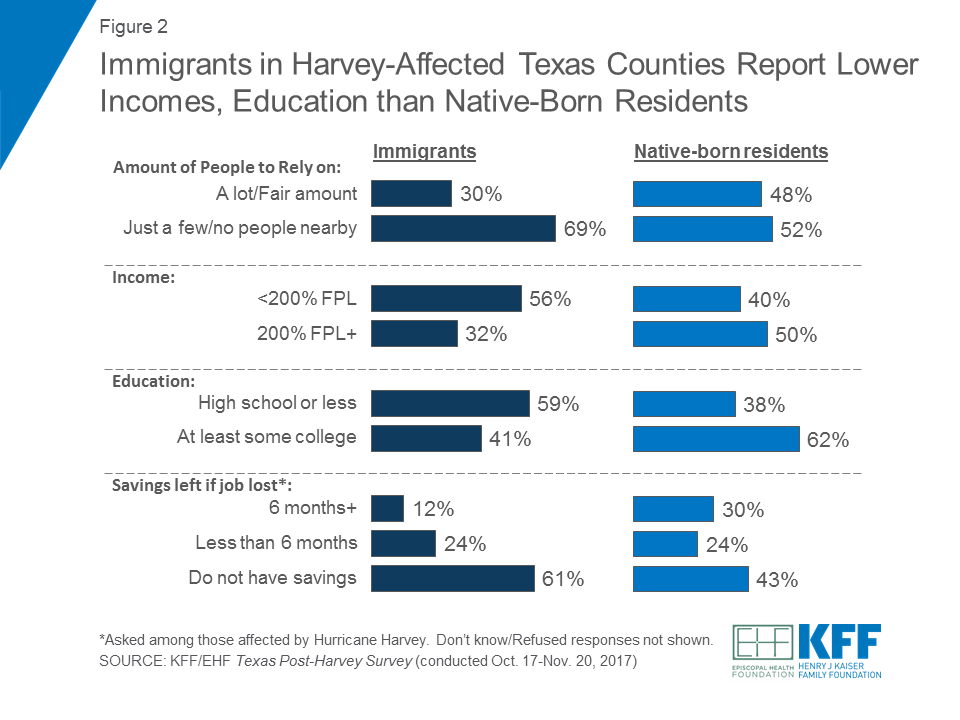
Compared to native-born residents, immigrants in these Texas counties report more tenuous financial and social circumstances. When asked how many relatives and friends they had living nearby who they could rely on for help and support, seven in ten immigrants (69 percent) said they had “just a few” or “no people living nearby.” This is compared to about half of native-born residents who said the same. In terms of their economic situation, immigrants were more likely than native-born residents to report having incomes under 200% of the Federal Poverty Level (56 percent versus 40 percent), and less likely to have at least some college education (62 percent versus 41 percent). Among those who were directly affected by Hurricane Harvey, immigrants were much less likely than those born in the United States to say that if they lost their job or source of income, they would be able to live comfortably for at least 6 months (12 percent versus 30 percent).
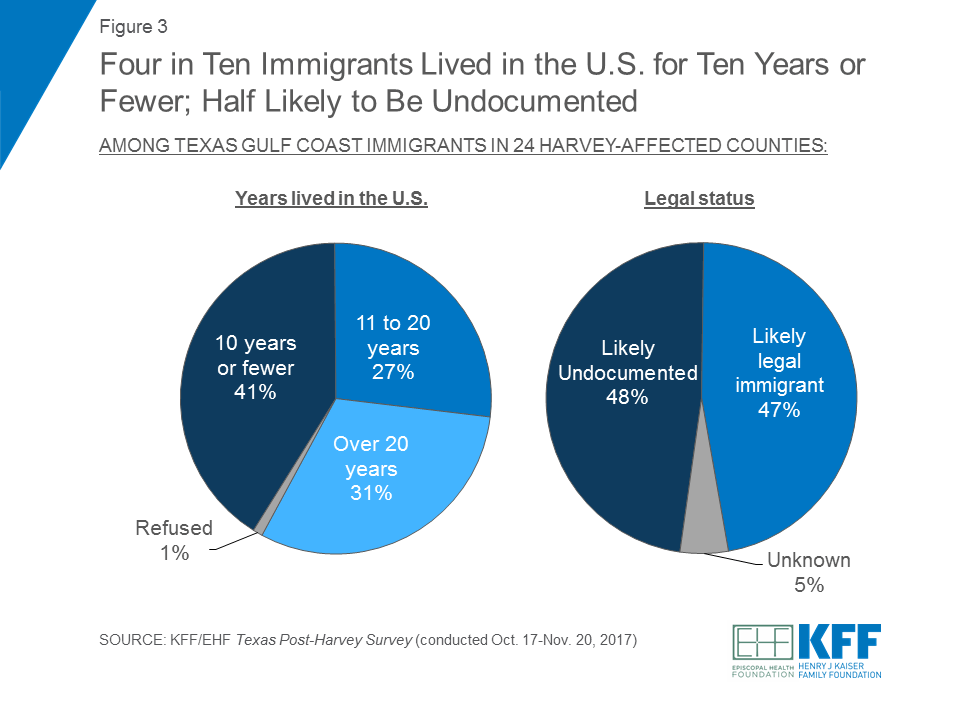
Four in ten foreign-born residents (41 percent) in the survey said they had lived in the United States for 10 years or fewer.3 Furthermore, about half were likely to be undocumented – a status that was determined by asking immigrants whether they were a permanent resident (i.e. had a green card) when they came to the United States or if their status had been changed to permanent resident since arriving.
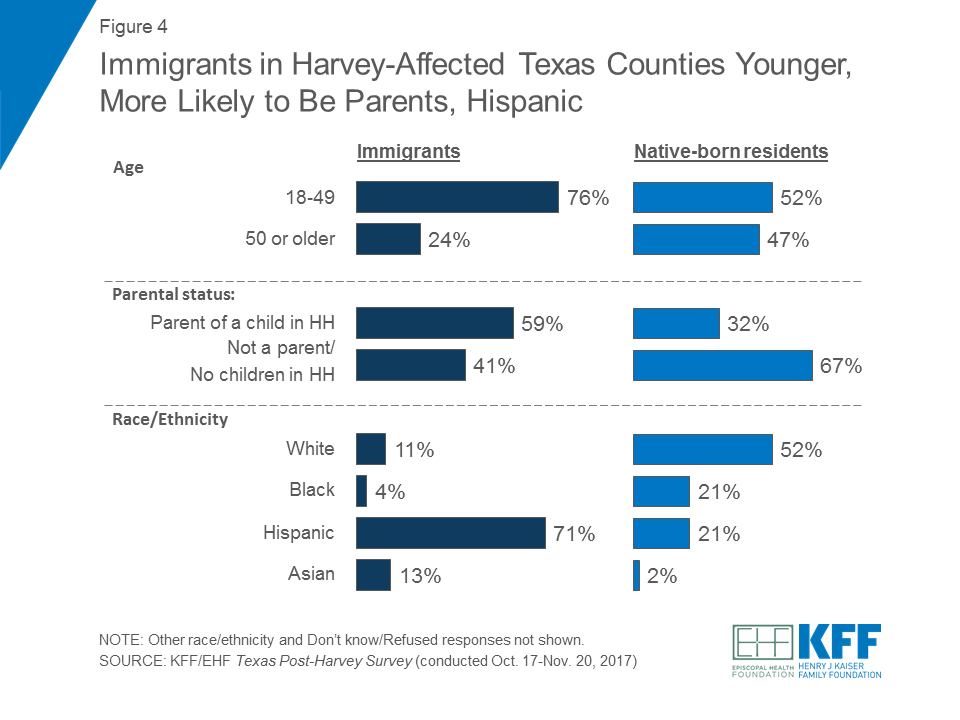
There are also other differences in the demographic profiles of immigrants and native-born residents in the Texas Gulf Coast – specifically by age, parental status, and race/ethnicity. Compared to residents born in the United States, immigrants were younger (three-quarters are under 50 years of age) and more likely to be the parent of a child in their household. About seven in ten immigrants in the 24-county region were Hispanic.
Reflecting their more challenging financial circumstances and lower levels of education, immigrants were particularly vulnerable to employment and income disruptions as a result of Hurricane Harvey. A larger share of immigrants said they experienced some type of income or job loss as a result of the storm compared to native-born residents (64 percent versus 39 percent). Specifically, immigrants were more than twice as likely to say someone in their household had overtime or regular hours cut back at work (54 percent versus 24 percent). By contrast, immigrants were somewhat less likely than individuals born in the United States to say their home was damaged as a result of the storm (35 percent versus 45 percent).4 Overall three-quarters (74 percent) of immigrants in the region said they were affected by some type of property damage to their home or vehicle and/or some form of job or income loss, compared to 63 percent of native-born residents.
| Table 1: Hurricane Harvey Effects by Residency Status | ||
| Percent who report the following as a result of Hurricane Harvey: | Immigrants | Native-born |
| Someone in household experienced income/job loss (NET) | 64% | 39% |
| Someone in household was laid off/lost a job | 16 | 10 |
| Someone in household had hours cut back at work | 54 | 24 |
| Someone in household had any other loss of income | 39 | 29 |
| Home was damaged (NET) | 35 | 45 |
| Home had major damage or was destroyed | 12 | 22 |
| Home had minor damage | 22 | 23 |
| Vehicle was damaged | 21 | 21 |
| Any property damage/income effects | 74 | 63 |
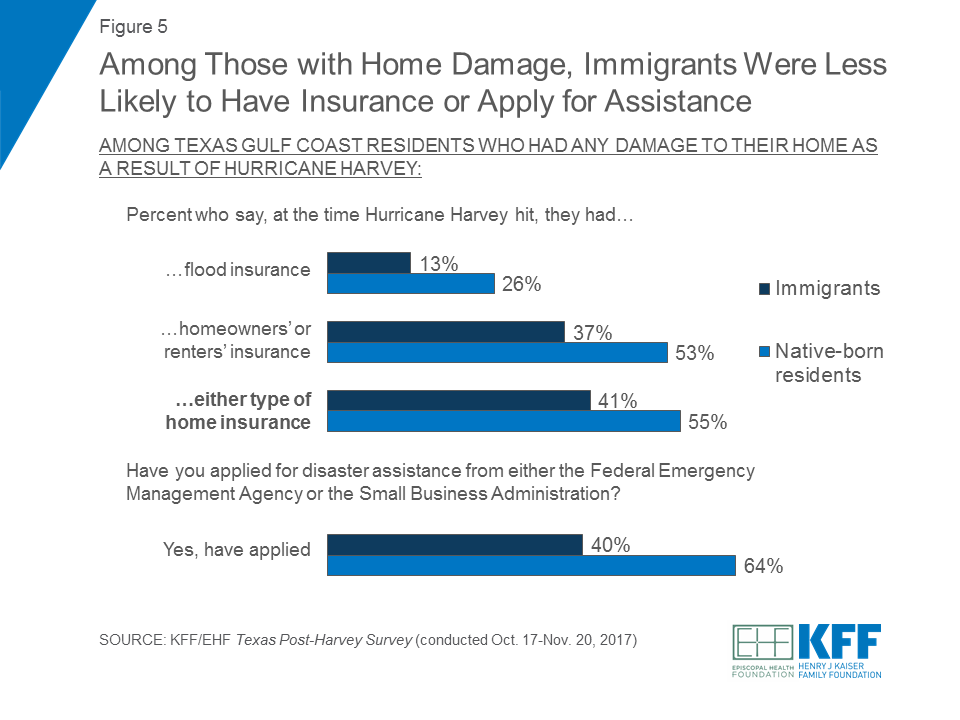
Again perhaps related to their economic status, immigrants who had damage to their home as a result of Hurricane Harvey were less likely than those born in the United States to say they had either flood insurance or homeowners’/renters’ insurance at the time Hurricane Harvey hit (41 percent versus 55 percent). Immigrants who were affected by Harvey were also less likely to report applying for government assistance after the storm. Four in ten immigrants whose homes were damaged said they applied for disaster assistance from either FEMA or the SBA following the hurricane, while almost two-thirds of native-born residents said they applied.
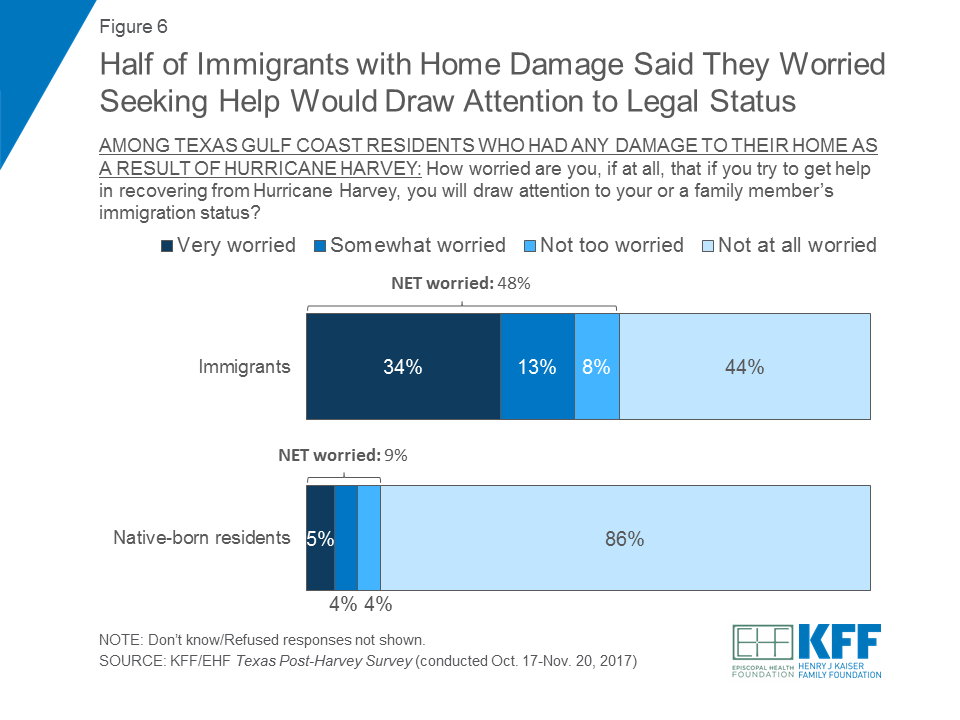
One potential reason immigrants may have been less likely to apply for disaster assistance is a possible fear of highlighting their own or someone else’s legal resident status. Half of immigrants with home damage said they were “somewhat” or “very worried” (48 percent) that if they tried to get help in recovering from Hurricane Harvey they would draw attention to their or a family member’s immigration status, while one in ten (9 percent) native-born residents said they were worried.
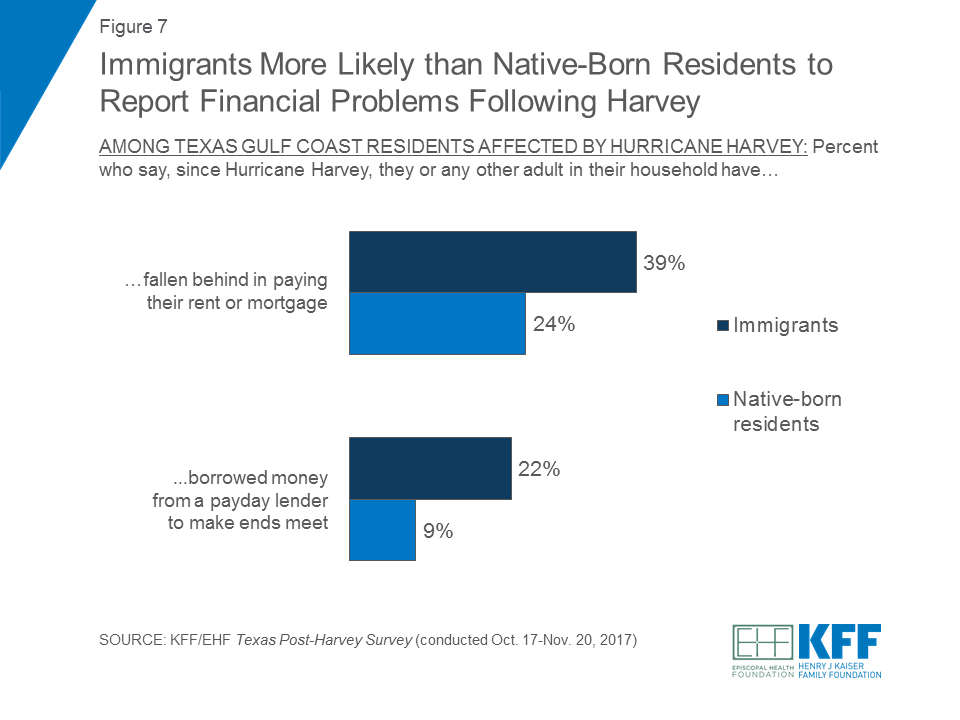
Further highlighting the income challenges that Texas Gulf Coast immigrants experienced as a result of Hurricane Harvey, the survey also finds foreign-born residents disproportionately likely to report financial difficulties in the months after the hurricane. Compared to residents born in the United States, immigrants affected by Harvey were significantly more likely to say that they or any other adult in their household had fallen behind in paying their rent or mortgage since the storm (39 percent versus 24 percent). Similarly, a larger share of immigrants said that they or a family member had borrowed money from a payday lender to make ends meet (22 percent versus 9 percent).
Immigrants were also more likely to report problems accessing health care in the wake of the storm. About a quarter (24 percent) of immigrants who were affected by the storm said they needed more help with getting the medical care they and their family needed, compared to a smaller share (13 percent) of native-born residents.
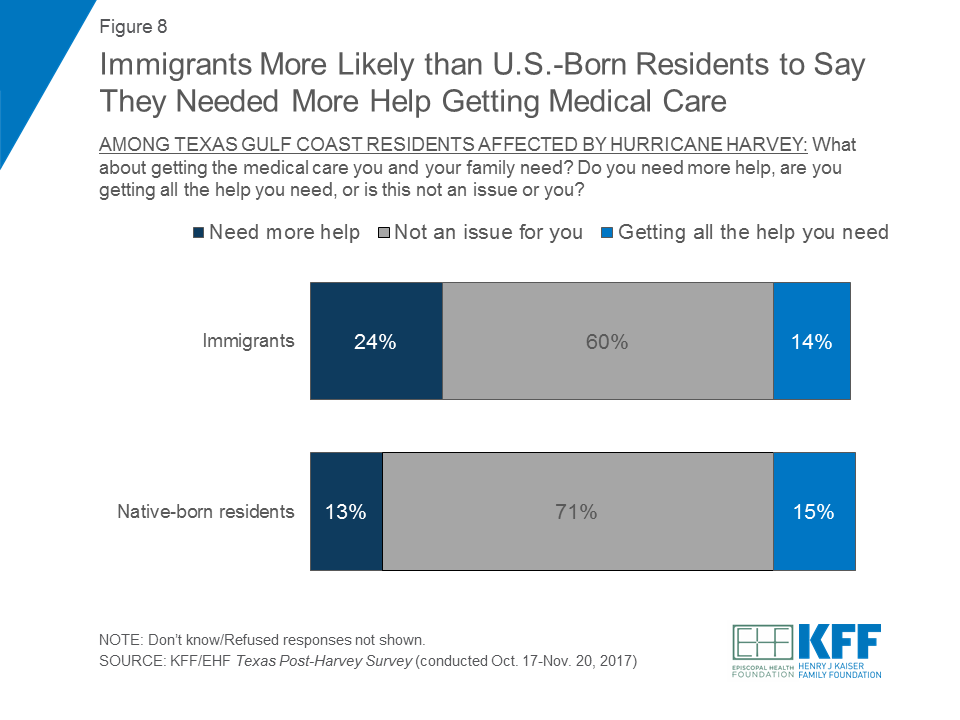
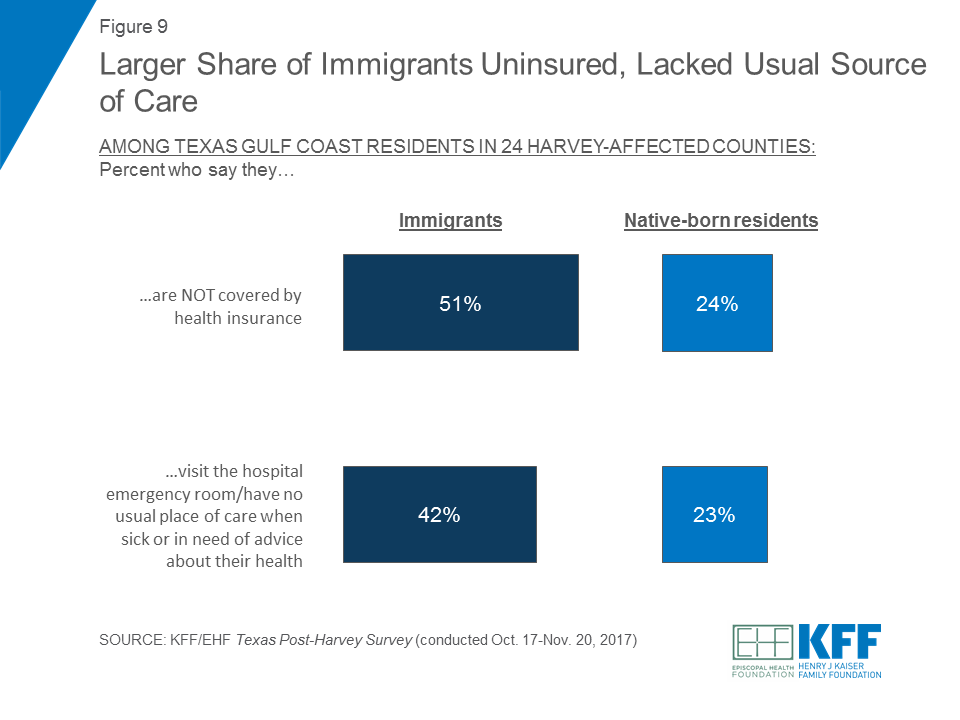
This difference may be related to the fact that immigrants are more likely than native-born residents to lack insurance coverage and access to health care providers. When asked about their health care, immigrants were about twice as likely as native-born residents to say they did not have health insurance (51 percent versus 24 percent). About four in ten immigrants also said they either visit the hospital emergency room or they have no usual place of care to go to when sick or in need of advice about their health (42 percent). This is compared to a much smaller share of residents born in the United States who said the same (23 percent).
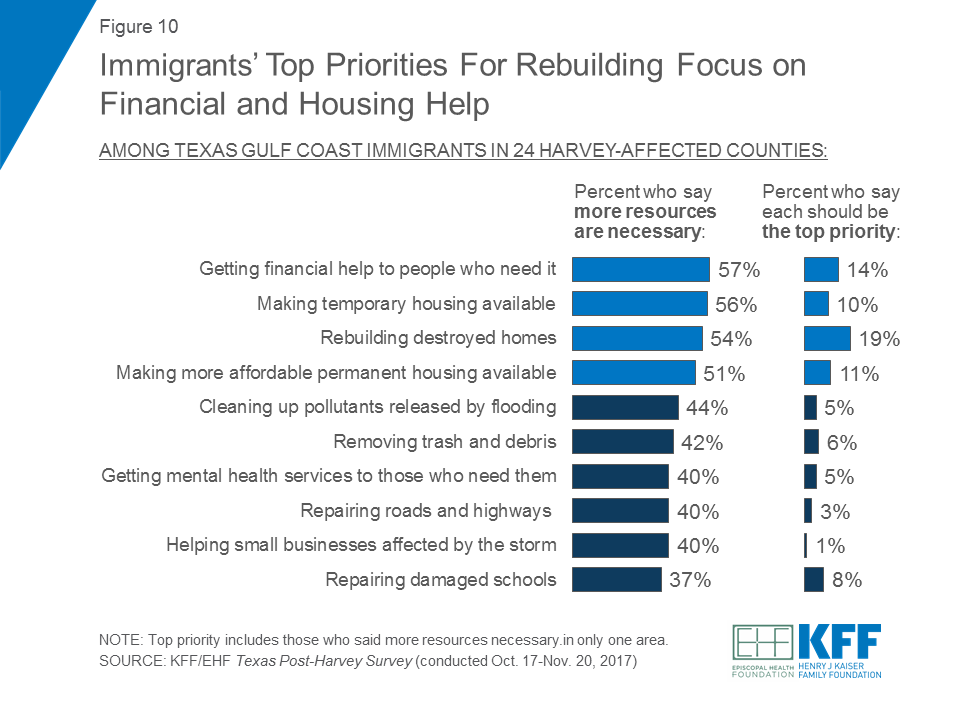
Immigrants in the 24-county region – including those who were affected by the hurricane and those who weren’t – identified many areas where more resources were needed for rebuilding and recovery efforts in Harvey-affected communities. Similar to all adults living along the Texas Gulf Coast, priorities for foreign-born residents focused on providing financial and housing help to those in need. A majority of foreign-born residents said more resources were necessary in getting financial help to people who need it (57 percent), making temporary housing available (56 percent), rebuilding destroyed homes (54 percent), and making more affordable permanent housing available (51 percent). When forced to choose the top priority, rebuilding destroyed homes ranked first (19 percent), followed by getting financial help to people who need it (14 percent), making more affordable permanent housing available (11 percent), and making temporary housing available (10 percent).
Immigrants in the Texas Gulf Coast region faced some particular challenges compared to their native-born counterparts even before Hurricane Harvey hit, including more tenuous financial circumstances, poorer access to health care and insurance, and smaller nearby social support networks. The survey finds that the hurricane exacerbated some of these challenges, as immigrants were more likely than other Texans to experience job-related income loss as a result of the storm. As recovery efforts continue, these data indicate that help with financial recovery and access to health care may be of particular benefit to immigrants living in the Texas gulf coast region.

Immigrants living along the Texas Gulf Coast were more likely than their U.S.-born neighbors to suffer employment and income losses as a result of Hurricane Harvey (64% vs. 39%), a new Kaiser Family Foundation/Episcopal Health Foundation analysis finds.
The analysis examines differences between immigrants and U.S.-born families based on a fall KFF/EHF survey of residents in 24 Texas counties hit hard by Hurricane Harvey in August 2017.
Other findings include:
The analysis is based on the Texas Post-Harvey Survey, designed and analyzed by KFF and EHF researchers and conducted by landline and cellular telephone October 17 – November 20, 2017 among a random sample of 1,635 adults ages 18 and older living in 24 Texas counties that suffered large amounts of property damage from Hurricane Harvey according to FEMA reports. The margin of sampling error including the design effect for the full sample is plus or minus 3 percentage points, and plus or minus 7 percentage points for results based on immigrants (N=290). For results based on other subgroups, the margin of sampling error may be higher.
The role of government in regulating abortion coverage began to be debated shortly after the landmark Supreme Court ruling in Roe v Wade. Since 1976, the Hyde Amendment has blocked federal funds under Medicaid and other federal programs from being used to pay for abortion, allowing exceptions only for pregnancies that endanger a woman’s life, or that result from rape or incest. The Affordable Care Act (ACA) interpreted the federal abortion-funding ban to include the federal tax credits that functioned as premium subsidies to help individuals afford Marketplace plans. This issue brief reviews current federal and state policies on private insurance coverage of abortion services, and how the Premium Relief Act of 2017 would affect abortion coverage for women enrolled in the individual market and some small group plans.
States have the responsibility to regulate fully insured individual, small, and large group health insurance policies issued in their state, whereas self-insured plans are regulated by the federal government under the Employee Retirement Income Security Act (ERISA). States can choose to regulate whether abortion coverage is included or excluded in private plans that are not self-insured.
Three states, California, New York, and Oregon, require all state-regulated private health insurance policies to include abortion coverage. California requires all fully insured plans, including individual and employer plans to treat abortion coverage and maternity coverage neutrally. As all plans are required to include maternity coverage, all plans must also include abortion coverage.1 New York requires all fully insured insurance policies that provide hospital, surgical, or medical expense coverage to cover “medically necessary” abortions without copayments, coinsurance, or annual deductibles, unless the policy is a tax-qualified high deductible health plan. Oregon’s Reproductive Health Equity Act requires state-regulated health plans to cover abortion without cost sharing. The Washington legislature recently passed a bill requiring state-regulated health plans to treat abortion and maternity coverage equally, which the Governor is expected to sign.
Eleven states (Idaho, Kentucky, Missouri, North Dakota, Oklahoma, Indiana, Kansas, Michigan, Nebraska, Texas, and Utah) restrict abortion coverage in private plans. Some states follow the same restrictions as the federal Hyde Amendment for their private plans, while others are more restrictive. Nine of the eleven states allow insurers to sell riders for abortion coverage on the private market; however, these riders are not available, and there is no documentation of their cost or impact on access. Utah bans riders from being sold for abortion coverage.
The Affordable Care Act (ACA) specifically excludes abortion as an “essential health benefit” and prohibits federal premium tax credits and cost sharing reductions (CSR) from subsidizing abortion. Furthermore, the ACA allows states to ban coverage of abortions in the plans that are available through the ACA Marketplace, and 25 states have done so. In 2016, in an additional six states without an abortion coverage ban, the Marketplaces nonetheless did not offer any plans that included abortion coverage.2 In the states that permit Marketplace abortion coverage, plans that include abortion coverage must collect separate premium payments from individuals, and the plans must segregate those funds to ensure no federal tax subsidy dollars are applied to abortion coverage. In addition, federal reimbursement to insurers that receive CSR payments is restricted to claims for essential health benefits, and so does not subsidize abortion coverage.
The Premium Relief Act of 2017, as introduced in the House in December 2017, would amend the Public Health Service Act to create a Patient and State Stability Fund. This Fund would allocate funding to states to be used at the state’s discretion for a wide range of purposes, including to provide health plans with reinsurance funds or cost-sharing reduction payments. The bill prohibits States from allocating funds to plans that include abortion coverage. An exception is made for abortions for pregnancies resulting from rape or incest, or if the pregnancy endangers the woman’s life. This Act would go further than current law in limiting abortion coverage in private plans. Plans that operate in states that apply these funds toward cost-sharing reduction payments or reinsurance to stabilize premiums and reduce costs for high cost enrollees would not be permitted to include abortion coverage, even if it is paid for with private dollars. This bill would (Table 1):
The Premium Relief Act would not block State Medicaid programs from using their own state funds to cover abortion beyond the limited Hyde circumstances.
| Table 1: Summary of Proposed Changes to Abortion Coverage Restrictions in the Private Individual Insurance Market | ||
| The Affordable Care Act (ACA) | The Premium Relief Act of 2017 | |
| Who regulates abortion coverage in fully insured private plans sold in states? | States regulate fully insured private plans.
| States would continue to regulate fully insured plans. |
| Who regulates abortion coverage in state Marketplace exchanges? | States can choose to ban abortion coverage from plans offered through the Marketplace (25 states have done this). Federal regulations require that at least one Multi-State Plan that excludes abortion coverage must be available in each Marketplace. | States would continue to regulate plans offered through the Marketplace under ACA provisions. |
| How are federal funds limited for abortion coverage in Marketplace and private insurance plans? | No federal premium and cost-sharing subsidies can be used to pay for abortion. Exceptions are only made for pregnancies resulting from rape, incest, or if it is determined to endanger the life of the woman (Hyde). If a plan offers abortion coverage, premiums paid for that coverage must be segregated from premiums for other services. Every Marketplace must offer an option to enroll in a plan that does not include abortion. Plans that offer abortion coverage are not blocked from receiving cost-sharing reduction payments from the federal government. | Only insurers that exclude abortion coverage would be eligible for federal reinsurance funding to reduce premiums in the individual and small group market, both on and off the Marketplace. Only insurers that exclude abortion coverage would be eligible for cost-sharing reduction payments to assist low-income individuals enrolled in Qualified Health Plans. For cost-sharing reduction payments and reinsurance, exceptions would only be made for pregnancies resulting from rape, incest, or if it is determined to endanger the life of the woman (Hyde). |
California, New York, and Oregon require plans that are not self-insured to cover abortion. If the Premium Relief Act becomes law, these states would not be permitted to allocate any Patient and State Stability funds for reinsurance funding or cost-sharing reduction payments to assist health plans operating in the individual and small group market.
Three States Require Abortion Coverage in All Plans
California – In 2014, the California Department of Managed Care reasserted that the Knox-Keene Health Care Service Plan Act requires the provision of basic health care services. Several court decisions have confirmed that the California Constitution prohibits discrimination against women who choose to terminate their pregnancy. Therefore, all fully insured health plans in California must cover both maternity services and abortion services.
New York – New York law requires health insurance plans to cover medically necessary abortions without co-pays, coinsurance, or deductibles.
Oregon – The Reproductive Health Equity Act, passed in 2017, requires all health plans to cover abortion without cost sharing.
The Premium Relief Act’s abortion restrictions on the use of Patient and State Stability funds for cost-sharing reduction payments and federal reinsurance funding, if enacted, would serve as a disincentive for private plans to cover abortion as a benefit for enrollees in the individual and small group market nationwide. Given the direct conflict with state laws in California, New York, and Oregon that require all private plans sold in the state to include abortion coverage, there will likely be legal challenges if the Premium Relief Act were enacted with the current abortion coverage restrictions. The Senate has proposed an amendment to the omnibus spending bill with similar restrictions to address the need for continuation of the cost sharing reduction payments and reinsurance for private plans.
In this video, residents of Puerto Rico and the U.S. Virgin Islands describe progress but also a long, slow road to recovery of the U.S. territories’ health care systems, economies and infrastructure six months after hurricanes Irma and Maria. Residents and officials spoke of enduring mental health troubles, continued power outages and reduced tourism and other business activity and employment, as well as shortages of physicians and nurses. At the same time, officials say new Medicaid money recently approved by Congress will be helpful to recovery efforts.
With devastating force, Hurricane Maria hit Puerto Rico on September 20, 2017 as a category 4 storm, wreaking havoc on the island’s residents and its infrastructure. Six months after the hurricane hit, the island’s health care system is slowly recovering. Community health centers are a critical part of the health care system—20 federally funded health centers provide primary and preventive care services at 93 urban and rural sites across the island. In 2016, health centers in Puerto Rico served 352,172 patients, over one in ten residents, and provided more than 1.5 million patient visits, including over 84,000 oral health visits and over 68,000 visits for mental health and addiction services. Six months after the hurricane, these health centers have seen improvements but still face many challenges.
All health centers in Puerto Rico are now open and providing services, but the lack of power remains a critical problem for some. While improvements have been made in restoring power, approximately 1 in 10 (11%) of the permanent health center sites on the island have limited or no grid power. Three of these health centers have intermittent grid power and rely on generators as a backup source of power, while five remain without grid power and rely solely on generators. An additional health center converted to solar power in lieu of continuing to rely on a generator. Despite these challenges, health centers are providing essential primary care and mental health services to the residents of Puerto Rico as they struggle to recover and rebuild in the wake of the storm. Based on information collected by the Asociacion de Salud Primaria de Puerto Rico, Inc. (ASPPR), the interactive map below provides a snapshot of the operational status of the 93 health center sites as of March 13, 2018.
| Table 1: Puerto Rico Health Center Sites and Total Patients, 2016 | |||
| Health Center Name | City | Total Sites | Total Patients |
| BARCELONETA PRIMARY HEALTH SERVICES, INC | BARCELONETA | 2 | 15,658 |
| CAMUY HEALTH SERVICES, INC. | CAMUY | 1 | 13,336 |
| CASTANER GENERAL HOSPITAL | CASTANER | 2 | 10,626 |
| CENTRO DE SALUD DE LARES, INC. | LARES | 2 | 16,340 |
| CENTRO DE SALUD FAMILIAR (PALMIERI) | ARROYO | 3 | 13,150 |
| CENTRO DE SERVICIOS PRIMARIOS DE SALUD INC | FLORIDA | 1 | 13,877 |
| CONCILIO DE SALUD INTEGRAL DE LOIZA, INC | LOIZA | 3 | 13,583 |
| CONSEJO DE SALUD DE PUERTO RICO, INC. | PONCE | 11 | 40,265 |
| CORPORACION DE SERVICIOS DE SALUD Y MEDICINA AVANZADA | CIDRA | 6 | 27,960 |
| CORPORACION DE SERVICOS MEDICOS PRIMARIOS Y PREVENCION DE HATILLO | HATILLO | 7 | 16,505 |
| CORPORACION SANOS | CAGUAS | 3 | 5,713 |
| COSTA SALUD COMMUNITY HEALTH CENTERS INC | RINCON | 2 | 12,454 |
| HPM FOUNDATION, INC. | SAN JUAN | 5 | 14,540 |
| MIGRANT HEALTH CENTER, WESTERN REGION, INC | MAYAGUEZ | 12 | 23,985 |
| MOROVIS COMMUNITY HEALTH CENTER, INC. | MOROVIS | 1 | 13,083 |
| MUNICIPALITY OF SAN JUAN | SAN JUAN | 4 | 947 |
| NEOMED CENTER INC | GURABO | 7 | 34,545 |
| PATILLAS COMMUNITY GOVERNING BOARD | PATILLAS | 4 | 19,064 |
| PRYMED MEDICAL CARE, INC. | CIALES | 2 | 14,432 |
| SALUD INTEGRAL EN LA MONTANA, INC. | NARANJITO | 8 | 32,109 |
| Total | 86 | 352,172 | |
| Source: Bureau of Primary Health Care, Health Resources and Services Administration, Puerto Rico 2016 Health Center Profile. | |||
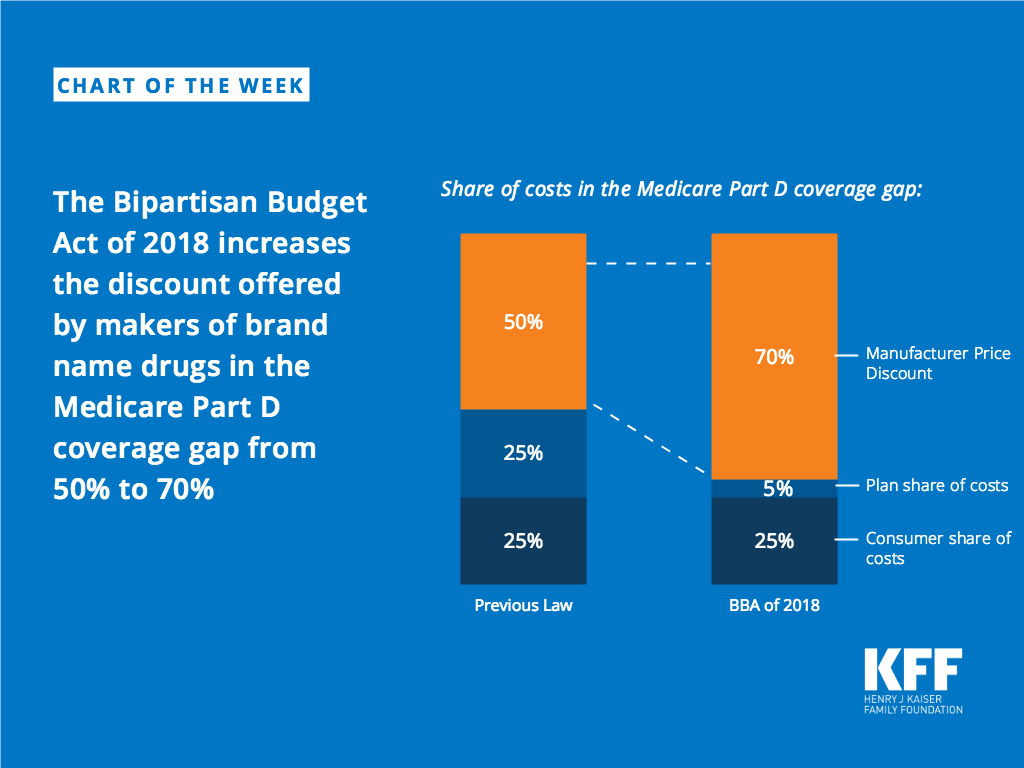
KFF analysis of Bipartisan Budget Act of 2018