KFF Health Tracking Poll: Health Care Costs, Expiring ACA Tax Credits, and the 2026 Midterms
Findings
Key Takeaways
- The cost of health care, including paying for health insurance and out-of-pocket expenses, tops the list of the public’s economic anxieties, rising well above other necessities. Two-thirds of the public (66%) say they worry about being able to afford health care for them and their family, ranking higher than utilities, food and groceries, housing, and gas. In addition, most adults (55%) say their health care costs have gone up in the past year, including at least one in five who say they have increased at a faster rate than food or utilities. A majority (56%) of the public say they expect health care costs for them and their families to become even less affordable in the coming year.
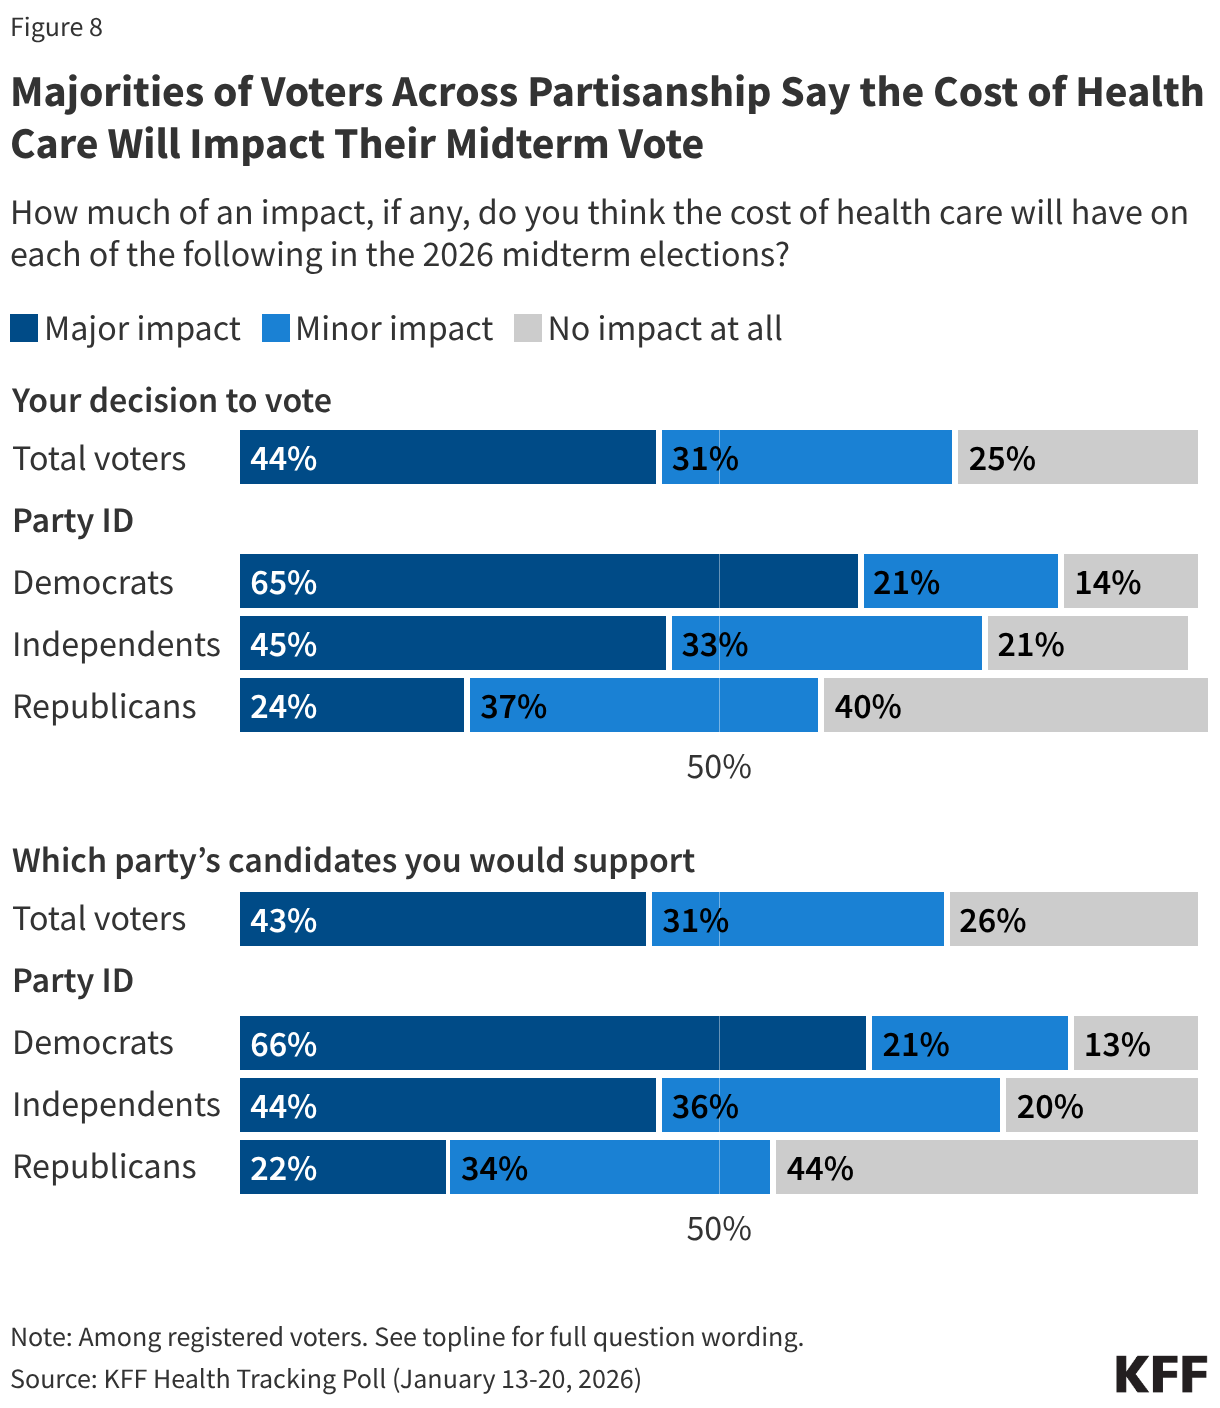
- With health care costs topping the list of economic worries across partisans and key groups, voters expect the issue to play a major role in their decisions to turnout in November’s midterm elections as well as which candidates they support. Majorities across partisans say health care costs will impact their vote in November, but the issue is resonating more with Democratic voters and independent voters. More than three-quarters of Democratic voters and independent voters say health care costs will impact both their decision to vote and which party’s candidate they will vote for in the election, compared to about half of Republican voters. In fact, two-thirds of Democratic voters and more than four in ten independent voters say health care costs will have a “major impact” on their 2026 voting decisions.
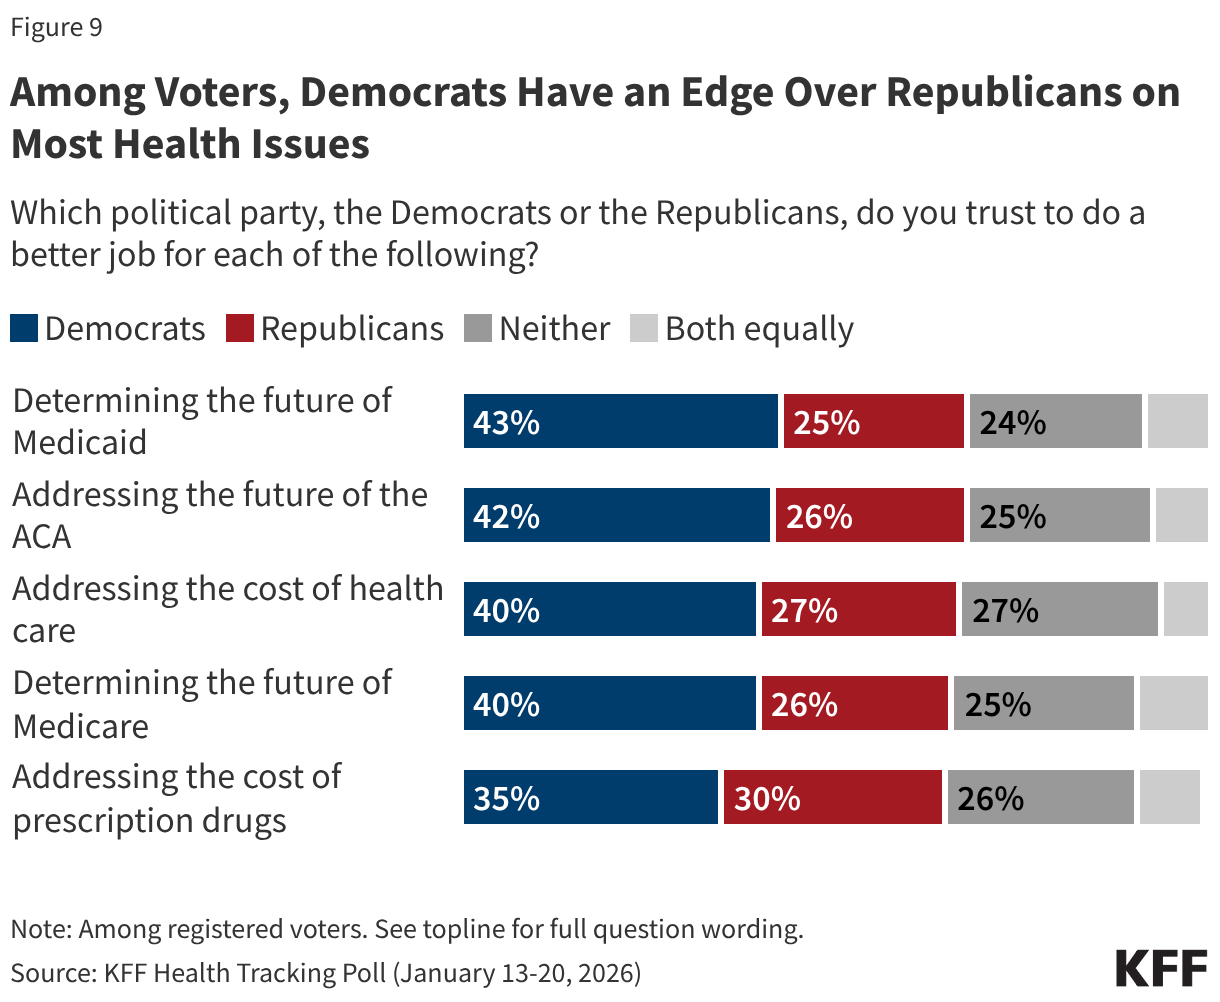
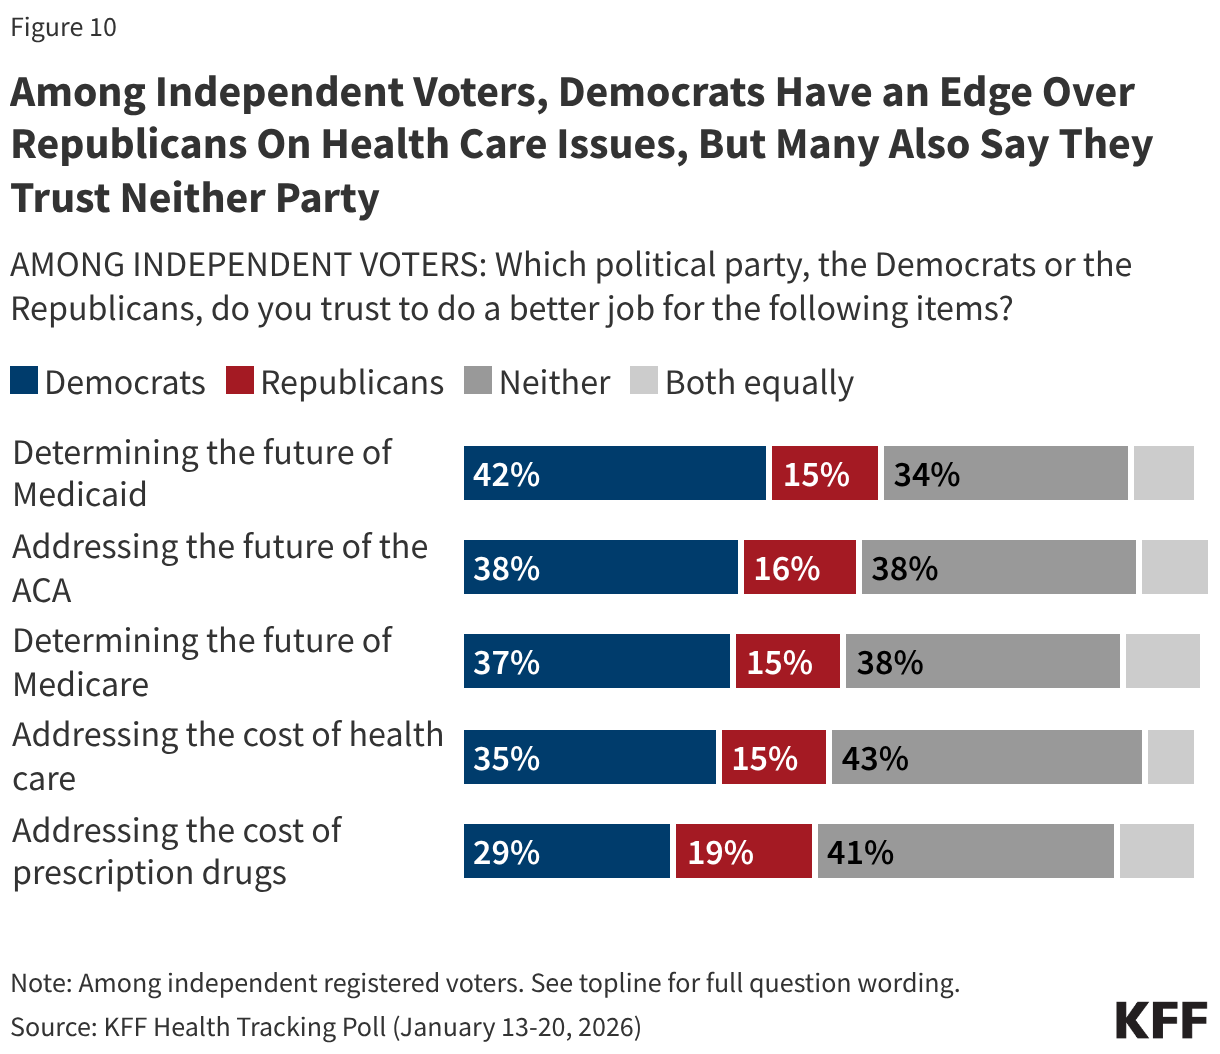
- The Democratic Party has the advantage when it comes to which party voters trust to handle most health care issues, including health care costs, on which the Democrats have a 13-point advantage over Republicans. The one exception is prescription drug prices, an issue President Trump has focused on in his second term, and on which similar shares of voters say they trust the Democratic Party (35%) and the Republican Party (30%). Among independent voters, the Democratic Party has an edge over the Republican Party on health care issues, but many independent voters also say they don’t trust either party.
- The public’s anxiety around health care costs comes at a time when the Senate and President Trump seem unlikely to revive the ACA enhanced premium tax credits, which expired on January 1st. Most (67%) of the public say Congress did the “wrong thing” by not extending the credits, including large majorities of Democrats (89%) and independents (72%). But majorities of Republicans (63%) including MAGA supporters (64%) say Congress did the “right thing” by not extending the ACA enhanced premium tax credits. While overall popularity of the ACA and the Marketplaces is still high, given the recent debate around the ACA enhanced tax credit debates, favorability has declined among Republicans.
Health Care Costs Top Public’s Concerns During Moment of Economic Anxiety
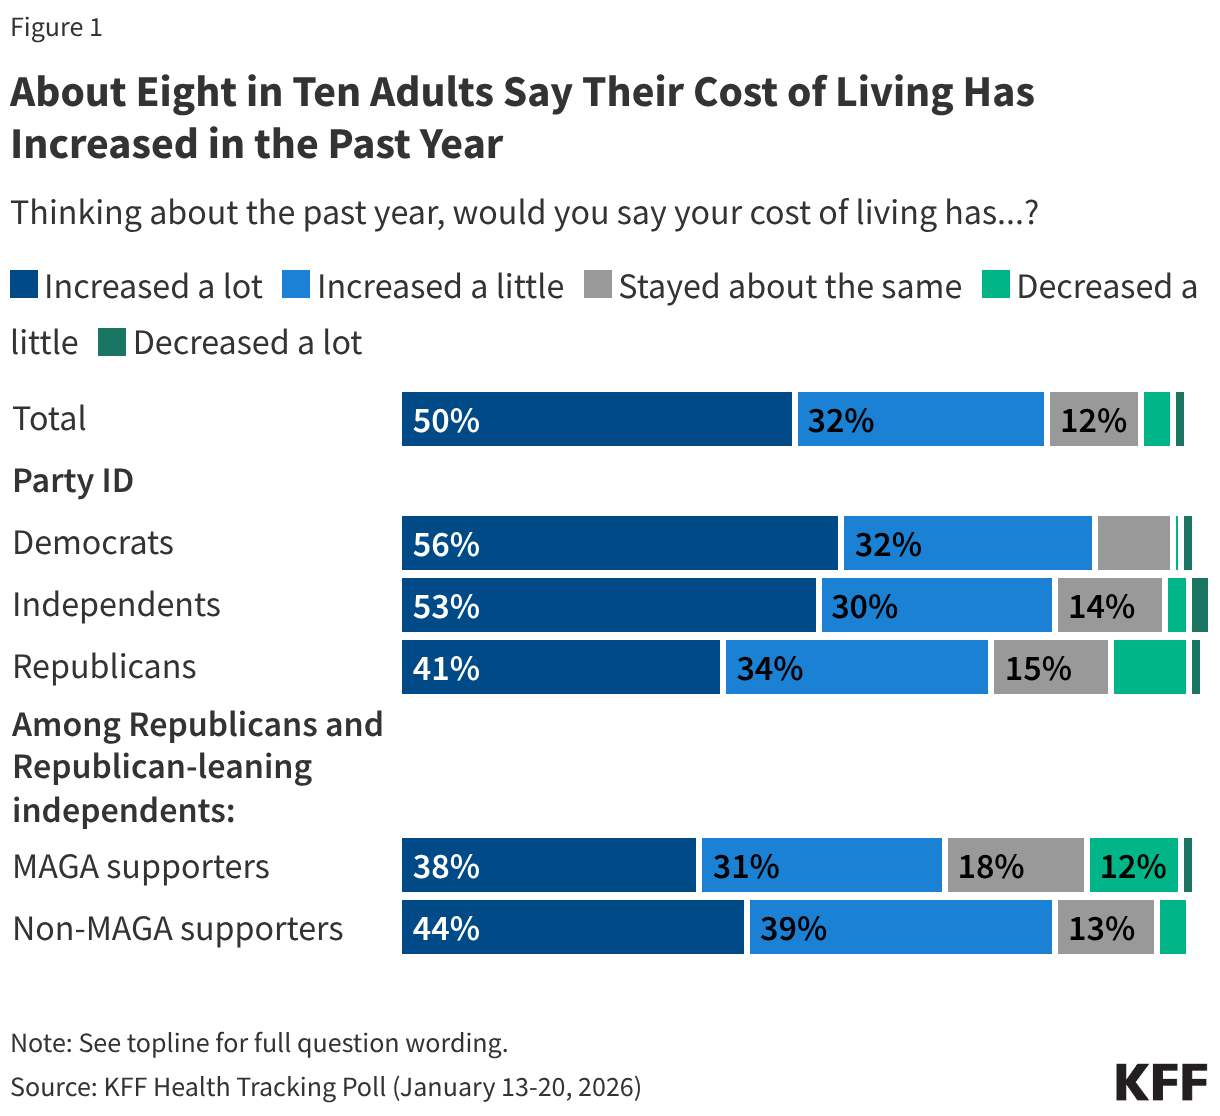
One year into the second term of President Trump and less than ten months before the 2026 midterm elections, the public remains concerned about the top issue of the 2025 election – the economy. Eight in ten (82%) adults say their cost of living has increased in the past year, including half who say it has increased “a lot.” Very few say their cost of living has “decreased” either “a little” (4%) or “a lot” (1%) while about one in ten say their living expenses have remained stable over the past year. Many adults, regardless of partisanship, say their cost of living has increased “a lot” in the past year, including a majority of (56%) Democrats, about half (53%) independents, and four in ten (41%) Republicans. About four in ten (38%) supporters of the Make America Great Again Movement (MAGA) also say their cost of living has increased “a lot” in the past year.
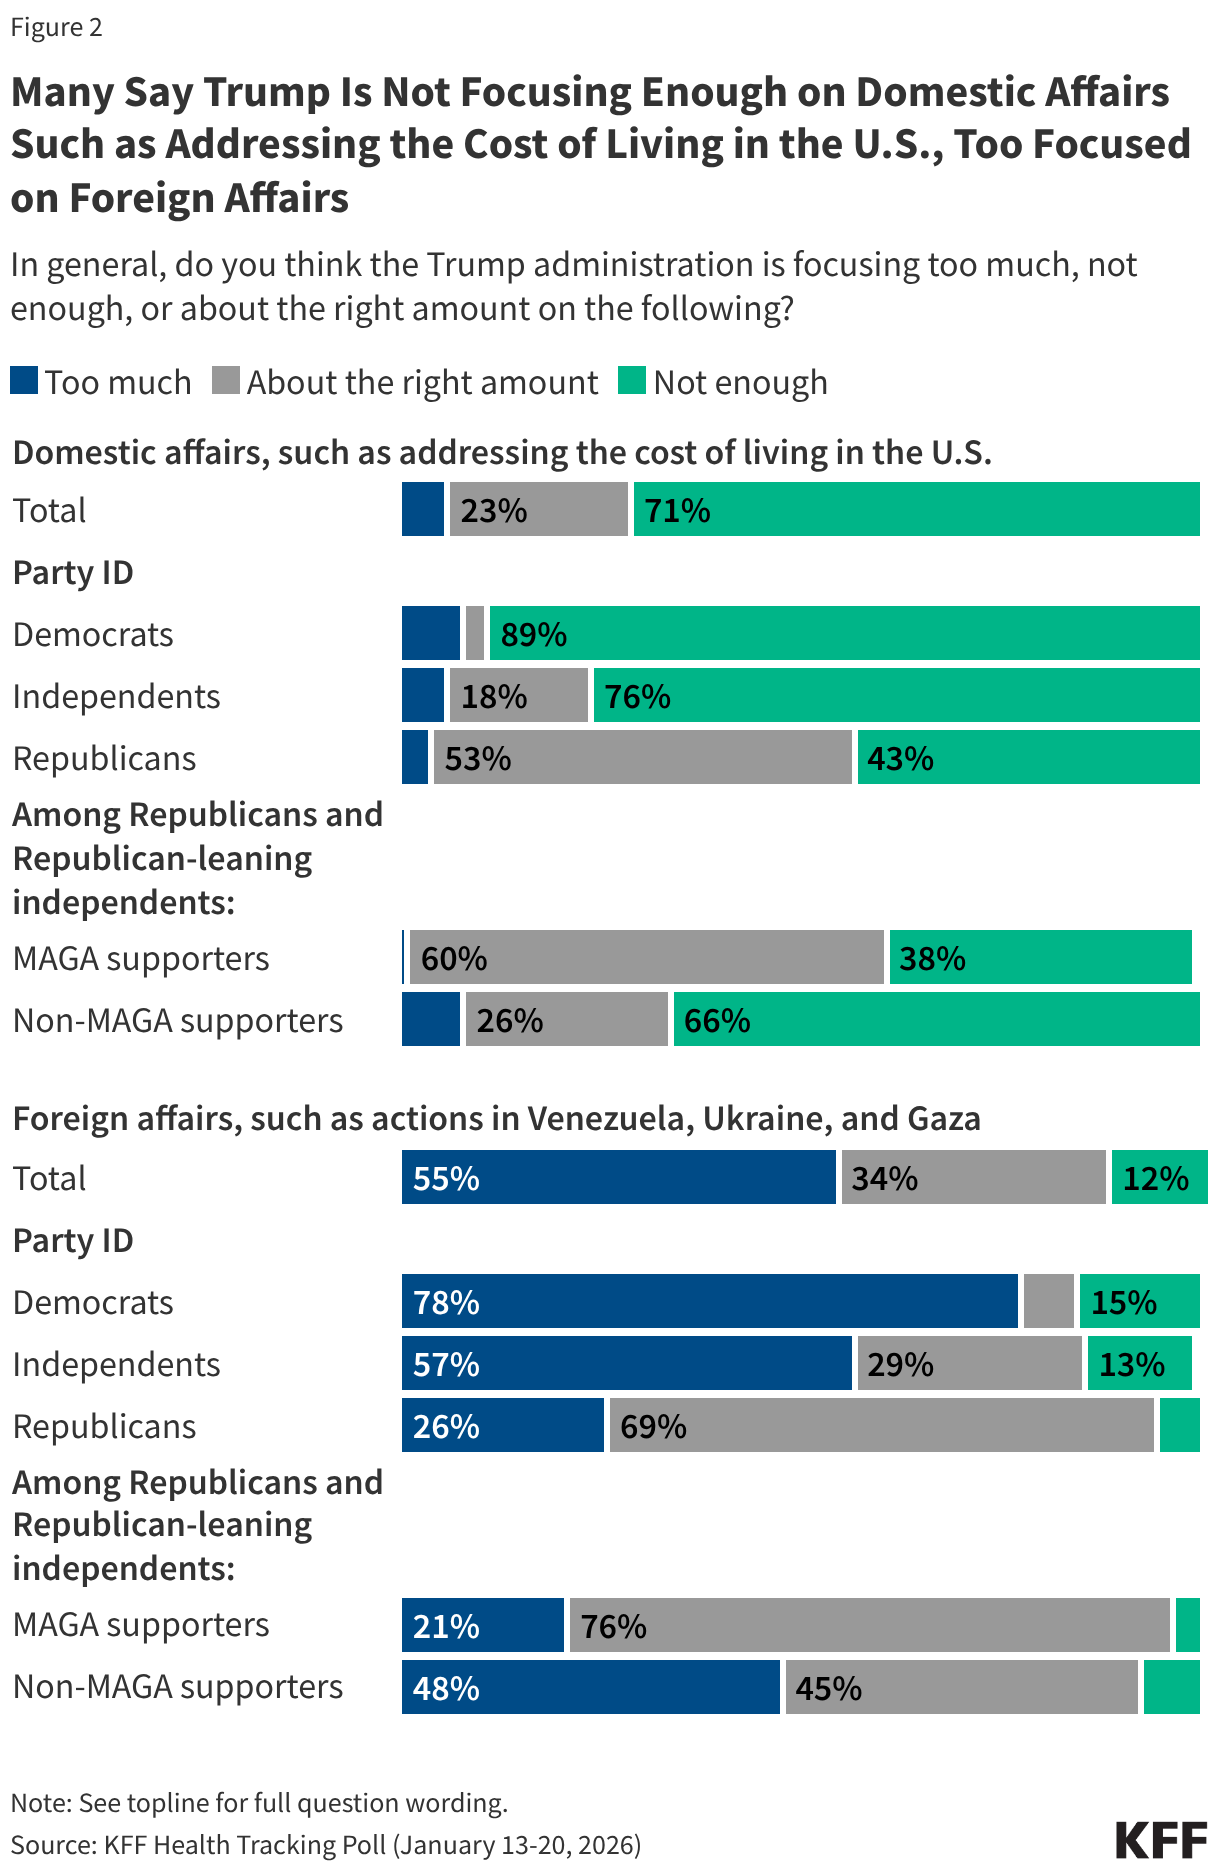
Concerns about household spending coincide with a majority (71%) of the public saying President Trump is not focusing enough on domestic affairs, such as addressing the cost of living in the U.S. The share of the public who say President Trump is not paying enough attention to domestic concerns rises to about nine in ten (89%) Democrats and three-quarters of (76%) independents. On the other hand, a majority of the public (55%) also say the Trump administration is focusing “too much” on foreign affairs, such as actions in Venezuela, Ukraine, and Gaza. Republicans and MAGA supporters are more positive about President Trump’s priorities, with many saying he is spending the “right amount” on both domestic affairs (53% and 60%), and foreign affairs (66% and 76%).
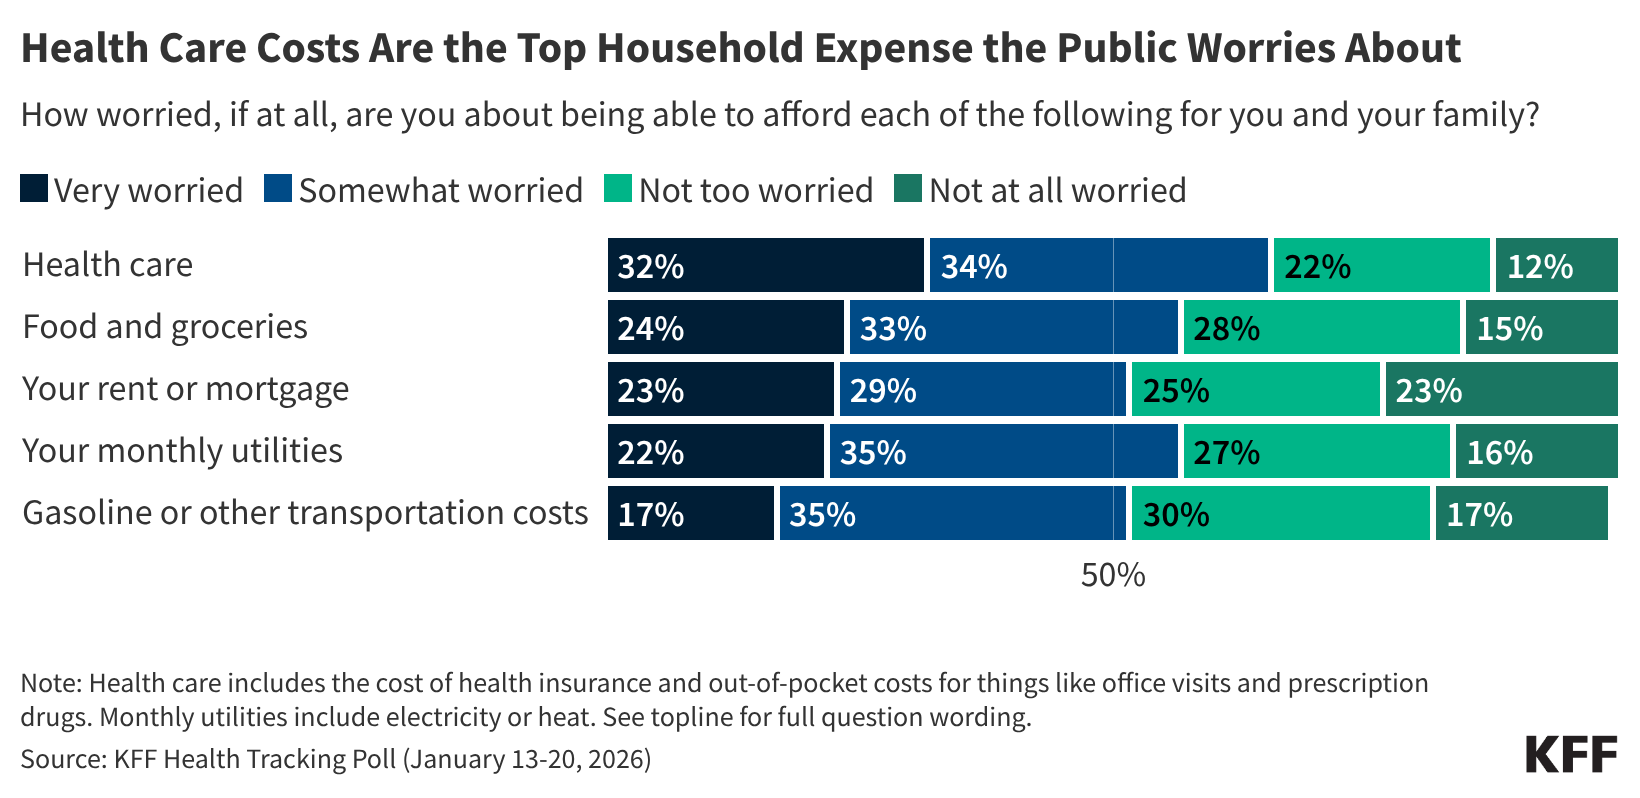
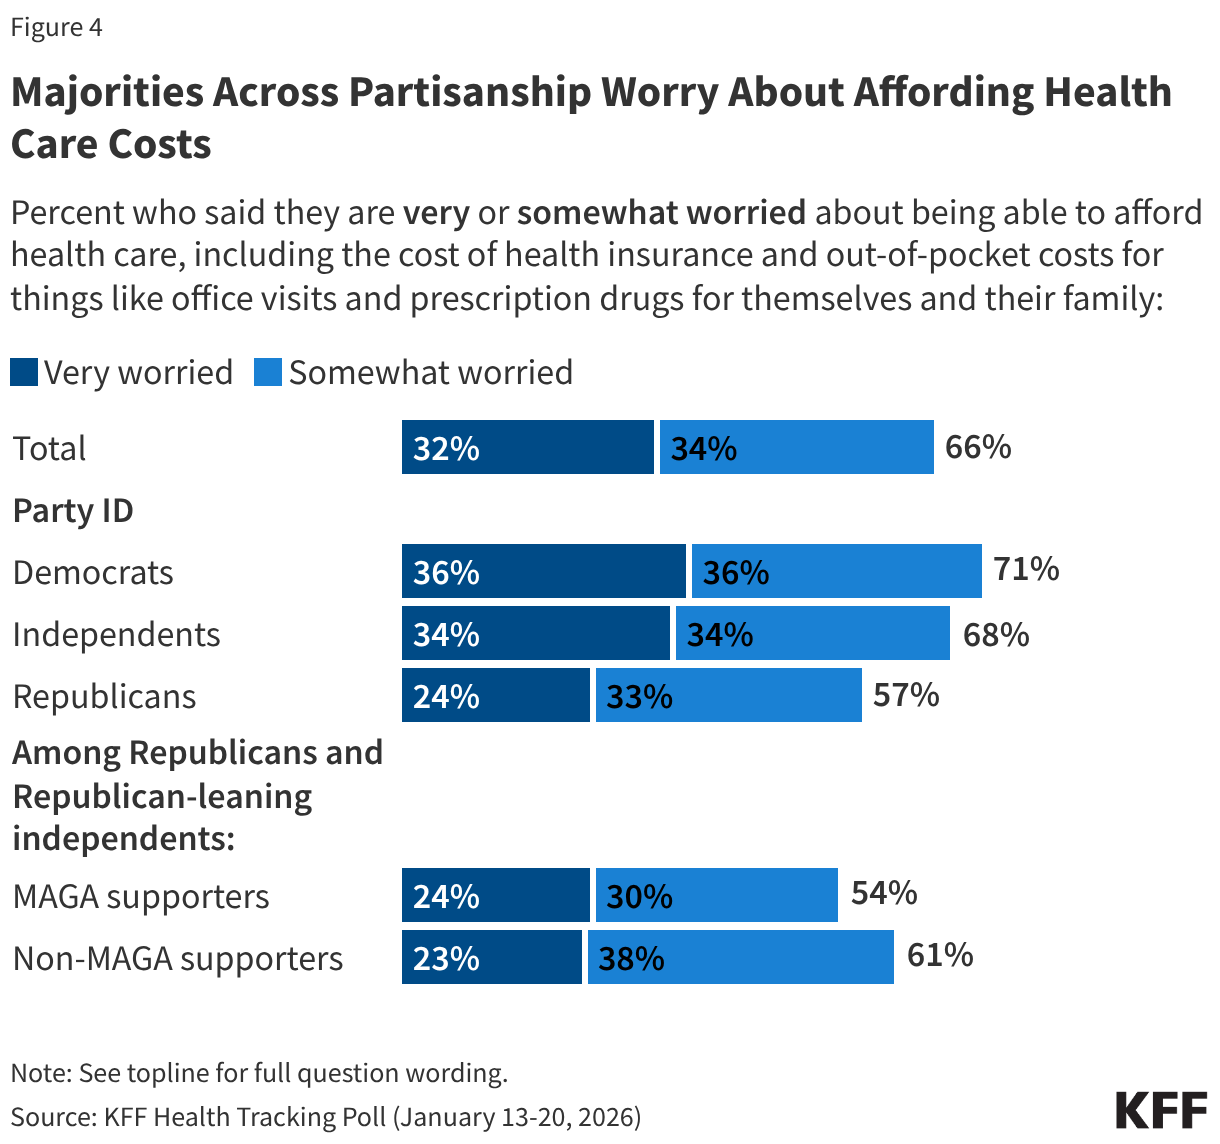
The latest KFF Health Tracking Poll finds health care costs top the list of what the public worries about being able to afford for themselves and their family. Two-thirds (66%) of the public say they worry about paying for health care, including the cost of health insurance and out-of-pocket costs for things like office visits and prescription drugs, ranking higher as a financial worry than other household expenses like utilities, food, and rent or mortgage – all three items on which a majority of Americans are still worried about being able to afford. About a third of adults (32%) say they are “very worried” about affording health care expenses, while about a quarter of adults say the same about being able to afford food and groceries (24%), their rent or mortgage (23%), or utilities (22%). About a fifth of adults say they are “very worried” about affording gas and transportation costs (17%). This comes as recent reports show that health care costs are on the rise for most Americans and the Affordable Care Act (ACA) enhanced tax credits, which benefitted most people who purchased insurance through the marketplace, have expired.
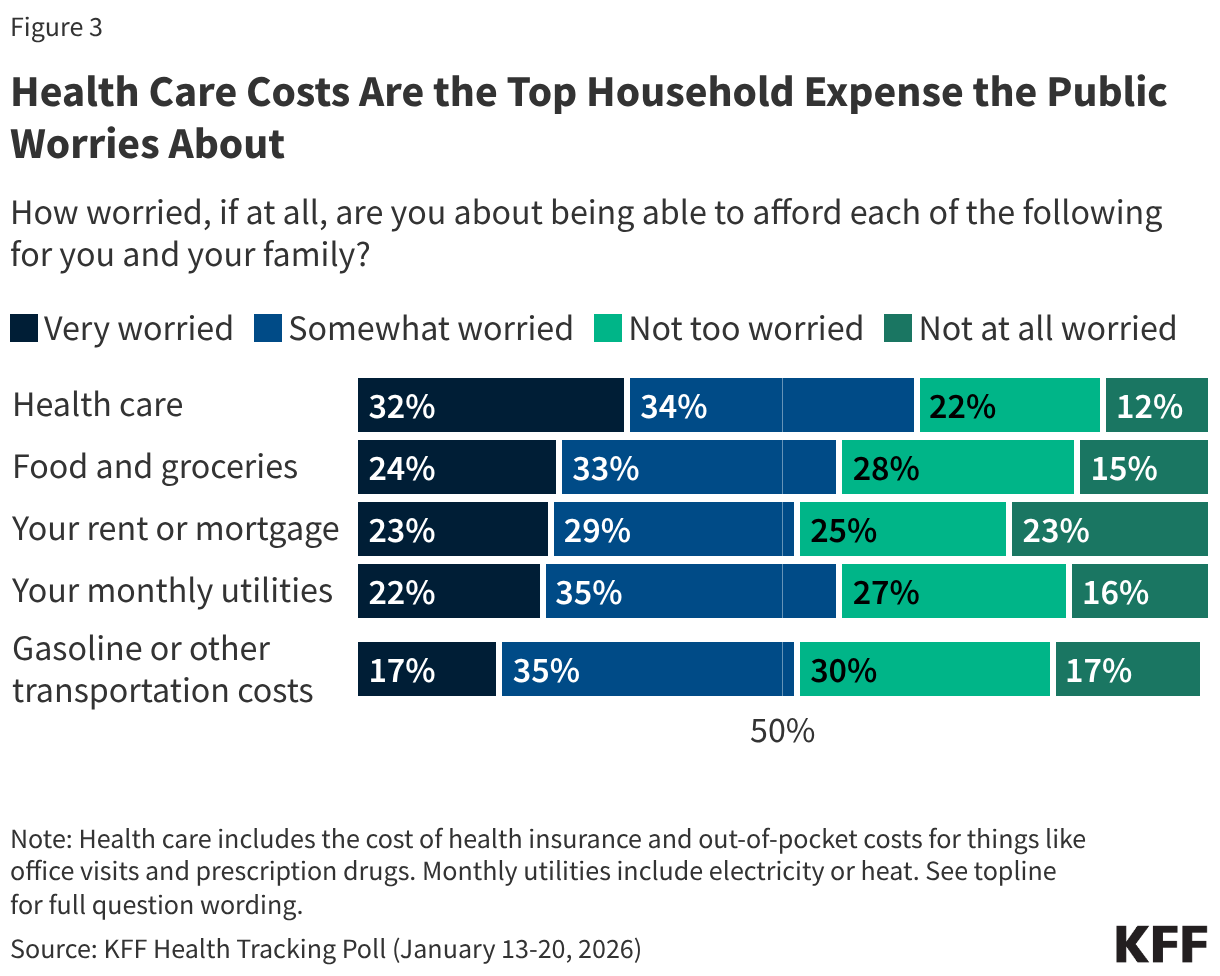
Notably, health care costs are the biggest worry compared to other household expenses for all adults, regardless of partisanship. About one third of Democrats (36%) and Independents (34%) say they are “very” worried about affording health care, as are about one in four (24%) Republicans. This includes one in four MAGA Republicans (23%) and non-MAGA Republicans (24%).
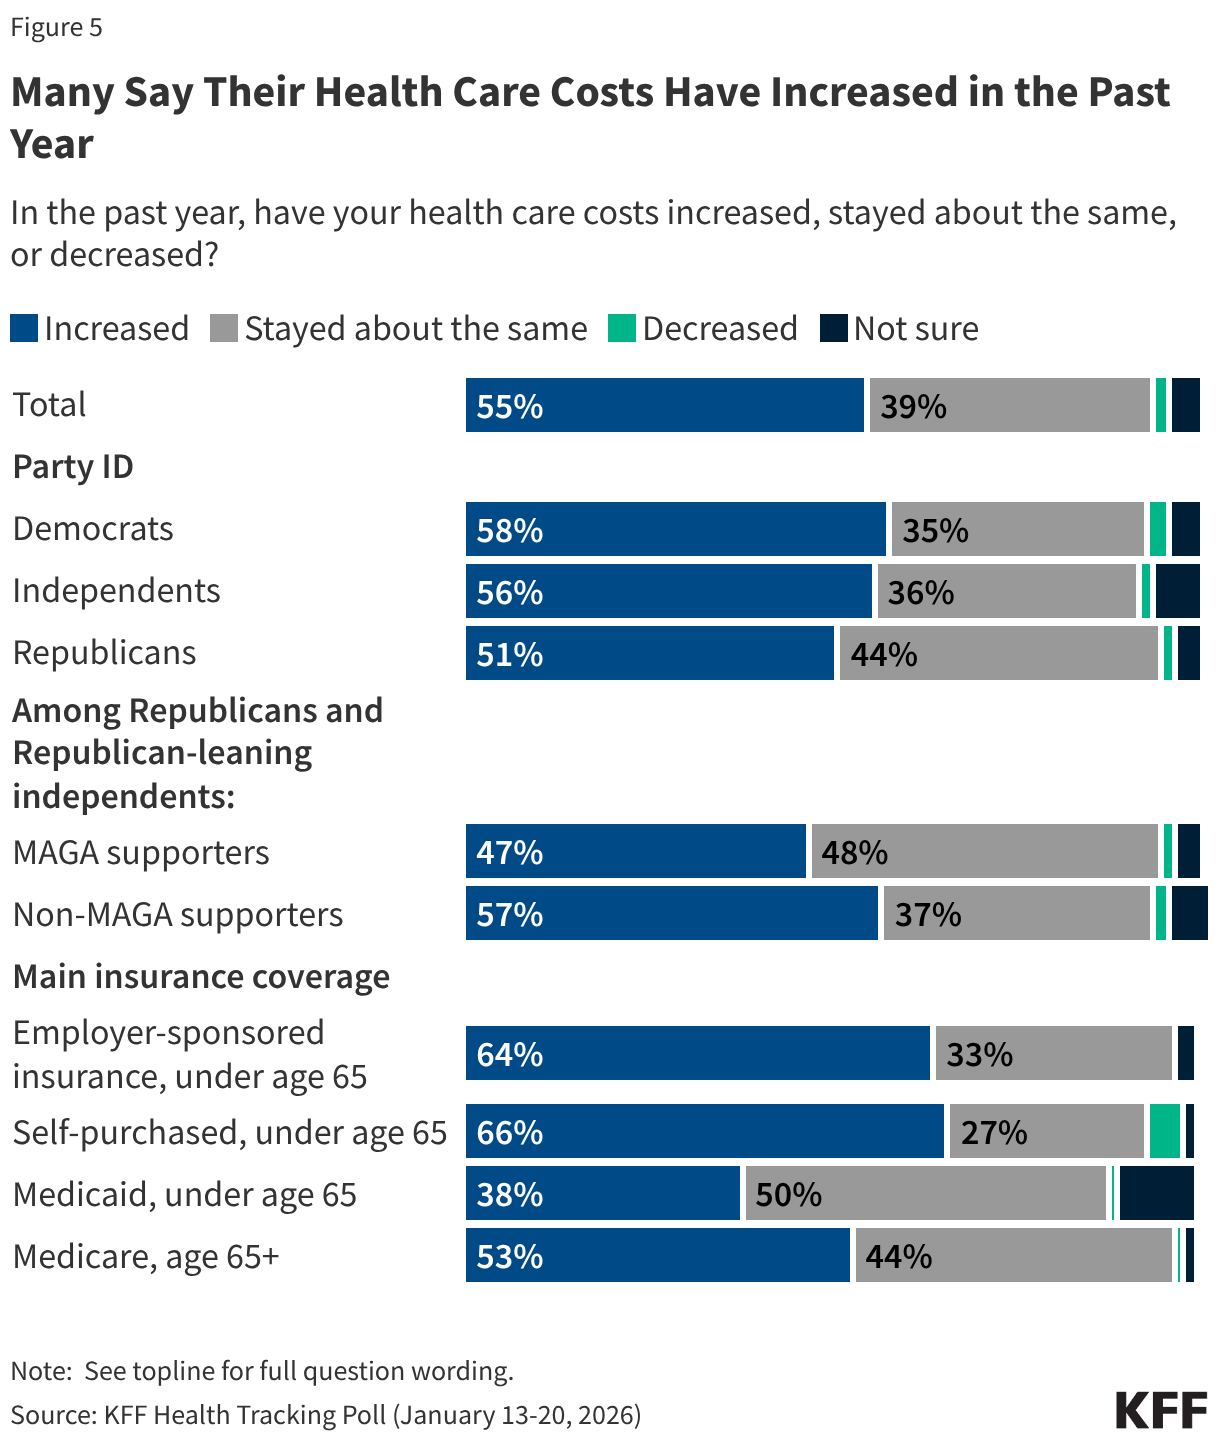
One reason why health care expenses may be topping the list of household worries is that most adults say their health care costs have increased in the past year, including a substantial share who say these costs have increased at a faster rate than other household expenses.
Overall, more than half (55%) of adults say their health care costs have increased in the past year. This includes about two-thirds of people with employer-based health insurance (64%) and those who purchase their own coverage (66%), as well as about half (53%) of Medicare enrollees 65 and older. Perceptions about the increase of health care costs persist across partisanship, with about half or more across partisans saying their health care costs have increased in the past year, including 58% of Democrats, 56% of independents, and 51% of Republicans, including 47% of MAGA Republicans.
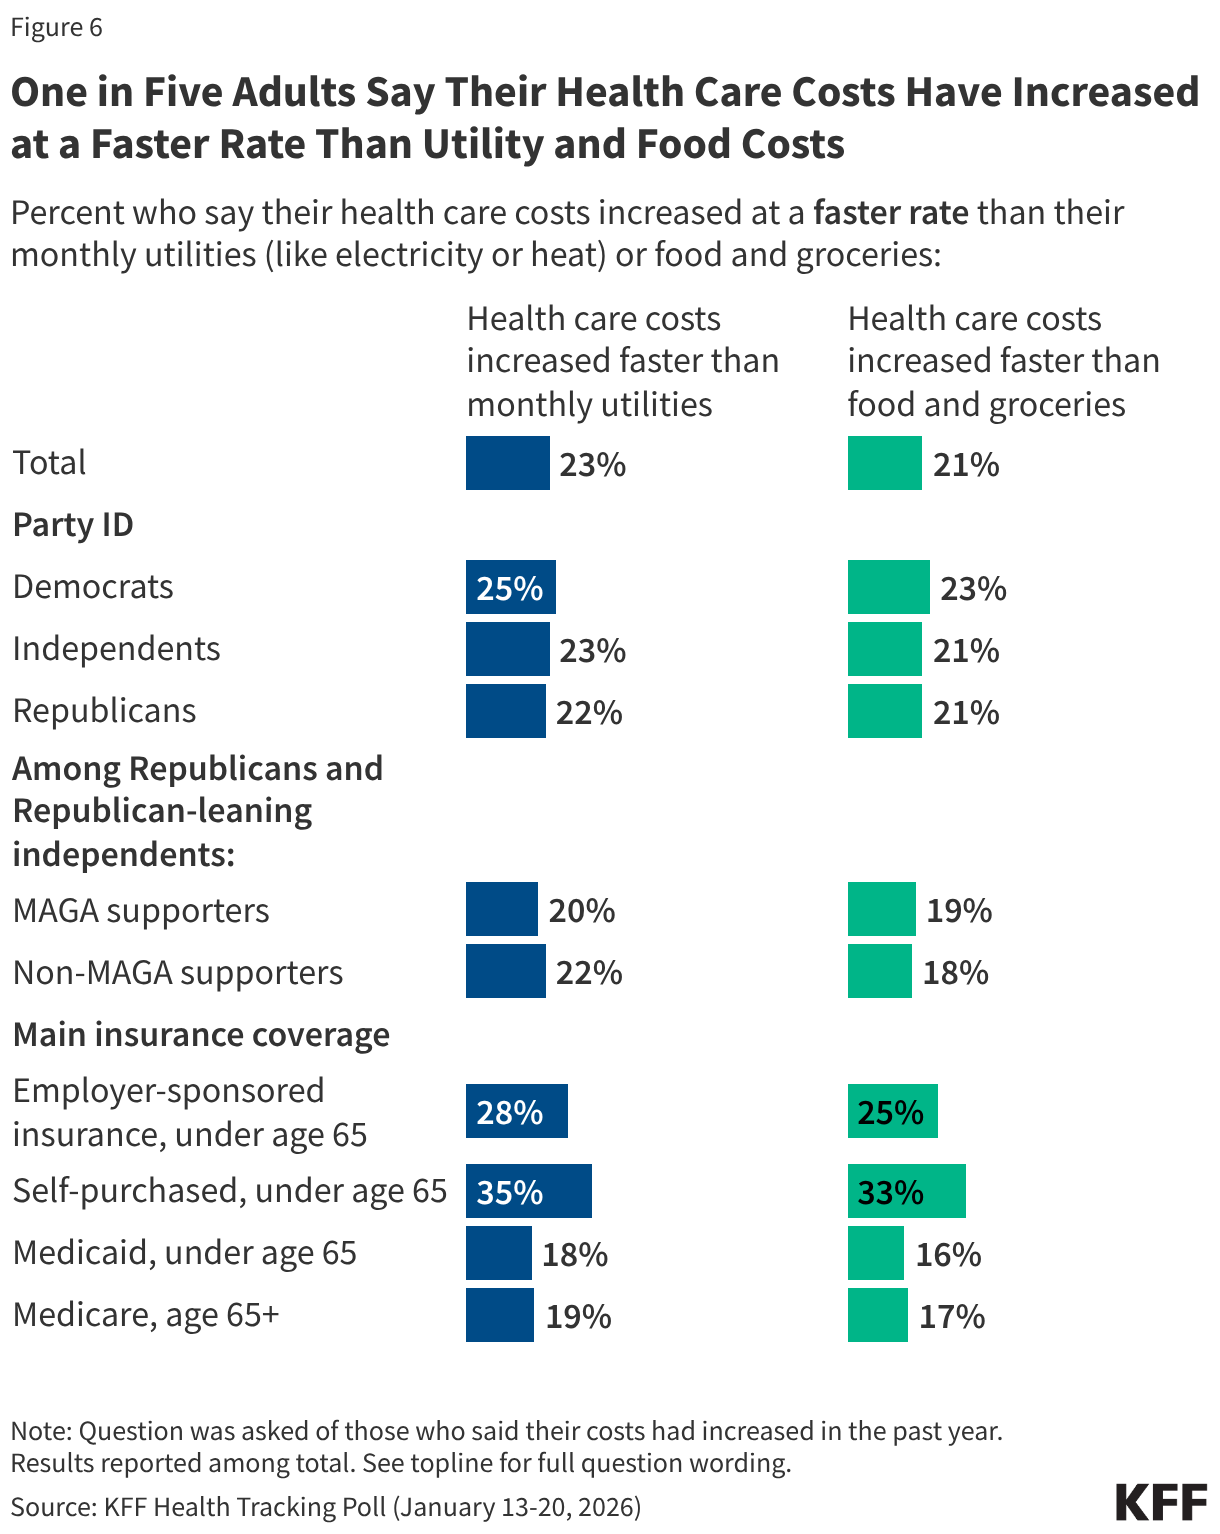
Notably, about one in five of all adults say their health care costs have increased at a faster rate than other necessities like utilities (23%) and food and groceries (21%). This includes similar shares among partisans and MAGA supporters, as well as at least one in four with employer-sponsored insurance and about a third who purchase their own insurance. Smaller shares of adults who receive health insurance through Medicaid and Medicare say their health care costs have increased at a faster rate than utilities and food and groceries, suggesting those with government coverage are more insulated from the rising cost of health care.
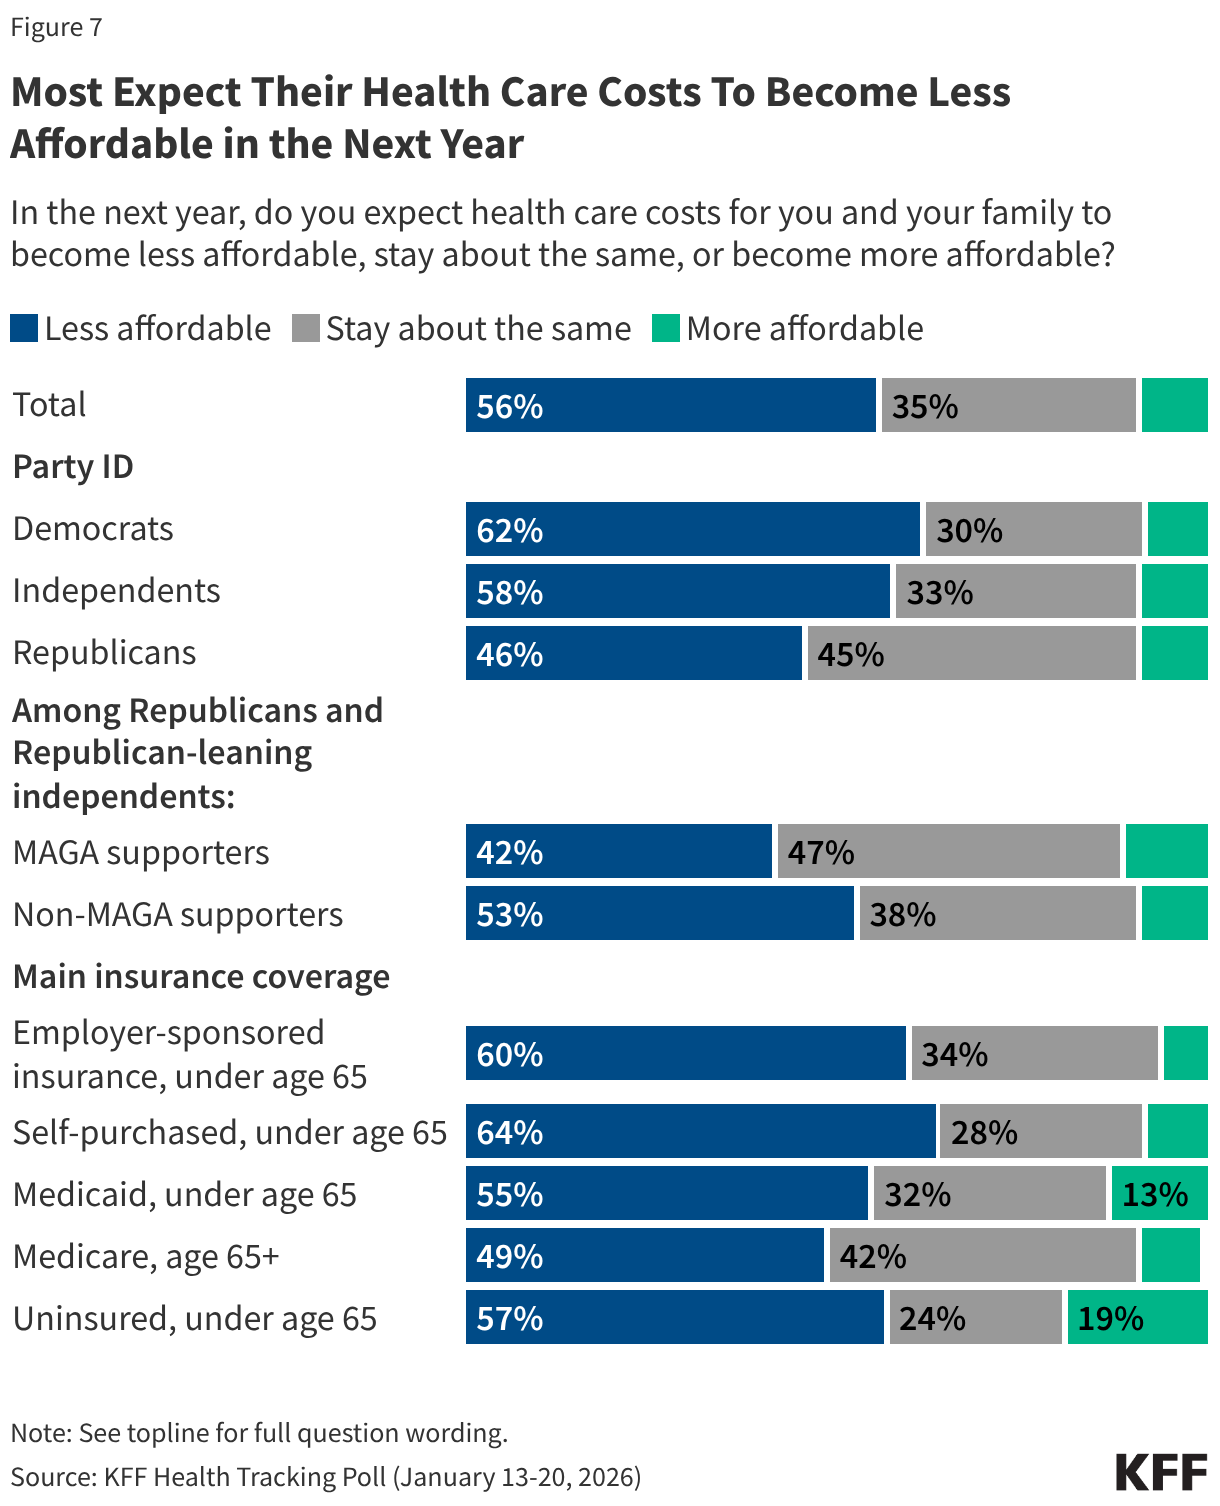
Looking ahead to the next year, a majority (56%) of adults expect their family’s health care costs to become less affordable, while about a third (35%) expect them to stay about the same, and one in ten (9%) expect them to be more affordable. Most Democrats (62%) and independents (58%) expect health care costs to become less affordable, while Republicans, including those who identify as MAGA Republicans are split, with similar shares saying they expect them to become less affordable or expect them to say about the same. Majorities across insurance types expect their health care costs to become less affordable. This includes two-thirds of those who self-purchase (64%) or have employer-sponsored insurance (60%) and majorities of those who are uninsured (57%) or who have coverage through Medicaid (55%).
Democrats Have an Advantage on Health Care Issues, But No Party Has an Advantage on the Cost of Living
With health care costs on the rise and a significant source of worry for many, a majority of voters, regardless of partisanship, say the issue will play a role in their voting decisions. The cost of health care is a particularly strong motivator for Democratic voters, of whom more than eight in ten say it will impact their decision to vote and who they will vote for, including two-thirds who say it will have a “major impact.” The cost of health care is a similarly large motivator for independents, of whom about eight in ten say it will impact their vote, including more than four in ten who say it will have a “major impact.” While Democratic and independent voters are more likely to say health care costs are a strong motivator compared to Republican voters, substantial shares of Republican voters say it will impact their decisions in November as well. Six in ten (60%) Republican voters say it will impact their decision to vote and 56% say it will impact which party’s candidate they will vote for. This includes about a fifth of Republican voters who say the cost of health care will have a “major impact.” This suggests that rising health care costs resonate with voters across the board and will be a key voting issue to watch for in this November’s elections.
Less than ten months before the 2026 midterm elections, the Democratic Party has a strong edge over the Republican Party when it comes to health care issues, including on the cost of health care. Democrats have a double-digit advantage over the Republicans when it comes to who voters trust on determining the future of Medicaid (43% vs. 25%), addressing the future of the ACA (42% vs. 26%), determining the future of Medicare (40% vs. 26%), and addressing the cost of health care (40% vs. 27%). Voters are more divided on which party they trust to address the cost of prescription drugs, an issue that President Trump has focused on during his second term. Notably, on every health care issue asked about, at least a quarter of voters say they trust neither party to do a better job.
Unsurprisingly, on each health care issue polled, Democratic voters are more likely to say they trust the Democratic Party and Republican voters are more likely to say they trust the Republican Party. Among independent voters, the Democratic Party has a clear advantage over the Republican Party on each of the health care issues; however, sizeable shares of independent voters (between about one-third and four in ten) say they trust “neither” party. When it comes to addressing the cost of prescription drugs, a larger share of independent voters say they trust “neither party” than say they trust either the Democrats or the Republicans.
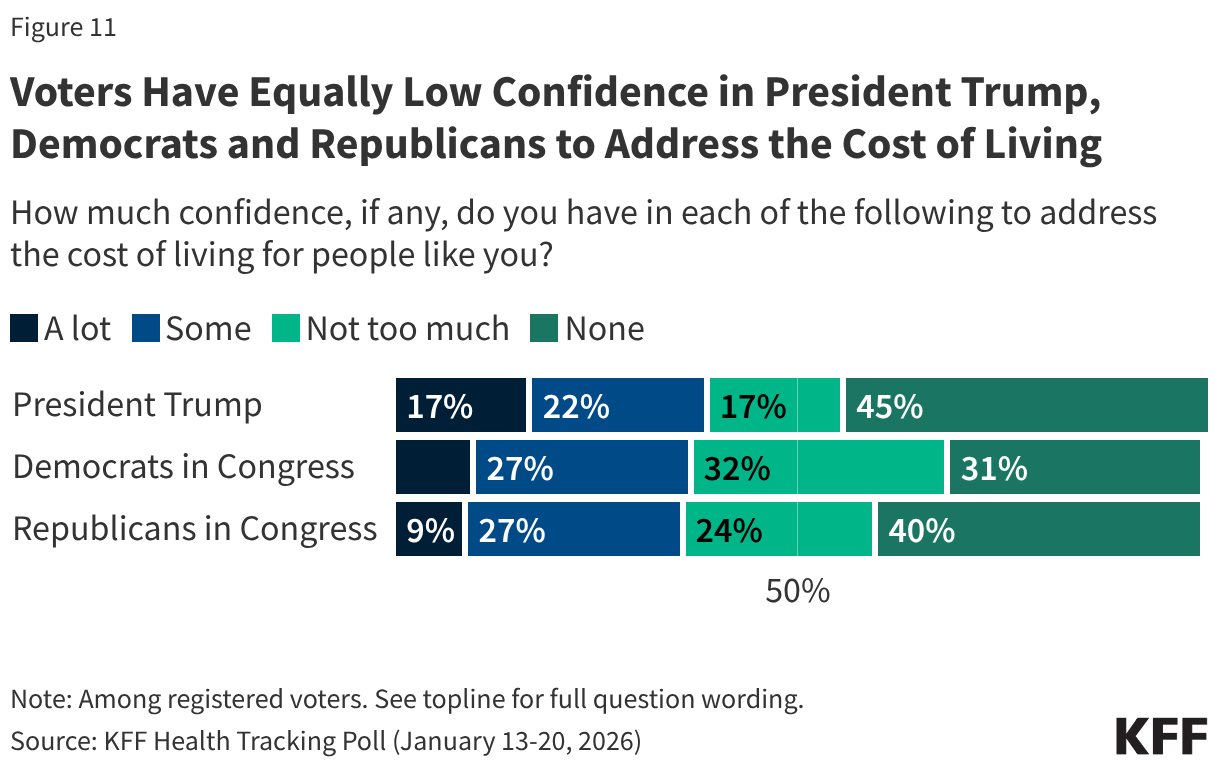
While the Democrats have an advantage among voters overall on health care issues, voter confidence is low when it comes to both political parties and President Trump to address the cost of living. Most voters say they have “not too much” confidence or “none” in the Republicans in Congress (64%), the Democrats in Congress (63%), and President Trump (61%), to address the cost of living for people like them. Small and similar shares of voters overall say they have “a lot” or “some” confidence in President Trump (38%), Democrats in Congress (37%), or Republicans in Congress (36%) to address the cost of living.
Amid the ACA Tax Credits Debate, Favorability of the ACA and ACA Marketplace Remains High, but Has Declined Among Republicans
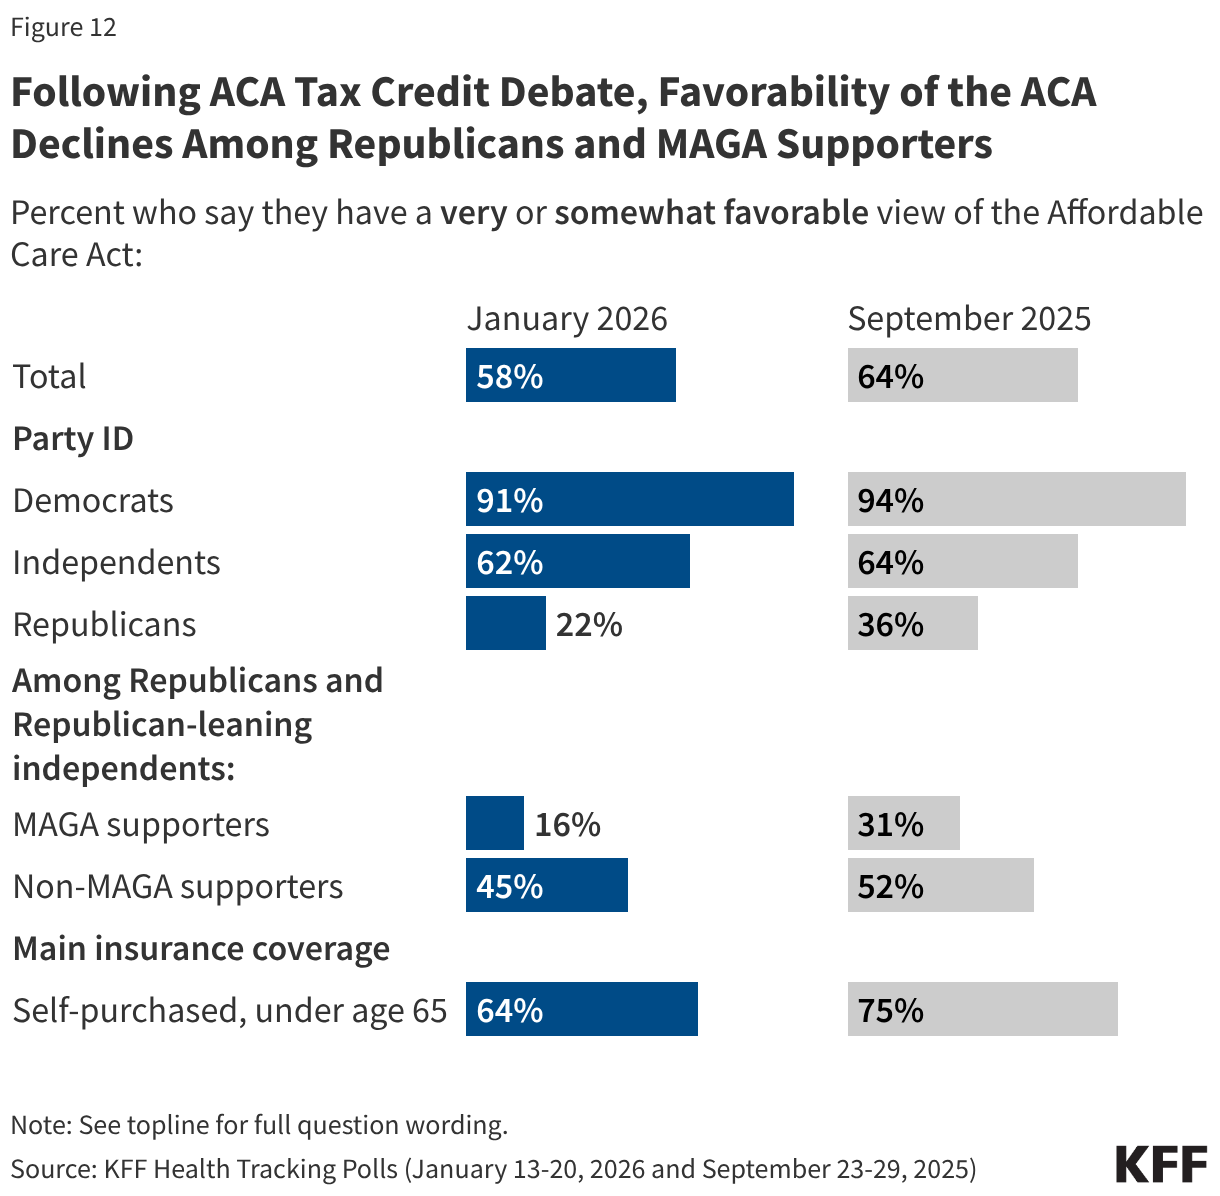
While a majority of the public continues to express a favorable view of the ACA, Republicans’ views have soured recently in the wake of the debate over extending the enhanced tax credits and Republican lawmakers’ persistent attacks on the 2010 health care law. Overall favorability of the ACA has dropped in the most recent poll, with 58% now saying they have a favorable view of the law and 41% saying they have an unfavorable view (down from 64% favorable, 35% unfavorable in September 2025). The overall decline in favorability of the ACA is driven by Republicans, of whom one in five (22%) now say they have a “very” or “somewhat” favorable view, compared to one-third (36%) who said the same in September. Views of the ACA remain positive and stable among Democrats (91%) and independents (62%), as well as among individuals who buy their own health coverage (64%).
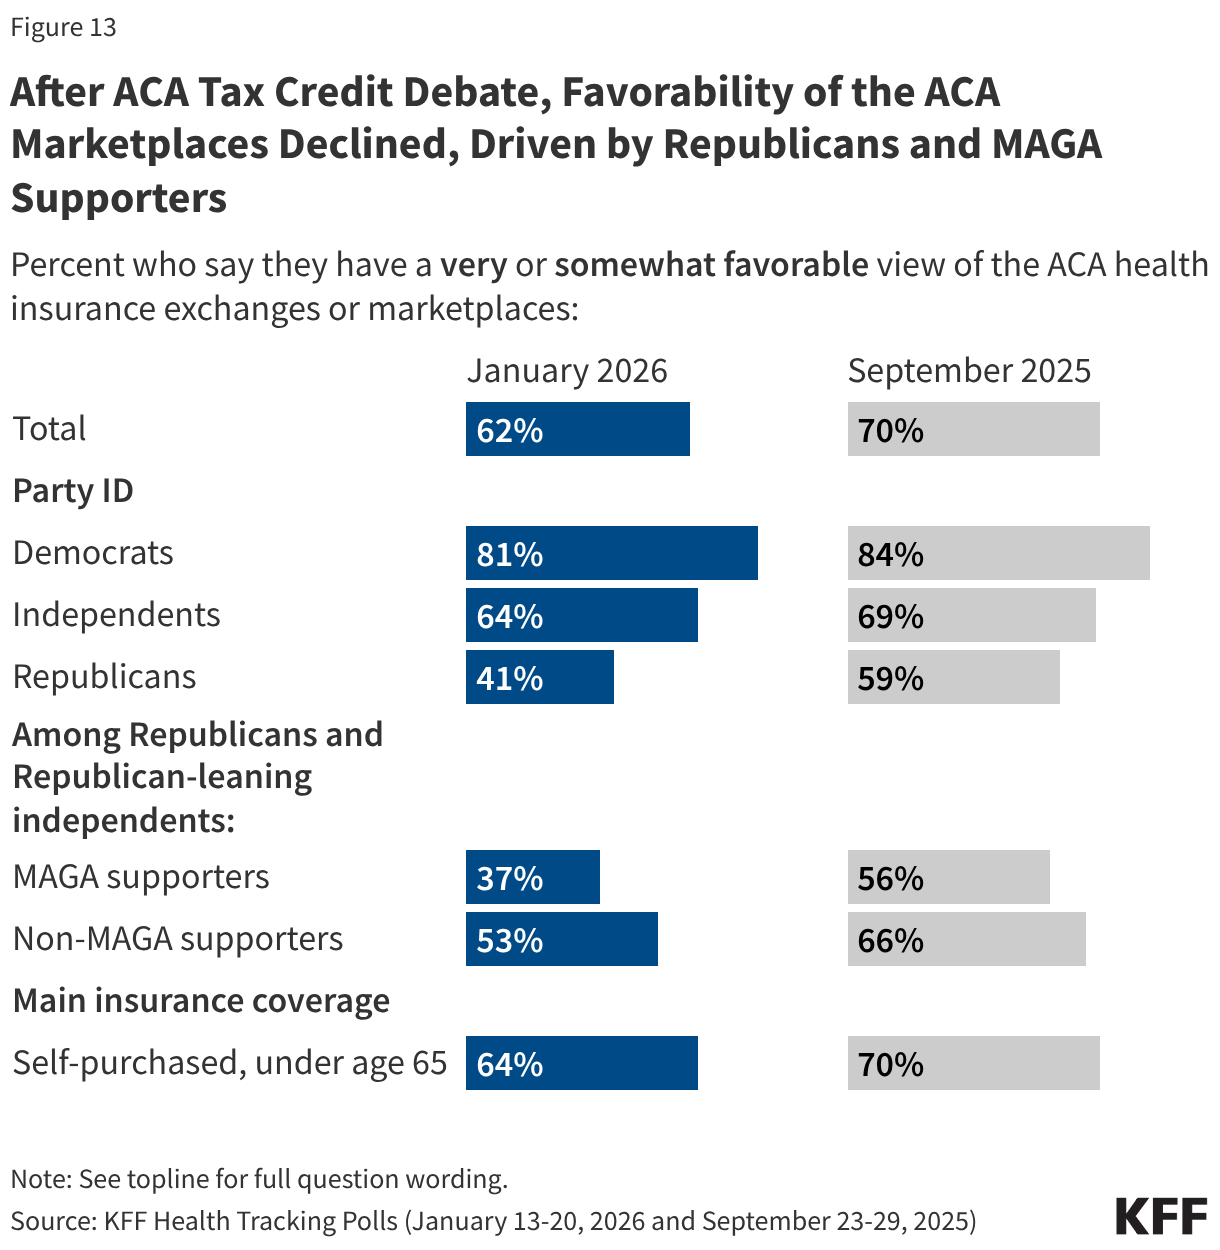
Favorable views of the ACA marketplaces where people and small businesses owners can shop for health insurance have also declined from 70% in September 2025 to 62% in the latest KFF Health Tracking Poll. Similarly to views of the ACA overall, this shift is driven by Republicans (41% now vs. 59% in September 2025 who said they view the marketplace favorably). Views of the ACA marketplaces are stable and favorable among Democrats (81%), independents (64%), and among those who self-purchase their insurance (64%).
Most Say Congress Did the “Wrong Thing” Not Extending the ACA Tax Credits
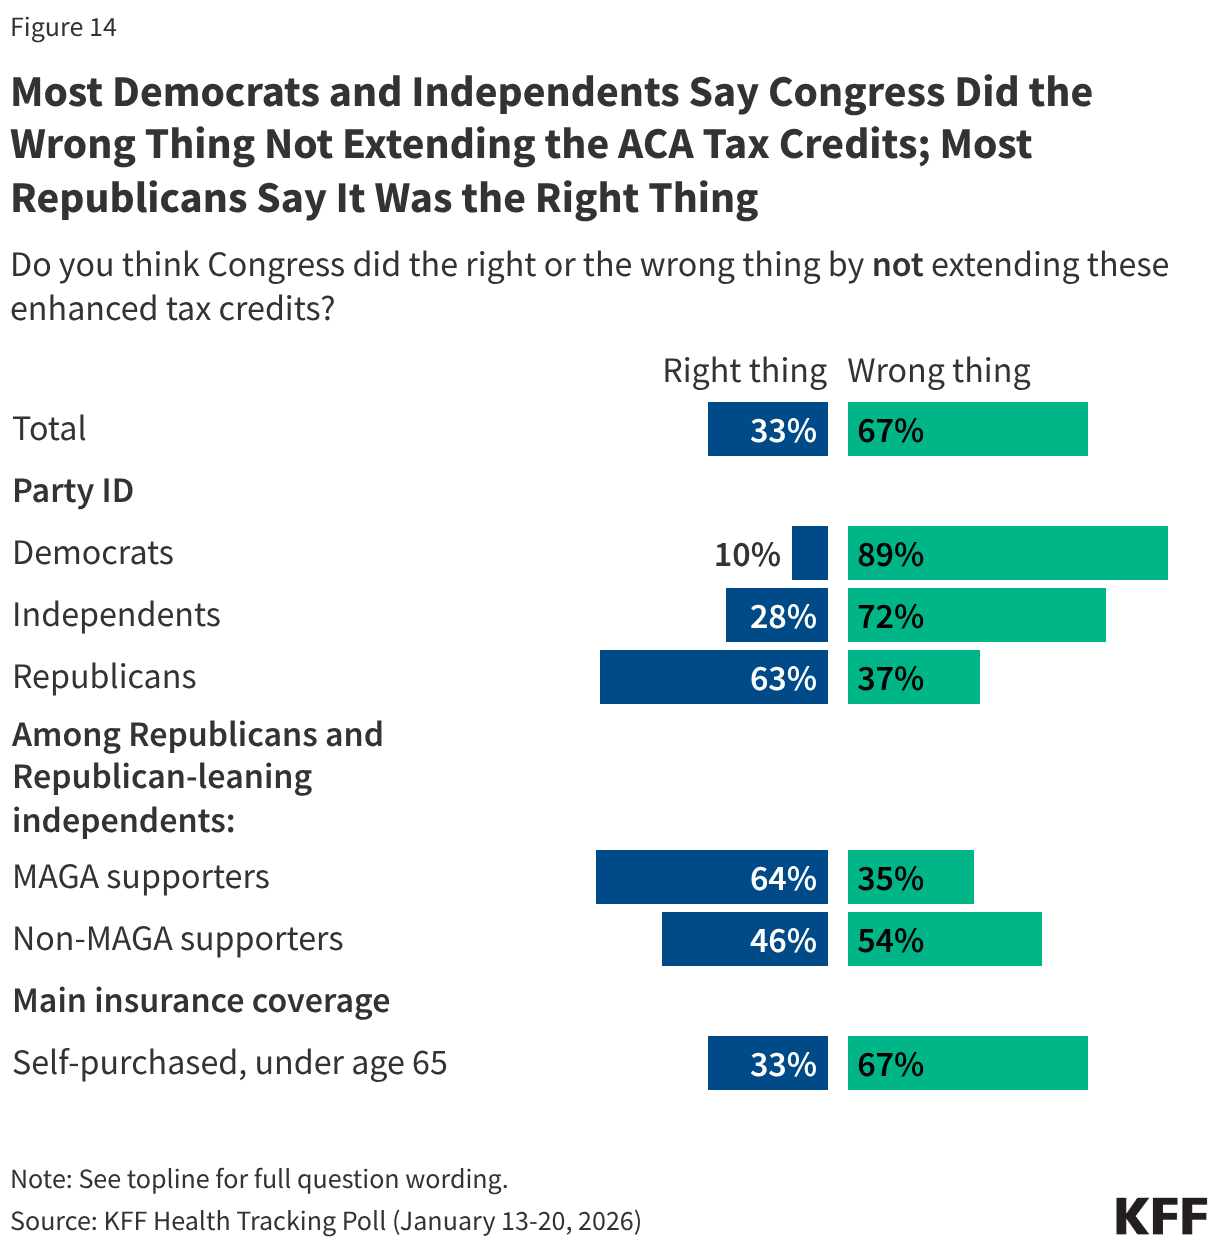
The public is largely critical of Congress not extending the ACA enhanced tax credits for people who buy their own health coverage. Two-thirds of the public say Congress did the “wrong thing” by not extending the ACA enhanced tax credits, compared to one-third who say Congress did the “right thing.” Majorities of Democrats (89%), independents (72%), non-MAGA Republicans (54%), and those who purchase their insurance themselves (67%) say Congress did the “wrong thing” by not extending the tax credits. While most (63%) Republicans say Congress did the “right thing” by not extending the tax credits, a sizeable share, about four in ten (37%), say Congress did the “wrong thing.” This marks a shift in views from when debates over to extend the tax credits or not were still ongoing in November, when half of Republicans said Congress should extend the tax credits, suggesting the debates have shifted opinion among the Republican base.
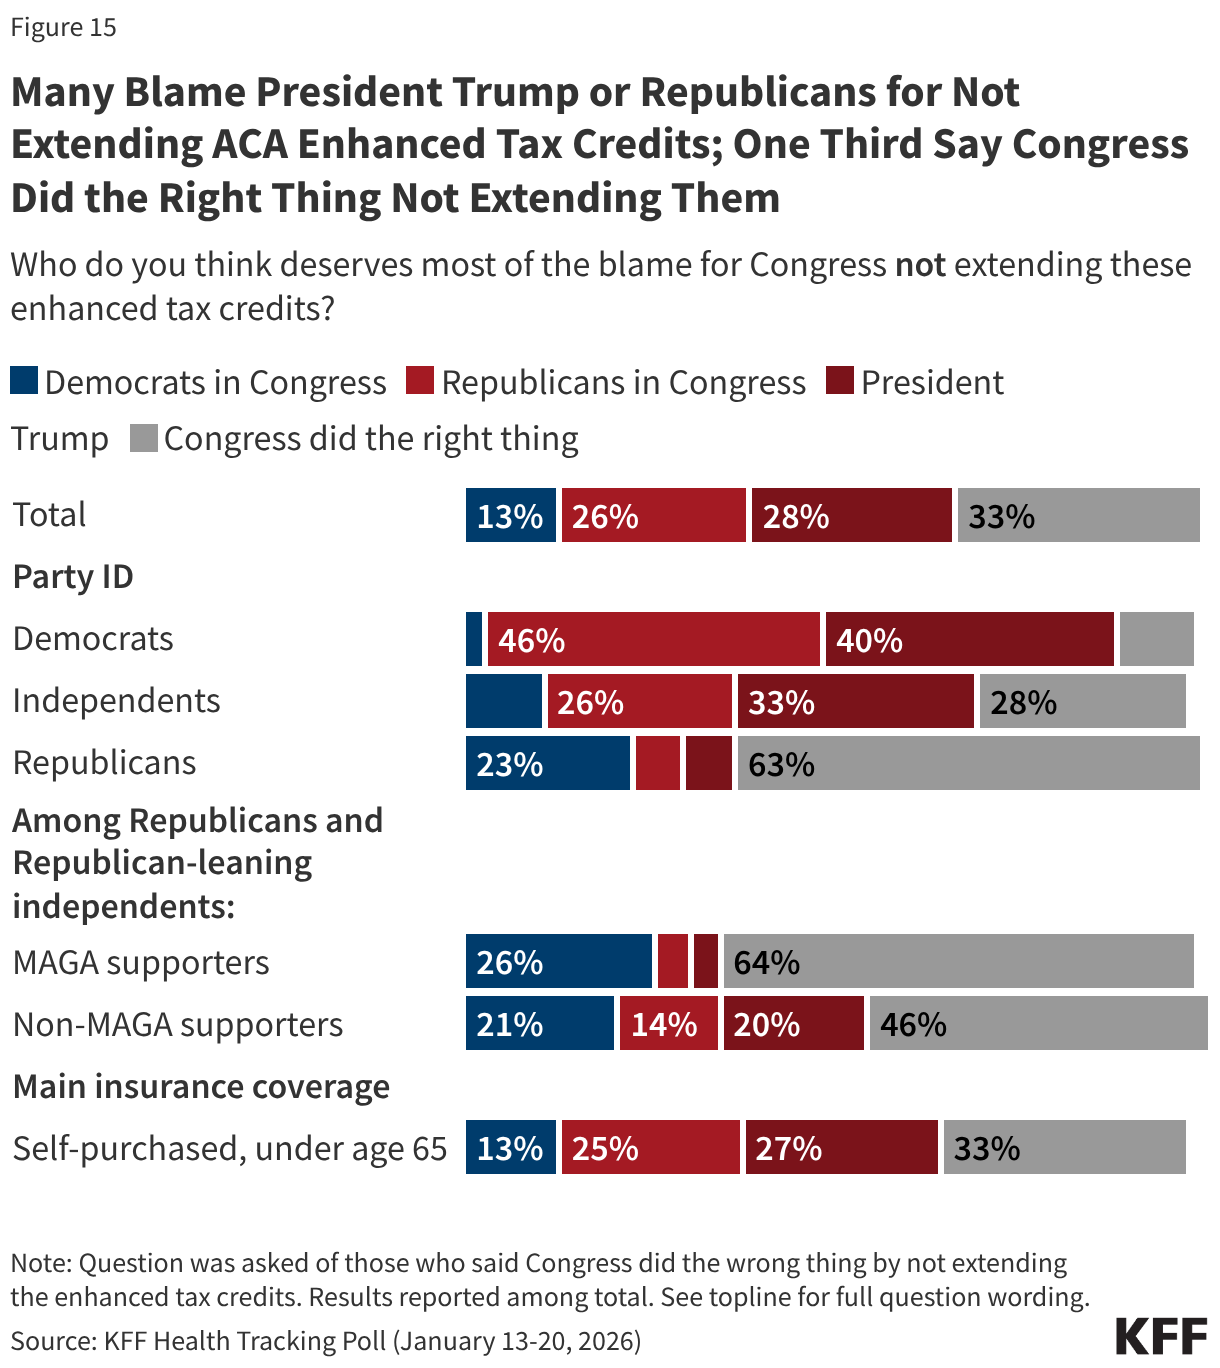
Among those who think the enhanced tax credits should have been extended, a group that leans more Democratic, many say most of the blame either falls on President Trump (42%, 28% of total adults) or Republicans in Congress (38%, or 26% of total adults). About one in five (19%, or 13% of total adults) say Democrats in Congress deserve the most blame. Among the four in ten Republicans who say Congress did the “wrong thing” not extending the tax credits, two-thirds (64%) blame Democrats in Congress for their expiration, rising to seven in ten (72%) MAGA-supporters.
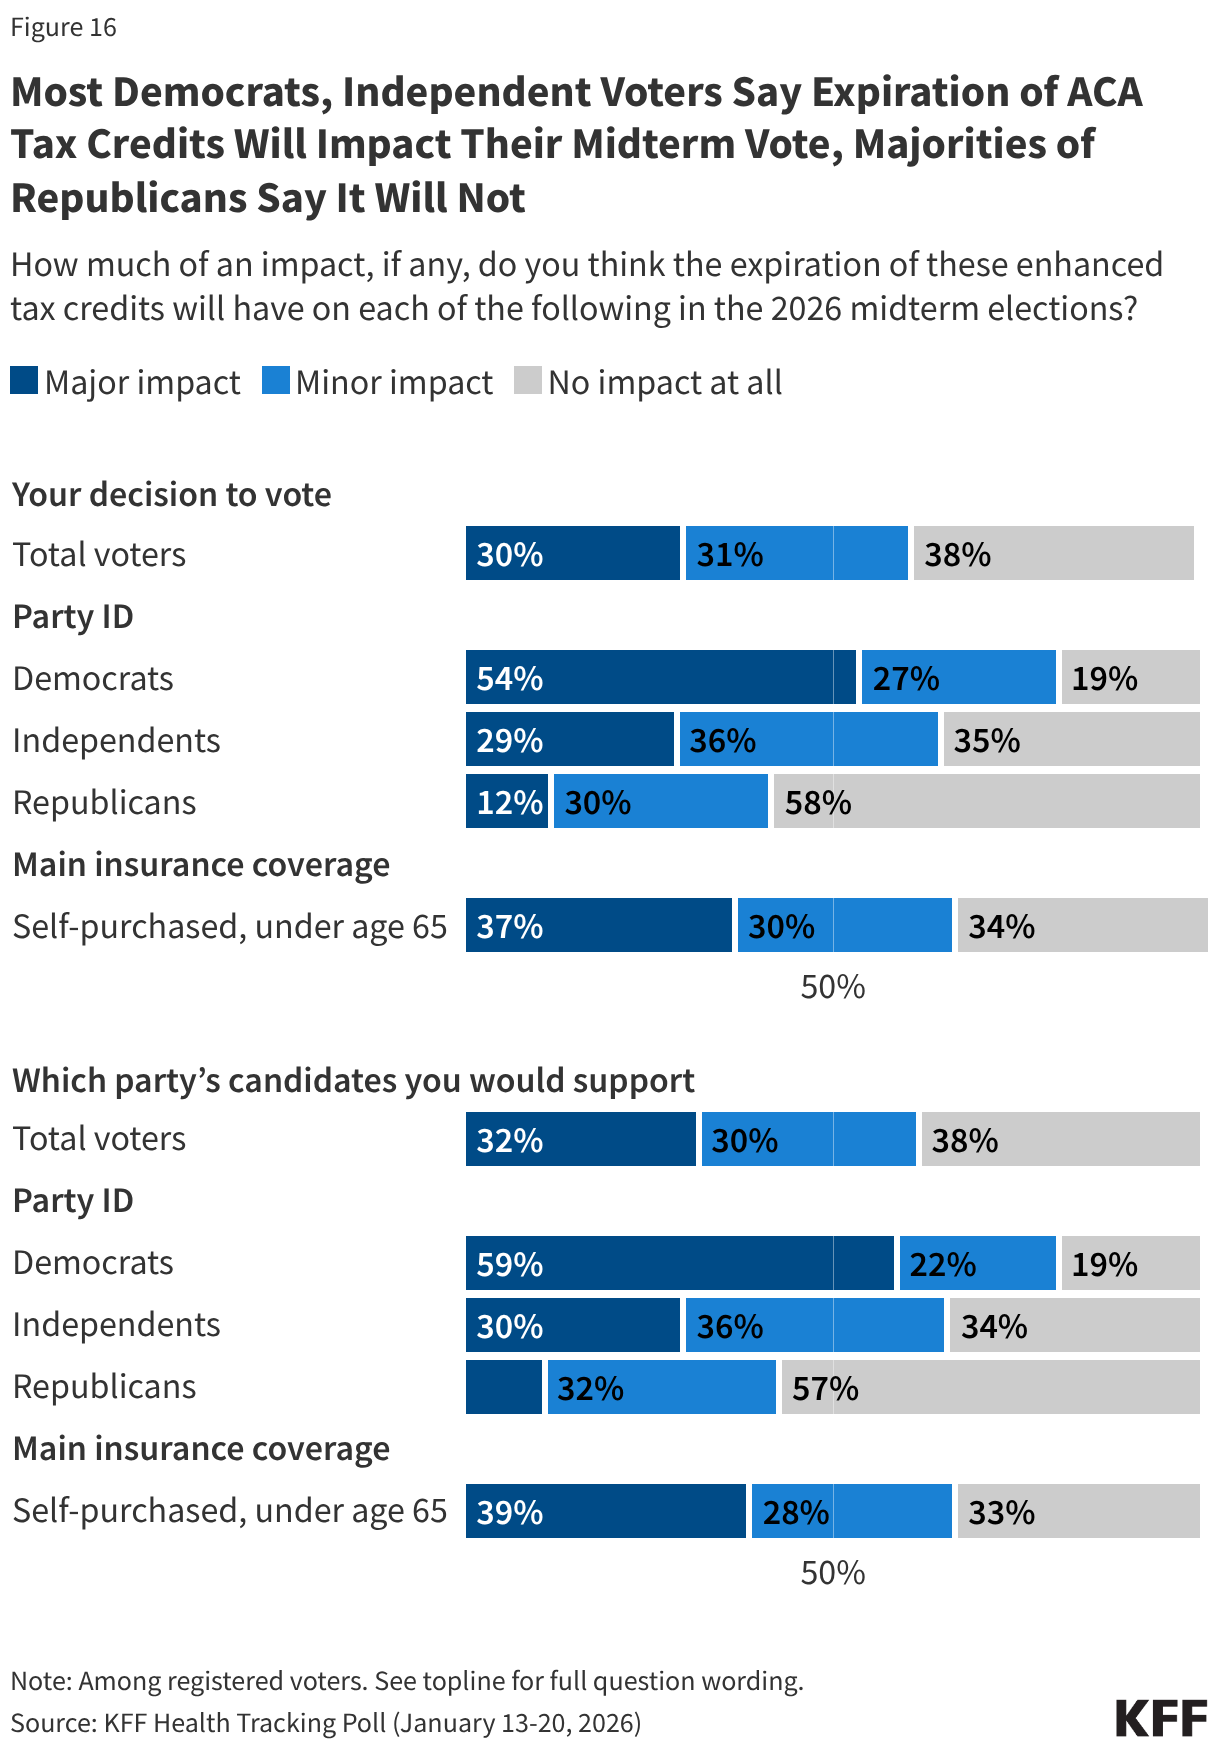
There are some indications that the expiration of the enhanced tax credits will play a role in how voters make decisions in the coming November election. Among those who self-purchase their insurance, two-thirds say it will impact their decision to vote (66%) and which party’s candidate they will vote for (67%) in the upcoming election. And although the expiring enhanced premium tax credits directly affect only those who purchase their own coverage on the ACA marketplaces, among voters overall, six in ten (62%) say their expiration will have an impact on their decision to vote, including 30% who say it will have a “major impact” and 31% who say it will have a “minor impact.” An additional four in ten (38%) voters say it will have “no impact at all” on their decision to vote. The expiration of the tax credits is a stronger motivator for Democratic voters and independent voters than for Republican voters. About eight in ten Democratic and two-thirds of independent voters say it will impact their voting behavior, compared to about four in ten Republican voters.
Methodology
This KFF Health Tracking Poll/KFF Tracking Poll on Health Information and Trust was designed and analyzed by public opinion researchers at KFF. The survey was conducted January 13-20, 2026, online and by telephone among a nationally representative sample of 1,426 U.S. adults in English (n=1,355) and in Spanish (n=71). The sample includes 1,028 adults (n=60 in Spanish) reached through the SSRS Opinion Panel either online (n= 1,003) or over the phone (n=25). The SSRS Opinion Panel is a nationally representative probability-based panel where panel members are recruited randomly in one of two ways: (a) Through invitations mailed to respondents randomly sampled from an Address-Based Sample (ABS) provided by Marketing Systems Groups (MSG) through the U.S. Postal Service’s Computerized Delivery Sequence (CDS); (b) from a dual-frame random digit dial (RDD) sample provided by MSG. For the online panel component, invitations were sent to panel members by email followed by up to three reminder emails.
Another 398 (n=11 in Spanish) adults were reached through random digit dial telephone sample of prepaid cell phone numbers obtained through MSG. Phone numbers used for the prepaid cell phone component were randomly generated from a cell phone sampling frame with disproportionate stratification aimed at reaching Hispanic and non-Hispanic Black respondents. Stratification was based on incidence of the race/ethnicity groups within each frame. Among this prepaid cell phone component, 149 were interviewed by phone and 249 were invited to the web survey via short message service (SMS).
Respondents in the prepaid cell phone sample who were interviewed by phone received a $15 incentive via a check received by mail or an electronic gift card incentive. Respondents in the prepaid cell phone sample reached via SMS received a $10 electronic gift card incentive. SSRS Opinion Panel respondents received a $5 electronic gift card incentive (some harder-to-reach groups received a $10 electronic gift card). In order to ensure data quality, cases were removed if they failed two or more quality checks: (1) attention check questions in the online version of the questionnaire, (2) had over 30% item non-response, or (3) had a length less than one quarter of the mean length by mode. Based on this criterion, 2 cases was removed.
The combined cell phone and panel samples were weighted to match the sample’s demographics to the national U.S. adult population using data from the Census Bureau’s 2025 Current Population Survey (CPS), September 2023 Volunteering and Civic Life Supplement data from the CPS, and the 2025 KFF Benchmarking Survey with ABS and prepaid cell phone samples. The demographic variables included in weighting for the general population sample are gender, age, education, race/ethnicity, region, civic engagement, frequency of internet use and political party identification. The weights account for differences in the probability of selection for each sample type (prepaid cell phone and panel). This includes adjustment for the sample design and geographic stratification of the cell phone sample, within household probability of selection, and the design of the panel-recruitment procedure.
The margin of sampling error including the design effect for the full sample is plus or minus 3 percentage points. Numbers of respondents and margins of sampling error for key subgroups are shown in the table below. For results based on other subgroups, the margin of sampling error may be higher. Sample sizes and margins of sampling error for other subgroups are available on request. Sampling error is only one of many potential sources of error and there may be other unmeasured error in this or any other public opinion poll. KFF public opinion and survey research is a charter member of the Transparency Initiative of the American Association for Public Opinion Research.
| Group | N (unweighted) | M.O.S.E. |
|---|---|---|
| Total | 1,426 | ± 3 percentage points |
| Party ID | ||
| Democrats | 473 | ± 6 percentage points |
| Independents | 483 | ± 6 percentage points |
| Republicans | 367 | ± 6 percentage points |
| MAGA Republicans/Rep leaners | 352 | ± 6 percentage points |
| MAHA supporters | 618 | ± 5 percentage points |
| Parents or guardians of children under 18 living in their household | 436 | ± 6 percentage points |