Financing Family Planning Services for Low-income Women: The Role of Public Programs

Published: Oct 25, 2019

Issue Brief

For more than 50 years, a network of public programs and providers have assisted millions of low-income women of childbearing age in the U.S. to obtain sexual and reproductive health services. Medicaid, the Title X Family Planning Program, and Section 330 of the Public Health Service Act (PHSA) provide critical support to more than 10,000 safety-net clinics across the country that provide reproductive health services to low-income women, men, and teens. Since the 2016 election, state and federal efforts to restrict public funding to Planned Parenthood and other abortion providers and to funnel new federal funds to faith-based providers who oppose contraceptives and abortion have gained traction and begun to shift the family planning landscape across the nation.

One in three low-income women in the US relies on a clinic, either a health center, Planned Parenthood or other publicly-funded clinic to get contraception (Figure 1). These providers also offer STI screening and treatment services, and other preventive care and for some women are the sole source of their medical care. Medicaid, Title X, and other federal and government programs are critical sources of funding for these clinic-based providers. Poor women are more likely to experience an unintended pregnancy, have an abortion, contract a sexually transmitted infection (STI) and have less access to care than higher income women. In 2017, approximately 30% (21 million) of reproductive-age women lived in households that earned less than 200% of the federal poverty level ($40,840 for a family of three).

Figure 1: One in Three Low-Income Women Who Use Birth Control Obtain It From a Safety-Net Clinic

Major Public Programs for Financing Family Planning Services for Low-Income People

Medicaid –Health coverage program that covers more than 70 million low-income individuals. Operated jointly by federal and state governments, all beneficiaries have coverage for family planning services, and according to federal statute, may see the participating provider of their choice. Medicaid is the largest funding source for public family planning services.

Title X – The nation’s only federal program specifically dedicated to supporting the delivery of family planning care. The program provides funds to approximately 4,000 clinics across the nation to support the delivery of family planning services to low-income individuals.

Section 330 Grants – Provides core support to the nation’s Federally Qualified Health Centers (FQHCs), the largest system of clinics providing primary care services to poor and underserved patients. All FQHCs provide some family planning care within their network.

Over the past three years, policy changes at the state and federal level in Medicaid and Title X have restricted providers from receiving federal and state funds if they provide abortion services in addition to family planning care. This brief reviews the role of these public programs and providers in financing care and enabling access to family planning services. It also addresses the impact of actions taken by President Trump and Congress to block federal funds from Planned Parenthood and other entities that provide abortion.

Medicaid is the Primary Source of Public Funding for Family Planning

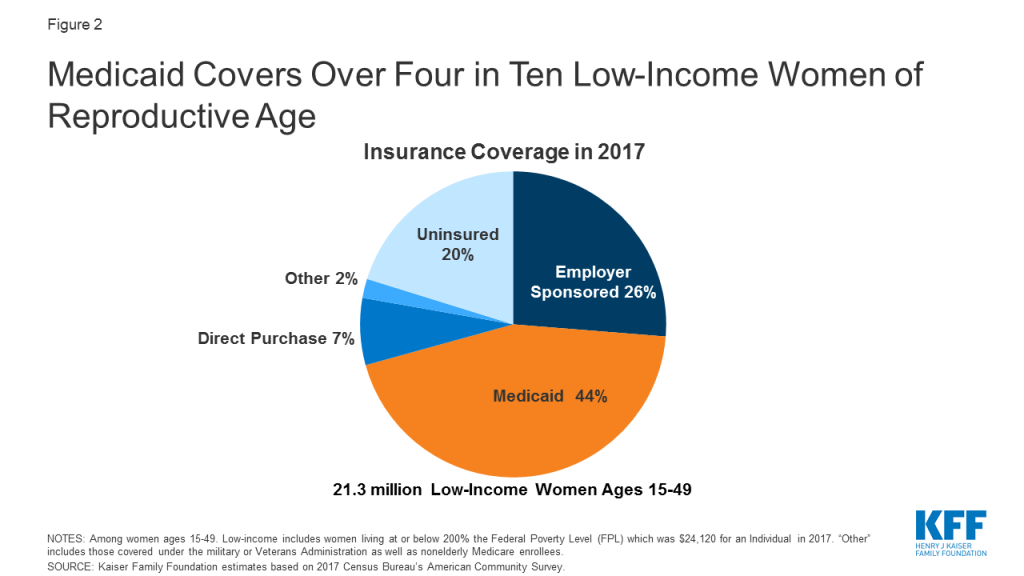
Medicaid, a jointly operated and funded federal/state program, covers more than four in ten (44%) low-income women of reproductive age, the leading source of coverage among this population (Figure 2). Across the nation, the share of low-income reproductive-age women enrolled in Medicaid varies considerably by state. These differences are the result of state choices about Medicaid eligibility, particularly whether the state has expanded Medicaid to all adults up to 138% FPL as permitted by the ACA and state-established income eligibility thresholds for parents in the non-expansion states. Coverage rates range from a high of 71% of reproductive age women in Vermont to a low of 22% in Utah (Appendix Table 1). In 2014, the most recent year in which national enrollment data is available, 19.1 million reproductive-age women were enrolled in the program. For these women, Medicaid provides comprehensive affordable coverage to help meet the full range of their health care needs, and guarantees that they will not have any out of pocket costs for family planning services and pregnancy-related care.

Figure 2: Medicaid Covers Over Four in Ten Low-Income Women of Reproductive Age

Medicaid accounted for 75% of all public funds spent on contraceptive services and supplies in 2015. Federal law stipulates that family planning is a “mandatory” benefit that states must cover under Medicaid, but provides states, with considerable discretion in specifying the services and supplies that are included in the program. Most state Medicaid programs make the full range of FDA approved contraceptives available to women, and nearly all cover counseling on STIs and HIV as well as screening for cervical cancer.

Other federal requirements that shape family planning policy under Medicaid include:

  • The federal government pays 90% of all family planning services and supplies, and states pay 10%. This is considerably higher than the federal match that states receive for most other services, which ranges from 50% to 78%, depending on the state.
  • Federal law prohibits cost sharing for any family planning (and pregnancy-related) services.
  • States must allow “any willing provider” to participate in the Medicaid program unless there is “evidence of fraud or criminal action, material non-compliance with relevant requirements, or material issues concerning the fitness of the provider to perform covered services or appropriately bill for them.” While this provision is not specific to family planning, the policy means that states cannot bar providers from the program simply because they provide abortion services.
  • Medicaid beneficiaries have “freedom of choice” to obtain family planning services from any provider participating in the program. For those enrolled in managed care plans, there is an additional protection, ensuring that beneficiaries may seek family planning services even if the provider is outside of the plan’s network.
  • The Hyde Amendment prohibits any federal dollars, including Medicaid reimbursements, from being used to pay for abortions except in cases of rape, incest or life endangerment of the woman. Clinics, including some Planned Parenthood sites, which provide both family planning and abortion services, cannot be reimbursed with federal Medicaid dollars for abortions, but they can be paid for all services including contraceptives, cancer screenings, and STI testing and treatment.
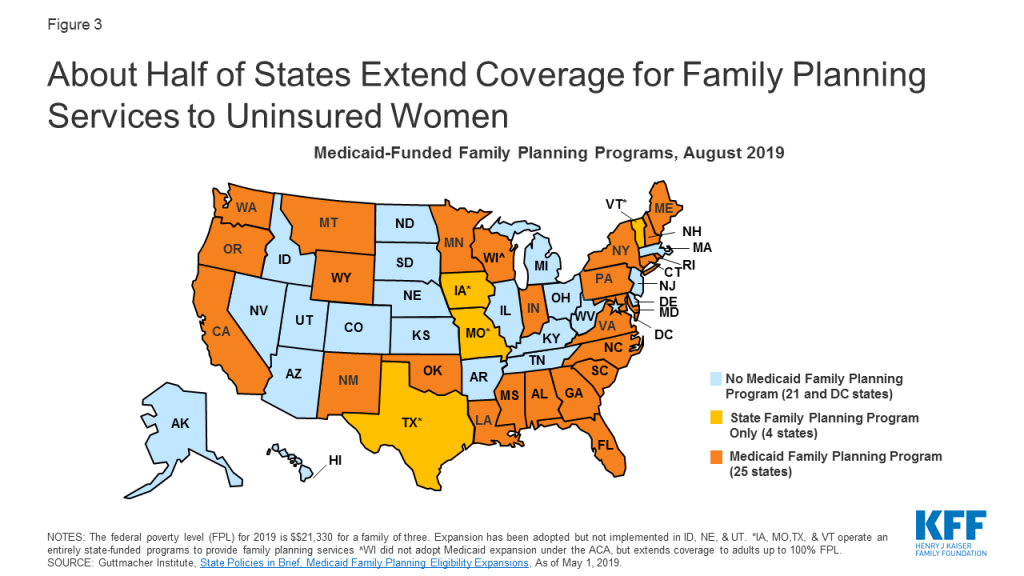
  • States may establish limited scope programs through Medicaid Section 1115 Research and Demonstration Waivers or through State Plan Amendments (SPAs) to provide family planning services to individuals who do not qualify for full-scope Medicaid. Today, more than half of states have established such programs (Figure 3).
Figure 3: About Half of States Extend Coverage for Family Planning Services to Uninsured Women

Title X Funds Support Clinics That Provide Family Planning Services to Low-Income People

The Title X National Family Planning Program, a federal block grant administered by the HHS Office of Population Affairs (OPA), is the only federal program specifically dedicated to supporting the delivery of family planning care. The program funds organizations in each state to distribute federal dollars to safety-net clinics to provide family planning services to low-income, uninsured, and underserved clients. In June of 2019, approximately 4,000 clinics nationwide received Title X funding, including specialized family planning clinics such as Planned Parenthood centers, primary care providers such as federally qualified health centers (FQHCs), and health departments, school-based, faith-based, and other private nonprofits (Appendix Table 2). In 2018, two-thirds (65%) of clients seen at Title X clinics had family incomes at or below the poverty level, 38% were covered by Medicaid or another public program, and four in ten (40%) were uninsured.

Title X grantees must serve low-income populations at low or no cost, and have historically been required to provide clients with a broad range of contraceptive methods as recommended by the national Quality Family Planning Guidelines (QFP), and ensure that the services are voluntary and confidential. In addition to providing clinics with funds to cover the direct costs of family planning services and supplies such as contraceptives, Title X funds enable clinics to pay for patient and community education services about family planning and sexual health issues, as well as infrastructure expenses such as rent, utilities, information technology, and staff salaries. Title X clinics are also eligible to obtain discounted prescription contraceptives and devices through the federal 340B program. No other federal program makes funds available to support clinic infrastructure needs specifically for family planning. In contrast, Medicaid reimburses for specific clinical services.

Signed into law by President Nixon in 1970, the Title X program is currently funded at $285 million. The program budget, however, has not kept pace with medical price inflation over time. Clinics that provide family planning services have a mix of revenue sources, including grant funds from Title X and other programs, reimbursement for patients covered by Medicaid or private insurance, and some out of pocket payments from patients. Title X clinics received 19% of their revenue from the Title X grant, while Medicaid reimbursement accounted for 39% of revenue in 2018.

Over the past decade, the Title X program has experienced significant financial cutbacks due to federal budget reductions and freezes. In addition, some Congressional leaders have questioned the need to continue to fund the program, the types of services that the program can cover and the providers who qualify for funding. In March 2019, the Trump administration published a new regulation that alters the program significantly. In particular, the new rules block the availability of federal funds to family planning providers, such as Planned Parenthood, if they also offer abortion services with non-Title X funds. The regulation also prohibits Title X-funded providers from making referrals to abortion services for pregnant women seeking that care and requires providers that receive Title X support to refer all pregnant women to prenatal care even if a woman wants to terminate the pregnancy.

Currently, the new regulation is in effect, but it has been challenged by 23 states, major family planning organizations, and the American Medical Association in federal court, claiming the new rules violate the Constitution and federal law. As of October 2019, 18 of 90 grantees that had received funding in April 2019 are no longer participating in the program because they are unwilling to comply with the new federal regulations that limit their ability to provide clients with abortion referrals and block them from participating if they also offer abortion services. In addition, one quarter of the family planning (approximately 1,000 clinics) network no longer receive Title X funding to support family planning services to low-income women in the community and some states are no longer participating in the Title X program. The loss of Title X funding may force some clinics to close and others to reduce hours, services, and staff training.

Many Health Centers Offer Family Planning Services, but the Range and Volume of Services They Provide Varies

Under Section 330 of the PHSA, the Health Resources and Services Administration (HRSA) provides grants to health centers whose main focus is providing primary and preventive care to underserved and vulnerable populations. These clinics, called Federally Qualified Health Centers (FQHCs), are required to provide “voluntary family planning” services along with a wide range of health care services. Although it is not specifically defined in FQHC guidelines, voluntary family planning services can include preconception care, screening and treatment of STIs, and contraception. A survey of FQHCs found that virtually all reported they provided at least one method of contraception at one or more of their clinical sites.

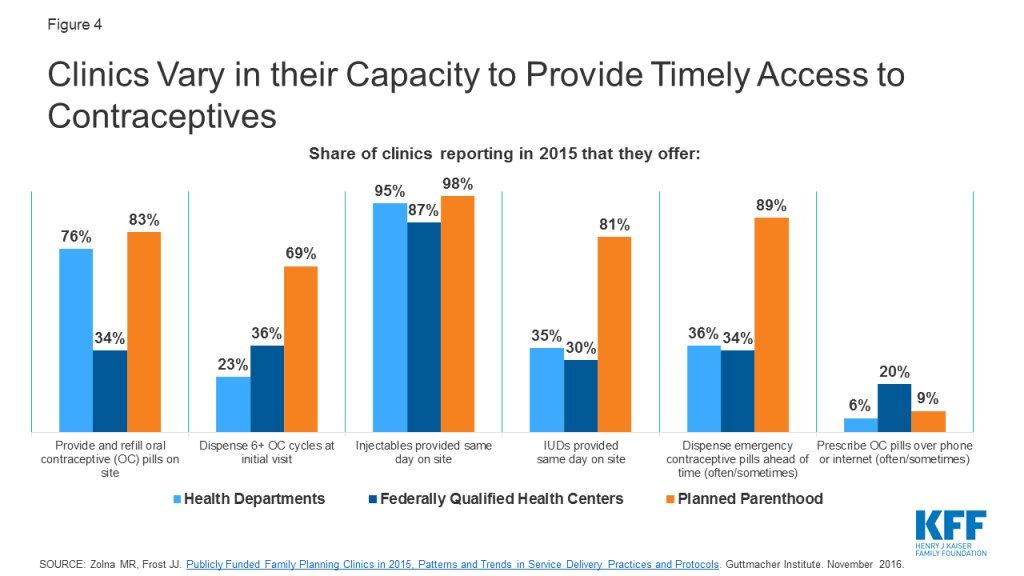
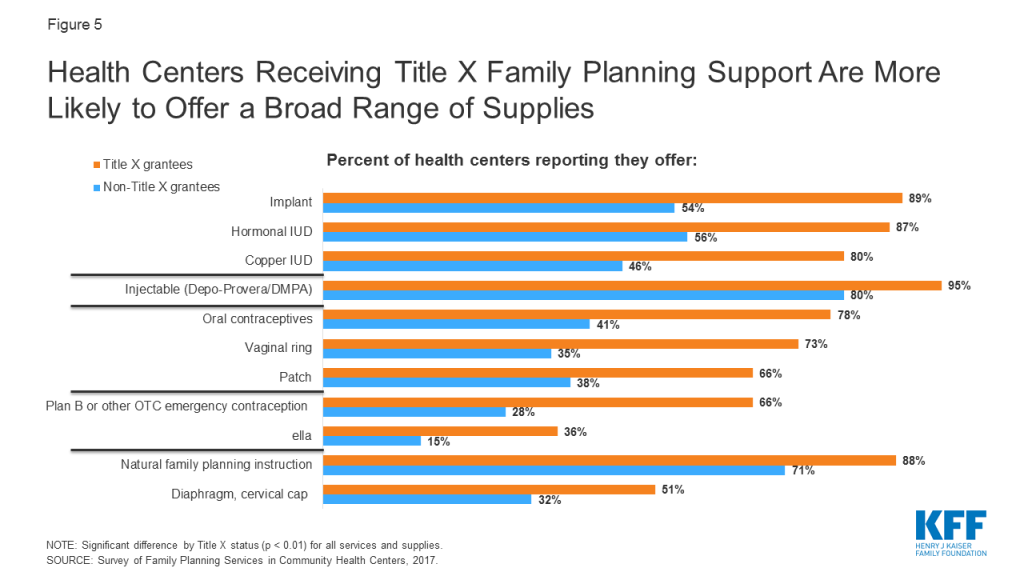
However, research has documented differences between clinic types in their ability to offer direct access to the most effective contraceptive methods (Figure 4). For example, about eight in ten Planned Parenthood clinics (83%) and three-quarters of health department clinics (76%) can provide initial supply and refills of oral contraceptives on site, compared to one-third (34%) of FQHCs. Similarly, there are differences in capacity for family planning care within the FQHC network. In a 2017 Kaiser Family Foundation/ George Washington University study of FQHCs, 80-90% of centers that received Title X funds reported they provide LARCs, compared to just about half of FQHCs that did not receive Title X support (Figure 5).

Figure 4: Clinics Vary in their Capacity to Provide Timely Access to Contraceptives
Figure 5: Health Centers Receiving Title X Family Planning Support Are More Likely to Offer a Broad Range of Supplies

FQHCs are paid using the Prospective Payment System (PPS), which is a higher rate to ensure their costs are coverage and clinics are fully reimbursed for Medicaid patient services, allowing them to utilize their federal 330 grant to care for uninsured and under-insured patients. FQHCs must have a sliding fee scale for patients with incomes below 200% FPL and offer services to all patients regardless of their ability to pay. Of those served in 2017, 69% lived at or below the poverty line, 23% were uninsured, and 49% were covered by Medicaid or CHIP.Similar to Title X clinics, FQHC funding comes largely from Medicaid payments, which made up 44% of revenue in 2017, followed by Section 330 grants (18%) and state, local, and private grants (38%).

Recent Federal and State Efforts Have Moved to Disqualify Planned Parenthood Clinics from Receiving Title X Support and Reimbursements under Medicaid

In the first three years of the Trump Administration, the President and many Congressional Republicans pursued multiple avenues to restrict public funds from going to Planned Parenthood and other clinics that provide both contraception and abortion services. In 2017, the Administration reversed an Obama era regulation that would have prevented states from blocking Title X funds from going to Planned Parenthood and other clinics that provide abortion using other funds. In 2017, every version of Republican legislation to replace the ACA included provisions that would have banned federal Medicaid payments to Planned Parenthood clinics. While none of these bills were enacted, this would have upended Medicaid’s “free choice of provider” requirement and would have resulted in a significant revenue loss for Planned Parenthood.

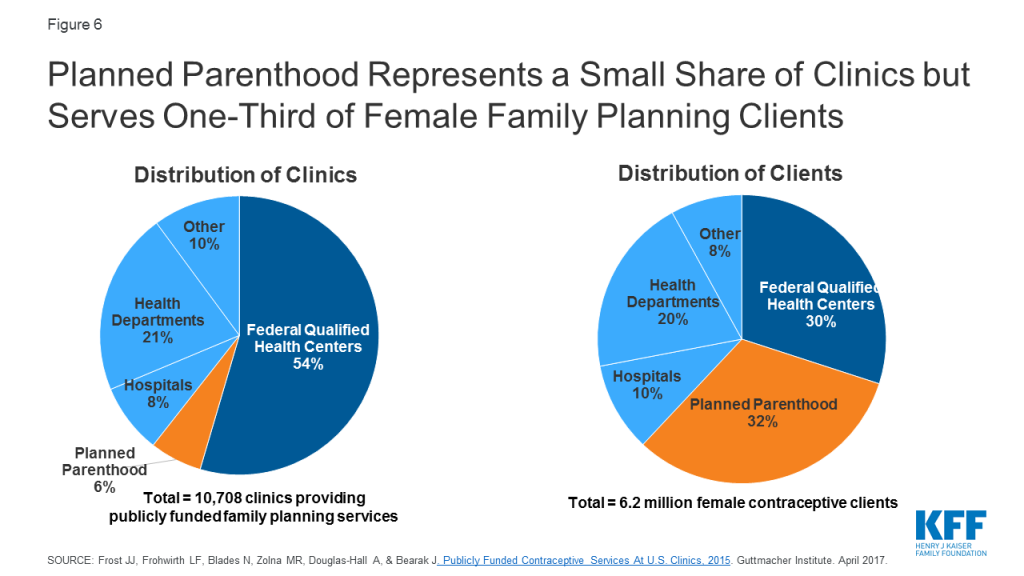
A common theme among proposals to block Planned Parenthood and other specialized family planning clinics from the Medicaid program is the redirection of funds to other providers, such as community health centers (CHCs), with the expectation that CHCs could meet the needs of those formerly served by Planned Parenthood. However, Planned Parenthood served approximately one-third (32%) of women seeking contraceptives at safety-net clinics in 2015. In contrast, while there are considerably more FQHCs (representing 54% of safety-net clinics), they served roughly the same share (30%) of women seeking contraceptive care as Planned Parenthood (Figure 6). CHCs and other remaining clinics would not likely be able to meet additional demands that would be placed on them to provide the full range of family planning services.

Figure 6: Planned Parenthood Represents a Small Share of Clinics but Serves One-Third of Female Family Planning Clients

The impact of banning federal Title X funds and Medicaid reimbursement to family planning clinics would vary across the country. In some states there are very few Planned Parenthood clinics, while in other states they are the predominant provider for low-income people seeking contraceptive services. In 13 states, Planned Parenthood clinics were the site of care for over 40% of women who obtained publicly funded contraceptives.

Experience at the state level has shown that blocking Planned Parenthood from receiving Medicaid reimbursements or Title X funding reduces low-income women’s access to contraceptives. In 2013, Texas replaced its federally funded family planning waiver program with a 100% state funded program that excluded Planned Parenthood as a participating provider. Following the policy change, there was a sharp drop in the number of women served by the state’s program, and access problems have persisted. A recent study found that approximately one-third of publicly insured women in Texas reported difficulty finding a provider (36%) that accepts their coverage and locating a provider that offers services (33%). Furthermore, there was a sizable drop in Medicaid claims for IUDs, contraceptive implants, and injectable contraceptives (IUDs and implants are the most costly and effective methods) and an increase in Medicaid-funded births. In 2013, the Wisconsin legislature approved family planning cuts directed at Planned Parenthood, which resulted in the closure of five Planned Parenthood clinics in rural areas. Women who used the Planned Parenthood clinics were referred to other clinics that were usually further away with wait lists that did not provide the full range of contraceptive methods. A study conducted by Health Management Associates for Planned Parenthood concluded that women in seven Wisconsin counties would have no alternative family planning provider should Planned Parenthood centers close there.

Several other states have also attempted to limit public funds to clinics that provide contraception and abortion services, including Planned Parenthood. Three states – Texas, Tennessee, and South Carolina, have applied to CMS for a federal waiver to exclude abortion providers from their Medicaid networks for non-abortion services, while Arkansas and Missouri have already done so, despite the federal free choice of provider requirement. Several other states have blocked state and Title X funds to clinics that provide both family planning and abortion (Table 1). These restrictions were in place prior to the Trump Administration’s change to the Title X program, which affect the entire nation. Should the federal Title X rules get reversed in court, state-level limits would remain in place.

Table 1: Selected State Policies and Legislative Proposals Regarding Public Funding for Family Planning Providers
State Efforts to Limit or Protect Funding for Family Planning ProvidersStates
Bans certain family planning providers from receiving Medicaid funds Arkansas, Iowa, Missouri, Texas
Applied to federal government for waiver from Medicaid free choice of provider requirementSouth Carolina, Tennessee, Texas
Prevents state family planning and/or Title X funds to providers that offer abortion services, regardless of federal policyMississippi, Nebraska, Wisconsin
Prohibits other forms of public funds^ to abortion providers or entities affiliated with abortion provision or referralArizona, Arkansas, Florida, Mississippi, Missouri, Nebraska, Ohio, North Carolina, Texas, Wisconsin
NOTE ^Public funds from programs such as Sex education, Breast and Cervical Cancer Mortality Prevention Act, Violence Against Women Act, HIV/AIDS initiatives, etc.

SOURCE: Kaiser Family Foundation analysis of state legislation; Guttmacher Institute. State Family Planning Funding Restrictions. June 2019.

Looking Forward

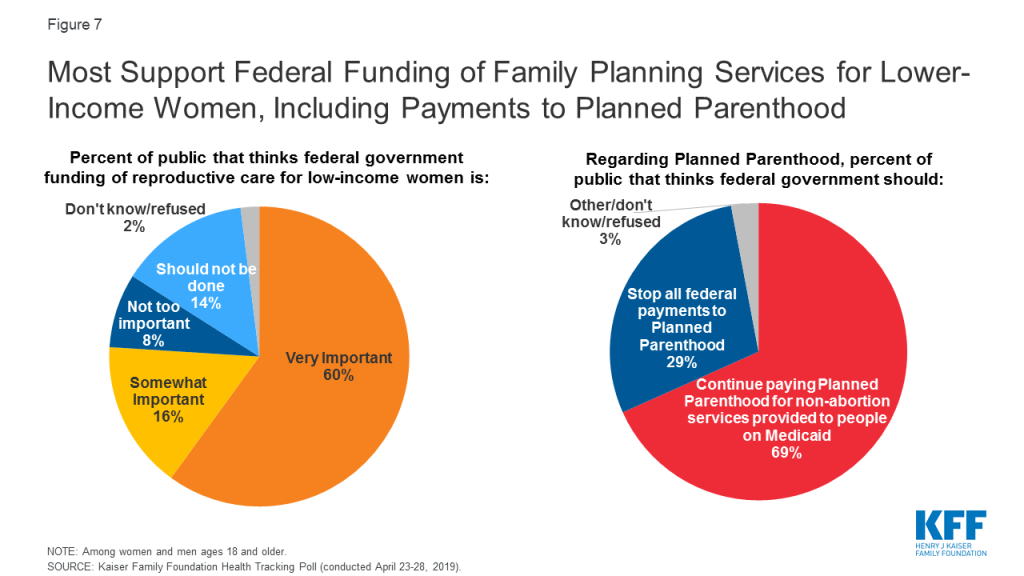
Federal and state funding that supports Medicaid, the Title X program, and Section 330 of the PHSA is the financial core for safety-net clinics that provide family planning services to the uninsured and other vulnerable populations. This federal funding of family planning services and Planned Parenthood receives considerable public support. Almost nine in ten (86%) people say it is important for the federal government to provide funding for reproductive health services, including family planning and birth control for lower-income women, and 69% say they support continued federal Medicaid funding to Planned Parenthood for non-abortion services (Figure 7). The Trump Administration’s changes to health care policy under Title X as well as state actions to restrict funding to Planned Parenthood under Medicaid are still playing out, with the likelihood that they will create gaps in access for low-income individuals that rely on these programs for their family planning care.

Figure 7: Most Support Federal Funding of Family Planning Services for Lower-Income Women, Including Payments to Planned Parenthood

Appendix

Appendix Table 1: Coverage of Low-Income Women of Reproductive Age, by State, 2017
StateEstimated Number of Total Women Ages 15-49 Low-Income Women Ages 15-49

Estimated Number of Low-Income Women (<200% FPL)

Share of Women Who are Low-IncomeShare of Low-Income Women Covered by MedicaidShare of Low-Income Women Who are Uninsured
United States 72,811,00021,257,00029%44%20%
Alabama 1,084,000 417,00038%34%23%
Alaska 165,000 38,00023%51%18%
Arizona 1,533,000 500,00033%49%21%
Arkansas 649,000 248,00038%50%15%
California 9,255,000 2,597,00028%55%15%
Colorado 1,298,000 300,00023%47%17%
Connecticut 770,000 159,00021%58%11%
Delaware 206,000 56,00027%39%10%
DC 190,000 44,00023%64%n/a
Florida 4,434,000 1,441,00032%32%28%
Georgia 2,453,000 804,00033%26%33%
Hawaii 298,000 59,00020%49%8%
Idaho 372,000 123,00033%27%25%
Illinois 2,898,000 811,00028%49%16%
Indiana 1,469,000 445,00030%42%18%
Iowa 661,000 172,00026%46%11%
Kansas 625,000 189,00030%27%23%
Kentucky 963,000 336,00035%58%10%
Louisiana 1,060,000 431,00041%52%14%
Maine 267,000 66,00025%50%17%
Maryland 1,372,000 277,00020%50%14%
Massachusetts 1,533,000 303,00020%66%5%
Michigan 2,156,000 665,00031%56%10%
Minnesota 1,216,000 257,00021%51%12%
Mississippi 664,000 285,00043%35%25%
Missouri 1,321,000 406,00031%32%25%
Montana 218,000 64,00030%46%17%
Nebraska 407,000 108,00027%26%25%
Nevada 686,000 203,00030%40%22%
New Hampshire275,00041,00015%45%13%
New Jersey 2,005,000 411,00020%48%22%
New Mexico 448,000 182,00041%61%16%
New York 4,525,000 1,233,00027%61%10%
North Carolina 2,321,000 757,00033%34%26%
North Dakota 158,000 37,00023%28%19%
Ohio 2,516,000 763,00030%56%12%
Oklahoma 861,000 314,00036%27%31%
Oregon 923,000 245,00027%54%15%
Pennsylvania 2,682,000 717,00027%52%12%
Rhode Island 230,000 56,00024%63%11%
South Carolina 1,095,000 391,00036%34%25%
South Dakota 174,000 46,00027%30%21%
Tennessee 1,500,000 506,00034%45%18%
Texas 6,707,000 2,227,00033%23%42%
Utah 750,000 186,00025%22%23%
Vermont 125,000 33,00026%71%5%
Virginia 1,906,000 446,00023%29%24%
Washington 1,669,000 367,00022%49%14%
West Virginia 373,000 140,00038%65%9%
Wisconsin 1,228,000 322,00026%44%12%
Wyoming 119,000 32,00027%28%32%
NOTES: All data shown are among women ages 15-49, 2017. Low-income includes women living at or below 200% the Federal Poverty Level (FPL), which was $24,120 for an Individual in 2017. Some estimates are “N/A” because point estimates do meet the minimum standards for statistical reliability.

SOURCE: Kaiser Family Foundation estimates based on 2017 Census Bureau’s American Community Survey.

ACA Open Enrollment: For Consumers Considering Short-Term Policies

Published: Oct 25, 2019

Some insurers and web brokers now actively promote the sale of short-term health insurance policies.  As the name implies, short-term policies offer health coverage for less than one year. Typically these policies offer fewer covered benefits and consumer protections compared to plans that meet all Affordable Care Act (ACA) standards.  As a result, short-term policies generally have lower premiums.  Short-term policies are never sold in the marketplace and differ from marketplace policies in other important respects.   This fact sheet identifies features of short-term policies consumers may wish to check carefully.

Eligibility based on health status

Except in states that prohibit their sale,[1] short term health insurance policies are medically underwritten.  That means consumers generally will be turned down if they have pre-existing health conditions.  Short-term policy applications ask questions about health – for example, if the applicant is pregnant or planning to get pregnant, of if the applicant has been diagnosed or treated for cancer, hepatitis, mental health or substance use disorders, HIV/AIDS, or other conditions.  Insurers generally refuse to sell short-term policies to people who answer “yes” to any of those questions.

Duration of coverage and “renewability”

Unless state rules limit the duration of short-term policies, they are allowed to provide coverage for up to 364 days.  Shorter-term policies – for example, lasting 3 or 6 months – are also for sale.  At the end of the policy term, coverage ends.  Some policies may include an option to extend or renew coverage at the end of the policy term.  However, it is up to the insurer to decide.  People who buy a short-term policy and then get sick most likely will not be able to extend or renew coverage.

Importantly, loss of coverage under a short-term policy during the year does not make people eligible for a special enrollment period (SEP) to switch to an ACA-compliant marketplace policy.  They will have to wait until the next Open Enrollment period to buy a plan that cannot turn them down.

Limits on covered benefits

Short-term policies can seem similar to major-medical coverage, though limits often apply.  For example:

  • Limits on covered doctor visits – Check to see if the short-term policy limits the number of covered doctor visits, for example, to no more than 3 visits.
  • Dollar limits on covered benefits – Check to see if dollar limits on specific covered benefits apply – such as $1,000 per day in the hospital. If a policy applies dollar limits, actual charges above the limit will not be covered.  (For example, according to healthcare.gov, the average cost of a 3-day hospital stay is around $30,000.)  Virtually all short-term policies apply a dollar cap to all covered benefits, e.g., ranging from $100,000 to $2 million.
  • Limits on prescription drug coverage – If prescription drugs are covered, check to see if other limits apply, for example, whether drugs are covered only during an inpatient hospital stay. Some short-term policies might not cover drugs at all but offer a drug discount card instead. A discount card is not the same as insurance coverage; the patient will have to pay the entire discounted price without any insurance reimbursement.
  • Excluded benefits – Carefully read information about policy exclusions. Short-term policies typically do not cover maternity care; many will not cover substance use treatment or mental health services.
  • Short-term policies exclude pre-existing conditions. If you make a claim under a short-term policy, the insurer can investigate whether your condition existed before you bought the policy.    Depending on the policy and state laws where you live, the insurer might also refuse to cover a condition that existed, even if not-yet diagnosed, before you bought the policy.  Some short-term policies offer limited coverage for certain pre-existing conditions, such as allergies, if you are otherwise healthy enough to buy the policy.

Cost sharing for covered benefits

Most short-term policies have an out-of-pocket limit on cost sharing; however, that limit might not include what you pay in deductibles or copays.  By contrast, in ACA-compliant policies, the out-of-pocket limit caps what consumers pay in a year for all types of cost sharing—deductibles, co-pays, and coinsurance.  For 2020, that limit is $8,150 per year for a single person.

Provider networks

Be sure to check whether the short-term policy offers a network of providers.  If so, you will need to seek care in-network to be covered (or, in case of “PPO” plans – to get the highest level of coverage.)  Some short-term policies are described as “Indemnity” policies.  That means the insurer does not limit coverage to a network of doctors and hospitals.  It also means the insurer has not negotiated any limits on what doctors and hospitals can charge you.  An indemnity policy will reimburse you up to an amount the insurer allows, and you will be responsible for the difference between that amount and the actual billed amount.  This difference is called “balance billing” and can be very expensive.

Other differences from ACA-compliant plans

Short-term policies cannot be sold on HealthCare.gov or state marketplace websites.  Consumers eligible for marketplace subsidies cannot use them to buy short-term policies.  When comparing premiums for short-term plans and marketplace plans, be sure to take into account marketplace premium and cost sharing subsidies that may apply to you.  Most people who buy marketplace plans qualify for these subsidies.


[1] So far, California, Massachusetts, New Jersey, and New York prohibit the sale of short-term health insurance policies that lack protections for people with pre-existing conditions. Additionally, Colorado, Connecticut, New Mexico, and Rhode Island impose tighter rules on short-term plans, and as a result, no short-term plans are currently sold in these states.  Some other states that apply much stricter limits to short-term policies are Delaware, District of Columbia, Hawaii, Illinois, Maine, Maryland, Vermont, and Washington.

ACA Open Enrollment: If You Are Low-Income

Published: Oct 25, 2019

If You Are Low-Income…

You can learn about your options by filling out a single application. It will tell you whether you qualify for coverage through the Medicaid program or for financial assistance to help pay for private insurance offered through your state’s marketplace. You can apply for coverage even if you have been unable to get it in the past.

States With Medicaid Expansion

Under the Affordable Care Act, 35 states including Washington, D.C. expanded  Medicaid eligibility to many low-income adults, including adults without dependent children, while 14 other states have chosen not to expand Medicaid under the law. Another two states, Nebraska and Utah, will be expanding Medicaid eligibility later in 2020. In states that expanded Medicaid, you may qualify for Medicaid if you earn $17,236 a year as a single individual or $29,435 for a family of three, while other family sizes can qualify at higher incomes. In states that did not expand, non-disabled adults who are parents with very low income will qualify (the eligibility levels vary by state). Regardless of your state’s decision on expanding Medicaid, children are eligible for Medicaid or the Children’s Health Insurance Program (CHIP) if their family  income is about $42,000 (for a family of three), or more in some states.

State Insurance Marketplaces

Whether or not your state expanded Medicaid, you may be eligible for federal assistance when you buy a health plan through your state’s marketplace. This assistance could lower the premiums you pay and reduce how much money you must pay out of your own pocket when you seek medical care. Although premiums for marketplace plans generally increase each year, if you qualify for premium tax credits, the tax credit should cover most or nearly all of the cost increase.  In general, you may be eligible for tax credits to lower your premium if you are single and your annual 2020 income is between $12,490 to $49,960 or if your household income is between $21,330 to $85,320 for a family of three (the lower income limits are higher in states that expanded Medicaid). The range differs for families of different sizes. If you buy a plan through the marketplace and your income is between $12,490 and $31,225 for a single person ($21,330 to $53,325 for a family of three), you can also qualify for help with cost sharing. Special modified silver plans are available with lower deductibles, copays, and annual out-of-pocket limits on cost sharing.

How to Apply

You can apply for coverage during the open enrollment period that runs from Nov. 1 through Dec. 15 in most states, including those using healthcare.gov. Coverage through a marketplace plan takes effect on Jan. 1, 2020. After Dec. 15, you may only sign up for a plan under special circumstances. Open enrollment in states that run their own marketplaces depends on the state. Seven states—California, Colorado, DC, Massachusetts, Minnesota, New York, and Rhode Island—have extended open enrollment beyond Dec. 15, 2019. Check with your state marketplace for details.

If you qualify for Medicaid, you can enroll at any time, not just during open enrollment. You can apply through healthcare.gov or your state’s marketplace website or directly with your state’s Medicaid agency. Once you have enrolled in Medicaid, you will receive a notice from your state’s Medicaid agency when it is time to renew your coverage.

Questions

If you have questions, you can call the federal government’s toll-free 24-hour hotline at 1-800-318-2596. To find in-person help, go to https://localhelp.healthcare.gov. Further information is available at www.healthcare.gov and at http://www.kff.org/health-reform/faq/health-reform-frequently-asked-questions/

News Release

U.S. Leads All Donors in First Comprehensive Assessment of Funding for Ebola Outbreak in DRC

Published: Oct 25, 2019

A new KFF analysis is the first comprehensive summary of donor funding for the response to the Ebola outbreak in the Democratic Republic of Congo (DRC). The analysis estimates that at least $546 million was provided by donors from August 2018, when the outbreak started, through September 2019. This includes bilateral support earmarked for Ebola from donor governments as well as contributions by multilateral organizations.

The United States provided the largest amount of support, estimated at no less than $148 million, followed by the World Bank ($130 million) and WHO Contingency Fund for Emergencies ($73.1 million). Only half of the total funding, including about one third of U.S. funding, was provided in direct support of the official DRC Response plans. This could have implications for the coordination of donor efforts and whether funding is being directed to the most critical or pressing activities.

Top-10-Donors-to-Ebola-Response-in-the-DRC

Overall funding amounts could be higher, as donor financing information is limited and fragmented. The analysis suggests coordination with national response plans is at times unclear, and the status of U.S. funding going forward is uncertain.

News Release

Analysis Finds Record 3,148 Medicare Advantage Plans Will be Available in 2020

Most Offer Additional Benefits, Including Some Fitness, Dental and Vision, though Few Offer Telemonitoring, In-Home and Caregiver Support

Published: Oct 24, 2019

A record 3,148 Medicare Advantage plans will be available across the country as alternatives to traditional Medicare, a new KFF analysis finds. That’s up 15% from last year’s 2,734 plans and results in a typical beneficiary having 28 plans available to them in their local market for the 2020 Medicare open enrollment period, which began Oct. 15 and runs until Dec. 7.

About 22 million Medicare beneficiaries – a third of all beneficiaries – are currently in Medicare Advantage plans, which are mostly HMOs and PPOs offered by private insurers that are paid to provide Medicare benefits to enrollees.

Most plans also offer benefits beyond what traditional Medicare covers, including fitness (93%), dental (88%), eye exams and glasses (87%), and hearing aids (83%). Nearly half (46%) provide a meal benefit, such as a cooking class, nutrition education or meal delivery, and one-third (33%) provide some transportation benefit. Far fewer offer other benefits related to social and residential needs that can affect health, such as bathroom safety devices, handrails (6%), telemonitoring (4%), in-home support (4%), and support for caregivers (2%).

The number of 2020 plans available varies greatly across the country, with 31 plans, on average, in metropolitan counties and 16 plans, on average, in non-metropolitan counties. Six counties in Ohio and Pennsylvania have more than 60 plans, while no plans will be available in 77 mostly rural counties nationwide.

Most Medicare Advantage plans (90%) include prescription drug coverage. Similar to last year, about 49% of these plans do not charge any additional premium beyond Medicare’s standard Part B premium.

KFF has also updated its collection of frequently asked questions about Medicare Open Enrollment to help beneficiaries understand their options during the annual open enrollment period, including the private stand-alone Part D plans that provide Medicare’s drug benefit and Medicare supplement (Medigap) plans, in addition to Medicare Advantage plans.

Medicare Advantage 2020 Spotlight: First Look

Authors: Gretchen Jacobson, Meredith Freed, Anthony Damico, and Tricia Neuman
Published: Oct 24, 2019

Executive Summary

Medicare Advantage plans have taken a large and growing role in the Medicare program over the past decade, with more than 22 million Medicare beneficiaries (34%) enrolled in Medicare Advantage plans in 2019, a private plan alternative to the traditional Medicare program. This brief provides an overview of the Medicare Advantage plans that will be available for 2020, based on an analysis of data from the Centers for Medicare and Medicaid Services (CMS). Findings include:

  • Number of Plans. Nationwide, 3,148 Medicare Advantage plans will be available for individual enrollment for the 2020 plan year – an increase of 414 plans since 2019. The average beneficiary will be able to choose among 28 plans in 2020, up from 24 in 2019 (ES Figure). The number of Special Needs Plans (SNPs) will also increase from 717 plans in 2019 to 855 plans in 2020.
Figure 1: The average Medicare beneficiary has access to 28 Medicare Advantage plans in 2020, an increase from prior years
  • Variation in Number of Plans. The number of Medicare Advantage plans will vary greatly across counties in 2020, from 31 plans, on average, in metropolitan counties to 16 plans, on average, in non-metropolitan counties. More than 60 plans will be available in six counties (in OH and PA), while no plans will be offered in 77 counties (accounting for less than 1% of beneficiaries) in 2020.
  • Number of Firms. The average beneficiary will be able to choose from plans offered by seven firms in 2020, similar to 2019. Four percent of all Medicare beneficiaries will have a choice of plans offered by two or fewer firms while 24 percent will be able to choose from plans offered by 10 or more firms.
  • Market Entrants and Exits. Thirteen insurers will be entering the Medicare Advantage market for the first time, and one insurer will be exiting in 2020. In all, well over 100 firms will offer Medicare Advantage plans in 2020.
  • Extra Benefits. Nearly all beneficiaries (97%) have access to a Medicare Advantage plan that provides dental, fitness, vision, and hearing benefits, which are not covered by traditional Medicare. Many beneficiaries also have access to some transportation assistance (92%) and a meal benefit (96%), but some benefits are less frequently available, such as in-home support (54%), bathroom safety (49%), telemonitoring services (29%), and support for caregivers of enrollees (12%).

Data Note

Plan Offerings in 2020

Number of Plans

Total Number of Plans. In total, 3,148 Medicare Advantage plans will be available nationwide for individual enrollment in 2020 – a 15 percent increase (414 more plans) from 2019 and the largest number of plans ever available (Figure 1; Appendix Table 1). These numbers exclude employer or union-sponsored group plans and Special Needs Plans, which are only available to select populations. Similar to prior years, HMOs continue to account for about two-thirds (64%) of all plans offered in 2020.

Figure 1: More Medicare Advantage plans are available in 2020 than in any other year

The growth in number of plans varies across states and counties, with the preponderance of the growth in plans occurring in California and Florida (61 more and 42 more plans, respectively; data not shown). Indiana and Puerto Rico will have 5 fewer plans available in 2020 than in 2019, while Utah will have 2 fewer plans, and Maryland and Hawaii will each have one fewer plan available in 2020 than in 2019.

While many employers and unions also offer Medicare Advantage plans to their retirees, no information about these plans is made available by CMS to the public during the Medicare open enrollment period because these plans are not available to the general Medicare population.

Special Needs Plans (SNPs). More SNPs will be available in 2020 than in any year since they were authorized, increasing from 717 plans in 2019 to 855 plans in 2019, a 19 percent increase (Figure 2). The SNP market may be an especially attractive market because potential overpayments to plans may be largest for those plans that are serving the sickest beneficiaries.

Figure 2: More than 850 Special Needs Plans will be offered in 2020

The rise in SNPs for people who require an institutional-level of care (I-SNPs) has been particularly notable, more than doubling from 69 plans in 2016 to 150 plans in 2020. I-SNPs may be attractive to insurers because they tend to have much lower marketing costs than other plan types since they are often the only available option for people to receive their Medicare benefits in certain retirement communities and nursing homes. The number of SNPs for people dually eligible for Medicare and

Medicaid (D-SNPs) has also greatly increased over the past five years (58% increase since 2016), suggesting insurers’ continue to be interested in managing the care of this high-need population.

Most SNPs for people with chronic conditions (C-SNPs) will continue to target people with diabetes, heart disease, or lung conditions in 2020, as has been the case since the inception of SNPs. In 2020, three firms will offer C-SNPs for people with dementia (up from two firms in 2019) and one firm will continue to offer a C-SNP for people with mental health conditions in California. Four firms will continue to offer C-SNPs for people with end-stage renal disease (similar to 2019) and two firms will offer C-SNPs for people with HIV/AIDS (similar to 2019).

Number of Plans Available to Beneficiaries. In 2020, the average Medicare beneficiary will have access to 28 Medicare Advantage plans available for individual enrollment, the highest number of plans available to the average beneficiary since 2011 (Figure 3). Among the 28 Medicare Advantage plans available to the average Medicare beneficiary, 24 of the plans will include prescription drug coverage (MA-PDs); 90 percent of all Medicare Advantage plans offered will include prescription drug coverage in 2020.

Figure 3: The average Medicare beneficiary has access to 28 Medicare Advantage plans in 2020, an increase from prior years

Variation in the Number of Plans, by Geographic Area. On average, beneficiaries in metropolitan areas will be able to choose from more than twice as many Medicare Advantage plans as beneficiaries in non-metropolitan areas (31 plans versus 16 plans, respectively). In ten percent of counties (accounting for 40% of beneficiaries), beneficiaries can choose from more than 30 plans in 2020, including four counties in Ohio (Mahoning, Medina, Trumbull, and Summit) and two counties in Pennsylvania (Bucks and Lancaster) where more than 60 plans will be available (Figure 4). In contrast, in 6 percent of counties (accounting for 1% of beneficiaries), beneficiaries can choose from two or fewer Medicare Advantage plans, including 59 counties in which only one plan will be available to beneficiaries. The number of counties with no Medicare Advantage plans will decline from 115 in 2019 to 77 in 2020. Additionally, no Medicare Advantage plans are available in territories other than Puerto Rico, similar to previous years.

Figure 4: In 131 counties, Medicare beneficiaries can choose from more than 40 Medicare Advantage plans, including 6 counties with more than 60 plans in 2020

Access to Medicare Advantage Plans, by Plan Type

As in recent years, virtually all Medicare beneficiaries (99%) will have access to a Medicare Advantage plan as an alternative to traditional Medicare, including almost all beneficiaries in metropolitan areas (99.9%) and the vast majority of beneficiaries in non-metropolitan areas (97%). In non-metropolitan counties, a smaller share of beneficiaries will have access to HMOs (81% in non-metropolitan versus 99% in metropolitan counties) or local PPOs (86% in non-metropolitan versus 95% in metropolitan counties), and a slightly larger share of beneficiaries will have access to regional PPOs (77% in non-metropolitan counties versus 72% in metropolitan counties).   

Number of Firms

The average Medicare beneficiary will be able to choose from plans offered by 7 firms, on average, in 2020, similar to 2019 (Figure 5). Almost one-quarter of beneficiaries (24%) will be able to choose from plans offered by 10 or more firms. Fourteen firms will offer Medicare Advantage plans in six counties: Los Angeles, Orange, Riverside, and San Bernardino counties in California, Cook County (Chicago) in Illinois, and Summit County (Akron) in Ohio. In each of these metropolitan counties, per capita spending for traditional Medicare and the share of beneficiaries enrolled in Medicare Advantage plans are much higher than the national average. In contrast, in 146 counties, most of which are rural counties with relatively few Medicare beneficiaries, only one firm will offer Medicare Advantage plans in 2020, a reduction from 194 such counties in 2019.

Figure 5: Almost one-quarter of beneficiaries can choose among Medicare Advantage plans offered by 10 or more firms

UnitedHealthcare and Humana, the two firms with the most Medicare Advantage enrollees, have large footprints across the country, offering plans in most counties. UnitedHealthcare is offering plans in 60 percent of counties, Humana is offering plans in 83 percent of counties, and both firms are offering plans in more than half of all counties (53%) in 2020 (Figure 6). More than 8 in 10 (85%) of Medicare beneficiaries have access to at least one Humana plan and 82 percent have access to at least one UnitedHealthcare plan.

Figure 6: Humana’s Medicare Advantage plans will be available in 83% of counties and UnitedHealthcare’s will be available in 60% of counties in 2020

New Market Entrants and Exits

Medicare Advantage continues to be an attractive market for insurers, with 13 firms entering the market for the first time in 2020, collectively accounting for about 7 percent of the growth in the number of plans available for general enrollment and about 5 percent of the growth in SNPs (Table 1). Ten new entrants will be offering HMOs available for individual enrollment. Five of the new entrants will be offering SNPs; three firms will be offering D-SNPs and two firms will be offering I-SNPs, including one firm (MoreCare) that will also be offering a C-SNP for people with HIV/AIDS. All of the new entrants are offering plans in one of ten states (FL, IL, LA, MI, NC, NY, SC, TN, TX, and VA).

Similar to prior years, some of the new entrants, such as Oscar and Troy Medicare, are funded by venture capital firms, joining about a dozen other venture capital-funded firms offering Medicare Advantage plans in 2020. While well over 100 insurers offered Medicare Advantage plans in 2019, only one insurer will be exiting the market in 2020, a sign that the vast majority of plans in the Medicare Advantage market are profitable. The exiting insurer had about 8,000 enrollees in Puerto Rico in 2019.  

Table 1. Entrants and Exiting Insurers in Medicare Advantage Markets, by Plan Type and Plan Locations, 2020
Company NameTotal Number of Plans OfferedPlans for Individual EnrollmentSpecial Needs Plans (SNPs)States in Which Plans Are Offered
HMOsOtherD-SNPsC-SNPsI-SNPs
New Entrants
ApexHealth, Inc.13X X  NC, SC, TN, and VA
Clarion Health1X     FL
Community Health Choice1  X  TX
Dignity Health Plan1    XLA
El Paso Health Advantage1  X  TX
Experience Health, Inc.1X    NC
Mary Washington Medicare Advantage2X    VA
MoreCare4X  XXIL
Oscar2X    NY and TX
PHP Medicare6X    MI
Reliance Medicare Advantage2X    MI
Troy Medicare1X    NC
Zing Health1X    IL
Exiting Insurers
Constellation Health8XXX  PR
Note: D-SNPs are plans for people dually eligible for Medicare and Medicaid; C-SNPs are plans for people with certain chronic conditions; and I-SNPs are plans for people that require an institutional level of care.

Source: Kaiser Family Foundation analysis of CMS Landscape Files for 2019 and 2020.

Premiums

The vast majority of Medicare Advantage plans for individual enrollment (90%) will include prescription drug coverage (MA-PDs), and 49 percent of these plans will charge no premium, other than the Part B premium, similar to 2019. More than nine out of ten beneficiaries (93%) will have access to a MA-PD with no monthly premium in 2020. However, in three rural states (AK, MT and WY), beneficiaries will not have access to a zero-premium MA-PD, and in four other states (MD, SD, ID, and ND), less than half of beneficiaries will have access to a zero-premium MA-PD. The average premium for MA-PDs (not weighted by enrollment) will be $36 per month in 2020, down from $40 per month in 2019. Medicare Advantage enrollees typically choose low premium plans, and enrollment-weighted premiums are often lower than the average premium across plans.

Extra Benefits

Medicare Advantage plans may provide extra benefits that are not offered in traditional Medicare, and can use rebate dollars (including bonus payments) to help cover the cost of these extra benefits. Beginning in 2020, Medicare Advantage plans can offer extra benefits that are not primarily health related. Plans may also restrict the availability of these extra benefits to certain subgroups of beneficiaries, making different benefits available to different enrollees. Further research is needed to assess the comprehensiveness of coverage for these extra benefits, and the extent to which the benefits are only available to certain subgroups of enrollees.

Availability of Extra Benefits in Plans for General Enrollment. More than 80 percent of plans provide some dental, vision, hearing, or fitness benefits (Figure 7); nearly 6 in 10 plans (58%) provide all of these four benefits in 2020. One-third of plans (33%) provide some transportation benefit in 2020, and almost half (46%) provide a meal benefit, such as a cooking class, nutrition education, or meal delivery. Less than 10 percent of plans provide bathroom safety devices (6%), in-home support (4%), telemonitoring (4%), or support for caregivers of enrollees (2%).

Figure 7: Most Medicare Advantage plans provide fitness and vision benefits but much fewer provide in-home or caregiver support

Availability of Extra Benefits in Special Needs Plans. SNPs are designed to serve a disproportionately high-need population, and a somewhat larger percentage of SNPs than plans for other Medicare beneficiaries provide their enrollees with transportation benefits (84%) and meal benefits (60%). Similar to plans available for general enrollment, a relatively small share of SNPs provide bathroom safety devices (7%), in-home support (13%), telemonitoring (10%), and support for caregivers (8%).

Access to Extra Benefits. Nearly all Medicare beneficiaries have access to a Medicare Advantage plan with some extra benefits not covered by traditional Medicare, with 97% having access to some dental, fitness, vision, and hearing benefits in 2020. The vast majority of beneficiaries also have access to transportation assistance (92%) and a meal benefit (96%), but far fewer have access to in-home support (54%), bathroom safety (49%), telemonitoring services (29%), and support for caregivers of enrollees (12%).

Discussion

More Medicare Advantage plans will be offered in 2020 than any other year. Thirteen insurers will be entering the Medicare Advantage market for the first time, and only one insurer will be exiting the market, suggesting that the Medicare Advantage market remains an attractive, profitable market for insurers. As in prior years, some (mostly non-metropolitan) counties are less attractive to insurers, with fewer firms and plans available. Overall, less than 1 percent of beneficiaries will not have access to a Medicare Advantage plan in 2020, similar to prior years. With more firms offering SNPs and the number of SNPs rapidly growing, there may be greater focus on how well high-need, vulnerable beneficiaries are being served by Medicare Advantage plans, including SNPs as well as plans for general enrollment. As Medicare Advantage enrollment continues to grow, insurers seem to be responding by offering more plans and choices to the people on Medicare.

Gretchen Jacobson, Meredith Freed, and Tricia Neuman are with KFF.

Anthony Damico is an independent consultant.

Appendix

Appendix Table 1. Availability of Medicare Advantage Plans and Insurers, by State, 2020
StateTotal Number of PlansAverage Number of Plans Available to BeneficiariesAverage Number of Insurers Offering Plans

Share of Beneficiaries with Access to at Least 1 Plan

All PlansHMOsLocal PPOs
Nationwide3,14828799%95%93%
Alabama55185100%95%100%
Alaska00N/A0%0%0%
Arizona77309100%97%97%
Arkansas50227100%99%89%
California281311098%97%66%
Colorado63267100%86%95%
Connecticut29266100%100%100%
Delaware11104100%100%100%
DC774100%100%100%
Florida296358100%99%99%
Georgia94277100%87%97%
Hawaii19126100%100%100%
Idaho5623593%93%93%
Illinois116329100%98%96%
Indiana84206100%100%100%
Iowa47124100%91%96%
Kansas60175100%70%82%
Kentucky66175100%99%100%
Louisiana53207100%100%100%
Maine40248100%100%100%
Maryland2594100%90%71%
Massachusetts58306100%99%97%
Michigan79366100%100%100%
Minnesota79317100%100%99%
Mississippi30124100%76%85%
Missouri79215100%90%97%
Montana1453100%79%86%
Nebraska3013594%82%82%
Nevada40217100%97%94%
New Hampshire34286100%100%100%
New Jersey58246100%100%100%
New Mexico29156100%68%100%
New York1784010100%100%100%
North Carolina82176100%94%95%
North Dakota22133100%0%51%
Ohio1404710100%100%100%
Oklahoma40174100%77%94%
Oregon85247100%93%100%
Pennsylvania160478100%100%100%
Rhode Island16164100%100%100%
South Carolina76288100%100%100%
South Dakota24144100%27%81%
Tennessee76247100%100%100%
Texas152279100%93%94%
Utah28156100%98%94%
Vermont13112100%100%100%
Virginia93175100%97%93%
Washington12728798%93%90%
West Virginia35205100%100%100%
Wisconsin101257100%99%92%
Wyoming521100%3%3%
Note: Excludes SNPs, EGHPs, HCPPs, and PACE plans.  Nationwide totals include Puerto Rico and other territories.

Source: Kaiser Family Foundation analysis of CMS Landscape File, 2020.

What Do We Know About Infant Mortality in the U.S. and Comparable Countries?

Published: Oct 18, 2019

An updated slideshow examines infant mortality rates in the United States, including variations by race and ethnicity and comparisons with similar countries. Overall, the U.S. and comparable countries have seen a decrease in infant mortality rates in recent years, but the U.S. has been slower to improve its consistently higher average rate of infant deaths, and significant disparities exist within the U.S. The analysis finds that high rates of infant mortality are concentrated in the South and parts of the Midwest, and infants born to non-Hispanic Black mothers have the highest infant mortality rate among all racial and ethnic groups.

The slideshow is part of the Peterson-Kaiser Health System Tracker, an online information hub dedicated to monitoring and assessing the performance of the U.S. health system.

News Release

List Prices Increased As Much As 9 Times Faster Than Inflation for 20 of the Top 25 Part D Drugs, Suggesting Potential for Savings Under Proposed Inflation Rebate Policies

Published: Oct 18, 2019

A new KFF analysis finds that the list prices for most of the top Medicare Part D drugs by total spending increased as much as nine times the rate of inflation (1.7%) between 2016 and 2017, suggesting recent Congressional proposals targeting such increases could generate savings for Medicare and Part D enrollees.

The analysis finds 20 of the top 25 drugs, all of which were brand-name medications, had price increases between three and more than nine times the inflation rate during that year. In some cases, price increases were in the double digits, far outstripping the inflation rate. These include 15.7% for Lyrica, a pain medication used by 900,000 Part D enrollees; 15.3% for Revlimid, a cancer drug used by 37,000 enrollees; and 13.2% for Humira Pen, a medication for rheumatoid arthritis taken by 52,000 enrollees.

The analysis is based on data from the CMS’s most recent Medicare Part D drug spending dashboard. Of the 2,879 drugs reported in 2017 in the dashboard (both brand-name and generic), 60 percent had list prices that increased faster than inflation between 2016 and 2017.

The analysis suggests the potential for savings to the Medicare program if drug manufacturers limited price increases to the rate of inflation or paid a rebate to the federal government. Medicare beneficiaries could also benefit because Part D cost sharing often comes in the form of coinsurance, which is calculated as a percentage of the list price. If the policy led to slower growth in Part D program costs, enrollees could also see lower premiums.

KFF did not analyze any specific provision in current legislation that would require drug manufacturers to pay a rebate to the federal government if their drug prices increase above the rate of inflation. Savings would depend on the details of legislative proposals, as well as on the response of drug manufacturers, such as increasing launch prices for drugs or decreasing existing rebates. The analysis is based on pricing data that does not reflect existing manufacturer rebates or discounts to plans, which are considered proprietary and not publicly available.

News Release

State Budgets for Fiscal Year 2020 Include Total Medicaid Spending Growth of 6.2 Percent on Average, Even As Enrollment Remains Essentially Flat  

Rising Costs for Prescription Drugs, Provider Rate Increases and Care for the Elderly and People with Disabilities Are Factors, Annual 50-State Survey Finds

Published: Oct 18, 2019

States budgeted for total Medicaid spending to increase at a faster pace than enrollment in fiscal year 2020, driven in part by rising costs for prescription drugs, provider rate increases and higher costs associated with caring for the elderly and disabled, according to KFF’s new 50-state Medicaid budget survey.

The 19th annual survey of state Medicaid directors finds that officials expect total Medicaid spending to climb 6.2 percent while enrollment remains virtually flat, up 0.8 percent. This follows total Medicaid spending growth of 2.9 percent for fiscal 2019, a year in which enrollment declined 1.7 percent.

Officials identified increasing costs for prescription drugs (particularly for specialty drugs), provider rate increases (most often for managed care organizations, hospitals, and nursing facilities) and pressures from the aging population and long-term care costs as key upward drivers of total Medicaid spending.

States generally attributed enrollment declines to a stronger economy; however, some states also pointed to process and systems changes including changes to renewal processes, upgraded eligibility systems and enhanced data matching efforts to verify eligibility as putting a downward pressure on enrollment. Recent Census Bureau data show an increase in the number of uninsured in the U.S., suggesting that some people losing Medicaid coverage may not gain access to employer-based health benefits and are not buying their own insurance.

State Medicaid spending accounted for 37.5 percent of the $593 billion in overall Medicaid spending in federal fiscal year 2018.  Reported data for this survey shows that average state Medicaid spending is budgeted to increase by 5.7 percent in state fiscal year 2020, after rising 1.1 percent in 2019.

State Medicaid spending growth, which typically moves in the same direction and at a similar rate to total Medicaid spending, was lower than total Medicaid spending growth in FY 2019 and is expected to be lower again in FY 2020. In FY 2019, state Medicaid spending grew slower than overall general fund expenditure growth.  The Affordable Care Act requires that expansion states assume an increasing share of Medicaid expansion costs, with their share rising from 6 percent in January 2018, to 7 percent in 2019 and 10 percent in 2020, where it will remain.

Thirty-six states and Washington D.C. have adopted the Medicaid expansion, with implementation expected in 2020 for Idaho, Nebraska and Utah (although implementation could be in FY 2021 for Nebraska and Utah). Most expansion states relied on general funds to finance the expansion, but a number also reported using provider taxes or other savings from the expansion.

The annual survey provides an in-depth, state-specific examination of changes and initiatives taking place in Medicaid programs.  Some notable findings include:

Work requirements. The most frequently reported eligibility restrictions implemented in FY 2019 or planned for FY 2020 are work or community engagement requirements. Six states (AZ, IN, MI, OH, UT, WI) currently have approved Section 1115 work requirement waivers. Nine states (AL, ID, MS, MT, OK, SC, SD, TN, VA) have pending waivers for work requirements. With the exception of Virginia, Montana, and Idaho, all other pending work requirement waivers are from non-expansion states. Three states (KY, AR, NH) have had work requirement waivers set aside by the courts following legal challenges and litigation was filed challenging the work requirement waiver in Indiana.

Prescription drug cost containment.  Amid rising concerns about the cost of prescription drugs, 24 states in FY 2019 and 26 states in FY 2020 reported newly implementing or expanding at least one initiative to contain prescription drug spending. Strategies include value-based contracts linking reimbursement to patient health outcomes, transparency requirements related to pharmacy benefit managers and prior authorization requirements for certain high cost drugs.

The opioid epidemic. All states reported using pharmacy benefit management strategies to prevent opioid-related harms. These include adoption of opioid prescribing guidelines, drug utilization review, prior authorization based on clinical criteria and state prescription drug monitoring programs. States also reported a variety of initiatives to expand access to medication assisted treatment (MAT).

Long-term services and supports. Nearly all states in FY 2019 (48 states) and in FY 2020 (47 states) are employing one or more strategies to expand the number of people served in home and community-based settings. Of these states, the vast majority report using HCBS waivers and/or state plan options

Other key highlights include state initiatives to address social determinants of health through managed care contracts and outside of managed care and an array of efforts (through eligibility, benefits and delivery system changes) to help reduce maternal mortality and improve infant birth outcomes.

The survey findings are presented in two reports: