Uninsured Most Likely to Delay or Go Without Care or Prescription Drugs Due to Cost

The independent source for health policy research, polling, and news.
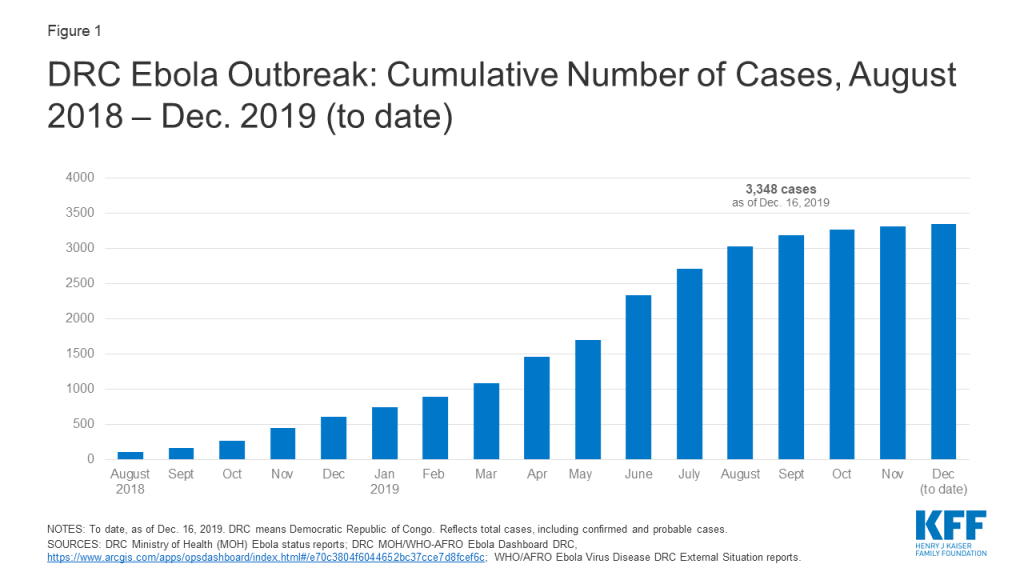
The current Ebola outbreak was first declared by the DRC Ministry of Health on August 1, 2018 (see timeline of key events below). Almost all cases of Ebola in this outbreak so far have occurred in the two northeastern DRC provinces of Ituri and North Kivu, though a few cases have recently been identified in South Kivu province. This outbreak is the tenth – and by far the largest – in the DRC’s history and the second largest Ebola outbreak ever recorded after the West Africa Ebola outbreak in 2014-2015 that saw 28,616 cases, including 11,310 deaths, in the three most affected countries (Guinea, Liberia, and Sierra Leone).
Cross-border spread remains a concern. Uganda has reported several imported Ebola cases in areas bordering the DRC, with the most recent reported on August 26, 2019. WHO says there is a risk of further spread within the DRC and potentially across borders to Burundi, Rwanda, South Sudan, and Uganda, in particular. Several cases over the summer of 2019 in the large city of Goma, a regional and international transport hub that directly borders Rwanda, highlighted such concerns. Given the risks, neighboring countries have been preparing for possible cases for some time.
| Timeline of Key Events in Current Ebola Outbreak |
| August 1, 2018: Outbreak declared by the DRC Ministry of Health |
| Early August 2018: First U.S. CDC staff deployed to North Kivu province to assist in response efforts |
| August 7-8, 2018: Genetic tests confirm outbreak; vaccination efforts begin |
| August-September 2018: U.S. government pulls back staff from outbreak area due to security concerns |
| September 21, 2018: USAID deployed a Disaster Assistance Response Team (DART) to the DRC |
| October 17, 2018: WHO-convened Emergency Committee recommends that “public health emergency of international concern” (PHEIC) not be declared with regard to the DRC Ebola outbreak |
| November 9, 2018: Ebola case count surpasses largest number from previous DRC outbreaks, making this the largest Ebola outbreak in the DRC’s history |
| Late November 2018: Ebola case count surpasses all but the 2014-2015 West Africa outbreak, making this the second largest Ebola outbreak ever |
| Late December 2018: Voting in the DRC elections postponed in certain Ebola-affected areas, sparking protests |
| February 24, 2019: Ebola treatment center attacked and partially burned down, leading Medicins Sans Frontieres (MSF) to suspend services at the center; another center was attacked three days later, leading MSF to suspend its activities in the area |
| March 30, 2019: Ebola case count in this DRC outbreak surpasses 1,000 |
| April 12, 2019: WHO-convened Emergency Committee recommends for a second time that a PHEIC not be declared with regard to the DRC Ebola outbreak |
| April 15, 2019: The DRC Ministry of Health reports over 100,000 people have been vaccinated in this outbreak to date |
| April 19, 2019: WHO epidemiologist from Cameroon killed when a clinic was attacked in Butembo in the DRC |
| June 5, 2019: Ebola case count in the DRC outbreak surpasses 2,000 |
| June 11, 2019: Uganda confirmed first imported case of Ebola, with two additional cases reported the next day |
| June 14, 2019: WHO-convened Emergency Committee recommends for a third time that a PHEIC not be declared with regard to the DRC Ebola outbreak |
| July 14, 2019: The DRC government reports first case in Goma, capital of North Kivu province and a large city of 1-2 million people bordering Rwanda |
| July 17, 2019: WHO-convened Emergency Committee meets for a fourth time; WHO Director-General accepts the Committee’s assessment and declares the DRC Ebola outbreak a PHEIC |
| August 16, 2019: First Ebola cases confirmed in South Kivu province, the third province to see cases in this outbreak. |
| August 29, 2019: Ebola case count in the DRC surpasses 3,000; Uganda reports a fourth imported Ebola case |
| October 18, 2019: WHO Emergency Committee meets again and says the DRC outbreak remains a PHEIC. |
| November 11-12, 2019: Merck’s Ebola vaccine (Ervebo) approved by the European Commission and pre-qualified by WHO, making it the first officially licensed vaccine for Ebola. |
| November 14, 2019: Second Ebola vaccine (from Johnson & Johnson) is introduced into the Ebola response in eastern DRC, with a planned 50,000 people to be vaccinated in Goma. |
| November 27-28, 2019: WHO and other organizations temporarily halt operations and evacuate some staff after armed militia groups kill four people at Ebola response centers and violent protests erupt. |
| NOTES: WHO means World Health Organization. The DRC means the Democratic Republic of the Congo. |
As of December 16, 2019, the DRC Ministry of Health reports the country has had 3,348 cases (see figure below), of which there were 2,210 deaths. The number of new cases reported each week has declined noticeably since the end of July 2019, indicating progress has been made in interrupting transmission. Still, cases continue to occur, and recent violence in some Ebola-affected areas has interrupted the response, sparking concerns about this potentially leading to an increase in Ebola cases. Regardless, response activities could be needed for another several months at least, and another increase in transmission remains a concern. The crude case fatality ratio for this outbreak is high, at 66%, as of December 16, 2019.
Health care workers (HCWs), such as nurses and doctors, caring for Ebola patients have been at particularly high risk of infection. At least 169 cases (about 5% of total cases) over the course of this outbreak have occurred among HCWs. This Ebola outbreak has also disproportionately affected children, with about 15 percent of all cases occurring among children under 5 and a higher proportion of the child cases dying from the disease compared with older age groups.
Multiple issues make responding to this Ebola outbreak more challenging than any prior outbreaks in the DRC. These include:
This combination of factors has made responding to this outbreak a much more difficult challenge compared with previous outbreaks in the DRC (see KFF brief).
U.S. engagement in the current outbreak has been limited compared to its role in the 2014-2015 West Africa Ebola outbreak response, where the U.S. played a major leadership role, mobilizing an unprecedented amount of funding, other resources, and personnel to support the Ebola response. Since then, there have been improvements in the global capacity to respond to Ebola, particularly on the part of WHO, and the DRC has had significant experience in addressing prior Ebola outbreaks; both WHO and the DRC took the lead early on in the current outbreak (see KFF brief). In addition, insecurity in the affected areas of the DRC has prevented U.S. agencies from being more involved, as U.S. personnel have been mostly restricted from working directly in the hardest hit areas due to safety concerns. However, the U.S. has provided significant funding and technical assistance in the DRC and in neighboring countries, working in conjunction with national governments, United Nations (U.N.) agencies, and other organizations leading the response. In fact, the U.S. is the largest donor to the Ebola response effort in the country, having provided over $250 million since August 2018.
While the number of Ebola cases in the DRC continues to decline from a peak over the summer, major challenges remain for the U.S. and other responders, such as: completing the task of interrupting transmission even amid ongoing violence, preventing expansion of the outbreak into other geographic areas, and effectively transitioning from an emergency response to a longer-term development effort to help stabilize and build up health systems in the affected areas.
The U.S. Agency for International Development (USAID) and U.S. Centers for Disease Control and Prevention (CDC) are the two main agencies contributing to the U.S. government response. USAID’s Office of Foreign Disaster Assistance (OFDA) coordinates U.S. emergency response efforts in the DRC, and in September 2018, the agency deployed a Disaster Assistance Response Team (DART) to the DRC in response to the outbreak. USAID’s Bureau for Global Health provides operational and personnel support. Several CDC offices, including the Center for Global Health’s Division of Global Health Protection and the National Center for Emerging and Zoonotic Infectious Diseases’ Division of High-Consequence Pathogens and Pathology (NCEZID/DHCPP), provide technical and personnel support. CDC efforts in the DRC are coordinated through its Emergency Operations Center (EOC) in Atlanta, which was activated in June 2019 at its lowest level (level 3).
Other U.S. agencies engaged in Ebola efforts include the National Institutes of Health (NIH) (conducting research on drug and vaccine development, including Ebola treatment trials in the DRC); the U.S. Food and Drug Administration (FDA) (regulating drug and vaccine development); and the Department of State (coordinating the U.S. and international diplomatic response).
U.S. personnel have been assisting in the DRC since the outbreak was announced in August 2018, but since late August/early September 2018, no U.S. personnel have been allowed to directly engage in response activities in active transmission areas in northeastern DRC. Citing safety concerns due to ongoing violence there, U.S. officials have decided to keep CDC and other U.S. staff away from the front lines of the response. Outside experts have made calls for the U.S. to return CDC staff to affected areas to assist more directly. So far though, there is little indication that the U.S. government will deviate from its current policy, though CDC reports working with the U.S. Department of State to “pre-position CDC staff in Goma to rapidly respond to hotspots where the security situation is permissible.”
Outside of the outbreak zone, U.S. personnel continue to assist. The DART – a “team of disaster and health experts” from USAID and CDC – continues its work in the DRC in response to the outbreak. CDC reports 34 staff working the DRC. Other CDC workers have deployed to WHO headquarters and to neighboring countries, such as Uganda, to assist in keeping the virus from crossing borders and to support countries in preparedness and response activities.
USAID reports providing about $266 million toward the Ebola response in the DRC and surrounding countries since the outbreak began in August 2018. Of this amount, $252 million is for activities in the DRC, while $14 million is for preparedness and response activities in Burundi, Rwanda, South Sudan, and Uganda. No estimate is available for the amount that CDC has spent on its Ebola response activities, though WHO reports the CDC has provided $500 thousand in funding to its efforts. The funding for both USAID and CDC, as well as for other U.S. agencies, in the response is not new funding; rather, it has been drawn from unspent FY 2015 emergency Ebola supplemental appropriations provided by Congress at the time of the West Africa Ebola outbreak. For USAID, leftover funding in the International Disaster Assistance (IDA) account that was designated for “assistance for countries affected by, or at risk of being affected by,” Ebola is being utilized for this purpose, and for CDC, leftover funding that was designated for Ebola international preparedness and response is being utilized. CDC’s leftover funding expired at the end of FY 2019 on Sept. 30, 2019 and, per communication with CDC, was expected to have been entirely spent by that time. In recent months, Congress has stated that CDC may use existing funds in the Infectious Diseases Rapid Response Reserve Fund, which was established in FY 2019, for CDC Ebola response.
The DRC government, including the Ministry of Health, and agencies of the U.N. lead the outbreak response. WHO is the lead U.N. agency for the public health response; other key U.N. actors include the U.N. Office for Coordination of Humanitarian Affairs (OCHA), the U.N. Children’s Fund (UNICEF), the World Food Programme (WFP), and MONUSCO, a multinational peacekeeping force that has been assisting with security. U.N. actors are led by a U.N. Emergency Ebola Response Coordinator.
Other key actors in and supporters of the response include governments of various countries, including the U.S.; multilateral organizations, such as the World Bank and Gavi; international and national non-governmental organizations (NGOs), such as Medicins Sans Frontieres (MSF), International Medical Corps, the Alliance for International Medical Action (ALIMA), and the International Red Cross/Red Crescent; and other partners.
Current public health response efforts in the DRC are focused on interrupting chains of Ebola transmission through identifying, isolating, and caring for cases before they transmit the disease further. The goal of the response is to bring the number of cases down “to zero”. Ebola outbreaks are usually declared to be over after 42 days have passed since the last known case (equal to two incubation periods of Ebola virus disease). A national Strategic Response Plan outlines the overall strategy, objectives, and priority activities for responding to the outbreak. There have been four iterations of the plan to date, each covering a specific period of time. The current plan that focuses on the core public health “pillar” of the response covers planned activities from July through the end of December 2019. It addresses strengthening response capacities in priority areas such as: coordination, surveillance and laboratory capabilities, infection prevention and control measures, vaccination, human resources, security, and risk communication among others. Complementary humanitarian response activities are another “pillar” of the response and outlined in a broader integrated Ebola response strategy, which includes efforts addressing food assistance, employment, and economic development in Ebola-affected regions.
On July 17, 2019, the WHO Director-General accepted the recommendation of the Emergency Committee and declared the DRC Ebola outbreak to be a “public health emergency of international concern” (PHEIC). A PHEIC is “an extraordinary event which is determined to constitute a public health risk to other States through the international spread of disease and to potentially require a coordinated international response.” In its declaration, WHO released a set of recommend actions for affected countries, neighboring countries, and all states. This was the fourth time the Emergency Committee had met to discuss a potential PHEIC declaration for Ebola in the DRC; each of the prior three times the Committee recommended not to do so.
At its most recent meeting, on October 17, 2019, the WHO Emergency Committee again recommended that the PHEIC declaration remain in place.
Vaccination has been an important component of the response since it began. This outbreak marks the first time that an effective vaccine is available and being used as a core component of an Ebola response. Authorities have mostly used a “ring vaccination” approach, targeting vaccination of those who have been in contact with a case of Ebola and the contacts of those contacts, as well as other groups at potential risk of exposure such as health care workers. As of December 8, 2019, over 256,000 people have been vaccinated in the DRC since the start of the outbreak, which has likely prevented hundreds, if not thousands, of Ebola cases already. Authorities have been primarily using a vaccine manufactured by Merck, which the company has provided free of charge to WHO and the DRC for the purposes of the response. The Merck vaccine, which was being deployed on an emergency use basis under a “compassionate use” protocol, received approval from European regulators and prequalification from WHO in November 2019, making it the first officially licensed Ebola vaccine. It is not yet approved and licensed by the FDA (though it is under review and an FDA regulatory decision is expected in early 2020). Costs for vaccine distribution and management of vaccinations in the response are shared among Gavi, WHO, other donors, and the DRC government.
In addition to the vaccination efforts in the DRC, neighboring countries are also vaccinating certain people, such as health workers, in areas at risk of seeing or that have seen Ebola cases due to cross-border spread (like Uganda, with at least 5,000 people vaccinated thus far).
A second Ebola vaccine, manufactured by Johnson & Johnson, is also available. Following recommendations from WHO and other expert groups, the DRC government decided to introduce the second vaccine into some at-risk areas of the country that do not have active Ebola transmission. For example, DRC authorities began vaccinating 50,000 people in Goma with the second vaccine in November 2019, and in December 2019, the DRC and neighboring Rwanda initiated a new vaccination campaign using that vaccine to protect people in at-risk areas on their mutual border.
It appears there are enough doses of the Merck vaccine to meet the demands of the current WHO/DRC government’s ring vaccination approach. Currently there are enough vaccine doses to vaccinate 300,000 people, which is greater than the total number of people vaccinated in the outbreak over the first 17 months of the response. In addition, WHO reports that Merck will produce enough vaccine over the next 6 to 18 months to vaccinate an additional 1.3 million people. Gavi announced in December 2019 that it will support a new global stockpile of 500,000 doses of Ebola vaccine, to be made available for emergency use as needed.
There is reportedly an adequate supply of the second (Johnson & Johnson) Ebola vaccine, with enough to vaccinate approximately 2 million people.
There are no FDA- or other approved treatments for Ebola, though several promising treatments are under development. Four experimental treatments have been studied in a clinical trial among Ebola patients in the DRC, and in August, the U.S. NIH announced that initial results of the trial indicated two of those treatments (the monoclonal antibody mAb114 and the multi-antibody “cocktail” REGN-EB3) showed the most promise. Ebola patients in the DRC enrolled in the trials are offered these two treatments as investigators further evaluate them. The treatments are still under investigation and being offered on a “compassionate use” basis only in the DRC.
From August 2018 through early December 2019 the amount of funding directed to response activities in the DRC included under four iterations of a national Strategic Response Plan has reached $361 million. This amount does not include additional DRC outbreak activities not captured under the plans, nor response costs in Uganda and preparedness costs in neighboring countries.
Funding amounts provided under each of the plans so far:
As mentioned earlier, USAID reports providing about $252 million toward the Ebola response in the DRC and about $14 million for activities in neighboring countries since the outbreak began in August 2018 (this includes funding channeled through the DRC national plans as well as funding not captured under the plans). No estimate is available for the amount that CDC has spent on its Ebola response activities, though WHO reports the CDC has provided $500 thousand in funding to its efforts. All U.S. funding for the current outbreak is drawn from existing funding sources (i.e., no new funding has been appropriated to agencies by Congress for this Ebola response, thus far).
See the KFF data note on donor funding for the response for further information.
Now well into its second year, the Ebola outbreak in the DRC remains challenging for responders, despite having important tools (such as vaccines and new treatment options) on hand. This is because the underlying factors driving transmission of Ebola in the DRC remain. The security situation shows no sign of abating, and there is a fear that it can always worsen. Mistrust of public health authorities also remains a barrier to response efforts. While it is not possible to predict the trajectory of the outbreak, it could take at least a few more months to fully contain even under good circumstances, so given the complex set of challenges being faced, the outbreak could take even longer than that to be brought under control.
Addressing these longstanding challenges more effectively is the aim of the broader integrated response strategy being implemented in the DRC. This strategy, which includes the public health pillar’s current national plan and is designed to guide the response through the end of December 2019, calls for greater community engagement, support for health and development interventions beyond addressing Ebola alone, a new approach to security, and more coordination among all responders.
Finally, the major questions for the U.S. government going forward include: whether or not it will change its approach and engagement in the DRC to allow U.S. government personnel to directly engage in public health activities on the frontlines of the response, how the U.S. will contribute to finally breaking all chains of transmission, and how the U.S. will support efforts to transition from an emergency response to a longer-term strategy for supporting the health care system in the affected areas to help prevent and contain any future recurrences of Ebola or other outbreaks.
Based on analysis of publicly available information, we estimate that donors provided approximately $734 million in overall financial support for the DRC Ebola response from August 2018, when the outbreak began, through early December 2019 (see Table 1). We attributed funding to donor governments for Ebola when designated for this purpose, whether provided bilaterally to the DRC or earmarked for Ebola but provided to a multilateral organization or instrument. We attributed funding to a multilateral organization where that multilateral organization specifically designated general funds for this purpose. Data sources are provided in Table 1.
| Table 1: Donor Funding for the Current Ebola Response in the DRC(Aug. 2018 – Dec. 11, 2019) | ||
| Donor | Estimated Funding(in US$ millions) | Data Source |
| TOTAL | 733.8 | |
| Donor Governments | 424.0 | |
| Australia | 0.4 | DRC/Partners SRP 3 |
| Canada | 2.2 | DRC/Partners SRP 3; WHO |
| China | 3.5 | WHO |
| Denmark | 4.8 | OCHA |
| European Union | 52.4 | European Union |
| France | 1.0 | OCHA |
| Germany | 8.9 | WHO |
| Ireland | 3.4 | OCHA; WHO |
| Italy | 0.9 | OCHA |
| Japan | 5.1 | OCHA |
| Luxembourg | 0.6 | WHO |
| Norway | 3.5 | OCHA |
| South Korea | 1.0 | WHO |
| Sweden | 4.2 | WHO |
| Switzerland | 1.4 | OCHA |
| United Kingdom | 78.4 | U.K.; WHO |
| United States | 252.4 | USAID; WHO |
| Centers for Disease Control and Prevention (CDC) | 0.5 | WHO |
| U.S. Agency for International Development (USAID) | 251.9 | USAID |
| -Office of Foreign Disaster Assistance (OFDA) | 203.0 | USAID |
| -Food for Peace (FFP) | 37.0 | USAID |
| -Bureau for Global Health (GH) | 12.0 | USAID |
| Multilateral and International Organizations | 294.0 | |
| African Development Bank | 1.0 | WHO |
| Gavi, the Vaccine Alliance | 26.5 | Gavi; WHO |
| UNICEF | 0.3 | DRC/Partners SRP 2 |
| U.N. Central Emergency Response Fund (CERF) | 12.6 | U.N. CERF |
| U.N. OCHA/DRC Humanitarian Fund | 10.0 | Humanitarian Fund |
| WHO Contingency Fund for Emergencies (CFE) | 73.1 | WHO/CFE |
| World Bank | 170.0 | World Bank; WHO |
| Pandemic Emergency Financing Facility | 50.0 | World Bank; WHO |
| International Development Association | 120.0 | World Bank; WHO |
| World Food Programme (WFP) | 0.5 | DRC/Partners SRP 3 |
| Non-Profits and Others | 15.9 | |
| Gates Foundation | 6.0 | WHO |
| Paul Allen Foundation | 0.7* | WHO; KFF personal communication |
| Susan T. Buffett Foundation | 5.0 | WHO |
| Wellcome Trust | 4.2 | WHO |
| NOTES: Based on publicly-available information as of Dec. 11, 2019. * Reflects funding through Oct. 2019. May not sum to subtotal/total due to rounding. Does not include funding provided by the Democratic Republic of the Congo (DRC) government itself. OCHA amounts include commitments and paid contributions, not pledges and in-kind contributions. U.N.: United Nations. UNICEF: U.N. Children’s Fund. OCHA: Office for the Coordination of Humanitarian Affairs. | ||
More than half (57.8%) of this funding was provided by donor governments bilaterally, including the U.S., with large share (40.1%) provided by multilateral and international organizations, such as the World Bank, and a small proportion (2.2%) provided by non-profits, such as private foundations.
The U.S. government was the largest donor, having provided $252.4 million for activities within the DRC (see Figure 1 and Box 1), followed by the World Bank ($170 million), the United Kingdom ($78.4 million), the WHO Contingency Fund for Emergencies ($73.1 million), and the European Union ($52.4 million).

Box 1: Key Sources of U.S. Funding for the DRC Ebola Response
U.S. Agency for International Development (USAID)All of the USAID response funds to date have been drawn from unspent FY 2015 emergency Ebola supplemental appropriations, originally provided by Congress in December 2015. These funds, from USAID’s International Disaster Assistance (IDA) account, were designated for “assistance for countries affected by, or at risk of being affected by,” Ebola.Centers for Disease Control and Prevention (CDC)Although CDC has yet to publicly announce the amount of funding it has provided for the outbreak response in the DRC over the past year ($0.5 million is reported by WHO as having been contributed by the CDC), its Ebola response funds from Aug. 1, 2018, through Sept. 30, 2019, have been drawn from unspent FY 2015 emergency Ebola supplemental appropriations designated for Ebola international preparedness and response; according to communication with the agency, this funding was expected to be exhausted by the end of FY 2019, when it was due to expire. In recent months, Congress has stated that CDC may use existing funds in the Infectious Diseases Rapid Response Reserve Fund, which was established in FY 2019 with $50 million and could have additional funds added in FY 2020, for CDC Ebola response.
The DRC government, U.N. agencies such as WHO, and other partners prepared four DRC national Strategic Response Plans (“the plans”) to guide and enumerate resource needs for the Ebola response (see Table 2). We found that about half (49%, $361 million) of donor funding for the response – including about a fifth (19%, $47.9 million) of U.S. funding – was identified as directly supporting the national plans.
| Table 2: Funding Requested for the DRC Ebola Response Under National Plans(Aug. 2018 – Dec. 2019) | ||
| Period | Funding Requested(in U.S. $ millions) | Plan |
| Aug. – Oct. 2018 | 43.8 | Strategic Response Plan 1 |
| Nov. 2018 – Jan. 2019 | 61.3 | Strategic Response Plan 2 |
| Feb. – July 2019 | 147.9 | Strategic Response Plan 3 |
| July – Dec. 2019 | 287.6 | Strategic Response Plan 4 |
| NOTES: Reflects support for public health response activities; the current plan is complemented by a broader strategy that addresses additional activities related to the response. DRC: Democratic Republic of the Congo. | ||
Donors met the funding requests in the first two plans and mostly met that of the third plan. As of early December, they have provided at least $148.3 million (via WHO) toward the fourth plan, which requests $287.6 million for public health response activities from July through December 2019.
Authorities in the DRC have also requested an additional $225.6 million for July through December 2019 under a broader strategy that includes other activities, such as economic development, to address social conditions that drive the outbreak. In support of this broader strategy, some donors have pledged more funding. The World Bank, for example, pledged up to an additional $300 million ($70 million of which has already been provided), and the United Kingdom pledged up to an additional $62.6 million, or £50 million ($9.7 million, or £8 million, of this funding has already been provided for preparedness efforts in neighboring countries, and $23.8 million of this funding has already been provided to WHO). More recently, the European Union has pledged an additional $54.7 million (€50 million) in support of the broader response.
Maintaining a robust response to Ebola in the DRC over the next several months, and maybe even longer, will require additional donor funding. As such, there are several issues for the U.S. and other donors to consider:
The FY 2020 appropriations conference agreement, released by Congress on December 16, 2019 and passed by both the House (12/17) and the Senate (12/19), includes funding for U.S. global health programs at the State Department, the U.S. Agency for International Development (USAID), the Centers for Disease Control and Prevention (CDC), and the National Institutes of Health (NIH). The agreement still needs to be signed by the President. Key highlights are as follows (see table for additional detail):
State Department & USAID:
Centers for Disease Control and Prevention (CDC): Funding for global health provided to the CDC totals $571 million, an increase of $75 million compared to the FY19 enacted level ($496 million) and $114 million above the FY20 Request ($457 million). The entire increase in CDC funding is to support global health security activities.
Fogarty International Center (FIC): Funding for the Fogarty International Center (FIC) at the National Institutes of Health (NIH) totaled $81 million, $3 million above the FY 2019 enacted level ($78 million) and $14 million above the FY20 Request.
Additional Global Health Legislation: The appropriations bill also included the “End Neglected Tropical Diseases Act” as well as the “Preventing Child Marriage in Displaced Populations Act.” Learn more about these two bills on the KFF U.S. Global Health Legislation Tracker here.
Additional Resources:
The table below compares global health funding in the FY 2020 conference agreement to the FY 2019 enacted funding amounts as outlined in the “Consolidated Appropriations Act, 2019” (P.L. 116-6; KFF summary here), the President’s FY 2020 request (KFF summary here).
| Table: KFF Analysis of Global Health Funding in the FY20 Conference Agreement | |||||
| Department / Agency / Area | FY19Enactedi(millions) | FY20Requestii(millions) | FY20Conference Agreement(millions) | Difference(millions) | |
| FY20 Conference– FY19 Enacted | FY20 Conference– FY20 Request | ||||
| State & Foreign Operations (SFOPS) | |||||
| HIV/AIDS | $4,700.0 | $3,350.0 | $4,700.0 | $0(0%) | $1350(40.3%) |
| State Department | $4,370.0 | $3,350.0 | $4,370.0 | $0(0%) | $1020(30.4%) |
| USAID | $330.0 | $0.0 | $330.0 | $0(0%) | $330.0(NA) |
| of which Microbicides | $45.0 | $0.0 | $45.0 | $0(0%) | $45.0(NA) |
| Global Fund | $1,350.0 | $958.4 | $1,560.0 | $210(15.6%) | $601.6(62.8%) |
| Tuberculosisiii | – | $262.0 | – | – | – |
| Global Health Programs (GHP) account | $302.0 | $261.0 | $310.0 | $8(2.6%) | $49(18.8%) |
| Economic Support Fund (ESF) account | Not specified | $1.0 | Not specified | – | – |
| Malaria | $755.0 | $674.0 | $770.0 | $15(2%) | $96(14.2%) |
| Maternal & Child Health (MCH)iv | – | v | – | – | – |
| GHP accountvi | $835.0 | $619.6 | $851.0 | $16(1.9%) | $231.4(37.3%) |
| of which Gavi | $290.0 | $250.0 | $290.0 | $0(0%) | $40(16%) |
| of which Poliovi | $51.5 | $16.0 | $61.0 | $9.5(18.4%) | $45(282.2%) |
| UNICEFvii | $137.5 | Not specified | $139.0 | $1.5(1.1%) | – |
| ESF account | Not specified | $75.5 | Not specified | – | – |
| of which Poliovi | $7.5 | $7.0 | vi | – | – |
| Nutritionviii | – | $89.7 | – | – | – |
| GHP account | $145.0 | $78.5 | $150.0 | $5(3.4%) | $71.5(91.1%) |
| ESF account | Not specified | $11.2 | Not specified | – | – |
| Family Planning & Reproductive Health (FP/RH) | $607.5 | $259.0 | $607.5 | $0(0%) | $348.5(134.6%) |
| Bilateral FPRH | $575.0 | $259.0 | $575.0 | $0(0%) | $316(122%) |
| GHP account | $524.0 | $237.0 | $524.0 | $0(0%) | $287(121.1%) |
| ESF account | $51.1 | $22.0 | $51.1 | $0(0%) | $29.1(132%) |
| UNFPA | $32.5 | $0.0 | $32.5 | $0(0%) | $32.5(NA) |
| Vulnerable Children | $24.0 | $0.0 | $25.0 | $1(4.2%) | $25.0(NA) |
| Neglected Tropical Diseases (NTDs) | $102.5 | $75.0 | $102.5 | $0(0%) | $27.5(36.7%) |
| Global Health Security | $138.0 | $90.0 | $100.0 | $-38(-27.5%) | $10(11.1%) |
| GHP account | $100.0 | $90.0 | $100.0 | $0(0%) | $10(11.1%) |
| Ebola transfer | $38.0 | $0.0 | $0.0 | $-38(-100%) | $0.0(0%) |
| Emergency Reserve Fund | $2.0 | $0.0 | ix | – | – |
| Ebola transfer | $2.0 | $0.0 | $0.0 | $-2(-100%) | $0.0(0%) |
| SFOPs Total (GHP account only) | $8,837.5 | $6,343.5 | $9,092.5 | $255(2.9%) | $2748.9(43.3%) |
| Health & Human Services (HHS) | |||||
| Centers for Disease Control & Prevention (CDC) – Total Global Health | $495.8 | $457.0 | $570.8 | $75(15.1%) | $113.9(24.9%) |
| Global HIV/AIDS | $128.4 | $69.5 | $128.4 | $0(0%) | $58.9(84.7%) |
| Global Tuberculosisx | $7.2 | $7.2 | $7.2 | $0(0%) | $0(0%) |
| Global Immunization | $226.0 | $206.0 | $226.0 | $0(0%) | $20(9.7%) |
| Polio | $176.0 | Not specified | $176.0 | $0(0%) | – |
| Other Global Vaccines/Measles | $50.0 | Not specified | $50.0 | $0(0%) | – |
| Parasitic Diseases | $26.0 | $24.5 | $26.0 | $0(0%) | $1.5(6.3%) |
| Global Public Health Protectionxi | $108.2 | $149.8 | $183.2 | $75(69.3%) | $33.4(22.3%) |
| Global Disease Detection and Emergency Response | $98.4 | Not specified | $173.4 | $75(76.2%) | – |
| of which Global Health Security (GHS) | $50.0 | $99.8 | $125.0 | – | $25.2(25.3%) |
| Global Public Health Capacity Development | $9.8 | Not specified | $9.8 | $0(0%) | – |
| National Institutes of Health (NIH) – Total Global Health | $880.2 | $760.1 | Not yet known | – | – |
| HIV/AIDS | $590.1 | $511.1 | Not yet known | – | – |
| Malaria | $212.0 | $182.0 | Not yet known | – | – |
| Fogarty International Center (FIC) | $78.1 | $67.0 | $80.8 | $2.7(3.4%) | $13.8(20.5%) |
| Notes: | |||||
| i – The FY19 Enacted includes the transfer of $40.0 million in unspent Emergency Ebola funding including: $2.0 million for the Emergency Reserve Fund and $38.0 million for “programs to accelerate the capacities of targeted countries to prevent, detect, and respond to infectious disease outbreaks.” | |||||
| ii – In the FY20 Request, the administration proposed to consolidate the Development Assistance (DA), Economic Support Fund (ESF), the Assistance for Europe, Eurasia, and Central Asia (AEECA), and the Democracy Fund (DF) accounts in to one new account — the Economic Support and Development Fund (ESDF). ESF funding for the FY20 Request reflects the amounts requested by the administration for ESDF. | |||||
| iii – Some tuberculosis funding is provided under the ESF account, which is not earmarked by Congress in the annual appropriations bills and determined at the agency level (e.g. in FY17, TB funding under the ESF account totaled $2.64 million). | |||||
| iv – Some MCH funding is provided under the ESF account, which is not earmarked by Congress in the annual appropriations bills and determined at the agency level (e.g. in FY17, MCH funding under the ESF account totaled $56.54 million). | |||||
| v – It is not possible to calculate total MCH funding in the FY20 request because UNICEF, which has historically received funding through the International Organizations and Programs (IO&P) account, was not specified in the FY20 request. | |||||
| vi – The minority summary of the FY20 conference agreement states that part of the increase in MCH funding is “due to a shift of $7.5 million for polio prevention programs from the Economic Support Fund account to the Global Health Programs account.” | |||||
| vii – UNICEF funding in the FY19 bill and the FY20 Conference Agreement both include an earmark of $5 million for programs addressing female genital mutilation. | |||||
| viii – Some nutrition funding is provided under the ESF account, which is not earmarked by Congress in the annual appropriations bills and determined at the agency level. (e.g. in FY17, nutrition funding under the ESF account totaled $21 million). | |||||
| ix – The explanatory statement accompanying the FY20 Conference Agreement states that the “agreement includes authority to reprogram $10,000,000 of Global Health Program funds to the Emergency Reserve Fund if necessary to replenish amounts used during fiscal year 2020 to respond to emerging health threats.” | |||||
| x – In FY20, the administration proposed to formally transfer $7.2 million from the “HIV/AIDS, Viral Hepatitis, STI and TB Prevention” account to “Global Tuberculosis” activities under “Global Health Programs” at CDC. The FY20 conference agreement formalizes this transfer. The FY19 total has been adjusted to reflect this administrative change. | |||||
| xi – In the CDC FY20 congressional justification, this funding line is titled “Global Disease Detection and Other Programs”. | |||||
| Updated: December 19, 2019 | |||||
Several democratic presidential primary candidates and Members of Congress have proposed or endorsed a “public option” to expand health coverage and lower health care costs, giving people the choice between private insurance and a publicly-sponsored plan. The approaches of public option proposals differ from Medicare-for-all in that they expand upon, rather than replace, current sources of coverage (e.g., employer-sponsored plans, the marketplaces, Medicare, and Medicaid). Similar to Medicare-for-all, a public option could make broader use of Medicare-like provider payment rates, lowering the cost of coverage relative to private insurance. Recent polls find greater support for a public option than for Medicare-for-all.
Democratic candidates Biden, Buttigieg, Steyer, and Warren have each proposed a public option approach that aims to broaden coverage and make health care more affordable. Senator Warren describes her public option as an incremental measure before pushing for subsequent passage of separate Medicare-for-all legislation. Public option proposals vary in how many people would gain coverage, the number of people who shift from their current health plan to the public option, the potential size of the public option, the affordability of coverage, and changes in spending by the federal government and other payers. The impact on coverage and affordability would depend on factors such as eligibility criteria, the scope of covered benefits, the level of subsidies provided, and provider payment rates. See Table 1 for short descriptions of each proposal.
This issue brief presents a high-level view of key questions regarding current public option proposals supported by both presidential candidates and Members of Congress.
As Congress debated the Affordable Care Act (ACA) ten years ago, some lawmakers supported a public option to address anticipated concerns about private insurer participation in new ACA marketplaces and the stability of private plan offerings, and to leverage greater competition to help lower costs and premiums in the marketplaces. The House-passed version of the ACA included a public option, offered only through the marketplace, which would cover the same benefits and be subject to the same standards as other marketplace plans. Ultimately, that provision was dropped from the final legislation when it was considered by the Senate.
Since then, some policymakers have continued to press for a public option. Congressional bills to establish a public option since 2017 have evolved and included other ACA enhancements. This year, presidential candidates have proposed public options that could be even more expansive, offering more Americans a choice between their current private-sector coverage and a public option. Some are described as a glide path or transition to Medicare-for-all.
The health insurance industry and many provider organizations have opposed a public option. Private insurers raise concerns that they would have difficulty competing on a level playing field with a public option, and ultimately would be put out of business. Hospitals and other health care providers raise concerns about the adequacy of payment rates in a public option and potential loss of revenues.
Unlike Medicare-for-all, a new public option would be offered as an option for eligible individuals rather than replacing current sources of coverage. Under most proposals, the public option would be administered by the federal government, as Medicare is today. An alternative approach would allow states to build a public option based on the Medicaid program.
Medicare-for-all proposals aim to achieve universal and cradle-to-grave coverage. In contrast, under a public option proposal, people could still be at risk for coverage lapses when life events (such as job loss or a change in income) force transitions. Some proposals try to minimize coverage gaps by providing for the automatic enrollment of the uninsured or others into the public option. The extent to which a public option would move toward universal coverage would depend in large part on how much it would increase affordability of insurance through lower payment rates to providers and increased subsidies for individuals.
Eligibility for the public option varies across proposals, and some proposals would provide for auto-enrollment of certain individuals. Examples of eligibility differences include:
As noted above, several proposals would auto-enroll certain individuals into the public option with no premium, with an “opt out” if they prefer other coverage – an approach that would expand the size of the public program. The Medicare for America bill would auto-enroll everyone in the public option, while allowing people with access to qualified employer coverage to opt out.
Under the Biden and Buttigieg proposals and others the public option would cover essential health benefits, similar to marketplace qualified health plans (QHPs) and most employer-sponsored health plans.3 Biden’s proposal would extend the “full scope of Medicaid benefits” to enrollees with income up to 138% of poverty. Congressional proposals to create a Medicare buy-in option for older adults would give enrollees the same benefits as the current Medicare program, which differ somewhat from essential health benefits; for example, the current Medicare program does not have a limit on out-of-pocket spending.
Several proposals specify that reproductive services, including abortion, would be covered under the public option, and that the Hyde Amendment, which prohibits federal funding for abortion services in most circumstances, would be repealed.
Under Senator Warren’s proposal and the Medicare for America bill, the public option would cover a substantially broader set of benefits, including long-term services and supports (LTSS), dental benefits, and others. A public option that covers more comprehensive benefits with a broader network of providers than private plans could attract a sicker and more expensive population, which could increase the cost of the public option (and taxes required to support it) while relieving families and others of these expenses.
Rising deductibles and cost-sharing requirements are a growing concern for people with job-based and marketplace coverage. Over the past decade, deductibles in employer plans have risen six times faster than wages. The average deductible under silver-tier marketplace plans is $4,544 per person in 2020 (unweighted), though cost-sharing reduction (CSR) subsidies, available to people with income up to 250% of the federal poverty level (FPL), reduce silver plan deductibles for about half (52%) of marketplace enrollees.
Candidates Biden, Buttigieg, and Steyer would reduce ACA cost-sharing for those in both marketplace plans and the new public option. Their proposals would set the benchmark marketplace plan at the gold level, instead of silver, to lower deductibles and other out-of-pocket costs. Some proposals would expand eligibility for cost-sharing subsidies to those with income above 250% FPL, and up to 400% FPL in some cases.4 Proposals that let would employees elect the public option and receive subsidies instead of job-based coverage could extend cost sharing relief to some low-wage workers.
Warren takes a different approach. In addition to enhancing marketplace cost-sharing subsidies as do the other candidates, cost sharing under the public option would be even lower. Cost sharing in Warren’s public option would be set at the platinum level (which covers 90% of costs) instead of gold (which covers 80% of costs). In addition, deductibles would be eliminated for all public option enrollees, and there would be no cost sharing for enrollees with income up to 200% FPL. Co-insurance would apply for people with incomes above 200% FPL up to an out-of-pocket cap, but would phase out over time. These features would reduce out-of-pocket health care spending for many people relative to private insurance.
How attractive the public option is to individuals will largely depend on the relative affordability of premiums in the public option. The availability and level of premium subsidies will be an important factor, particularly to individuals who are currently ineligible for marketplace subsidies due to income or because they are offered employer coverage. Other factors that could affect the premium in the public option include benefits and cost sharing, and provider payment rates. Premiums for public option enrollees could be higher (or lower) depending on the risk profile of individuals who elect coverage under the public option. If the public option experiences adverse selection, premiums could be higher than private insurance and rise over time, although in virtually all proposals, public option premiums would be capped as a percentage of income for enrollees.
Like marketplace plans, the public option premiums generally could vary by age, geography, family size, and tobacco use.
Most proposals would expand premium subsidies relative to those that are currently available to marketplace enrollees. Several would make the public option free for low-income people – those with income up to 200% FPL under Warren’s proposal, and up to 138% FPL for some or all people under proposals by Biden, Buttigieg, and Steyer. Many would also cap premium contributions for people with higher incomes. Premiums would be capped at 5% of income under Warren, 8% under Medicare for America, and 8.5% under Biden, Buttigieg, and Steyer. These caps are lower than the current 9.78% premium cap, which is only available to people with incomes up to 400% of poverty. Premiums would be eliminated over time under the Warren proposal. In addition, all of the candidate proposals and the Choose Medicare Act (Sen. Merkley/ Rep. Richmond) would enhance marketplace premium subsidies by changing the benchmark plan, on which subsidies are based, from silver level to gold level.
The relative affordability of the public option would also depend on the level of provider payments. This is because private insurers typically pay higher prices than Medicare for covered services. For example, a Congressional Budget Office (CBO) analysis found that Medicare hospital payment rates were 47% below those of commercial insurers, on average, though with wide variation by geography and other factors.5 Medicare’s role in setting payment rates has contributed to slower growth in spending for Medicare than private insurance. Adopting Medicare rates could also reduce or eliminate the problem of surprise medical bills, as Medicare limits what providers can charge and prohibits balance billing.
However, health care providers are likely to oppose this approach, based on concerns about the adequacy of payment rates, and the impact on patient care. An ongoing question is how hospitals and other health care providers would respond to lower payment rates, and whether they would be able to achieve efficiencies without jeopardizing quality of care.
One controversial element of Medicare-for-all is that it would replace private coverage that people have today. Public option proposals would instead retain current coverage and offer an additional choice. Candidates Biden, Buttigieg, Warren and Steyer all would let people with job-based plans opt for the public option and receive subsidies for that coverage (this is also a feature of the Medicare for America bill). Warren would also offer substantially more generous benefits under the public option than most employers offer today. The relative attractiveness of the public option – e.g. due to its covered benefits or subsidies – could lead more workers to elect it over time, ultimately diminishing the role of employer coverage.
The broad availability of a public option could also lead some employers to decide to stop offering plans they sponsor today. Whether and which firms continue offering private coverage would depend on a number of factors, including how many enrollees would prefer to keep their employer plan, the average cost of covering remaining employees, and the employer’s cost of maintaining the plan relative to the cost of paying the large employer mandate penalty under the ACA. The substantial federal tax preference accorded to employer-sponsored group health benefits today could also affect decisions of firms to keep offering job-based coverage and worker decisions to participate. Unlike wages, health benefits are not subject to federal income or payroll tax.
The public option could also significantly affect non-group insurance. A public option could strengthen incentives for private insurers to compete on value and cost. A new public option could offer consumers an additional plan choice, particularly in marketplace areas served by a single insurer. On the other hand, if private insurers are unable to compete effectively, the public option could draw substantial enrollment away from them and might become the sole option in at least some areas.
All of the public option proposals would retain the current Medicare program. Although many invoke the Medicare name, such as Medicare For All Who Want It, Medicare Choice, and Medicare Part E, the new public options are intentionally structured to be separate from the current Medicare program and differ from it in many respects.
Most proposals would not allow people who are eligible for the current Medicare program to enroll in the new public option, and most leave the current program as is. Some create a firewall between the new public option and Medicare, explicitly stating that the new public option will not have any effect on premiums in the current Medicare program or finances (e.g. the Medicare Hospital Insurance Trust Fund).
Some proposals would make improvements to the current Medicare program. The Buttigieg proposal and the Merkley bill, for example, would add an out-of-pocket limit to traditional Medicare. The Higgins bill would create a new voluntary Medigap option to make cost sharing more affordable for people with Medicare. Virtually all of the proposals would address the price of prescription drugs in Medicare as they do for the public option (e.g., allow the government to negotiate lower prices). Warren’s proposal would match benefits under the current Medicare program to the public option “to the extent possible”.
In contrast to other proposals, the Warren proposal would lower the age of eligibility for Medicare to 50, but would allow people age 50-64 to go in (or out) of the Medicare program. Her proposal would automatically enroll all 50-64 year olds who are uninsured or living on incomes below 200% of poverty into the Medicare program with no premiums, deductibles or cost sharing. This approach would substantially increase the size of the current Medicare program, and could potentially affect the Medicare Hospital Insurance Trust Fund unless safeguards are put in place. At the same time, the infusion of younger adults into the current Medicare program could lead to lower per capita costs, which could result in lower Medicare premiums.
Proposals also differ in what happens to the Medicaid program and in how they address the coverage gap in states that have not adopted the Medicaid expansion. Many congressional proposals would retain the Medicaid program and would not permit people eligible for Medicaid to enroll in the public option; they also would not address the lack of coverage for poor adults living in states that did not expand Medicaid. In contrast, the presidential candidates’ proposals and the Medicare for America bill would have broader implications for Medicaid, and most would cover low-income adults in non-expansion states.
Candidates Biden, Buttigieg, and Steyer would auto-enroll into the public option low-income uninsured individuals living in the 14 states that did not expand Medicaid. These individuals would receive free coverage through the public option. The Buttigieg plan would allow individuals who are uninsured, have private coverage or Medicaid to opt into the public option while plans offered by Biden and Steyer would allow states to shift some or all of their Medicaid enrollees into the public option and make a maintenance of effort (MOE) payment instead, though how that MOE would work is not specified. These proposals do not specify whether the public option would cover all benefits that are currently covered by Medicaid, such as LTSS and non-emergency medical transportation, for this population.
Warren’s proposal would auto-enroll into the public option, with an opt out, a much larger group of people, including people who are currently eligible for Medicaid or in the Medicaid coverage gap. Children up to age 18 would be auto-enrolled, as would adults up to age 50 with incomes below 200% of poverty. Adults age 50-64 would be eligible for Medicare. Under this proposal, the public option and expanded Medicare program would be offered as an alternative to Medicaid and CHIP. States would also be permitted to move other Medicaid enrollees into the public option and make an MOE payment instead, thus eliminating Medicaid altogether in these states.
This proposal raises a number of important questions for the Medicaid population, particularly adults age 50-64 with long-term care needs, as well as for states. For example, while the public option would guarantee coverage vision, dental, and LTSS, these benefits would only be provided to the “greatest extent possible” under Medicare. The proposal also does not specify if low-income individuals ages 50-64 in Medicare would have access to free coverage, as would be the case for younger adults and children under the public option.
Unlike other proposals, the Medicare for America bill would explicitly eliminate the Medicaid program, moving all Medicaid enrollees into the public option. To ensure Medicaid enrollees receive the same coverage under the public option, Medicare for America would cover all benefits provided by state Medicaid programs as part of the benefit package.
One congressional bill (Schatz/Lujan) differs from the others in that it would permit states to build on the existing Medicaid infrastructure to create a Medicaid-like public option. Yet, even with this proposal, the Medicaid program would remain intact for existing Medicaid enrollees — the Medicaid buy-in would target those who are eligible for marketplace coverage, not those currently eligible for Medicaid. Although it seeks to address the coverage gap, it would do so by extending 100% federal financing for the expansion for three years for any state that newly adopts the expansion. Individuals with incomes below 138% of poverty in states that continue to refuse to adopt the expansion would remain uninsured and without an affordable coverage option.
The Congressional Budget Office (CBO) has not estimated any of the public option bills introduced in the 116th Congress. In general, a public option can be expected to have less of an effect on federal spending and revenues than Medicare-for-all. The federal cost of a public option could be higher or lower depending on many factors, including benefits, subsidies, the number of people who enroll, and the extent to which costs shift from individuals and other payers to the public option. Federal spending could also rise due to induced demand resulting from more people with coverage, and lower cost-related barriers to care. New federal costs could be offset somewhat to the extent the public option uses lower provider payment rates. The cost of federal marketplace subsidies could also be offset to the extent that public option premiums are lower than what commercial insurers charge today, depending on the details of how subsidies are determined.
A public option could also affect costs borne by individuals, employers and states. Proposals that provide enhanced cost-sharing and premium subsidies in the public option, and make more people eligible for these subsidies, could improve affordability for millions of Americans. However, public option proposals do not go as far as Medicare-for-all proposals that eliminate premiums and cost-sharing and provide comprehensive benefits. Employers could realize savings if employees opt into the public option, subject to contribution requirements. Employers could also achieve savings if they are able to access public option provider payment rates. The fiscal impact on states would depend on the extent to which Medicaid enrollees would shift to the public option, and related MOE requirements.
Recent polls have shown substantial support for a public option, relative to Medicare-for-all, in part because it would give individuals another “choice” rather than require all people to be covered under one program that replaces current sources of coverage. Public support for Medicare-for-all drops when people are told that it would eliminate private insurance and employer-sponsored coverage, and threaten the Medicare program. The public option is viewed as less disruptive than Medicare-for-all, even though it could replace a significant amount of private plan coverage under some proposals. In fact, support for a public option drops when people are told it could reduce payments to hospitals and doctors or lead to too much government involvement in health care.
A public option could have a modest or significant effect on health coverage and costs in the U.S., depending on how it is structured. The effect could be minimal if the public option is available to a limited subset of the population, with benefits, cost sharing and subsidies similar to marketplace coverage, and if providers can participate voluntarily with little change in their payment rates. However, a public option could have a more dramatic impact on coverage and costs if it is widely available, offers more comprehensive benefits at lower costs, extends subsidies to people now in job-based plans, and uses Medicare provider payment rates.
Ultimately, with many different proposals on the table, it is important to examine key details that could determine the impact of a public option on coverage and affordability, and the level of disruption to the current health care system.
| Table 1: Public Option Proposals Introduced by Presidential Candidates | |
| PRESIDENTIAL CANDIDATES’ PUBLIC OPTION PROPOSALS | |
| Proposal | General Approach |
| Biden The Biden Plan To Protect & Build On The Affordable Care Act |
|
| Buttigieg |
|
| Steyer |
|
| Warren My First Term Plan For Reducing Health Care Costs In America And Transitioning To Medicare For All |
|
| CONGRESSIONAL PUBLIC OPTION PROPOSALS | |
| Proposal | General Approach |
| Cardin |
|
| Stabenow/ Higgins |
|
| Schatz S.489, State Public Option Act |
|
| Bennet/ Delgado S.981 / H.R.2000, Medicare-X Choice Act of 2019 |
|
| Schakowsky H.R.2085, CHOICE Act |
|
| Merkley S.1261, Choose Medicare Act |
|
| DeLauro H.R.2452, Medicare for America Act of 2019 |
|
| NOTES: Candidate proposals are listed by order of introduction within each category. Amy Klobuchar also supports a public option, per her campaign website, but does not outline a specific proposal. Andrew Yang announced his support for giving employees the option to enroll in Medicare-for-all instead of an employer plan. Elizabeth Warren has also introduced a separate proposal for Medicare-for-all; she describes her public option plan as a transition to Medicare-for-all. Congressional proposals are listed by order of introduction within each category. For more detail on congressional bills, see Compare Medicare-for-all and Public Plan Proposals | |

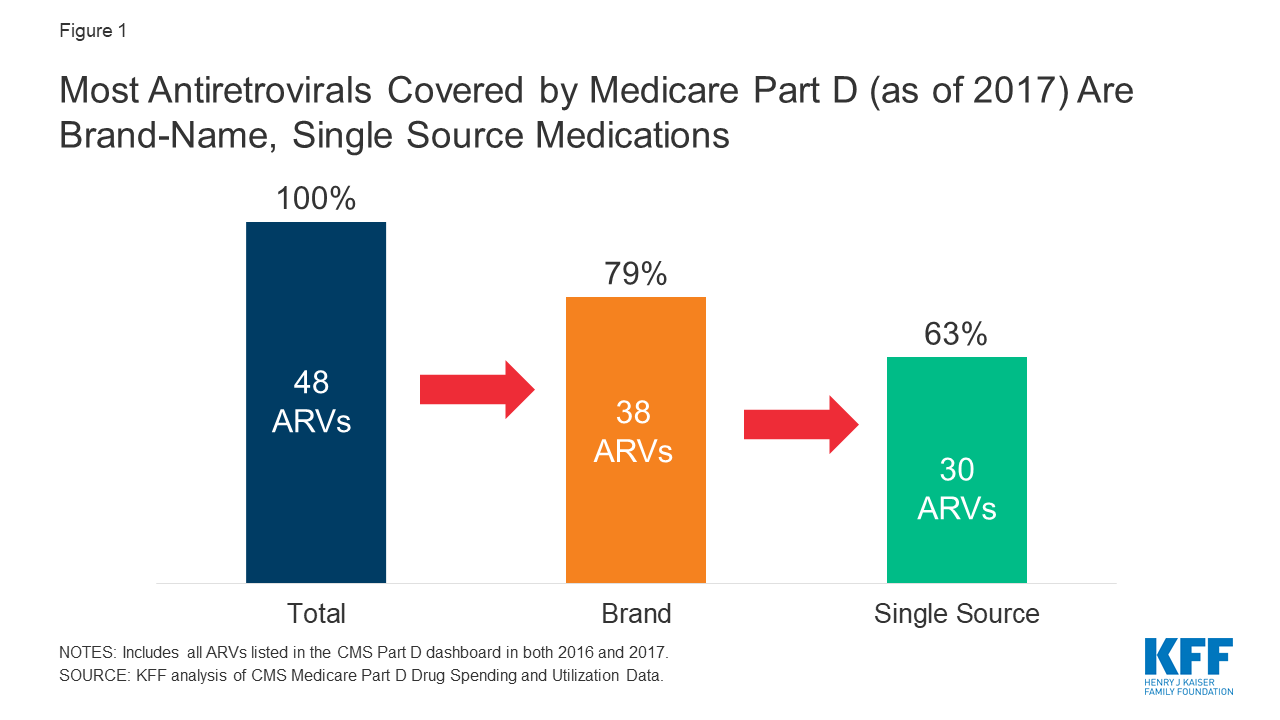
Drug price concerns in the U.S., including for antiretrovirals, the mainstay of HIV treatment and, increasingly prevention, have prompted the introduction of several policy proposals. One proposal would require manufacturers to provide a rebate to Medicare if prices increase faster than inflation. As a drug class, ARVs lack competition in the U.S. market and few generic options are available, leading to particular concerns over their pricing. We assessed list price changes between 2016 and 2017 for ARVs under Medicare Part D, which is required to cover all or substantially all ARVs. During this period, 48 ARVs were covered by Part D, 38 of which were brand medications and 30 were single source.
According to our analysis:
These findings suggest that current proposals that seek to control Part D prices relative to inflation could yield savings.
Ongoing concerns about prescription drug pricing and affordability in the United States have prompted the introduction of policy proposals from the White House, members of Congress, and presidential candidates. Some of these proposals would require drug manufacturers to pay a rebate to the federal government if their prices for drugs covered under Medicare Part B and Part D increase by more than the rate of inflation. Indeed, a recent KFF analysis found that list price increases for more than half of Medicare Part D drugs exceeded inflation in 2017, in some cases by a substantial margin, suggesting opportunities for significant savings under these plans.
We used the same methodology to assess price changes for antiretroviral medications (ARVs) under Part D, which is required to cover all or substantially all ARVs as one of six protected drug classes. ARVs are the mainstay of HIV treatment and, increasingly prevention. National treatment guidelines recommend initiating ARV treatment upon an HIV diagnosis; for those at high risk, pre-exposure prophylaxis, or PrEP, with ARVs is recommended to prevent HIV acquisition.
While only a small share of people in the U.S. have HIV or are on PrEP, spending on ARVs has an outsized impact on prescription drug spending across payers. In addition, concerns have been raised about ARV drug pricing and affordability specifically, where list prices for a typical recommended HIV treatment regimen could range from $22,000 to $38,000 per year. High prices are, in part, driven by the lack of manufacturer competition and minimal availability of generic substitutes within the U.S. ARV market, the very types of drugs targeted by several of the prescription drug policy proposals.
To assess changes in the list prices of ARVs covered by Medicare Part D relative to inflation, we used data from the CMS Medicare Part D Spending Dashboard to identify ARVs used in the two most recent years available (2016 and 2017). List price changes were measured by one-year (2016-2017) changes in average spending per dosage unit amounts reported. Our analysis is based on unit prices that do not reflect manufacturer rebates and discounts to plans, which are considered proprietary and therefore not publicly available (the major proposals being considered are not based on post-rebate prices). Inflation was measured over the same period using the Consumer Price Index for all urban consumers (CPI-U), which was 1.7% between 2016 and 2017. A full methodology can be found here.
The 2019 Medicare Part D Spending Dashboard includes 48 antiretrovirals that were utilized in 2016 and 2017, including both brand and generic drugs (see Table 1). Most ARVs (38 or 79%) were brand medications and almost two-thirds (30 or 63%) were single source, meaning they had no generic alternative (see Figure 1).

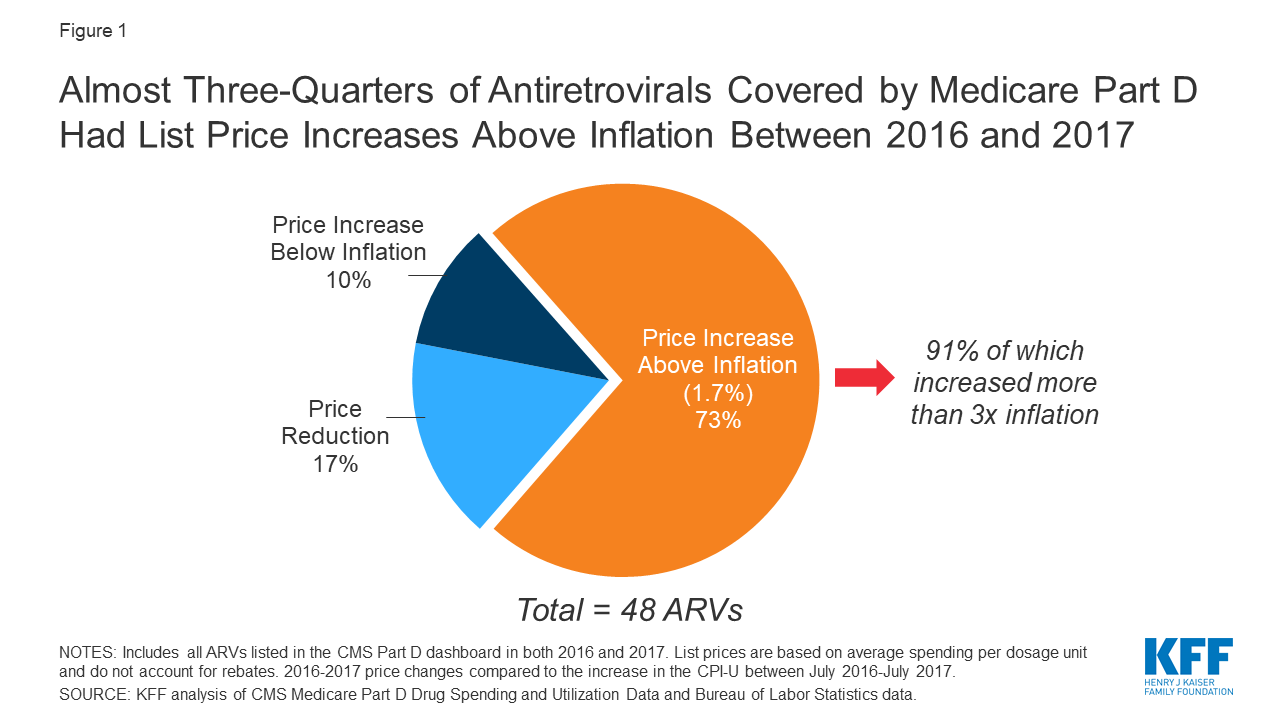
Of the 48 ARVs reported in the 2017 Part D dashboard, almost three-quarters (35 drugs or 73%) had list price increases that exceeded inflation between July 2016 and July 2017 (1.7%). This compares to 60% of Part D medications overall. Most of these price increases were more than 3 times the rate of inflation. Almost all drugs with price increases exceeding inflation were brand-name medications (32), and the vast majority were single source (27). Of the remaining ARVs, 10% (or 5 drugs) had list price increases below inflation between 2016 and 2017, and 17% (8 drugs) had price decreases over this period. All 8 of the ARVs with price decreases were available as generics (see Figure 2).

We examined price increases for ARVs with the highest spending and utilization among Part D enrollees. Among the 10 ARVs with the highest Part D spending in 2017, all were brand-name, single source medications, and all had list price increases exceeding inflation by at least 5 percentage points (see Figure 3). For instance, Genvoya, the ARV with the highest Part D spending, had a price increase of 7.4%. Triumeq, the ARV with the second highest spending, had a price increase of 9.6%, nearly six times the rate of inflation. Truvada, used for HIV treatment as well as PrEP, had the fourth highest Part D spending, and a list price increase of 7.5%. Until 2019, Truvada was the only ARV approved for PrEP.

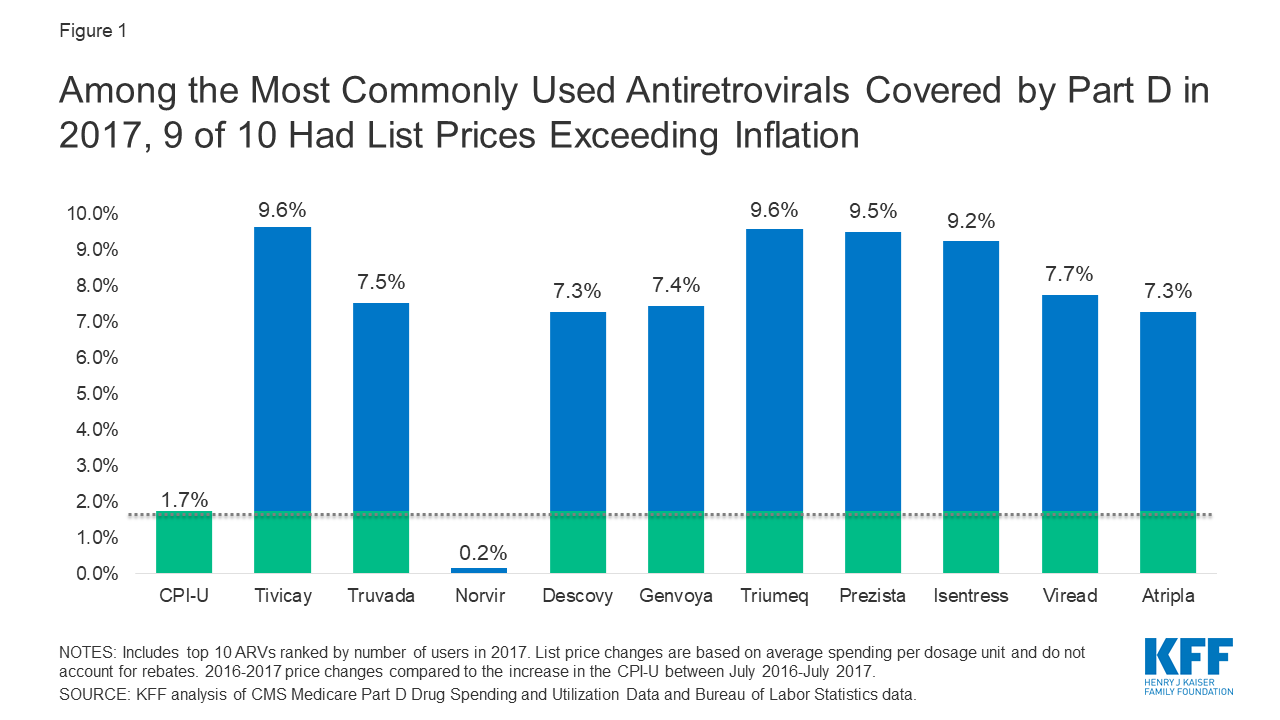
Among the top 10 most commonly used ARVs, 9 had list price increases exceeding inflation by at least 5 percentage points and, as with spending, all were brand-name, single source drugs (see Figure 4). The top two most commonly used ARVs – Tivicay and Truvada, each with over 36,000 users in 2017 – had list prices that increased by 9.6% and 7.5%, respectively.

As with Medicare Part D drugs overall, the majority of ARVs had price increases that exceeded the rate of inflation by several percentage points. Moreover, reflecting the lack of competition within the U.S. ARV market, most of these were brand-name, single source medications, including those with the highest spending and greatest utilization, the very types of medications targeted by current policy proposals. These findings suggest that such proposals could yield savings for public and private payers and for patients. However, proposals that place limits on year-to-year drug price increases may incentivize manufactures to introduce newer medications at higher prices. This could present particular challenges in the case of HIV, where several newer treatment and prevention regimens are on the near-term horizon.
| Table 1: List Price Changes Between 2016-2017 for ARVs by Total Medicare Part D Spending in 2017 | |||
| Drug Name | Total Part D Spending in 2017 | Number of Users in 2017 | 2016-2017 List Price Change |
| Genvoya | $689,941,011.34 | 28,632 | 7.4% |
| Triumeq | $650,941,450.22 | 27,561 | 9.6% |
| Tivicay | $518,431,674.93 | 36,611 | 9.6% |
| Truvada | $416,800,910.94 | 36,552 | 7.5% |
| Atripla | $415,313,758.64 | 18,148 | 7.3% |
| Descovy | $404,070,231.27 | 31,533 | 7.3% |
| Prezista | $350,738,609.34 | 27,211 | 9.5% |
| Isentress | $320,942,015.53 | 25,667 | 9.2% |
| Odefsey | $228,725,946.87 | 10,664 | 7.2% |
| Prezcobix | $223,824,222.87 | 16,153 | 9.0% |
| Stribild | $171,008,928.08 | 7,411 | 8.4% |
| Viread | $166,748,054.55 | 20,409 | 7.7% |
| Reyataz | $145,194,479.40 | 11,682 | 6.6% |
| Complera | $109,054,960.06 | 5,263 | 8.3% |
| Norvir | $100,716,172.19 | 35,212 | 0.2% |
| Intelence | $99,729,416.45 | 9,108 | 10.2% |
| Sustiva | $57,430,302.28 | 6,195 | 7.5% |
| Selzentry | $49,645,406.08 | 3,282 | 9.4% |
| Kaletra | $38,421,347.87 | 4,721 | 7.1% |
| Abacavir-Lamivudine | $36,163,620.28 | 9,471 | -30.2% |
| Edurant | $33,470,096.30 | 3,957 | 9.1% |
| Evotaz | $32,508,946.37 | 2,426 | 7.4% |
| Epzicom | $26,139,505.74 | 4,150 | -2.0% |
| Lexiva | $17,792,125.43 | 1,541 | 9.1% |
| Abacavir | $16,159,350.36 | 8,022 | -5.8% |
| Lamivudine | $12,136,669.35 | 9,734 | -7.3% |
| Abacavir-Lamivudine-Zidovudine | $10,164,840.09 | 973 | 3.2% |
| Emtriva | $9,769,395.38 | 2,828 | 0.2% |
| Lamivudine-Zidovudine | $8,943,870.54 | 4,035 | -20.1% |
| Nevirapine ER | $8,783,702.01 | 2,042 | -10.1% |
| Viracept | $7,356,137.42 | 799 | 8.9% |
| Fuzeon | $5,917,901.94 | 198 | 6.5% |
| Invirase | $3,824,859.01 | 350 | 6.6% |
| Aptivus | $2,780,380.01 | 196 | 7.8% |
| Combivir | $1,129,748.72 | 165 | 2.0% |
| Nevirapine | $956,975.66 | 2,585 | 1.4% |
| Didanosine | $885,882.06 | 522 | 10.8% |
| Ziagen | $861,764.65 | 331 | -6.5% |
| Trizivir | $799,844.30 | 94 | 3.6% |
| Viramune XR | $757,400.11 | 212 | 7.3% |
| Zidovudine | $562,555.68 | 1,857 | -0.5% |
| Crixivan | $510,444.65 | 145 | 0.2% |
| Epivir | $437,552.20 | 466 | 58.3% |
| Viramune | $437,525.85 | 86 | 5.4% |
| Stavudine | $310,975.88 | 531 | 7.0% |
| Tybost | $182,986.76 | 163 | 6.7% |
| Rescriptor | $104,025.14 | 24 | 7.3% |
| Videx EC | $8,506.46 | — | 0.6% |
| NOTE: List price changes are based on average spending per dosage unit and do not account for rebates. – indicates data not available due to small sample size.SOURCE: KFF analysis of CMS Medicare Part D Drug Spending and Utilization Data, 2016-2017. | |||