News Release

About 1.5 Million Teachers are at Higher Risk of Serious Illness From COVID-19

Published: Jul 10, 2020

As local, state and federal official debate when and how to reopen schools across the nation, a new KFF analysis estimates nearly 1.5 million teachers have health conditions that put them at higher risk of serious illness if they were to contract COVID-19. This represents nearly one in four (24%) of all teachers around the country, creating challenges for schools trying to provide in-person classroom education safely for students and teachers alike.

While children are at less risk for serious illness from COVID-19 than adults and often have mild or no symptoms when infected, teachers and other adult staff in schools face higher risk.

The analysis finds teachers are similar to the broader workforce in terms of the share who are considered high risk for serious illness from COVID-19 as identified by the Centers for Disease Control and Prevention.  Factors that put someone at risk include being at least 65 years old; having diabetes, chronic obstructive pulmonary disease, heart disease, or moderate or severe asthma; being severely obese; and having a compromised immune system, as often occurs during cancer treatment.

Education is primarily a state and local concern, and although they have received mixed guidance from federal officials, decisions over reopening will be made at the state and local level.

One challenge for school systems is the sheer volume of traffic and tight quarters in many school environments, which may make social distancing difficult in the classroom and other settings. How state and local officials balance the desire to reopen schools with the need to assure the safety of students, parents, and school personnel will be have significant health and economic consequences for people and communities.

Growing COVID-19 Hotspots in the U.S. South and West will Likely Widen Disparities for People of Color

Published: Jul 10, 2020

The number of COVID-19 cases in the U.S. is expanding rapidly, particularly in many states in the South and West. While the locations of outbreaks continue to move across the country, surging in some states and falling in others, much of the recent case growth has been occurring in the South and West. As of July 8th, we identified 33 states as hotspots (experiencing recent increases in cases and an increasing positivity rate or positivity rate over 10%), 23 of which were in the South and West. The shifting surge in outbreaks to the South and West will likely exacerbate the disparate effects of COVID-19 for people of color, who already are facing a higher burden of cases, hospitalizations, and deaths as well as a larger economic toll compared to their White counterparts. Hispanic people may be particularly hard hit as outbreaks rise in these areas.

Just over half (51%) of people in the U.S. reside in these 23 Southern and Western hotspot states, but these states are home to seven in ten of all Hispanic individuals (71%) (Figure 1). Moreover, roughly six in ten Asian (59%) and American Indian and Alaska Native  (AIAN) (57%) people live in these states, as do over half (51%) of Black people. Overall, nearly two-thirds of people of color (62%) reside in these states, compared to less than half of White people (43%).

Figure 1: Seven in Ten Hispanic People in the U.S. Live in Southern and Western Hotspot States

In addition, people of color account for a larger share of the population compared to their share of the total U.S. population in a number of these states. For example, in 9 of the 23 Southern and Western hotspot states, Black people make up a larger share of the population compared to their share of the total U.S. population (12%). These states include Georgia (31%), Louisiana (32%), and Mississippi (38%), where more than three in ten residents are Black. AIAN people also make up a larger share of the population in 9 of these 23 states, including Montana (6%), New Mexico (9%), and Alaska (16%), compared to their share of the total U.S. population (<1%). Similarly, while 18% of the total U.S. population is Hispanic, they make up a higher share of the population in 7 of these 23 states, including roughly a third or more of the population in Arizona (32%), California (39%), Texas (40%), and New Mexico (49%). Asian people also account for a higher share of the population in Nevada (8%), Washington (9%), California (15%), and Hawaii (38%) compared to the U.S. overall (6%).

Moreover, within many of these states, COVID-19 has already disproportionately affected people of color. Based on data reported as of July 6, Black people accounted for a higher share of COVID-19 related deaths compared to their share of the population in 13 of these states that were reporting deaths by race/ethnicity. Similarly, Hispanic people made up a larger share of cases compared to their share of the population in 13 states, including in Tennessee and Arkansas, where their share of cases is over three times higher than their share of the population. There are also striking disparities for AIAN and Asian people in some of these states. For example, in Arizona, AIAN people made up 7% of cases and 16% of deaths compared to just 4% of the population and, in Nevada, Asian people made up 14% of deaths compared to 8% of the population.

The large number of people of color living in COVID-19 hotspots coupled with the already disproportionate impact for people of color will likely lead to further growth in disparities as the outbreak shifts to the South and West. Potential growing impacts for the large shares of Hispanic and Asian people living in these areas heighten the importance of providing information and services in linguistically and culturally appropriate ways and addressing potential fears that could make those who have an immigrant family member hesitant to access services. Prior to the pandemic, growing research showed that many immigrant families were increasingly fearful of accessing services, including health care services, due to recent immigration policy changes. Rising cases will likely compound the major challenges AIAN people already are facing due to the pandemic and widen disproportionate impacts for Black individuals, as these groups are at increased risk of experiencing serious illness if they contract the virus due to high rates of underlying health conditions. People of color also are at increased risk of exposure to the virus, face increased barriers to testing and treatment, and are more vulnerable to financial challenges due to the pandemic due to social and economic circumstances.

As discussed in previous work, the disparate impacts of COVID-19 mirror and compound existing racial and ethnic disparities in health and health care that are driven by broader underlying structural and systemic barriers, including racism and discrimination. For example, people of color are more likely to be uninsured, report poorer access to health care, and face increased economic and social challenges compared to their White counterparts. Further, 8 of these 23 hotspot states have not yet implemented the ACA Medicaid expansion to low-income adults, leaving a gap in coverage for poor adults in these states.

Together the findings point to the importance of prioritizing health equity as part of response and relief efforts and directing resources to communities who are at the highest risk and experiencing disproportionate effects. Such efforts include collecting data to monitor the impact across communities; working with trusted community members and leaders and providing information in linguistically and culturally appropriate ways to effectively reach individuals; making testing and care readily accessible within communities to facilitate access to services, including for those who are uninsured; and providing adequate resources and support to help prevent spread of the virus. At the same time, broader efforts to address systemic and structural barriers both within and outside the health care system remain pivotal to addressing the underlying health inequities that have been highlighted and exacerbated by the COVID-19 pandemic.

Read the news release.

House Appropriations Committee Approves FY21 State and Foreign Operations (SFOPs) Appropriations Bill

Published: Jul 9, 2020

UPDATED: The House Committee on Appropriations approved the FY 2021 State & Foreign Operations (SFOPs) appropriations bill (and accompanying report) on July 9, 2020 (a draft version of the bill was released on July 6 and the accompanying report was released on July 8). The SFOPs bill includes funding for U.S. global health programs at the State Department and the U.S. Agency for International Development (USAID). Funding for these programs, through the Global Health Programs (GHP) account, which represents the bulk of global health assistance, totaled $9.2 billion, an increase of $64.5 million (1%) above the FY 2020 enacted level and $3.2 billion (53%) above the President’s FY 2021 request. The bill provides higher levels of funding for almost all program areas compared to the FY 2021 request. The bill also provides $10 billion in emergency funding for global COVID-19 response efforts through the Department of State and USAID. Key highlights are as follows (see Table 1 for additional detail on global health funding and Table 2 for additional detail on emergency funding for COVID-19):

  • Bilateral HIV funding through the President’s Emergency Plan for AIDS Relief (PEPFAR) is $4,700 million ($4,370 million through State and $330 million through USAID), matching the FY 2020 enacted level, and $1,520 million (48%) above the FY 2021 request ($3,180 million).
  • The House bill includes $1,560 million for the U.S. contribution to the Global Fund to Fight AIDS, Tuberculosis and Malaria (Global Fund), matching the FY 2020 enacted level and $902 million (137%) above the FY 2021 request ($657.6 million).
  • Funding for tuberculosis (TB) totals $310 million, matching the FY 2020 enacted level, and $35 million (13%) above the FY 2021 request ($275 million).
  • Funding for malaria totals $755 million, $15 million (2%) below the FY 2020 enacted level ($770 million), and $46.5 million (7%) above the FY 2021 request ($708.5 million).
  • The House bill includes $850 million for maternal and child health (MCH), matching the FY 2020 enacted level and $190 million (29%) above the FY 2021 request ($660 million). Specific areas under MCH include:
    • Gavi, the Vaccine Alliance funding totals $290 million, matching the FY 2020 enacted and FY 2021 request levels.
    • Polio funding totals $61 million, matching the FY 2020 enacted level. The President’s FY 2021 request did not specify funding for polio.
    • Funding for the U.S. contribution to the United Nations Children’s Fund (UNICEF) provided through the International Organizations and Programs (IO&P) account totals $139 million, matching the FY 2020 enacted level. The President’s FY 2021 request did not specify funding for UNICEF.
  • Funding for nutrition totals $145 million, $5 million (3%) below the FY 2020 enacted level ($150 million), and $55 million (61%) above the FY 2021 request ($90 million).
  • Bilateral family planning and reproductive health (FP/RH) funding totals $750 million ($585.5 million through GHP and $164.5 million through the Economic Support Fund account), $175 million (30%) above the FY 2020 enacted level ($575 million). The FY 2021 request specified FP/RH funding through the GHP account only ($237 million); the House bill provides $585.5 million for FP/RH through the GHP account, $348.5 million (147%) above the FY 2021 request.
  • Funding for the United Nations Population Fund (UNFPA) totals $55.5 million, $23 million (71%) above the FY 2020 enacted level ($32.5 million). The President’s FY 2021 request proposed eliminating funding for UNFPA. In FY 2020 the Trump Administration invoked the Kemp-Kasten amendment to withhold UNFPA funding (learn more about the Kemp Kasten amendment here). The House FY 2021 bill notes that if this funding is not provided to UNFPA it “shall be transferred to the ‘Global Health Programs’ account and shall be made available for family planning, maternal, and reproductive health activities.”
  • Funding for the vulnerable children program totals $24 million, $1 million (4%) below the FY 2020 enacted level. The President’s FY 2021 request proposed eliminating funding for this program.
  • Funding for neglected tropical diseases (NTDs) totals $102.5 million, matching the FY 2020 enacted level and $28 million (37%) above the FY 2021 request ($75 million).
  • Funding for global health security totals $125 million, an increase of $25 million (25%) above the FY 2020 enacted level ($100 million) and $35 million (39%) above the FY 2021 request ($90 million).
  • The House bill states that “up to $50,000,000 of the funds made available under the heading ‘Global Health Programs’ may be made available for the Emergency Reserve Fund.” The FY 2021 request provided $25 million for the Emergency Reserve Fund through the GHP account, $25 million below the House level.
  • Funding for the World Health Organization (WHO) totals $319 million ($200 million through GHP and $119 million through the Contributions to International Organizations account). Funding for the WHO in the FY 2020 enacted bill and FY 2021 request was provided through the CIO account only — $122.7 million in the FY 2020 enacted bill ($3.8 million above the House level) and $57.9 million in the FY 2021 request ($61 million below the House level). The President has moved to suspend funding to the WHO and formally withdraw U.S. membership from the organization (learn more about the U.S. government and WHO here).
  • Coronavirus pandemic preparedness and response emergency funding for global efforts totals $10 billion, of which $2.5 billion is provided through the GHP account at USAID, including:
    • $150 million transferred to the Emergency Reserve Fund, based on a determination by the Secretary of State,
    • $750 million for Gavi, the Vaccine Alliance, and
    • $800 million for the Global Fund.
    • Additional funding provided through other accounts is detailed in Table 2 below.

The SFOPs bill also includes the following policy provisions:

  • The Global HER Act, which would permanently repeal the Protecting Life in Global Health Assistance, also known as the Mexico City Policy, reinstated by President Trump in January 2017 (learn more about the Mexico City Policy here)
  • The bill includes a prohibition on the use of current or prior funds for implementing the Mexico City Policy.

Resources:

Table 1 (.xls) below compares global health funding in the FY 2021 House bill to the FY 2020 enacted funding amounts as outlined in the  “Consolidated Appropriations Act, 2020” (P.L. 116-94; KFF summary here) and the FY 2021 request (KFF summary here). Table 2 provides a summary of emergency funding in the FY 2021 House SFOPs appropriations bill.

Note: Some funding amounts (e.g. global health funding provided through the Economic Support Fund account at USAID) will be determined at the agency level, and are not earmarked by Congress in the SFOPs appropriations bill.

Table 1: KFF Analysis of FY21 House Appropriations for Global Health
Department / Agency / AreaFY20 Enacted(millions)FY21Requesti(millions)FY21House(millions)Difference(millions)
FY21 House– FY20 EnactedFY21 House  – FY21 Request
 SFOPs – Global Health
HIV/AIDS$4,700.0$3,180.3$4,700.0$0 (0%)$1519.7 (47.8%)
State Department$4,370.0$3,180.3$4,370.0$0(0%)$1189.7(37.4%)
USAID$330.0$0.0$330.0$0(0%)$330.0(NA)
of which Microbicides$45.0$0.0$45.0$0(0%)$45.0(NA)
Global Fund$1,560.0$657.6$1,560.0$0 (0%)$902.4 (137.2%)
Tuberculosisii –  – – –
Global Health Programs (GHP) account$310.0$275.0$310.0$0(0%)$35(12.7%)
Economic Support Fund (ESF) accountNot specifiedNot specifiedNot specified – –
Malaria$770.0$708.5$755.0$-15 (-1.9%)$46.5 (6.6%)
Maternal & Child Health (MCH)iiiiv – – –
GHP accountv$851.0$659.6$850.0$-1(-0.1%)$190.4(28.9%)
of which Gavi$290.0$290.0$290.0$0(0%)$0(0%)
of which Poliov$61.0Not specified$61.0$0(0%) –
UNICEFvi$139.0Not specified$139.0$0(0%) –
ESF accountNot specifiedNot specifiedNot specified – –
of which PoliovvNot specifiedNot specified – –
Nutritionvii – – – –
GHP account$150.0$90.0$145.0$-5(-3.3%)$55(61.1%)
ESF accountNot specifiedNot specifiedNot specified – –
Family Planning & Reproductive Health (FP/RH)$607.5 –$805.5$198 (32.6%) –
Bilateral FPRH$575.0 –$750.0$175(30.4%) –
GHP account$524.0$237.0$585.5$61.5(11.7%)$348.5(147%)
ESF account$51.1Not specified$164.5$113.5(222.3%) –
UNFPAviii$32.5$0.0$55.5$23(70.8%)$55.5(NA)
Vulnerable Children$25.0$0.0$24.0$-1 (-4%)$24.0(NA)
Neglected Tropical Diseases (NTDs)$102.5$75.0$102.5$0 (0%)$27.5 (36.7%)
Global Health Security$100.0$90.0$125.0$25 (25%)$35 (38.9%)
GHP account$100.0$90.0$125.0$25(25%)$35(38.9%)
Emergency Reserve Fundix$25.0ix – –
World Health Organization (WHO)x$122.7$57.9$318.9$196.2 (159.9%)$261 (450.9%)
GHP accountx – –$200.0 – –
Contributions to International Organizations (CIO) account$122.7$57.9$118.9$-3.8(-3.1%)$61(105.4%)
SFOPs Total (GHP account only)$9,092.5$5,998.0$9,157.0$64.5 (0.7%)$3159 (52.7%)
Notes:
i – In the FY21 Request, the administration proposed to consolidate the Development Assistance (DA), Economic Support Fund (ESF), the Assistance for Europe, Eurasia, and Central Asia (AEECA), and the Democracy Fund (DF) accounts in to one new account — the Economic Support and Development Fund (ESDF). ESF funding for the FY21 Request reflects the amounts requested by the administration for ESDF.
ii – Some tuberculosis funding is provided under the ESF account, which is not earmarked by Congress in the annual appropriations bills and determined at the agency level (e.g. in FY18, TB funding under the ESF account totaled $4 million).
iii – Some MCH funding is provided under the ESF account, which is not earmarked by Congress in the annual appropriations bills and determined at the agency level (e.g. in FY18, MCH funding under the ESF account totaled $15.5 million).
iv – It is not possible to calculate total MCH funding in the FY21 request because UNICEF, which has historically received funding through the International Organizations and Programs (IO&P) account, was not specified in the FY21 request.
v – The minority summary of the FY20 conference agreement states that part of the increase in MCH funding is “due to a shift of $7.5 million for polio prevention programs from the Economic Support Fund account to the Global Health Programs account.”
vi – UNICEF funding in the FY20 Conference Agreement and FY21 House bill both include an earmark of $5 million for programs addressing female genital mutilation.
vii – Some nutrition funding is provided under the ESF account, which is not earmarked by Congress in the annual appropriations bills and determined at the agency level. (e.g. in FY17, nutrition funding under the ESF account totaled $21 million).
viii – In FY20 the Trump Administration invoked the Kemp-Kasten amendment to withhold UNFPA funding. The FY21 House bill text states that if this funding is not provided to UNFPA it “shall be transferred to the ‘Global Health Programs’ account and shall be made available for family planning, maternal, and reproductive health activities.”
ix – The explanatory statement accompanying the FY20 Conference Agreement states that the “agreement includes authority to reprogram $10,000,000 of Global Health Program funds to the Emergency Reserve Fund if necessary to replenish amounts used during fiscal year 2020 to respond to emerging health threats.” The House FY21 appropriations bill states that “up to $50,000,000 of the funds made available under the heading ‘Global Health Programs’ may be made available for the Emergency Reserve Fund.”
x – The FY20 enacted WHO amount is an estimate. The House FY21 appropriations bill states that of the GHP funding provided to USAID, “not less than $200,000,000 shall be available for grants or contributions to the World Health Organization, which shall be allocated and allotted not later than 60 days after the date of enactment of this Act.” This amount is not included in the GHP total in this table.
Updated: July 8, 2020
Table 2: KFF Analysis of Coronavirus Pandemic Preparedness and Response Emergency Fundingin House FY21 SFOPs Appropriations Bill
Department / Agency / AreaFY21House(millions)
Total Funding$10,018.60
Department of State$959.40
Diplomatic Programs$955.00
Office of Inspector General$4.40
USAID$108.00
Operating Expenses$105.00
Office of Inspector General$3.00
Bilateral Economic Assistance$7,670.00
Global Health Programs (GHP)  Account$2,500.00
of which Emergency Reserve Fund$150.00
of which GAVI$750.00
of which Global Fund$800.00
Development Assistance$900.00
of which Basic and Higher Education$150.00
International Disaster Assistance$1,125.00
Economic Support Fund$1,500.00
Assistance for Europe, Eurasia and Central Asia$500.00
Migration and Refugee Assistance$1,125.00
Inter-American Foundation$10.00
United States African Development Foundation$10.00
Multilateral Assistance$1,281.20
International Organizations & Programs (IO&P)$1,281.20
Updated: July 15, 2020

Comparing Private Payer and Medicare Payment Rates for Select Inpatient Hospital Services

Authors: Eric Lopez, Gary Claxton, Karyn Schwartz, Matthew Rae, Nancy Ochieng, and Tricia Neuman
Published: Jul 7, 2020

Issue Brief

As the total number of people who have been hospitalized for COVID-19 continues to rise across the U.S., there is increasing interest in the pandemic’s impact on costs incurred by patients, public and private payers, and revenues for hospitals and other health care providers. With many severely ill COVID-19 patients requiring hospital care, the pandemic provides a window into the large gap between what hospitals charge private insurers and what Medicare pays. As of June 20, 2020, 43% of patients hospitalized for COVID-19 in the United States were age 65 or older,1  virtually all of whom have Medicare coverage. Proposals like a public option or lowering the age of Medicare eligibility would give more people access to coverage with lower payments rates and premiums, while also resulting in lower revenues for health care providers.

This issue brief analyzes hospital payments paid by private payers and by Medicare for a selection of inpatient services, including services requiring similar inpatient treatments for COVID-19, using data from the IBM MarketScan Commercial Claims and Encounters Database and the Medicare Provider Payment and Utilization Data public use files for 2014 to 2017. For each of these services, we compare average payments made by private payers and Medicare, show the 75th and 25th percentile in Medicare and private insurance payments. We also examine the growth in average payments paid by private insurers and Medicare, relative to inflation.

Our analysis finds:

  • Private insurance payment rates were between 1.6 and 2.5 times higher than Medicare rates, with some variation among the ten DRGs included in our analysis.
  • Private insurance rates varied more widely than Medicare rates.
  • The average private insurance payment rates paid for diagnoses related to COVID-19 increased between 9.3% and 22.4% from 2014 to 2017, much faster than Medicare rates.

Background

Private insurance payments for inpatient services vary based on several factors, most notably hospitals’ market power relative to that of insurers.2  In contrast, reimbursements in traditional (fee-for-service) Medicare depend on a set of federal policies and formulas. Inpatient services are categorized into “diagnosis-related groups” (DRGs), which group together patients with similar clinical needs that are expected to require similar levels of hospital resources. Each DRG has a payment weight assigned based on the average resources required to treat Medicare patients grouped in that DRG. These weights are then adjusted for hospital-based factors such as local labor costs and case mix, as well as patient-specific factors such as severity and comorbidities. Hospitals that treat a higher share of low-income Medicare and Medicaid patients receive increased reimbursements, as do teaching hospitals. Medicare also makes additional outlier payments to reimburse hospitals for cases that are particularly costly.

To shed light on differences in Medicare and private payer reimbursement rates for COVID-19-related care, this analysis examines payments for respiratory infections and inflammation with major comorbidities or complications, the principal DRG now used by Medicare to reimburse for COVID-19,3  as well as payments for respiratory system diagnoses with ventilator support. The Trump administration has stated that Medicare rates will be used to reimburse hospitals and other providers that treat uninsured patients with COVID-19, subject to the availability of funds. The CARES Act includes a 20% increase in inpatient reimbursement for Medicare patients with COVID-19 during the COVID-19 Public Health Emergency (PHE) period. This 20% increase was not factored into our analysis because it was not in effect at the time source data were collected, the increase is temporary, and the Department of Health and Human Services has stated that it will not apply to payments for uninsured patients.4  Because we did not account for the 20% temporary increase, the differences we show between private and Medicare payment rates for the three respiratory DRGs in this analysis are somewhat overstated during the period of the public health emergency, as explained below.

In addition to the three respiratory DRGs that include patients requiring similar treatments to those used for patients with COVID-19, we examined seven other inpatient services that had a comparably large number of hospitalizations in both datasets: hip and knee replacements, angioplasties, major bowel surgeries, bariatric surgeries, uterine surgeries, treatment for esophagitis or gastroenteritis, and treatment for cellulitis.5  This group of services includes elective procedures (hip and knee replacements and bariatric surgery), non-elective procedures (treatment for cellulitis and gastroesophageal disease requiring hospitalization), and procedures that can be performed electively for patients who do not emergently require them (major bowel surgeries, uterine surgeries, and angioplasty6 ).

Overall, hospital volume has declined for services not related to COVID-19 treatment. The largest decreases have been seen for elective procedures, many of which have been delayed or cancelled based on Centers for Medicare & Medicaid Services (CMS) recommendations designed to preserve hospital capacity and personal protective equipment and to help minimize the risk of coronavirus infections.7  As states begin to loosen social distancing restrictions, CMS has issued recommendations related to restarting health care that is not related to COVID-19.8 

Key Results

Private insurance paid more than twice what Medicare paid on average for all three respiratory diagnoses related to COVID-19.  For patients on a ventilator for more than 96 hours, the average private insurance payment rate is about $60,000 more than the average amount paid by Medicare ($40,218 vs. $100,461). On average, private insurance reimbursement for services related to COVID-19 were between 2.1 and 2.5 times higher than average Medicare reimbursement (Figure 1, Appendix Table 1). The private-to-Medicare payment ratio for both respiratory infections and respiratory diagnosis with ventilator for more than 96 hours are higher than the ratios for any of the seven other DRGs included in this analysis (Figure 2, Appendix Table 1).

Figure 1: Private Payer Payment Rates Are More Than Twice Medicare Rates for Respiratory Diagnoses, 2017

If the 20% add-on that hospitals now get paid by Medicare for COVID-19 inpatients had been in effect in 2017 and if it had been applied to these claims, the difference between Medicare and private payments would be smaller. For example, the average Medicare payment rate for patients on a ventilator for more than 96 hours would increase from $40,218 to $48,262 if all claims were subject to the 20% add-on. Even with the 20 percent increase in Medicare payments for COVID-19 hospitalizations, private insurance payment rates would still be roughly double Medicare rates, ranging from 1.8 to 2.1 times Medicare rates.

Private insurance paid at least $10,000 more than Medicare rates on average for four of the seven other diagnoses we analyzed. When comparing the ratio of average private insurance and Medicare payments for services not related to coronavirus, private insurance payment rates ranged from 1.6 to 2.2 times higher than average Medicare payment (Figure 2, Appendix Table 1). The three procedures with the highest private-to-Medicare payment ratios are either elective procedures (knee and hip replacements and bariatric surgery) or procedures that can be performed electively for patients who do not emergently require them (angioplasty). The high private-to-Medicare payment ratio for procedures that are often elective helps to explain the financial impact that delays and cancellations of elective procedures have had on hospitals.

Figure 2: Average Private Payer Rates Are Substantially Higher than Medicare Rates Across 7 Common Diagnoses, 2017

There is much wider variation in private insurance payment rates than Medicare payments for all services we analyzed, with particularly wide variation for the three diagnoses similar to COVID-19 treatments. For the ten diagnoses we analyzed, private insurance payment rates at the 75th percentile were between 1.7 and 2.6 times higher than private insurance payments at the 25th percentile for the same diagnosis. In contrast, the 75th percentile payment rates paid by Medicare were about 1.3 to 1.4 times the 25th percentile payment rate. For seven of the ten conditions we analyzed, the 75th percentile private insurance payment rate was at least $10,000 more than the 25th percentile private insurance payment rate. The DRG for respiratory diagnosis with ventilator support for more than 96 hours had the widest variation of the diagnoses in our study, with about a $74,000 difference between the 75th and 25th percentiles of private payment rates.

As discussed earlier, Medicare payments vary only based on several factors including cost of labor where the hospital is located, patient comorbidities, and higher reimbursement for particularly expensive cases, leading to greater uniformity in rates across hospitals compared to private insurance. The substantially larger variation in payment rates paid by private insurers suggests that geographic differences in labor costs and patient severity alone may not fully explain variation in private payment rates. Instead, much of the literature suggests that variation in private insurers’ payments is better explained by local market dynamics, including the degree of hospital consolidation.9 

The average private insurance payment rates paid for diagnoses related to COVID-19 increased between 9.3% and 22.4% from 2014 to 2017, much faster than Medicare rates. Those increases are well above inflation over the same time period, which was 3.5%,10  as measured by the Consumer Price Index for All Urban Consumers (CPI-U) (Figure 4). In contrast, the average payment rate increases in Medicare were either close to inflation or—in the case of the respiratory diagnosis—the average payment declined. This decline is likely partly due to a drop in the relative weight used by Medicare to determine payments for that DRG over the same period.11  Other factors could include a decrease in the average length of stay, a healthier case mix, or a decrease in the number of patients for which hospitals received outlier payments.

Figure 4: Private Payer Payment Rates for Respiratory Conditions Increased at More than Twice Inflation Rate, 2014-2017

Between 2014 and 2017, private insurance payment rates for the seven non-COVID related services we analyzed increased more than twice the rate of inflation. The growth in private insurance payment rates substantially outpaced Medicare. This finding is consistent with recent Peterson Center on Healthcare and KFF analysis showing that per enrollee spending has been grown much more quickly for private insurance spending than for Medicare.12  The largest percentage increase in payment rate was seen for uterine procedures, which had a payment increase of 21.1% (Figure 5). The three conditions with the smallest percent increase in average payment for private insurance were also the three conditions with the highest private-to-Medicare payment ratio among the seven non-COVID-19 related conditions we analyzed. It is possible that private insurance payment rates increased at a lower rate for these services because their payment rates were already relatively high in 2014 relative to Medicare.

The average Medicare payment for knee and hip replacements as well as bariatric surgery decreased 1.6% and 2.6%, respectively. The Medicare relative weight for those DRGs also declined.13   The declines in the average Medicare payment rates may also be partly due to a healthier case mix or a change in one of the other factors that impacts hospital payment for a DRG.

Figure 5: Private Payer Payment Rates Increased More than Inflation While Medicare Rates Stayed Relatively Flat, 2014-2017

Discussion

Our analysis shows that the pattern of private insurance payment rates vary widely and average about twice Medicare rates, consistent with a robust set of literature comparing private insurance and Medicare rates.14  Notably, we found that private insurance payment rates are more than twice Medicare rates for the services most likely to be used by patients who are hospitalized with COVID-19. The temporary 20% increase in inpatient reimbursement for COVID-19 inpatients during the public health emergency will narrow this gap for these DRGs, but will not impact other DRGs or reimbursement for patients without COVID-19 who receive treatment for respiratory conditions. For the non-COVID-19 DRGs, we found that the private-to-Medicare payment rate ratio was close to two-to-one for most of the seven diagnoses we analyzed, with the highest private-to-Medicare ratios for DRGs that are often elective.

Our analysis also shows a much wider variation in private insurance payment rates when compared to Medicare. Past studies have found that market consolidation has contributed to higher private insurance hospital prices.15  If the coronavirus pandemic leads to even greater hospital consolidation, hospitals may gain even greater leverage to demand higher prices from private insurers, further widening the difference between private and Medicare payment rates, and increasing premiums and other costs for people with private insurance. Proposals to create a public option or allow people to enroll in Medicare earlier could constrain payment rates and make health coverage more affordable, but also decrease revenues for health care providers.

This work was supported in part by Arnold Ventures. We value our funders. KFF maintains full editorial control over all of its policy analysis, polling, and journalism activities.

Appendix

Appendix Table 1: Distribution of Private Payer and Medicare Payment Rates for Select Diagnoses, 2017
MedicarePrivate PayerPrivate-to-Medicare Mean Payment Ratio
Diagnosis25th  percentileMedian75th  percentileMean25th  percentileMedian75th  percentileMean
Angioplasty(DRG 247)$13,337$15,005$17,402$15,782$24,045$32,544$42,663$35,3212.24
Bariatric(DRG 621)$9,854$11,229$12,955$11,531$15,843$21,092$27,143$22,1791.92
Bowel(DRG 330)$15,314$17,116$20,083$18,940$20,205$28,655$39,926$32,7331.73
Cellulitis(DRG 603)$5,310$5,928$7,019$6,511$6,678$9,416$13,647$10,9801.69
Gastroenteritis(DRG 392)$4,759$5,304$6,322$5,872$6,655$9,341$13,224$11,0551.88
Knee and Hip(DRG 470)$12,643$14,084$16,259$14,747$21,519$27,812$35,704$30,0992.04
Respiratory Infection(DRG 177)*$10,825$12,124$14,263$13,297$15,160$24,134$39,543$33,7862.54
Respiratory with ventilator <=96 hours(DRG 208)*$14,173$15,960$19,061$17,437$20,025$29,639$43,140$36,7582.11
Respiratory with ventilator >96 hours(DRG 207)*$31,836$37,291$45,324$40,218$50,435$77,902$124,532$100,4612.50
Uterus(DRG 743)$7,457$8,505$9,967$9,232$9,550$13,168$17,750$14,4441.56
NOTES: *Denotes a DRG that includes inpatient services requiring similar treatments to COVID-19.SOURCE: KFF analysis of IBM MarketScan Commercial Claims and Encounters Database (IBM Corporation), and Medicare Provider   Payment and Utilization Data public use files for inpatient hospital services (Centers for Medicare and Medicaid Services), for 2017.

Methods

This analysis uses a sample of claims obtained from IBM Health Analytics MarketScan Commercial Claims and Encounters Database (IBM Corporation), as well as Medicare payment data obtained from the Medicare Provider Payment and Utilization Data public use files (Centers for Medicare and Medicaid Services). MarketScan is a convenience sample of health care claims provided primarily by large employers and health plans. We used a subset of MarketScan claims provided by large employers, as well as Medicare-reported provider-level payment reports, from 2014 through 2017 to conduct this analysis. The specific Diagnosis-Related Groups (DRGs) examined were selected either due to their relevance to COVID-19-related hospitalizations (DRG 177 – respiratory infections and inflammations with major comorbidities or complications, DRG 207 – respiratory system diagnoses with ventilator support for over 96 hours, and DRG 208 – respiratory system diagnoses with ventilator support for up to 96 hours), or due to their comparably large volume of hospital admissions in both datasets. The latter group includes DRG 470 (major hip and knee replacement without major complications or comorbidities), DRG 247 (percutaneous cardiovascular procedures with drug-eluting stent without major complications or comorbidities), DRG 330 (major procedures of the small and large bowel with complications or comorbidities), DRG 621 (operating room procedures for obesity without complications or comorbidities), DRG 743 (uterine and adnexa procedures for non-malignancy without complications or comorbidities), DRG 392 (esophagitis, gastroenteritis, and miscellaneous disorders without major complications or comorbidities), and DRG 603 (cellulitis without major comorbidities or complications).

To calculate private insurance payment rates, we analyzed a sample of medical claims obtained from the 2017 IBM Health Analytics MarketScan Commercial Claims and Encounters Database. We only included claims for people under the age of 65. This analysis used claims for almost 19 million people representing about 22% of the 86 million people in the large group market in 2017. Weights were applied to match counts in the Current Population Survey for enrollees at firms of a thousand or more workers by sex, age, and state. Weights were trimmed at eight times the interquartile range.  Averages represent the charges paid to the hospitals for an admission.  Across all the DRGs, hospital spending represented about 86% of the total cost of the admission.  Costs include both amounts paid by enrollees in the form of cost-sharing and spending by the plan.  Hospital costs are trimmed to exclude the lowest 1.5% and highest 0.5% of hospital costs within DRG. These data reflect cost sharing incurred under the benefit plan, but do not include balance-billing payments that beneficiaries may make to health care providers for out-of-network services or out-of-pocket payments for non-covered services.

To calculate Medicare payment rates, we analyzed average provider-level total payments (Medicare payments plus enrollee cost-sharing) to hospitals for admissions identified through the diagnostic-related group (DRG) assigned to them in the database, as reported in the Medicare Provider Payment and Utilization Data public use files. These files are prepared by the Centers for Medicare and Medicaid Services (CMS) using Medicare Provider Analysis and Review (MEDPAR) data, employing trimming and weighting methods developed by CMS (see https://www.cms.gov/Research-Statistics-Data-and-Systems/Statistics-Trends-and-Reports/Medicare-Provider-Charge-Data/Inpatient2017 for further information). Provider-level average payments were further weighted by provider-level case volume. This analysis used Medicare payment data representing hospital-specific payments for over 3,000 Medicare-qualified hospitals, encompassing more than 7 million enrollee discharges, or approximately 75% of total Medicare IPPS discharges in 2017. These data reflect Medicare-allowed cost sharing, but do not include balance-billing payments or other payments made outside of the Medicare claims process.

In Medicare, hospital admissions are reimbursed based on DRGs that reflects a patient’s clinical conditions and treatment. In contrast, private insurers pay for hospital admissions using different approaches that may vary with the procedures performed during the stay, including per diem payments, discounted fee-for-service payments, DRGs or other combinations of payments and performance incentives. IBM assigns a DRG to each admission using the Centers for Medicare & Medicaid Services (CMS) Grouper 35. This method selects a DRG for the admission based on the diagnosis and procedures a patient received during the case. The total payments to hospitals in the Marketscan data reflect the payments actually made to the hospitals. Some variation in the payment rates of admissions is accounted for by differences in the intensity or types of services that a patient receives, and not differences in the rates paid for those services. The rates Medicare uses to reimburse DRGs are designed to account for this variation in the intensity of cases and services. This analysis compares the average of DRG payment rates in Medicare to the average amounts paid for admissions by insurers and enrollees in Marketscan.

Endnotes

  1. Hospitalizations reported from March 1, 2020 to June 13, 2020 according to CDC data, https://gis.cdc.gov/grasp/COVIDNet/COVID19_5.html (accessed June 29, 2020). ↩︎
  2. Eric Lopez, Tricia Neuman, Gretchen Jacobson, and Larry Levitt, How Much More Than Medicare Do Private Insurers Pay? A Review of the Literature (Washington, D.C: Kaiser Family Foundation, April 2020), https://modern.kff.org/medicare/issue-brief/how-much-more-than-medicare-do-private-insurers-pay-a-review-of-the-literature/   ↩︎
  3. “ICD-10 MS-DRGs Version 37.1 R1 Effective April 1, 2020,” Centers for Medicare & Medicaid Services, 2020, https://edit.cms.gov/files/document/icd-10-ms-drgs-version-371-r1-effective-april-1-2020-updated-march-23-2020.pdf ↩︎
  4. “CARES Act Provider Relief Fund: General Information,” Department of Health & Human Services, accessed May 15, 2020, https://www.hhs.gov/coronavirus/cares-act-provider-relief-fund/general-information/index.html#targeted   ↩︎
  5. See the Methods section for the formal definitions used by the Centers for Medicare and Medicaid Services for each of these diagnosis-related group (DRG) codes. ↩︎
  6. Peterson, Eric D et al,  “Contemporary mortality risk prediction for percutaneous coronary intervention: results from 588,398 procedures in the National Cardiovascular Data Registry,” Journal of the American College of Cardiology 55 (May 4, 2010): 1923-32. doi:10.1016/j.jacc.2010.02.005   ↩︎
  7. “Non-Emergent, Elective Medical Services, and Treatment Recommendations,” Centers for Medicare & Medicaid Services, 2020, https://www.cms.gov/files/document/cms-non-emergent-elective-medical-recommendations.pdf; “Hospital volumes hit unprecedented lows $1.4B daily revenue losses mean long recovery ahead,” Crowe, May 1, 2020, https://www.crowe.com/news/hospital-data-analysis-examines-the-financial-impact-of-covid-19.   ↩︎
  8. “Opening Up America Again: Centers for Medicare & Medicaid Services (CMS) Recommendations, Re-opening Facilities to Provide Non-emergent Non-COVID-19 Healthcare: Phase 1,” Centers for Medicare & Medicaid Services, 2020, https://www.cms.gov/files/document/covid-flexibility-reopen-essential-non-covid-services.pdf ↩︎
  9. Examining the Impact of Health Care Consolidation: Statement before the Committee on Energy and Commerce Oversight and Investigations Subcommittee, 115th Cong. (2018), https://docs.house.gov/meetings/IF/IF02/20180214/106855/HHRG-115-IF02-Wstate-GaynorM-20180214.pdf   ↩︎
  10. The annual averages of the Consumer Price Index for all Urban Consumers (CPI-U) were 236.736 and 245.120 in 2014 and 2017, respectively. ↩︎
  11. The value of the relative weight for MS-DRG 177, respiratory infections and inflammation with major comorbidities or complications, decreased from 1.9934 in FY 2014 to 1.8672 in FY 2017—a 6.3 percent change decrease. ↩︎
  12. Rabah Kamal, Daniel McDermott, and Cynthia Cox, How has U.S. spending on healthcare changed over time?(Washington, DC: Kaiser Family Foundation, December 2019), https://www.healthsystemtracker.org/chart-collection/u-s-spending-healthcare-changed-time/#item-start   ↩︎
  13. The value of the relative weight for MS-DRG 470, knee and hip replacement, decreased from 2.1463 in FY 2014 to 2.0671 in FY 2017—a 4 percent change decrease. ↩︎
  14. Eric Lopez, Tricia Neuman, Gretchen Jacobson, and Larry Levitt. How Much More Than Medicare Do Private Insurers Pay? A Review of the Literature (Washington, DC: Kaiser Family Foundation, April 2020), https://modern.kff.org/medicare/issue-brief/how-much-more-than-medicare-do-private-insurers-pay-a-review-of-the-literature/   ↩︎
  15. Zack Cooper, Stuart V Craig, Martin Gaynor, John Van Reenen, “The Price Ain’t Right? Hospital Prices and Health Spending on the Privately Insured,” The Quarterly Journal of Economics 134, no. 1 (Feb.  2019): 51–107, https://doi.org/10.1093/qje/qjy020   ↩︎
News Release

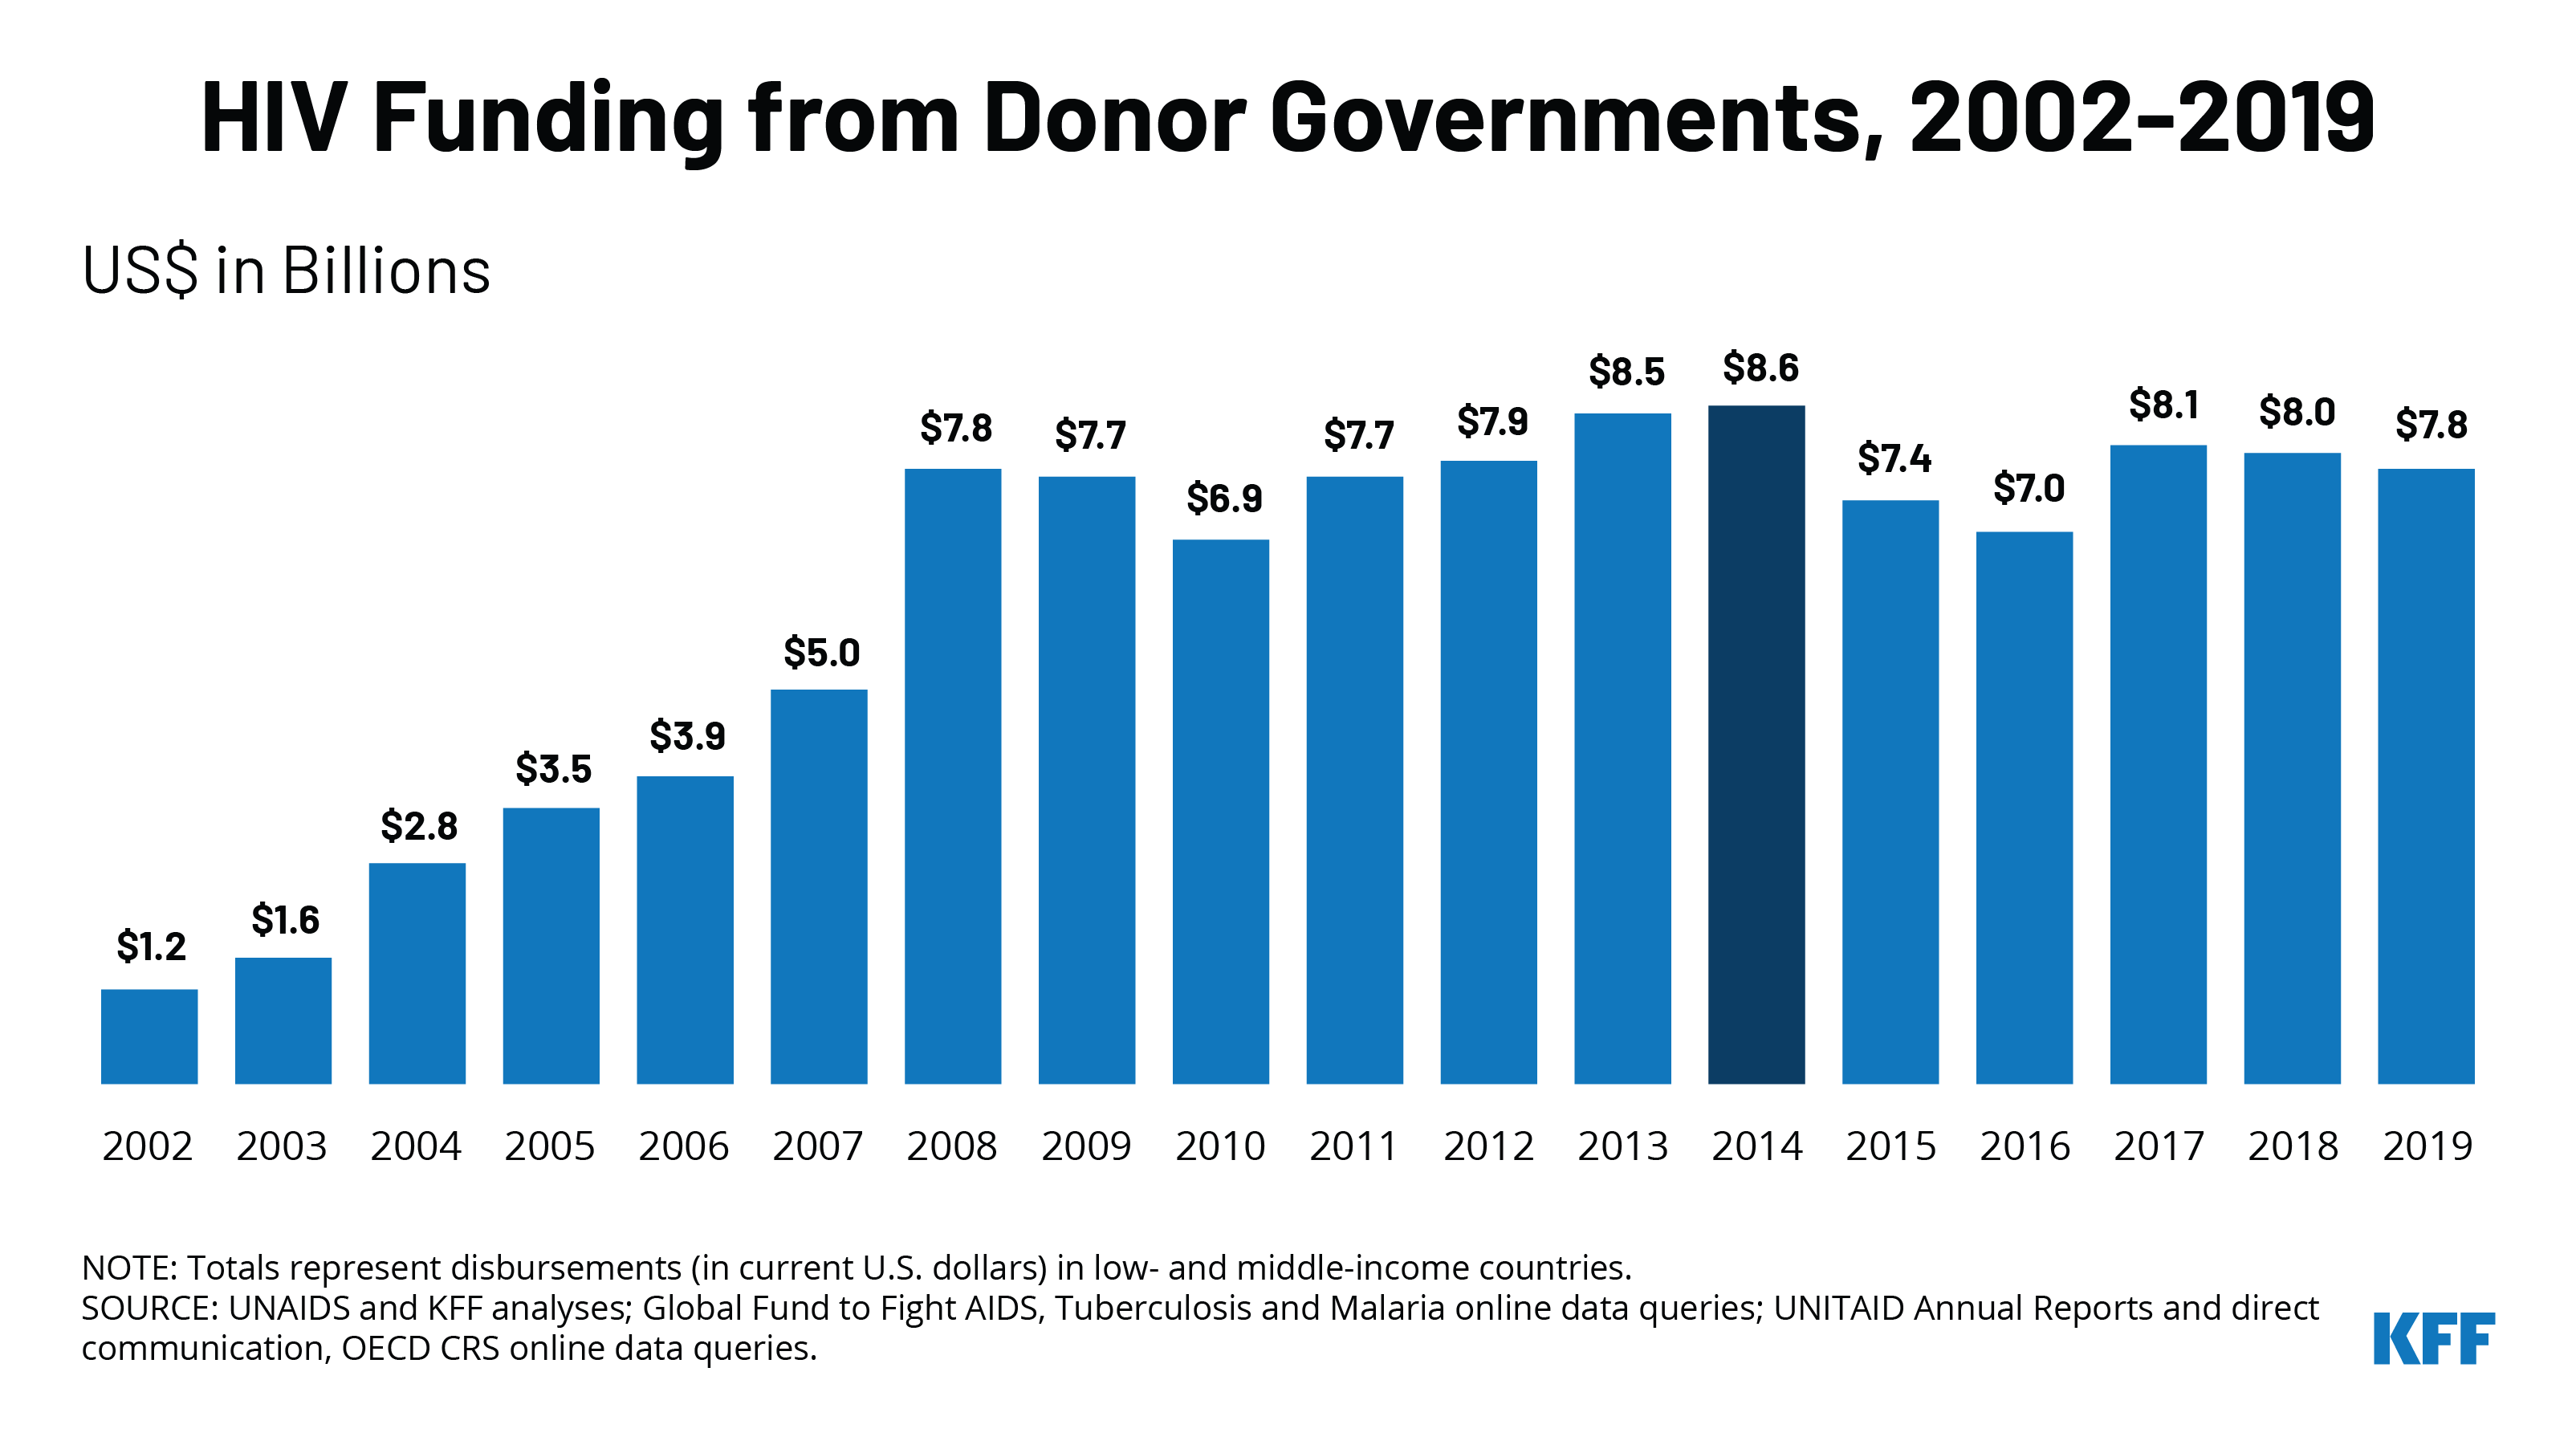
KFF/UNAIDS Analysis Finds Donor Governments Spent US$7.8 Billion for HIV in 2019, Down Almost $200 Million From the Previous Year

Funding from donor governments was nearly the same as a decade ago, despite an increase in the number of people living with HIV of 25 percent over that period.

Published: Jul 6, 2020

A new report from KFF (Kaiser Family Foundation) and The Joint United Nations Programme on HIV/AIDS (UNAIDS) finds donor government disbursements to combat HIV in low- and middle-income countries totaled US$7.8 billion in 2019, a reduction from the US$8 Billion in 2018 and nearly the same as the funding levels of a decade ago.

Half of the 14 donor governments analyzed in the study decreased their spending on global HIV efforts from 2018 to 2019; six increased; and one held steady. Donor government funding supports HIV care and treatment, prevention and other services in low- and middle-income countries.

The decline in funding was driven primarily by a decrease in bilateral funding from the United States, due to, flat funding from Congress for several years and a shrinking funding pipeline for programs, as well as the timing of disbursements. The decline is also attributable to declining funding from other donors, though to a lesser extent. While donors increased multilateral contributions to The Global Fund to Fight AIDS, Tuberculosis, and Malaria, UNAIDS, and UNITAID by more than $100 million, these gains were not enough to offset declines in bilateral funding. Since 2010, funding from donor governments other than the U.S. has declined by more than US$1 billion largely due to decreased bilateral support for HIV.

Even with its decreased funding, the United States remains the world’s largest donor government to HIV, disbursing US$5.7 billion in 2019, and ranking first in funding relative to the size of its economy. The next largest donor is the United Kingdom (US$646 million), followed by France (US$287 million), the Netherlands (US$213 million) and Germany (US$180 million).

These data feed into the broader UNAIDS global report, which examines all sources of funding for HIV relief, including local governments, non-governmental organizations and the private sector, and compares it the resources need to achieve goals related to testing and treatment. UNAIDS estimates that resources needed by the end of 2020 are US$26.2 billion, compared to US$19.8 billion currently available, leaving a gap of several billion dollars. This gap has grown in recent years as the number of people living with HIV in low and middle income countries has increased by 25% over the past decade and the number of new HIV infections remains high.

“Every dollar not invested today contributes to AIDS-related deaths and new HIV infections,” said Winnie Byanyima, Executive Director of UNAIDS. “In a world characterized by massive inequalities we must ramp up investments for realizing the right to health. It’s a shared responsibility, demanding more donor funding and domestic resources, including freeing up fiscal space through debt cancellation.”

“Donor governments continue their move away from funding HIV programs in low and middle income countries, while the number of people living with HIV continues to grow,” said KFF Senior Vice President Jen Kates. “This situation is likely to become more precarious in 2020 and beyond, as the effects of COVID-19 hit donor government budgets and take an increasing toll on health and economies around the world.”

The new report, produced as a long-standing partnership between KFF and UNAIDS, provides the latest data available on donor government funding based on data provided by governments. It includes their bilateral assistance to low- and middle-income countries and contributions to the Global Fund, UNAIDS, and UNITAID.  “Donor government funding” refers to disbursements, or payments, made by donors.

News Release

KFF’s Kaiser Health News (KHN), AP Investigate the State of the Nation’s Public Health Infrastructure as It Confronts the Challenge of the COVID-19 Pandemic

Published: Jul 1, 2020

A new investigation from KFF’s Kaiser Health News (KHN) and The Associated Press examines the troubling state of the public health infrastructure the nation is relying on to navigate the health and economic threats presented by the COVID-19 pandemic.

The multipart investigation, which launched today, finds that the public health workforce in the United States is underfunded and under threat, lacking the basic tools to confront the worst pandemic in a century. The novel coronavirus has infected at least 2.6 million people in the U.S., killed more than 126,000 people and cost tens of millions of jobs and $3 trillion in federal rescue money.

Among the key findings in the series’s first story, “Hollowed-Out Public Health System Faces More Cuts Amid Virus”:

  • Since 2010, spending on state health departments has dropped by 16% per capita, and in local health departments by 18%, in 2019 dollars after adjusting for inflation, according to the KHN and AP analysis.
  • At least 38,000 state and local public health jobs have been eliminated since the Great Recession in 2008, leaving an inadequate workforce in what was viewed in the mid-20th century as one of the world’s best public health systems.
  • At least 14 states have already cut or are actively considering cuts to health department budgets or positions. States, cities and counties, facing declining revenues amid the economic downturn, are laying off and furloughing the already limited staff.

For their first investigative collaboration, KHN and AP journalists interviewed more than 150 public health workers, policymakers and experts, analyzed state and federal financial records, and surveyed statehouses around the country. Their investigation finds that governments at every level have failed to provide the public health system with the resources — both human and financial — that are required to protect the nation from pandemics.

The reporting also shows how public health officials, who already work on an array of tasks for their communities — such as administering vaccination programs, tracking and preventing infectious diseases, screening infants, monitoring water and air quality, and conducting food and restaurant inspections — are stretched thinner than ever as they work to reduce and monitor the effects of the pandemic. Departments are having to spend already constrained budgets on adequate supplies to keep workers safe as they try to implement preparedness plans and mount effective contact tracing efforts with limited staff. And they have been targeted for criticism by frustrated elected officials and members of the public who blame them for unpopular lockdowns and safety restrictions.

“Bringing together the resources of both The Associated Press and KHN enabled us to marry hard-to-wrangle data with compelling stories from the front lines of the nation’s public health system as it grapples with this pandemic,” said KHN national editor Kytja Weir.

“We are pleased to be working with Kaiser Health News to take a deep look at what is really happening inside the U.S. public health system,” said AP investigative editor Alison Kodjak. “This is important public service journalism at a critical time.”

Through the collaboration, AP and KHN have shared data and offered guidance to news organizations that are AP members and customers to help them localize the findings of the investigation for their regions. KHN and AP expect to publish more stories in the series over the coming weeks and months.

About KFF and Kaiser Health News

Filling the need for trusted information on national health issues, KFF (Kaiser Family Foundation) is a nonprofit organization based in San Francisco, California. KHN (Kaiser Health News) is a nonprofit news service covering health issues. KHN is an editorially independent program of KFF and, along with Policy Analysis and Polling, is one of the three major operating programs of KFF. KFF is not affiliated with Kaiser Permanente.

About AP

The Associated Press is an independent global news organization dedicated to factual reporting. Founded in 1846, AP today remains the most trusted source of fast, accurate, unbiased news in all formats and the essential provider of the technology and services vital to the news business. More than half the world’s population sees AP journalism every day. Online: www.ap.org

Where are the COVID-19 Hotspots? Tracking State Outbreaks

Authors: Jennifer Kates, Jennifer Tolbert, Kendal Orgera, Josh Michaud, and Larry Levitt
Published: Jun 30, 2020

An updated map and data of state hot spots is available based on our analysis of more recent data.

There is growing concern about rising COVID-19 cases and other troubling trends in a subset of states that have reopened, and a few Governors and Mayors have either paused reopening or signaled their intention to do. Understanding in which states the pandemic is moving in the wrong, or right, direction, is critical but complex, as no single metric can tell the full story. For example, an increasing number of cases could be the result of more testing or the result of increasing transmission, or a combination of both.

A few existing resources examine state-level data to make assessments about current risk levels (see, in particular, https://www.covidexitstrategy.org/, https://covidactnow.org/, and https://www.aei.org/covid-2019-action-tracker/). We similarly sought to examine current trends across the U.S. and identify state “hotspots” for COVID-19. Specifically, we looked at two metrics that are readily available for all states and, when taken together, signal concern:

  • COVID-19 Cases: Percent Change in Reported Daily Cases Over the Past 14 Days. An increase in reported cases could signal a growing caseload, though it could also be the result of increased testing. Used, however, in conjunction with the change in positivity rate helps to elucidate this trend.
  • Positivity Rate: Percent Change in Share of COVID-19 Tests with Positive Results Over the Past 14 Days or Positivity Rate of 10% or Greater. The positivity rate is an important metric to monitor.1  If transmission is decreasing and more people are being tested, including those who are not infected, the positivity rate should fall. On the other hand, a rising positivity rate suggests that an insufficient share of the population is being tested and/or that actual cases are increasing, and likely increasing at a faster rate than the confirmed case counts would indicate. Additionally, a positivity rate of 10% or more indicates there are a relatively high number of cases and an ongoing epidemic in the state.

We examined data from the most recent 14-day period to account for the lag between transmission and the incubation period of the virus, as well as the time at which an individual seeks and receives testing and testing results are reported to health officials; even so, it is important to note that cases from the most recent two-week period still reflect prior transmission patterns. We calculated the percent change based on a 7-day rolling average, which helps to account for fluctuations in reporting throughout each week and other noise in the data; however, data anomalies exist leading to fluctuations in the data in a number of states. We excluded states for which the percent change in at least one of the 14-day metrics was below 5%. For the positivity rate, we reported the most recent rate based on the 7-day rolling average.

In addition to cases and positivity rates, we also include data on the percent change in the number of tests conducted, hospitalizations, and deaths, to provide additional context for interpreting trends. For example, hospitalization data provide information on severity of illness and strain on the health care system, though not all states report this information and it is a lagging measure that reflects transmissions from even longer ago. Increasing cases in the most recent period is likely predictive of future hospitalizations (and deaths), though depends on the characteristics or people being infected in any given area (since older people and those with pre-existing conditions are more likely to get severely ill once infected).

Results

Looking at the period from June 14 to June 28, 31 states are classified as hotspots (i.e., have increasing cases, and increasing positivity rates over the most recent 14-day period or a positivity rate of 10% or greater). See Figure and Table 1 below. These states are primarily in the West (12) and South (12); six are in the Midwest and one is in the Northeast. Many are states that were not hit hard earlier in the pandemic. While four of the states are reporting fewer than 40 daily cases, 16 are reporting 400 or more new cases per day, and nine states have positivity rates above 10%.

Figure 1: COVID-19 Hotspot States, June 14 to June 28, 2020
Table 1: COVID-19 Metrics for Hotspot States (as of 6/28/20)
State14-DayPercentChange inCases14-DayPercentChange inPositivityRatePositivity Rate(7-Day RollingAverage)14-DayPercentChange inCurrentHospitalizations14-DayPercentChange inDeaths14-DayPercentChange inTestsDaily Cases(7-Day RollingAverage)CurrentHospitalizations(7-Day RollingAverage)Daily Deaths(7-Day RollingAverage)Date Stay atHome OrderLifted
Alabama6%-4%13%21%-1%10%774116674/30/2020
Arizona145%53%24%75%75%60%3,047352,3185/16/2020
California70%29%6%21%-11%45%5,250605,454Still in place
Colorado57%28%5%-16%-59%12%25242434/27/2020
Delaware40%58%4%-18%200%-11%6410856/1/2020
Florida277%157%16%N/A12%47%6,25537N/A5/4/2020
Georgia116%61%12%37%-50%34%1,787191,1305/1/2020
Hawaii60%14%1%N/AN/A22%120N/AStill in place
Idaho407%162%10%N/A-50%93%1880N/A5/1/2020
Iowa16%5%7%-39%-57%6%3653143-*
Kansas146%73%7%N/A0%30%2442N/A5/4/2020
Kentucky28%41%4%-23%10%-10%2125371-*
Louisiana70%50%8%20%21%13%923136685/15/2020
Michigan106%65%2%-14%-25%25%319105576/1/2020
Mississippi134%-36%13%11%37%263%750147254/27/2020
Missouri97%72%6%-6%11%19%31965425/4/2020
Montana161%148%1%134%100%5%210144/26/2020
Nevada156%250%15%32%-48%-26%56024505/29/2020
New Mexico59%30%4%-26%-41%-1%17831355/22/2020
Ohio106%40%5%5%-41%47%786155975/20/2020
Oklahoma125%53%6%85%33%50%34722825/12/2020
Oregon44%197%10%21%-8%-17%2012164Still in place
Pennsylvania19%7%4%-28%-33%36%561266935/8/2020
South Carolina92%10%15%67%17%73%1,23798625/4/2020
Tennessee32%132%8%N/A4%-46%72484634/29/2020
Texas184%126%15%123%48%27%5,315304,7224/30/2020
Utah62%50%11%19%-50%8%52012435/1/2020
Washington46%90%5%17%-33%0%43962615/31/2020
West Virginia105%130%2%-5%0%-18%431275/4/2020
Wisconsin52%66%5%-32%-28%-12%41852465/13/2020
Wyoming95%88%5%0%N/A4%3106-*
Note: N/A: Insufficient data to report. Decrease signifies a percentage decrease in the metric over the past two weeks. Testing data only include tests with results. * Iowa, Kentucky, and Wyoming never issued a stay at home order.Source: KFF analysis of Johns Hopkins University COVID-19 Dashboard and The COVID Tracking Project data.

There are likely multiple policy, epidemiologic, and other factors driving these increases, including: when stay-at-home orders were lifted (and how long they were in place); the pace of reopening; the use of other social distancing measures (such as face mask requirements); increased population movement due to warming weather; outbreaks in congregate settings; the Memorial Day Holiday period; and, potentially, protests. For example, while 23 of the 31 states had lifted their stay-at-home orders by the end of May (California, Hawaii, and Oregon have maintained their stay-at-home orders as they have begun phased reopening; see Table 1), they did so at different paces. Many moved quickly, reopening businesses and lifting other restrictions within a two-week period. All states, except California and Washington, have lifted or eased bans on large gatherings and only eight require the general public to wear face masks. However, teasing out the role of these various factors and policy changes, many of which occurred simultaneously, will require further analysis.

What This All Means

Using these metrics – increasing COVID-19 cases over the past 14 days and increasing positivity rates over the past 14 days or a positivity rate of 10% or greater –we find that over 60% of states, representing nearly 70% of the US population, are moving in the wrong direction. These hotspot states are primarily in the South and West, and many were not hit hard in the earliest days of the U.S. outbreak. Hospitalizations have increased significantly in some states, and could increase in others. In addition, rising positivity rates in these states indicate that the growth in cases is not due to increased testing and likely reflects an actual increase in transmission.

While these trends are concerning, and beginning to drive the national trend, 20 states are moving in the right direction. Many of these states were among the last to reopen. Some phased in reopening over a longer time period and many have required the widespread use of face masks.

The factors determining which states are hotspots and which are not are difficult to tease out, but the inescapable reality is that the epidemic is getting worse, not better, in a significant portion of the country.

  1. The WHO recommends that the positivity rate should be at 5% or less for an extended period before reopening. ↩︎

Abortion Back at the Supreme Court: June Medical Services LLC v. Russo

Published: Jun 29, 2020

Issue Brief

Supreme Court Decision June 29, 2020

On June 29, 2020, the Supreme Court ruled that the Louisiana Act 620 is unconstitutional. Justice Breyer wrote the opinion of the court, which Justices Ginsburg, Kagan, and Sotomayor joined. Chief Justice Roberts wrote a concurring opinion, which reached the same conclusion that the Louisiana admitting privileges law places a “substantial obstacle” in the path of women seeking abortions, but he did not apply the balancing test used in Whole Woman’s Health. The Court will likely not apply the Whole Woman’s Health balancing test to future challenges to abortion restrictions, but will rather inquire whether the law poses a “substantial obstacle.” As a result, the Court may uphold some laws with little or no benefit.

Introduction

Since the Supreme Court’s 1973 landmark decision in Roe v. Wade, abortion has been squarely in the middle of political debates at the national and state levels. The Supreme Court last ruled on an abortion case, Whole Woman’s Health v. Hellerstedt, in June 2016, when President Obama was in office and there were eight justices on the Supreme Court, including Anthony Kennedy, the swing vote. On March 4, 2020, the Supreme Court will hear oral arguments in June Medical Services LLC v. Russo, a challenge to a Louisiana admitting privileges law that is nearly identical to the Texas law struck down by the Supreme Court in 2016. In Whole Woman’s Health, the Court ruled 5 to 3 in favor of the abortion providers, with Justice Kennedy siding with the majority.

Since that decision, the makeup of the Court has significantly changed. In 2018, Justice Kennedy retired. President Trump has nominated two new Justices: Justice Gorsuch to replace Justice Scalia and Justice Kavanaugh to replace Justice Kennedy. Emboldened by the new make-up of the Supreme Court, some states have passed new abortion restrictions with the goal of reaching the Court to re-consider Roe v. Wade. While the current case, June Medical Services LLC v. Russo, is unlikely to overturn Roe v Wade, the Court’s ruling could have significant implications for women’s access to abortion and could eliminate the right of abortion providers to bring legal challenges to state and federal laws and policies. This issue brief explains the legal and factual issues in dispute and the reviews the potential implications of different rulings.

What is the law in controversy?

The June Medical Services LLC v. Russo case is a challenge to a Louisiana law, Louisiana Unsafe Abortion Protection Act (“Act 620”), which requires physicians who perform abortions in the state to have “active admitting privileges” at a hospital within 30 miles of the facility where the doctor provides abortions. Doctors who perform an abortion without having admitting privileges, may be imprisoned or fined and the clinics that employ them can have their licenses revoked and may also be fined or face civil liability. According to the Louisiana Department of Health, approximately 10,000 women obtain abortions in Louisiana annually. Clinics and doctors have brought this litigation to the court, questioning the constitutionality of the Louisiana law, and the State of Louisiana has brought a counter challenge questioning the right of doctors and clinics to sue on behalf of their patients.

Louisiana’s then Governor, Bobby Jindal, signed the bill in June 2014, and it was scheduled to go into effect September 1, 2014. On August 22, 2014, June Medical Services LLC (doing business as Hope Clinic), two other clinics (Bossier Clinic and Choice), and two doctors who perform abortions at these clinics filed a legal complaint requesting a preliminary injunction to block the enforcement of the law. When the complaint was filed, there were a total of five licensed abortion clinics in Louisiana, and six doctors performing abortions in Louisiana. Since that time, one abortion provider retired, and two clinics (Bossier City Medical Suite and Causeway Medical Clinic in Metairie) closed. There are currently three licensed clinics and five doctors who perform abortions in Louisiana.

On August 31, 2014, the District Court issued a temporary restraining order until a hearing could be held to determine whether a preliminary injunction should be issued. Per this order, Plaintiffs were expected to continue seeking admitting privileges but the State was barred from penalizing doctors during this time for not having admitting privileges.

Do abortion providers have standing to challenge this law?

For the federal courts to be able to hear a case at all there must be a party with a real, concrete injury whose protection depends on an intervention by the court. Usually, a person can only challenge the constitutionality of a law if it infringes on their own rights, not broadly on the rights of others. However, “third-party standing” allows another person or organization to assert the rights of another individual when it is difficult for that person to assert their own rights, and the parties’ interests are closely aligned. In cases relating to the right to abortion, it is very hard for women themselves to serve as plaintiffs, and for 45 years the Court has permitted their doctors sue on behalf on women. The Supreme Court established third-party standing for abortion doctors on behalf of their patients in a 1976 decision, Singleton v. Wulff. That case was brought by two doctors challenging the exclusion of abortion in Missouri’s Medicaid program. Justice Blackmun wrote for the court, “Aside from the woman herself, the physician is uniquely qualified, by virtue of his confidential, professional relationship with her, to litigate the constitutionality of the State’s interference with, or discrimination against, the abortion decision. Singleton recognized that women are chilled from asserting their abortion rights out of concern for their privacy.

In this case, although Louisiana did not challenge the doctors’ and clinics’ third-party standing in any of the cases that had made their way through lower courts for the last five and half years, the State now maintains that the third-party standing is not appropriate. Louisiana contends the courts have incorrectly assumed that doctors always have third-party standing to assert their patients’ constitutional rights to abortion without reviewing the specific facts of each case.

The State argues that the doctors do not meet the standards for third-party standing which requires: (1) the party asserting the right [must have] a ‘close’ relationship with the person who possesses the right, and (2) there must be a “hindrance” to the possessor’s ability to protect his own interests. The State maintains that the doctors in this case do not have a close relationship with their patients, and there is an inherent conflict in clinics and doctors challenging a health and safety regulation intended to protect abortion patients. They maintain that women can and do assert their own alleged rights in litigation challenging abortion regulations. The State argues that there was no evidence in this case “that any particular Louisiana woman who has obtained or is considering an abortion would personally (1) prefer to obtain an abortion from a doctor without admitting privileges, (2) prefer to forgo the protections Act 620 was intended to provide, or (3) consider her decision to obtain an abortion to be burdened by Act 620.”

The Plaintiffs maintain that the State waived the right to object to the standing of the clinics and providers by not raising this issue in the lower courts. Louisiana did not dispute Plaintiffs’ third party standing and present any evidence in the courts below to support their challenge now to third-party standing. The Plaintiffs contend there is a long history of cases ruling that doctors have the right to challenge abortion regulations on behalf of their patients, and the Court should abide by this precedent.

If the Supreme Court rules in favor of the State of Louisiana and determines that the clinics and doctors do not have third-party standing, then the Court does not need to reach the question of constitutionality of the admitting privileges law. The admitting privileges requirement would be allowed to stand, and any new challenges would need to be brought by women impacted by the law. The district court found that abortion in Louisiana is accompanied by discrimination, hostility, and occasional violence. Women seeking abortions in Louisiana also must overcome numerous obstacles including financial limitations, and concerns for privacy and personal safety, that would likely make it difficult for them to assert their constitutional rights and challenge an abortion restriction. ­­­

This could have far-reaching implications for other cases where third-party standing has been recognized including physicians’ ability to challenge laws on behalf of their patients’ rights to privacy for contraception, and to obtain mental health services. Third- party standing has also been used for education rights, housing rights, and criminal justice cases.

Allowing courts to evaluate credible evidence to determine if an abortion regulation benefits women is essential to evaluating whether an abortion law is constitutional. While Louisiana is claiming that requiring abortion providers to have hospital admitting privileges will protect women, the Supreme Court found that a nearly identical provision in Texas was an unnecessary regulation that would not protect women’s health and that the burden that this regulation would put on women outweighed any benefit. The state of Louisiana is asking the Court to re-open this question in this case.

In Whole Woman’s Health, the Supreme Court clarified that abortion restrictions are only constitutional if they further a valid state interest and have benefits that outweigh the burdens placed on women seeking abortions. The benefits and burdens of the laws must be based on credible evidence. The Court emphasized that the previous standard established in Planned Parenthood of Southeastern Pa. v. Casey “[u]nnecessary health regulations that have the purpose or effect of presenting a substantial obstacle to a woman seeking an abortion impose an undue burden on the right.” The rule announced in Casey “requires that courts consider the burdens a law imposed on abortion access together with the benefits those laws confer.”

The Court concluded that the Texas law requiring doctors who perform abortions to have admitting privileges at nearby hospitals did not provide any benefit to women’s health and concluded each provision of the law “places a substantial obstacle in the path of women seeking a previability abortion, each constitutes an undue burden on abortion access.” Therefore, the burden the law placed on women’s access to abortion outweighed the benefit. The district court that held the Texas law was unconstitutional based the factual findings of the lack of benefits on peer- reviewed studies on abortion complications, and expert testimony.

How many women need to be burdened?

Abortion regulations have typically been challenged before they go into effect to avoid the irreparable harm that would be caused by clinics closing and women losing access to their constitutional right to abortion—the burden. The question of what constitutes a burden is also central to this case. In 1992, the Supreme Court’s ruling in Planned Parenthood of Southeastern PA v. Casey, explained that to meet the undue burden standard, a “substantial obstacle” must be present within “a large fraction of the cases in which [it] is relevant.” The Court reiterated this standard in Whole Woman’s Health: “the relevant denominator is ‘those [women] for whom [the provision] is an actual rather than an irrelevant restriction.’”

The parties do not agree on how to define the relevant group of women affected by the Act 620 or what percentage of that group is a “large fraction.” The State of Louisiana points to Justice Alito’s dissent in Whole Woman’s Health and is requesting the Supreme Court to revisit this legal standard and only invalidate a law that burdens all women of reproductive age in a state.

The parties in this case have made different calculations regarding the share of women burdened by law and have different interpretations of the standard for a substantial burden and it will be up to the Court to determine how to define the burden.

How have the lower courts ruled on the Louisiana law?

The law was initially challenged by a group of abortion clinics and physicians in the Federal Middle District Court of Louisiana, and then the ruling, in favor of the plaintiffs was appealed to the federal 5th Circuit Court of Appeals who ruled in favor of the State.

The Federal Middle District Court of Louisiana: Requiring Abortion Providers to Have Hospital Admitting Privileges Would “Cripple Women’s Ability to have an Abortion”Soon after the passage of Act 620, but before the scheduled effective date of September 1, 2014, abortion clinics and physicians filed a complaint to enjoin the law. (See Appendix 1 for the timeline of the case.) The federal district court issued a temporary restraining order on August 31, 2014, enjoining enforcement of Act 620, but requiring the Plaintiffs to continue seeking admitting privileges at the relevant hospitals. The district court held a six-day trial in June 2015.

In January 2016, the district court ruled that Act 620 is unconstitutional, finding, “The medical benefits which would flow from Act 620 are minimal and are outweighed by the burdens which would flow from this legislation.” The district court determined that only one physician and one clinic would be left in the State to continue to provide abortions if the admitting privileges requirement were to go into effect.

The Plaintiffs then appealed the decision to the 5th Circuit Court of Appeals. After the Supreme Court decided Whole Woman’s Health in June 2016, the 5th Circuit remanded the case back to the district court so that it could be re-considered in light of Whole Woman’s Health. The district court issued a final judgment April 26, 2017, permanently enjoining the Act, ruling the law does “little or nothing for women’s health” but would cripple women’s ability to have an abortion.” The court found that approximately 70% of the women in Louisiana seeking an abortion would be unable to get an abortion in the State. The court also found no relationship between ability to obtain admitting privileges and competency. For over one year, the doctors had attempted to get hospital privileges but were unable to obtain them for a variety of reasons. Louisiana does not have standards for hospitals admitting privileges, and there is no time period in which hospitals need to respond to an application. Some hospitals require doctors to have a record of inpatient services, something most abortion providers do not have (because there are such few complications resulting from abortions). The district court included a detailed evidentiary record of each doctor’s attempts to obtain hospital privileges and the challenges they faced.

Fifth Circuit Court of Appeals: “A minimal burden even on a large fraction of women does not undermine the right to abortion.” The Requirement for Admitting Privileges does not “Impose a Substantial Burden on a Large Fraction of Women.”On September 26, 2018, the 5th Circuit overruled the district court’s decision, finding the district court clearly erred with its factual findings, and did not apply the correct legal standard. Citing the legislative history of Act 620 and the intent to promote women’s health, the 5th Circuit found that that Act 620 has a minimal health benefit. In reviewing the burden, the Court found that Act 620 does not impose a substantial burden on a large fraction of women. It also found that several doctors failed to seek admitting privileges in good faith and some of the burden on women would be caused by the doctors’ actions not the Act. After setting aside the district’s court’s factual findings as clearly erroneous, the 5th Circuit ruled that the Plaintiffs did not demonstrate an undue burden on a large fraction of women; 30% of all women seeking an abortion is not a large fraction, and the women who would be affected would not be burdened substantially.

Who determines the benefit of the law: state legislatures or courts?

One of the important issues in this case is who decides whether a state law benefits or harms women. In Whole Woman’s Health, the Supreme Court stated, “the Court, when determining the constitutionality of laws regulating abortion procedures, has placed considerable weight upon evidence and argument presented in judicial proceedings.” The Court prioritized the evidence that was presented in the case and placed less emphasis on the purported purpose of the law when enacted by state legislators.

Louisiana maintains that when the legislature enacted Act 620, it held committee hearings with extensive testimony and that Act 620 improves credentialing of abortion providers, and conditioning abortion provider qualifications on hospital credentialing introduces verification of competency that would not otherwise exist. The State is requesting that the Supreme Court give deference to state legislatures to enact laws to protect the health and safety on their citizens. They conclude that the law in question is rational law to protect women seeking abortions in Louisiana.

Constitutionality of the Louisiana Abortion Law: Facts and Legal Standards According to the Litigants
LitigantsFactsLegal Standard for Review of Admitting PrivilegesHow Many Women Need to be Burdened?
Plaintiffs:June Medical Services LLCTwo doctors (Doe 1 and Doe 2)Act 620 confers no health or safety benefit beyond the existing law.

Act 620 would result in the closure of two Louisiana’s three remaining clinics leaving only one physician to provide abortion care in the whole state. 7,000 of the 10,000 women seeking abortion in Louisiana would not be able to obtain an abortion.

In Whole Woman’s Health, The Supreme Court found that conditioning outpatient abortion care on hospital admitting privileges disqualifies competent providers and burdens abortion access. The Court must weigh the benefit with the burden. When a law serves no health or safety benefit, any burden imposed by the law is by definition undue.For those women actually restricted by Act 620, will that restriction amount to a substantial obstacle for a significant number of women.
Defendant:Stephen Russo, Interim Secretary, Louisiana Department of Health and HospitalsAct 620 improves credentialing for abortion providers.

Not all of the doctors made good faith efforts to obtain hospital admitting privileges. At most, the law would create a burden for 3,000 of the 10,000 women, but this burden would not be substantial

Regulations of abortion procedures that do not impose a substantial obstacle are examined under a rational basis standard.

State legislatures and medical boards have primary authority to set health and safety regulations and courts must review their work with adequate deference to the core state role of protecting health and safety.

Abortion regulations do not impose a substantial obstacle unless they make abortions nearly impossible to obtain for the relevant women (or all women, in a facial challenge), such that the abortion right exists in name only.

To be facially unconstitutional the Act would need to impose a substantial burden on a large fraction of women seeking an abortion.

The Plaintiffs contend that the leader of an anti-abortion advocacy groups sent the legislative sponsor an article touting H.B.2’s “tremendous success in closing abortion clinics and restricting abortion access in Texas.” In hearings on the bill, witnesses reiterated to legislator that Act 620 would shutter facilities in Louisiana, just as H.B. 2 had done in Texas.

After a six-day trial, the district court found that the Act 620 does not advance health or safety or ensure that physicians are competent to provide abortion care. In contrast, the 5th Circuit Court of Appeals found some evidence of a minimal benefit stating that “the admitting-privileges requirement performs a real, and previously unaddressed, credentialing function that promotes the wellbeing of women seeking abortion.” The 5th Circuit cites to the legislative history of Act 620 as demonstrating an intent to promote women’s health.

Which court establishes the facts of the case?

Under most circumstances, the district court is responsible for hearing and reviewing evidence and determining the facts of the case. Only when the district court’s factual findings are clearly erroneous do the appeals courts set aside these facts and establish their own set of facts. In this case, however, the Appeals court has used their own set of facts and rejected the evidence used in the case heard by the lower federal court.

After a full trial with witnesses and evidence, the district court ruled that Act 620 would create a substantial burden for women seeking abortion services and would force two of Louisiana’s three abortion clinics to close, leaving only one physician in the state who could provide abortion services.

However, the 5th Circuit Court of Appeals rejected the district court’s findings, and ruled that only one doctor had put forth a good-faith effort to get admitting privileges. Based on its determination of the facts, the 5th Circuit found that Act 620 does not impose a substantial burden. Although the parties agree that a court of appeals should only substitute its factual findings for the district court’s factual findings when the findings are clearly erroneous, they disagree about whether that standard was met in this case.

Looking Ahead

The Supreme Court will likely release its decision in this case at the end of June 2020. With the election only months away, and party conventions in July, this case once again puts abortion right in the middle of the political debate. While the Court’s decision is unlikely to overturn Roe v. Wade, the implications could be far reaching. Here are some of the possible ways the Court could rule:

  • Third-Party Standing: If the Court decides that doctors and clinics no longer have the right to challenge abortion regulations on behalf of their patients (third- party standing), abortion would remain a constitutional right, but many potentially unconstitutional abortion regulations may go unchallenged.
  • Deference to Legislature on Benefit of Law: The Court could change the standard created in Whole Woman’s Health by not requiring courts to consider credible evidence but to defer to the stated reason given by the legislature for the law in its review, giving states that want to restrict abortion greater leeway.
  • Standard for Substantial Burden: The Court could also alter the burden analysis by requiring a “large fraction” of all women of reproductive age to be “substantially burdened” not just the women affected by the law. This would raise the bar on the number or share of women who potentially would be harmed before a state law would be considered a “burden” to women.

No matter how the Court rules, the decision will have far reaching impact, affecting not only women in Louisiana, but potentially determining how far other states can go in limiting access to abortion services.
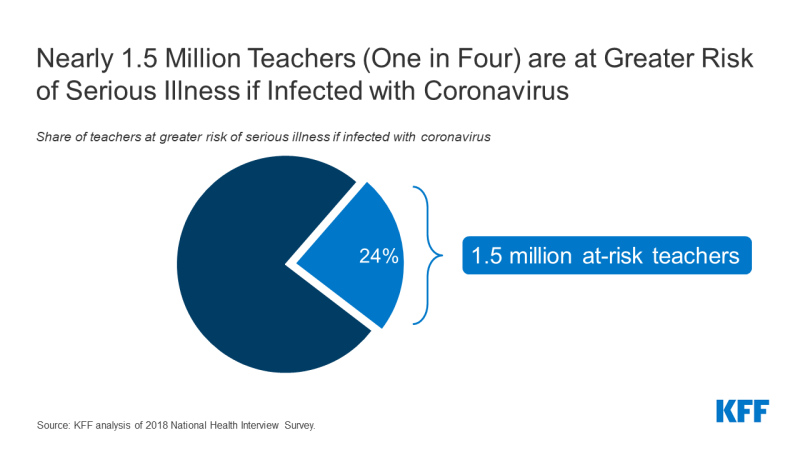
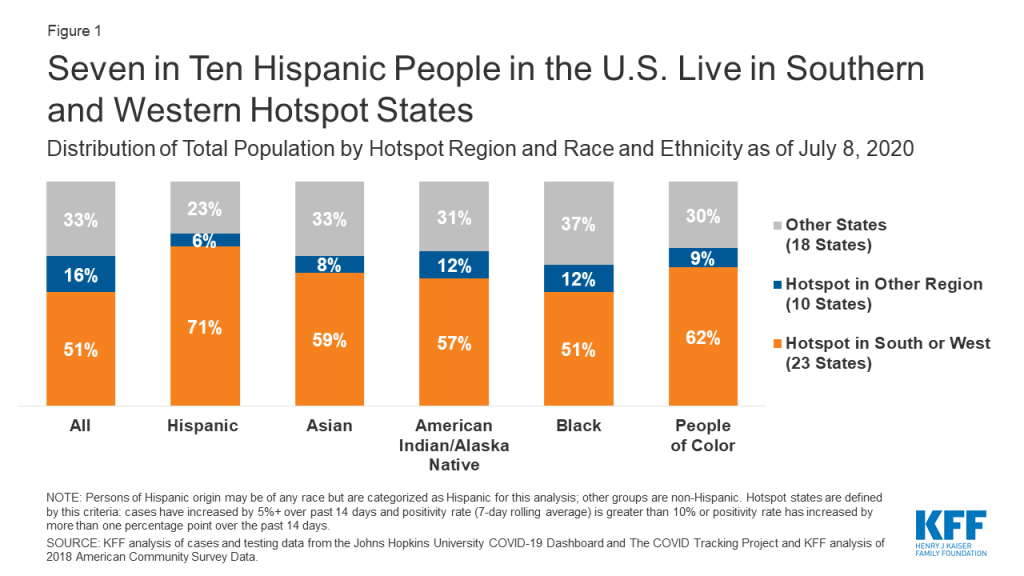
Appendix

Timeline: June Medical Services LLC v. Russo
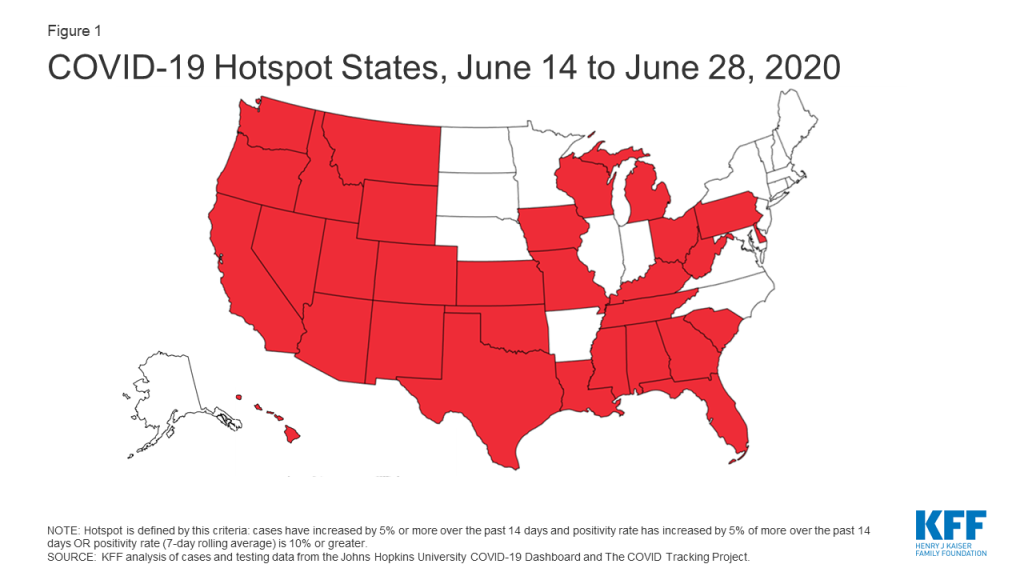
June 2014: Act 620 was signed into law.

August 22, 2014: June Medical Services challenged Act 620 in court.

August 31, 2014: The Middle District of Louisiana stayed the enforcement of the law while the doctors tried to obtain admitting privileges

January 26, 2016: The Middle District of Louisiana issued a preliminary injunction against Act 620.

February 24, 2016: The 5th Circuit stayed the preliminary injunction.

March 2016: The U.S. Supreme Court restored the preliminary injunction.

June 27, 2016: The U.S. Supreme Court held a Texas law similar to Act 620 was unconstitutional in Whole Woman’s Health v. Hellerstedt

April 26, 2017: The district court declared Act 620 was unconstitutional.

September 26, 2018: The 5th Circuit reversed and dismissed the Middle District of Louisiana’s 2017 ruling, upholding Louisiana Act 620.

January 18, 2019: The 5th Circuit Court of Appeals denied a petition to hear the case en banc.

April 17, 2019: June Medical Services, the petitioner, filed a petition with the U.S. Supreme Court.

October 4, 2019: The U.S. Supreme Court agreed to hear the case.

March 4, 2020: Oral argument at the Supreme Court