U.S. Has Higher Number of COVID-19 Cases per Capita Compared to Other Countries That Reopened Schools
Source
What Do We Know About Children and Coronavirus Transmission?
The independent source for health policy research, polling, and news.
What Do We Know About Children and Coronavirus Transmission?
Key Takeaways
The COVID-19 pandemic has led to renewed interest among policymakers, the media, residents, and their families in nursing home regulation and oversight, as residents and staff are at increased risk of infection due to the highly transmissible nature of the coronavirus, the congregate nature of facility settings, and the close contact that many workers have with patients. Certification of nursing home compliance with federal Medicare and/or Medicaid requirements generally is performed by states through regular inspections known as surveys. Federal regulations issued in 2016 require facilities to have an infection control and prevention program and a written emergency preparedness plan. This issue brief answers key questions about nursing home oversight and explains how federal policy has changed in light of COVID-19. Key findings include:
There has been sustained attention on nursing homes in the wake of COVID-19, from the initial widespread outbreak at a facility in Washington State to the disproportionate number of cases and deaths among residents and staff nationally throughout the pandemic. Nursing home residents include 1.2 million seniors and nonelderly people with disabilities living in over 15,000 facilities. These residents and the 3 million people who work in skilled nursing or residential care facilities are at increased risk of infection due to the highly transmissible nature of the coronavirus, combined with the congregate nature of facility settings and the close contact that many workers have with patients. If infected, many residents are at increased risk of adverse health outcomes and death from COVID-19, due to old age and/or underlying chronic health conditions. Over 40% of all COVID-19 deaths have been residents or staff of long-term care facilities, with even higher numbers in some states. At the pandemic’s outset, nursing home oversight and response was concentrated at the state level, which led to different protocols across states and facilities, with little federal involvement and substantial shortages of personal protective equipment and coronavirus tests.
As a result of the pandemic’s impact, policymakers, residents, staff, and others have raised questions about whether there has been sufficient federal and state oversight of and guidance for nursing homes, and CMS has released a series of guidance and other policy actions. The Social Security Act authorizes the Health and Human Services (HHS) Secretary to establish requirements relating to nursing home residents’ health, safety and well-being as conditions for facilities to receive payment from the Medicare and Medicaid programs. Nursing homes can be certified as Medicare skilled nursing facilities (SNFs)1 and/or Medicaid nursing facilities (NFs).2 Medicare is the primary payer for about 12 percent of nursing home residents, with coverage limited to short-term stays for skilled nursing care or rehabilitation. Medicaid is the primary payer for 62 percent of nursing home residents, covering both short-term skilled nursing care and rehabilitation, as well as long-term care. This brief answers key questions about nursing home oversight and explains how federal policy has changed in light of COVID-19.
Certification of nursing home compliance with federal Medicare and/or Medicaid requirements generally is performed by states through regular inspections known as surveys.3 States receive 75% federal matching funds for Medicaid nursing facility survey and certification activities,4 while Medicare SNF survey and certification activities are funded by a discretionary appropriation. Appendix 1 explains the survey process. States also must investigate complaints of facility violations of federal requirements5 and allegations of abuse, neglect, and misappropriation of resident property by nurse aides or other facility service providers6 and conduct periodic educational programs for facility staff and residents about current regulations, policies, and procedures.7
The penalties for facilities found to be out of compliance with federal requirements vary depending on whether the deficiency is determined to immediately jeopardize residents’ health or safety.8 For deficiencies that result in immediate jeopardy, a facility is subject to the appointment of temporary management to oversee operations while deficiencies are corrected or termination from the Medicare and/or Medicaid programs with the safe and orderly transition of residents to another facility or community setting.9 However, a facility may continue to receive Medicare and/or Medicaid payments for up to six months after a deficiency finding, if the state finds that this alternative is more appropriate than program termination. In these instances, the facility must agree to repay Medicare funds, and the state must agree to repay federal Medicaid funds, if corrective action is not taken according to a Secretary-approved plan and timetable. For deficiencies that do not result in immediate jeopardy, a facility may be allowed up to six months to correct deficiencies. A facility that does not come into substantial compliance within three months is subject to denial of Medicare and/or Medicaid payment for all individuals admitted after the deficiency finding date. A facility that is not in substantial compliance within six months is subject to Medicare program termination and discontinuance of Medicaid federal financial participation.
Civil money penalties (CMPs) can be imposed for the number of days a facility is not in substantial compliance or for each instance that a facility is not in substantial compliance.10 CMPs can range from $6,525 to $21,393 for deficiencies constituting immediate jeopardy, and from $107 to $6,417 for deficiencies that do not constitute immediate jeopardy but either caused actual harm or did not cause actual harm but have the potential for more than minimal harm. Per instance CMPs range from $2,140 to $21,393. A portion of CMP funds collected are returned to states and can be used for activities that protect or improve care quality or resident quality of life as approved by CMS, such as supporting and protecting residents during facility closures, relocating residents, supporting resident and family councils and other consumer involvement, facility improvement initiatives such as staff and surveyor training or technical assistance for quality assurance and performance improvement programs, or developing and maintaining temporary manager capability such as recruitment, training, or system infrastructure expenses.
Additional remedies apply to facilities with patterns of deficiencies over time. A facility that is found to provide substandard care quality on three consecutive standard surveys is subject to denial of Medicare and Medicaid payments for all new admissions or entirely and is subject to state monitoring until the facility demonstrates that it has regained and will remain in substantial compliance.11 CMS and/or the state also may direct staff in-service training for facilities with patterns of deficiencies.
Prior to the late 1960s, nursing homes were “essentially unregulated in most states,” and care quality was generally considered to be poor.12 The creation of Medicare and Medicaid in 1965 led to greater federal involvement in nursing home regulation with the establishment of federal criteria to certify facilities. However, concern about care quality and inadequate enforcement continued through the 1970s and 1980s, leading to the appointment of an Institute of Medicine (IOM) committee to recommend changes. The IOM recommendations included incorporating resident assessment, care quality, quality of life, and residents’ rights in federal conditions of participation and making both regulatory requirements and the survey and certification process more “resident-centered and outcome-oriented,” with a shift in emphasis “from facility capability to facility performance.”13 The IOM report also recommended increased federal funding and oversight of state survey agencies and establishing intermediate sanctions short of program termination and facility closure to enforce compliance. Appendix 2 contains additional background about the evolution of federal nursing home oversight.
The IOM recommendations led to changes adopted in the 1987 Nursing Home Reform Act, which established Medicare SNF and Medicaid NF requirements in three main areas: service provision, residents’ rights, and administration and other matters (Appendix Table 1). The Nursing Home Reform Act strengthened federal standards, inspections, and enforcement provisions; merged Medicare and Medicaid standards; required comprehensive resident assessments; set minimal licensed nursing staff requirements; and required inspections to focus on care outcomes.14 Service provision requirements are related to quality of life, care plans, resident assessment, services and activities, nurse aide training, physician supervision and clinical records, social services, and nurse staffing information.15 Facilities must protect and promote specific residents’ rights including free choice, freedom from restraints, privacy, confidentiality, accommodation of needs, grievances, participation in resident and family groups and other activities, examination of survey results, and refusal of certain transfers. Additional requirements govern the use of psychopharmacologic drugs, advance directives, access and visitation, equal access to quality care, admissions, and protection of resident funds. Administration requirements include licensing and life safety code, sanitary and infection control and physical environment standards.
To help address continuing quality concerns, the 2010 Affordable Care Act (ACA) included some additional reforms. The Nursing Home Transparency and Improvement Act, adopted as part of the ACA, sought to address complex ownership, management, and financing structures that inhibited regulators’ ability to hold providers accountable for compliance with federal requirements. The ACA also incorporated the Elder Justice Act and the Patient Safety and Abuse Prevention Act, which include provisions to protect long-term care recipients from abuse and other crimes.
The 2016 nursing home regulations issued by the Obama Administration were the first comprehensive update in 25 years. The original consolidated Medicare and Medicaid facility participation requirements were issued in 1989, following the Nursing Home Reform Act, and revised in 1991. The 2016 regulations sought to account for ensuing innovations in resident care and quality assessment and an increasingly diverse and clinically complex resident population.16 New requirements added by the 2016 regulations most relevant to issues raised by COVID-19 include those related to infection control, facility assessment, and emergency preparedness (Box 1). The 2016 regulations also revised provisions related to resident rights, adopting a greater emphasis on person-centered care; reporting of abuse and neglect; and transfer and discharge rights. Additionally, the 2016 regulations added a new section on behavioral health services, adopted a competency requirement for determining staffing sufficiency and new staff training program requirements, and implemented ACA requirements for facility quality assurance and performance improvement programs17 and compliance and ethics programs.18 The regulations were implemented in three phases from 2016 through 2019.
Box 1: 2016 Nursing Facility Regulations Relevant to COVID-19 Pandemic
The 2016 regulations require facilities to establish an infection prevention and control program to provide a safe, sanitary, and comfortable environment and help prevent the development and transmission of communicable diseases. The program must include a system for preventing, identifying, reporting, investigating, and controlling infections and communicable diseases for all residents, staff, volunteers, visitors, and other individuals providing services under a facility contract. The program is based on the facility assessment (described below) and must follow “accepted national standards.” The program must include written standards, policies, and procedures for a surveillance system to identify possible communicable diseases before they can spread to others in the facility; when and to whom possible incidents should be reported; standard and transmission-based precautions to prevent infection spread; when and how isolation should be used for a resident; the circumstances under which the facility must prohibit employees with a communicable disease from direct contact with residents or their food; and hand hygiene procedures. The facility also must designate at least one infection preventionist responsible for the program. The program must be reviewed annually, and the facility must provide staff training on the program.
Facilities must conduct an assessment to determine what resources are necessary to care competently for residents during both regular day-to-day operations and emergencies. The facility assessment must consider the resident population; necessary staff competencies; the physical environment, equipment and services necessary to provide care; any ethnic cultural or religious factors that may affect care; facility resources such as buildings and equipment; services such as physical therapy, pharmacy, and specialized rehabilitation; personnel; contracts with third parties; and health information technology. The assessment must be updated as needed and at least annually.
Facilities must have a written emergency preparedness plan. This provision was issued in a separate 2016 provider emergency preparedness regulation.19 The plan must be reviewed and updated at least annually. Facilities must train all employees in emergency procedures when they begin to work in facility and periodically review procedures with existing staff. Facilities also must have an emergency preparedness communication plan including a means of providing information about the general condition and location of residents under the facility’s care and a method for sharing appropriate information from the emergency plan with residents and their families.
In July 2019, the Trump Administration proposed a number of changes to the 2016 regulations, which it said would increase provider flexibility and reduce regulatory burden. The proposed changes, which are still pending, include:
Also in July 2019, the Trump Administration issued a final regulation that eliminated the existing ban on pre-dispute arbitration agreements.
Infection control deficiencies were widespread and persistent in nursing homes prior to the COVID-19 pandemic, according to a May 2020 GAO report.20 The GAO found that “infection prevention and control deficiencies were the most common type of deficiency cited in surveyed nursing homes, with most nursing homes having an infection prevention and control deficiency cited in one or more years from 2013 through 2017 (13,299 nursing homes, or 82 percent of all surveyed homes).” All states had facilities with infection prevention and control deficiencies cited in multiple consecutive years, indicating “persistent problems.” These deficiencies include staff failing to regularly use proper hand hygiene or failing to implement preventive measures to control infection spread during an outbreak, such as isolating sick residents and using masks and other personal protective equipment (PPE). GAO also found that nearly all infection prevention and control deficiencies were classified by surveyors as not severe, meaning the surveyor determined that residents were not harmed, and implemented enforcement actions for these deficiencies were typically rare. GAO plans future reports to examine CMS guidance and oversight of infection control more broadly as well as CMS’s response to COVID-19.
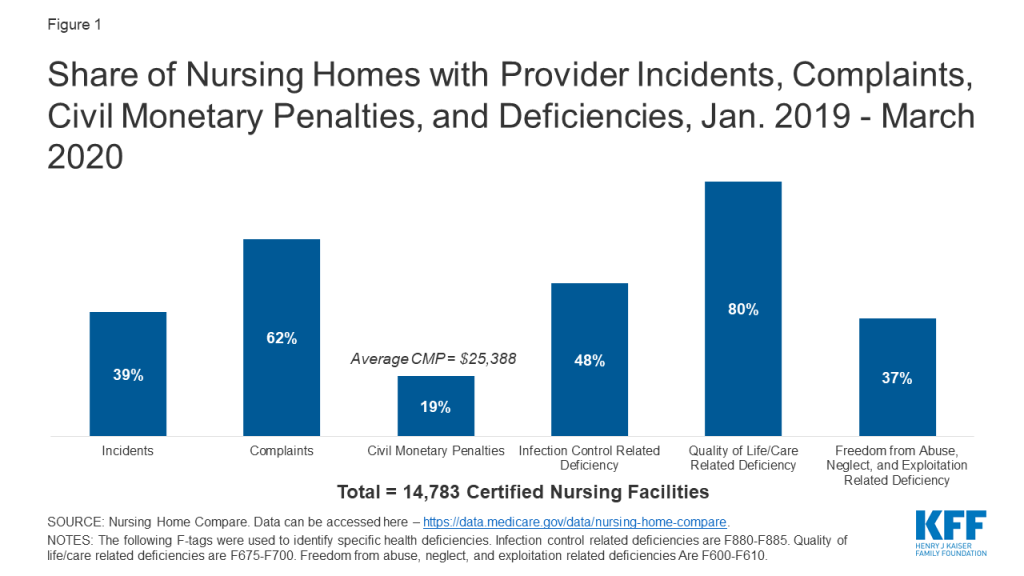
In regular surveys conducted from January 2019 through March 2020, nearly half of facilities received an infection control deficiency (Figure 1). Most facilities (80%) received a deficiency related to resident quality of life or care, and 37% received an abuse/neglect/exploitation deficiency (Figure 1). Just under 20% of facilities received a CMP, with the average amount just over $25,000 (Figure 1). During this same time period, 62% of facilities had substantiated complaints regarding violations of federal requirements, and 39% of facilities had incidents with alleged or suspected resident abuse, neglect, or misappropriation of property (Figure 1).
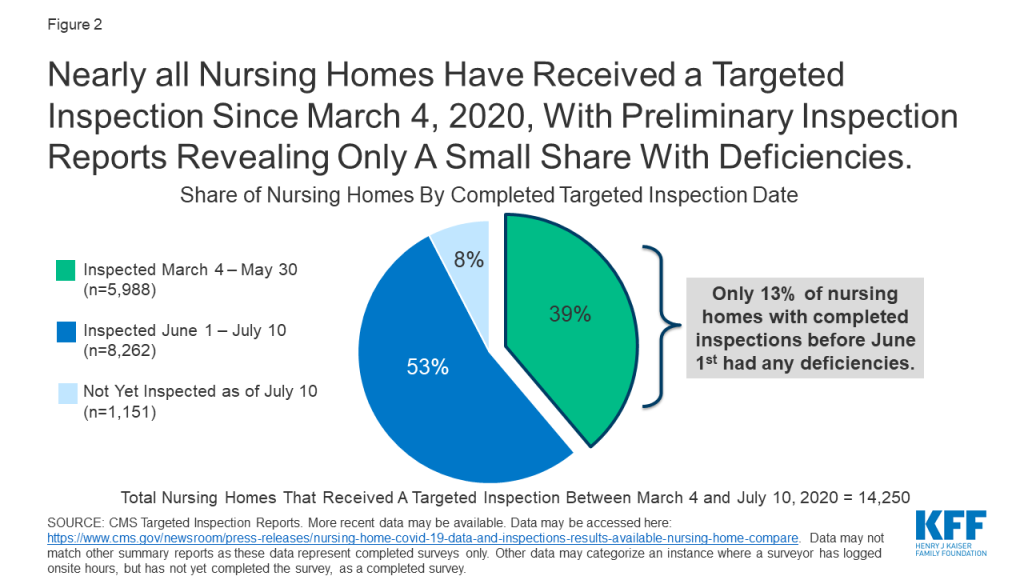
In response to COVID-19, CMS suspended state survey activities in March 2020, except for those related to infection control and immediate jeopardy. Nearly all nursing homes have received these targeted surveys since March 4, 2020, with preliminary inspection reports revealing only a small share with deficiencies (Figure 2). Just 13% of the nearly 6,000 facilities surveyed between March 4 and May 30, 2020 were cited as deficient in meeting any federal requirements. Though nursing homes across the country have experienced high rates of COVID-19 cases and deaths, the data does not point to quality deficiencies as a reason for this occurrence.
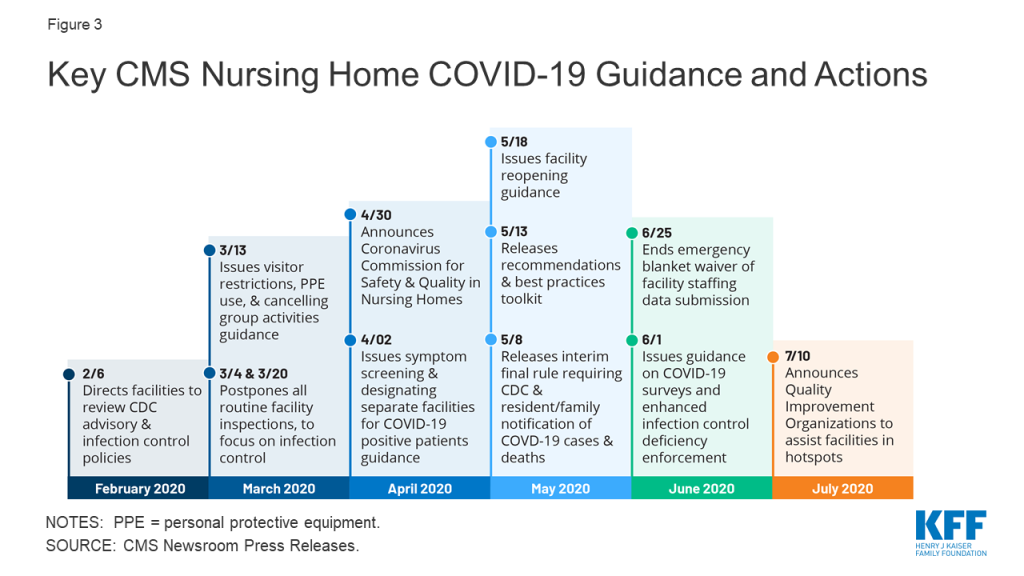
As the number of COVID-19 cases and deaths in nursing homes increased, CMS has issued guidance about how facilities should respond to the pandemic (Figure 3). A February 2020 informational bulletin advised health care facilities to review the Centers for Disease Control (CDC) COVID-19 advisory and recommendations as well as their own infection control policies. As noted above, CMS suspended state survey activities in March 2020, except for those related to infection control and immediate jeopardy. That same month, CMS infection control and prevention guidance advised facilities to screen visitors and staff and about when to transfer residents to and accept those discharged from hospitals. CMS also required facilities to restrict all visitors except for compassionate care circumstances and cancel all communal dining and group activities, released guidance allowing facilities to perform COVID-19 tests, and issued a number of Section 1135 blanket waivers to help facilities’ emergency response. In April 2020, CMS issued guidance directing facilities to screen all staff, residents, and visitors for symptoms, ensure staff use PPE “to the extent available,” and designate separate staff and facilities or units for COVID-19 patients.
In April 2020, CMS announced the formation of an independent commission to conduct a comprehensive assessment of facility response to COVID-19. The commission is expected to make recommendations to protect residents from COVID-19 and improve care delivery responsiveness; strengthen efforts to rapidly identify and mitigate infectious disease transmission in nursing homes; and enhance strategies to improve compliance with infection control policies. The commission also is charged with identifying approaches to better use data to enable federal, state, and local entities to address the current spread of COVID-19 within facilities, analyze the impact of efforts to stop or contain the virus within facilities, and identify best practices to address COVID-19 that CMS or states could adopt. Commission members are to include residents, families, resident/patient advocates, industry experts, clinicians, medical ethicists, administrators, academics, infection control and prevention professionals, state and local authorities, and other experts. Twenty-five Commission members were announced in June 2020, and a final report is expected in fall 2020.
As of May 2020, facilities must report COVID-19 data to the CDC and provide information to residents and their families. Prior to this interim final rule, facilities were not required to report infectious disease information to the CDC, though they typically report to state and/or local health departments. The lack of centralized data contributed to difficulty in tracking disease spread and coordinating dissemination of personal protective equipment and testing supplies. The new rule requires weekly reporting of suspected and confirmed infections among residents and staff including residents previously treated for COVID-19; total deaths and COVID-19 deaths among residents and staff; PPE and hand hygiene supplies in the facility; ventilator capacity and supplies in the facility; resident beds and census; access to COVID-19 testing while a resident is in the facility; staffing shortages; and other information specified by the Secretary.
CMS is publicly reporting the data, and recently announced additional actions based on the data. In July 2020, CMS sent “Task Force Strike Teams” of clinicians and public health officials to 18 nursing homes in six states experiencing an increase in COVID-19 cases. The Teams are focused on determining immediate actions and needed resources to reduce virus spread. In late July 2020, CMS also announced that it would send a weekly list of nursing homes with an increase in cases to states.
The new rule also requires facilities to inform residents, their representatives, and families of confirmed or suspected COVID-19 cases among residents and staff by 5 pm the next calendar day following a single confirmed case or three or more residents or staff with new onset of respiratory symptoms within 72 hours of each other. Facilities also must provide cumulative updates at least weekly by 5 pm the next calendar day following each subsequent occurrence of confirmed infection or whenever three or more residents or staff with new onset of respiratory symptoms occur within 72 hours of each other. Facilities must include information on mitigating actions implemented to prevent or reduce the risk of transmission including whether normal operations will be altered such as restrictions or limitations on visits or group activities. Facilities cannot release personally identifiable information and can communicate through paper notices, a listserv, a website post or recorded phone messages.
In May 2020, CMS issued nursing home reopening recommendations and an informational toolkit with best practices for states to mitigate COVID-19 in nursing homes. The reopening guidance sets out criteria for relaxing restrictions using a phased approach and mitigating the risk of resurgence, including case status in the community, case status in the facility, adequate staffing, access to adequate testing, universal source control (masks, social distancing, and hand washing for visitors), adequate access to PPE for staff, and local hospital capacity. The guidance also includes considerations for allowing visitors and services and for restarting routine state survey activities in each phase. Additionally, quality improvement organizations (QIOs) under contract with CMS are providing technical assistance with a focus on about 3,000 low performing facilities with a history of infection control issues to help identify problems, create and implement an action plan, and monitor compliance. For example, QIOs train staff on proper PPE use, appropriate resident cohorting, and safe resident transfers. States also can request QIO technical assistance targeted to facilities that have experienced an outbreak.
In June 2020, CMS issued additional guidance to states on COVID-19 survey activities and enhanced enforcement for infection control deficiencies. CMS noted that focused infection control surveys pursuant to the March 2020 guidance had been completed in 53 percent of facilities, with wide state variation. As a result, states that have not completed all of these surveys by July 31, 2020 must submit a corrective action plan outlining their strategy to complete these surveys within 30 days. If all surveys still are not complete after the 30-day period, states’ CARES Act FY 2021 allocation may be reduced by up to 10%. Subsequent 30-day extensions could result in additional reductions up to 5%, with funding redistributed to states that have completed their surveys. The CARES Act provided $100 million for nursing home inspections focused on those with COVID-19 community spread from FY 2021 through FY 2023, $81 million of which will be available to state survey agencies. This represents a 6% annual increase in the nursing home survey and certification budget, which had remained at $397 million annually since October 2014. CARES funds may be used for state surveys, strike teams, enhanced surveillance or monitoring of nursing homes, or other state-specific interventions. The June 2020 guidance also establishes enhanced enforcement remedies for infection control deficiencies including directed plans of correction, discretionary denial of payment for new admissions, and CMPs.
The June 2020 guidance also announced three additional survey requirements: (1) states must perform on-site surveys of nursing homes with previous COVID-19 outbreaks by July 1, 2020; (2) states must perform on-site surveys within three to five days of identification of any nursing homes with three or more new suspected or confirmed cases since the last CDC COVID-19 report or one confirmed resident case in a facility that previously was COVID-free; and (3) starting in FY 2021, states must perform annual focused infection control surveys of 20 percent of facilities. States could forfeit 5% of their annual CARES Act allocation for failing to perform these activities.
The June 2020 guidance also authorizes states to expand survey activities to include more routine surveys once a state has entered phase 3 of the nursing home reopening guidance or earlier at state discretion. The expanded activities include complaint investigations that are not immediate jeopardy, revisit surveys to any facility with a removed immediate jeopardy finding but that is still out of compliance, special focus facility and special focus facility candidate recertification surveys, and nursing home and intermediate care facility for individuals with intellectual and developmental disabilities recertification surveys greater than 15 months. When expanding survey activities, states should prioritize facilities with a history or allegations of noncompliance regarding abuse or neglect, infection control, violations of transfer or discharge requirements, insufficient staffing or competency, or other care quality issues such as falls or pressure ulcers.
In late July 2020, CMS began requiring, rather than recommending, that all staff be tested weekly in nursing homes in states with a 5% or greater positivity rate. HHS also is distributing rapid diagnostic tests to nursing homes in COVID-19 hotspots through a one-time procurement to facilitate on-site testing of residents and staff. CMS and the CDC are offering COVID-19 training to nursing homes, which includes cohorting strategies and using telehealth to mitigate virus spread.
As the pandemic continues, state survey agencies may face issues related to funding, capacity, and data. CMS will withhold CARES funds from state survey agencies that do not timely complete inspections, but these penalties may be too blunt for agencies whose lack of compliance stems from insufficient funding in the first place. As noted above, prior to the new CARES Act funds, the survey and certification budget had remained flat since 2014. It remains to be seen whether these new funds will be sufficient for state agencies to perform regular surveys as well as increased oversight in the foreseeable future resulting from the pandemic. While facilities are now reporting COVID-19 cases and deaths to CMS, these data are not cumulative prior to May 8, 2020, and it will be important for both state survey agencies and CMS to continue to monitor data and adjust policy guidance and facility oversight as needed.
Nursing facilities also face a number of challenges in their continued pandemic response. Nearly $5 billion in federal provider relief funds has been allocated to nursing facilities to cover health care related expenses or lost revenues attributed to coronavirus. On July 22, 2020, HHS announced that an additional $5 billion from the provider relief fund is being allocated to Medicare-certified long-term care facilities and state veterans homes. These funds may be used to hire additional staff, implement infection control “mentorship” programs with subject matter experts, increase testing, and provide additional services, such as technology so residents can connect with their families if they are not able to visit. As of June 28, 2020, nearly one in three nursing homes nationally report a shortage of staff and/or PPE. Despite federal legislation generally requiring insurers to cover coronavirus testing without cost-sharing, recent federal guidance concludes that insurers do not have to cover coronavirus “testing conducted to screen for general workplace health and safety (such as employee “return to work” programs).” This leaves open the question about who will pay for regular tests needed for facility staff to safely work during the pandemic. It also remains to be seen whether facilities will be able to maintain adequate staffing levels as the pandemic continues. CMS has lifted its emergency waiver of the staffing data submission requirement, and facilities must submit regular staffing data for April through June 2020 by August 14, 2020. Facilities also may be under financial strain due to lower occupancy levels as a result of the pandemic.
While the data and experience to date do not show a direct link between nursing home quality and COVID-19 cases, the pandemic has brought renewed attention to issues of nursing home quality and oversight at the federal and state levels. Nursing home quality concerns have existed for decades. With the current focus on challenges facing nursing homes and state survey agencies as they respond to the pandemic, policymakers may revisit whether federal Medicare and Medicaid requirements should be adjusted to improve oversight and whether additional funding is needed to support providers and agencies to ensure sufficient capacity and resources. These issues are likely to continue to be the subject of policy discussion and debate as long-term care coronavirus cases, particularly in “hotspot states” with wider community transmission continue to rise. While most nursing facilities are Medicare-certified, a small number (315 or 2%) are only Medicaid-certified and therefore appear ineligible for a share of the additional provider relief funds announced on July 22.
More broadly, seniors and people with disabilities who receive long-term services and supports in other settings, such as assisted living facilities, intermediate care facilities for people with intellectual/developmental disabilities, institutions for “mental disease,” and group homes, also are at increased risk of serious illness if infected with coronavirus based on older age and/or chronic health conditions. Unlike nursing homes, other long-term care congregate settings are primarily regulated by states, leading to greater variation in quality protections and lack of standardized reporting about coronavirus cases, deaths, staffing, supplies, and other data necessary to understand and respond to the pandemic and understand its full impact on all people who receive long-term care services and the staff who provide them.
A facility is subject to a standard survey, without advance notice, at least once every 15 months.21 If found to have provided substandard care quality,22 a facility is subject to an extended survey within two weeks of the standard survey.23 In addition, states may conduct special surveys within two months of any change in facility ownership, administration, management, or nursing director to determine whether care quality has declined as a result of the change.24 The Secretary also can conduct special surveys when the Secretary has reason to question facility compliance with federal requirements.25 Standard surveys include a case-mix stratified sample of residents.26 Extended surveys review and identify facility policies and procedures that produced substandard care quality, expand the sample size of resident assessments reviewed, and review staffing, in-service training, and if appropriate, consultant contracts.27
Facility surveys are conducted by a multi-disciplinary team using a protocol developed by the Secretary.28 The survey team must include a registered nurse and may include physicians, physician assistants, nurse practitioners, physical, speech, or occupational therapists, dieticians, sanitarians, engineers, licensed practical nurses, social workers, or other professionals.29 The survey team cannot include anyone who has served as staff or a consultant to the facility in the prior two years or who has a personal or familial financial interest in the facility.30
Survey and certification information, including statements of deficiencies, must be made publicly available by states and the Secretary within 14 days after the facility is notified.31 States submit this information, including any enforcement actions, to the Secretary on the same day that the facility is notified, and the Secretary uses this information to update the federal Nursing Home Compare website at least quarterly.32 The website must include facility staffing data, including resident census data and hours of care provided per resident per day and information on staffing turnover and tenure; links to state survey and certification programs, inspection reports, and facility plans of correction or report responses; information on how to file a complaint with the state survey and certification program and the state long-term-care ombuds program; summary information on the number, type, severity, and outcome of substantiated complaints; the number of adjudicated instances of criminal violations by the facility or its employees committed within the facility regarding abuse, neglect, exploitation, criminal sexual abuse or other violations resulting in serious bodily injury; and CMPs levied against the facility, its employees, contractors, and other agents. States also must notify the state long-term care ombudsman of any findings of noncompliance or adverse actions taken against facilities.
After the creation of the Medicare and Medicaid programs, it soon became clear that “[s]trict enforcement of federal standards would have barred most nursing homes from participating in the Medicare program”33 in the mid-1960s, and certification of nursing homes to participate in Medicaid was left to the states.34 After increased congressional and media attention to substandard facility conditions and lax government oversight, revised federal regulations certifying facilities to participate in Medicare and Medicaid were established in 1974. Continued concern about care quality and inadequate enforcement led to new proposed federal regulations issued in 1980 by the Carter Administration. However, the nursing home industry objected to the new regulations’ projected costs, and the regulations were rescinded by the Reagan Administration. In turn, the Reagan Administration’s subsequent proposal, which would have deleted or relaxed many existing standards, was set aside after opposition from consumer advocates, states, Congress, and providers. The impasse led to the appointment of an Institute of Medicine (IOM) committee to recommend changes.
The 1986 IOM committee report contained numerous recommendations to enhance nursing home care quality and resident quality of life by improving nursing home regulation.35 While the IOM committee credited the 1974 regulations with contributing to better care quality, it noted “substantial room for improvement” due to weaknesses in the regulations and uneven administration and enforcement by states.36 At the time of the IOM study, “there [was] broad consensus that government regulation of nursing homes, as it now functions, is not satisfactory because it allows too many substandard nursing homes to continue in operation.” Concerns included “neglect and abuse leading to premature death, permanent injury, increased disability, and unnecessary fear and suffering on the part of residents,” poor quality of life and lack of autonomy, and poor quality medical and nursing care.37 The IOM committee emphasized that government regulation of nursing homes is warranted due to residents’ “large array of physical, functional, and mental disabilities,” limited opportunities for transfer among facilities, and inability to pay for care out-of-pocket.
Although the IOM recommendations led to changes adopted in the 1987 Nursing Home Reform Act, concerns about poor care quality and inadequate enforcement of federal standards continued. Between 1997 and 2010, the Government Accountability Office (GAO) issued more than 20 reports finding substandard care in many nursing homes; understatement of serious deficiencies by state surveyors; unenforced sanctions for harming residents; facilities cycling in and out of compliance; and inconsistent and ineffective federal oversight.38 During the same period, the HHS Office of Inspector General issued reports critical of facility compliance and state and federal enforcement.39 Recurring concerns include staffing levels, abuse and neglect, unmet resident needs, care quality, staff training and competency, and lack of integration between medical care and other services.40
| Table 1: Summary of Federal Requirements for Medicare and Medicaid Certified Nursing Homes | ||
| Area | Description | Citation |
| Requirements related to provision of services | ||
| Quality of Life | Care for residents in a manner and environment that promotes, maintains, or enhances each resident’s quality of life. Maintain a quality assessment and assurance committee to identify issues and develop and implement plans of action to correct identified deficiencies. | 42 U.S.C. § 1395i-3 (b)(1); 42 U.S.C. § 1396r (b)(1); 42 C.F.R. § 483.24. |
| Scope of services and activities under care plan | Provide services to attain or maintain the highest practicable physical, mental, and psychosocial well-being of each resident in accordance with a written care plan that describes the resident’s medical, nursing, and psychosocial needs and how these needs will be met. Care plan is initially prepared, with the participation to extent practicable of the resident or resident’s family or legal representative, by a team that includes the resident’s attending physician and a registered professional nurse with responsibility for the resident; and is periodically reviewed and revised. | 42 U.S.C. § 1395i-3 (b)(2); 42 U.S.C. § 1396r (b)(2); 42 C.F.R. § 483.21. |
| Residents’ assessments | Conduct a comprehensive, accurate, standardized, reproducible assessment of each resident’s functional capacity, which describes the resident’s capability to perform daily life functions and significant impairments in functional capacity. Assessment must be based on the uniform minimum data set specified by the Secretary, use an instrument specified by the states, include the identification of medical problems, and be conducted or coordinated by a registered professional nurse. Assessments must be conducted promptly and no later than 14 days after admission, promptly after any change in the resident’s physical or mental condition, and at least once a year. Examine each resident at least once every 3 months and revise the assessment as appropriate. | 42 U.S.C. § 1395i-3 (b)(3); 42 U.S.C. § 1396r (b)(3); 42 C.F.R. § 483.20. |
| Provision of services and activities | To the extent needed to fulfill care plans, provide or arrange for nursing and specialized rehabilitative services and medically related social services to attain or maintain each resident’s highest practicable physical, mental and psychosocial well-being; pharmaceutical services; dietary services that meet each resident’s daily nutritional and special dietary needs; an ongoing activity program to meet each resident’s interests and physical, mental and psychosocial well-being; routine dental services and emergency dental services; and treatment and services required by residents who have mental illness or intellectual disabilities not otherwise provided or arranged for by the state. Provide 24-hour licensed nursing services sufficient to meet resident needs, including registered professional nurse services at least 8 consecutive hours a day, 7 days a week, except that the Secretary may waive this requirement for certain rural SNFs, and states may waive this requirement for NFs that demonstrate their inability, despite diligent efforts (including offering wage at the community prevailing rate), to recruit appropriate personnel and if the state determines resident health and safety will not be endangered and a registered professional nurse or physician is obligated to respond immediately to phone calls from facility. | 42 U.S.C. § 1395i-3 (b)(4); 42 U.S.C. § 1396r (b)(4); 42 C.F.R. § § 483.25, 483.30, 483.35, 483.40, 483.45, 483.50, 483.55, 483.60, 483.65. |
| Required training of nurse aides | After 4 months, full-time nurse aides must have completed a training and competency evaluation program. Provide regular performance reviews and in-service education to assure nurse aide competency to provide services, including services to individuals with cognitive impairments. | 42 U.S.C. § 1395i-3 (b)(5); 42 U.S. C. § 1396r (b)(5). |
| Physician supervision and clinical records | Require that every resident’s medical care be provided under physician supervision (or for NFs, supervision of nurse practitioner, clinical nurse specialist, or physician assistant), provide for having a physician available to furnish necessary medical care in case of emergency and maintain clinical records on all residents which include care plans and resident assessments. | 42 U.S.C. § 1395i-3 (b)(6); 42 U.S.C. § 1396r (b)(6). |
| Required social services | Facilities with more than 120 beds must have at least one full-time social worker. | 42 U.S.C. § 1395i-3 (b)(7); 42 U.S.C. § 1396r (b)(7). |
| Information on nurse staffing | Post daily and make available to the public on request the current number of licensed and unlicensed nursing staff directly responsible for resident care in the facility for each shift. | 42 U.S.C. § 1395i-3 (b)(8); 42 U.S.C. § 1396r (b)(8). |
| Requirements related to residents’ rights | ||
| General rights | Protect and promote each resident’s rights including the rights to free choice (including choice of personal attending physician, to be fully informed in advance about care and treatment and any changes that may affect resident well-being and to participate in care planning and treatment); freedom from restraints (including physical or mental abuse, corporal punishment, involuntary seclusion, and any physical or chemical restraints imposed for discipline or convenience and not required to treat medical symptoms; restraints only may be imposed to ensure physical safety of resident or other residents and only upon written physician order that specifies duration and circumstances used, except in emergency circumstances specified by Secretary until such order could be reasonably obtained); privacy; confidentiality; reasonable accommodation of individual needs and preferences; grievances; participation in resident and family groups and social, religious, and community activities; to examine survey results, and to refuse transfer to another room if the purpose is to relocate from a part of the facility that is a SNF to a part of the facility that is not a SNF. Provide notice of these rights. Psychopharmacologic drugs may be administered only on physician orders and only as part of care plan designed to eliminate or modify symptoms for which drugs are prescribed and only if at least annually an independent external consultant reviews the appropriateness of the drug plan of each resident receiving such drugs. | 42 U.S.C. § 1395i-3 (c)(1); 42 U.S.C. § 1396r (c)(1); 42 C.F.R. § §483.10, 483.12. |
| Transfer and discharge rights | Cannot transfer or discharge resident unless necessary to meet the resident’s welfare, appropriate because resident’s health has improved, safety or health of other individuals in the facility would endangered, resident has failed to pay for stay, or facility ceases to operate. | 42 U.S.C. § 1395i-3 (c)(2); 42 U.S.C. § 1396r (c)(2); 42 C.F.R. § 483.15. |
| Access and visitation rights | Permit immediate access to any resident by any representative of the Secretary or the state, ombuds or resident’s individual physician; permit immediate access subject to resident’s right to deny or withdraw consent at any time to immediate family or other relatives; permit immediate access subject to reasonable restrictions and resident’s right to deny or withdraw consent at any time to others who are visiting with resident’s consent; permit reasonable access by any entity or individual that provides health, social, legal or other services to resident subject to resident’s right to deny or withdraw consent at any time; and permit state ombuds, with resident’s permission to examine resident’s clinical records. | 42 U.S.C. § 1395i-3 (c)(3); 42 U.S.C. § 1396r (c)(3). |
| Equal access to quality care | Establish and maintain identical policies and practices regarding transfer, discharge and covered services under Medicare and Medicaid for all individuals regardless of source of payment. | 42 U.S.C. § 1395i-3 (c)(4); 42 U.S.C. § 1396r (c)(4) |
| Admissions policy | Not require applicants or residents to waive their rights to Medicare or Medicaid benefits; not require oral or written assurance that such individuals are not eligible for or will not apply for Medicare or Medicaid; prominently display in facility and provide to such individuals written information about how to apply for and use Medicare and Medicaid and how to receive refunds for previous payments covered by such benefits; and not required third party guarantee of payment to facility as condition of admission or expedited admission to or continued stay in facility. | 42 U.S.C. § 1395i-3 (c)(5); 42 U.S.C. § 1396r (c)(5). |
| Protection of resident funds | Not require residents to deposit their personal funds with the facility and upon resident’s written authorization must hold, safeguard and account for such personal funds under a system established and maintained by the facility. Deposit personal funds in excess of $100 ($50 for NFs) in an interest bearing account separate from any of facility’s operating accounts. Any other personal funds must be maintained in a non-interest bearing account or petty cash fund. Maintain written financial records and pursue a surety bond to secure resident personal funds on deposit. | 42 U.S.C. § 1395i-3 (c)(6); 42 U.S.C. § 1396r (c)(6). |
| Requirements relating to administration and other matters | ||
| Administration | Be administered in a manner that enables facility to use its resources efficiently and effectively to attain or maintain each resident’s highest practicable physical, mental and psychosocial well-being and must have reports for any surveys, certifications, and complaint investigations during the preceding 3 years available for review. | 42 U.S.C. § 1395i-3 (d)(1); 42 U.S.C. § 1396r (d)(1); 42 C.F.R. § 483.70. |
| Licensing and life and safety code | Be licensed under state and local law and meet the life safety code requirements of the National Fire Protection Association Life Safety Code or state law. | 42 U.S.C. § 1395i-3 (d)(2); 42 U.S.C. § 1396r (d)(2); 42 C.F.R. § 483.90. |
| Sanitary and infection control program and physical environment | Establish and maintain an infection control program designed to provide a safe, sanitary, and comfortable environment in which residents reside and to help prevent the development and transmission of disease and infection and be designed, constructed, equipped and maintained in manner to protect health and safety of residents, personnel, and general public | 42 U.S.C. § 1395i-3 (d)(3); 42 U.S.C. § 1396r (d)(3); 42 C.F.R. § 483.80. |
| Miscellaneous | Comply with all applicable federal, state and local laws and accepted professional standards. | 42 U.S.C. § 1395i-3 (d)(4); 42 U.S.C. § 1396r (d)(4). |
This brief survey examines how the public views the motivations of doctors, nurses, insurance companies, and drug companies when it comes to making profits vs. working for the public good. It updates a question asked in 2005 to measure how views have changed over time.
The United States remains among the countries most severely impacted by the coronavirus pandemic, with reported COVID-19 cases rising again in many states. While much recent research and media reporting on the pandemic response has focused on the availability of hospital beds and medical equipment, there is also concern that the availability of medical personnel capable of providing intensive care could be a limiting factor in the care of COVID-19 patients. This is a particular challenge as cases and hospitalizations surge in hotspots across the country.
Using recent data from the National Plan and Provider Enumeration System (NPPES) National Provider Identifier (NPI) Registry, this Data Note reports baseline estimates of the number of active critical care physicians and nurses in each state relative to state population.
To date, much of the federal and state-level response to the COVID-19 pandemic in the United States has focused on the availability of hospital resources such as funding, beds, and personal protective equipment.1 However, some experts have signaled that personnel are also in short supply. Alarmingly, the Society for Critical Care Medicine (SCCM) reported that the number of providers trained in intensive care unit (ICU) care and mechanical ventilation could be a limiting factor in the care of COVID-19 patients, and has recommended that the pandemic response should place greater emphasis on increasing the number of available critical care professionals.2
However, quantifying the number of critical care providers in the U.S. has historically been difficult. On the one hand, some professional societies have argued that only “intensivist” physicians who have completed a formal fellowship in critical care medicine should lead critical care teams, and some research suggests that this may improve clinical outcomes in the ICU setting.3 On the other hand, many providers without formal critical care training regularly care for critically ill ICU patients, including substantial numbers of hospitalists, pulmonologists, and anesthesiologists. The issue is further complicated by variability in the proportion of duty hours that individual providers spend in the intensive care setting. Researchers writing in 2015 noted that, “our current supply of full-time intensivists is very low, as the vast majority of adult, board-certified intensivists are really part-time practitioners based in pulmonary medicine, operating rooms (surgeons/anesthesiologists), or emergency medicine”.4
Consequently, prior estimates have reflected these limitations. For example, an early landmark study by the Committee on Manpower for Pulmonary and Critical Care Societies in 2000 found that, of the 10,244 practicing U.S. physicians that classified themselves as critical care providers, nearly half did not hold a formal critical care certification.5 A 2013 study by the Health Resources and Services Administration (HRSA) took duty hour variation into account, reporting only 3,570 full-time equivalent intensivist physicians and 2,880 full-time equivalent critical care nurse practitioners.6 The most recent published estimates are based on data from 2015, though the ongoing COVID-19 pandemic response warrants further updates.7 Using data from the 2020 National Plan and Provider Enumeration System (NPPES) National Provider Identifier (NPI) Registry, this Data Note quantifies the availability of providers capable of providing critical care in each state relative to state-level population.
These estimates highlight several issues relevant to both the baseline critical care workforce in the U.S. and to the response to the coronavirus pandemic. Notably, the number of intensivist physicians is substantially smaller than that of “second-line” providers that sometimes provide critical care, such as hospitalists, pulmonologists, and anesthesiologists, lending credence to longstanding concerns that intensivists are in short supply in the U.S. at baseline. However, it is unclear how many of these second-line providers could be readily redirected into the ICU setting. Many hospitalists likely can be, since most practice in the hospital setting. However, significant numbers of anesthesiologists and pulmonologists may primarily practice in non-hospital settings such as ambulatory surgery centers and outpatient physician offices, and may have little experience providing ICU-level care. Similarly, the number of nurses specifically trained in critical care also appears relatively small compared to prior estimates, suggesting that the source data may lack comprehensive records for some categories of nurses that provide critical care.
Furthermore, recent increases in COVID-19 cases in several states may justify redirection of second-line providers into critical care roles, as well as recruitment of intensivists and critical care nurses from other regions, as the pandemic intensifies. Both approaches may be facilitated by volunteer programs and state government proposals similar to those that supported prior workforce expansions in New York.8
Finally, providers outside of the hospital setting will also play instrumental roles in the pandemic response, both by reducing strain on hospitals and by providing direct COVID-19 care. For example, long-term care and skilled nursing facilities are continuing to be disproportionately impacted, increasing their demand for additional personnel as well.9 Similarly, sufficient numbers of primary care physicians and other ambulatory care providers are vital, not only to help minimize avoidable hospitalizations through monitoring of their patients’ chronic conditions, but also to coordinate essential follow-up care for recovering COVID-19 patients after hospital discharge.
National and state leaders are facing challenging decisions about where to allocate limited resources, including critical care providers. Estimates of the current workforce size and distribution can help inform these decisions, though they must be interpreted in conjunction with local factors such as disease burden, health care infrastructure, workplace safety, and the availability of funding and medical resources. The interactions between these factors are complex and will require continuous re-evaluation in order to best protect both patients and health care personnel during the pandemic.
Eric John Lopez was a member of KFF’s ACA and Medicare Policy teams. He is a medical student at the University of California, San Francisco, and participated in a yearlong UCSF-KFF Health Policy Fellowship.
Methods
State-level counts of active critical care providers were calculated based on May 2020 data from the National Plan and Provider Enumeration System (NPPES) National Provider Identifier (NPI) Registry (https://download.cms.gov/nppes/NPI_Files.html).10
NPPES specialty taxonomy codes used to calculate raw provider counts included: 207LC0200X (Anesthesiology – critical care medicine), 207RC0200X (Internal medicine – critical care medicine), 207VC0200X (Obstetrics & gynecology – critical care medicine), 2084A2900X (Neurocritical care), 2086S0102X (Surgical critical care), 163WC0200X (Registered nurse – critical care medicine), 364SC0200X (Clinical nurse specialist – critical care medicine), 363LC0200X (Nurse practitioner – critical care medicine). Certified Registered Nurse Anesthetists (CRNAs) are included in estimates of critical care nurses, as an American Association of Nurse Anesthetists (AANA) position statement on COVID-19 has stated that CRNAs can safely assume care of ICU patients, subject to the experience and judgment of individual clinicians (https://www.aana.com/docs/default-source/practice-aana-com-web-documents(all)/crnas_asked_to_assume_critical_care_responsibilities_during_ the_covid_19_pandemic .pdf? sfvrsn=ea3630e7_6).
Providers are assigned to their state of practice as reported the most recent version of the dataset. State-level ratios of providers per 10,000 adults were calculated by dividing the number of each critical care provider by the state-level population as reported in the 2019 U.S. Census Bureau projections.11 Providers specializing in pediatric and neonatal critical care are not included. The full list of taxonomy codes and definitions can be found at the Washington Publishing Company website (http://www.wpc-edi.com/reference/codelists/healthcare/health-care-provider-taxonomy-code-set/).
| Table 1: Intensivist Physicians, Critical Care Nurses, and Second-line Critical Care | Physicians per 10,000 Adults | ||
| State | Intensivist (Critical Care) Physicians per 10,000 Adults | Critical Care Nurses and CRNAs per 10,000 Adults | Total 2nd-Line Critical Care Physicians* per 10,000 Adults |
| Alabama | 0.41 | 5.07 | 3.48 |
| Alaska | 0.51 | 2.54 | 4.37 |
| Arizona | 0.56 | 1.46 | 5.23 |
| Arkansas | 0.29 | 3.19 | 3.58 |
| California | 0.63 | 0.89 | 4.43 |
| Colorado | 0.75 | 1.77 | 5.18 |
| Connecticut | 0.98 | 2.66 | 6.08 |
| D.C. | 1.99 | 2.18 | 8.78 |
| Delaware | 0.61 | 4.99 | 4.93 |
| Florida | 0.63 | 3.17 | 4.14 |
| Georgia | 0.56 | 2.45 | 3.99 |
| Hawaii | 0.45 | 1.09 | 4.19 |
| Idaho | 0.27 | 3.54 | 2.50 |
| Illinois | 0.64 | 2.12 | 4.79 |
| Indiana | 0.70 | 1.29 | 4.96 |
| Iowa | 0.64 | 2.45 | 3.97 |
| Kansas | 0.41 | 4.85 | 3.60 |
| Kentucky | 0.57 | 4.23 | 4.50 |
| Louisiana | 0.44 | 4.53 | 3.90 |
| Maine | 0.45 | 3.71 | 5.12 |
| Maryland | 1.13 | 2.01 | 5.22 |
| Massachusetts | 1.01 | 2.15 | 6.19 |
| Michigan | 0.72 | 3.99 | 4.18 |
| Minnesota | 0.54 | 5.53 | 3.80 |
| Mississippi | 0.29 | 3.52 | 3.41 |
| Missouri | 0.80 | 3.73 | 5.39 |
| Montana | 0.50 | 1.42 | 5.07 |
| Nebraska | 0.40 | 4.03 | 4.33 |
| Nevada | 0.67 | 0.90 | 4.41 |
| New Hampshire | 0.91 | 3.15 | 5.38 |
| New Jersey | 0.70 | 1.33 | 4.64 |
| New Mexico | 0.39 | 2.21 | 3.15 |
| New York | 0.85 | 1.34 | 5.60 |
| North Carolina | 0.57 | 4.22 | 3.97 |
| North Dakota | 0.79 | 6.36 | 4.21 |
| Ohio | 0.81 | 3.59 | 4.56 |
| Oklahoma | 0.36 | 2.44 | 4.18 |
| Oregon | 0.70 | 1.52 | 4.89 |
| Pennsylvania | 0.87 | 4.40 | 5.05 |
| Puerto Rico | 0.27 | 0.27 | 2.06 |
| Rhode Island | 0.91 | 2.26 | 3.95 |
| South Carolina | 0.59 | 3.78 | 3.71 |
| South Dakota | 0.42 | 6.62 | 3.57 |
| Tennessee | 0.63 | 5.29 | 4.33 |
| Texas | 0.48 | 2.64 | 4.00 |
| Utah | 0.50 | 1.37 | 4.40 |
| Vermont | 0.49 | 0.98 | 4.75 |
| Virginia | 0.55 | 2.77 | 4.03 |
| Washington | 0.59 | 1.81 | 4.45 |
| West Virginia | 0.52 | 4.87 | 4.00 |
| Wisconsin | 0.58 | 2.27 | 5.16 |
| West Virginia | 0.52 | 4.87 | 4.00 |
| Wyoming | 0.34 | 2.22 | 4.22 |
| US Total | 0.62 | 2.54 | 4.32 |
| *Hospitalists, Pulmonologists, and AnesthesiologistsSOURCE: KFF analysis of the National Plan and Provider Enumeration System (NPPES) National Provider Identifier (NPI) monthly data dissemination file May 2020 (https://download.cms.gov/nppes/NPI_Files.html) and 2019 U.S. Census Bureau projections (https://www.census.gov/data/tables/time-series/demo/popest/2010s-state-detail.html). | |||
With schools nationwide preparing for fall and the federal government encouraging in-person classes, key concerns for school officials, teachers and parents include the risks that coronavirus poses to children and their role in transmission of the disease.
A new KFF brief examines the latest available data and evidence about the issues around COVID-19 and children and what they suggest about the risks posed for reopening classrooms. The review concludes that while children are much less likely than adults to become severely ill, they can transmit the virus. Key findings include:
The analysis concludes that there is a risk of spread associated with reopening schools, particularly in states and communities where there is already widespread community transmission, that should be weighed carefully against the benefits of in-person education.
Policymakers in the United States are struggling to decide whether and how to reopen schools and daycares, at the same time that parents and caregivers are trying to weigh the risks and benefits of different approaches to schooling for their children. Indeed, our latest national poll found that most parents are worried about their child or a family member, as well as teachers and staff, getting sick from coronavirus if schools reopen and think it is better to wait.
With only a few weeks remaining until most U.S. schools are scheduled to begin, the White House for months has emphasized the importance of reopening schools and having students physically present in classrooms, although more recently has supported a more flexible approach for schools and parents. For its part, the Centers for Disease Control and Prevention (CDC) recently released updated guidance, including a review of the data, for school administrators, parents, and caregivers facing decisions around schooling, while also issuing a statement that having children physically present in reopened schools this fall was of utmost importance. CDC states, that, “No studies are conclusive, but the available evidence provides reason to believe that in-person schooling is in the best interest of students, particularly in the context of appropriate mitigation measures similar to those implemented at essential workplaces.”
Still, many large school districts, especially in locations where there is widespread community transmission, have opted for a virtual rather than an in-person start to the school year, citing the risks that the virus poses to students, teachers, staff, and households. Our recent analysis found, for example, that 1.5 million teachers are at high risk of severe disease if infected with coronavirus, due to underlying health conditions and age. In addition, we found that millions of seniors live in households with school-aged children.
Struggles surrounding decisions around schooling and childcare reflect some of the most perplexing aspects of the COVID-19 pandemic so far: understanding the risks the virus poses to children and their role in transmission of the disease. While researchers have been actively investigating these topics since the emergence of the pandemic, our understanding is, in many cases, still incomplete. Here, drawing on published literature and expert opinion, we summarize what is known about children and coronavirus, and what the information gaps remain.
Box 1: Data on COVID-19 in Children in the United States
Children, under the age of 18, to date, account for:
The number of reported cases of Multisystem Inflammatory Syndrome in Children (MIS-C) is 342, including 6 deaths, among states reporting data (source: CDC)
*Based only on data for which age group information was available.
Disease severity is significantly less in children, though a small subset become quite sick: We know children of all ages can indeed be infected with coronavirus but the evidence at this point is quite clear that overall, children who become infected experience a milder disease course than adults. As one expert review panel stated, we are “essentially certain” the risk of death and of severe illness from COVID-19 in children is extremely low. Another expert panel organized by the National Academies of Medicine reported that “compared with adults, children who contract COVID-19 are more likely to experience asymptomatic infection or mild upper respiratory symptoms”, and that over 90 percent of children testing positive will have no or mild symptoms. While the infection has been known to cause an inflammatory condition (MIS-C) in some children, and these cases are serious (342 have been reported to date), so far such cases are very rare and most children who do experience the condition eventually recover.
One reflection of the generally milder disease course in children is that the reported number of COVID-19 deaths among children under the age 18 in the U.S. is less than 1% of reported COVID-19 deaths, even though children make up 22% of the U.S. population [see Box 1].
Evidence is mixed about whether children are less likely to become infected when exposed. Regarding risk of infection there is some evidence that, compared to adults, children are less likely to become infected when exposed to the virus. One prominent study estimated susceptibility to infection for those under 20 years of age to be about half that of those over 20 years, and several large-scale seroprevalence studies have found lower prevalence of infection in children, especially younger children, compared to adults. Still, the evidence is somewhat mixed on this point, with other studies showing children, especially older children (>10 years) having been infected at rates similar to adults in some places. A recent (pre-publication) review of the evidence concludes there is “significantly lower” susceptibility to infection for children under 10 compared to adults, but the same conclusion cannot be drawn for children 10 and older.
A number of biological explanations have been posited for this difference between children and adults in severity and infection risk, including less expression of a key receptor in the upper airways of children, and some level of pre-existing immune cross-reactivity to SARS-Cov-2 in many children due to recent exposure to related viruses (such as common cold viruses). Still, investigations continue and more evidence is needed to fully understand if lower infection rate in children is a real phenomenon and what explains it.
Children do transmit to others but more evidence is needed on the frequency and extent of that transmission. We do not yet know for sure how common transmission from children is compared to transmission from adults. We know that children are capable of transmission to others, but the frequency and extent of this transmission remains under investigation, and this is a question where only weak, and sometimes contradictory evidence, is available.
For example, multiple studies indicate that children have viral loads and shed virus in similar amounts to adults, which might indicate risk of transmission is similar across age groups. Without a doubt transmission from child-to-child and child-to-adult can occur, but a number of studies find children, particularly young children, are less likely to be source of infection in households and other settings, compared to adults. A number of these studies conclude that a majority of documented transmissions between children and adults have occurred from adults to children, rather than the other way around, but more detailed information is needed to fully understand this dynamic. There is new evidence, including from a recent comprehensive study from South Korea, suggesting there is an age gradient in terms of transmission risk from children, meaning younger children (<10 years old) are less likely to transmit compared to adults, while older children (10 and older) may transmit at levels similar to adults.
Evidence is so far lacking partly because doing studies and collecting the necessary information has been challenging for a number of reasons, including:
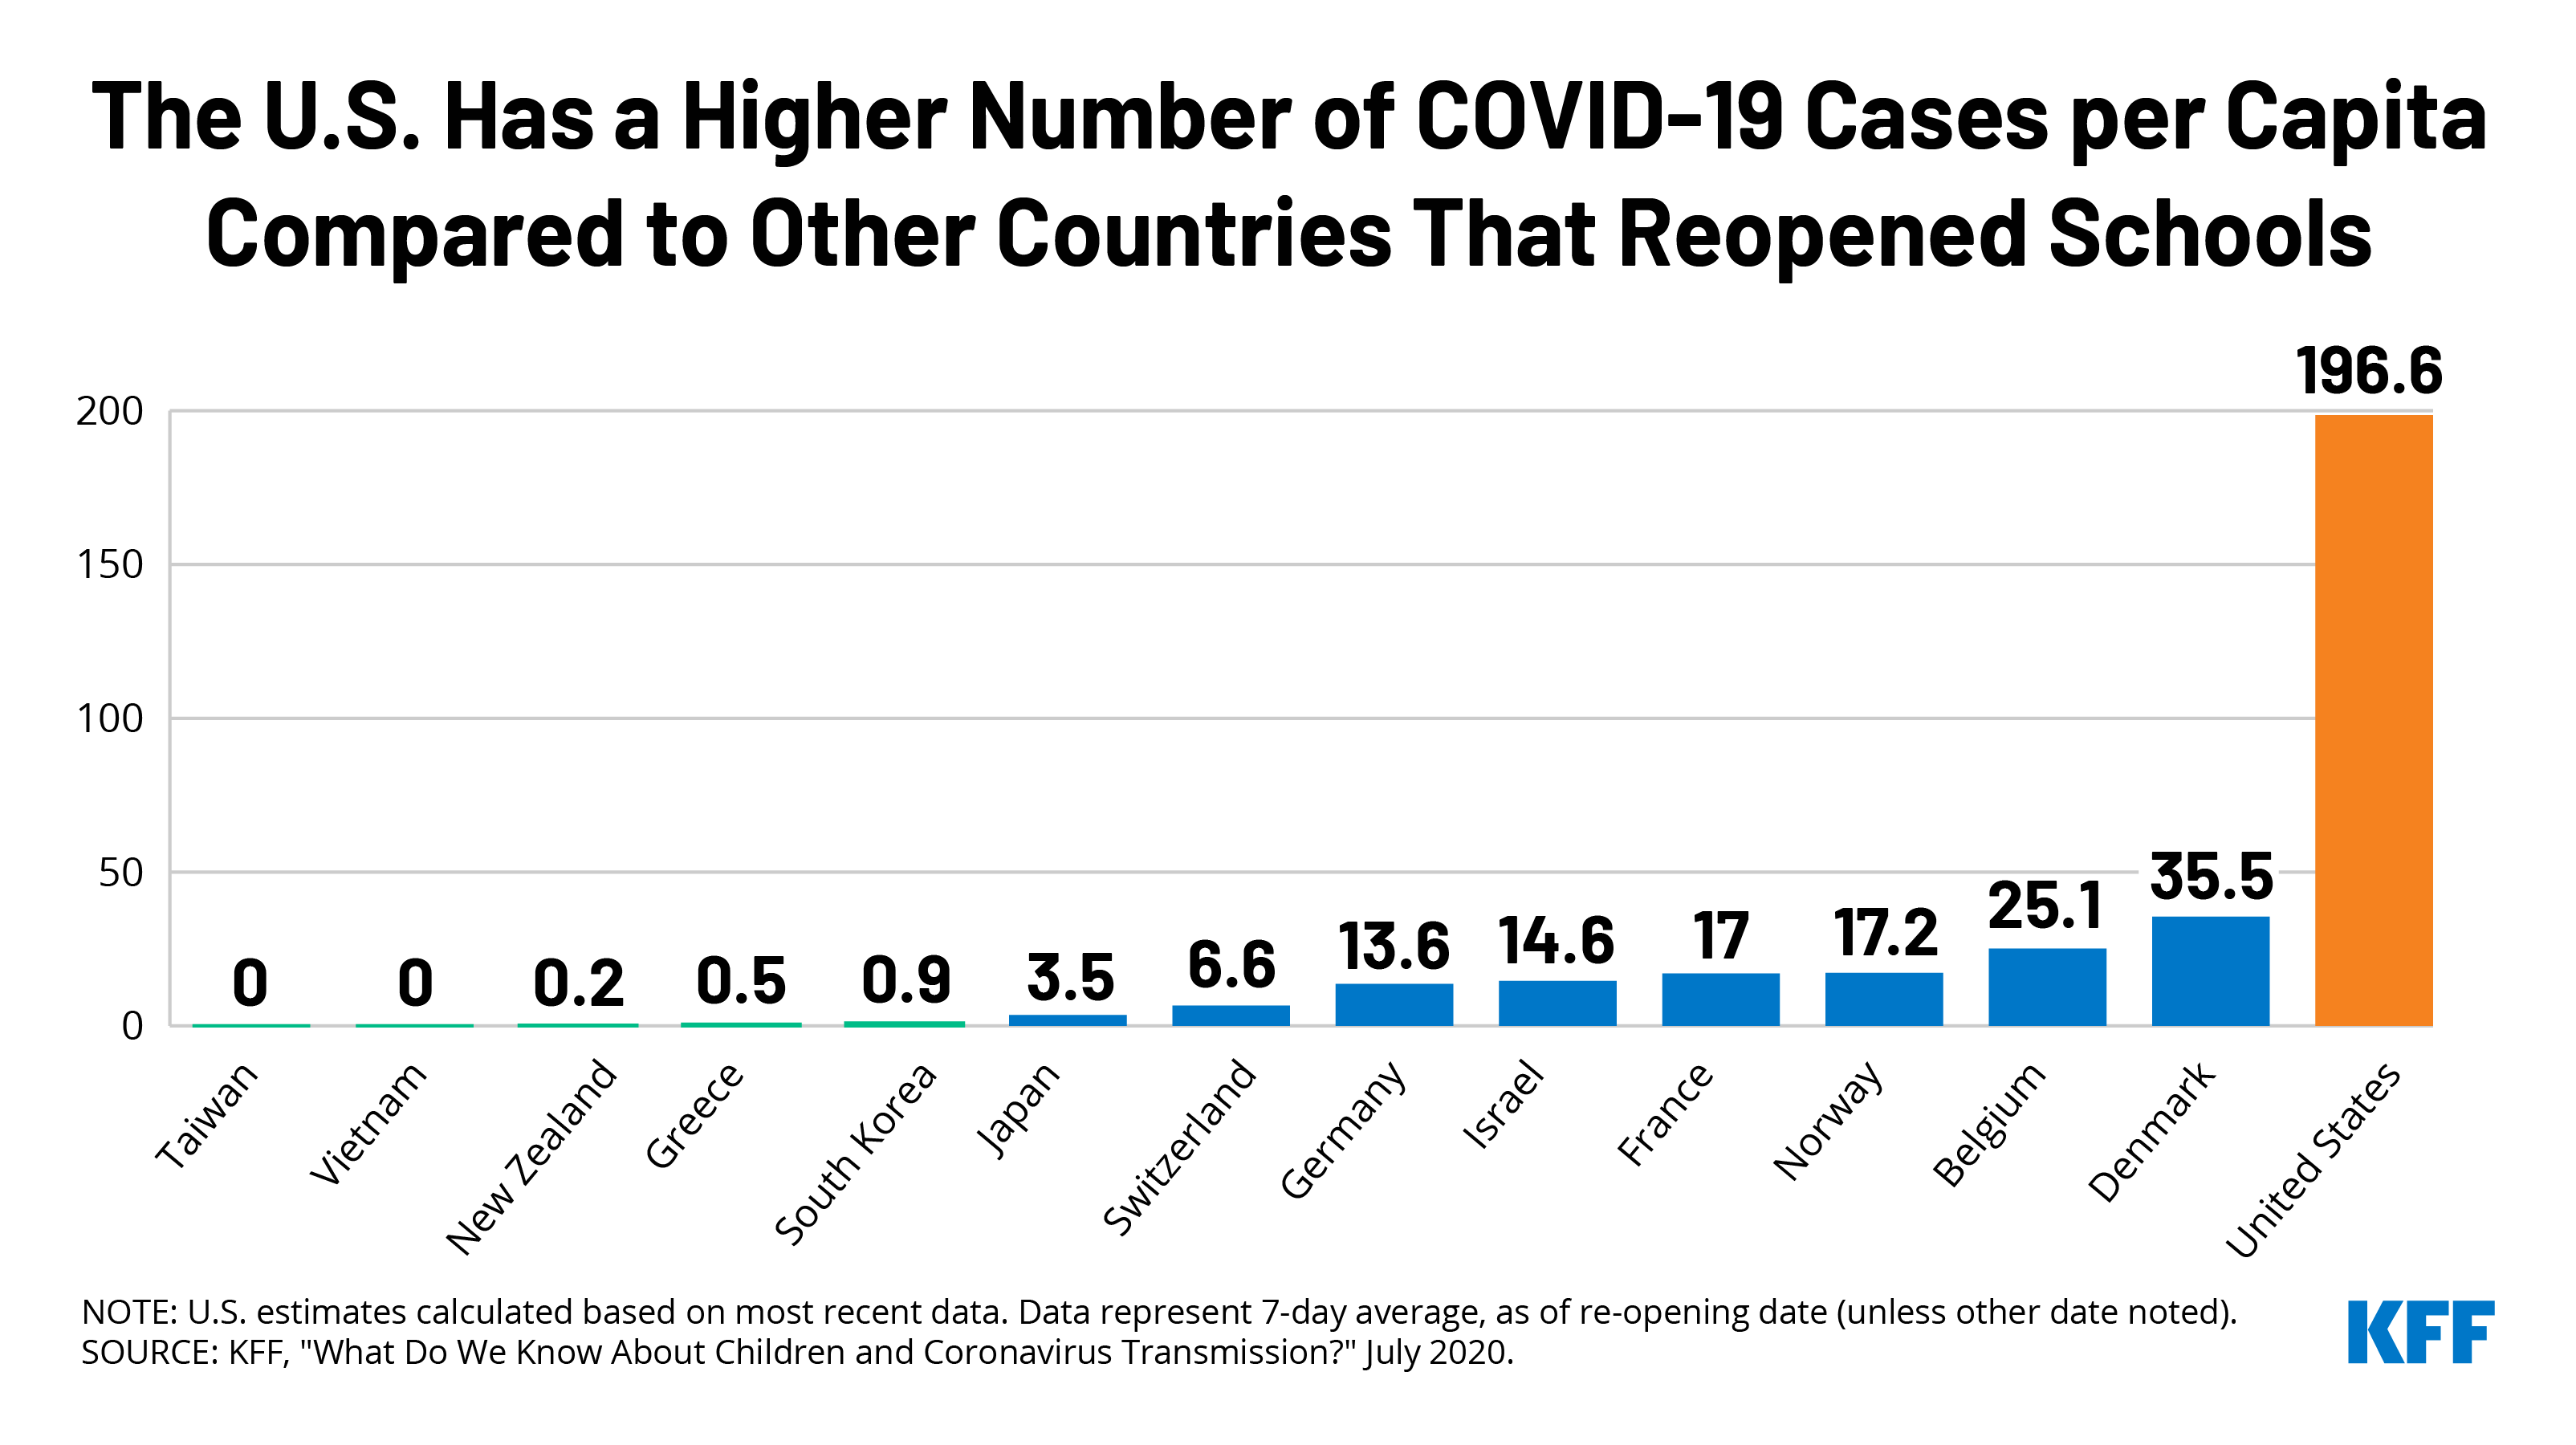
Most countries that have reopened schools have not experienced outbreaks but almost all have had significantly lower rates of community transmission than the U.S. and higher testing and contact tracing capacity. In many countries around the world, schools and daycares have reopened following a period of lockdown. So far, most have not seen cases surge after re-opening. For the most part, the lack of a surge in cases and the ability to control any outbreaks in most countries that have re-opened schools is in large part explained by their significantly lower levels of community transmission at the time schools re-opened compared to much of the U.S. now, as well as their greater testing and contact tracing capacity.
In Table 1, we compare U.S. COVID-19 data to 13 other countries that have reopened schools. We looked specifically at the 7-day average of cases, cases per million, and test positivity rate as of the date each country reopened schools compared to the U.S. as of the most recent date. As shown, all countries that have reopened had significant lower case counts and cases per million than the U.S. currently has and all but one (Japan) had lower positivity rates. For example, when South Korea opened schools on June 8, the country had a 7-day average of just 44 cases nationwide (or 0.9 per million population), after more than two months of limited transmission; it also already had widespread testing (a test positivity rate of 0.3%) and contact tracing in place, meaning it was well positioned to respond quickly to any school outbreaks. By contrast, the U.S. is currently averaging at more than 65,000 cases a day (or 195 per million population) and its test positivity rate is 8%. Many other countries, such as Finland, Iceland, New Zealand, and Vietnam, similarly had low case numbers, cases per million, and positivity rates when they opened schools and have avoided large school-based outbreaks so far.
| Table 1: School Re-Openings: Country Comparisons on Key Metrics Compared to Current U.S. Data | ||||
| Date of reopening | Daily Cases | Daily Cases Per Million Population | Positivity Rate (%) | |
| (7-day averages) | ||||
| United States | — | 65,750.4 | 198.6 | 8.3 |
| Belgium | 5/18/2020 | 291.3 | 25.1 | 2.1 |
| Denmark | 4/15/2020 | 205.7 | 35.5 | 6.2 |
| France | 5/11/2020 | 1,110.9 | 17.0 | 1.1 |
| Germany | 5/4/2020 | 1,140.3 | 13.6 | 2.4 |
| Greece | 6/1/2020 | 5.6 | 0.5 | 0.1 |
| Israel | 5/3/2020 | 126.7 | 14.6 | 1.4 |
| Japan | 4/24/2020 | 439 | 3.5 | 8.7 |
| South Korea | 6/8/2020 | 44.4 | 0.9 | 0.3 |
| New Zealand | 5/14/2020 | 1.1 | 0.2 | 0 |
| Norway | 4/20/2020 | 93.3 | 17.2 | 3.8 |
| Switzerland | 5/11/2020 | 57.1 | 6.6 | 1.3 |
| Taiwan | 2/25/2020 | 1.1 | 0.0 | 0.2 |
| Vietnam | 5/18/2020 | 4.6 | 0.0 | 0 |
| NOTES: U.S. estimates calculated based on most recent data. France positivity rate from May 24. Vietnam positivity rate from April 29. Data represent 7-day average, as of re-opening date (unless other date noted).SOURCES: COVID-19 data from: “Coronavirus Pandemic (COVID-19)”. Published online at OurWorldInData.org. Retrieved on July 28, 2020. School reopening dates from: University of Washington, Summary of School Re-Opening Models and Implementation Approaches During the COVID 19 Pandemic, July 6, 2020, | ||||
At the same time, school associated outbreaks have occurred in some countries. Not all countries have avoided school-associated outbreaks. For example, schools in Canada, Chile, France, and Israel have reported outbreaks, sometimes significant ones, necessitating re-closure of schools in some cases. Israel, in particular, has had several outbreaks at schools after reopening, including an outbreak in a high school where 13.2% of students tested positive for coronavirus as did 16.6% of staff and school-based cases have been linked to increasing community transmission. The country reopened when it had significant fewer cases, cases per million, and positivity rate than the U.S. does today (see Table 1); it reopened its entire school system with few social distancing or other mitigation measures. In Sweden, a country which never closed its schools for children under 16, health authorities have reported that teachers are no more at risk in schools than adults in other professions and community transmission was not affected by schools being open. There have been school outbreaks and deaths among school teachers in Sweden, but insufficient testing and contact tracing at Swedish schools make it difficult to draw definitive lessons from the Swedish school experience.
Like schools, daycare-associated outbreaks also have been reported, including in the U.S., such as in California and Texas.
Taken together, the evidence indicates that while children are much less likely than adults to become severely ill from COVID-19, they do transmit virus. It is still unclear to what extent children, especially younger ones, are likely to get infected or transmit the infection to others compared to adults. However, where there is already widespread community transmission, as is the case in many areas in the U.S., there is clearly a risk of spread associated with reopening schools. This challenge may be more pronounced where testing and contact tracing capacity is limited. As such, the risk of re-opening schools needs to be considered carefully in light of the recognized benefits of in-person education.
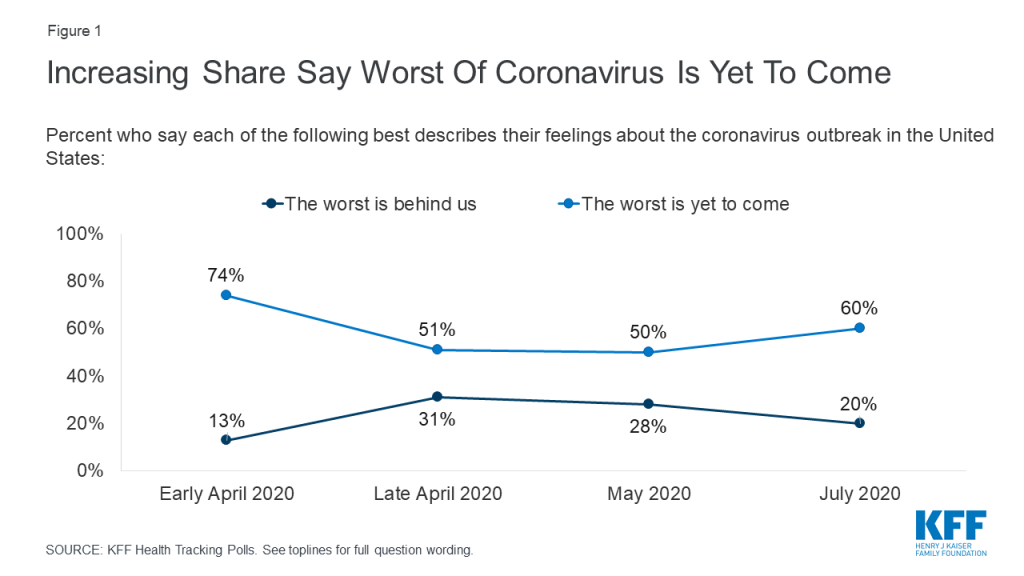
With a mounting death toll and coronavirus cases surging throughout much of the U.S., a majority of the public (60%) think that the worst is yet to come, up from 50% in May, though not as high as the 74% of adults in early April who thought things were likely to get worse. One in five adults (20%) currently think that the worst of the coronavirus outbreak is behind us. The overall numbers mask a deep partisan divide, with a slight majority of Republicans saying either “the worst is behind us” (31%) or that they don’t think the coronavirus is or will be a major problem (23%), while about eight in ten Democrats (79%) and a majority of independents (57%) say “the worst is yet to come.”
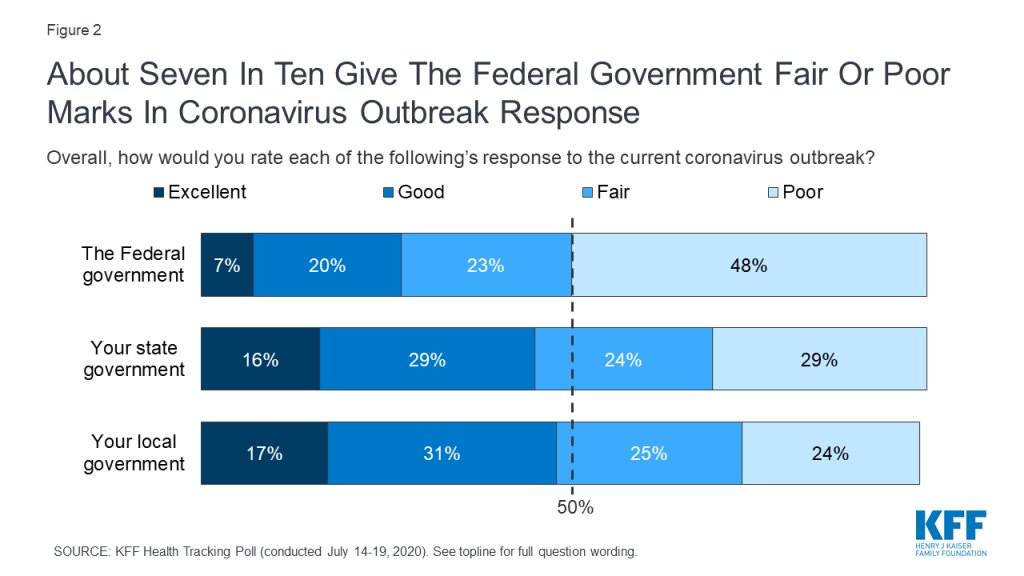
Amid what many see as a botched federal response to the virus, about half of U.S. adults (48%) rate the federal government response to the pandemic as “poor” while another 23% call it “fair.” Just 28% rate the federal response as “good” or “excellent.” Even among Republicans, who are generally supportive of President Trump and his Administration, 42% rate the federal government response to the pandemic as “fair” or “poor.” The public is more divided when it comes to assessing state and local governments, with about half of adults giving their state (46%) and local (48%) governments positive marks.
| Table 1: Views of federal, state, and local response to coronavirus by party identification | |||
| How would you rate…to the current coronavirus outbreak? | Party identification | ||
| Democrats | Independents | Republicans | |
| …the federal government’s response… | |||
| Excellent/good | 8% | 26% | 57% |
| Fair/poor | 91 | 73 | 42 |
| …your state government’s response… | |||
| Excellent/good | 55 | 42 | 44 |
| Fair/poor | 44 | 57 | 56 |
| …your local government’s response… | |||
| Excellent/good | 57 | 45 | 50 |
| Fair/poor | 42 | 54 | 47 |
As Congress discusses its next coronavirus relief package, there are reports that the Trump Administration is resisting allocating additional federal funds for coronavirus testing, contact tracing, and other prevention measures. This is at clear odds with the public’s priorities; when asked about a number of potential actions Congress could take, the highest-ranked priority among the public is increasing federal funding for efforts to limit the spread of coronavirus, such as testing, contact tracing, and personal protective equipment for essential workers. Seven in ten adults overall (72%) say this should be a top priority for Congress, including majorities of Democrats, independents, and Republicans. Schools are another popular priority: a majority (55%) say increasing federal funding to state and local governments to help schools reopen safely should be a top priority, including about two-thirds of Democrats (68%) and about half of independents (53%) and Republicans (48%).
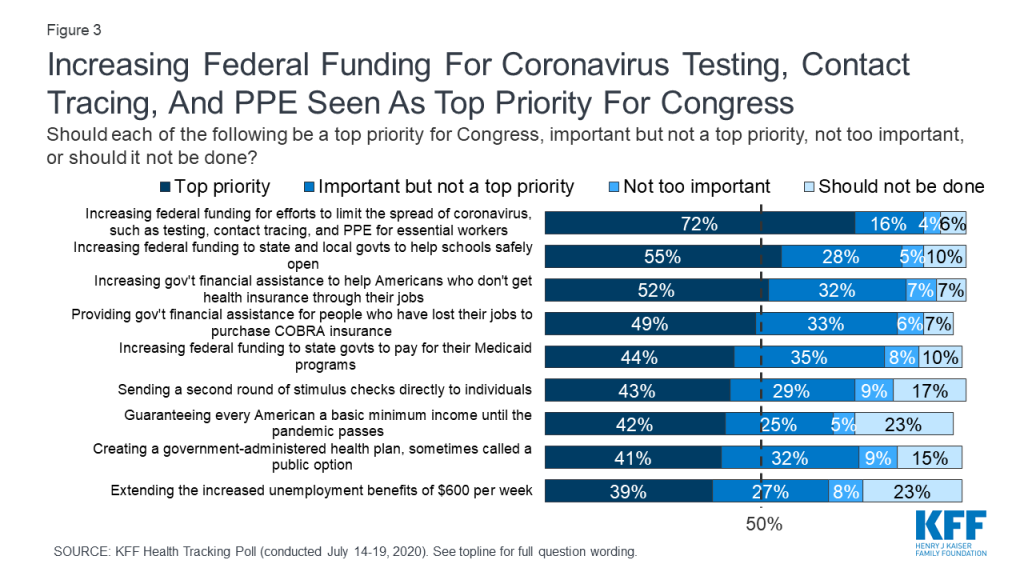
Other measures to provide economic relief or extend insurance benefits are seen as important by large shares of the public overall, but have less broad appeal across partisans. For example, about half the public overall say increasing government financial assistance to help Americans who do not get health insurance from their jobs pay for coverage (52%) and providing financial assistance for people who have lost their jobs to purchase COBRA insurance through their former employers (49%) should be top priorities. However, there are large partisan gaps, with Democrats 42 percentage points more likely than Republicans to say Congress should place a top priority on increasing government financial assistance for individual health insurance, and 26 percentage points more likely to say Congress should place a top priority on providing assistance for people to purchase COBRA coverage.
About four in ten overall say other actions should be top priorities for Congress, including increasing funding to states to help pay for Medicaid (44%), sending a second round of stimulus checks to individuals (43%), guaranteeing every American a basic income until the pandemic passes (42%), creating a public option health insurance plan (41%), and extending the additional unemployment benefits set to expire at the end of July (39%). Views on each of these measures are marked by large partisan differences, with about six in ten Democrats saying each should be a top priority, compared with about a quarter of Republicans.
| Table 2: Views of potential Congressional actions on coronavirus by party identification | |||
| Percent saying each of the following should be a “top priority” for Congress: | Party identification | ||
| Democrats | Independents | Republicans | |
| Increasing federal funding for efforts to limit the spread of coronavirus | 90% | 65% | 57% |
| Increasing federal funding to state and local governments to help schools safely open | 68 | 53 | 48 |
| Increasing government financial assistance to help more Americans who don’t get health insurance through their jobs purchase coverage | 73 | 49 | 31 |
| Providing government financial assistance for people who have lost their jobs to purchase COBRA health insurance | 63 | 47 | 37 |
| Increasing federal funding to state governments to help pay for their Medicaid programs | 63 | 43 | 25 |
| Sending a second round of stimulus checks directly to individuals | 58 | 40 | 27 |
| Guaranteeing every American a basic minimum income until the pandemic passes | 56 | 42 | 27 |
| Creating a public option health plan | 57 | 39 | 26 |
| Extending the increased unemployment benefits of $600 per week which are set to expire on July 31st | 59 | 36 | 25 |
With coronavirus cases surging in many states that took an early approach to reopening, a plurality (45%) of adults overall say their state is moving at about the right pace in easing social distancing restrictions and opening businesses, while three in ten (31%) say their state is moving “too quickly” and about one in five (22%) say their state is opening “too slowly.” Views on reopening vary by both partisanship and location. Democrats are about three times as likely as Republicans to feel their state is moving too quickly, while Republicans are about three times as likely as Democrats to feel their state is moving too slowly. Notably, about four in ten adults (39%) in states that are current coronavirus hotspots (based on case data as of July 18) say their state is moving too quickly to reopen, compared to about one in four (24%) in non-hotspot states.2
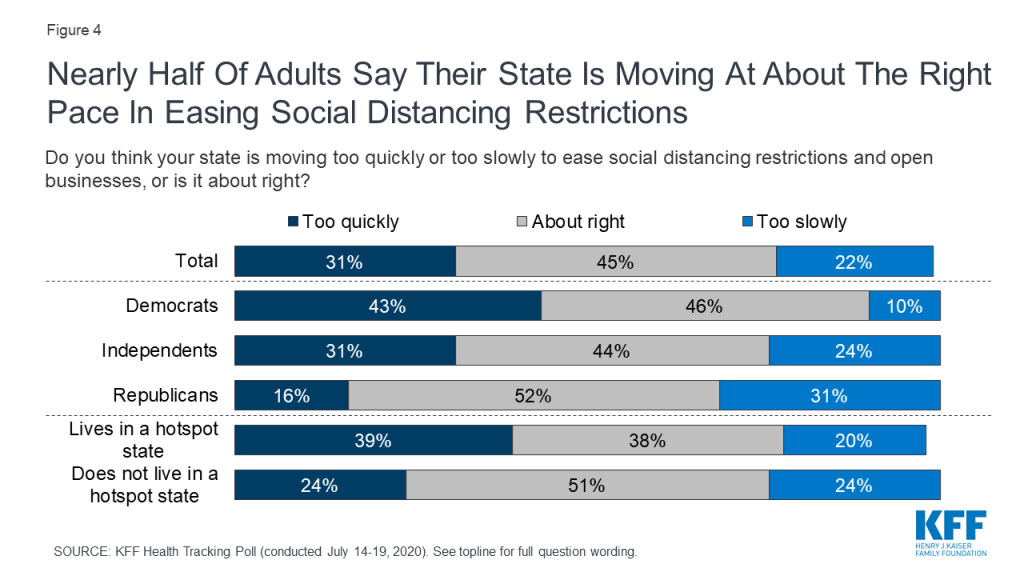
With the new school year quickly approaching, the issue of whether and how to reopen schools for in-person instruction has been at the forefront of discussions for both parents and policymakers. President Trump has stated that he wants schools to reopen for in-person instruction in the fall, and has even suggested that the federal government may withhold money from schools that don’t reopen. When asked to weigh the risks vs. benefits, a majority of the public (63%) thinks it is better to open schools later to ensure the risk of getting coronavirus is as low as possible, even if it means some students will fall behind academically or miss out on services and some parents will be unable to return to work. About a third (32%) think it is better to open schools sooner so that parents can work and students won’t miss out on learning and other services, even if there is some risk to teachers, students and staff. There is a large partisan gap on this issue among the public overall, with 87% of Democrats and 59% of independents preferring schools open later while six in ten Republicans (60%) prefer that schools open sooner.
Among parents with a child age 5-17 that normally attends school, six in ten (60%) think it is better to reopen schools later in order to ensure the risk of coronavirus is as low as possible, while about half as many (34%) think it is better to reopen sooner. Parents of color (76%) are even more likely to prefer a later reopening compared to their White counterparts (51%).
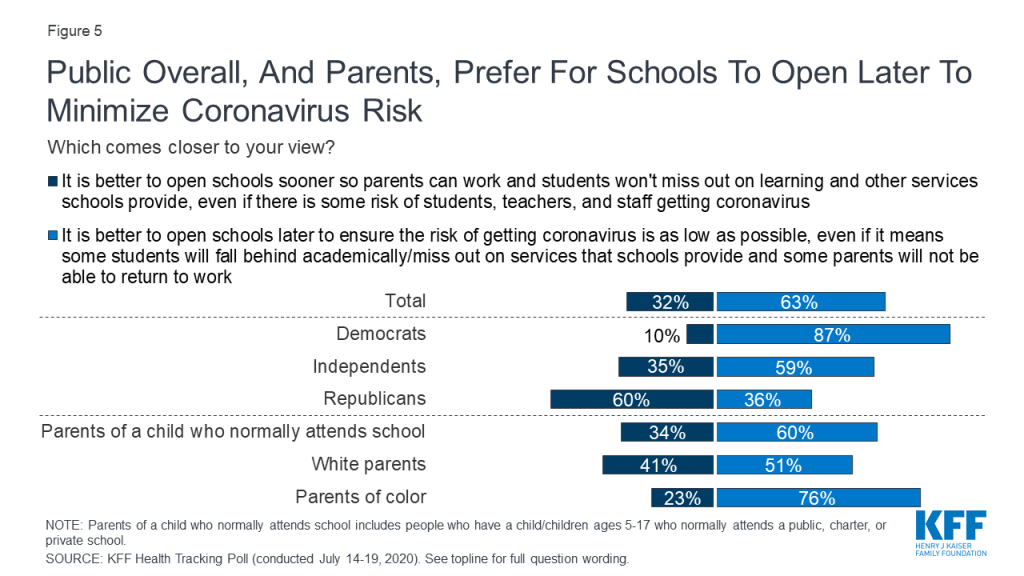
The public’s caution towards reopening schools may be reinforced by a sense that schools do not have the necessary resources to safely reopen in a manner that complies with public health recommendations on how to minimize the risk of spreading coronavirus. Seven in ten adults overall say that public schools in their area need more resources in order to safely reopen, while just 22% say schools have enough resources. This sentiment is echoed by parents of school-aged children when they are asked about their own child’s school. Two-thirds of parents (66%) say their child’s school needs more resources in order to safely reopen. Notably, parents of color are more likely than their White counterparts to say their child’s school lacks the resources necessary to safely reopen (82% vs. 54%).
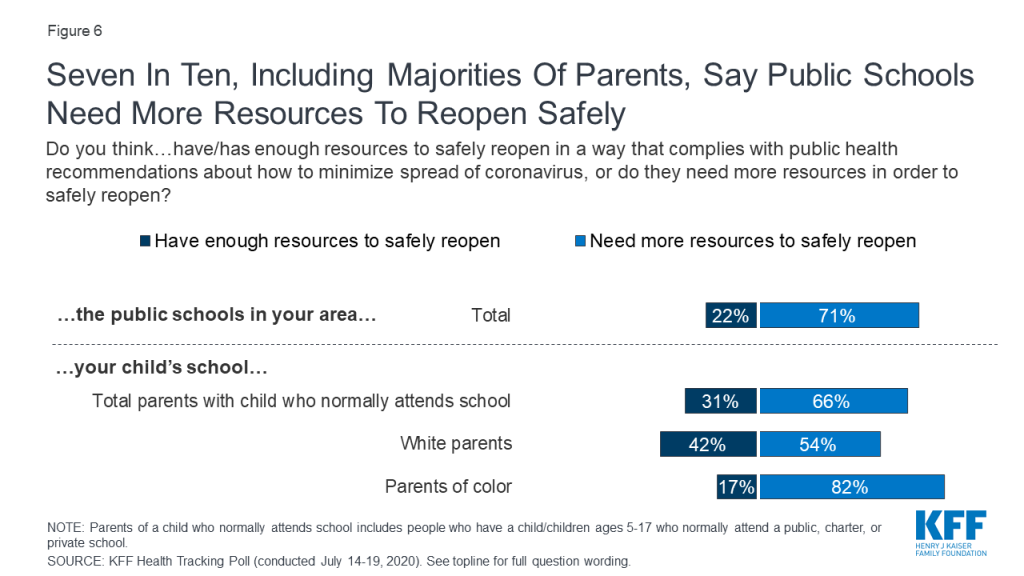
With many schools’ academic year commencing in August and early September, about half of parents with children who typically attend school (52%) said their child’s school had not yet announced whether they would be having in-person classes this fall at the time they took the survey. This month’s poll asked parents about worries related to both a school reopening scenario and one in which schools remain closed to in-person instruction. When it comes to reopening, large shares of parents with a child enrolled in school are worried about teachers and staff getting sick from coronavirus (79% very or somewhat worried) and children being unable or unwilling to comply with physical distancing practices (73% very or somewhat worried). About seven in ten are also worried about their child (70%) or themselves or a family member (69%) getting sick from coronavirus, while two-thirds (66%) worry about their child’s school being unable to comply with public health recommendations.
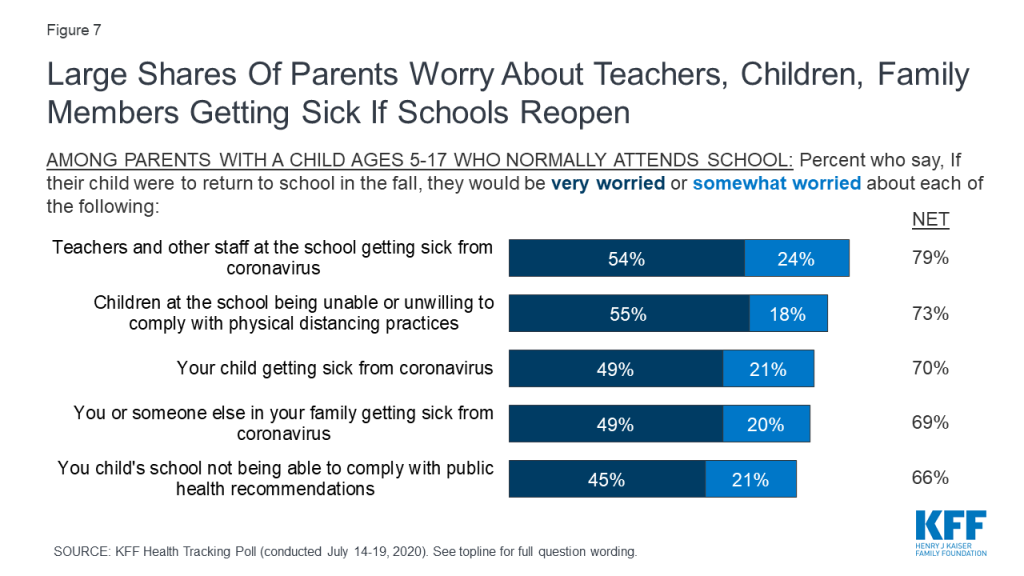
Reflecting the disproportionate impact of the coronavirus pandemic on those with lower incomes and on communities of color, there are some notable differences in worry levels between parents of color and White parents, and between those with lower and those with higher household incomes. Nine in ten parents of color (91%) say they are either “very worried” or “somewhat worried” about their child getting sick with coronavirus if they return to school in the fall, compared to 55% of White parents who say the same. Similarly, about nine in ten of parents of color say they are worried about teachers and other staff getting sick with coronavirus (92%), children being unable or unwilling to physically distance (91%), and that they or a family member will get sick with coronavirus (90%). Far fewer White parents say they are worried about each of these concerns.
In addition, parents who have a household income under $90,000 are more likely than their higher-income counterparts to say they are worried about children being unable or unwilling to physically distance (82% vs. 62%) or teachers and staff getting sick from the coronavirus (84% vs. 73%).
| Table 3: Worries about school reopening among parents by race/ethnicity and household income | |||||
| Percent who say they are “very worried” or “somewhat worried” about each of the following if their child DOES return to school in-person: | All parents with a child who normally attends school | Race/ethnicity | Household Income | ||
| Parents of color | White Parents | Parents with HH income under $90,000 | Parents with HH income $90,000+ | ||
| Teachers and other staff at school getting sick from coronavirus | 79% | 92% | 69% | 84% | 73% |
| Children at the school being unable or unwilling to comply with physical distancing practices | 73 | 91 | 60 | 82 | 62 |
| Their child getting sick with coronavirus | 70 | 91 | 55 | 75 | 65 |
| They or someone else in their family getting sick from coronavirus | 69 | 90 | 53 | 72 | 66 |
| Their child’s school being unable to comply with public health recommendations | 66 | 88 | 49 | 68 | 66 |
Parents also express a number of worries related to schools remaining closed for in-person instruction in the fall. If schools don’t reopen, about two-thirds of parents say they would worry about their children falling behind socially and emotionally (67%) and academically (65%), and about half say they would worry about losing income if they can’t go to work (51%) or not being able to pay enough attention to their kids if they’re working at home (47%). Other services schools provide are also a concern for some parents: 40% worry about their child not getting needed social services if schools remain closed, 31% worry they won’t have access to technology needed for online learning, and 24% worry about their children having enough food to eat at home.
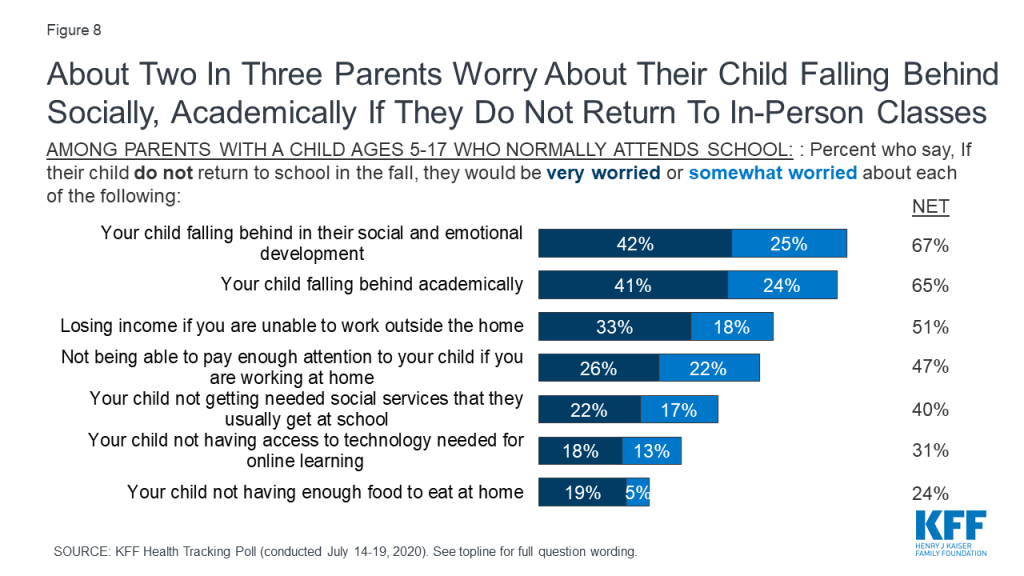
Similar to the findings on parental worries about their child returning to school in-person in the fall, parents of color and those with lower household incomes are also more likely than their counterparts to say they worry about possible outcomes if their children do not return to in-person classes.
Parents of color are more likely than White parents to say they are “very worried” or “somewhat worried” about their child not getting social services they usually get at school (52% vs. 32%), are almost three times as likely to worry their child won’t have access to the technology needed for online learning (49% vs. 17%), and about five times as likely to worry their child will not have enough to eat at home (44% vs. 9%). Parents of color are also more likely than White parents to worry about losing income if they are unable to work outside the home (65% vs. 41%).
Similarly, parents with household incomes under $90,000 more likely than their higher income counterparts to be worried that their child will not have access to social services they usually get at school (47% vs. 26%), will not have enough to eat at home (34% vs. 6%), or won’t have access to the technology needed for online learning (43% vs. 10%). Moreover, lower-income parents are more likely than those with higher incomes to worry about losing income if they are unable to work outside the home (61% vs. 35%).
| Table 4: Worries about schools remaining closed among parents by race/ethnicity and household income | |||||
| Percent saying they are “very worried” or “somewhat worried” about each of the following if their child DOES NOT return to school in-person: | All parents with a child who normally attends school | Race/ethnicity | Household Income | ||
| Parents of color | WhiteParents | Parents with HH income under $90,000 | Parents with HH income $90,000+ | ||
| Their child falling behind on their emotional and social development | 67% | 76% | 62% | 68% | 65% |
| Their child falling behind academically | 65 | 73 | 60 | 66 | 63 |
| Losing income if they are unable to work outside the home | 51 | 65 | 41 | 61 | 35 |
| Not being able to pay enough attention to their child if they are working from home | 47 | 56 | 41 | 49 | 48 |
| Their child not getting needed social services they usually get at school | 40 | 52 | 32 | 47 | 26 |
| Their child not having enough to eat at home | 24 | 44 | 9 | 34 | 6 |
| Their child not having access to the technology needed for online learning | 31 | 49 | 17 | 43 | 10 |
As life with the coronavirus pandemic wears on, Americans increasingly say it is taking a negative toll on their mental health. For the first time since KFF began tracking this question in March, a majority of adults (53%) now say that stress and worry related to the pandemic has had a negative impact on their mental health. This is up 14 percentage points since May, and up 8 percentage points since the previous high of 45% in early April. About one in four (26%) say worry and stress related to coronavirus has had a “major impact” on their mental health, while a similar share (28%) say it has had a “minor impact.”
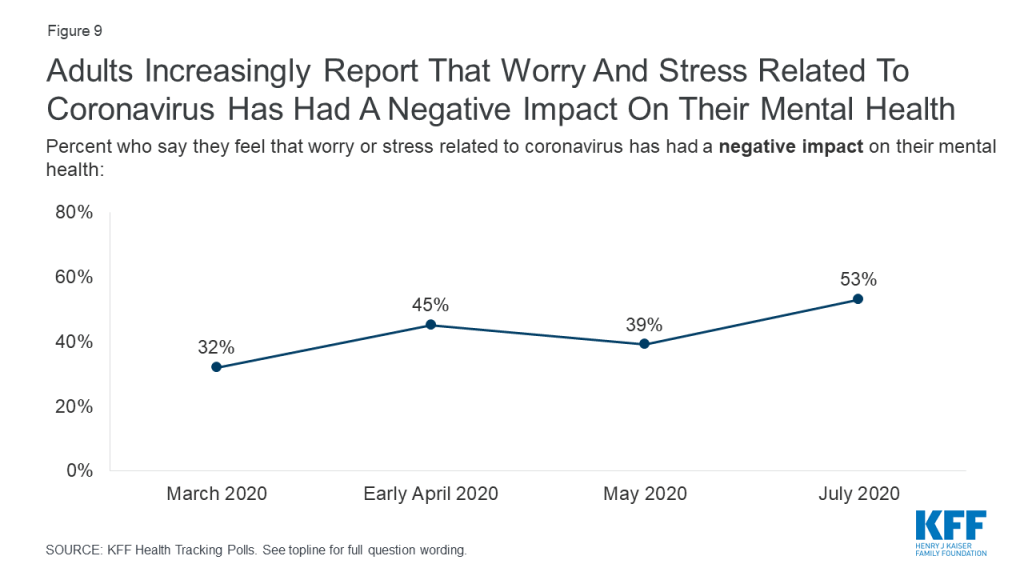
Notably, younger adults are more likely older adults, and women are more likely than men, to say stress and worry related to coronavirus has had a negative impact on their mental health. About seven in ten Blacks adults (68%) and those who have had difficulty paying household bills in the past three months due to the financial impact of the coronavirus outbreak (71%) say that stress and worry related to the pandemic has had a negative impact on their mental health.
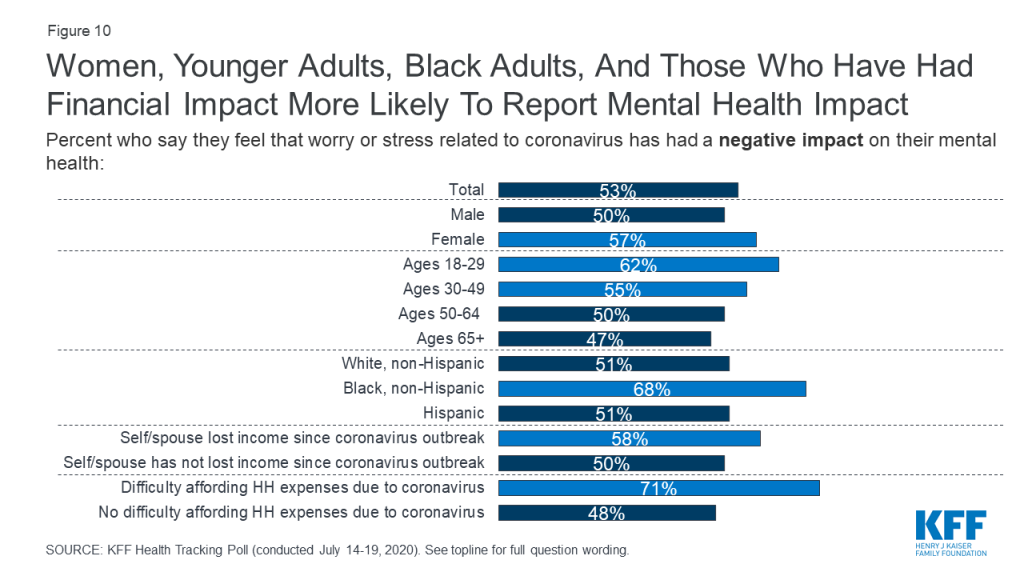
In addition to reporting a general negative impact on their mental health, about half (52%) of adults report that worry and stress related to the coronavirus outbreak has had adverse effects on their mental health and wellbeing in specific ways. About a third say coronavirus-related worry or stress has led to problems with their sleep (36%) or has led to a poor appetite or overeating (32%). About one in five say worry or stress related to the pandemic has caused them to experience frequent headaches or stomachaches (18%) or difficulty controlling their temper (18%), while 12% each say it has led to increased alcohol or drug use or worsening chronic health conditions.
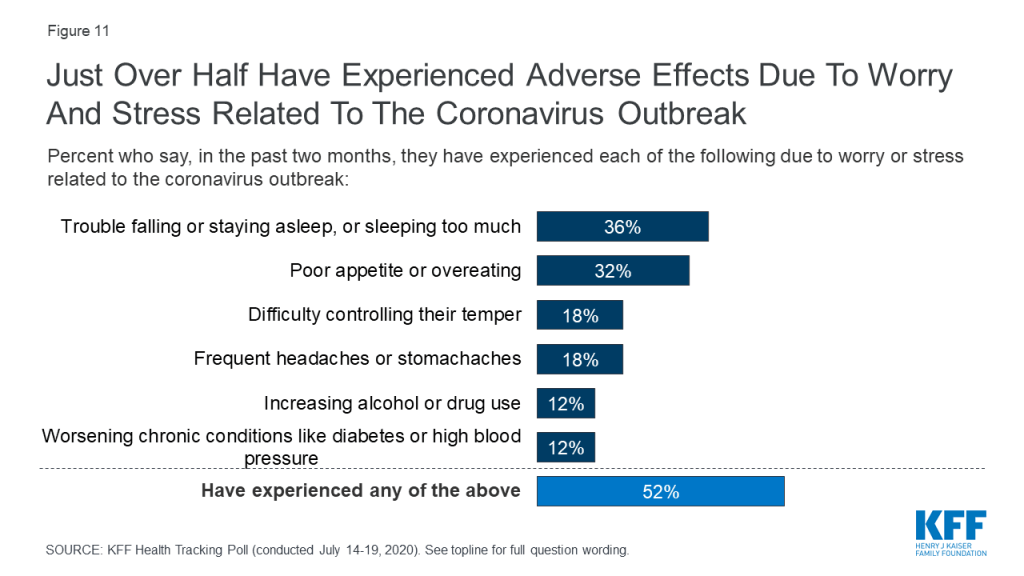
Mirroring the findings on overall negative impact on mental health, younger adults and women are more likely than their counterparts to say coronavirus-related stress has caused adverse effects on their mental health or wellbeing. Notably, three in four adults who have had difficulty paying household bills in the past three months due to the financial impact of coronavirus say they have also experienced adverse effects their mental health and wellbeing, as do about six in ten Hispanic adults and Black adults.

With the country facing a double-digit unemployment rate, four in ten adults say they or an adult in their household has had problems paying bills or difficulty affording medical care or basic expenses in the past three months. This includes about one in five who say they have fallen behind on their credit card bills (22%), 18% who have had trouble affording health insurance, and similar shares who say they have had trouble paying medical bills (17%), paying for food (17%), paying utility bills (17%) or have fallen behind on their rent or mortgage (17%). Additionally, 12% say they have had problems affording their prescription medications. Notably, among the 40% of adults who have experienced difficulty paying household or medical bills in the last three months, most (54%, or 22% of all adults) say it was due to the coronavirus outbreak and its impact on their financial situation, while 42% (17% of all adults) say this something they were already experiencing before the pandemic.
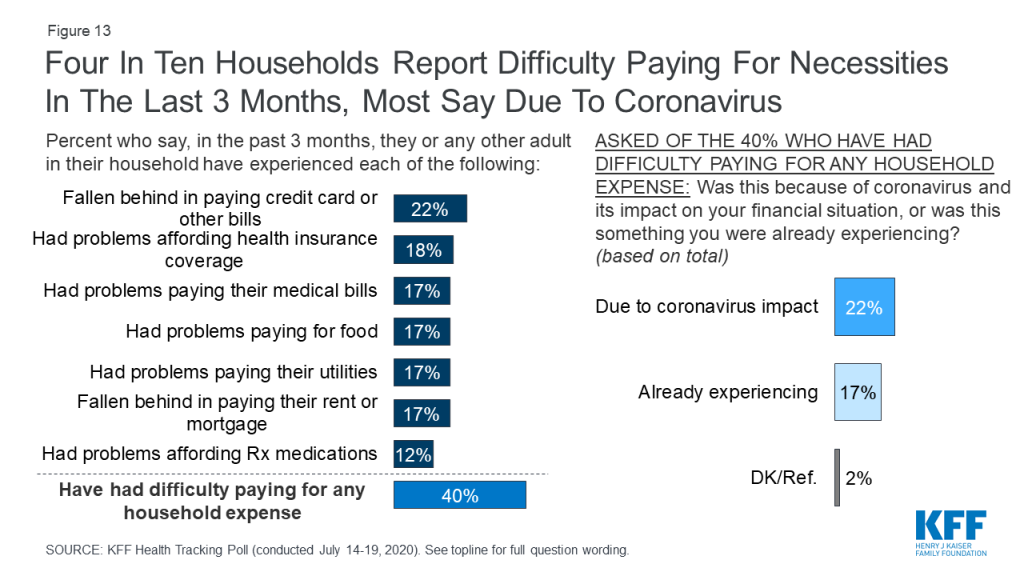
Four months out from 2020 election, voters give President Trump negative ratings on his overall job approval as well as his handling of key issues that will likely decide the election President Trump also now garners his lowest net approval on the handling of the coronavirus outbreak in the U.S. since KFF began polling on the topic. One-third (35%) of voters approve of his handling of the coronavirus outbreak in the U.S. while six in ten (61%) voters disapprove (net approval of -26 percentage points). President Trump also receives negative ratings on his handling of health care more broadly (net approval of -21 percentage points) as well as his handling of the Affordable Care Act (net approval of -21 percentage points). While President Trump had previously received positive marks on his handling of the economy, voters are now split with 47% approving of his handling of the nation’s economy, and 50% disapproving (resulting in a negative net approval—approval minus disapproval—of -3 percentage points). Overall, four in ten voters (41%) approve of how President Trump is handling his job as president while a majority disapprove (56%).
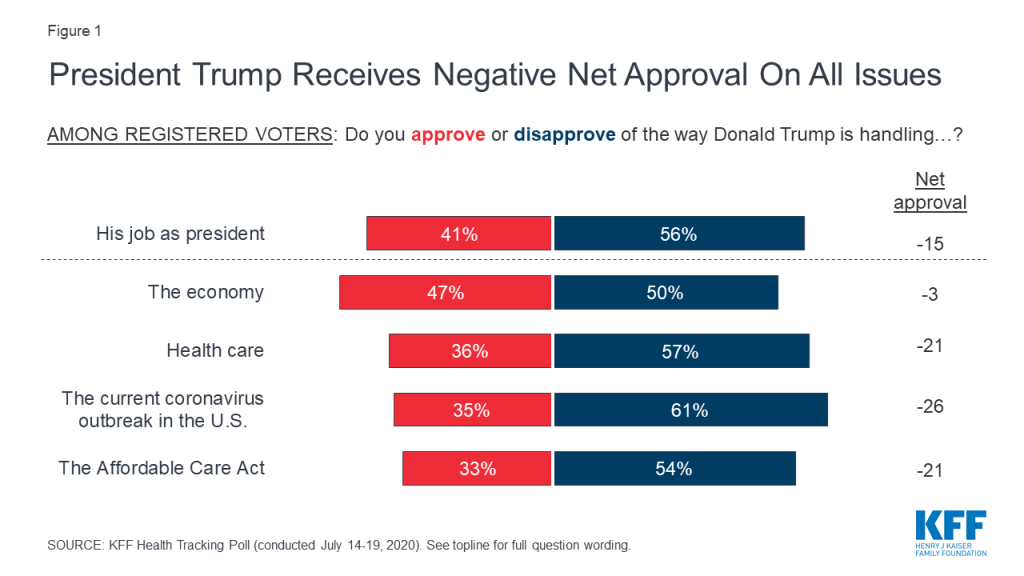
Voters’ attitudes on President Trump’s handling of both the economy and the coronavirus outbreak have dropped sharply since May 2020. The latest KFF Health Tracking Poll finds President Trump’s overall net approval on these two key issues has dropped nearly 20 percentage points over the course of the summer (economy: 19 percentage point drop in net approval; coronavirus: 18 percentage point drop in net approval).
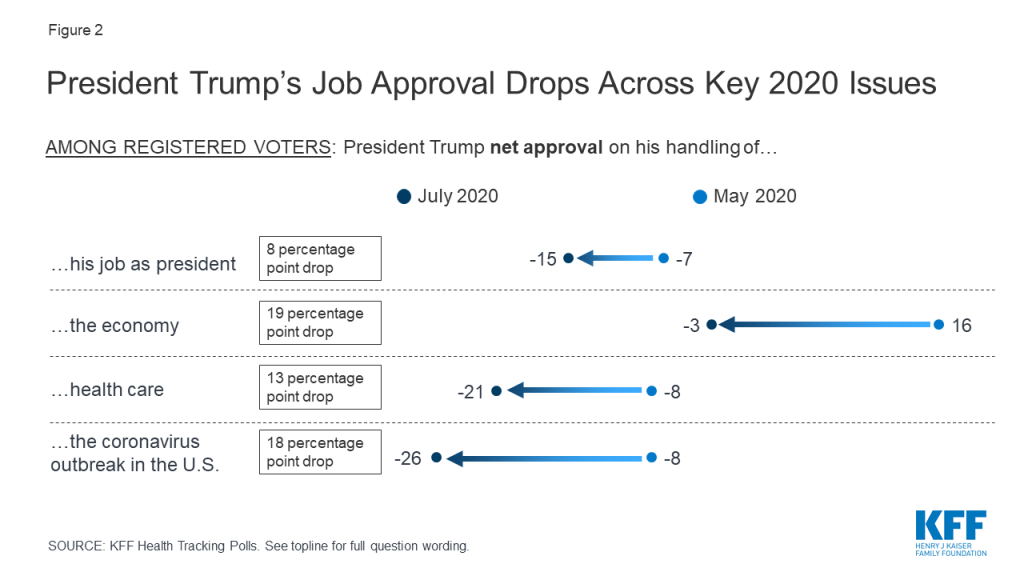
Voters’ opinions of President Trump’s handling of the issues probed in the poll are largely partisan, with Republicans giving him much higher marks across all of the issues asked about. Majorities of Republican voters approve of President Trump’s handling of his job as president (84%), the economy (87%), health care (78%) and the coronavirus outbreak in the U.S. (74%), yet his net approval on each of these issues is down by double digits among Republicans since May.
| Table 1: Across Issues, Trump Net Approval Has Dropped From May to July 2020 Among Partisans | |||||||
| Do you approve or disapprove of the way President Trump is handling… | Democratic voters | Independent voters | Republican voters | ||||
| May 2020 | July 2020 | May 2020 | July 2020 | May 2020 | July 2020 | ||
| …his job as president | Approve | 9% | 5% | 45% | 43% | 90% | 84% |
| Disapprove | 90 | 93 | 54 | 55 | 9 | 15 | |
| Net Approval | -81 | -88 | -9 | -12 | 81 | 69 | |
| Difference in net Approval | 7 percentage point drop | 3 percentage point drop | 12 percentage point drop | ||||
| …the economy | Approve | 23 | 14 | 57 | 47 | 93 | 87 |
| Disapprove | 74 | 84 | 41 | 49 | 6 | 10 | |
| Net Approval | -51 | -70 | 16 | -2 | 87 | 77 | |
| Difference in net Approval | 19 percentage point drop | 18 percentage point drop | 10 percentage point drop | ||||
| …health care | Approve | 9 | 7 | 41 | 33 | 88 | 78 |
| Disapprove | 89 | 89 | 53 | 58 | 9 | 16 | |
| Net Approval | -80 | -82 | -12 | -25 | 79 | 62 | |
| Difference in net Approval | 2 percentage point drop | 13 percentage point drop | 17 percentage point drop | ||||
| …the coronavirus outbreak in the U.S. | Approve | 12 | 5 | 44 | 36 | 88 | 74 |
| Disapprove | 88 | 92 | 54 | 61 | 11 | 23 | |
| Net Approval | -76 | -87 | -10 | -25 | 77 | 51 | |
| Difference in net Approval | 11 percentage point drop | 15 percentage point drop | 26 percentage point drop | ||||
Swing voters, a crucial group of voters who have not yet decided which candidate they will vote for in November, are also negative in their assessments of President Trump’s presidency and his handling of most national issues – but remain positive in their assessment of his handling of the economy. Swing voters (who comprise 29% of all voters) largely disapprove (57%) of the way President Trump is handling his job overall and are also negative in Trump’s handling of both the coronavirus outbreak (66% disapprove) and health care (58% disapprove).
Defining Swing Voters
When asked about their intentions for the upcoming election, voters say they are either “definitely going to vote for President Trump” (30%), or “definitely going to vote for Joe Biden” (36%), while about three in ten voters either say they are undecided in their 2020 vote choice (8%), don’t know yet who they will vote for (2%), or are probably going to vote for President Trump (8%) or Democratic nominee Joe Biden (11%) but have not made up their minds yet.
Swing voters are more positive in views of how President Trump is handling the economy, but at a smaller margin than their assessments in May, with a net approval of +5 percentage points compared to +19 percentage point net approval in May. Swing voters’ assessments of Trump’s handling of health care and the coronavirus outbreak have also become more negative, with the assessments of the president’s handling of health care down 8 net percentage points, and the current coronavirus outbreak down 14 net percentage points.
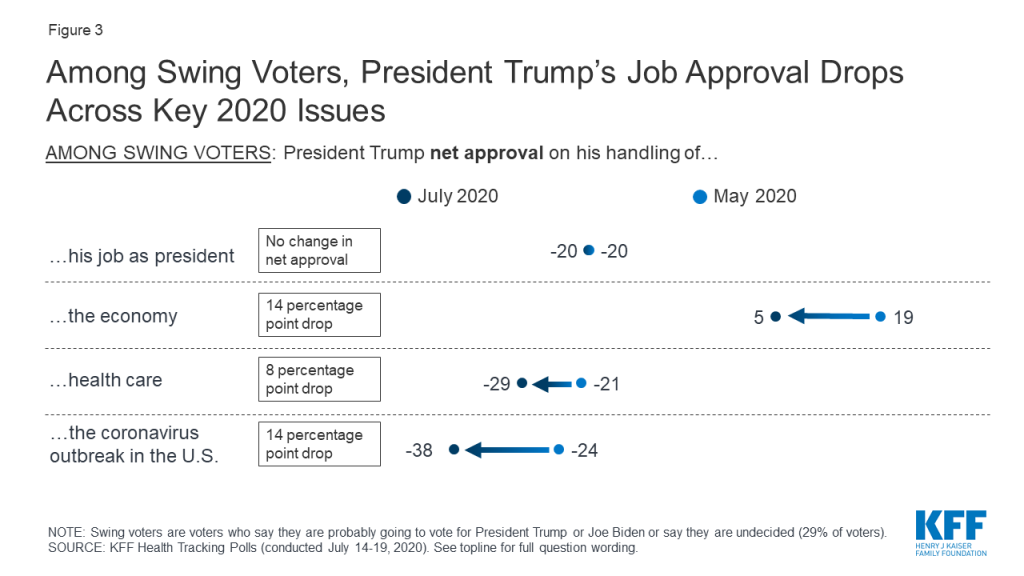
Another important group of voters to watch in 2020 are voters living in states where the election outcome is less predictable. The attitudes of these Electoral College battleground voters will be important in the upcoming election, as their states and districts are likely to swing the Electoral College towards President Trump or Joe Biden.3 This group of voters, representing 38% of all voters, are evenly split in their party preferences, with three in ten saying they are Democrats, Republicans and Independents (31%, 30% and 31% respectively).
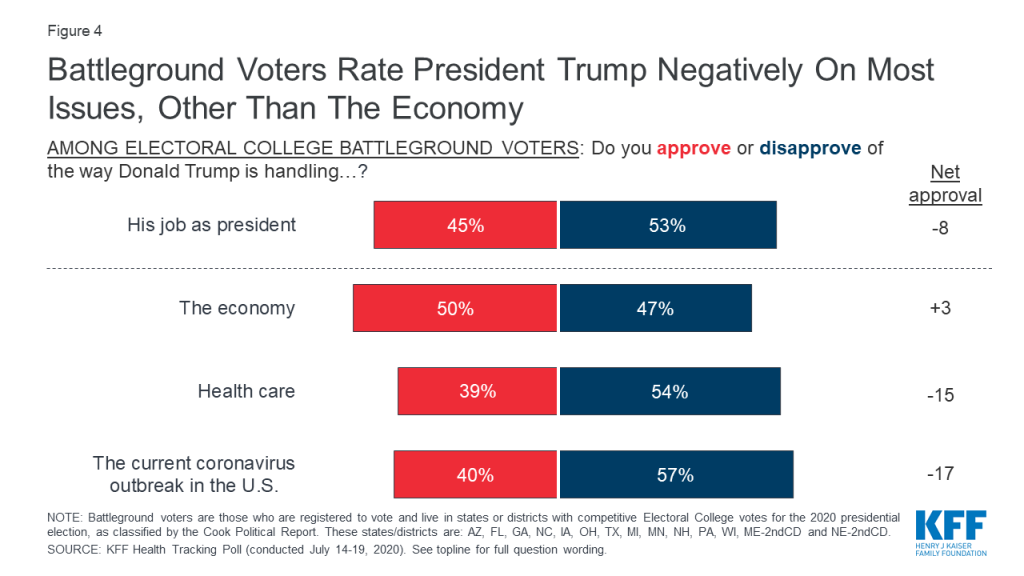
President Trump fares slightly better with these battleground voters on all key issues. Half of these voters approve of President Trump’s handling of the economy and 45% say they approve of his handling of his job as president. But similar to the views of all voters and swing voters, President Trump fares slightly worse on his handling of health care and the coronavirus outbreak in the U.S.. Partisan voters in these battleground states and districts fall largely along the same party lines in their evaluations of President Trump, as partisan voters overall.
The public’s attitudes towards the 2010 Affordable Care Act (ACA) have remained relatively unchanged over the past 5 months, with half (51%) now saying they hold a favorable opinion of the law, while 36% hold an unfavorable view.
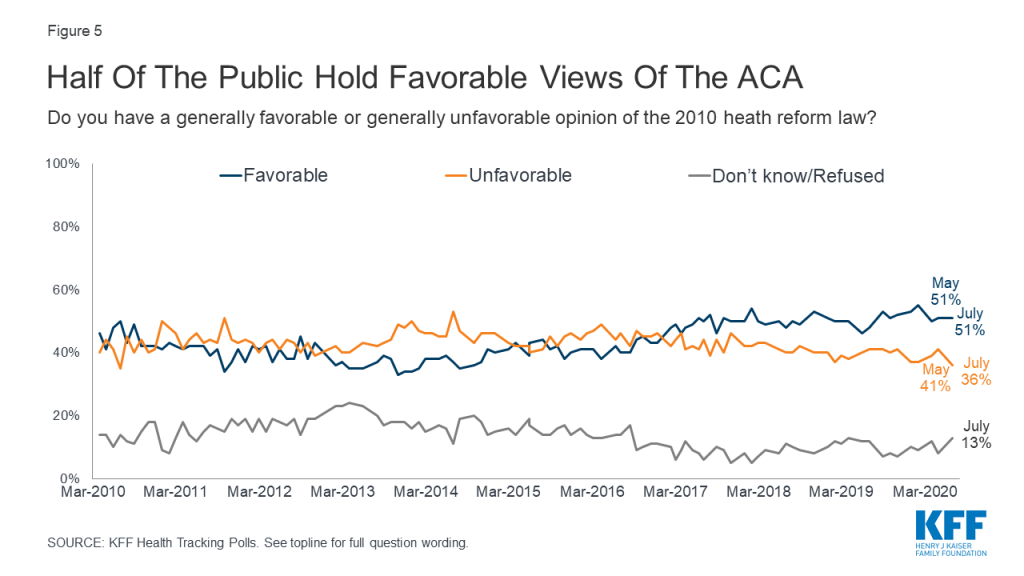
Partisans continue to hold different views of the ACA, with about eight in ten Democrats (79%) holding favorable views while seven in ten Republicans (72%) view the law unfavorably. Half of independents hold favorable views (51%) while a smaller share (35%) say they view the law unfavorably.
On June 25th, 2020, the Trump administration issued a brief asking the U.S. Supreme Court to overturn the entire Affordable Care Act. The brief was filed in support of an ongoing challenge to the ACA by a group of Republican attorneys general in California v. Texas, a case that challenges the legality of the ACA in light of the zeroing out of the individual mandate penalty in the 2017 Tax Cuts and Job Acts. While there is a possibility that the case may be heard in the days leading up to the 2020 election, no opinion is expected to be issued until 2021.
Republicans largely approve (77%) of the Trump administration’s actions, while the vast majority of Democrats (91%) as well as more than half of independents (55%) disapprove of the Trump administration asking the Supreme Court to overturn the ACA.
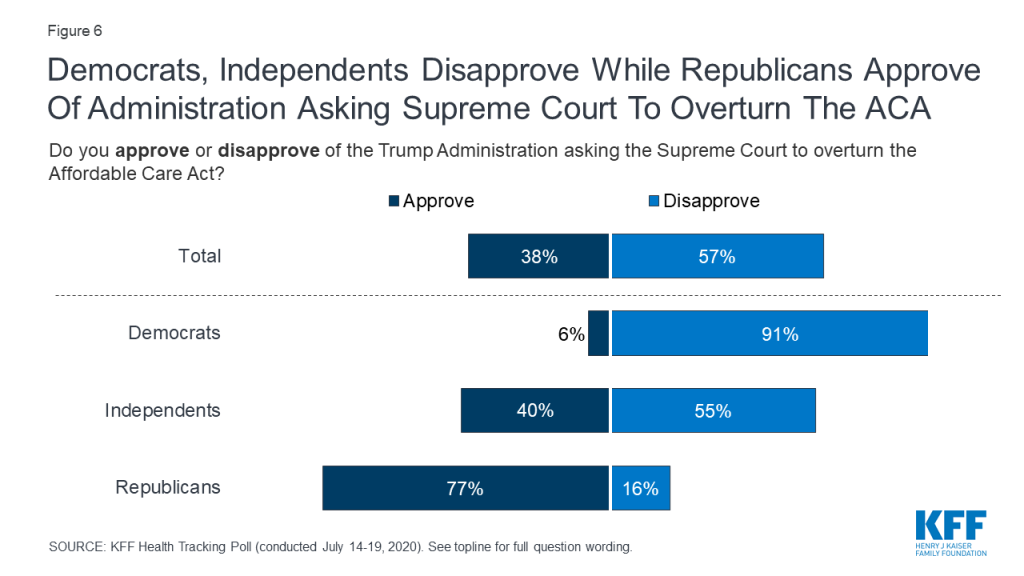
If the Supreme Court sides with the Trump administration and the coalition of Republican attorneys general, all or parts of the 2010 Affordable Care Act would no longer be the law of the land. About half (53%) of the public do not want to see the ACA overturned by the Supreme Court while four in ten (38%) say they want to see the law overturned. Once again, attitudes are largely partisan with eight in ten Democrats (82%) and half of independents (51%) not wanting the law overturned, while seven in ten Republicans say the Supreme Court should overturn the 2010 health care law. Previous KFF polling has found that majorities across partisans want many of the ACA’s protections to remain in place.
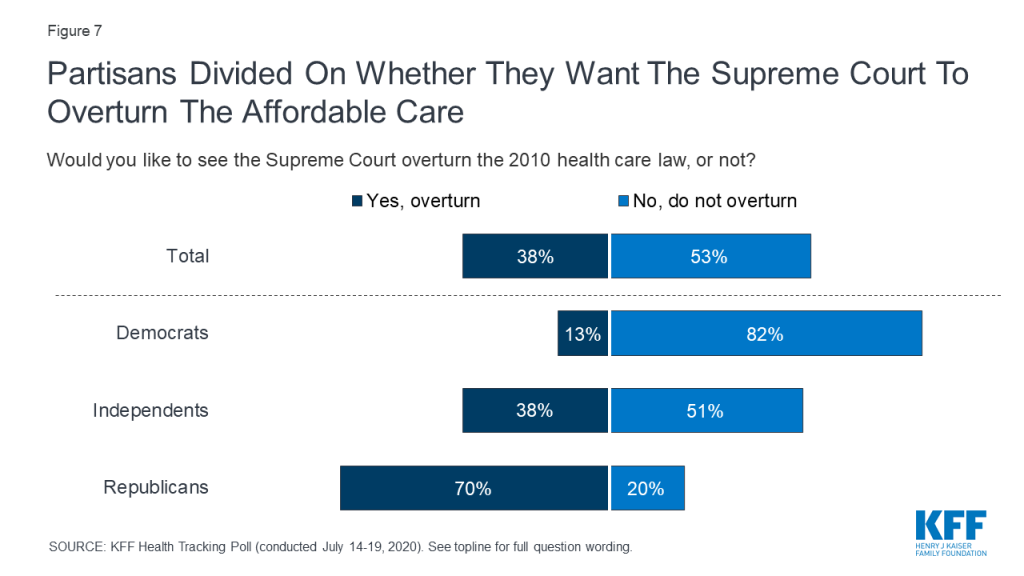
This KFF Health Tracking Poll was designed and analyzed by public opinion researchers at the Kaiser Family Foundation (KFF). The survey was conducted July 14-19, 2020, among a nationally representative random digit dial telephone sample of 1,313 adults ages 18 and older, living in the United States, including Alaska and Hawaii (note: persons without a telephone could not be included in the random selection process). The sample included 292 respondents reached by calling back respondents that had previously completed an interview on the KFF Tracking poll at least nine months ago. Computer-assisted telephone interviews conducted by landline (323) and cell phone (990, including 714 who had no landline telephone) were carried out in English and Spanish by SSRS of Glen Mills, PA. To efficiently obtain a sample of lower-income and non-White respondents, the sample also included an oversample of prepaid (pay-as-you-go) telephone numbers (25% of the cell phone sample consisted of prepaid numbers) as well as a subsample of respondents who are parents of children ages 5 to 17 who had previously completed interviews on the SSRS Omnibus and Sports polls (n=101). Both the random digit dial landline and cell phone samples were provided by Marketing Systems Group (MSG). For the landline sample, respondents were selected by asking for the youngest adult male or female currently at home based on a random rotation. If no one of that gender was available, interviewers asked to speak with the youngest adult of the opposite gender. For the cell phone sample, interviews were conducted with the adult who answered the phone. KFF paid for all costs associated with the survey.
The combined landline and cell phone sample was weighted to balance the sample demographics to match estimates for the national population using data from the Census Bureau’s 2018 American Community Survey (ACS) on sex, age, education, race, Hispanic origin, and region along with data from the 2010 Census on population density. The sample was also weighted to match current patterns of telephone use using data from the January-June 2019 National Health Interview Survey. The weight takes into account the fact that respondents with both a landline and cell phone have a higher probability of selection in the combined sample and also adjusts for the household size for the landline sample, and design modifications, namely, the oversampling of prepaid cell phones and likelihood of non-response for the re-contacted sample. All statistical tests of significance account for the effect of weighting. The sample of parents with school-age children was weighted by: gender, age, educational attainment, race/ethnicity, and Census region.
The margin of sampling error including the design effect for the full sample is plus or minus 3 percentage points. Numbers of respondents and margins of sampling error for key subgroups are shown in the table below. For results based on other subgroups, the margin of sampling error may be higher. Sample sizes and margins of sampling error for other subgroups are available by request. Note that sampling error is only one of many potential sources of error in this or any other public opinion poll. Kaiser Family Foundation public opinion and survey research is a charter member of the Transparency Initiative of the American Association for Public Opinion Research.
| Group | N (unweighted) | M.O.S.E. |
| Total | 1,313 | ± 3 percentage points |
| Party Identification | ||
| Democrats | 398 | ± 6 percentage points |
| Republicans | 330 | ± 6 percentage points |
| Independents | 450 | ± 6 percentage points |
| Parent | ||
| Parent of child(ren) under 18 | 377 | ± 6 percentage points |
| Parent of child(ren) with a child who normally attends school | 308 | ± 7 percentage points |
| Parent/Race | ||
| White Parents | 230 | ± 8 percentage points |
| Parents of color | 136 | ± 11 percentage points |
| Voters | ||
| Registered Voters | 1,117 | ± 4 percentage points |
| Democratic Voters | 353 | ± 6 percentage points |
| Independent Voters | 380 | ± 6 percentage points |
| Republican Voters | 304 | ± 7 percentage points |
| Swing Voters | 285 | ± 7 percentage points |
| Battleground Voters | 419 | ± 6 percentage points |
At almost 27 weeks since the first coronavirus case appeared in the United States, we have reached 4 million cumulative cases — only 15 days after crossing 3 million. While cases are climbing at increasing rates and the economy continues to suffer, the debate around the safety and feasibility of reopening schools for in-person instruction continued this week, as state and local officials released their decisions around in-person or online learning and the Centers for Disease Control and Prevention released its own guidance on reopening schools.
Amidst these developments, we released our latest poll, which found that parents overwhelmingly prefer that schools wait to restart in-person classes to reduce infection risk (60%) rather than open sooner so parents can work and students can return to the classroom (34%). Parents of color (76%) are even more likely than white parents (51%) to prefer that schools wait to return to in-person classes.
Increasing federal funding to state and local governments to help schools reopen safely was among the public’s top priorities for Congress, with 55% saying it should be a top priority.
But as Congress finalizes negotiations around the next coronavirus stimulus package, 72% of the public say increasing federal funding to limit the spread of coronavirus — including testing, contract tracing and personal protective equipment (PPE) — should be a top priority for Congress. It’s the highest-ranked priority in the poll, and the only one seen as a top priority by a majority of Democrats, Republicans, and independents.
The media and President Trump in his latest coronavirus briefings largely focused on the share of cases attributed to a younger population in the most recent resurgences in hotspot states, but our analysis highlights how continued community transmission has implications beyond increased cases. As of July 23, we identified 36 states that are now coronavirus hotspots — based on cases and positivity rates increasing, or meeting specific thresholds. That means approximately 73.5% of the U.S. population is now living in a hotspot.
Long-term care (LTC) facility deaths in these hotspot states as of July 23 have risen at six times the rate as LTC deaths in non-hotspot states. Long-term care cases in Texas and Florida have increased by approximately 50% in two weeks. Adults 65 and older account for 16% of the US population but 80% of COVID-19 deaths in the US. Nearly half of all COVID-19 deaths have been in long-term care facilities.
Global Cases and Deaths: Total cases worldwide reached 15.5 million between July 16 and July 23 – with an increase of approximately 1.7 million new confirmed cases. There were also approximately 43,600 new confirmed deaths worldwide between July 16 and July 23, bringing the total to 633,394 confirmed deaths.
U.S. Cases and Deaths: Total confirmed cases in the U.S. passed 4 million this week. There was an approximate increase of 463,000 confirmed cases between July 16 and July 23. Approximately 5,900 confirmed deaths in the past week brought the total to over 144,000 confirmed deaths in the U.S.
U.S. Tests: There have been over 48 million total COVID-19 tests with results in the U.S. In the past 7 days, 1.7% of the total U.S. population was tested.
Race/Ethnicity Data: As of this week, Black individuals made up a higher share of cases/deaths compared to their share of the population in 30 of 49 states reporting cases and 34 of 44 states reporting deaths. In 7 states (MI, TN, MO, IL, WI, KS, and NH), the share of COVID-19 related deaths among Black people was at least two times higher than their share of the total population.
Hispanic individuals made up a higher share of cases compared to their share of the total population in 35 of 45 states reporting cases and 10 of 44 states reporting deaths. In 8 states (NE, VA, WI, AR, IA, MN, TN, and SD), Hispanic peoples’ share of cases was more than 3 times their share of the population. COVID-19 continues to have a sharp, disproportionate impact on American Indian/Alaska Native as well as Asian people in some states.
State Reports of Long-Term Care Facility Cases and Deaths Related to COVID-19 (Includes Washington D.C.)
State Social Distancing Actions (includes Washington D.C.)
State COVID-19 Health Policy Actions (Includes Washington D.C.)
State Actions on Telehealth (Includes Washington D.C.)38 states overall have taken mandatory action expanding access to telehealth services through private insurers, including:
Approved Medicaid State Actions to Address COVID-19 (Includes Washington D.C.)
A new KFF analysis finds that 80 percent of people who have died of COVID-19 in the U.S. to date were age 65 or older, though the share varies considerably by state — from a high of 94 percent in Idaho to a low of 70 percent in the District of Columbia.
The analysis of data from the Centers for Disease Control and Prevention provides clear evidence of the toll that the novel coronavirus has taken on older Americans. It also provides a more detailed picture of where the impact on seniors has been the greatest.
The analysis finds that states that have seen the largest share of COVID-19 deaths among people 65 and older include those that have had a disproportionate number of deaths in long-term care facilities. These states include Idaho (with 94% of deaths among those 65 and older), New Hampshire (92%), Massachusetts (90%), Rhode Island (90%), Minnesota (89%), Connecticut (89%), Pennsylvania (87%), Ohio (86%), Kentucky (84%), and Delaware (83%).
States in which deaths among those 65 and older account for a somewhat lower share of all COVID-19 deaths compared to the national average are in the South and Sun Belt. Many of these states are hotspots where the virus has surged more recently and where deaths among older adults may be lagging, including Alabama (where 76% of COVID-19 deaths are among those 65 and older), Tennessee (76%), Nevada (75%), Arizona (74%), Mississippi (74%), Arkansas (71%), New Mexico (71%), and Texas (70%).
For more data and analyses regarding older Americans and the novel coronavirus pandemic, visit kff.org.
Since the early days of the pandemic, COVID-19 has taken its greatest toll among older adults in the US in terms of cases, hospitalizations and deaths. Months into the pandemic, older adults continue to be one of the populations most at risk of becoming seriously ill and dying from COVID-19. Adults 65 and older account for 16% of the US population but 80% of COVID-19 deaths in the US, somewhat higher than their share of deaths from all causes (75%) over the same period. Around the country, however, states have put in place a variety of policies regarding COVID-19, and on different timetables, which have contributed to different case trajectories and could result in variations across states in the proportion of COVID-19 deaths among older people. Other factors that may contribute to these differences include the prevalence of underlying medical conditions and racial composition of each state’s population.
To examine the extent of state-level variation in the share of COVID-19 deaths accounted for by older adults, we analyze the distribution of COVID-19 deaths by age group at the state level, based on data from the Centers for Disease Control and Prevention (CDC) as of July 22, 2020, for the week ending July 11. The data are provisional and reflect a time lag due to differences in how states report data.
Of the 41 states and District of Columbia included in this analysis, the share of people 65 and older who have died of COVID-19 varies considerably by state (Figure 1).
.The percent of COVID-19 deaths accounted for by people 65 and older is consistently high and ranges from a high of 94% in Idaho to a low of 70% in the District of Columbia.
In most states, the share of adults 65 and older who have died due to COVID-19 is higher than their share of deaths from all causes (Figure 2).
.For example, in Idaho, a substantially higher share of people who have died of COVID-19 were 65 and older (94%) compared to deaths from all causes (76%). Similarly, in West Virginia, the share of people 65 and older who have died of COVID-19 was much higher than for all causes (90% vs 73%). This was true for almost all states included in the analysis except for Arizona, Arkansas, Kansas, New Mexico, New York and Texas, where the share of COVID-19 deaths and deaths from all causes were the same, and Nebraska where the share of COVID-19 deaths was lower than for all causes.
States that have reported a larger share of adults 65 and older who have died of COVID-19 tend to be those states that have had a disproportionate number of deaths in long-term care facilities. These include Idaho, with 94% of COVID-19 deaths among those 65 and older, as well as New Hampshire (92%), Massachusetts (90%), Rhode Island (90%), Minnesota (89%), Connecticut (89%), Pennsylvania (87%), Ohio (86%), Kentucky (84%), and Delaware (83%).
Many of the states that have reported a smaller share of adults 65 and older who have died of COVID-19 compared to the national average are in the South and the Sun Belt, including Alabama (76%), Tennessee (76%), Nevada (75%), Arizona (74%), Mississippi (74%), Arkansas (71%), New Mexico (71%), and Texas (70%). With the exception of Texas, these states have a population age distribution similar to the US average, which suggests that this finding is not a function of having a younger population. In these states, the pandemic is peaking later than in states that were hit earlier, which may contribute to a lag in deaths among older adults.
States that have experienced a large percentage of deaths at long-term care facilities are also more likely to have a larger share of COVID-19 deaths in the oldest age cohort, those 85 and older (Figure 3).
.In the US overall, 33% of people who have died from COVID-19 were age 85 and older, compared to 31% of people who died from all causes over the same period who were 85 and older. In states with a relatively large share of deaths in long-term care facilities, the percentage is higher, e.g., 48% in New Hampshire and Massachusetts, 46% in Rhode Island, 45% in Minnesota and Connecticut, 43% in Pennsylvania, 39% in Idaho, 37% in Kentucky, Delaware, and Ohio.
The number of adults 65 and older who have died of COVID-19 is considerably higher in some states than others, with 61% of all adults 65 and older who died of COVID-19 as of July 15, residing in just 7 states: New York, New Jersey, Massachusetts, Pennsylvania, Illinois, California, and Michigan (Figure 4).1
.By comparison, only 36% of deaths among people 65 and older from all causes were among older adults residing in those 7 states.
The majority of people who have died of COVID-19 are 65 and older nationwide; however, there is a fair amount of variation across states. These differences may reflect a number of factors, including underlying demographic characteristics, other state-specific factors, and the timing of outbreaks. In states that were affected earlier, older adults tend to account for a higher share of deaths. This may be attributable to the relatively large number of deaths in long-term care facilities. States that have experienced more recent outbreaks have a somewhat smaller share of deaths accounted for by people 65 and older, but as the pandemic progresses, the share of deaths among older people in these states may rise, especially in states that are now experiencing a sharp rise in coronavirus cases in long-term care facilities.
Methods
This analysis uses data from the Centers for Disease Control and Prevention, “Provisional COVID-19 Death Counts by Sex, Age, and State,” as of July 22, 2020, for the week ending July 11, 2020 https://data.cdc.gov/NCHS/Provisional-COVID-19-Death-Counts-by-Sex-Age-and-S/9bhg-hcku. The CDC uses incoming data from death certificates to produce provisional COVID-19 death counts. The number of deaths reported in this dataset are the total number of deaths received and coded as of the date of analysis, and do not represent all deaths that occurred in that period. Data during this period are incomplete because of the lag in time between when the death occurred and when the death certificate is completed, submitted to the National Center for Health Statistics (NCHS) and processed for reporting purposes. This delay can range from 1 week to 8 weeks or more. Death counts that are fewer than 10 by age group were suppressed in accordance with NCHS confidentiality standards. We excluded 9 states from this analysis where there was a discrepancy of more than 10% between the total number of COVID-19 deaths by age group and the total number of deaths overall within the state (Alaska, Hawaii, Maine, Montana, North Dakota, South Dakota, Utah, Vermont, and Wyoming). This discrepancy is likely due to the suppression of data within age cohorts that falls below the NCHS reporting standard.