Consumer Assistance in Health Insurance: Evidence of Impact and Unmet Need

Authors: Karen Pollitz, Jennifer Tolbert, Liz Hamel, and Audrey Kearney
Published: Aug 7, 2020

Summary

The Affordable Care Act (ACA) created new health coverage options and financial assistance to expand coverage and help people remain insured even when life changes, such as job loss, might otherwise disrupt coverage. The ACA also established in-person consumer assistance programs to help people identify coverage options and enroll. A variety of professionals provide consumer assistance, including Navigator programs that are funded through state and federal marketplaces, brokers who receive commissions from insurers when they enroll consumers in private health plans, local non-profit organizations, and health care providers. Recent funding cuts have reduced the availability of Navigator programs.

In the spring of 2020, KFF surveyed consumers most likely to use or benefit from consumer assistance—nonelderly adults covered by marketplace health plans (also called qualified health plans, or QHPs) or Medicaid, and people who were uninsured—to learn who uses consumer assistance, why they seek help, and what difference it makes as well as who does not get help and why. The survey also explored differences in help provided by marketplace assister programs and brokers. Key findings include:

  • Nearly one in five (18%) consumers who looked for coverage or actively renewed their coverage, or about seven million people, received consumer assistance in the past year. Most who enrolled in coverage with help said assistance made a difference; 40% think it is unlikely they would have found coverage without help.
  • Another 12% of target consumers—nearly five million people—tried to find help but did not get it, suggesting there is a shortage of consumer assistance. Among target consumers who were not helped in the past year, two-thirds said they would likely seek consumer assistance if it were available.
  • Roughly one in four marketplace enrollees who were helped by a broker or commercial health plan representative said they were offered a non-ACA compliant policy as an alternative or supplement to a marketplace policy. Brokers and commercial health plan representatives rarely help with Medicaid enrollment.
  • The COVID-19 pandemic could disrupt health coverage for potentially millions of people, but the findings suggest that public understanding of available coverage options and how to apply is limited. Most people who are uninsured or have marketplace of Medicaid coverage do not know or are unsure if the ACA has been overturned, if their state has expanded Medicaid eligibility, or time frames when they can apply. Consumer assistance could help people identify and navigate replacement coverage options.
  • Consumer satisfaction with marketplace plan coverage is generally high; satisfaction with Medicaid is even higher. Three-fourths of marketplace enrollees said, overall, they were very or somewhat satisfied with their plan coverage; among Medicaid enrollees, it was 93%. Medicaid enrollees were also significantly more satisfied with the level of cost sharing and with their choice of doctors and hospitals compared to marketplace enrollees.

Issue Brief

Introduction

Getting, keeping, and understanding health insurance has long been challenging for consumers. While most non-elderly Americans obtain health insurance through their employers, ten years after enactment of the Affordable Care Act (ACA), many consumers without job-based coverage remain unsure of other coverage options or rules for applying. Many even struggle to understand basic health insurance terms and concepts. The ACA provided new, ongoing capacity for professional consumer assistance to help individuals get and keep health insurance, educate the public about coverage options and financial assistance, and resolve consumer questions and insurance problems.

By law, the ACA marketplaces operated by states or the federal government must establish Navigator programs that work year round, including during annual open enrollment, to help consumers apply for coverage and financial assistance through the marketplace – a single, “no-wrong-door” application is used to determine eligibility for marketplace subsidies and for coverage under Medicaid and the Children’s Health Insurance Program (CHIP). Navigators help consumers enroll in marketplace plans as well as Medicaid, and they also conduct outreach and public education and provide post-enrollment assistance. The marketplaces also certify, but do not finance, consumer assistance programs operated by nonprofit community organizations, community health centers, and others, collectively known as certified application counselor (CAC) programs. Health insurance agents and brokers, who are paid commissions by insurers for the policies they sell, also provide professional consumer assistance.

KFF surveys of consumer assister programs have found that millions of consumers turn to these professionals for help each year. The process of learning about health coverage options and applying for financial help can be complicated, and many people lack confidence to complete it on their own. KFF assister program surveys have found that while there is overlap in the services provided and people served by Navigators, CACs, and brokers, they are not interchangeable. Navigator programs, compared to CACs, tend to be more trained and resourced, and more likely to help consumers with complex applications. Brokers are less likely than marketplace assister programs to help consumers who are uninsured, or need help in another language, or who apply for Medicaid.

Since 2017, the Trump Administration reduced Navigator funding in 32 federal marketplace states by 84% on average, from $63 million to $10 million, and many counties now have no Navigator service. Other recent program changes included eliminating the requirement that Navigators maintain a physical presence in the area they serve. The Administration also reduced funding for outreach/advertising during open enrollment by 90%. In explaining funding reductions, the Administration said consumers have grown more familiar with marketplace enrollment procedures, private health insurers have increased spending on outreach and advertising, and enrollment assistance from brokers is more cost efficient.

This report presents data from a March-April 2020 national survey of individuals who are most likely to use and benefit from consumer assistance with health insurance shopping or enrollment: those ages 18-64 who had coverage through marketplace policies (qualified health plans, or QHPs) or Medicaid or who were uninsured at the time of the survey. The survey asked respondents whether they received help applying for coverage in the past year, the nature of help received, and the reasons they sought help or not. The survey also asked respondents about their interest specifically in Navigator assistance, their awareness of financial help and marketplace rules, and their confidence in finding new coverage if they were to become unable to afford current coverage as a result of the COVID-19 pandemic.

Who gets consumer assistance

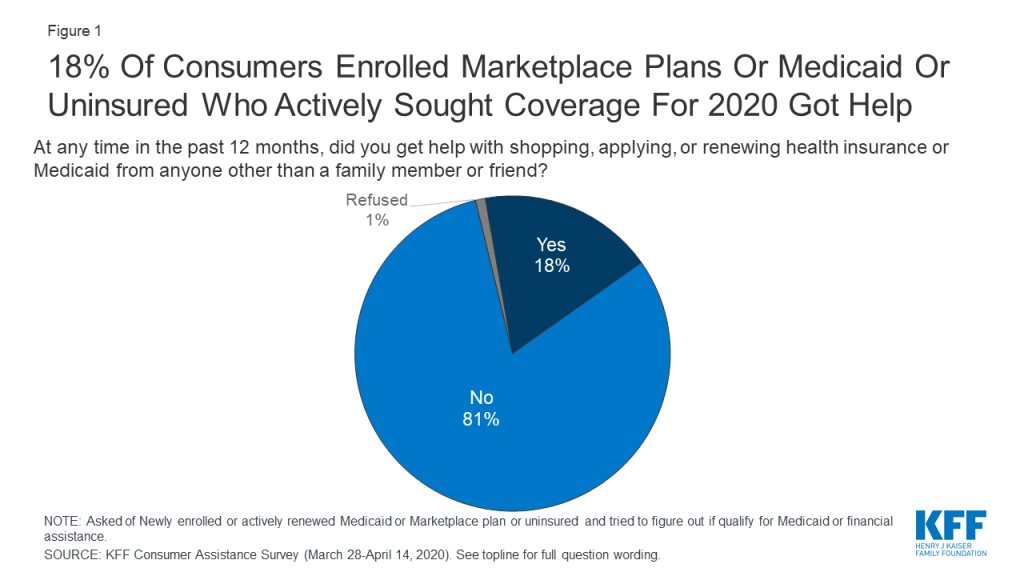
Overall, 18% of consumers with marketplace or Medicaid coverage or uninsured consumers who looked for coverage reported getting help from someone other than a friend or family member (Figure 1). We estimate this represents about seven million individuals who received consumer assistance in the past 12 months (see Methods section for description).

Figure 1: 18% Of Consumers Enrolled Marketplace Plans Or Medicaid Or Uninsured Who Actively Sought Coverage For 2020 Got Help

For the most part, there were few differences in demographic characteristics between consumers who got help and those who did not. Consumers who were newly applying for coverage were as likely to get or seek assistance as were those who actively renewed health plans (consumers enrolled in marketplace plans can actively renew their coverage by returning to the marketplace and looking for a new plan or, if they take no action, can be auto-renewed). Additionally, consumers sought help at about the same rate regardless of their age or income, or whether they lived in metropolitan or non-metro areas. Hispanic consumers were more likely to receive assistance than were White consumers. Hispanic consumers may be more likely to seek help because of language barriers or immigration concerns.

Table 1: Share of Consumers Who Got Help or Sought Help with Health Plan Shopping or Renewal in the Past Year, by Key Demographics
Among target consumers, percent who:Race/EthnicityIncomeAgeMSA
WhiteBlackHispanic< 138% FPL138-249% FPL250-399% FPL400%+ FPL18-2930-4950-64Metro areaNon-metro area
Got help with shopping, applying, or renewing health insurance or Medicaid from someone other than a family member or friend in the past 12 months16%18%23%*15%16%21%23%18%17%19%19%15%
Did not get help in the last 12 months (NET)848176848478768182818185
Tried to get help10141414139121212131213
Did not try to get help727163717267646772686973
Base: Newly enrolled or actively renewed Medicaid or Marketplace plan, or uninsured and tried to figure out if qualify for Medicaid or financial assistance in the past year* Indicates statistically significant difference between White and Hispanic groups (p<0.05)

Among consumers who renewed coverage this year without assistance, about one in five said they got help in a prior year when they first signed up for that coverage. Roughly a quarter (26%) of marketplace enrollees and one in five Medicaid enrollees who did not get help this year reported getting help when they first enrolled in their current coverage (Table 2).

Table 2: One in five consumers with Marketplace or Medicaid coverage who were not helped this year received consumer assistance when they first signed up
Thinking back to when you first signed up for coverage, did someone other than a friend or family member help you with the process?Insurance type
TotalMarketplace enrolledMedicaid enrolled
Yes22%26%20%
No67%67%67%
Not sure/Don’t remember/Refused12%8%13%
Base: Marketplace or Medicaid enrollees who did not received help in past 12 months

Reasons consumers seek help

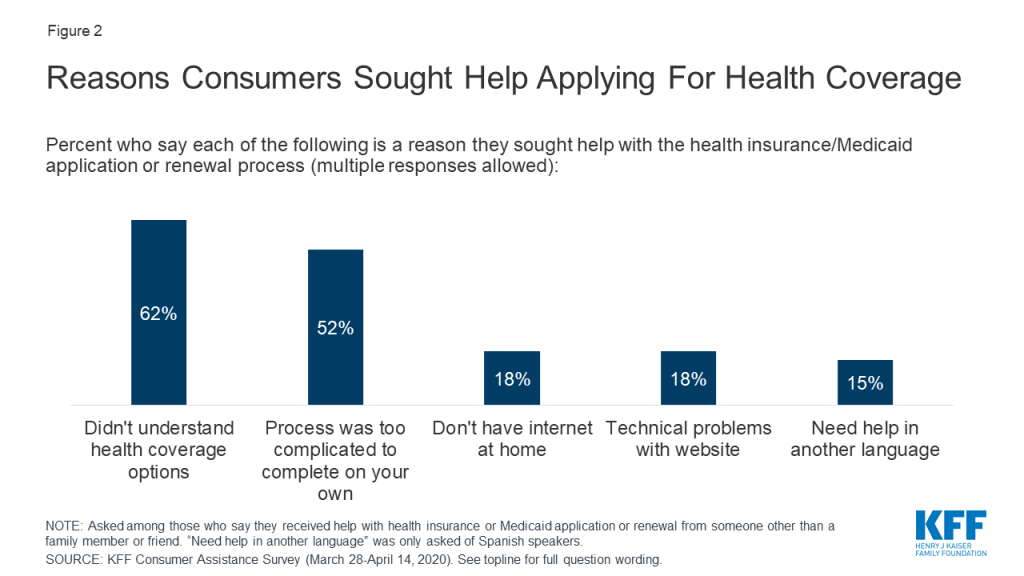
Consumers sought help for a variety of reasons, including lack of knowledge about coverage options and a complicated application process. Among consumers who received help 62% said they did not understand their coverage options and 52% said the process of applying was too complicated to complete on their own (Figure 2). Some consumers also sought help because they did not have internet access at home (18%), they had problems with the marketplace website (18%), or they needed assistance in Spanish (15%).

Figure 2: Reasons Consumers Sought Help Applying For Health Coverage

Consumers also reported challenges with multiple aspects of the application and plan selection process. Consumers applying for coverage and financial assistance must complete a multi-step process that typically begins with creating an online account. Those applying for financial assistance must report information about their income and household size; and are sometimes required to submit additional documentation by a deadline. Then consumers must review their plan options, including covered benefits, drug formularies, and provider networks and select one that best fits their needs. The process may vary somewhat depending on the type of coverage in which the person enrolls or whether they apply through the marketplace or through their state Medicaid agency. Each of these steps can pose challenges for consumers. Among uninsured adults who tried to find coverage, about eight in ten (83%) found at least one of these steps somewhat or very difficult. About six in ten (61%) consumers who enrolled in marketplace policies experienced difficulties. Consumers who enrolled in Medicaid were less likely to face challenges, though nearly four in ten found at least one step in the process somewhat or very difficult (Table 3).

Table 3: Difficulties Faced by Consumers in Finding and Enrolling in Coverage
Percent who say it was difficult to do each of the following when signing up/renewing/applying for a plan:Insurance Type
TotalMarketplace enrolleesMedicaid enrolleesUninsured, sought coverage
Find a health plan to meet their needs28%38%*15%60%*^
Compare your costs under different plans3333N/AN/A
Compare the doctors and hospitals they could see under each plan3137*2349*
Figure out if income qualifies them for financial assistance or Medicaid2528*1757*^
Provide required documentation2024*1340*^
Set up or access an online account1922*1629*
Understand and meet deadlines1717*1143*^
Any of the above difficult5161*3883*^
Base: Newly enrolled or actively renewed Medicaid or Marketplace plan, or uninsured and began an application for Medicaid or marketplace in the past year* Indicates statistically significant difference from Medicaid enrollees (p<0.05)^ Indicates statistically significant difference from Marketplace enrollees (p<0.05)N/A: only marketplace enrollees were asked about difficulty comparing costs under different plans

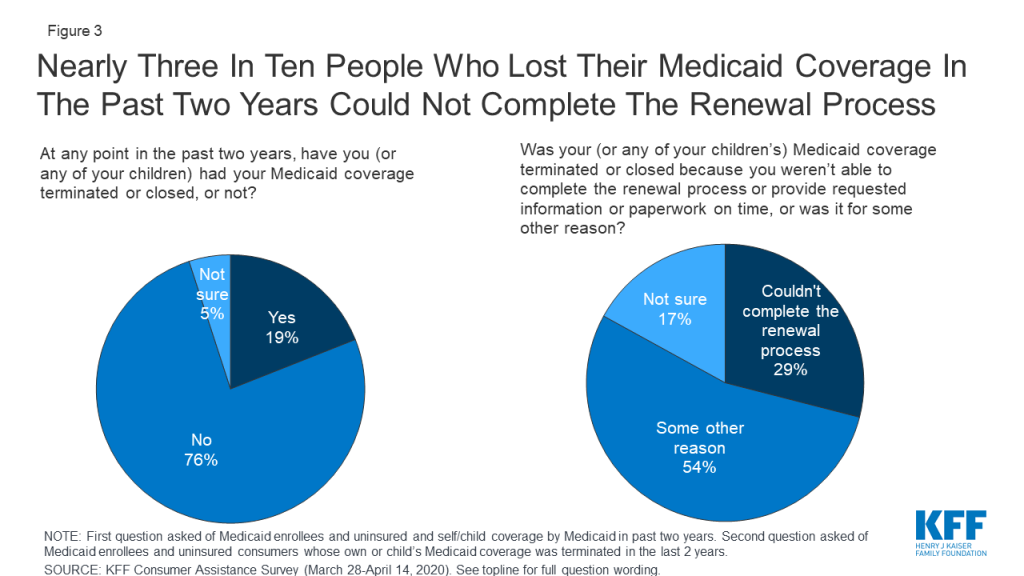
Some consumers struggled to complete the Medicaid renewal process. About one in five (19%) of those covered by Medicaid in the past two years said their or their child’s coverage was terminated at some point. While a relatively small share of current Medicaid consumers (11%) reported a coverage termination, a larger share (41%) of uninsured consumers who had been covered by Medicaid themselves or had a child covered by Medicaid said that coverage had been terminated. Among those whose Medicaid coverage had been terminated at some time in the past two years, nearly three in ten (29%) said it was because they could not complete the redetermination process (Figure 3). Until recently, many states had experienced a decline in Medicaid enrollment, due in part to increased use of periodic eligibility checks and redetermination requirements that the Trump Administration had encouraged. If individuals were unaware of the need to complete the redetermination process or were unable to complete the process within the required timeframe, their coverage would be terminated even if they remained eligible. However, since this survey was conducted, states have had to suspend most Medicaid terminations until the end of the COVID-19 emergency period in return for receiving enhanced federal Medicaid matching funding.

Figure 3: Nearly Three In Ten People Who Lost Their Medicaid Coverage In The Past Two Years Could Not Complete The Renewal Process

Measures of the benefits of consumer assistance

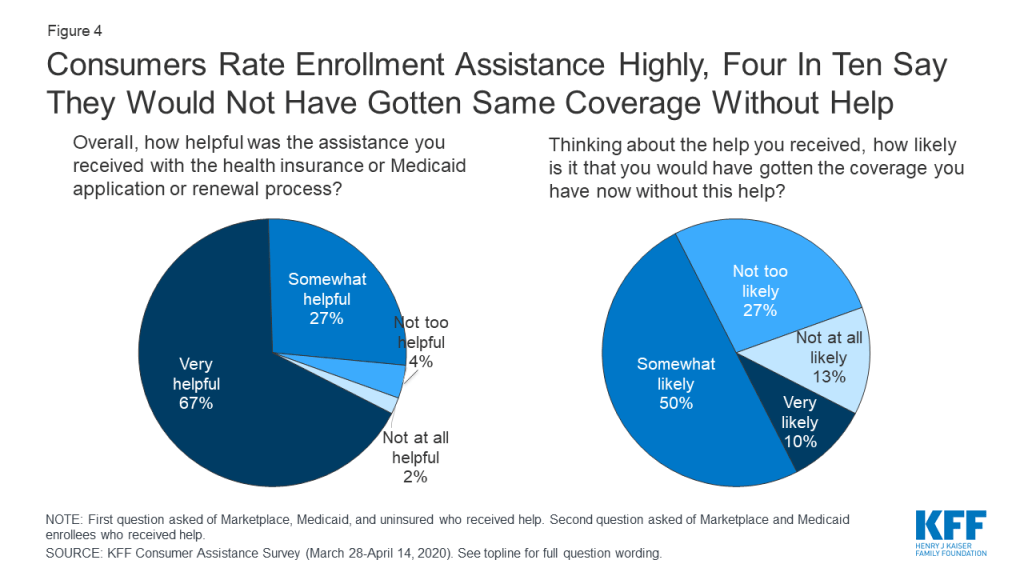
Consumers valued help they received and many questioned whether they would have obtained coverage without assistance. Overall, 94% of consumers who got assistance said it was very or somewhat helpful. Four in ten consumers who got help enrolling in coverage said it was somewhat or very unlikely they would have gotten their coverage without help; 50% said it was somewhat likely they would have gotten coverage (Figure 4). In addition, 27% of consumers who received help enrolling said they returned to their assister with help for other post-enrollment questions, such as help understanding how to use their new insurance.

Figure 4: Consumers Rate Enrollment Assistance Highly, Four In Ten Say They Would Not Have Gotten Same Coverage Without Help

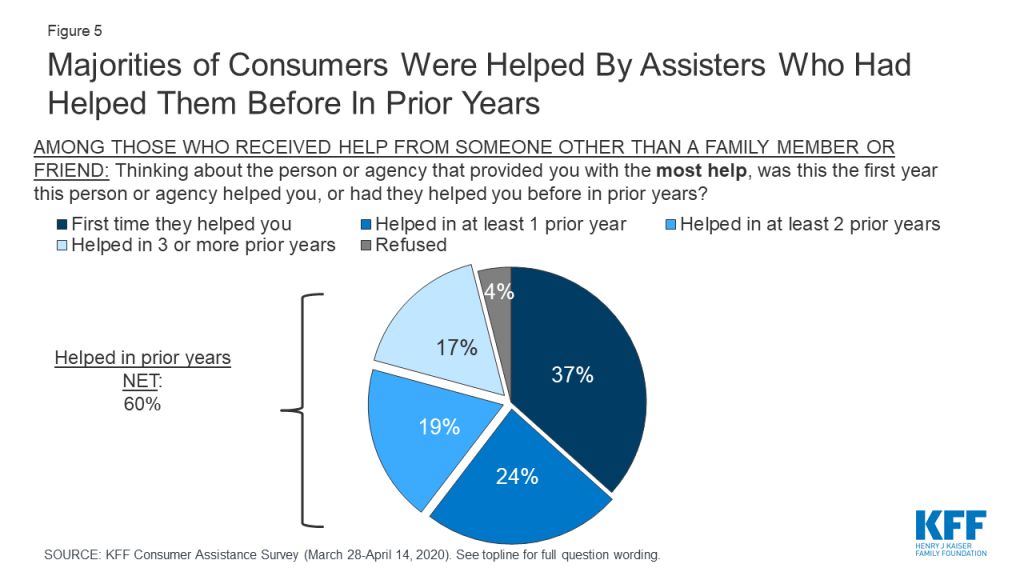
Many consumers sought help from the same assisters in previous years. Another indication of how consumers value enrollment assistance is the rate at which they return to assisters for help year after year. Most who received consumer assistance (60%) this year returned to someone who had helped them in the past, with 36% reporting they had been helped in two or more prior years by the person or agency who helped them this year (Figure 5).

Figure 5: Majorities of Consumers Were Helped By Assisters Who Had Helped Them Before In Prior Years

Who provides consumer assistance

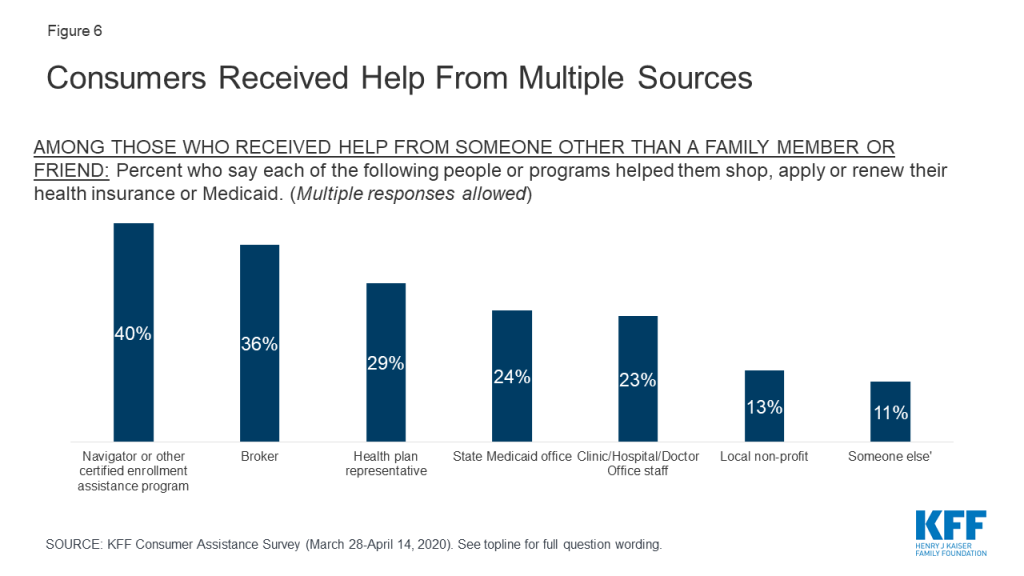
Consumers received help from a variety of sources, and often from multiple sources. A variety of entities provide consumer assistance, including Navigators, health insurance brokers, representatives from health plans, staff from health clinics, doctor’s offices, or hospitals, and community-based non-profits. People applying for Medicaid can also apply at state or local Medicaid offices. For consumers, identifying Navigator programs as such can be a challenge. In only in a handful of states is the Navigator program specifically branded – e.g. the NC Navigator Consortium in North Carolina. Navigator programs in most states are housed in community-based non-profits or in health clinics or hospitals; however, non-Navigator CAC programs also tend to be offered by non-profits, clinics, and hospitals. The Find Local Help Link in healthcare.gov does not distinguish Navigators from other CAC assister programs, although it does clearly identify brokers. According to the survey, among consumers who received assistance, 42% said they got help from more than one source. Including all sources of help, four in ten consumers who got help reported getting help from a Navigator, 36% said they got help from a broker, and 29% received help from a health plan representative. Fewer received help from a state Medicaid office or from a health care provider (Figure 6).

Figure 6: Consumers Received Help From Multiple Sources

Consumers most frequently cited marketplace websites and word of mouth as the ways they learned about the person or organization that provided the help. About four in ten (42%) consumers who got help said they found assistance through a state or federal marketplace websites and 39% relied on word of mouth. Three in ten said they learned about assistance from a Medicaid office, and about one in five said the received a call or email from person or organization that helped them (21%) or heard about help through an advertisement or news coverage (18%). Fewer consumers cited outreach events (15%) or social media (6%).

Brokers provided assistance primarily to marketplace enrollees. Fourteen percent of marketplace enrollees overall reported receiving assistance from brokers compared to just 2% of Medicaid enrollees and 4% of people who were uninsured and sought coverage (Table 4). At the same time, both Medicaid enrollees and people who were uninsured were more likely than marketplace enrollees to have gotten help from a state Medicaid agency. Navigators helped consumers at about the same rate whether they were uninsured or enrolling in marketplace coverage or Medicaid.

Table 4: Sources of Consumer Assistance, by Coverage Status
Percent who say they received help from each of the following sources:Insurance Type
TotalMarketplace enrolleesMedicaid enrolleesUninsured, sought coverage
Any source other than family member or friend18%21%15%20%
Navigator7959
Broker614*24
Health plan representative5639*
State Medicaid office416^6^
Clinic, hospital, or physician office staff4247
Local non-profit2223
Base: Newly enrolled or actively renewed Medicaid or Marketplace plan, or uninsured and tried to figure out if qualify for Medicaid or financial assistance in the past year. Multiple responses allowed.* Indicates statistically significant difference from Medicaid enrollees (p<0.05)^ Indicates statistically significant difference from Marketplace enrollees (p<0.05)

Some people helped by brokers or health plan representatives or who bought their coverage directly from a web broker or insurer web site were offered non-ACA compliant products. The Trump Administration has encouraged the use of brokers as a replacement for Navigators, and promoted enrollment in marketplace QHPs via health insurer and commercial web broker sites, called enhanced direct enrollment (EDE) sites, instead of healthcare.gov. About one in five (22%) marketplace enrollees who were helped by brokers or plan representatives or who enrolled through EDEs say they were offered an alternative to QHPs, such as short-term policies with lower premiums that exclude pre-existing conditions and other benefits required of ACA-compliant plans (Table 5). One-quarter said they were offered other noncompliant policies, such as cancer policies or hospital indemnity policies, to buy as a supplement to marketplace coverage. Additionally, 81% of marketplace enrollees who signed up through EDE sites or who were assisted by brokers or health plan representatives said that the person or site recommended a specific policy that would be best for that consumer. By contrast, Navigators and certified application counselors are prohibited from recommending non-ACA compliant policies and are required to provide only objective information.

Table 5: Experiences of Marketplace Enrollees Helped by Brokers and Health Plan Representatives or who Bought Coverage on a Web Broker or Health Plan Web Site
When you chose or renewed your current plan, did the broker/web broker/health plan representative…?Marketplace Enrollees
Show you plans you could buy instead of a marketplace policy, such as short-term health plansYes22%
No59%
Unsure19%
Show you plans to buy in addition to a marketplace policy, such as policies that cover deductibles, pay daily cash benefits while in the hospital, or cover a single condition like cancer?Yes25%
No59%
Unsure16%
Recommend a specific policy that would be best for youYes81%
No19%
Unsure1%
Base: Marketplace enrollees who got help from a health insurance broker or health plan representative, or who purchased health insurance from a broker, directly from an insurance company, or from a website offering plans sold by multiple insurance companies.

More were interested in consumer assistance than got it

Among people who actively looked for QHP or Medicaid coverage in the past year, more expressed interest in consumer assistance than received it. Of consumers who actively looked for coverage, 12%, or nearly 5 million consumers, tried to find enrollment assistance without success.

Consumers who looked for help but did not get it cited various reasons, mostly stemming from limited availability of in-person assistance. About one-third (32%) of consumers who wanted but did not get help said they could not find help close to home, and another three in ten said they could not get an appointment (Table 6). One in ten reported they were unable to get help in Spanish. These barriers reflect actions that many Navigator programs said they would need to take in response to federal funding reductions – including cuts in staff, advertising, and services for non-English speaking consumers. Consumers with QHP coverage in federal marketplace states were less likely to be helped by Navigators (6%) compared to QHP enrollees in state-run marketplace states (18%), — suggesting that federal funding cuts and other changes to Navigator programs may have reduced access to these assisters relative to state-based marketplaces that maintained consumer assistance.

Table 6: Reasons Why People Who Sought Consumer Assistance Didn’t Get it
Among those who say they did not get help in the past year, but sought help, percent who say each of the following is the reason they did not get help:
Couldn’t find help close enough to your home32%
Couldn’t get an appointment30
Couldn’t find help in person and weren’t comfortable getting help over the phone26
Couldn’t find help available in Spanish10
Other reasons9
Base: Those who did not get help with health insurance shopping, applying, or renewing in the past year, but tried to find someone to help them. Multiple responses allowed.

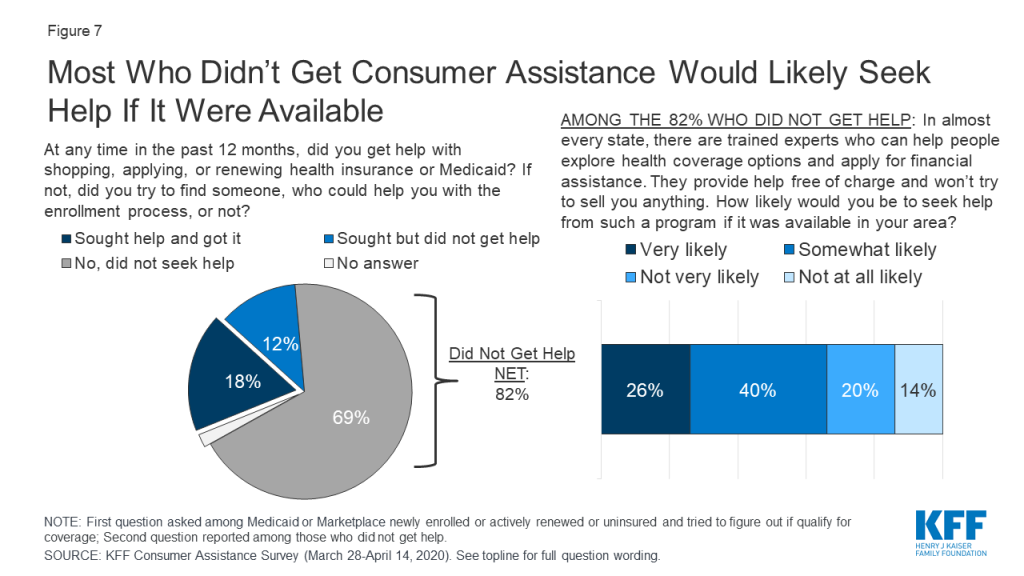
In addition, most consumers who did not get help said they would likely seek consumer assistance if it were available. When asked if they would be interested in receiving marketplace assistance from trained experts who would help them, free of charge, to explore coverage options and apply for financial assistance, two-thirds of consumers who did not receive any consumer assistance said they would likely seek help from such a program if it were available in their area (Figure 7). Lack of awareness is likely a key barrier to obtaining in-person assistance. Although the ACA requires all marketplaces to provide Navigator programs, that a majority of consumers who were not helped said they would likely seek help from such a program if it were available suggests that many do not know if these programs are available or how to find them.

Figure 7: Most Who Didn’t Get Consumer Assistance Would Likely Seek Help If It Were Available

Seven in ten people who actively looked for health coverage in the past year did not receive consumer assistance and did not try to find it. The most frequently offered reason for not seeking help is that they did not feel they needed help (67%). The perceived need for help varied by coverage status. People enrolled in marketplace plans were more likely to say they did not need help compared to Medicaid enrollees and uninsured individuals who looked for coverage (79% vs. 67% and 56%, respectively). Other reasons for not seeking help included not knowing where to look for help (29%) or not having time to look for help (19%) (Table 7). In addition, as noted earlier, 26% of marketplace enrollees and one in five Medicaid enrollees who did not get help this year reported getting help when they first enrolled in their current coverage.

Table 7: Reasons why Consumers did not Seek Enrollment Assistance
Percent who say each of the following is the reason for not seeking consumer assistance:Insurance Type
TotalMarketplace enrolleesMedicaid enrolleesUninsured, sought coverage
You didn’t feel you needed help67%79%*67%56%
You didn’t know where to look for help29272833
You didn’t have time to look for help19191819
Other3323
Base: Newly enrolled or actively renewed Medicaid or Marketplace plan or uninsured and tried to figure out if qualify for Medicaid or financial assistance, did not get help and did not try to find someone to help. Multiple responses allowed.* Indicates statistically significant difference from Medicaid enrollees and Uninsured, sought coverage (p<0.05) 

Consumer assistance during the coronavirus pandemic

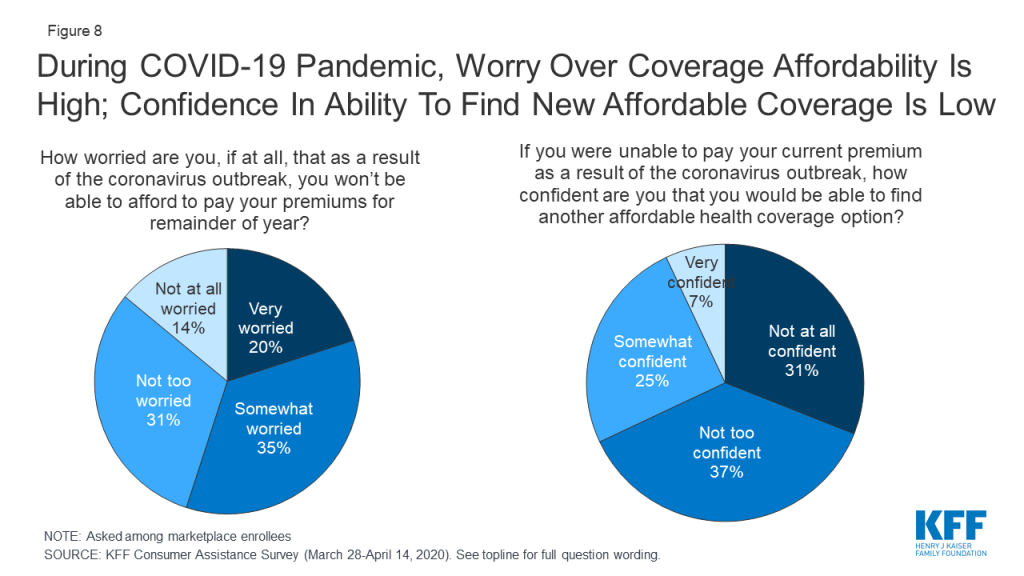
The coronavirus pandemic has caused many to lose their jobs and worry about maintaining their health coverage. The KFF consumer assistance survey was fielded March 28-April 14, 2020, as the COVID-19 pandemic was emerging in the U.S. By mid-April, about 600,000 COVID-19 cases had been confirmed, compared to about five million cases today. Among people then enrolled in marketplace coverage, about half (55%) said they worried they would not be able to afford paying their premiums for the rest of this year due to the pandemic (Figure 8). Two-thirds (67%) said that if they were to lose current coverage as a result of the outbreak, they were not confident they would be able to find other coverage they could afford.

Figure 8: During COVID-19 Pandemic, Worry Over Coverage Affordability Is High; Confidence In Ability To Find New Affordable Coverage Is Low

Many people have lost their job-based coverage because of the pandemic, but may not be aware of other coverage options. At the time the survey was conducted, 6% of those who were uninsured said they had recently lost health coverage due to the pandemic. Since then, KFF analysis estimates 26.8 million people who lost jobs as of early May are also at risk of losing their health benefits. While most of them would be eligible for other subsidized coverage through the marketplace or Medicaid, whether they can identify and enroll in new coverage for which they are eligible is another question. As noted earlier, about half of consumers experience difficulty with some aspect of the process of searching or applying for marketplace or Medicaid coverage. And even before the pandemic, nearly six in ten uninsured people were eligible for subsidized coverage under the ACA but not enrolled.

Many people lack basic information about the ACA and available coverage options. About a third (32%) of people correctly said the ACA is still the law; the rest were unsure or thought the law has been overturned (Table 8). While about half (48%) of people knew that marketplace enrollment is generally available only during open enrollment, fewer than four in ten (38%) were aware that Medicaid enrollment is available year-round. In addition, only one in five people knew whether their state had expanded Medicaid.

Table 8: Consumer Awareness of Affordable Care Act Policies
Percent who correctly say each of the following is true:Insurance Type
TotalMarketplace enrolleesMedicaid enrolleesUninsured
The Affordable Care Act is still law.32%56%*^30%^22%
The individual mandate is no longer in effect for people who did not have coverage in 2019.3952 *^2444*
There is a specific time period each year when most people need to sign up for a private health insurance plan through the ACA marketplaces.4876*^3743
People who are eligible for Medicaid can sign up at any time.383149 ŧ^33
Among those in states that have expanded Medicaid
TotalMarketplace enrolleesMedicaid enrolleesUninsured
Percent who correctly say that their state has expanded Medicaid programs to cover more low-income people2126^24^14
Among those in states that have not expanded Medicaid
TotalMarketplace enrolleesMedicaid enrolleesUninsured
Percent who correctly say that their state has not expanded Medicaid programs to cover more low-income people2127*^1920
* Indicates statistically significant difference from Medicaid enrollees (p<0.05)^ Indicates statistically significant difference from Uninsured (p<0.05)ŧ Indicates statistically significant difference from Marketplace enrollees (p<0.05)

Consumer satisfaction with coverage

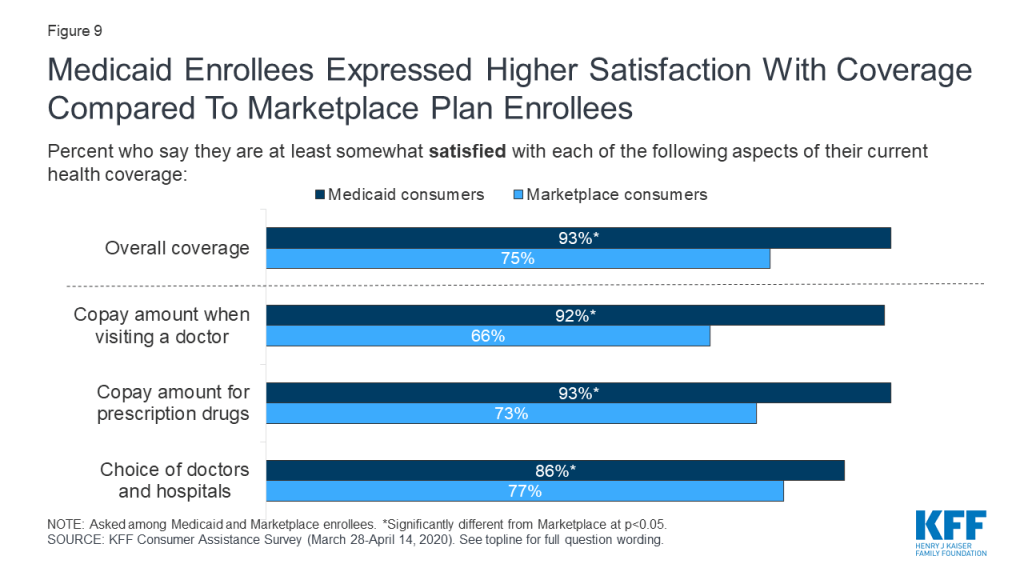
In general, consumers enrolled in marketplace plans or Medicaid expressed satisfaction with their coverage, with Medicaid enrollees expressing even higher levels of satisfaction. Three-fourths of marketplace enrollees said, overall, they were very or somewhat satisfied with their plan coverage; among Medicaid enrollees, it was 93% (Figure 9). Medicaid enrollees were significantly more likely than marketplace enrollees to say they were very or somewhat satisfied with copays or other out-of-pocket costs they face when they visit a doctor (92% vs. 66%) or when they fill a prescription (93% vs. 73%). Medicaid enrollees were also more likely than marketplace enrollees to express satisfaction with their choice of doctors and hospitals (86% vs. 77%).

Figure 9: Medicaid Enrollees Expressed Higher Satisfaction With Coverage Compared To Marketplace Plan Enrollees

Marketplace enrollees were less satisfied with the premiums they pay for coverage and with the annual deductibles associated with their plans. While Medicaid generally does not require enrollees to pay monthly premiums and does not have annual deductibles, marketplace plans charge premiums and impose deductibles and, even after accounting for subsidies, many enrollees find these costs burdensome. About one-third (35%) of marketplace consumers said they were somewhat or very dissatisfied with their monthly premium amount, and about half (48%) were dissatisfied with their deductible.

Attitudes toward alternative coverage options

Perceptions of the cost of health coverage discourage many people who are uninsured from applying. Two-thirds of those who are uninsured cited the cost of coverage as the main reason why they did not have health insurance. In part because of the perceived cost of insurance, just 29% of uninsured individuals said they tried to find coverage in the past year, and only one-third of those individuals (10% of all who were uninsured) completed an application. About half (54%) of uninsured consumers reported they have lacked coverage for two years or longer.

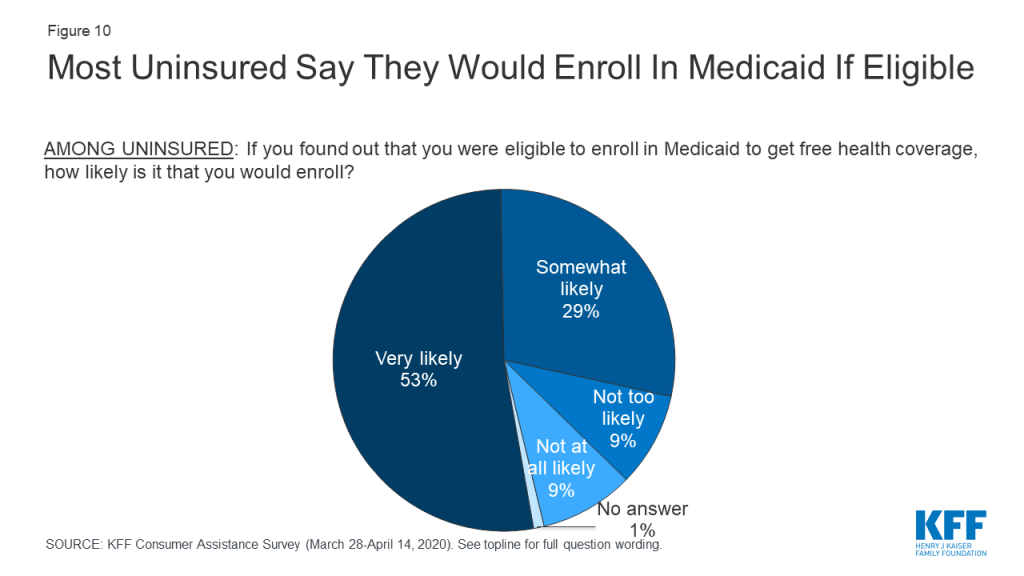
Eight in ten people who were uninsured said they would enroll in Medicaid if told they were eligible (Figure 10). Similar shares of uninsured people in states that had expanded Medicaid and in states that have not yet expanded responded they would enroll in Medicaid. These findings suggest that many uninsured residents in the 13 non-expansion states would enroll if their state expanded Medicaid. According to estimates, 24% of people who are uninsured are eligible for Medicaid, but are not enrolled. Lack of awareness of coverage options and barriers to enrollment may prevent those who are eligible from enrolling in coverage, pointing to the need for additional outreach and enrollment assistance.

Figure 10: Most Uninsured Say They Would Enroll In Medicaid If Eligible

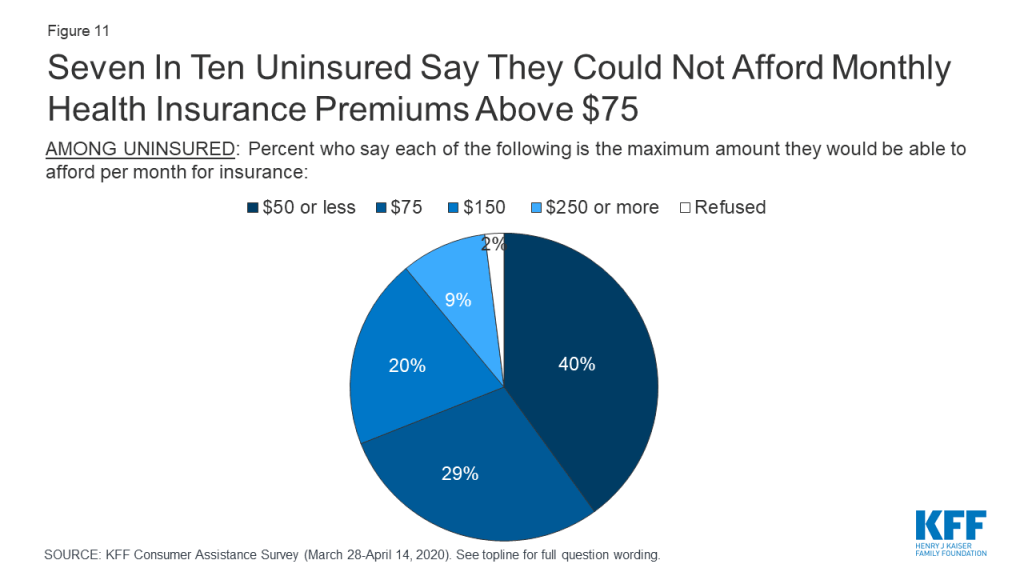
Most uninsured consumers cannot afford to pay a lot for health insurance. When uninsured individuals were asked what premium amount they could afford to pay for coverage each month, about seven in ten said $75 or less, with 24% saying even $50 would be unaffordable (Figure 11). In 2019, the average marketplace enrollee paid a premium of $87 after taking into account premium tax credits.

Figure 11: Seven In Ten Uninsured Say They Could Not Afford Monthly Health Insurance Premiums Above $75

Most uninsured consumers do not want plans with high out-of-pocket costs. While 28% of the uninsured would qualify for “free” bronze premium this year because the premium tax credit would cover 100% of the monthly premium, 75% of uninsured individuals said they would not be interested in such a policy, whose annual deductible typically exceeds $5,000 per year.

Most marketplace and uninsured consumers would not purchase short-term, limited duration policies, but would be interested in enrolling in a public option. The Trump Administration has promoted other less expensive policies – such as short-term limited duration insurance – that can charge lower premiums because they exclude pre-existing conditions and limit covered benefits. However, about eight in ten (82%) marketplace and uninsured consumers said they would not purchase such a policy (Figure 12). By contrast, 72% of these consumers said they would be interested in a government-administered plan, or public option, as a source of coverage.

Figure 12: Majorities of Marketplace And Uninsured Consumers Do Not Want To Purchase Short-term Policies, But Would Enroll In A Public Option

Discussion

Consumer assistance in health coverage matters. An estimated seven million people with marketplace or Medicaid coverage or who were uninsured and looked for coverage received consumer assistance. Nine in ten of those who received assistance rated it highly, and 40% of those who enrolled in coverage with assistance think it is unlikely they would have the same coverage today if not for help they received.

There is also evidence of a shortage of consumer assistance. An estimated five million consumers sought help but could not get it. Among consumers who did not receive help, 66% said they would likely seek consumer assistance if it were available. Resources to provide consumer assistance through the marketplace are limited and have been cut severely in recent years. Yet, the need for consumer assistance still appears to be large, with this survey finding about half who apply for coverage find at least some aspect of that process difficult. Also, consumers who are most likely to apply for marketplace coverage or Medicaid generally are not very familiar with coverage options or procedures. Most don’t know if the ACA remains law, or if their state has expanded Medicaid eligibility, or when during the year they can apply for these different types of coverage.

There is evidence brokers are not a substitute for marketplace consumer assistance programs. Brokers rarely help people apply for Medicaid. A significant share of consumers say brokers and web brokers recommend other non-ACA compliant coverage options, which may have lower premiums but also fewer protections.

During this pandemic, millions are at risk of losing their job-based coverage. While most will be eligible for replacement coverage through the marketplace or Medicaid, transitioning to these programs will not be intuitive or easy for many people. Greater availability of consumer assistance would help people losing employer-based insurance navigate their coverage options, but those options still could prove to be unaffordable for some.

This work was supported in part by the Kate B. Reynolds Charitable Trust. We value our funders. KFF maintains full editorial control over all of its policy analysis, polling, and journalism activities.

Methods

The Kaiser Family Foundation (KFF) Consumer Assistance with Health Insurance Survey is based on interviews with a probability-based sample of 2,049 respondents between the ages of 18 and 64 who reported having health insurance purchased from a state or federal marketplace (the “Marketplace” group); being covered by Medicaid, excluding those who receive Supplemental Security Income (the “Medicaid” group); or not being covered by health insurance (the “Uninsured” group). Interviews were administered online from March 28 through April 14, 2020 in English and Spanish. The survey was designed and analyzed by researchers at KFF, and KFF paid for all costs associated with the survey.

Ipsos conducted sampling, interviewing, and tabulation for the survey using the KnowledgePanel, a representative panel of adults age 18 and over living in the United States. KnowledgePanel members are recruited through probability sampling methods using address-based sampling. Panel members who do not have internet access are provided with a netbook and internet service.

For this study, certain types of panelists were selected at disproportionately higher rates in order to allow for subgroup analysis, including those with Marketplace coverage, those living in states with state-based Marketplaces, those living in states that have not expanded Medicaid, and African Americans.

The combined results have been weighted to adjust for the fact that not all survey respondents were selected with the same probability, to address the implications of sample design, and to account for systematic nonresponse along known population parameters. In the first weighting stage, the sample of all respondents selected for the survey (prior to any termination due to ineligibility) was weighted to match the demographic makeup of the 18-64 year-old population by sex, age, race/ethnicity, education, household income, region, metro status, and language proficiency (for Spanish-speaking respondents). Demographic targets came from the Census Bureau’s 2018 Current Population Survey, except for language proficiency which was derived from the 2018 American Community Survey.

In the second weighting stage, eligible respondents were separated into 3 groups (Marketplace, Medicaid, and Uninsured), and the first stage weight was used to create demographic benchmarks for each group. Qualified respondents were then weighted to the resulting benchmarks.

The margin of sampling error including the design effect for the full sample is plus or minus 3 percentage points. All statistical tests of significance account for the effect of weighting. Numbers of respondents and margins of sampling error for key subgroups are shown in the table below. For results based on other subgroups, the margin of sampling error may be higher. Sample sizes and margins of sampling error for other subgroups are available by request. Note that sampling error is only one of many potential sources of error in this or any other public opinion poll. Kaiser Family Foundation public opinion and survey research is a charter member of the Transparency Initiative of the American Association for Public Opinion Research.

GroupN (unweighted)M.O.S.E.
Total2,049±3 percentage points
Marketplace731±5 percentage points
Medicaid680±5 percentage points
Uninsured638±5 percentage points

The estimates of the number of people helped and the number of people who sought help but did not get it were calculated by first estimating the universe for the target population, which is comprised of nonelderly adults enrolled in marketplace plans as of March 2020 who are in a new plan or actively renewed their 2019 plan; non-elderly who enrolled in Medicaid in the past year or actively renewed their Medicaid coverage, and who were not receiving SSI benefits as of that date; and nonelderly uninsured who actively sought coverage in the past year.

Marketplace enrollees. According to the Early 2020 Effectuated Enrollment Snapshot, 10.7 million people selected or were reenrolled in a marketplace plan as of March 15, 2020. In addition, based on data from the 2020 Marketplace Open Enrollment Data, 880,000 adults enrolled in the Basic Health Plan (BHP) in New York and Minnesota for a total of 11.6 million marketplace and BHP enrollees. From the survey, 72% of marketplace enrollees are either in a new plan for 2020, or actively renewed their 2019 plan. Total marketplace enrollees newly enrolled or actively renewed in 2020 was 8.4 million.

Medicaid enrollees. Current Medicaid enrollment data that separate non-elderly, nondisabled adults are unavailable. Using 2018 data from a KFF analysis of Medicaid enrollees with disabilities, there are an estimated 25.5 million nonelderly, non-disabled adults on Medicaid. To include all the individuals helped, the children of adults on Medicaid were also included. According to the survey 47% of Medicaid enrollees reported one or more children was also enrolled in Medicaid at the time of the survey. Estimating one child per adult is about 12 million children. Total Medicaid enrollees in the sample universe was 37.5 million. This total was then reduced to include only those who enrolled in the past 12 months (20% from the survey or 7.5 million) or who actively renewed their coverage (39% from survey or 14.6 million) for a total of 22 million in the target population.

Uninsured individuals. Using data from 2018, there were 27.9 million nonelderly individuals without health coverage. According to the survey, 29% of people who were uninsured actively looked for coverage for a total of 8.1 million.

Summing the estimates results in 38.5 million people who could have been helped. According to the survey, 18% of people who could have been helped, actually got help or about 7 million people. Additionally, 12% of people who could have been helped sought help but didn’t get it or nearly 5 million people.

Since the coronavirus pandemic hit the United States, KFF has been tracking the firsthand experiences of people and how they’re coping with the virus and the changes it has brought about in their lives. Parents face a unique set of challenges as they attempt to balance the needs of their children – especially their schooling – with their own concerns about work, finances, and health. With the new school year approaching, the July KFF Tracking Poll explored parents’ concerns and preferences related to school reopening decisions. This new analysis finds a gender gap in parents’ worries and their views on schools returning for in-person instruction, as well as the reported toll of coronavirus-related stress on their mental health and wellbeing. (more…)

It’s Back-to-School amid COVID-19, and Mothers Especially Are Feeling the Strain

Authors: Lunna Lopes, Cailey Muñana, and Liz Hamel
Published: Aug 6, 2020

Since the coronavirus pandemic hit the United States, KFF has been tracking the firsthand experiences of people and how they’re coping with the virus and the changes it has brought about in their lives. Parents face a unique set of challenges as they attempt to balance the needs of their children – especially their schooling – with their own concerns about work, finances, and health. With the new school year approaching, the July KFF Tracking Poll explored parents’ concerns and preferences related to school reopening decisions. This new analysis finds a gender gap in parents’ worries and their views on schools returning for in-person instruction, as well as the reported toll of coronavirus-related stress on their mental health and wellbeing. (more…)

Since the coronavirus pandemic hit the United States, KFF has been tracking the firsthand experiences of people and how they’re coping with the virus and the changes it has brought about in their lives. Parents face a unique set of challenges as they attempt to balance the needs of their children – especially their schooling – with their own concerns about work, finances, and health. With the new school year approaching, the July KFF Tracking Poll explored parents’ concerns and preferences related to school reopening decisions. This new analysis finds a gender gap in parents’ worries and their views on schools returning for in-person instruction, as well as the reported toll of coronavirus-related stress on their mental health and wellbeing. (more…)

The Veterans Health Administration’s Role During the COVID-19 Response

Authors: Daniel McDermott, Julie Hudman, and Cynthia Cox
Published: Aug 6, 2020

A new issue brief examines the role of the Veterans Health Administration (VHA) during the coronavirus pandemic, and public health emergencies more broadly. The analysis finds that the VHA has provided assistance to 46 states and D.C., including treating over 270 non-veteran patients with coronavirus. The VHA has also provided additional coronavirus tests and equipment in 17 states, opened beds to non-veteran patients in 13 states, and dispatched over 750 doctors, nurses, and other staff to non-VA facilities throughout the country.

The analysis is available on the Peterson-KFF Health System Tracker, a partnership between the Peterson Center on Healthcare and KFF that monitors the U.S. health system’s performance on key quality and cost measures.

Last Week in Coronavirus: July 24 to July 30

Published: Aug 5, 2020

During the 28th week since the first coronavirus case appeared in the United States we also entered the final 100 days of a presidential election campaign that’s increasingly influenced by this pandemic. Last week, we released additional findings from our most recent KFF Health Tracking Poll, which found that voters’ approval of President Trump’s handling of the coronavirus has dropped 18 points to hit a new low. 61 percent disapprove of the President’s handling of the pandemic less than four months before the election, compared to 35 percent who approve.

Meanwhile, the gross domestic product for the second quarter in the United States contracted by the greatest rate on record. And Congress, which was working to pass the coronavirus relief bill and provide answers on whether the additional unemployment benefits would continue, recessed without resolution to that question as 1.43 million filed for unemployment last week.

The economic impact of the pandemic is reversing trends in Medicaid and the Children’s Health Insurance Program (CHIP) for 2020. After two years of declining enrollment, the number of people covered by Medicaid and CHIP rose by 1.2 million between Dec. 2019 and April 2020, to 72.3 million.

Enrollment from March 2020 to April 2020 was increasing in all but 5 states

Last week the pandemic also unfortunately set records. Deaths due to COVID-19 in the United States crossed 150,000 on July 29 — 189 days since the first case in the U.S. We ended the week with a 7-day rolling average of 65,171 new cases per day nationwide as of Thursday, July 30. Meanwhile, the majority of the country is living in a hotspot. In that area the U.S. also crossed a threshold last week, hitting the highest number of hotspot states — 40 accounting for 80.8% of the US population – on Sunday, July 26.

As the pandemic continued to spread, the first schools started to reopen and others in the South and Midwest prepared for in-the-classroom education to start in August — even in some of these hotspot states. We compiled what is known and unknown about the risk of children transmitting and becoming infected with the novel coronavirus as schools prepare for fall in our new analysis.

Here are last week’s coronavirus stats from KFF’s tracking resources:

Global Cases and Deaths: Total cases worldwide reached 17.3 million on July 30 – with an increase of approximately 1.8 million new confirmed cases since July 23. There were also approximately 39,700 new confirmed deaths worldwide between July 23 and July 30, bringing the total to 673,200 confirmed deaths.

U.S. Cases and Deaths: Total confirmed cases in the U.S. passed 4.4 million last week. There was an approximate increase of 456,199 confirmed cases between July 23 and July 30. Approximately 7,625 confirmed deaths in the past week brought the total to 152,055 confirmed deaths in the U.S.

  • Data Reporting Status: 47 states are reporting COVID-19 data in long-term care facilities, 4 states are not reporting
  • Long-term care facilities with known cases: 14,071 (across 44 states)
  • Cases in long-term care facilities: 336,824 (across 43 states)
  • Deaths in long-term care facilities: 62,925 (in 43 states)
  • Long-term care facility cases as a share of total state cases: 9% (across 43 states)
  • Long-term care facility deaths as a share of total state deaths: 44% (across 43 states)

State Social Distancing Actions that went in effect 7/24 to 7/30 (includes Washington D.C.):

  • Face Mask Requirements
    • New requirements: No states
    • Enhanced requirements: MD, MS
  • Social Distancing Measures
    • Extended: AL, DE, SC, UT, IL, IA, MA, WA
    • Paused: MD
    • Rolled back: NV
    • New restrictions: KY, DC, MS

THE LATEST KFF COVID-19 RESOURCES:

  • What Do We Know About Children and Coronavirus Transmission? (News Release, Issue Brief)
  • KFF Health Tracking Poll – July 2020: Coronavirus and the 2020 Election (Poll Findings)
  • Growth in Medicaid MCO Enrollment during the COVID-19 Pandemic (Data Note)
  • Analysis of Recent National Trends in Medicaid and CHIP Enrollment (Issue Brief)
  • Updated: COVID-19 Coronavirus Tracker – Updated as of July 29 (Interactive)
  • Updated: Medicaid Emergency Authority Tracker: Approved State Actions to Address COVID-19 (Interactive)
  • Updated: State Data and Policy Actions to Address Coronavirus (Issue Brief)
  • COVID-19 Pandemic Not Seasonal But ‘One Big Wave,’ WHO Says, Urging More Measures To Mitigate Spread As Some Reopened Countries Witness Rise In Cases (KFF Daily Global Health Policy Report)

THE LATEST KHN COVID-19 STORIES:

·    The Color of COVID: Will Vaccine Trials Reflect America’s Diversity? (KHN, Los Angeles Times)

·    Analysis: When Is a Coronavirus Test Not a Coronavirus Test? (KHN, New York Times)

·    Public Health Experts Fear a Hasty FDA Signoff on Vaccine (KHN, Huffington Post)

·    In Texas, More People Are Losing Their Health Insurance as COVID Cases Climb (KHN, NPR)

·    Where Mask-Wearing Isn’t Gospel: Colorado Churches Grapple With Reopening (KHN, NBC News)

·    Lost on the Frontline (KHN, The Guardian)

·    Dental and Doctors’ Offices Still Struggling with COVID Job Loss (KHN)

·    The COVID-19 Downturn Triggers Jump in Medicaid Enrollment (KHN)

·    Last Thing Patients Need During Pandemic: Being Last to Know a Doctor Left Network (KHN)

·    ‘It’s About Love and Solidarity’: Mutual Aid Unites NYC Neighbors Facing COVID (KHN, NPR)

Key Questions About Nursing Home Regulation and Oversight in the Wake of COVID-19

Authors: MaryBeth Musumeci and Priya Chidambaram
Published: Aug 3, 2020

Issue Brief

Key Takeaways

The COVID-19 pandemic has led to renewed interest among policymakers, the media, residents, and their families in nursing home regulation and oversight, as residents and staff are at increased risk of infection due to the highly transmissible nature of the coronavirus, the congregate nature of facility settings, and the close contact that many workers have with patients. Certification of nursing home compliance with federal Medicare and/or Medicaid requirements generally is performed by states through regular inspections known as surveys. Federal regulations issued in 2016 require facilities to have an infection control and prevention program and a written emergency preparedness plan. This issue brief answers key questions about nursing home oversight and explains how federal policy has changed in light of COVID-19. Key findings include:

  • Infection control deficiencies were widespread and persistent in nursing homes prior to the COVID-19 pandemic, according to a May 2020 GAO report.
  • Despite widespread issues found in more comprehensive surveys before the pandemic, preliminary reports of targeted nursing home surveys focused on infection control and immediate jeopardy since March 4, 2020 reveal that only a small share have deficiencies.  However, the pandemic has brought renewed attention to nursing home quality issues. 
  • While the pandemic has led to new federal guidance, funding, and reporting requirements, state survey agencies and nursing homes each may face issues related to funding, capacity, and data as the pandemic continues.

Introduction

There has been sustained attention on nursing homes in the wake of COVID-19, from the initial widespread outbreak at a facility in Washington State to the disproportionate number of cases and deaths among residents and staff nationally throughout the pandemic. Nursing home residents include 1.2 million seniors and nonelderly people with disabilities living in over 15,000 facilities. These residents and the 3 million people who work in skilled nursing or residential care facilities are at increased risk of infection due to the highly transmissible nature of the coronavirus, combined with the congregate nature of facility settings and the close contact that many workers have with patients. If infected, many residents are at increased risk of adverse health outcomes and death from COVID-19, due to old age and/or underlying chronic health conditions. Over 40% of all COVID-19 deaths have been residents or staff of long-term care facilities, with even higher numbers in some states. At the pandemic’s outset, nursing home oversight and response was concentrated at the state level, which led to different protocols across states and facilities, with little federal involvement and substantial shortages of personal protective equipment and coronavirus tests.

As a result of the pandemic’s impact, policymakers, residents, staff, and others have raised questions about whether there has been sufficient federal and state oversight of and guidance for nursing homes, and CMS has released a series of guidance and other policy actions. The Social Security Act authorizes the Health and Human Services (HHS) Secretary to establish requirements relating to nursing home residents’ health, safety and well-being as conditions for facilities to receive payment from the Medicare and Medicaid programs. Nursing homes can be certified as Medicare skilled nursing facilities (SNFs)1  and/or Medicaid nursing facilities (NFs).2  Medicare is the primary payer for about 12 percent of nursing home residents, with coverage limited to short-term stays for skilled nursing care or rehabilitation. Medicaid is the primary payer for 62 percent of nursing home residents, covering both short-term skilled nursing care and rehabilitation, as well as long-term care. This brief answers key questions about nursing home oversight and explains how federal policy has changed in light of COVID-19.

1.  How are the federal requirements for nursing home oversight enforced?

Certification of nursing home compliance with federal Medicare and/or Medicaid requirements generally is performed by states through regular inspections known as surveys.3  States receive 75% federal matching funds for Medicaid nursing facility survey and certification activities,4  while Medicare SNF survey and certification activities are funded by a discretionary appropriation. Appendix 1 explains the survey process. States also must investigate complaints of facility violations of federal requirements5  and allegations of abuse, neglect, and misappropriation of resident property by nurse aides or other facility service providers6  and conduct periodic educational programs for facility staff and residents about current regulations, policies, and procedures.7 

The penalties for facilities found to be out of compliance with federal requirements vary depending on whether the deficiency is determined to immediately jeopardize residents’ health or safety.8  For deficiencies that result in immediate jeopardy, a facility is subject to the appointment of temporary management to oversee operations while deficiencies are corrected or termination from the Medicare and/or Medicaid programs with the safe and orderly transition of residents to another facility or community setting.9  However, a facility may continue to receive Medicare and/or Medicaid payments for up to six months after a deficiency finding, if the state finds that this alternative is more appropriate than program termination. In these instances, the facility must agree to repay Medicare funds, and the state must agree to repay federal Medicaid funds, if corrective action is not taken according to a Secretary-approved plan and timetable. For deficiencies that do not result in immediate jeopardy, a facility may be allowed up to six months to correct deficiencies. A facility that does not come into substantial compliance within three months is subject to denial of Medicare and/or Medicaid payment for all individuals admitted after the deficiency finding date. A facility that is not in substantial compliance within six months is subject to Medicare program termination and discontinuance of Medicaid federal financial participation.

Civil money penalties (CMPs) can be imposed for the number of days a facility is not in substantial compliance or for each instance that a facility is not in substantial compliance.10  CMPs can range from $6,525 to $21,393 for deficiencies constituting immediate jeopardy, and from $107 to $6,417 for deficiencies that do not constitute immediate jeopardy but either caused actual harm or did not cause actual harm but have the potential for more than minimal harm. Per instance CMPs range from $2,140 to $21,393. A portion of CMP funds collected are returned to states and can be used for activities that protect or improve care quality or resident quality of life as approved by CMS, such as supporting and protecting residents during facility closures, relocating residents, supporting resident and family councils and other consumer involvement, facility improvement initiatives such as staff and surveyor training or technical assistance for quality assurance and performance improvement programs, or developing and maintaining temporary manager capability such as recruitment, training, or system infrastructure expenses.

Additional remedies apply to facilities with patterns of deficiencies over time. A facility that is found to provide substandard care quality on three consecutive standard surveys is subject to denial of Medicare and Medicaid payments for all new admissions or entirely and is subject to state monitoring until the facility demonstrates that it has regained and will remain in substantial compliance.11  CMS and/or the state also may direct staff in-service training for facilities with patterns of deficiencies.

2.  How have the federal nursing home requirements evolved over time?

Prior to the late 1960s, nursing homes were “essentially unregulated in most states,” and care quality was generally considered to be poor.12  The creation of Medicare and Medicaid in 1965 led to greater federal involvement in nursing home regulation with the establishment of federal criteria to certify facilities. However, concern about care quality and inadequate enforcement continued through the 1970s and 1980s, leading to the appointment of an Institute of Medicine (IOM) committee to recommend changes. The IOM recommendations included incorporating resident assessment, care quality, quality of life, and residents’ rights in federal conditions of participation and making both regulatory requirements and the survey and certification process more “resident-centered and outcome-oriented,” with a shift in emphasis “from facility capability to facility performance.”13  The IOM report also recommended increased federal funding and oversight of state survey agencies and establishing intermediate sanctions short of program termination and facility closure to enforce compliance. Appendix 2 contains additional background about the evolution of federal nursing home oversight.

The IOM recommendations led to changes adopted in the 1987 Nursing Home Reform Act, which established Medicare SNF and Medicaid NF requirements in three main areas: service provision, residents’ rights, and administration and other matters (Appendix Table 1). The Nursing Home Reform Act strengthened federal standards, inspections, and enforcement provisions; merged Medicare and Medicaid standards; required comprehensive resident assessments; set minimal licensed nursing staff requirements; and required inspections to focus on care outcomes.14  Service provision requirements are related to quality of life, care plans, resident assessment, services and activities, nurse aide training, physician supervision and clinical records, social services, and nurse staffing information.15  Facilities must protect and promote specific residents’ rights including free choice, freedom from restraints, privacy, confidentiality, accommodation of needs, grievances, participation in resident and family groups and other activities, examination of survey results, and refusal of certain transfers. Additional requirements govern the use of psychopharmacologic drugs, advance directives, access and visitation, equal access to quality care, admissions, and protection of resident funds. Administration requirements include licensing and life safety code, sanitary and infection control and physical environment standards.

To help address continuing quality concerns, the 2010 Affordable Care Act (ACA) included some additional reforms. The Nursing Home Transparency and Improvement Act, adopted as part of the ACA, sought to address complex ownership, management, and financing structures that inhibited regulators’ ability to hold providers accountable for compliance with federal requirements. The ACA also incorporated the Elder Justice Act and the Patient Safety and Abuse Prevention Act, which include provisions to protect long-term care recipients from abuse and other crimes.

The 2016 nursing home regulations issued by the Obama Administration were the first comprehensive update in 25 years. The original consolidated Medicare and Medicaid facility participation requirements were issued in 1989, following the Nursing Home Reform Act, and revised in 1991. The 2016 regulations sought to account for ensuing innovations in resident care and quality assessment and an increasingly diverse and clinically complex resident population.16  New requirements added by the 2016 regulations most relevant to issues raised by COVID-19 include those related to infection control, facility assessment, and emergency preparedness (Box 1). The 2016 regulations also revised provisions related to resident rights, adopting a greater emphasis on person-centered care; reporting of abuse and neglect; and transfer and discharge rights. Additionally, the 2016 regulations added a new section on behavioral health services, adopted a competency requirement for determining staffing sufficiency and new staff training program requirements, and implemented ACA requirements for facility quality assurance and performance improvement programs17  and compliance and ethics programs.18  The regulations were implemented in three phases from 2016 through 2019.

Box 1: 2016 Nursing Facility Regulations Relevant to COVID-19 Pandemic

The 2016 regulations require facilities to establish an infection prevention and control program to provide a safe, sanitary, and comfortable environment and help prevent the development and transmission of communicable diseases. The program must include a system for preventing, identifying, reporting, investigating, and controlling infections and communicable diseases for all residents, staff, volunteers, visitors, and other individuals providing services under a facility contract. The program is based on the facility assessment (described below) and must follow “accepted national standards.” The program must include written standards, policies, and procedures for a surveillance system to identify possible communicable diseases before they can spread to others in the facility; when and to whom possible incidents should be reported; standard and transmission-based precautions to prevent infection spread; when and how isolation should be used for a resident; the circumstances under which the facility must prohibit employees with a communicable disease from direct contact with residents or their food; and hand hygiene procedures. The facility also must designate at least one infection preventionist responsible for the program. The program must be reviewed annually, and the facility must provide staff training on the program.

Facilities must conduct an assessment to determine what resources are necessary to care competently for residents during both regular day-to-day operations and emergencies. The facility assessment must consider the resident population; necessary staff competencies; the physical environment, equipment and services necessary to provide care; any ethnic cultural or religious factors that may affect care; facility resources such as buildings and equipment; services such as physical therapy, pharmacy, and specialized rehabilitation; personnel; contracts with third parties; and health information technology. The assessment must be updated as needed and at least annually.

Facilities must have a written emergency preparedness plan. This provision was issued in a separate 2016 provider emergency preparedness regulation.19  The plan must be reviewed and updated at least annually. Facilities must train all employees in emergency procedures when they begin to work in facility and periodically review procedures with existing staff. Facilities also must have an emergency preparedness communication plan including a means of providing information about the general condition and location of residents under the facility’s care and a method for sharing appropriate information from the emergency plan with residents and their families.

In July 2019, the Trump Administration proposed a number of changes to the 2016 regulations, which it said would increase provider flexibility and reduce regulatory burden. The proposed changes, which are still pending, include:

  • Removing the existing requirement that the infection preventionist work at the facility at least part-time or have frequent contact with infection prevention and control program staff and instead requiring that the infection preventionist has “sufficient time” at facility to meet program objectives; and
  • Modifying current provisions governing the use of psychotropic medications, the grievance process, the timeframe for retaining staffing data, the quality assurance and performance improvement program, and the compliance and ethics program, among other areas.

Also in July 2019, the Trump Administration issued a final regulation that eliminated the existing ban on pre-dispute arbitration agreements.

3.  What was the state of nursing home quality before and during COVID-19?

Infection control deficiencies were widespread and persistent in nursing homes prior to the COVID-19 pandemic, according to a May 2020 GAO report.20  The GAO found that “infection prevention and control deficiencies were the most common type of deficiency cited in surveyed nursing homes, with most nursing homes having an infection prevention and control deficiency cited in one or more years from 2013 through 2017 (13,299 nursing homes, or 82 percent of all surveyed homes).” All states had facilities with infection prevention and control deficiencies cited in multiple consecutive years, indicating “persistent problems.” These deficiencies include staff failing to regularly use proper hand hygiene or failing to implement preventive measures to control infection spread during an outbreak, such as isolating sick residents and using masks and other personal protective equipment (PPE). GAO also found that nearly all infection prevention and control deficiencies were classified by surveyors as not severe, meaning the surveyor determined that residents were not harmed, and implemented enforcement actions for these deficiencies were typically rare. GAO plans future reports to examine CMS guidance and oversight of infection control more broadly as well as CMS’s response to COVID-19.

In regular surveys conducted from January 2019 through March 2020, nearly half of facilities received an infection control deficiency (Figure 1). Most facilities (80%) received a deficiency related to resident quality of life or care, and 37% received an abuse/neglect/exploitation deficiency (Figure 1). Just under 20% of facilities received a CMP, with the average amount just over $25,000 (Figure 1). During this same time period, 62% of facilities had substantiated complaints regarding violations of federal requirements, and 39% of facilities had incidents with alleged or suspected resident abuse, neglect, or misappropriation of property (Figure 1).

Figure 1: Share of Nursing Homes with Provider Incidents, Complaints, Civil Monetary Penalties, and Deficiencies, Jan. 2019 – March 2020

In response to COVID-19, CMS suspended state survey activities in March 2020, except for those related to infection control and immediate jeopardy. Nearly all nursing homes have received these targeted surveys since March 4, 2020, with preliminary inspection reports revealing only a small share with deficiencies (Figure 2). Just 13% of the nearly 6,000 facilities surveyed between March 4 and May 30, 2020 were cited as deficient in meeting any federal requirements. Though nursing homes across the country have experienced high rates of COVID-19 cases and deaths, the data does not point to quality deficiencies as a reason for this occurrence.

Figure 2: Nearly all Nursing Homes Have Received a Targeted Inspection Since March 4, 2020, With Preliminary Inspection Reports Revealing Only A Small Share With Deficiencies

4.  How has nursing home oversight changed in light of COVID-19?

As the number of COVID-19 cases and deaths in nursing homes increased, CMS has issued guidance about how facilities should respond to the pandemic (Figure 3). A February 2020 informational bulletin advised health care facilities to review the Centers for Disease Control (CDC) COVID-19 advisory and recommendations as well as their own infection control policies. As noted above, CMS suspended state survey activities in March 2020, except for those related to infection control and immediate jeopardy. That same month, CMS infection control and prevention guidance advised facilities to screen visitors and staff and about when to transfer residents to and accept those discharged from hospitals. CMS also required facilities to restrict all visitors except for compassionate care circumstances and cancel all communal dining and group activities, released guidance allowing facilities to perform COVID-19 tests, and issued a number of Section 1135 blanket waivers to help facilities’ emergency response. In April 2020, CMS issued guidance directing facilities to screen all staff, residents, and visitors for symptoms, ensure staff use PPE “to the extent available,” and designate separate staff and facilities or units for COVID-19 patients.

Figure 3: Key CMS Nursing Home COVID-19 Guidance and Actions

In April 2020, CMS announced the formation of an independent commission to conduct a comprehensive assessment of facility response to COVID-19. The commission is expected to make recommendations to protect residents from COVID-19 and improve care delivery responsiveness; strengthen efforts to rapidly identify and mitigate infectious disease transmission in nursing homes; and enhance strategies to improve compliance with infection control policies. The commission also is charged with identifying approaches to better use data to enable federal, state, and local entities to address the current spread of COVID-19 within facilities, analyze the impact of efforts to stop or contain the virus within facilities, and identify best practices to address COVID-19 that CMS or states could adopt. Commission members are to include residents, families, resident/patient advocates, industry experts, clinicians, medical ethicists, administrators, academics, infection control and prevention professionals, state and local authorities, and other experts. Twenty-five Commission members were announced in June 2020, and a final report is expected in fall 2020.

As of May 2020, facilities must report COVID-19 data to the CDC and provide information to residents and their families. Prior to this interim final rule, facilities were not required to report infectious disease information to the CDC, though they typically report to state and/or local health departments. The lack of centralized data contributed to difficulty in tracking disease spread and coordinating dissemination of personal protective equipment and testing supplies. The new rule requires weekly reporting of suspected and confirmed infections among residents and staff including residents previously treated for COVID-19; total deaths and COVID-19 deaths among residents and staff; PPE and hand hygiene supplies in the facility; ventilator capacity and supplies in the facility; resident beds and census; access to COVID-19 testing while a resident is in the facility; staffing shortages; and other information specified by the Secretary.

CMS is publicly reporting the data, and recently announced additional actions based on the data. In July 2020, CMS sent “Task Force Strike Teams” of clinicians and public health officials to 18 nursing homes in six states experiencing an increase in COVID-19 cases. The Teams are focused on determining immediate actions and needed resources to reduce virus spread. In late July 2020, CMS also announced that it would send a weekly list of nursing homes with an increase in cases to states.

The new rule also requires facilities to inform residents, their representatives, and families of confirmed or suspected COVID-19 cases among residents and staff by 5 pm the next calendar day following a single confirmed case or three or more residents or staff with new onset of respiratory symptoms within 72 hours of each other. Facilities also must provide cumulative updates at least weekly by 5 pm the next calendar day following each subsequent occurrence of confirmed infection or whenever three or more residents or staff with new onset of respiratory symptoms occur within 72 hours of each other. Facilities must include information on mitigating actions implemented to prevent or reduce the risk of transmission including whether normal operations will be altered such as restrictions or limitations on visits or group activities. Facilities cannot release personally identifiable information and can communicate through paper notices, a listserv, a website post or recorded phone messages.

In May 2020, CMS issued nursing home reopening recommendations and an informational toolkit with best practices for states to mitigate COVID-19 in nursing homes. The reopening guidance sets out criteria for relaxing restrictions using a phased approach and mitigating the risk of resurgence, including case status in the community, case status in the facility, adequate staffing, access to adequate testing, universal source control (masks, social distancing, and hand washing for visitors), adequate access to PPE for staff, and local hospital capacity. The guidance also includes considerations for allowing visitors and services and for restarting routine state survey activities in each phase. Additionally, quality improvement organizations (QIOs) under contract with CMS are providing technical assistance with a focus on about 3,000 low performing facilities with a history of infection control issues to help identify problems, create and implement an action plan, and monitor compliance. For example, QIOs train staff on proper PPE use, appropriate resident cohorting, and safe resident transfers. States also can request QIO technical assistance targeted to facilities that have experienced an outbreak.

In June 2020, CMS issued additional guidance to states on COVID-19 survey activities and enhanced enforcement for infection control deficiencies. CMS noted that focused infection control surveys pursuant to the March 2020 guidance had been completed in 53 percent of facilities, with wide state variation. As a result, states that have not completed all of these surveys by July 31, 2020 must submit a corrective action plan outlining their strategy to complete these surveys within 30 days. If all surveys still are not complete after the 30-day period, states’ CARES Act FY 2021 allocation may be reduced by up to 10%. Subsequent 30-day extensions could result in additional reductions up to 5%, with funding redistributed to states that have completed their surveys. The CARES Act provided $100 million for nursing home inspections focused on those with COVID-19 community spread from FY 2021 through FY 2023, $81 million of which will be available to state survey agencies. This represents a 6% annual increase in the nursing home survey and certification budget, which had remained at $397 million annually since October 2014. CARES funds may be used for state surveys, strike teams, enhanced surveillance or monitoring of nursing homes, or other state-specific interventions. The June 2020 guidance also establishes enhanced enforcement remedies for infection control deficiencies including directed plans of correction, discretionary denial of payment for new admissions, and CMPs.

The June 2020 guidance also announced three additional survey requirements: (1) states must perform on-site surveys of nursing homes with previous COVID-19 outbreaks by July 1, 2020; (2) states must perform on-site surveys within three to five days of identification of any nursing homes with three or more new suspected or confirmed cases since the last CDC COVID-19 report or one confirmed resident case in a facility that previously was COVID-free; and (3) starting in FY 2021, states must perform annual focused infection control surveys of 20 percent of facilities. States could forfeit 5% of their annual CARES Act allocation for failing to perform these activities.

The June 2020 guidance also authorizes states to expand survey activities to include more routine surveys once a state has entered phase 3 of the nursing home reopening guidance or earlier at state discretion. The expanded activities include complaint investigations that are not immediate jeopardy, revisit surveys to any facility with a removed immediate jeopardy finding but that is still out of compliance, special focus facility and special focus facility candidate recertification surveys, and nursing home and intermediate care facility for individuals with intellectual and developmental disabilities recertification surveys greater than 15 months. When expanding survey activities, states should prioritize facilities with a history or allegations of noncompliance regarding abuse or neglect, infection control, violations of transfer or discharge requirements, insufficient staffing or competency, or other care quality issues such as falls or pressure ulcers.

In late July 2020, CMS began requiring, rather than recommending, that all staff be tested weekly in nursing homes in states with a 5% or greater positivity rate. HHS also is distributing rapid diagnostic tests to nursing homes in COVID-19 hotspots through a one-time procurement to facilitate on-site testing of residents and staff. CMS and the CDC are offering COVID-19 training to nursing homes, which includes cohorting strategies and using telehealth to mitigate virus spread.

5.  What are the key challenges for nursing homes as the pandemic continues?

As the pandemic continues, state survey agencies may face issues related to funding, capacity, and data. CMS will withhold CARES funds from state survey agencies that do not timely complete inspections, but these penalties may be too blunt for agencies whose lack of compliance stems from insufficient funding in the first place. As noted above, prior to the new CARES Act funds, the survey and certification budget had remained flat since 2014. It remains to be seen whether these new funds will be sufficient for state agencies to perform regular surveys as well as increased oversight in the foreseeable future resulting from the pandemic. While facilities are now reporting COVID-19 cases and deaths to CMS, these data are not cumulative prior to May 8, 2020, and it will be important for both state survey agencies and CMS to continue to monitor data and adjust policy guidance and facility oversight as needed.

Nursing facilities also face a number of challenges in their continued pandemic response. Nearly $5 billion in federal provider relief funds has been allocated to nursing facilities to cover health care related expenses or lost revenues attributed to coronavirus. On July 22, 2020, HHS announced that an additional $5 billion from the provider relief fund is being allocated to Medicare-certified long-term care facilities and state veterans homes. These funds may be used to hire additional staff, implement infection control “mentorship” programs with subject matter experts, increase testing, and provide additional services, such as technology so residents can connect with their families if they are not able to visit. As of June 28, 2020, nearly one in three nursing homes nationally report a shortage of staff and/or PPE. Despite federal legislation generally requiring insurers to cover coronavirus testing without cost-sharing, recent federal guidance concludes that insurers do not have to cover coronavirus “testing conducted to screen for general workplace health and safety (such as employee “return to work” programs).” This leaves open the question about who will pay for regular tests needed for facility staff to safely work during the pandemic. It also remains to be seen whether facilities will be able to maintain adequate staffing levels as the pandemic continues. CMS has lifted its emergency waiver of the staffing data submission requirement, and facilities must submit regular staffing data for April through June 2020 by August 14, 2020. Facilities also may be under financial strain due to lower occupancy levels as a result of the pandemic.

Conclusion

While the data and experience to date do not show a direct link between nursing home quality and COVID-19 cases, the pandemic has brought renewed attention to issues of nursing home quality and oversight at the federal and state levels. Nursing home quality concerns have existed for decades. With the current focus on challenges facing nursing homes and state survey agencies as they respond to the pandemic, policymakers may revisit whether federal Medicare and Medicaid requirements should be adjusted to improve oversight and whether additional funding is needed to support providers and agencies to ensure sufficient capacity and resources. These issues are likely to continue to be the subject of policy discussion and debate as long-term care coronavirus cases, particularly in “hotspot states” with wider community transmission continue to rise. While most nursing facilities are Medicare-certified, a small number (315 or 2%) are only Medicaid-certified and therefore appear ineligible for a share of the additional provider relief funds announced on July 22.

More broadly, seniors and people with disabilities who receive long-term services and supports in other settings, such as assisted living facilities, intermediate care facilities for people with intellectual/developmental disabilities, institutions for “mental disease,” and group homes, also are at increased risk of serious illness if infected with coronavirus based on older age and/or chronic health conditions. Unlike nursing homes, other long-term care congregate settings are primarily regulated by states, leading to greater variation in quality protections and lack of standardized reporting about coronavirus cases, deaths, staffing, supplies, and other data necessary to understand and respond to the pandemic and understand its full impact on all people who receive long-term care services and the staff who provide them.

Appendix

Appendix 1: Nursing Home Survey and Certification Process

A facility is subject to a standard survey, without advance notice, at least once every 15 months.21  If found to have provided substandard care quality,22  a facility is subject to an extended survey within two weeks of the standard survey.23  In addition, states may conduct special surveys within two months of any change in facility ownership, administration, management, or nursing director to determine whether care quality has declined as a result of the change.24  The Secretary also can conduct special surveys when the Secretary has reason to question facility compliance with federal requirements.25  Standard surveys include a case-mix stratified sample of residents.26  Extended surveys review and identify facility policies and procedures that produced substandard care quality, expand the sample size of resident assessments reviewed, and review staffing, in-service training, and if appropriate, consultant contracts.27 

Facility surveys are conducted by a multi-disciplinary team using a protocol developed by the Secretary.28  The survey team must include a registered nurse and may include physicians, physician assistants, nurse practitioners, physical, speech, or occupational therapists, dieticians, sanitarians, engineers, licensed practical nurses, social workers, or other professionals.29  The survey team cannot include anyone who has served as staff or a consultant to the facility in the prior two years or who has a personal or familial financial interest in the facility.30 

Survey and certification information, including statements of deficiencies, must be made publicly available by states and the Secretary within 14 days after the facility is notified.31  States submit this information, including any enforcement actions, to the Secretary on the same day that the facility is notified, and the Secretary uses this information to update the federal Nursing Home Compare website at least quarterly.32  The website must include facility staffing data, including resident census data and hours of care provided per resident per day and information on staffing turnover and tenure; links to state survey and certification programs, inspection reports, and facility plans of correction or report responses; information on how to file a complaint with the state survey and certification program and the state long-term-care ombuds program; summary information on the number, type, severity, and outcome of substantiated complaints; the number of adjudicated instances of criminal violations by the facility or its employees committed within the facility regarding abuse, neglect, exploitation, criminal sexual abuse or other violations resulting in serious bodily injury; and CMPs levied against the facility, its employees, contractors, and other agents. States also must notify the state long-term care ombudsman of any findings of noncompliance or adverse actions taken against facilities.

Appendix 2: History of Federal Nursing Home Requirements

After the creation of the Medicare and Medicaid programs, it soon became clear that “[s]trict enforcement of federal standards would have barred most nursing homes from participating in the Medicare program”33  in the mid-1960s, and certification of nursing homes to participate in Medicaid was left to the states.34  After increased congressional and media attention to substandard facility conditions and lax government oversight, revised federal regulations certifying facilities to participate in Medicare and Medicaid were established in 1974. Continued concern about care quality and inadequate enforcement led to new proposed federal regulations issued in 1980 by the Carter Administration. However, the nursing home industry objected to the new regulations’ projected costs, and the regulations were rescinded by the Reagan Administration. In turn, the Reagan Administration’s subsequent proposal, which would have deleted or relaxed many existing standards, was set aside after opposition from consumer advocates, states, Congress, and providers. The impasse led to the appointment of an Institute of Medicine (IOM) committee to recommend changes.

The 1986 IOM committee report contained numerous recommendations to enhance nursing home care quality and resident quality of life by improving nursing home regulation.35  While the IOM committee credited the 1974 regulations with contributing to better care quality, it noted “substantial room for improvement” due to weaknesses in the regulations and uneven administration and enforcement by states.36  At the time of the IOM study, “there [was] broad consensus that government regulation of nursing homes, as it now functions, is not satisfactory because it allows too many substandard nursing homes to continue in operation.” Concerns included “neglect and abuse leading to premature death, permanent injury, increased disability, and unnecessary fear and suffering on the part of residents,” poor quality of life and lack of autonomy, and poor quality medical and nursing care.37  The IOM committee emphasized that government regulation of nursing homes is warranted due to residents’ “large array of physical, functional, and mental disabilities,” limited opportunities for transfer among facilities, and inability to pay for care out-of-pocket.

Although the IOM recommendations led to changes adopted in the 1987 Nursing Home Reform Act, concerns about poor care quality and inadequate enforcement of federal standards continued. Between 1997 and 2010, the Government Accountability Office (GAO) issued more than 20 reports finding substandard care in many nursing homes; understatement of serious deficiencies by state surveyors; unenforced sanctions for harming residents; facilities cycling in and out of compliance; and inconsistent and ineffective federal oversight.38  During the same period, the HHS Office of Inspector General issued reports critical of facility compliance and state and federal enforcement.39  Recurring concerns include staffing levels, abuse and neglect, unmet resident needs, care quality, staff training and competency, and lack of integration between medical care and other services.40 

Table 1: Summary of Federal Requirements for Medicare and Medicaid Certified Nursing Homes
AreaDescriptionCitation
Requirements related to provision of services
Quality of LifeCare for residents in a manner and environment that promotes, maintains, or enhances each resident’s quality of life.

Maintain a quality assessment and assurance committee to identify issues and develop and implement plans of action to correct identified deficiencies.

42 U.S.C. § 1395i-3 (b)(1);

42 U.S.C. § 1396r (b)(1);

42 C.F.R. § 483.24.

Scope of services and activities under care planProvide services to attain or maintain the highest practicable physical, mental, and psychosocial well-being of each resident in accordance with a written care plan that describes the resident’s medical, nursing, and psychosocial needs and how these needs will be met.

Care plan is initially prepared, with the participation to extent practicable of the resident or resident’s family or legal representative, by a team that includes the resident’s attending physician and a registered professional nurse with responsibility for the resident; and is periodically reviewed and revised.

42 U.S.C. § 1395i-3 (b)(2);

42 U.S.C. § 1396r (b)(2);

42 C.F.R. § 483.21.

Residents’ assessmentsConduct a comprehensive, accurate, standardized, reproducible assessment of each resident’s functional capacity, which describes the resident’s capability to perform daily life functions and significant impairments in functional capacity. Assessment must be based on the uniform minimum data set specified by the Secretary, use an instrument specified by the states, include the identification of medical problems, and be conducted or coordinated by a registered professional nurse.

Assessments must be conducted promptly and no later than 14 days after admission, promptly after any change in the resident’s physical or mental condition, and at least once a year. Examine each resident at least once every 3 months and revise the assessment as appropriate.

42 U.S.C. § 1395i-3 (b)(3);

42 U.S.C. § 1396r (b)(3);

42 C.F.R. § 483.20.

Provision of services and activitiesTo the extent needed to fulfill care plans, provide or arrange for nursing and specialized rehabilitative services and medically related social services to attain or maintain each resident’s highest practicable physical, mental and psychosocial well-being; pharmaceutical services; dietary services that meet each resident’s daily nutritional and special dietary needs; an ongoing activity program to meet each resident’s interests and physical, mental and psychosocial well-being; routine dental services and emergency dental services; and treatment and services required by residents who have mental illness or intellectual disabilities not otherwise provided or arranged for by the state.

Provide 24-hour licensed nursing services sufficient to meet resident needs, including registered professional nurse services at least 8 consecutive hours a day, 7 days a week, except that the Secretary may waive this requirement for certain rural SNFs, and states may waive this requirement for NFs that demonstrate their inability, despite diligent efforts (including offering wage at the community prevailing rate), to recruit appropriate personnel and if the state determines resident health and safety will not be endangered and a registered professional nurse or physician is obligated to respond immediately to phone calls from facility.

42 U.S.C. § 1395i-3 (b)(4);

42 U.S.C. § 1396r (b)(4);

42 C.F.R. § § 483.25, 483.30, 483.35, 483.40, 483.45, 483.50, 483.55, 483.60, 483.65.

Required training of nurse aidesAfter 4 months, full-time nurse aides must have completed a training and competency evaluation program. Provide regular performance reviews and in-service education to assure nurse aide competency to provide services, including services to individuals with cognitive impairments.42 U.S.C. § 1395i-3 (b)(5);

42 U.S. C. § 1396r (b)(5).

Physician supervision and clinical recordsRequire that every resident’s medical care be provided under physician supervision (or for NFs, supervision of nurse practitioner, clinical nurse specialist, or physician assistant), provide for having a physician available to furnish necessary medical care in case of emergency and maintain clinical records on all residents which include care plans and resident assessments.42 U.S.C. § 1395i-3 (b)(6);

42 U.S.C. § 1396r (b)(6).

Required social servicesFacilities with more than 120 beds must have at least one full-time social worker.42 U.S.C. § 1395i-3 (b)(7);

42 U.S.C. § 1396r (b)(7).

Information on nurse staffingPost daily and make available to the public on request the current number of licensed and unlicensed nursing staff directly responsible for resident care in the facility for each shift.42 U.S.C. § 1395i-3 (b)(8);

42 U.S.C. § 1396r (b)(8).

Requirements related to residents’ rights
General rightsProtect and promote each resident’s rights including the rights to free choice (including choice of personal attending physician, to be fully informed in advance about care and treatment and any changes that may affect resident well-being and to participate in care planning and treatment); freedom from restraints (including physical or mental abuse, corporal punishment, involuntary seclusion, and any physical or chemical restraints imposed for discipline or convenience and not required to treat medical symptoms; restraints only may be imposed to ensure physical safety of resident or other residents and only upon written physician order that specifies duration and circumstances used, except in emergency circumstances specified by Secretary until such order could be reasonably obtained); privacy; confidentiality; reasonable accommodation of individual needs and preferences; grievances; participation in resident and family groups and social, religious, and community activities; to examine survey results, and to refuse transfer to another room if the purpose is to relocate from a part of the facility that is a SNF to a part of the facility that is not a SNF.

Provide notice of these rights.

Psychopharmacologic drugs may be administered only on physician orders and only as part of care plan designed to eliminate or modify symptoms for which drugs are prescribed and only if at least annually an independent external consultant reviews the appropriateness of the drug plan of each resident receiving such drugs.

42 U.S.C. § 1395i-3 (c)(1);

42 U.S.C. § 1396r (c)(1);

42 C.F.R. § §483.10, 483.12.

Transfer and discharge rightsCannot transfer or discharge resident unless necessary to meet the resident’s welfare, appropriate because resident’s health has improved, safety or health of other individuals in the facility would endangered, resident has failed to pay for stay, or facility ceases to operate.42 U.S.C. § 1395i-3 (c)(2);

42 U.S.C. § 1396r (c)(2);

42 C.F.R. § 483.15.

Access and visitation rightsPermit immediate access to any resident by any representative of the Secretary or the state, ombuds or resident’s individual physician; permit immediate access subject to resident’s right to deny or withdraw consent at any time to immediate family or other relatives; permit immediate access subject to reasonable restrictions and resident’s right to deny or withdraw consent at any time to others who are visiting with resident’s consent; permit reasonable access by any entity or individual that provides health, social, legal or other services to resident subject to resident’s right to deny or withdraw consent at any time; and permit state ombuds, with resident’s permission to examine resident’s clinical records.42 U.S.C. § 1395i-3 (c)(3);

42 U.S.C. § 1396r (c)(3).

Equal access to quality careEstablish and maintain identical policies and practices regarding transfer, discharge and covered services under Medicare and Medicaid for all individuals regardless of source of payment.42 U.S.C. § 1395i-3 (c)(4);

42 U.S.C. § 1396r (c)(4)

Admissions policyNot require applicants or residents to waive their rights to Medicare or Medicaid benefits; not require oral or written assurance that such individuals are not eligible for or will not apply for Medicare or Medicaid; prominently display in facility and provide to such individuals written information about how to apply for and use Medicare and Medicaid and how to receive refunds for previous payments covered by such benefits; and not required third party guarantee of payment to facility as condition of admission or expedited admission to or continued stay in facility.42 U.S.C. § 1395i-3 (c)(5);

42 U.S.C. § 1396r (c)(5).

Protection of resident fundsNot require residents to deposit their personal funds with the facility and upon resident’s written authorization must hold, safeguard and account for such personal funds under a system established and maintained by the facility.

Deposit personal funds in excess of $100 ($50 for NFs) in an interest bearing account separate from any of facility’s operating accounts. Any other personal funds must be maintained in a non-interest bearing account or petty cash fund.

Maintain written financial records and pursue a surety bond to secure resident personal funds on deposit.

42 U.S.C. § 1395i-3 (c)(6);

42 U.S.C. § 1396r (c)(6).

Requirements relating to administration and other matters
AdministrationBe administered in a manner that enables facility to use its resources efficiently and effectively to attain or maintain each resident’s highest practicable physical, mental and psychosocial well-being and must have reports for any surveys, certifications, and complaint investigations during the preceding 3 years available for review.42 U.S.C. § 1395i-3 (d)(1);

42 U.S.C. § 1396r (d)(1); 42 C.F.R. § 483.70.

Licensing and life and safety codeBe licensed under state and local law and meet the life safety code requirements of the National Fire Protection Association Life Safety Code or state law.42 U.S.C. § 1395i-3 (d)(2);

42 U.S.C. § 1396r (d)(2);

42 C.F.R. § 483.90.

Sanitary and infection control program and physical environmentEstablish and maintain an infection control program designed to provide a safe, sanitary, and comfortable environment in which residents reside and to help prevent the development and transmission of disease and infection and be designed, constructed, equipped and maintained in manner to protect health and safety of residents, personnel, and general public42 U.S.C. § 1395i-3 (d)(3);

42 U.S.C. § 1396r (d)(3);

42 C.F.R. § 483.80.

MiscellaneousComply with all applicable federal, state and local laws and accepted professional standards.42 U.S.C. § 1395i-3 (d)(4);

42 U.S.C. § 1396r (d)(4).

Endnotes

  1. A Medicare skilled nursing facility (SNF) is an institution or distinct part that is primarily engaged in providing skilled nursing care and related services or rehabilitation services. 42 U.S.C § 1395i-3 (a). ↩︎
  2. A Medicaid nursing facility (NF) is an institution or distinct part that is primarily engaged in providing skilled nursing care and related services, rehabilitation services, or health-related care and services on a regular basis to individuals who because of their mental or physical condition require institutional care and services above the level of room and board. 42 U.S.C. § 1396r (a). In addition, SNFs and NFs cannot be primarily for the care or treatment of mental illnesses and must have a transfer agreement in effect with one or more hospitals. Id.; 42 U.S.C. § 1395i-3 (a). ↩︎
  3. The exception is state facilities, which are certified by the Secretary. 42 U.S.C § § 1395i-3 (g); 1396r (g). ↩︎
  4. 42 U.S.C. § 1396b (a)(2)(D). ↩︎
  5. 42 U.S.C. §§ 1395i-3 (g)(4); 1396r (g)(4). ↩︎
  6. States must maintain a registry of abuse, neglect, and misappropriation findings. 42 U.S.C. §§ 1395i-3 (g)(1)(C); 1396r (g)(1)(C). ↩︎
  7. 42 U.S.C. §§ 1395i-3 (g)(1)(B); 1396r (g)(1)(B). ↩︎
  8. For Medicare SNFs, states recommend penalties to be imposed by the Secretary based on survey results, and the Secretary also can independently impose penalties based on survey results or other findings. 42 U.S.C. § 1395i-3 (h). For Medicaid NFs, state law must include the specified penalties, which are imposed by states based on survey results or other findings. 42 U.S.C. § 1396r (h). ↩︎
  9. The facility must pay the temporary manager’s salary. If the immediate jeopardy is also substandard care quality, the state must notify each resident’s attending physician and the state facility administrator licensing board. 42 U.S.C. § § 1395i-3 (g)(5)(B), (C); 1396r (g)(5)(B),(C). ↩︎
  10. A CMP can be reduced in two ways, though only one penalty reduction can be applied. A CMP is reduced by 35 percent if a facility waives its right to a hearing to dispute the penalty. Or, a CMP may be reduced by 50 percent if a facility self reports and promptly corrects a deficiency, except that CMPs for repeat deficiencies within the prior year and for deficiencies found to result in a pattern of harm or widespread harm, immediately jeopardy to resident health or safety or resident death may not be reduced. 42 U.S.C. § § 1395i-3 (h)(2)(B)(ii); 1396r (h)(3)(C)(ii). ↩︎
  11. 42 U.S.C. § § 1395i-3 (g)(4); 1396r (g)(4). ↩︎
  12. Institute of Medicine 1986. Improving the Quality of Care in Nursing Homes. Washington, DC: The National Academies Press at 5. https://doi.org/10.17226/646. ↩︎
  13. Id. at 79. ↩︎
  14. KFF, Key Issues in Long-Term Services and Supports Quality (Oct 2017), https://modern.kff.org/medicaid/issue-brief/key-issues-in-long-term-services-and-supports-quality/. ↩︎
  15. Medicaid NFs are subject to additional preadmission screening and resident review (PASRR) requirements to ensure that individuals with serious mental illness or intellectual disabilities require a nursing facility level of services and whether any specialized services are required. PASRR reviews are conducted by the state mental health or developmental disability authorities upon admission and when there is a significant change in a resident’s condition. 42 U.S.C. § 1396r (e)(7). ↩︎
  16. 81 Fed. Reg. 68688 (Oct. 4, 2016), https://www.govinfo.gov/content/pkg/FR-2016-10-04/pdf/2016-23503.pdf. ↩︎
  17. 42 C.F.R. § 483.75. ↩︎
  18. 42 C.F.R. § 483.85. ↩︎
  19. 42 C.F.R. § 483.73. ↩︎
  20. U.S. Gov’t Accountability Office, Infection Control Deficiencies Were Widespread and Persistent in Nursing Homes Prior to COVID-19 Pandemic (May 20, 2020), https://www.gao.gov/assets/710/707069.pdf. ↩︎
  21. There must be a 12-month statewide average interval between standard surveys 42 U.S.C. § § 1395i-3 (g)(2)(A)(i), (iii)(I); 1396r (g)(2)(A)(i), (iii)(l). The Secretary conducts surveys of a representative sample of facilities in each state, within two months of state surveys, to validate state findings. If the Secretary finds that a state’s surveys were inadequate, the state is subject to sanctions, including a correction plan, training, and/or technical assistance for SNF survey inadequacies, and a reduction in federal matching funds for Medicaid administrative costs for a pattern of failure to identify deficiencies and training for NF survey deficiencies. 42 U.S.C. § § 1396r (g)(3)(C) 1395i-3 (g)(3)(C); 42 C.F.R. § 488.320. ↩︎
  22. Substandard care quality includes one or more deficiencies in the following areas: treating residents with dignity and respect and in a manner that promotes quality of life; providing equal access to quality care regardless of condition severity or payment source; ensuring residents can freely exercise rights; not imposing physical or chemical restraints for discipline or convenience; reasonably accommodating resident needs and preferences in receiving services; allowing married residents to share a room with spouse; allowing residents to have roommate of their choice; providing written notice of change of room or roommate; allowing residents to choose activities, schedules, health care and providers; allowing residents to make choices about aspects of facility life significant to the resident; allowing residents to participate in community activities; allowing resident and family groups; allowing family or representatives of the resident to meet in the facility with other residents’ family or representatives; and providing a safe, clean, comfortable, and homelike environment. 42 C.F.R. § 488.301. ↩︎
  23. 42 U.S.C. § § 1395i-3 (g)(2)(B); 1396r (g)(2)(B). ↩︎
  24. 42 U.S.C. § § 1395i-3 (g)(2)(A)(iii)(II); 1396r (g)(2)(A)(iii)(ll). ↩︎
  25. 42 U.S.C. § § 1395i-3 (g)(3); 1396r (g)(3). ↩︎
  26. 42 U.S.C. § § 1395i-3 (g)(2)(A)(ii); 1396r (g)(2)(A)(ii). ↩︎
  27. 42 U.S.C. § § 1395i-3 (g)(2)(B)(iii); 1396r (g)(2)(B)(iii). ↩︎
  28. The Secretary also is responsible for providing survey team training. 42 U.S.C. § § 1395i-3 (g)(2)(C), (E)(iii); 1396r (g)(2)(C) (E)(iii). ↩︎
  29. 42 C.F.R. § 488.314 (a)(2). ↩︎
  30. 42 U.S.C. § § 1395i-3 (g)(2)(E)(i), (ii); 1396r (g)(2)(E)(i), (ii). ↩︎
  31. 42 U.S.C. § § 1395i-3 (g)(5)(A); 1396r (g)(5)(A). ↩︎
  32. 42 U.S.C. § § 1395i-3 (g)(5)(E); 1396r (g)(5)(E). ↩︎
  33. Institute of Medicine 1986. Improving the Quality of Care in Nursing Homes. Washington, DC: The National Academies Press at 147. https://doi.org/10.17226/646. ↩︎
  34. Id. at 242. ↩︎
  35. See generally Id. ↩︎
  36. Id. at 6. ↩︎
  37. Id. at 3-4. ↩︎
  38. KFF, Implementation of Affordable Care Act Provisions to Improve Nursing Home Transparency, Care Quality, and Abuse Prevention (Jan. 2013), https://modern.kff.org/medicaid/report/implementation-of-affordable-care-act-provisions-to-improve-nursing-home-transparency-care-quality-and-abuse-prevention/. ↩︎
  39. Id. ↩︎
  40. KFF, Key Issues in Long-Term Services and Supports Quality (Oct 2017), https://modern.kff.org/medicaid/issue-brief/key-issues-in-long-term-services-and-supports-quality/. ↩︎
Poll Finding

Public’s Views of Doctors, Nurses, Insurance Companies, and Drug Companies Survey

Published: Aug 3, 2020

This brief survey examines how the public views the motivations of doctors, nurses, insurance companies, and drug companies when it comes to making profits vs. working for the public good. It updates a question asked in 2005 to measure how views have changed over time.

The Critical Care Workforce and COVID-19: A State-by-State Analysis

Author: Eric Lopez
Published: Jul 30, 2020

Data Note

The United States remains among the countries most severely impacted by the coronavirus pandemic, with reported COVID-19 cases rising again in many states. While much recent research and media reporting on the pandemic response has focused on the availability of hospital beds and medical equipment, there is also concern that the availability of medical personnel capable of providing intensive care could be a limiting factor in the care of COVID-19 patients. This is a particular challenge as cases and hospitalizations surge in hotspots across the country.

Using recent data from the National Plan and Provider Enumeration System (NPPES) National Provider Identifier (NPI) Registry, this Data Note reports baseline estimates of the number of active critical care physicians and nurses in each state relative to state population.

Background

To date, much of the federal and state-level response to the COVID-19 pandemic in the United States has focused on the availability of hospital resources such as funding, beds, and personal protective equipment.1  However, some experts have signaled that personnel are also in short supply. Alarmingly, the Society for Critical Care Medicine (SCCM) reported that the number of providers trained in intensive care unit (ICU) care and mechanical ventilation could be a limiting factor in the care of COVID-19 patients, and has recommended that the pandemic response should place greater emphasis on increasing the number of available critical care professionals.2 

However, quantifying the number of critical care providers in the U.S. has historically been difficult. On the one hand, some professional societies have argued that only “intensivist” physicians who have completed a formal fellowship in critical care medicine should lead critical care teams, and some research suggests that this may improve clinical outcomes in the ICU setting.3  On the other hand, many providers without formal critical care training regularly care for critically ill ICU patients, including substantial numbers of hospitalists, pulmonologists, and anesthesiologists. The issue is further complicated by variability in the proportion of duty hours that individual providers spend in the intensive care setting. Researchers writing in 2015 noted that, “our current supply of full-time intensivists is very low, as the vast majority of adult, board-certified intensivists are really part-time practitioners based in pulmonary medicine, operating rooms (surgeons/anesthesiologists), or emergency medicine”.4 

Consequently, prior estimates have reflected these limitations. For example, an early landmark study by the Committee on Manpower for Pulmonary and Critical Care Societies in 2000 found that, of the 10,244 practicing U.S. physicians that classified themselves as critical care providers, nearly half did not hold a formal critical care certification.5  A 2013 study by the Health Resources and Services Administration (HRSA) took duty hour variation into account, reporting only 3,570 full-time equivalent intensivist physicians and 2,880 full-time equivalent critical care nurse practitioners.6  The most recent published estimates are based on data from 2015, though the ongoing COVID-19 pandemic response warrants further updates.7  Using data from the 2020 National Plan and Provider Enumeration System (NPPES) National Provider Identifier (NPI) Registry, this Data Note quantifies the availability of providers capable of providing critical care in each state relative to state-level population.

Key Takeaways

  • Approximately 16,600 intensivists and 67,900 critical care nurses, including certified registered nurse anesthetists (CRNAs), were identified in the United States. At the state level, these counts correspond to an average of 0.62 intensivists and 2.54 critical care nurses per 10,000 adults.
  • There are also nearly 116,000 second-line physicians—hospitalists, pulmonologists, and anesthesiologists—who do not have formal critical care training, but who may be caring for critically ill patients. Across the states, these providers average 4.32 per 10,000 adults.
  • Individual state-level provider concentrations varied widely. Several states that have recently reported a surge in cases have per-population numbers of intensivists or critical care nurses that are substantially lower than national average ratios, such as California, Arizona and Texas. Estimates per 10,000 adults are reported in Table 1.

Discussion

These estimates highlight several issues relevant to both the baseline critical care workforce in the U.S. and to the response to the coronavirus pandemic. Notably, the number of intensivist physicians is substantially smaller than that of “second-line” providers that sometimes provide critical care, such as hospitalists, pulmonologists, and anesthesiologists, lending credence to longstanding concerns that intensivists are in short supply in the U.S. at baseline. However, it is unclear how many of these second-line providers could be readily redirected into the ICU setting. Many hospitalists likely can be, since most practice in the hospital setting. However, significant numbers of anesthesiologists and pulmonologists may primarily practice in non-hospital settings such as ambulatory surgery centers and outpatient physician offices, and may have little experience providing ICU-level care. Similarly, the number of nurses specifically trained in critical care also appears relatively small compared to prior estimates, suggesting that the source data may lack comprehensive records for some categories of nurses that provide critical care.

Furthermore, recent increases in COVID-19 cases in several states may justify redirection of second-line providers into critical care roles, as well as recruitment of intensivists and critical care nurses from other regions, as the pandemic intensifies. Both approaches may be facilitated by volunteer programs and state government proposals similar to those that supported prior workforce expansions in New York.8 

Finally, providers outside of the hospital setting will also play instrumental roles in the pandemic response, both by reducing strain on hospitals and by providing direct COVID-19 care. For example, long-term care and skilled nursing facilities are continuing to be disproportionately impacted, increasing their demand for additional personnel as well.9  Similarly, sufficient numbers of primary care physicians and other ambulatory care providers are vital, not only to help minimize avoidable hospitalizations through monitoring of their patients’ chronic conditions, but also to coordinate essential follow-up care for recovering COVID-19 patients after hospital discharge.

National and state leaders are facing challenging decisions about where to allocate limited resources, including critical care providers. Estimates of the current workforce size and distribution can help inform these decisions, though they must be interpreted in conjunction with local factors such as disease burden, health care infrastructure, workplace safety, and the availability of funding and medical resources. The interactions between these factors are complex and will require continuous re-evaluation in order to best protect both patients and health care personnel during the pandemic.

Eric John Lopez was a member of KFF’s ACA and Medicare Policy teams. He is a medical student at the University of California, San Francisco, and participated in a yearlong UCSF-KFF Health Policy Fellowship.

Methods

State-level counts of active critical care providers were calculated based on May 2020 data from the National Plan and Provider Enumeration System (NPPES) National Provider Identifier (NPI) Registry (https://download.cms.gov/nppes/NPI_Files.html).10 

NPPES specialty taxonomy codes used to calculate raw provider counts included: 207LC0200X (Anesthesiology – critical care medicine), 207RC0200X (Internal medicine – critical care medicine), 207VC0200X (Obstetrics & gynecology – critical care medicine), 2084A2900X (Neurocritical care), 2086S0102X (Surgical critical care), 163WC0200X (Registered nurse – critical care medicine), 364SC0200X (Clinical nurse specialist – critical care medicine), 363LC0200X (Nurse practitioner – critical care medicine). Certified Registered Nurse Anesthetists (CRNAs) are included in estimates of critical care nurses, as an American Association of Nurse Anesthetists (AANA) position statement on COVID-19 has stated that CRNAs can safely assume care of ICU patients, subject to the experience and judgment of individual clinicians (https://www.aana.com/docs/default-source/practice-aana-com-web-documents(all)/crnas_asked_to_assume_critical_care_responsibilities_during_ the_covid_19_pandemic .pdf? sfvrsn=ea3630e7_6).

Providers are assigned to their state of practice as reported the most recent version of the dataset. State-level ratios of providers per 10,000 adults were calculated by dividing the number of each critical care provider by the state-level population as reported in the 2019 U.S. Census Bureau projections.11  Providers specializing in pediatric and neonatal critical care are not included. The full list of taxonomy codes and definitions can be found at the Washington Publishing Company website (http://www.wpc-edi.com/reference/codelists/healthcare/health-care-provider-taxonomy-code-set/).

Table

Table 1: Intensivist Physicians, Critical Care Nurses, and Second-line Critical CarePhysicians per 10,000 Adults
StateIntensivist (Critical Care) Physicians per 10,000 AdultsCritical Care Nurses and CRNAs per 10,000 AdultsTotal 2nd-Line Critical Care Physicians* per 10,000 Adults
Alabama0.415.073.48
Alaska0.512.544.37
Arizona0.561.465.23
Arkansas0.293.193.58
California0.630.894.43
Colorado0.751.775.18
Connecticut0.982.666.08
D.C.1.992.188.78
Delaware0.614.994.93
Florida0.633.174.14
Georgia0.562.453.99
Hawaii0.451.094.19
Idaho0.273.542.50
Illinois0.642.124.79
Indiana0.701.294.96
Iowa0.642.453.97
Kansas0.414.853.60
Kentucky0.574.234.50
Louisiana0.444.533.90
Maine0.453.715.12
Maryland1.132.015.22
Massachusetts1.012.156.19
Michigan0.723.994.18
Minnesota0.545.533.80
Mississippi0.293.523.41
Missouri0.803.735.39
Montana0.501.425.07
Nebraska0.404.034.33
Nevada0.670.904.41
New Hampshire0.913.155.38
New Jersey0.701.334.64
New Mexico0.392.213.15
New York0.851.345.60
North Carolina0.574.223.97
North Dakota0.796.364.21
Ohio0.813.594.56
Oklahoma0.362.444.18
Oregon0.701.524.89
Pennsylvania0.874.405.05
Puerto Rico0.270.272.06
Rhode Island0.912.263.95
South Carolina0.593.783.71
South Dakota0.426.623.57
Tennessee0.635.294.33
Texas0.482.644.00
Utah0.501.374.40
Vermont0.490.984.75
Virginia0.552.774.03
Washington0.591.814.45
West Virginia0.524.874.00
Wisconsin0.582.275.16
West Virginia0.524.874.00
Wyoming0.342.224.22
US Total0.622.544.32
*Hospitalists, Pulmonologists, and AnesthesiologistsSOURCE: KFF analysis of the National Plan and Provider Enumeration System (NPPES) National Provider Identifier (NPI) monthly data dissemination file May 2020 (https://download.cms.gov/nppes/NPI_Files.html) and 2019 U.S. Census Bureau projections (https://www.census.gov/data/tables/time-series/demo/popest/2010s-state-detail.html).

Endnotes

  1. Emanuel, Ezekiel, et. al. 2020. “Fair Allocation of Scarce Medical Resources in the Time of COVID-19”. N Engl J Med. https://doi.org/10.1056/NEJMsb2005114 ↩︎
  2. Halpern, N. A. and Tan, K. S. 2020. U.S. ICU Resource Availability for COVID-19. Mount Prospect, IL: Society of Critical Care Medicine. https://sccm.org/Blog/March-2020/United-States-Resource-Availability-for-COVID-19?_zs=OdHjd1&_zl=w9pb6   ↩︎
  3. Weled, Barry, et. al. 2015. “The Importance of Process of Care and ICU Structure to Improved Outcomes: An Update from the American College of Critical Care Medicine Task Force on Models of Critical Care”. Critical Care Medicine. Jul; 43(7): 1520-1525. https://journals.lww.com/ccmjournal/Abstract/2015/07000/Critical_Care_Delivery __The_Importance_of_Process.19.aspx ↩︎
  4. Pastores, Stephen, et. al. 2015. “Intensivist Workforce in the United States: The Crisis is Real, Not Imagined”. Am J Respir Crit Care Med. Mar; 191(6): 718-719. https://www.atsjournals.org/doi/full/10.1164/rccm.201501-0079LE ↩︎
  5. Angus, Derek, et. al. “Current and Projected Workforce Requirements for Care of the Critically Ill and Patients with Pulmonary Disease: Can We Meet the Requirements of an Aging Population?” JAMA. Dec; 284(21): 2762-2770. https://jamanetwork.com/journals/jama/fullarticle/193318 ↩︎
  6. National Center for Health Workforce Analysis. 2013. Health Workforce Projections: Critical Care Physicians and Nurse Practitioners. Rockville, MD: Health Resources and Services Administration. https://bhw.hrsa.gov/sites/default/files/bhw/health-workforce-analysis/research/projections/critical-care-fact-sheet.pdf ↩︎
  7. Halpern, N. A., et. al. 2019. “Intensivists in U.S. Acute Care Hospitals”. Critical Care Medicine. Apr; 47(4): 517-525. https://www.ncbi.nlm.nih.gov/pubmed/30694817 ↩︎
  8. Simmons-Duffin, Selena. March 25, 2020. “States Get Creative to Find and Deploy More Health Workers in COVID-19 Fight”. NPR. Accessed July 3, 2020. https://www.npr.org/sections/health-shots/2020/03/25/820706226/states-get-creative-to-find-and-deploy-more-health-workers-in-covid-19-fight ↩︎
  9. McMichael, Temet; Currie, Dustin; et. al. 2020. “Epidemiology of COVID-19 in a Long-Term Care Facility in King County, Washington”. N Engl J Med. (epub ahead of print) https://www.ncbi.nlm.nih.gov/pubmed/32220208 ↩︎
  10. Centers for Medicare and Medicaid Services. 2020. National Plan and Provider Enumeration System (NPPES) Data Dissemination Monthly National Provider Identifier (NPI) File (May 12, 2020). Baltimore, MD: Centers for Medicare and Medicaid Services. Accessed May 20, 2020. https://download.cms.gov/nppes/NPI_Files.html   ↩︎
  11. United States Census Bureau. 2020. 2019 National and State Population Estimates. Suitland, MD: United States Census Bureau. Accessed July 16, 2020. https://www.census.gov/newsroom/press-kits/2019/national-state-estimates.html ↩︎
News Release

Brief Examines What’s Known About Children and Coronavirus Transmission as Schools Prepare for Fall

Published: Jul 29, 2020

With schools nationwide preparing for fall and the federal government encouraging in-person classes, key concerns for school officials, teachers and parents include the risks that coronavirus poses to children and their role in transmission of the disease.

A new KFF brief examines the latest available data and evidence about the issues around COVID-19 and children and what they suggest about the risks posed for reopening classrooms. The review concludes that while children are much less likely than adults to become severely ill, they can transmit the virus. Key findings include:

  • Disease severity is significantly less in children, though rarely some do get very sick. Children under age 18 account for 22% of the population but account for just 7% of the more than 4 million COVID-19 cases and less than 1% of deaths.
  • The evidence is mixed about whether children are less likely than adults to become infected when exposed. While one prominent study estimates children and teenagers are half as likely as adults over age 20 to catch the virus, other studies find children and adults are about equally likely to have antibodies that develop after a COVID-19 infection.
  • While children do transmit to others, more evidence is needed on the frequency and extent of that transmission. A number of studies find children are less likely than adults to be the source of infections in households and other settings, though this could occur because of differences in testing, the severity of the disease, and the impact of earlier school closures.
  • Most countries that have reopened schools have not experienced outbreaks, but almost all had significantly lower rates of community transmission. Some countries, including Canada, Chile, France, and Israel did experience school-based outbreaks, sometimes significant ones, that required schools to close a second time.

The analysis concludes that there is a risk of spread associated with reopening schools, particularly in states and communities where there is already widespread community transmission, that should be weighed carefully against the benefits of in-person education.

What Do We Know About Children and Coronavirus Transmission?

Published: Jul 29, 2020

Key Points:

  • With just a few weeks remaining before schools in the U.S. are scheduled to reopen, and the federal government encouraging in-person schooling, there remain many questions about the risk COVID-19 poses to children and their role in transmission of the disease. Indeed, other countries have not reopened schools with the levels of community transmission found in the U.S., coupled with its insufficient testing and limited contact tracing.
  • Our review of the latest available data indicates that, while children who are infected with COVID-19 are more likely to be asymptomatic and less likely to experience severe disease (though a small subset become quite sick), they are capable of transmitting to both children and adults.
  • What remains unclear and where evidence is still needed is: whether children are less likely to be infected than adults and, when infected, the frequency and extent of their transmission to others. There is some evidence for an age gradient in infectiousness, with younger children less likely and older children more likely to transmit at levels similar to adults.
  • While other countries that reopened schools have generally not experienced outbreaks in school settings, almost all had significantly lower levels of community transmission than the U.S. and greater testing and contact tracing capacity. Moreover, several disease clusters connected to schools and children have been reported.
  • Taken together, the evidence indicates that where there is already widespread community transmission, as in many areas in the U.S., there is clearly a risk of further spread associated with reopening schools. The risks of reopening need to be considered carefully in light of the recognized benefits of in-person education.

Introduction

Policymakers in the United States are struggling to decide whether and how to reopen schools and daycares, at the same time that parents and caregivers are trying to weigh the risks and benefits of different approaches to schooling for their children. Indeed, our latest national poll found that most parents are worried about their child or a family member, as well as teachers and staff, getting sick from coronavirus if schools reopen and think it is better to wait.

With only a few weeks remaining until most U.S. schools are scheduled to begin, the White House for months has emphasized the importance of reopening schools and having students physically present in classrooms, although more recently has supported a more flexible approach for schools and parents. For its part, the Centers for Disease Control and Prevention (CDC) recently released updated guidance, including a review of the data, for school administrators, parents, and caregivers facing decisions around schooling, while also issuing a statement that having children physically present in reopened schools this fall was of utmost importance. CDC states, that, “No studies are conclusive, but the available evidence provides reason to believe that in-person schooling is in the best interest of students, particularly in the context of appropriate mitigation measures similar to those implemented at essential workplaces.”

Still, many large school districts, especially in locations where there is widespread community transmission, have opted for a virtual rather than an in-person start to the school year, citing the risks that the virus poses to students, teachers, staff, and households. Our recent analysis found, for example, that 1.5 million teachers are at high risk of severe disease if infected with coronavirus, due to underlying health conditions and age. In addition, we found that millions of seniors live in households with school-aged children.

Struggles surrounding decisions around schooling and childcare reflect some of the most perplexing aspects of the COVID-19 pandemic so far: understanding the risks the virus poses to children and their role in transmission of the disease. While researchers have been actively investigating these topics since the emergence of the pandemic, our understanding is, in many cases, still incomplete. Here, drawing on published literature and expert opinion, we summarize what is known about children and coronavirus, and what the information gaps remain.

Box 1: Data on COVID-19 in Children in the United States

Children, under the age of 18, to date, account for:

  • 7% (more than 200,000) of reported COVID-19 cases* (source CDC)
  • <1% of reported COVID-19 deaths* (source: CDC)
  • 1% of reported COVID-19 hospitalizations (source: CDC)

The number of reported cases of Multisystem Inflammatory Syndrome in Children (MIS-C) is 342, including 6 deaths, among states reporting data (source: CDC)

*Based only on data for which age group information was available.

Current Evidence on COVID-19 and Children

Disease severity is significantly less in children, though a small subset become quite sick: We know children of all ages can indeed be infected with coronavirus but the evidence at this point is quite clear that overall, children who become infected experience a milder disease course than adults. As one expert review panel stated, we are “essentially certain” the risk of death and of severe illness from COVID-19 in children is extremely low. Another expert panel organized by the National Academies of Medicine reported that “compared with adults, children who contract COVID-19 are more likely to experience asymptomatic infection or mild upper respiratory symptoms”, and that over 90 percent of children testing positive will have no or mild symptoms. While the infection has been known to cause an inflammatory condition (MIS-C) in some children, and these cases are serious (342 have been reported to date), so far such cases are very rare and most children who do experience the condition eventually recover.

One reflection of the generally milder disease course in children is that the reported number of COVID-19 deaths among children under the age 18 in the U.S. is less than 1% of reported COVID-19 deaths, even though children make up 22% of the U.S. population [see Box 1].

Evidence is mixed about whether children are less likely to become infected when exposed. Regarding risk of infection there is some evidence that, compared to adults, children are less likely to become infected when exposed to the virus. One prominent study estimated susceptibility to infection for those under 20 years of age to be about half that of those over 20 years, and several large-scale seroprevalence studies have found lower prevalence of infection in children, especially younger children, compared to adults. Still, the evidence is somewhat mixed on this point, with other studies showing children, especially older children (>10 years) having been infected at rates similar to adults in some places. A recent (pre-publication) review of the evidence concludes there is “significantly lower” susceptibility to infection for children under 10 compared to adults, but the same conclusion cannot be drawn for children 10 and older.

A number of biological explanations have been posited for this difference between children and adults in severity and infection risk, including less expression of a key receptor in the upper airways of children, and some level of pre-existing immune cross-reactivity to SARS-Cov-2 in many children due to recent exposure to related viruses (such as common cold viruses). Still, investigations continue and more evidence is needed to fully understand if lower infection rate in children is a real phenomenon and what explains it.

Children do transmit to others but more evidence is needed on the frequency and extent of that transmission. We do not yet know for sure how common transmission from children is compared to transmission from adults. We know that children are capable of transmission to others, but the frequency and extent of this transmission remains under investigation, and this is a question where only weak, and sometimes contradictory evidence, is available.

For example, multiple studies indicate that children have viral loads and shed virus in similar amounts to adults, which might indicate risk of transmission is similar across age groups. Without a doubt transmission from child-to-child and child-to-adult can occur, but a number of studies find children, particularly young children, are less likely to be source of infection in households and other settings, compared to adults. A number of these studies conclude that a majority of documented transmissions between children and adults have occurred from adults to children, rather than the other way around, but more detailed information is needed to fully understand this dynamic. There is new evidence, including from a recent comprehensive study from South Korea, suggesting there is an age gradient in terms of transmission risk from children, meaning younger children (<10 years old) are less likely to transmit compared to adults, while older children (10 and older) may transmit at levels similar to adults.

Evidence is so far lacking partly because doing studies and collecting the necessary information has been challenging for a number of reasons, including:

  • Children have been less likely to be tested for coronavirus infection compared to adults. Testing (particularly in the US where testing capacity constraints have been common) has been focused on symptomatic patients (especially those with severe symptoms), and children exhibit fewer and milder symptoms compared to adults.
  • Because children are less likely to be symptomatic, they may also be less likely to be identified as the “index” case during a contact tracing investigation and therefore their role in transmission could be underrecognized.
  • Children may have different social mixing patterns compared to adults, coming into close contact with others at different rates. This may complicate comparisons of transmission between children and adults. On the one hand, children may have had fewer contacts than adults during times when schools and daycares were closed, but, on the other, may have a greater number of close contacts than adults when in a more typical school environment.

Transmission in School Settings

Most countries that have reopened schools have not experienced outbreaks but almost all have had significantly lower rates of community transmission than the U.S. and higher testing and contact tracing capacity. In many countries around the world, schools and daycares have reopened following a period of lockdown. So far, most have not seen cases surge after re-opening. For the most part, the lack of a surge in cases and the ability to control any outbreaks in most countries that have re-opened schools is in large part explained by their significantly lower levels of community transmission at the time schools re-opened compared to much of the U.S. now, as well as their greater testing and contact tracing capacity.

In Table 1, we compare U.S. COVID-19 data to 13 other countries that have reopened schools. We looked specifically at the 7-day average of cases, cases per million, and test positivity rate as of the date each country reopened schools compared to the U.S. as of the most recent date. As shown, all countries that have reopened had significant lower case counts and cases per million than the U.S. currently has and all but one (Japan) had lower positivity rates. For example, when South Korea opened schools on June 8, the country had a 7-day average of just 44 cases nationwide (or 0.9 per million population), after more than two months of limited transmission; it also already had widespread testing (a test positivity rate of 0.3%) and contact tracing in place, meaning it was well positioned to respond quickly to any school outbreaks. By contrast, the U.S. is currently averaging at more than 65,000 cases a day (or 195 per million population) and its test positivity rate is 8%. Many other countries, such as Finland, Iceland, New Zealand, and Vietnam, similarly had low case numbers, cases per million, and positivity rates when they opened schools and have avoided large school-based outbreaks so far.

Table 1: School Re-Openings: Country Comparisons on Key Metrics Compared to Current U.S. Data
Date of reopeningDaily CasesDaily Cases Per Million PopulationPositivity Rate (%)
(7-day averages)
United States65,750.4198.68.3
Belgium5/18/2020291.325.12.1
Denmark4/15/2020205.735.56.2
France5/11/20201,110.917.01.1
Germany5/4/20201,140.313.62.4
Greece6/1/20205.60.50.1
Israel5/3/2020126.714.61.4
Japan4/24/20204393.58.7
South Korea6/8/202044.40.90.3
New Zealand5/14/20201.10.20
Norway4/20/202093.317.23.8
Switzerland5/11/202057.16.61.3
Taiwan2/25/20201.10.00.2
Vietnam5/18/20204.60.00
NOTES: U.S. estimates calculated based on most recent data. France positivity rate from May 24. Vietnam positivity rate from April 29. Data represent 7-day average, as of re-opening date (unless other date noted).SOURCES: COVID-19 data from: “Coronavirus Pandemic (COVID-19)”. Published online at OurWorldInData.org. Retrieved on July 28, 2020. School reopening dates from: University of Washington, Summary of School Re-Opening Models and Implementation Approaches During the COVID 19 Pandemic, July 6, 2020,

At the same time, school associated outbreaks have occurred in some countries. Not all countries have avoided school-associated outbreaks. For example, schools in Canada, Chile, France, and Israel have reported outbreaks, sometimes significant ones, necessitating re-closure of schools in some cases. Israel, in particular, has had several outbreaks at schools after reopening, including an outbreak in a high school where 13.2% of students tested positive for coronavirus as did 16.6% of staff and school-based cases have been linked to increasing community transmission. The country reopened when it had significant fewer cases, cases per million, and positivity rate than the U.S. does today (see Table 1); it reopened its entire school system with few social distancing or other mitigation measures. In Sweden, a country which never closed its schools for children under 16, health authorities have reported that teachers are no more at risk in schools than adults in other professions and community transmission was not affected by schools being open. There have been school outbreaks and deaths among school teachers in Sweden, but insufficient testing and contact tracing at Swedish schools make it difficult to draw definitive lessons from the Swedish school experience.

Like schools, daycare-associated outbreaks also have been reported, including in the U.S., such as in California and Texas.

Conclusion

Taken together, the evidence indicates that while children are much less likely than adults to become severely ill from COVID-19, they do transmit virus. It is still unclear to what extent children, especially younger ones, are likely to get infected or transmit the infection to others compared to adults. However, where there is already widespread community transmission, as is the case in many areas in the U.S., there is clearly a risk of spread associated with reopening schools. This challenge may be more pronounced where testing and contact tracing capacity is limited. As such, the risk of re-opening schools needs to be considered carefully in light of the recognized benefits of in-person education.