FY 2026 National Security, Department of State and Related Programs (NSRP) Global Health Funding in the Consolidated Appropriations Act

Published: Feb 4, 2026

Update: On February 3, 2026, the President signed the “Consolidated Appropriations Act, 2026” which includes funding provided in the FY 2026 National Security, Department of State and Related Programs (NSRP) appropriations bill and accompanying explanatory statement detailed below. This resource was originally published on January 14, 2026.

On January 11, 2026, the Appropriations Committee released the FY 2026 National Security, Department of State and Related Programs (NSRP) (formerly State, Foreign Operations, and Related Programs [SFOPs]) appropriations bill and accompanying explanatory statement. The bill and explanatory statement include funding for U.S. global health programs at the State Department. Funding for global health programs at the State Department through the Global Health Programs (GHP) account, which represents the bulk of global health assistance, totals $9.4 billion, which is a decrease of $615 million (-6%) compared to the FY25 level ($10 billion). All program areas either decreased or remained flat as follows:

  • Decreased: Funding for the Global Fund to Fight AIDS, Tuberculosis and Malaria (Global Fund), bilateral HIV, tuberculosis (TB), global health security, neglected tropical diseases (NTDs), and vulnerable children declined; while the Global Fund accounted for the largest decrease (-$400 million or -24%), this funding supports the administration’s pledge of $4.6 billion for the eighth replenishment and serves as the first installment of that pledge. In addition, the explanatory statement accompanying the bill states that there are also “sufficient unobligated balances” from prior Acts “to fulfill the United States pledge for the seventh replenishment.”
  • Remained Flat: Funding for malaria, maternal and child health (MCH), nutrition, and family planning and reproductive health (FP/RH) remained flat.

In addition, the bill included provisions that either impact or provide direction on global health funding including:

  • Program Area Amounts: Funding for many of the global health program areas is specified in the explanatory statement (rather than the bill). Unlike prior years, this bill specifically states that funding “shall be made available at not less than the amounts specifically designated in the respective tables included in the explanatory statement” ensuring that the administration is required to provide the amounts for the areas specified. The bill also prohibits the administration from deviating from the global health amounts in the bill and explanatory statement.
  • Funding Availability Timeframe: PEPFAR funding (bilateral HIV and the contribution to the Global Fund) is available for five years. Funding for most other program areas is provided for two years, with the exception of funding for Gavi, the Vaccine Alliance and the Coalition for Epidemic Preparedness Innovations (CEPI), which is provided for one year.
  • Reports/Briefings: The bill requires the administration to provide updates (via reports or briefings) on numerous global health areas including (but not limited to) the PEPFAR Transition Strategy, Market Access Strategy, bilateral health agreements, multilateral health engagement, the development of an Innovation Fund, and the status of available funding (i.e. apportionment, allocations, obligations, and disbursements).
  • Additional Requirements: The bill requires coordination with the Centers for Disease Control and Prevention (CDC) on global health activities and establishes the Prevention, Treatment, and Response Initiative, which supports “research, development, and delivery of vaccines and other prevention technologies”.

See the table below for additional detail on global health funding. See other budget summaries (including the summary on FY 2026 Labor, Health and Human Services, Education, and Related Agencies (Labor HHS) global health funding) and the KFF budget tracker for details on historical annual appropriations for global health programs.

KFF Analysis of Global Health Funding in the FY 2026 Conference Appropriations Bill & Explanatory Statement (Table)

FY 2026 Labor, Health and Human Services, Education, and Related Agencies (Labor HHS) Global Health Funding in the Consolidated Appropriations Act

Published: Feb 4, 2026

Update: On February 3, 2026, the President signed the “Consolidated Appropriations Act, 2026” which includes funding provided in the FY 2026 Labor, Health and Human Services, Education, and Related Agencies (Labor HHS) conference bill and accompanying report detailed below. This resource was originally published on January 22, 2026.

The Committee on Appropriations released its FY 2026 Labor, Health and Human Services, Education, and Related Agencies (Labor HHS) conference bill and accompanying report on January 20, 2026.

While most U.S. global health funding is provided to the State Department through a separate appropriations bill (see the KFF budget summary on this funding here), the Labor HHS appropriations bill includes funding for global health programs at the Centers for Disease Control and Prevention (CDC) as well as funding for global health research activities at the National Institutes of Health (NIH). Total global health funding at CDC and NIH through the Labor HHS bill is not yet known, as funding for some programs (i.e. global HIV/AIDS and malaria research) at NIH is determined at the agency level rather than specified by Congress in annual appropriations bills. Funding for global health in the Labor HHS bill remained flat compared to the FY 20251 level as follows:

  • CDC: Funding for global health programs at CDC totals $693 million, the same level as the FY 2025 enacted amount.2 Within CDC, funding for each specific global health program area was also maintained at the FY 2025 level.
  • NIH: Funding for global health research activities at the Fogarty International Center (FIC) at NIH totals $95 million, the same level as the FY 2025 enacted amount.

In addition, Section 236 under the Labor HHS section of the bill specifically states that funding “shall be for the budget activities, and in the amounts specified in the table under each such heading in the explanatory statement” instructing the administration to provide the amounts for the areas specified.

See the table below for additional details on global health funding. See other budget summaries and the KFF budget tracker for details on historical annual appropriations for global health programs.

KFF Analysis of Global Health Funding in the FY 2026 Conference Labor, Health and Human Services, Education, and Related Agencies (Labor HHS) Appropriations Bill (Table)

  1. Funding for FY25 was provided in a full-year Continuing Resolution (CR), which maintained FY24 levels. All FY25 amounts and associated notes are based on those specified in relevant FY24 appropriations bills. ↩︎
  2. The FY26 Request eliminates CDC's Global Health Center and most of its bilateral programs, except funding for "Global Disease Detection & Emergency Response", which is transferred to "Crosscutting Activities and Program Support", and "Parasitic Diseases and Malaria", which is transferred to "Emerging and Zoonotic Infectious Diseases". ↩︎
News Release

Poll: People View Prior Authorization as Greatest Burden in Navigating the Health System

Many Report Impact on their Care, Finances and Well-being

Published: Feb 2, 2026

New KFF polling explores the challenges beyond costs that people with insurance face in navigating the health care system. People cite prior authorization review as their top problem by a wide margin, with a third (32%) saying prior authorization requirements are a “major burden.”

That’s more than say the same about understanding their bill or what they owe (23% say it is a major burden), getting appointments when they need them (20%), or finding providers who accept their insurance (17%).

When asked to choose which of those four factors is “the single biggest burden,” prior authorization before accessing certain tests, treatments, or medication ranks at the top (34%). Among people with a chronic condition that requires ongoing medical treatment (about half of all insured adults), 4 in 10 (39%) say prior authorization is the single biggest burden when it comes to getting care, more than twice the share who say the same about other obstacles.

“The complexity of the health system drives patients crazy, can have real consequences, and disproportionately affects people who are sick,” KFF President and CEO Drew Altman said. “Prior authorization review is the poster child for that complexity.”

Prior authorization ranks as the single biggest burden for people with employer coverage and Medicaid, as well as those who buy their own coverage (largely through the Affordable Care Act’s Marketplaces).

During the prior authorization process, some treatments or medications recommended by a provider may be delayed and, in some instances, an insurance company may end up denying medication or treatment.

About half (47%) of insured adults – and a larger share (57%) of those with chronic conditions – say their access to a certain health care service, treatment, or medication has been denied, delayed, or altered in the past two years by their health insurer.

Among those who report such denials, delays, or alterations, about a third say it had a “major negative impact” on their mental health and emotional well-being (34%) and finances (33%), and a quarter say it had a “major negative impact” on their physical health (26%). This translates to about 1 in 5 of all adults with insurance saying that their mental or physical health, or finances, have been majorly impacted.

Designed and analyzed by public opinion researchers at KFF, this survey was conducted January 13-20, 2026, online and by telephone among a nationally representative sample of 1,426 U.S. adults in English and in Spanish. The margin of sampling error is plus or minus 3 percentage points for the full sample. For results based on other subgroups, the margin of sampling error may be higher.

Poll Finding

KFF Health Tracking Poll: Prior Authorizations Rank as Public’s Biggest Burden When Getting Health Care

Published: Feb 2, 2026

Findings

As the latest KFF Health Tracking Poll shows, affordability is the public’s biggest concern, with the cost of health care ranking as their top economic worry. However, KFF polls have demonstrated that beyond costs, insured people report a whole host of issues navigating the health care system. This report looks at which aspects of accessing care and health insurance are the biggest problem for insured adults and finds that prior authorizations – or the process of having to get insurance approval before accessing certain tests, treatments, or medications – are having an outsized impact on insured adults.

One in three insured adults in the U.S. say they find prior authorizations a “major burden” to getting health care. An additional four in ten (37%) say the process is a “minor burden,” bringing the total share of insured adults who find the process burdensome to about seven in ten (69%). This is larger than the share who say other aspects are burdensome such as understanding bills or what is owed (60%), getting needed appointments (60%), or finding providers who accept their insurance (53%).

Stacked bar chart showing how much of a burden insured adults believe certain aspects of getting health care are.

When asked to choose which aspect of getting health care, beyond costs, is the single biggest burden, one in three insured adults (34%) choose prior authorizations, followed by getting needed appointments (19%), understanding their bill (17%), or finding providers who accept their insurance (15%). The choice of prior authorizations as the single biggest burden is even more stark among adults with a chronic condition that requires ongoing medical treatment (about half of all adults). These individuals often require more treatments and medications, resulting in more interactions with health insurance companies and health care providers. Four in ten (39%) insured adults with a chronic condition say prior authorizations are the single biggest burden when it comes to getting health care, at least twice the share who say the same about the other aspects of health care asked about.

Split bar chart showing how much of a burden insured adults and insured adults with a chronic condition believe certain aspects of getting health care are.

Prior authorizations are also identified as the single biggest burden for insured adults across partisans, as well as among individuals across insurance types that typically require prior authorizations such as individuals with Medicaid, people who buy their own health insurance, and people who get health insurance through an employer. Notably, about three in ten (28%) Medicaid enrollees identify finding providers who accept their insurance as the biggest burden, but small shares identify other issues as their biggest burden.1

A table showing the single biggest health care burden named by insured adults, broken out by insurance type and by party identification.

During the prior authorization process, some treatments or medications recommended by a provider may be delayed and, in some instances, an insurance company may end up denying medication or treatment. Overall, about two-thirds of adults say delays and denials of health care services by health insurance companies are a “major problem” with an additional one in four (24%) who say they are a “minor problem.” Just one in ten adults say delays and denials of services by insurance companies are not a problem in our current health care system.  More than six in ten across Medicaid enrollees, self-purchasers, and those with employer coverage say the delays and denials of care by insurance companies are a “major problem.”

A stacked bar chart showing how much of a problem adults view delays and denials of health care services by insurance companies.

About one in three insured adults (33%) say they have had a health insurance company deny coverage for a certain health care service treatment, or medication prescribed by their doctor in the past two years. Three in ten insured adults say that a health insurance company has delayed their ability to get such services, treatments, or medications (29%) or required them to try a lower-cost drug or treatment before covering the one that was originally recommended by their provider (29%). These issues are even more common among insured adults with a chronic condition with about four in ten reporting that an insurance company has required them to try a lower-cost drug or treatment (38%), deny coverage for a certain service or medication (42%), or delayed their ability to get prescribed care (37%). Overall, nearly half (47%) of insured adults say they have had a certain service, treatment, or medication either denied or delayed in the past two years, rising to nearly six in ten (57%) among those with a chronic condition.

Split bar chart showing the share of insured adults and insured adults with a chronic condition who say they've experienced issues with their health insurance company.

Denial and delays by health insurance companies can lead to negative consequences for people’s physical, mental, and financial health. One in three of those who experienced a denial or delay say the actions required by their health insurance company had a “major negative impact” on their mental health and emotional well-being as well as on their finances (about one in six of all insured adults).  One in four (one in eight of all insured adults) say the delays or denials has a “major negative impact” on their physical health.

A stacked bar chart showing how much of an impact issues with prior authorizations have had on insured adults, broken out by those who said they had previous experience with this and among total insured adults.


  1. Prior authorization is more common in Medicare Advantage than Traditional Medicare. Because this analysis is unable to break out individuals with traditional Medicare versus Medicare Advantage, we do not include Medicare as a subgroup in our analysis. These individuals are included in both the total group and the group with chronic conditions.  To learn more about prior authorizations for Medicare, more available at https://www.kff.org/medicare/medicare-advantage-insurers-made-nearly-53-million-prior-authorization-determinations-in-2024/. ↩︎

Methodology

This KFF Health Tracking Poll/KFF Tracking Poll on Health Information and Trust was designed and analyzed by public opinion researchers at KFF. The survey was conducted January 13-20, 2026, online and by telephone among a nationally representative sample of 1,426 U.S. adults in English (n=1,355) and in Spanish (n=71). The sample includes 1,028 adults (n=60 in Spanish) reached through the SSRS Opinion Panel either online (n= 1,003) or over the phone (n=25). The SSRS Opinion Panel is a nationally representative probability-based panel where panel members are recruited randomly in one of two ways: (a) Through invitations mailed to respondents randomly sampled from an Address-Based Sample (ABS) provided by Marketing Systems Groups (MSG) through the U.S. Postal Service’s Computerized Delivery Sequence (CDS); (b) from a dual-frame random digit dial (RDD) sample provided by MSG. For the online panel component, invitations were sent to panel members by email followed by up to three reminder emails. 

Another 398 (n=11 in Spanish) adults were reached through random digit dial telephone sample of prepaid cell phone numbers obtained through MSG. Phone numbers used for the prepaid cell phone component were randomly generated from a cell phone sampling frame with disproportionate stratification aimed at reaching Hispanic and non-Hispanic Black respondents. Stratification was based on incidence of the race/ethnicity groups within each frame. Among this prepaid cell phone component, 149 were interviewed by phone and 249 were invited to the web survey via short message service (SMS). 

Respondents in the prepaid cell phone sample who were interviewed by phone received a $15 incentive via a check received by mail or an electronic gift card incentive. Respondents in the prepaid cell phone sample reached via SMS received a $10 electronic gift card incentive. SSRS Opinion Panel respondents received a $5 electronic gift card incentive (some harder-to-reach groups received a $10 electronic gift card). In order to ensure data quality, cases were removed if they failed two or more quality checks: (1) attention check questions in the online version of the questionnaire, (2) had over 30% item non-response, or (3) had a length less than one quarter of the mean length by mode. Based on this criterion, 2 cases was removed. 

The combined cell phone and panel samples were weighted to match the sample’s demographics to the national U.S. adult population using data from the Census Bureau’s 2025 Current Population Survey (CPS), September 2023 Volunteering and Civic Life Supplement data from the CPS, and the 2025 KFF Benchmarking Survey with ABS and prepaid cell phone samples. The demographic variables included in weighting for the general population sample are gender, age, education, race/ethnicity, region, civic engagement, frequency of internet use and political party identification. The weights account for differences in the probability of selection for each sample type (prepaid cell phone and panel). This includes adjustment for the sample design and geographic stratification of the cell phone sample, within household probability of selection, and the design of the panel-recruitment procedure. 

The margin of sampling error including the design effect for the full sample is plus or minus 3 percentage points. Numbers of respondents and margins of sampling error for key subgroups are shown in the table below. For results based on other subgroups, the margin of sampling error may be higher. Sample sizes and margins of sampling error for other subgroups are available on request. Sampling error is only one of many potential sources of error and there may be other unmeasured error in this or any other public opinion poll. KFF public opinion and survey research is a charter member of the Transparency Initiative of the American Association for Public Opinion Research. 

GroupN (unweighted)M.O.S.E.
Total1,426± 3 percentage points
 
Party ID
Democrats473± 6 percentage points
Independents483± 6 percentage points
Republicans367± 6 percentage points
  
MAGA Republicans/Rep leaners352± 6 percentage points
MAHA supporters618± 5 percentage points
Parents or guardians of children under 18 living in their household436± 6 percentage points

Recent Trends in GLP-1 Use and Spending in Medicare

Published: Jan 30, 2026

Ahead of the Trump administration’s planned expansion of Medicare coverage for GLP-1s to treat obesity through temporary models and the availability of Medicare’s negotiated price for certain GLP-1 products beginning in 2027, new data from the Centers for Medicare & Medicaid Services (CMS) shows that use and spending for these drugs under Medicare has grown substantially in recent years, reflecting their demonstrated effectiveness at treating type 2 diabetes and other conditions. Medicare currently covers GLP-1s for type 2 diabetes, cardiovascular disease, and sleep apnea, but coverage for weight loss drugs is prohibited by law, even as GLP-1s have proved to be highly effective for this purpose (and even cost-effective, according to a recent analysis).

To address this gap in coverage for GLP-1s to treat obesity, CMS is launching a model called BALANCE (Better Approaches to Lifestyle and Nutrition for Comprehensive hEalth) under which CMS will negotiate pricing and coverage rules for GLP-1s, with the aim of expanding access to these medications and lifestyle interventions to support weight loss. The model, beginning in 2026 for Medicaid and 2027 for Medicare, is voluntary for drug manufacturers, state Medicaid programs, and Medicare Part D plans.

This analysis examines CMS’s Medicare Part D claims data from 2019 to 2024 to document the increase in the number of beneficiaries being treated with GLP-1 drugs and the growth in Medicare spending and claims for GLP-1s. Expansion of coverage under Medicare of GLP-1s to treat obesity under the BALANCE model is likely to increase utilization above current levels, as Medicare begins to meet the demand for obesity drugs among beneficiaries who have been unable to access or afford these medications to date. At the same time, the availability of Medicare’s lower negotiated price for certain GLP-1 products under the Medicare Drug Price Negotiation Program (semaglutide beginning in 2027 and dulaglutide beginning in 2028) could mitigate the increase in Medicare spending that could come about from ongoing and expanded use of these medications.

Ozempic Was Used by Two Million Medicare Part D Enrollees in 2024, Up from Fewer Than 150,000 in 2019

Semaglutide, the GLP-1 drug branded as Ozempic, Rybelsus, and Wegovy, was the most used GLP-1 in 2024. Two million Part D enrollees took Ozempic, which was approved by the FDA in 2017 to treat type 2 diabetes, up from fewer than 150,000 in 2019 (Figure 1). Nearly 1 million Part D enrollees took Mounjaro, approved in 2022 for type 2 diabetes, up from 54,000 in 2022. This increase reflects a pattern of growing use of newer GLP-1s, such as Ozempic and Mounjaro, while use of older products, such as Byetta (approved in 2005), Victoza (approved in 2010), and Trulicity (approved in 2014), has declined. While most GLP-1 drugs are currently available as injections, the introduction of new oral formulations, which could be easier for patients to take, could result in additional shifts in utilization among GLP-1s.

The Number of Medicare Part D Enrollees Using Ozempic Has Increased Dramatically in Recent Years, Even as Medicare Coverage of GLP-1s for Obesity Remains Prohibited Under Current Law (Line chart)

Medicare Part D Gross Spending on GLP-1s Increased Five-Fold Between 2019 and 2024, But Estimated Rebates of Around 50% Mean That Net Spending is Much Lower

Gross Medicare Part D spending on GLP-1s in 2024 (not accounting for rebates) totaled $27.5 billion, a five-fold increase from 2019, reflecting an expansion in use of GLP-1s with more recent FDA approvals for type 2 diabetes. (FDA approvals of Wegovy for cardiovascular disease and Zepbound for sleep apnea occurred in 2024 and therefore these uses are likely not reflected in Part D data through 2024.) More than half of gross spending in 2024 was on semaglutide products (Ozempic, 47%; Rybelsus, 7%; Wegovy, 1%) and nearly one fourth (23%) was for Mounjaro. Gross spending overstates the true cost of these products to the Medicare program, however. According to estimates from MedPAC, negotiated rebates for diabetic therapy were equal to or greater than 50% in 2023. Assuming rebates of 50% across all GLP-1 products in 2024 would mean net spending of around $14 billion in 2024.

Medicare Part D Gross Spending on GLP-1s Increased Five-Fold Between 2019 and 2024, But Estimated Rebates of ~50% Mean That Net Spending is Much Lower (Stacked column chart)

Claims for GLP-1s Increased Four-Fold Between 2019 and 2024

In accordance with an increase in both the number of Medicare Part D enrollees using GLP-1s and spending on these products, the number of claims for GLP-1s increased four-fold between 2019 and 2024, from 4.8 million to 21.8 million, with claims doubling between 2022 and 2024 alone. More than 10 million claims for Ozempic were submitted in 2024, up from 524,000 in 2019 (an 82% average annual growth rate) and another 5.1 million for Mounjaro, up from 122,000 in 2022 (average annual growth of 549%).

The Number of GLP-1 Claims in Medicare Part D Increased Four-Fold Between 2019 and 2024, With Claims Doubling Between 2022 and 2024 Alone (Stacked column chart)

This work was supported in part by Arnold Ventures. KFF maintains full editorial control over all of its policy analysis, polling, and journalism activities.

A Closer Look at Nebraska, the First State Planning to Implement a Medicaid Work Requirement

Authors: Amaya Diana and Anna Mudumala
Published: Jan 30, 2026

In December, Nebraska was the first state to announce that it would be enforcing Medicaid work requirements early, starting May 1, 2026. The 2025 reconciliation law requires states to condition Medicaid eligibility for adults in the ACA Medicaid expansion group and enrollees in partial expansion waiver programs (Georgia and Wisconsin) on meeting work requirements starting January 1, 2027; however, states have the option to implement requirements sooner through a state plan amendment (as is the case for Nebraska) or through an approved 1115 waiver. Implementing work requirements will require complex changes to eligibility and enrollment systems, as well as enrollee outreach and education, staff training, and coordination with managed care plans, providers, and other stakeholders. Early reports from the state during its recent January Medicaid Advisory Committee (MAC) meeting and data from KFF’s Medicaid work requirements tracker provide initial insight into how Nebraska is preparing to implement Medicaid work requirements. Similar information from MAC meetings in other states and data on the KFF tracker can be helpful to assess how other states may implement new requirements as well. 

Most Medicaid adults in Nebraska under age 65 who will be subject to the new work requirements are working already or attending school. As of March 2025, there were about 72,000 expansion enrollees in Nebraska who could be affected by the new requirements. KFF analysis indicates that roughly 65% of Medicaid adults without dependent children in Nebraska who could be subject to work requirements work 80 or more hours per month or are attending school. In addition, many enrollees who are not working the required hours will likely qualify for exemptions from the new work requirements.

In a recent Medicaid Advisory Committee (MAC) meeting, Nebraska provided a first look into how the state is planning to implement work requirements. All states are required to have a Medicaid Advisory Committee to advise the State Medicaid agency about health and medical care services. These groups include Medicaid enrollees, advocates, and providers. In its January 15, 2026 meeting, Nebraska state officials provided early insight into key decisions related to work requirements and look-back periods, data matching, medically frail exemptions, enrollee verification, short-term hardship exceptions, and outreach (Table 1). State officials also confirmed that the state does not intend to hire or increase staffing levels to facilitate implementation of work requirements or other eligibility changes.

Nebraska Work Requirement Implementation Decisions (Table)

There remain multiple operational and implementation issues the state will need to resolve in the next four months. State officials emphasized that conversations with the federal government are ongoing, and that Centers for Medicare and Medicaid Services (CMS) staff had recently travelled to Nebraska to plan implementation with state officials. As part of the MAC meeting discussion, state officials noted areas where there is ongoing work to identify data sources to verify compliance or exemption status:

  • Volunteer activities. Officials acknowledged they had not yet determined how volunteer activities will be defined or how volunteer activities could be identified through data matching. Current guidance from CMS does not clearly outline what types of volunteer activities count towards compliance with Medicaid work requirements.
  • Education activities. Officials said the state is working on specifics for defining hours of educational activity using course credit hours. The state is also exploring data matching for educational activities, including higher education enrollment data.
  • Work verification. Data matching for work hours was not discussed during the meeting, though officials confirmed that, as required by the reconciliation law, individuals can meet the work requirement if they are working and earn the equivalent of the federal minimum wage multiplied by 80 hours in a qualifying month.
  • Number of enrollees affected. State officials could not yet provide internal estimates of how many enrollees could already be identified as in compliance with the new requirements using currently available data sources, but explained they are currently running models to see who they can identify as being in compliance or exempt from Medicaid work requirements.

KFF is tracking metrics related to Medicaid enrollment, renewal outcomes, and application processing times that can provide insight into a state’s potential readiness to implement data matching and other necessary system changes. As of September 2025, Nebraska was performing in line or better across several renewal metrics compared to the United States national average (Figure 1). Nearly nine in ten applications were processed within 30 days and eight in ten individuals going through a Medicaid eligibility redetermination had their coverage renewed. Of people who retained coverage, 88% were renewed via ex parte processes (meaning the state verifies ongoing eligibility through available data sources before sending a renewal form or requesting documentation from an enrollee), although this percentage in September 2025 was higher than the average of 69% across the prior 6 months. Among those who were disenrolled, 53% were terminated for procedural reasons (meaning an individual was disenrolled because they did not complete the renewal process). While these metrics provide insight into Nebraska’s Medicaid eligibility systems, they are not the only indicators or predictors of successful implementation of work requirements, which will also require enrollee outreach and education, staff training, and coordination with managed care plans, providers, and other stakeholders.

Nebraska Renewal Outcomes and Application Processing Times, September 2025 (Stacked Bars)

As states implement work requirements, ongoing monitoring can help assess how processes are working and identify areas of concern. Central to that oversight is timely data on renewal outcomes, including data on disenrollments related to work requirements. While available data (highlighted above) from CMS can be helpful, these data are not timely enough for real-time monitoring and they do not isolate outcomes for the expansion population. States can fill that gap by reporting more timely data on application and renewal outcomes that include breakouts for individuals subject to work requirements. During the MAC meeting, state officials in Nebraska communicated their intention to be transparent in reporting how many enrollees are disenrolled.

Potential Impact of the Federal Pause on Immigrant Visas From 75 Countries on the U.S. Health Care Workforce

Published: Jan 29, 2026

As part of broader efforts to reduce immigration, the U.S. Department of State (DOS) recently announced that it will pause issuance of all immigrant visas for individuals from 75 countries. This analysis shows that workers from 69 of the 75 countries affected by the pause for which data are available make up nearly one in ten (8%) of the U.S. health care workforce. The pause will likely reduce the supply of workers and particularly health care workers in the U.S., which could exacerbate existing health care worker shortages. Shortages are likely to be compounded by other policies limiting immigration into the U.S. as well as ongoing deportation efforts. Estimates suggest the Trump administration’s policies could reduce legal immigration to the U.S. by 33% to 50% over four years.

On January 14, 2026, the DOS announced that it will pause processing of immigrant visas for individuals from 75 countries who it identified as at, “high risk for use of public benefits” and becoming a public charge. (See Methods for full list of impacted countries). This policy is part of broader efforts to expand public charge policies.The DOS indicates that the pause is being implemented to ensure “immigrants must be financially self-sufficient and not be a financial burden to Americans”. However, the DOS has not provided details about the process used to identify countries subject to the pause. Moreover, few immigrants are eligible for federal benefits due to longstanding restrictions. For example, most lawfully present immigrants have to wait five years after obtaining a “qualified” immigration status to be eligible for federal programs including Medicaid and the Supplemental Nutrition Assistance Program (SNAP).  

The pause went into effect on January 21, 2026, for nationals from the 75 countries applying for immigrant visas. Immigrant visas allow an individual to live and work in the U.S. on a permanent basis and can provide a pathway to citizenship. Examples of immigrant visas include family-based visas (when a U.S. citizen or lawful permanent resident (LPR or “green card” holder) sponsors a family member for permanent residency), certain types of employment-based  visas, as well as refugee visas (although entry of refugees to the U.S. has already largely been eliminated through executive action). Individuals applying for non-immigrant visas such as a student visa, tourist visa, or temporary work visa like H-1B are not impacted by the pause. The DOS states that, during this pause, applicants from impacted countries may submit visa applications and attend visa interviews, but that it will not issue any immigrant visas. The pause does not impact immigrants from the 75 countries who are already present in the U.S.

Foreign-born workers from 69 of the 75 countries impacted by the DOS visa pause for which data are available make up nearly one in ten (8%) of health care workers in the U.S. Based on KFF analysis of 2025 Current Population Survey data, there were 7.8 million foreign-born workers (ages 19 to 64) from 69 of the 75 countries impacted by the visa pause as of 2025, including 1.2 million health care workers. A little over half (55%) of health care workers from these countries are employed in health care support occupations such as home health aides and nursing aides, and the remaining 45% are in health care practitioner and technical occupations such as physicians, surgeons, and nurses. These workers include individuals who may have arrived on immigrant or non-immigrant visas since the data do not include information on visa type. Separate data for the remaining six countries affected by the pause (The Gambia, Kosovo, Kyrgyz Republic, Rwanda, South Sudan, and Tunisia) were not available. Among foreign-born workers from the 69 countries, those from Haiti (13%), Jamaica (10%), and Nigeria (9%) made up about one in three (32%), or the highest shares, of health care workers. Workers from 69 of the 75 countries affected by the DOS visa pause accounted for 6% of the total U.S. adult workforce and 8% of health care workers under age 65 (Figure 1). Immigrants from other countries not impacted by the pause accounted for 14% of the U.S. adult workforce and 11% of health care workers, and U.S.-born citizens accounted for the remaining eight in ten workers.

Foreign-Born Workers from 69 of the 75 Countries Impacted by the DOS Visa Pause Make Up Nearly One in Ten U.S Health Care Workers (Stacked Bars)

Methods

Data source: These findings are based on KFF analysis of the 2025 Current Population Survey Annual Social and Economic Supplement (CPS-ASEC). The CPS is a nationally representative U.S. household survey sponsored jointly by the U.S. Census Bureau and the U.S. Bureau of Labor Statistics and is the “primary source of labor force statistics for the population of the United States”.

Identifying foreign-born workers from impacted countries in CPS-ASEC: Foreign-born workers are identified as those between ages 19 and 64 who report their citizenship group as either “foreign born, US cit by naturalization” or “foreign born, not a US citizen”. Those who further indicate their country of birth as being one of the 75 countries impacted by the DOS visa pause (listed below) are included in the sample of foreign-born workers from countries subject to the visa pause. Of note, CPS does not include country of birth data separately for 6 of the 75 countries impacted by the DOS visa pause, namely The Gambia, Kosovo, Kyrgyz Republic (Kyrgyztan), Rwanda, South Sudan, and Tunisia.

List of impacted countries: Afghanistan, Albania, Algeria, Antigua and Barbuda, Armenia, Azerbaijan, Bahamas, Bangladesh, Barbados, Belarus, Belize, Bhutan, Bosnia and Herzegovina, Brazil, Burma, Cambodia, Cameroon, Cape Verde, Colombia, Cote d’Ivoire, Cuba, Democratic Republic of the Congo, Dominica, Egypt, Eritrea, Ethiopia, Fiji, The Gambia, Georgia, Ghana, Grenada, Guatemala, Guinea, Haiti, Iran, Iraq, Jamaica, Jordan, Kazakhstan, Kosovo, Kuwait, Kyrgyz Republic, Laos, Lebanon, Liberia, Libya, Moldova, Mongolia, Montenegro, Morocco, Nepal, Nicaragua, Nigeria, North Macedonia, Pakistan, Republic of the Congo, Russia, Rwanda, Saint Kitts and Nevis, Saint Lucia, Saint Vincent and the Grenadines, Senegal, Sierra Leone, Somalia, South Sudan, Sudan, Syria, Tanzania, Thailand, Togo, Tunisia, Uganda, Uruguay, Uzbekistan, and Yemen(Source: DOS).

Identifying health care workers in CPS-ASEC: Health care workers are identified as those whose detailed occupation in CPS-ASEC is reported as either “healthcare practitioner and technical occupations” or “healthcare support occupations”.

VOLUME 39

Abortion Pill Safety Decisions by FDA Were Science-Based, New JAMA Study Finds


Highlights

A new study found that Food and Drug Administration (FDA) decisions about the abortion pill mifepristone consistently followed scientific evidence, even as misleading claims about the drug’s safety continue to shape public understanding.

And Google removed some health AI summaries after a Guardian investigation reported that AI-generated summaries for search results about multiple health topics, including cancer screening, liver disease, and mental health conditions, shared false and potentially dangerous health information. While the full extent of inaccurate health information in these AI-generated summaries is unclear, patient advocacy organizations described the examples as “dangerous” and “alarming.”


What We’re Watching

Claims That the FDA Failed to Properly Evaluate Mifepristone Persist as New Study Finds Decisions Were Science-Based 

As FDA leadership initiates a new safety review of mifepristone following claims by abortion opponents that the drug was not adequately evaluated before it was granted approval, a new study published in JAMA examining more than 5,000 pages of internal FDA documents from 2011 to 2023 finds that agency decisions were consistently driven by scientific evidence, not politics. The study found that agency leaders almost always followed the recommendations of career scientists, repeatedly reviewed safety data, and reaffirmed that mifepristone is safe while making cautious changes to access. Despite this detailed analysis documenting the rigor of the FDA’s review process, the Senate’s Health, Education, Labor, and Pensions (HELP) Committee held a hearing this month framed as an inquiry into the abortion pill’s safety, with statements describing mifepristone as putting women in “serious danger.” Evidence continues to demonstrate that mifepristone is a safe medication. KFF polling shows that while twice as many adults say mifepristone is “safe” (42%) than say it is “unsafe” (18%) when taken as directed by a doctor, four in ten express uncertainty over the pill’s safety. Perception of the abortion pill’s safety has declined since 2023 among the public overall (42% view as safe now v. 55% in 2023) and among women ages 18 to 49 (41% view as safe now v. 59% in 2023).

Polling Insights:

KFF’s November 2025 Health Tracking Poll found that the public is largely divided over the intention underlying the FDA’s review of mifepristone. Just over half (53%) of adults and a similar share of women of reproductive age say that Secretary Kennedy’s decision to have the FDA review the safety of the abortion pill is mostly to “make it more difficult to access abortion pills,” while a somewhat smaller share of the public say the decision is mostly to “protect the health and safety of women” (46%).

Views on FDA’s review of mifepristone are largely shaped by partisanship, with most Democrats (81%) saying the decision is largely about curbing access to abortion pills and most Republicans (73%) saying the decision is mostly about protecting the health of women.

Split bar chart showing share of adults who believe RFK Jr.'s call for an FDA review of mifepristone is to protect the health and safety of women versus make it more difficult to access abortion pills. Results shown by total, women of reproductive age, and party.

U.S. Withdraws from International Health Organizations as Trust in Public Health Institutions Declines

The U.S. withdrawal from the World Health Organization took effect this month, with WHO Director-General Tedros Adhanom Ghebreyesus warning that the decision "makes the U.S. unsafe" and "makes the rest of the world unsafe" by cutting access to disease surveillance and emergency response systems. The withdrawal is part of broader U.S. disengagement from international health efforts, including the recent announcement that the U.S. is withdrawing from 31 U.N. entities such as the U.N. Population Fund, the lead U.N. agency focused on global population and reproductive health. Public opinion data suggests the decision lands amid declining and polarized public confidence in the WHO itself. According to an April 2024 poll from Pew Research, about six in ten U.S. adults believed the U.S. benefitted from its membership in the WHO, fewer than the share who said the same in 2021, including an 8 percentage point decrease in the share who say the U.S. benefitted a "great deal." These concerns reflect institutional and diplomatic trust and intersect with broader trust challenges in health. The withdrawal occurs as the U.S. public’s trust in federal health agencies has continued to erode.  As global health partnerships change, health communicators may benefit from tracking changes in trust in health agencies to better understand where audiences turn to for health information.

Fraudulent Ads on Social Media Continue Despite Enforcement Measures 

Fraudulent advertising on social media continues to expose users to misleading and dangerous health claims, impacting how people assess and trust health information online. In early January, the Better Business Bureau (BBB) issued a “scam alert” about fraudulent ads using AI-generated videos of celebrities to promote fake weight-loss products, including unauthorized endorsements for supplements claiming to be GLP-1 medications. The BBB reported receiving more than 170 reports about one such product, with customers spending hundreds of dollars after seeing the fraudulent ads. The use of celebrity likenesses and medical terminology may increase the perceived credibility of these claims, even when the products are not legitimate treatments. The persistence of these false health advertisements is part of broader challenges platforms face in content moderation, with recent investigations finding thousands of deceptive ads remaining active despite prior enforcement. A Reuters investigation also reported that Meta allowed a high number of ads from Chinese partners, including ads for fake health supplements, prioritizing revenue while some enforcement measures were delayed or paused. As misleading health advertising continues, KFF will continue monitoring the types of health information that the public reports seeing and trusting on social media to better inform health communicators of when to intervene.


AI & Emerging Tech

Google’s AI Overviews in Search Results May Give Harmful Health Information

What's happening?

An investigation conducted by The Guardian found that the artificial intelligence (AI)-generated summaries that appear at the top of Google search results, called “AI Overviews,” at times provided inaccurate and misleading information about health topics, potentially giving users false reassurance about serious illness. The Guardian found that the overviews wrongly advised people with pancreatic cancer to avoid high-fat foods, provided misleading information about liver blood test results, and incorrectly identified pap smears as screenings for vaginal cancer. Since the investigation was published, Google removed some AI health summaries tied to specific search queries, but similar prompts can still trigger AI-generated results and broader risks from AI-produced health information remain.

How often do people encounter and trust these overviews?

  • July 2025 polling from the Annenberg Public Policy Center found that nearly two-thirds of Americans who search for health information online had seen AI-generated responses at the top of search results, and most who see these responses consider them at least somewhat reliable, though just 8% consider them “very reliable.” Among adults who have seen AI-generated responses when searching for health information online, about three in ten said the AI responses provided them the answer they needed either “always” or “often.” At the same time, most adults who see these AI-generated responses to health inquiries said they either always or often continue searching by following links to specific websites or other resources.
  • A qualitative study published in the Journal of Medical Internet Research found that participants often skipped these overviews in favor of traditional search results, with some expressing skepticism about them because of a lack of sourcing. Even participants who read the AI-generated summaries continued scrolling to review other results rather than stopping their search, suggesting that some users are adopting a “trust but verify” approach to AI for health information.

Why this matters

The continued prevalence of AI-generated health information, which can contain misleading and harmful advice, suggests a need for both better safeguards from technology companies and clear guidance from health communicators about how to critically evaluate AI-generated health information. Even as research indicates that some users may skip these overviews or try to independently verify their contents, communicators should be aware that patients may be using these AI overviews as starting points for health research.

About The Health Information and Trust Initiative: the Health Information and Trust Initiative is a KFF program aimed at tracking health misinformation in the U.S., analyzing its impact on the American people, and mobilizing media to address the problem. Our goal is to be of service to everyone working on health misinformation, strengthen efforts to counter misinformation, and build trust. 


View all KFF Monitors

The Monitor is a report from KFF’s Health Information and Trust initiative that focuses on recent developments in health information. It’s free and published twice a month.

Sign up to receive KFF Monitor
email updates


Support for the Health Information and Trust initiative is provided by the Robert Wood Johnson Foundation (RWJF). The views expressed do not necessarily reflect the views of RWJF and KFF maintains full editorial control over all of its policy analysis, polling, and journalism activities. The data shared in the Monitor is sourced through media monitoring research conducted by KFF.

Poll Finding

KFF Health Tracking Poll: Health Care Costs, Expiring ACA Tax Credits, and the 2026 Midterms

Published: Jan 29, 2026

Findings

Key Takeaways

  • The cost of health care, including paying for health insurance and out-of-pocket expenses, tops the list of the public’s economic anxieties, rising well above other necessities. Two-thirds of the public (66%) say they worry about being able to afford health care for them and their family, ranking higher than utilities, food and groceries, housing, and gas. In addition, most adults (55%) say their health care costs have gone up in the past year, including at least one in five who say they have increased at a faster rate than food or utilities. A majority (56%) of the public say they expect health care costs for them and their families to become even less affordable in the coming year.
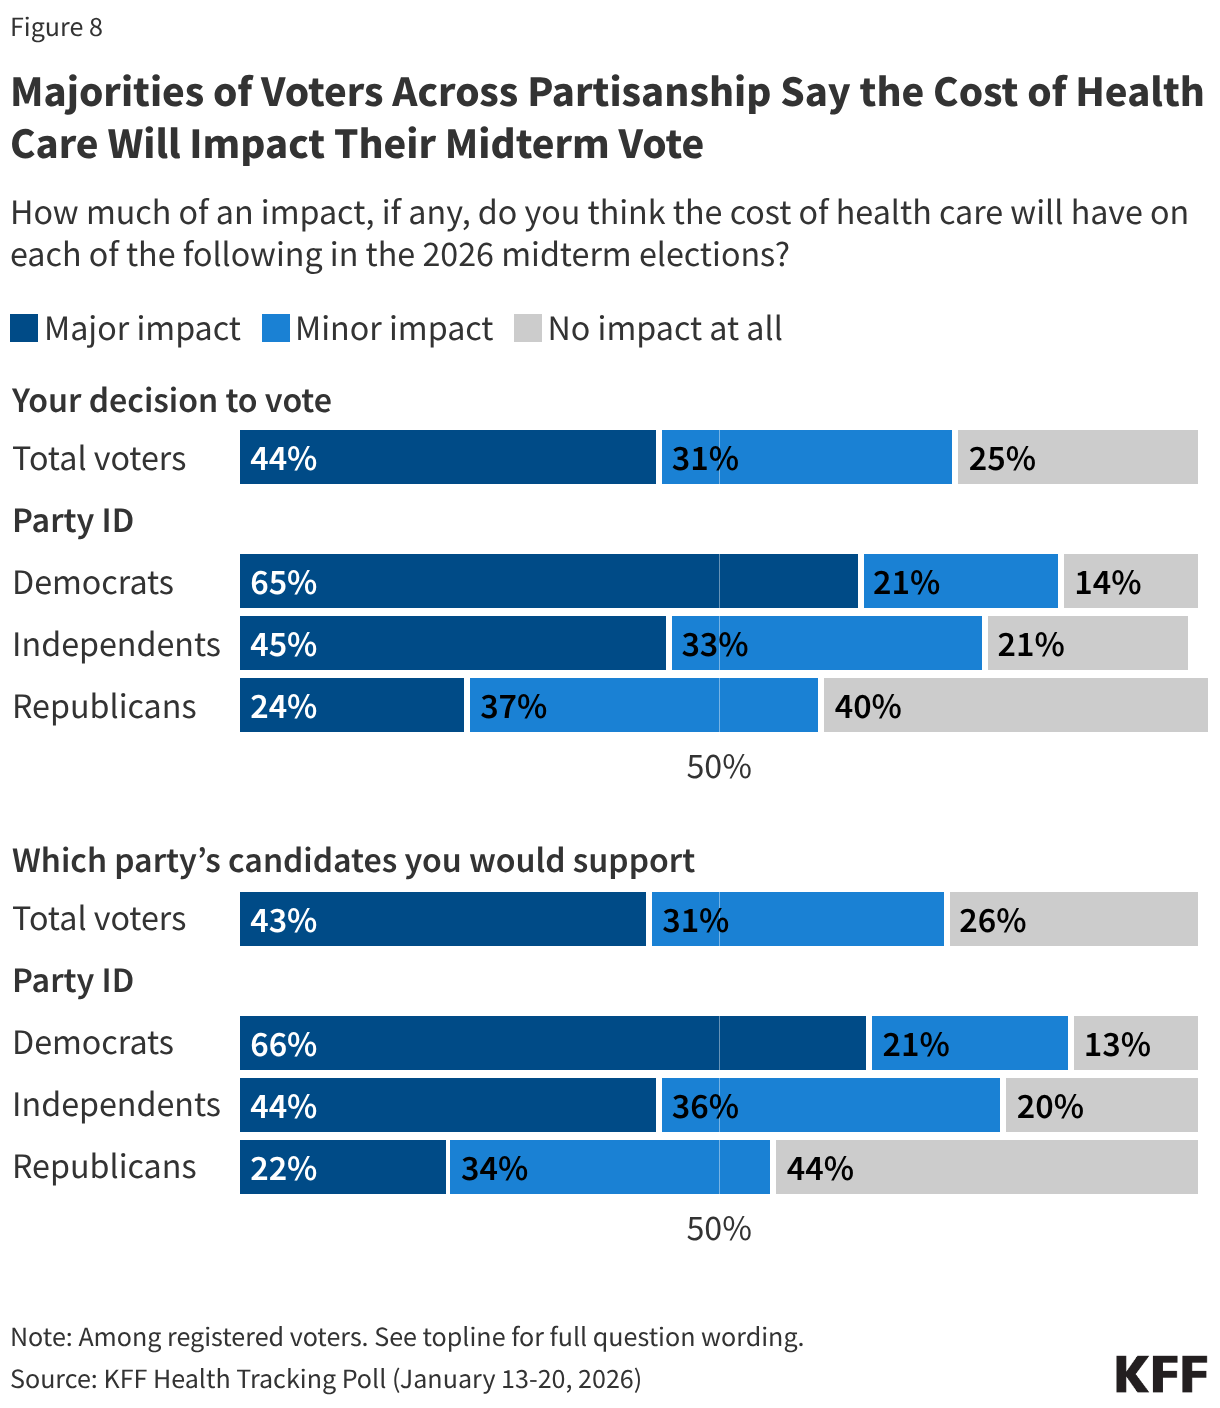
  • With health care costs topping the list of economic worries across partisans and key groups, voters expect the issue to play a major role in their decisions to turnout in November’s midterm elections as well as which candidates they support. Majorities across partisans say health care costs will impact their vote in November, but the issue is resonating more with Democratic voters and independent voters. More than three-quarters of Democratic voters and independent voters say health care costs will impact both their decision to vote and which party’s candidate they will vote for in the election, compared to about half of Republican voters. In fact, two-thirds of Democratic voters and more than four in ten independent voters say health care costs will have a “major impact” on their 2026 voting decisions.
  • The Democratic Party has the advantage when it comes to which party voters trust to handle most health care issues, including health care costs, on which the Democrats have a 13-point advantage over Republicans. The one exception is prescription drug prices, an issue President Trump has focused on in his second term, and on which similar shares of voters say they trust the Democratic Party (35%) and the Republican Party (30%). Among independent voters, the Democratic Party has an edge over the Republican Party on health care issues, but many independent voters also say they don’t trust either party.
  • The public’s anxiety around health care costs comes at a time when the Senate and President Trump seem unlikely to revive the ACA enhanced premium tax credits, which expired on January 1st. Most (67%) of the public say Congress did the “wrong thing” by not extending the credits, including large majorities of Democrats (89%) and independents (72%). But majorities of Republicans (63%) including MAGA supporters (64%) say Congress did the “right thing” by not extending the ACA enhanced premium tax credits. While overall popularity of the ACA and the Marketplaces is still high, given the recent debate around the ACA enhanced tax credit debates, favorability has declined among Republicans.

Health Care Costs Top Public’s Concerns During Moment of Economic Anxiety

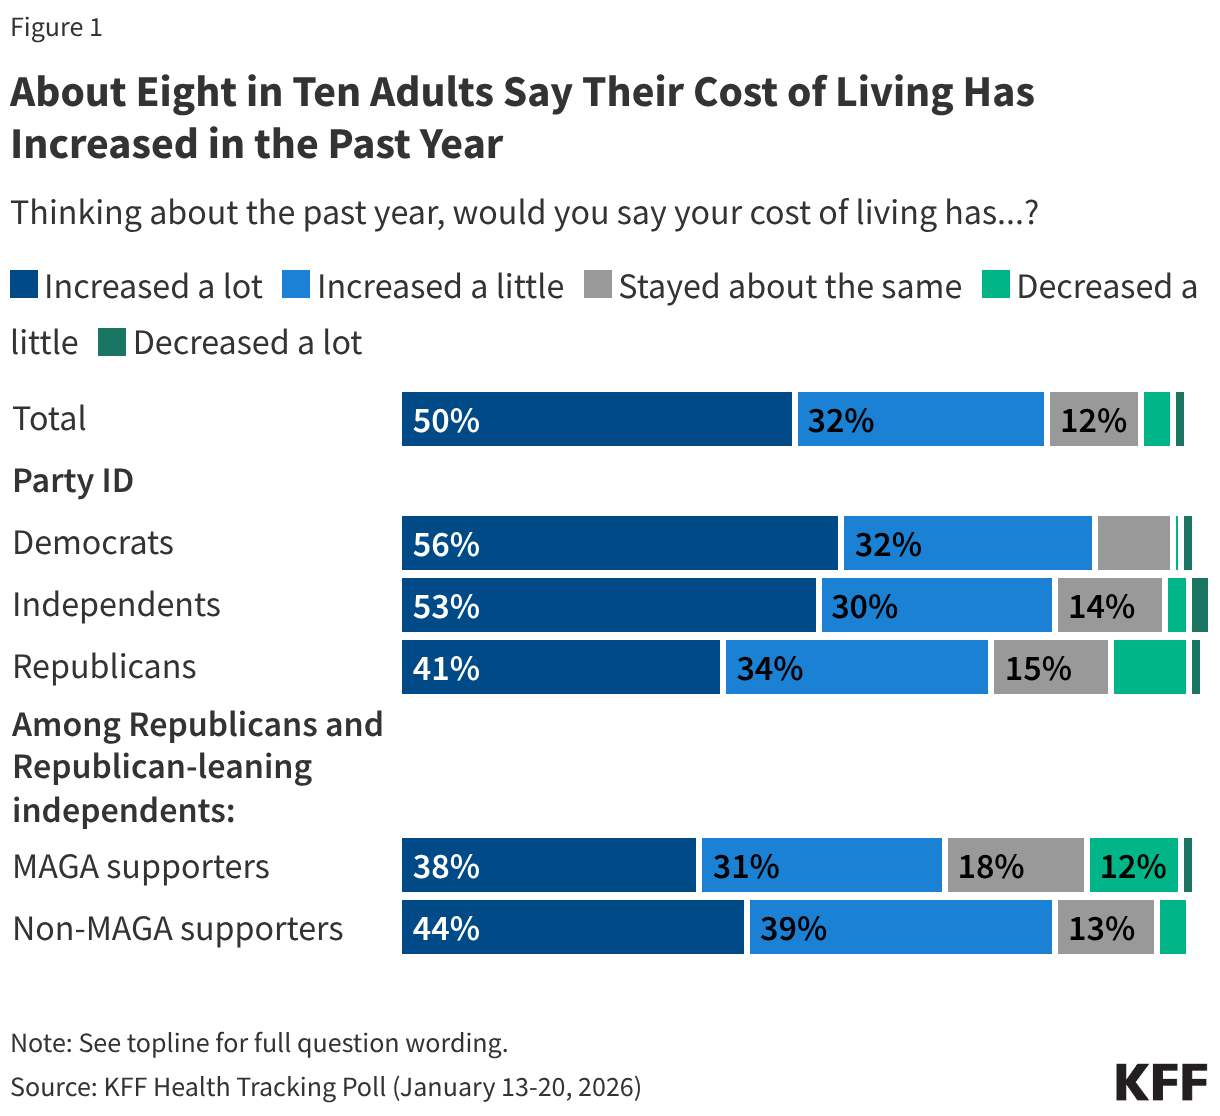
One year into the second term of President Trump and less than ten months before the 2026 midterm elections, the public remains concerned about the top issue of the 2025 election – the economy. Eight in ten (82%) adults say their cost of living has increased in the past year, including half who say it has increased “a lot.” Very few say their cost of living has “decreased” either “a little” (4%) or “a lot” (1%) while about one in ten say their living expenses have remained stable over the past year. Many adults, regardless of partisanship, say their cost of living has increased “a lot” in the past year, including a majority of (56%) Democrats, about half (53%) independents, and four in ten (41%) Republicans. About four in ten (38%) supporters of the Make America Great Again Movement (MAGA) also say their cost of living has increased “a lot” in the past year.

Stacked bar chart showing the public's view on the cost of living in the past year. Shown among total adults and by party identification.

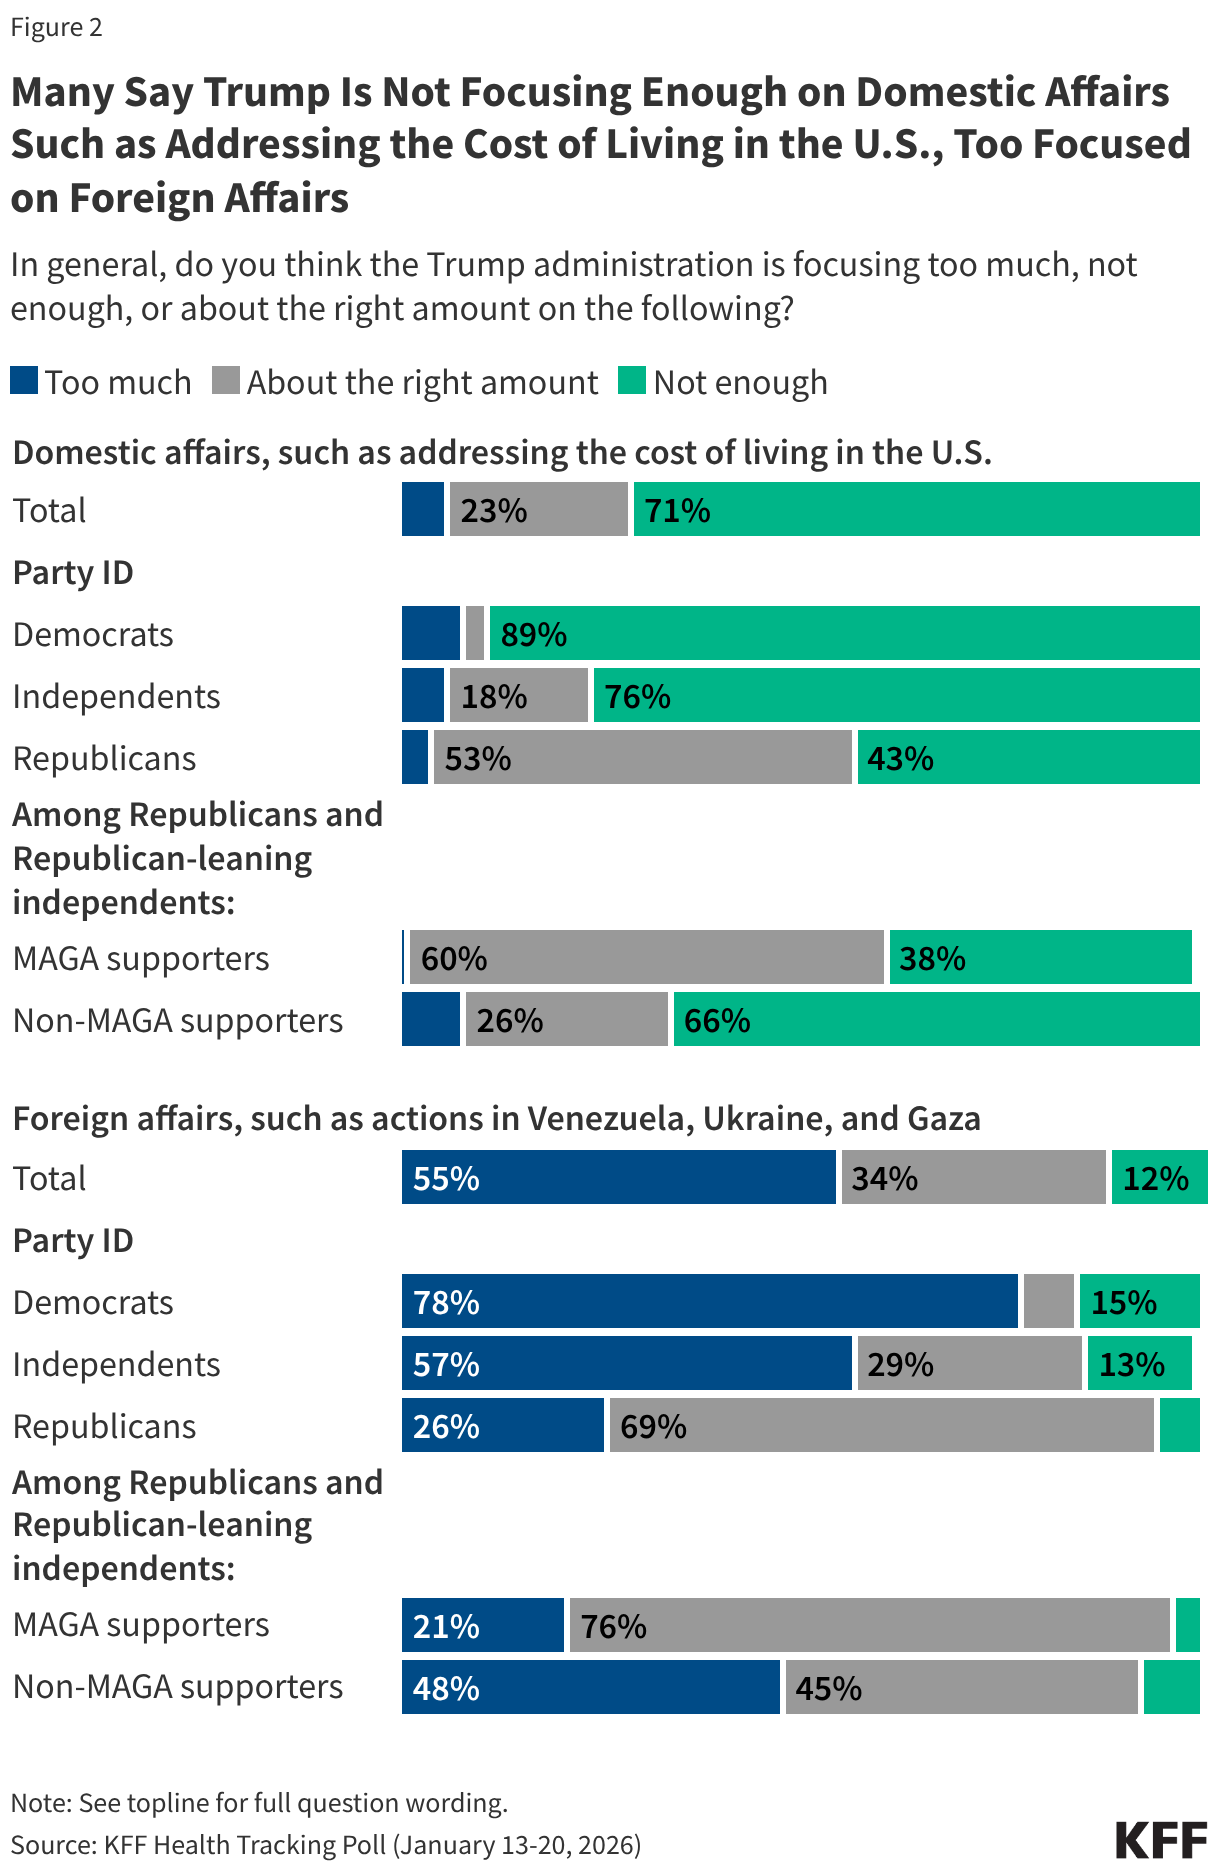
Concerns about household spending coincide with a majority (71%) of the public saying President Trump is not focusing enough on domestic affairs, such as addressing the cost of living in the U.S. The share of the public who say President Trump is not paying enough attention to domestic concerns rises to about nine in ten (89%) Democrats and three-quarters of (76%) independents. On the other hand, a majority of the public (55%) also say the Trump administration is focusing “too much” on foreign affairs, such as actions in Venezuela, Ukraine, and Gaza. Republicans and MAGA supporters are more positive about President Trump’s priorities, with many saying he is spending the “right amount” on both domestic affairs (53% and 60%), and foreign affairs (66% and 76%).

Stacked bar chart showing the shares of the public who say President Trump is focusing too much, not enough, or about the right amount on domestic and foreign affairs. Shown among total adults and by party identification.

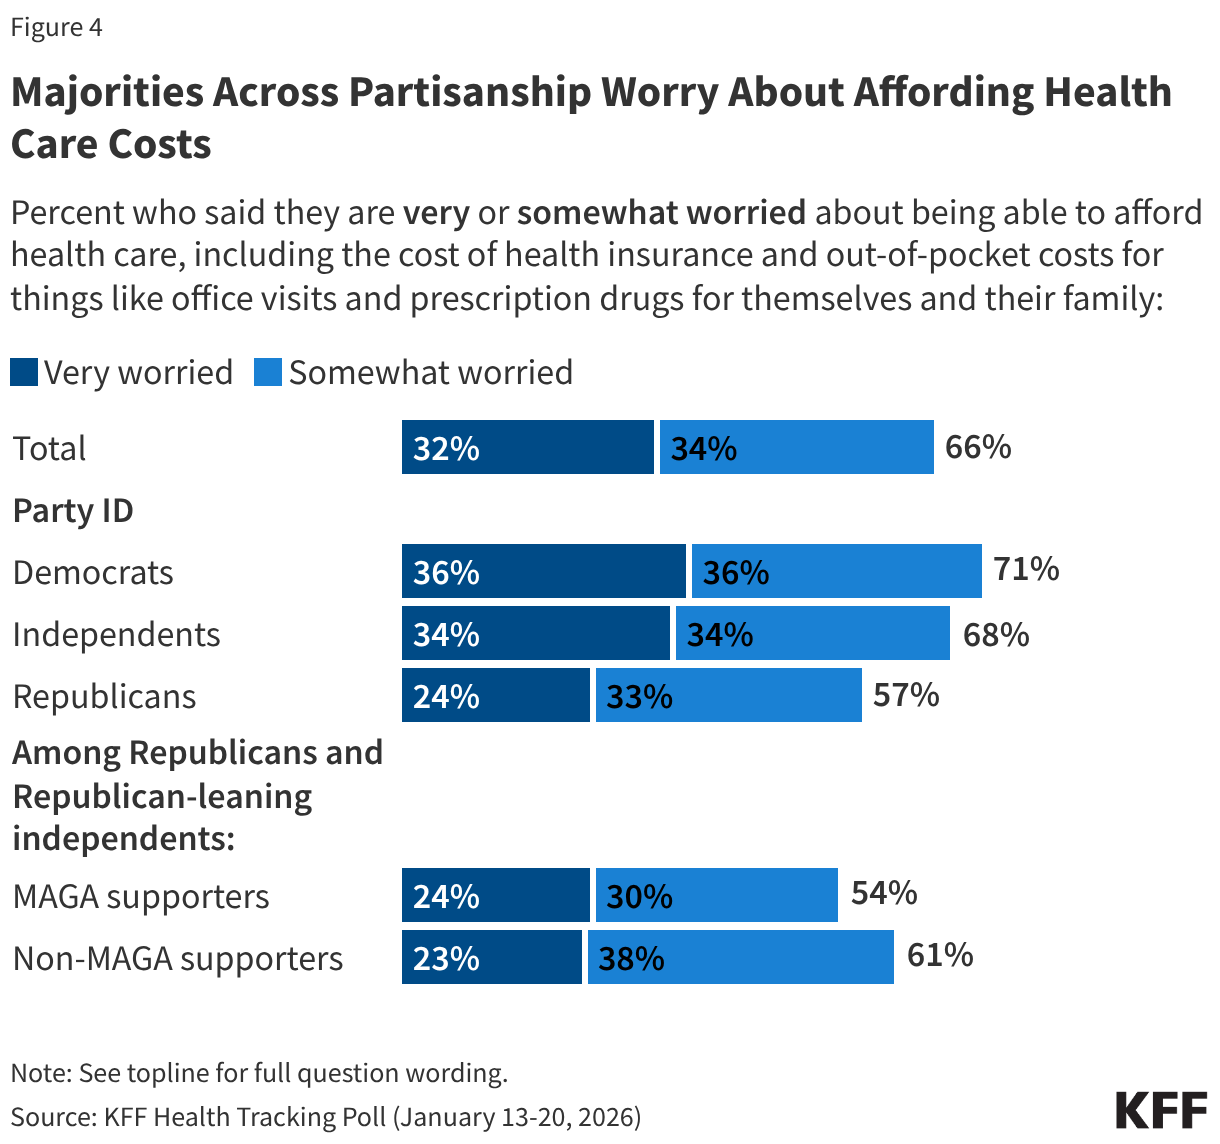
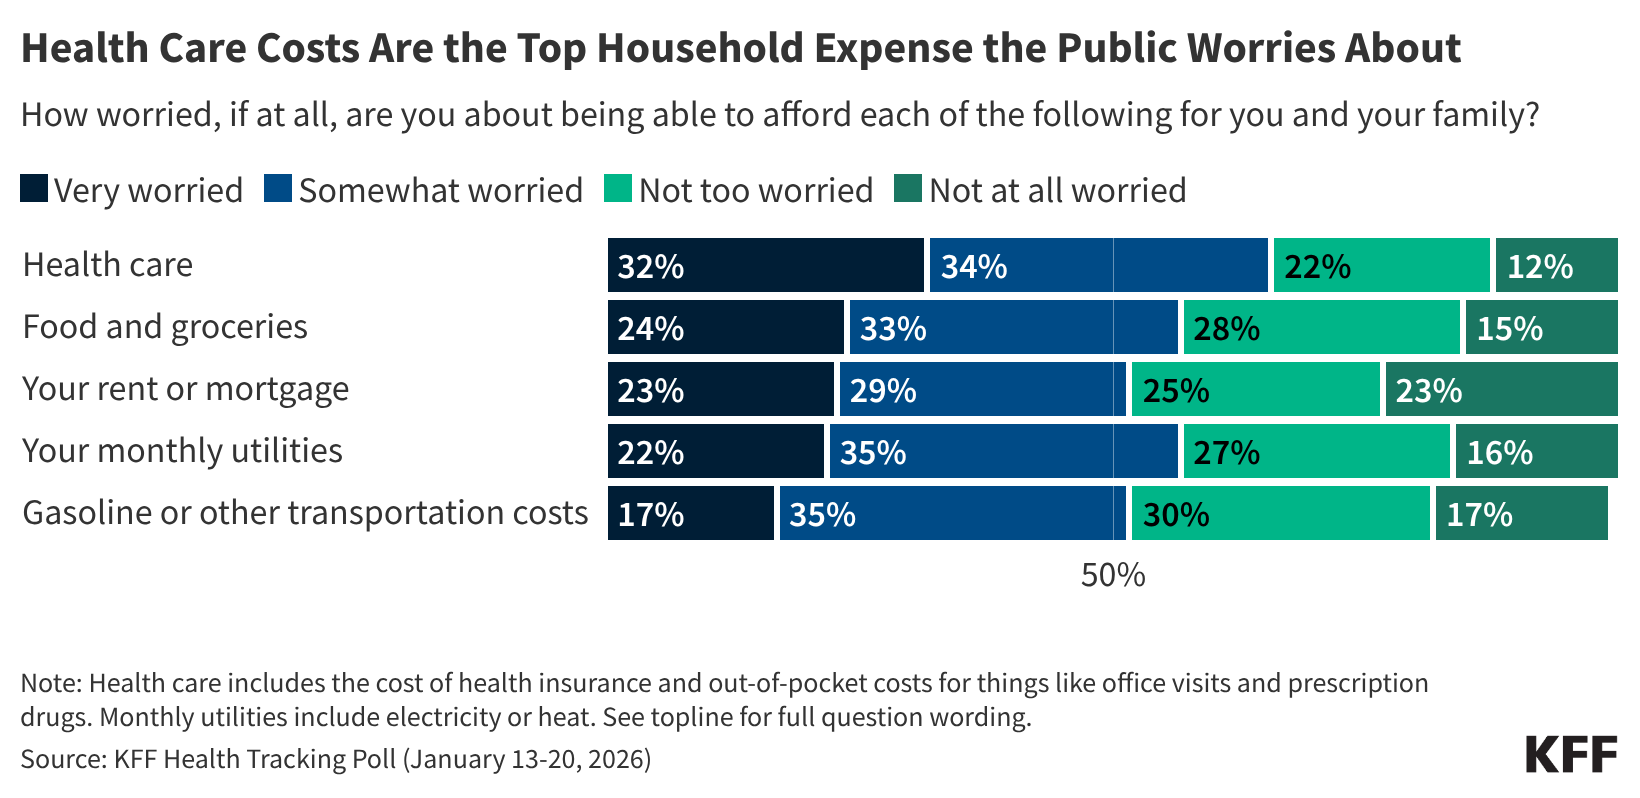
The latest KFF Health Tracking Poll finds health care costs top the list of what the public worries about being able to afford for themselves and their family. Two-thirds (66%) of the public say they worry about paying for health care, including the cost of health insurance and out-of-pocket costs for things like office visits and prescription drugs, ranking higher as a financial worry than other household expenses like utilities, food, and rent or mortgage – all three items on which a majority of Americans are still worried about being able to afford.  About a third of adults (32%) say they are “very worried” about affording health care expenses, while about a quarter of adults say the same about being able to afford food and groceries (24%), their rent or mortgage (23%), or utilities (22%). About a fifth of adults say they are “very worried” about affording gas and transportation costs (17%). This comes as recent reports show that health care costs are on the rise for most Americans and the Affordable Care Act (ACA) enhanced tax credits, which benefitted most people who purchased insurance through the marketplace, have expired.

Stacked bar chart showing the public's levels of worry when it comes to affording living necessities. Shown among total adults.

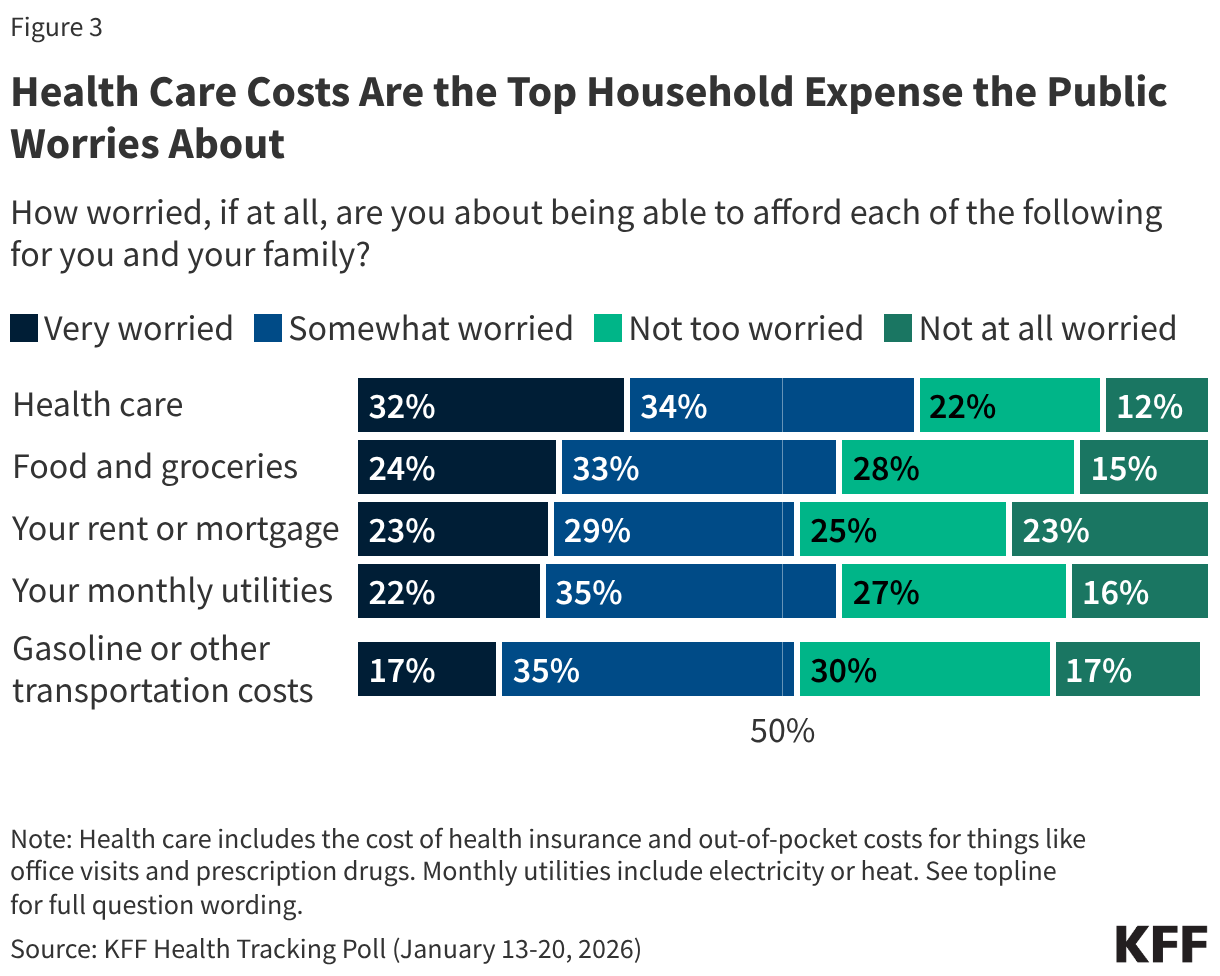
Notably, health care costs are the biggest worry compared to other household expenses for all adults, regardless of partisanship. About one third of Democrats (36%) and Independents (34%) say they are “very” worried about affording health care, as are about one in four (24%) Republicans. This includes one in four MAGA Republicans (23%) and non-MAGA Republicans (24%).

Stacked bar chart showing the public's worry when it comes to affording health care. Shown among total adults and by party identification

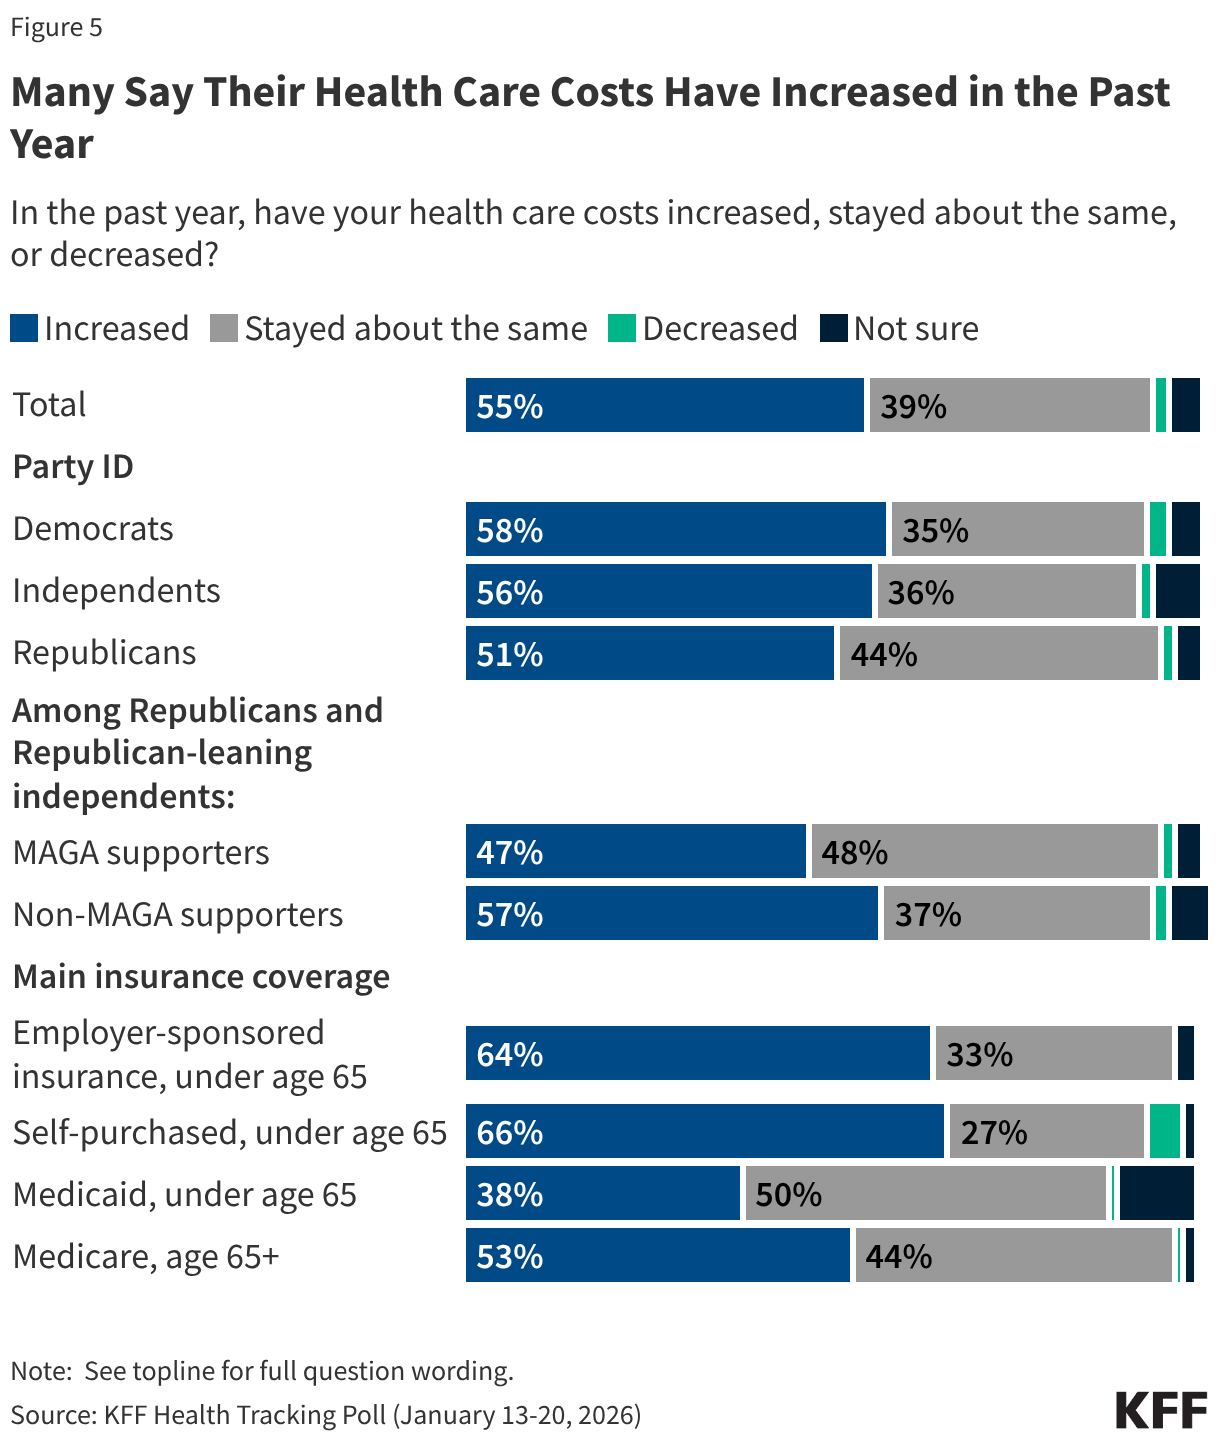
One reason why health care expenses may be topping the list of household worries is that most adults say their health care costs have increased in the past year, including a substantial share who say these costs have increased at a faster rate than other household expenses.

Overall, more than half (55%) of adults say their health care costs have increased in the past year. This includes about two-thirds of people with employer-based health insurance (64%) and those who purchase their own coverage (66%), as well as about half (53%) of Medicare enrollees 65 and older. Perceptions about the increase of health care costs persist across partisanship, with about half or more across partisans saying their health care costs have increased in the past year, including 58% of Democrats, 56% of independents, and 51% of Republicans, including 47% of MAGA Republicans.

Stacked bar chart showing the share of the public who say their health care costs have increased, stayed about the same, or decreased. Shown among total adults, by party identification, and by main insurance coverage type.

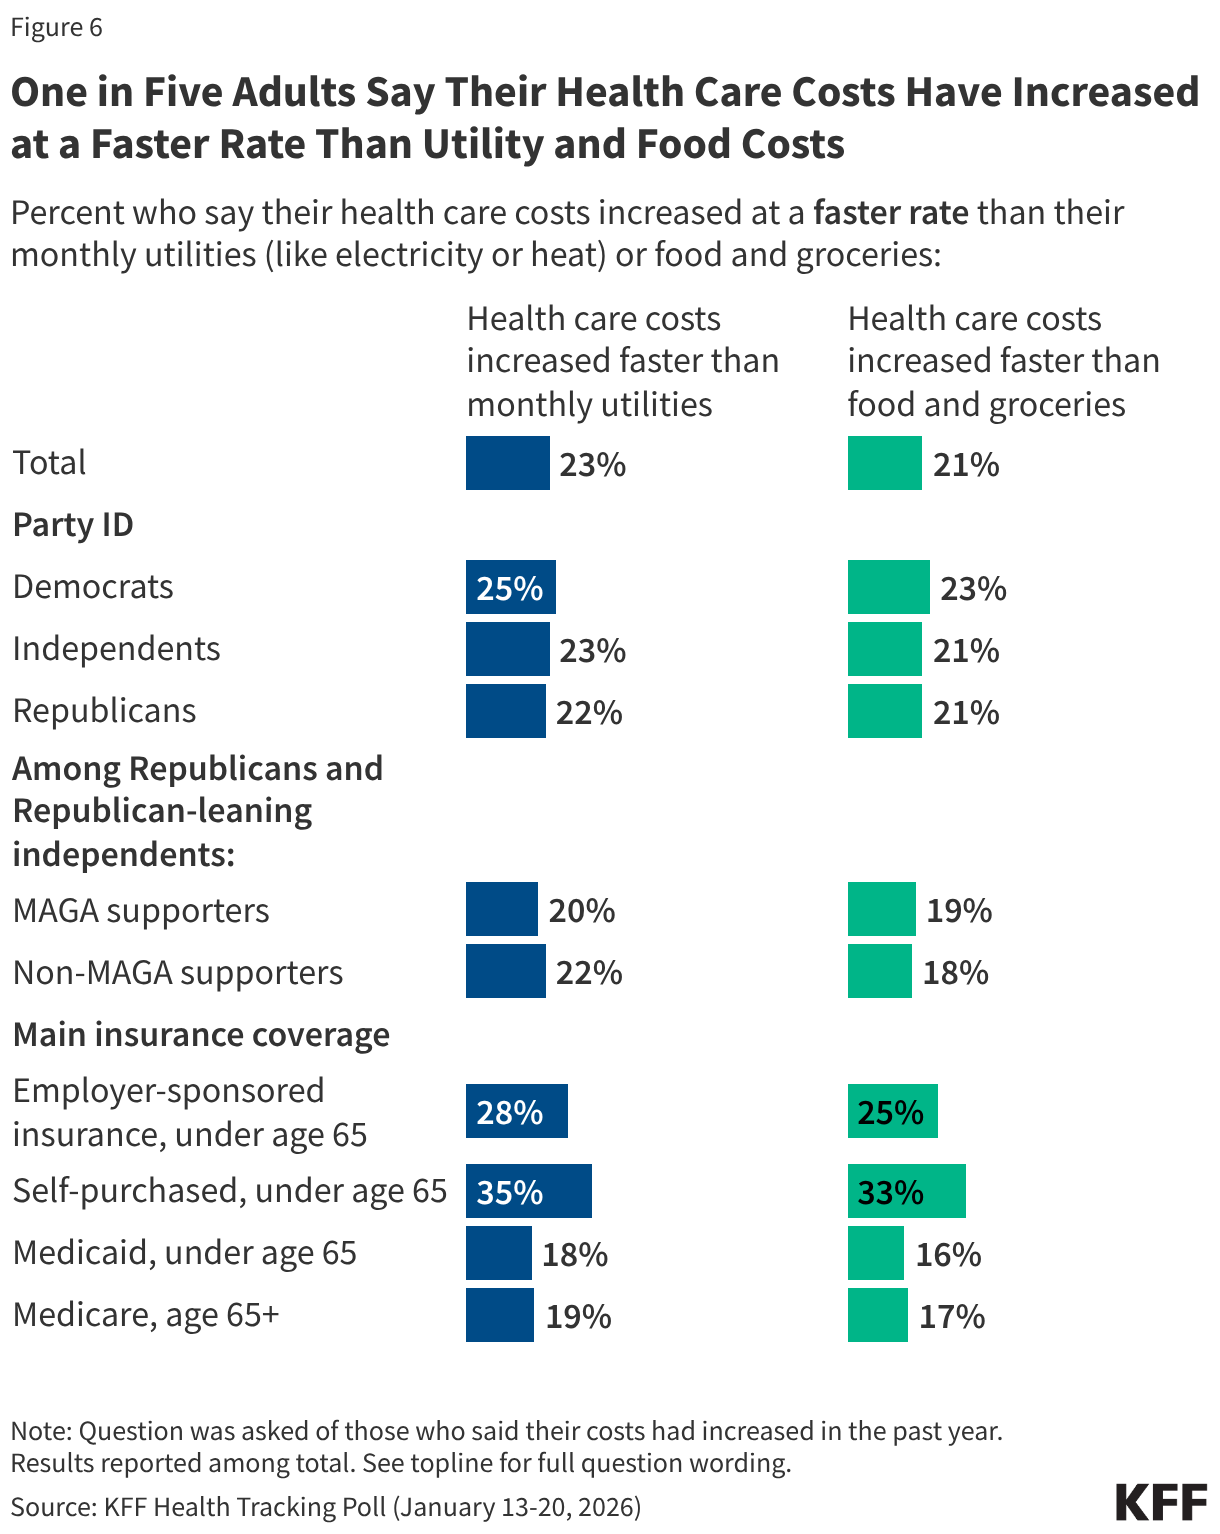
Notably, about one in five of all adults say their health care costs have increased at a faster rate than other necessities like utilities (23%) and food and groceries (21%). This includes similar shares among partisans and MAGA supporters, as well as at least one in four with employer-sponsored insurance and about a third who purchase their own insurance. Smaller shares of adults who receive health insurance through Medicaid and Medicare say their health care costs have increased at a faster rate than utilities and food and groceries, suggesting those with government coverage are more insulated from the rising cost of health care.

Split bar chart showing the share of adults who say their health care costs have increased at a faster rate than their monthly utilities and their food/groceries. Shown among total adults, by party identification, and by main insurance coverage type.

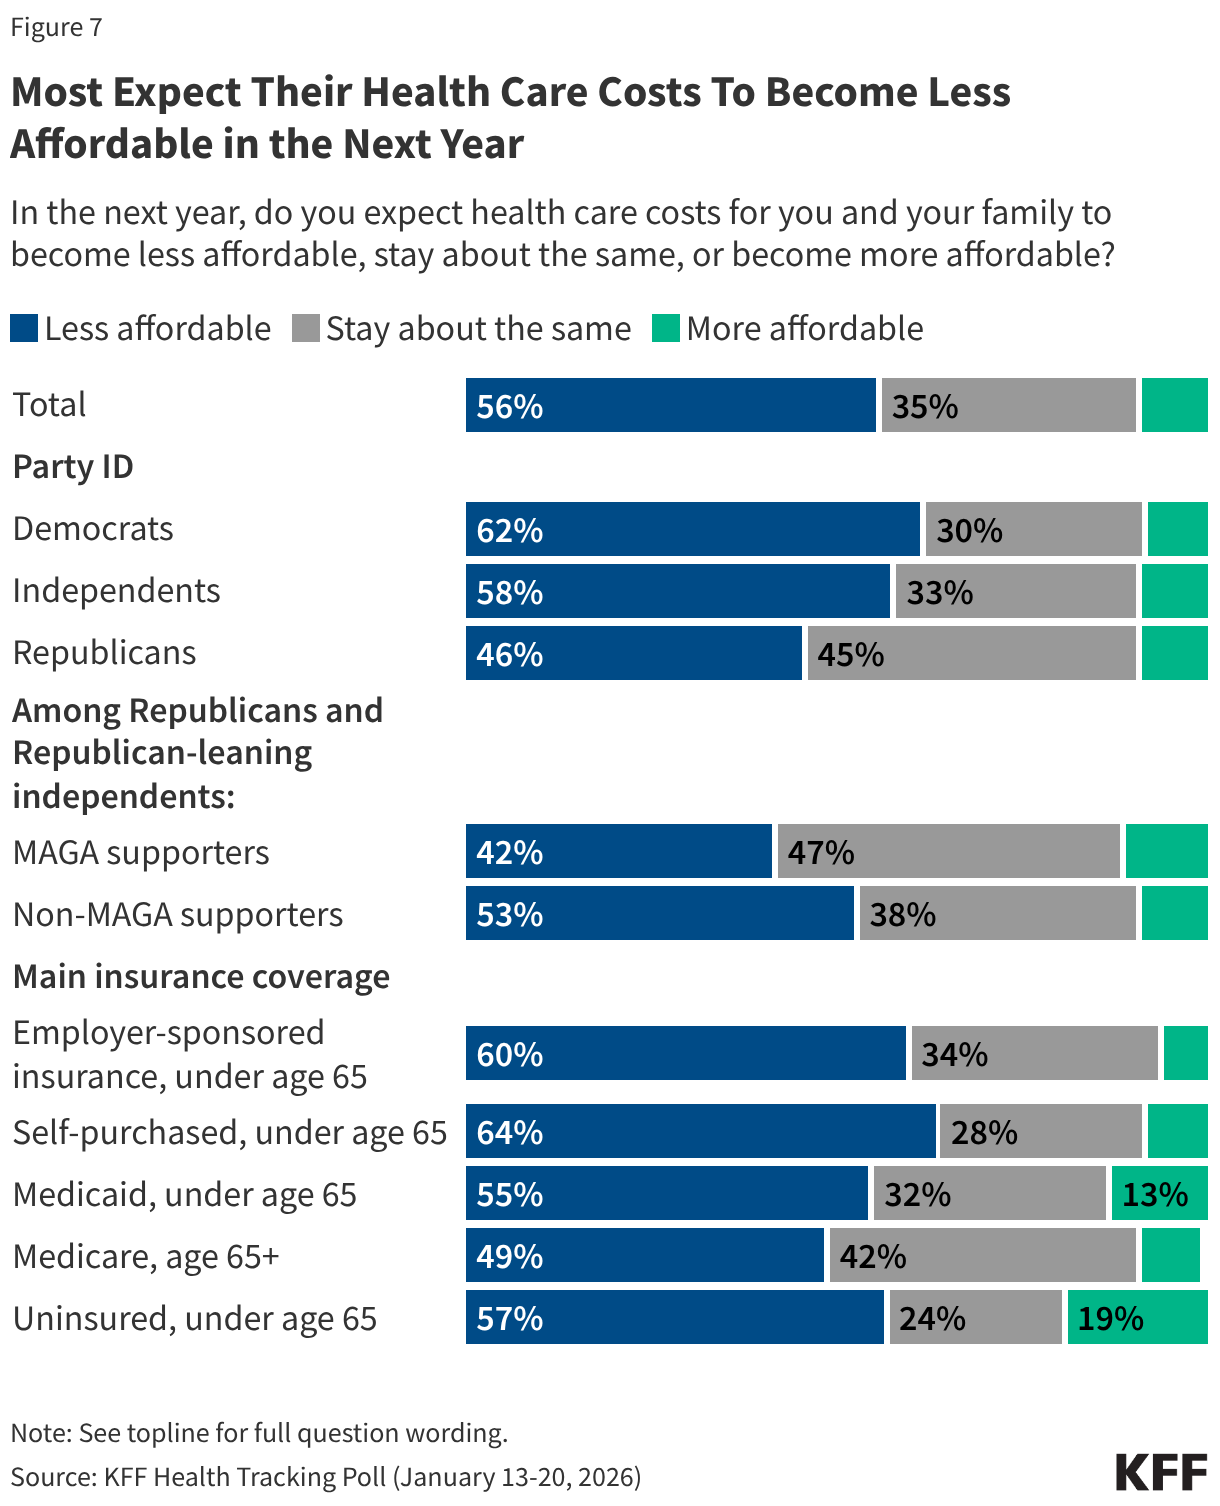
Looking ahead to the next year, a majority (56%) of adults expect their family’s health care costs to become less affordable, while about a third (35%) expect them to stay about the same, and one in ten (9%) expect them to be more affordable. Most Democrats (62%) and independents (58%) expect health care costs to become less affordable, while Republicans, including those who identify as MAGA Republicans are split, with similar shares saying they expect them to become less affordable or expect them to say about the same. Majorities across insurance types expect their health care costs to become less affordable. This includes two-thirds of those who self-purchase (64%) or have employer-sponsored insurance (60%) and majorities of those who are uninsured (57%) or who have coverage through Medicaid (55%).

Stacked bar chart showing the share of the public who say they expect their health care costs to become less affordable, stay about the same, or more affordable in the next year. Shown among total adults, by party identification, and by main insurance coverage type.

Democrats Have an Advantage on Health Care Issues, But No Party Has an Advantage on the Cost of Living 

With health care costs on the rise and a significant source of worry for many, a majority of voters, regardless of partisanship, say the issue will play a role in their voting decisions. The cost of health care is a particularly strong motivator for Democratic voters, of whom more than eight in ten say it will impact their decision to vote and who they will vote for, including two-thirds who say it will have a “major impact.” The cost of health care is a similarly large motivator for independents, of whom about eight in ten say it will impact their vote, including more than four in ten who say it will have a “major impact.” While Democratic and independent voters are more likely to say health care costs are a strong motivator compared to Republican voters, substantial shares of Republican voters say it will impact their decisions in November as well. Six in ten (60%) Republican voters say it will impact their decision to vote and 56% say it will impact which party’s candidate they will vote for. This includes about a fifth of Republican voters who say the cost of health care will have a “major impact.” This suggests that rising health care costs resonate with voters across the board and will be a key voting issue to watch for in this November’s elections.

Stacked bar chart showing the shares of adults who say the cost of health care will have a major impact, minor impact, or no impact at all on their decision to vote or which party's candidate they would support in the 2026 midterm elections. Shown among total voters and by party identification.

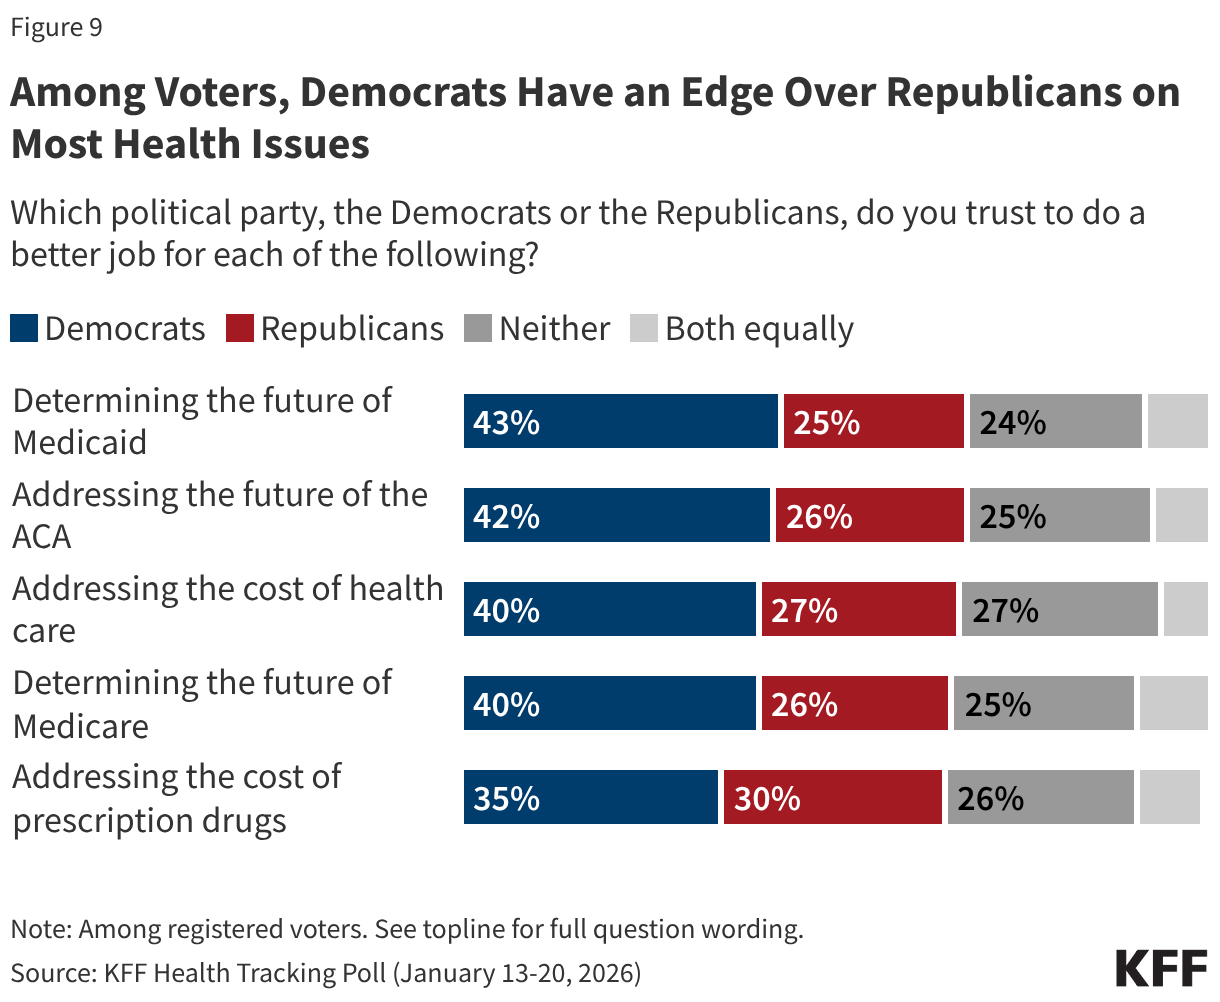
Less than ten months before the 2026 midterm elections, the Democratic Party has a strong edge over the Republican Party when it comes to health care issues, including on the cost of health care. Democrats have a double-digit advantage over the Republicans when it comes to who voters trust on determining the future of Medicaid (43% vs. 25%), addressing the future of the ACA (42% vs. 26%), determining the future of Medicare (40% vs. 26%), and addressing the cost of health care (40% vs. 27%). Voters are more divided on which party they trust to address the cost of prescription drugs, an issue that President Trump has focused on during his second term. Notably, on every health care issue asked about, at least a quarter of voters say they trust neither party to do a better job.

Stacked bar chart showing share of registered voters who say they trust the Democrats, Republicans, or neither party to do a better job addressing key health care issues.

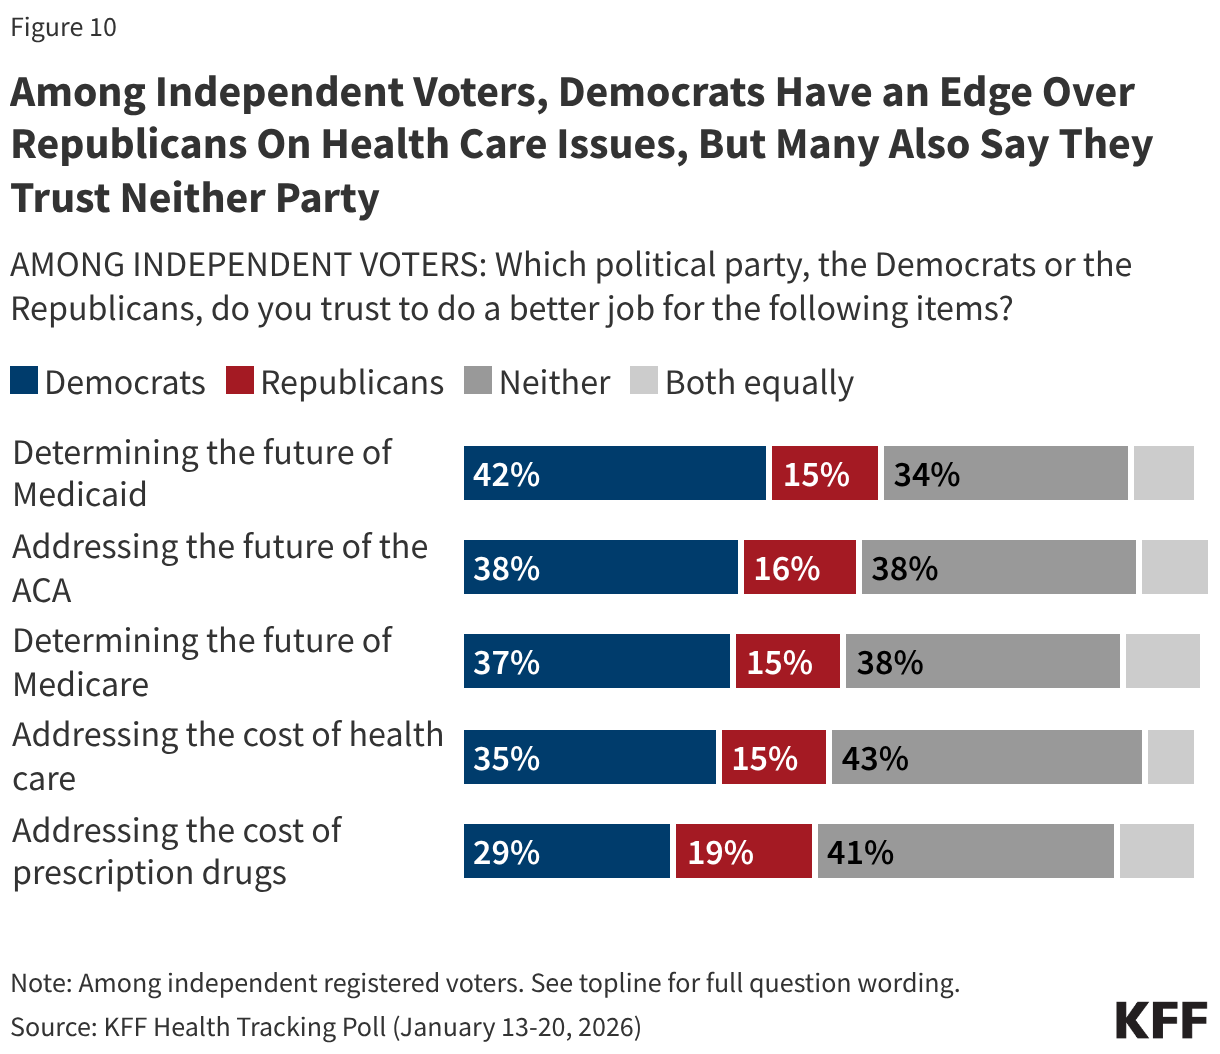
Unsurprisingly, on each health care issue polled, Democratic voters are more likely to say they trust the Democratic Party and Republican voters are more likely to say they trust the Republican Party. Among independent voters, the Democratic Party has a clear advantage over the Republican Party on each of the health care issues; however, sizeable shares of independent voters (between about one-third and four in ten) say they trust “neither” party. When it comes to addressing the cost of prescription drugs, a larger share of independent voters say they trust “neither party” than say they trust either the Democrats or the Republicans.

Stacked bar chart showing the share of independent voters who say they trust the Democrats, Republicans, or neither party to do a better job addressing key health care issues.

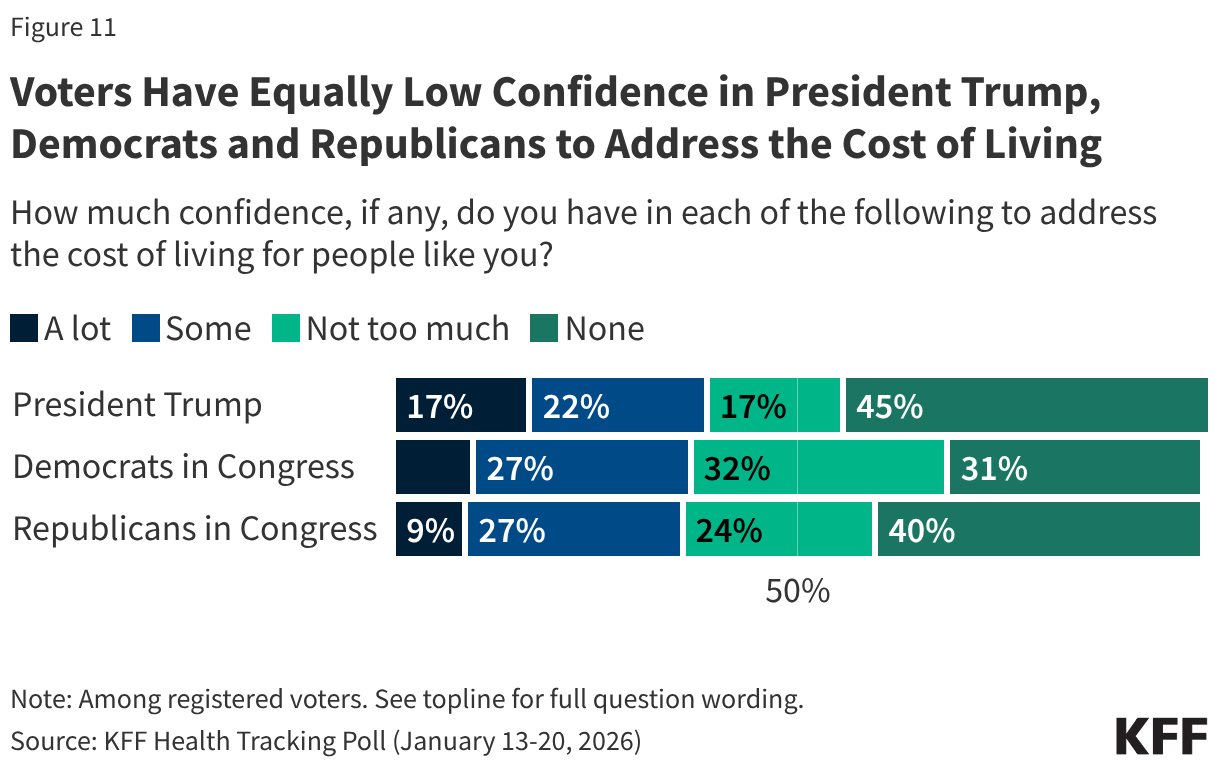
While the Democrats have an advantage among voters overall on health care issues, voter confidence is low when it comes to both political parties and President Trump to address the cost of living. Most voters say they have “not too much” confidence or “none” in the Republicans in Congress (64%), the Democrats in Congress (63%), and President Trump (61%), to address the cost of living for people like them. Small and similar shares of voters overall say they have “a lot” or “some” confidence in President Trump (38%), Democrats in Congress (37%), or Republicans in Congress (36%) to address the cost of living.

Stacked bar chart showing levels of trust among registered voters in President Trump, Democrats in Congress, and Republicans in Congress to address the cost of living for people like them.

Amid the ACA Tax Credits Debate, Favorability of the ACA and ACA Marketplace Remains High, but Has Declined Among Republicans  

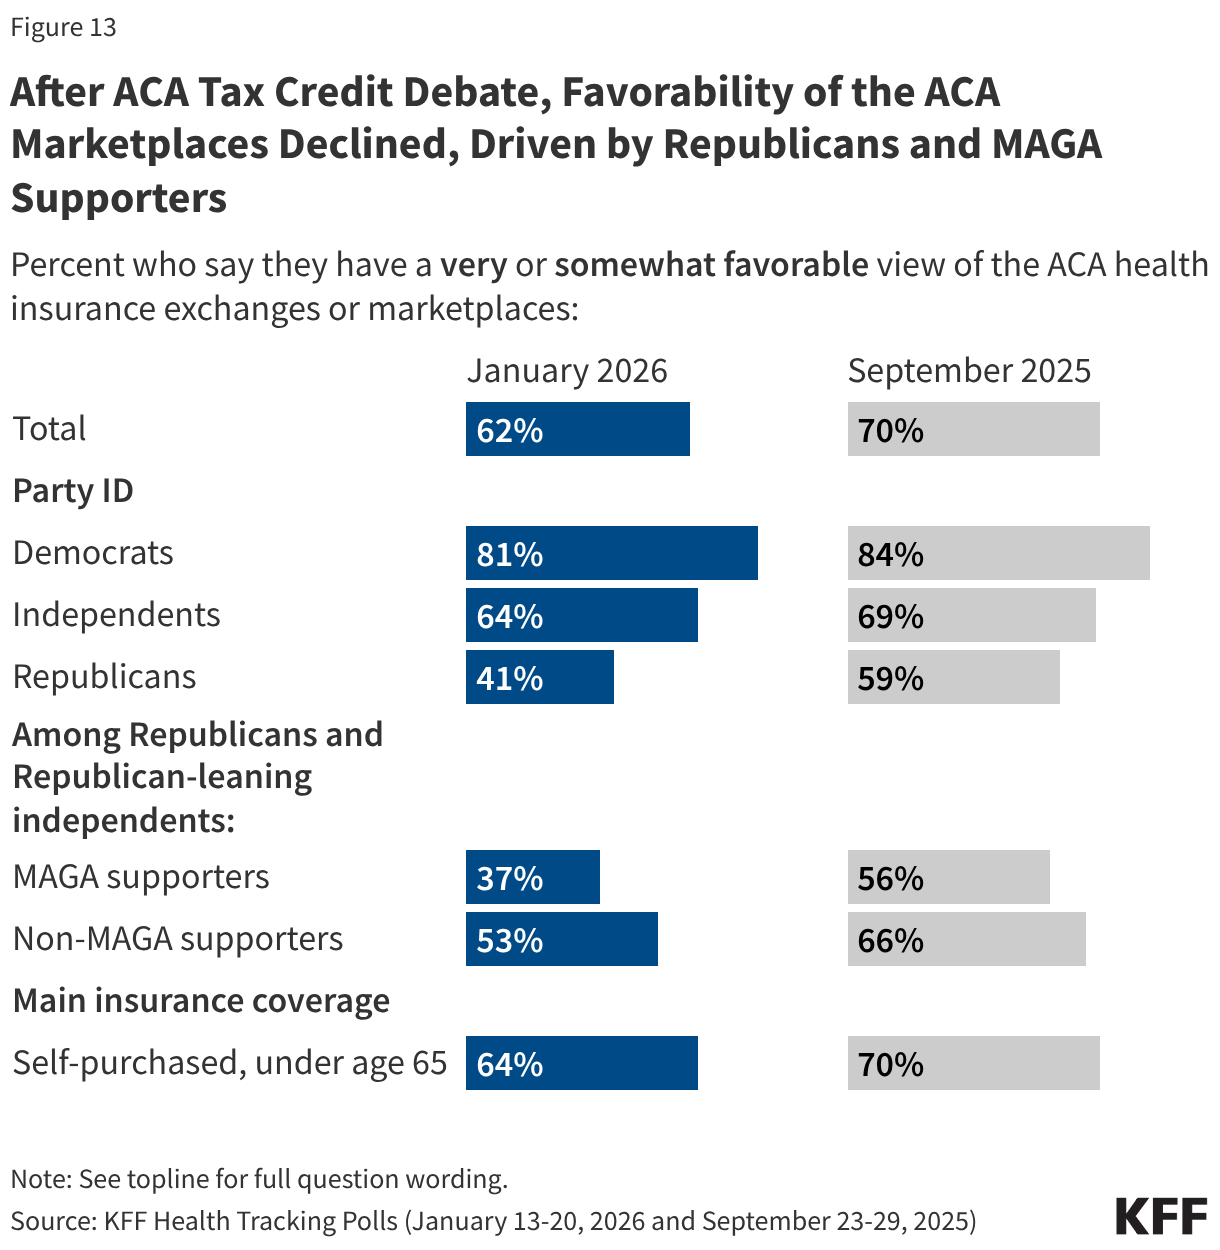
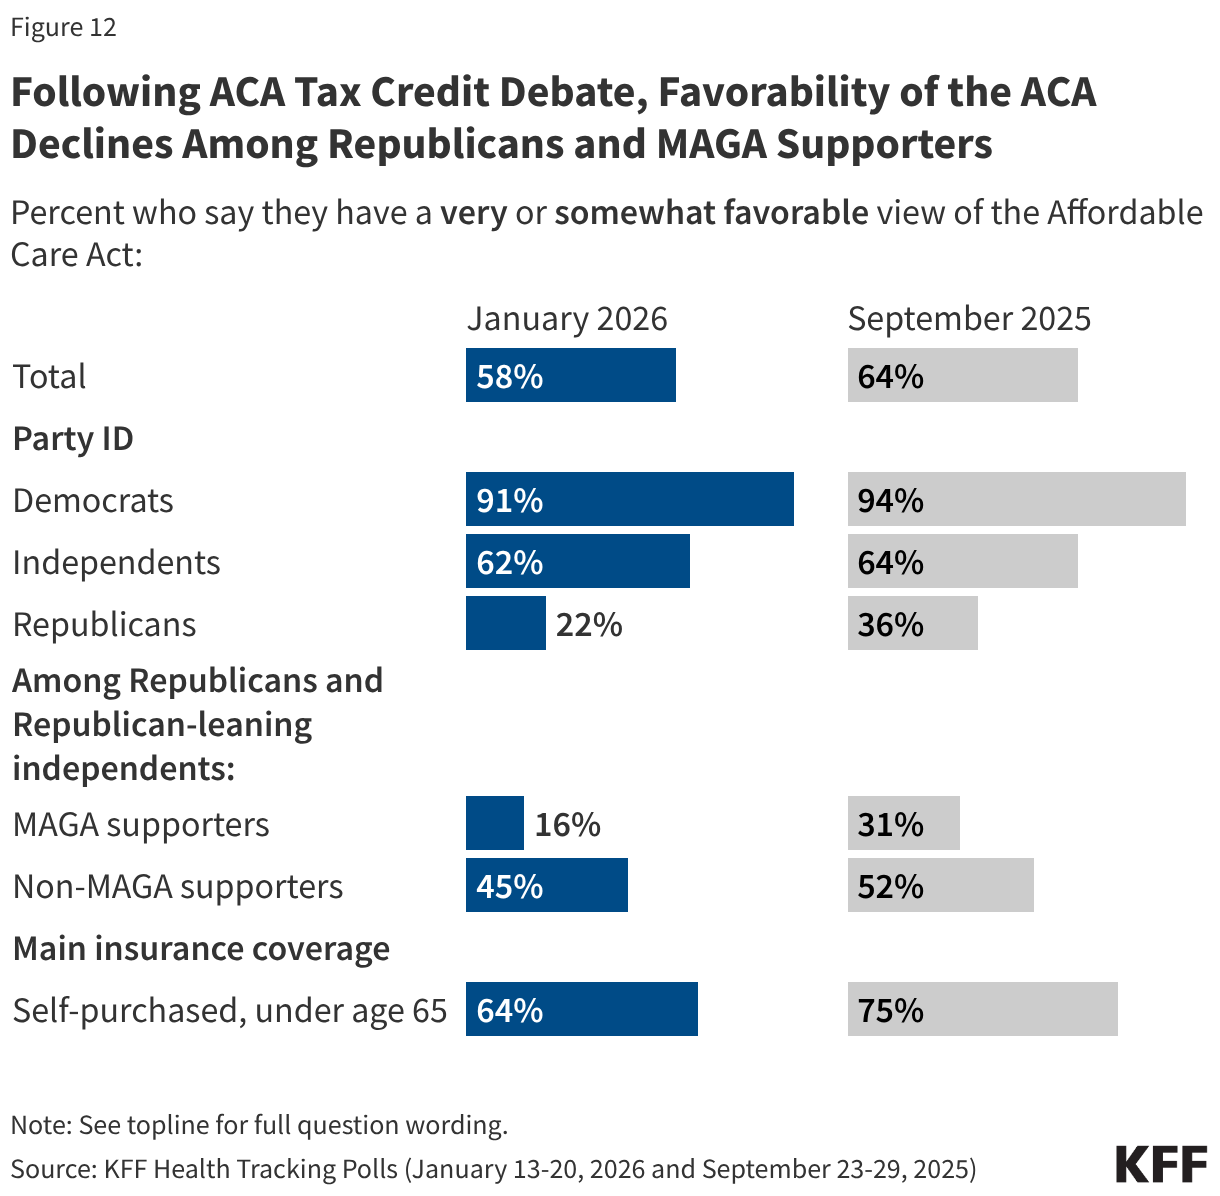
While a majority of the public continues to express a favorable view of the ACA, Republicans’ views have soured recently in the wake of the debate over extending the enhanced tax credits and Republican lawmakers’ persistent attacks on the 2010 health care law. Overall favorability of the ACA has dropped in the most recent poll, with 58% now saying they have a favorable view of the law and 41% saying they have an unfavorable view (down from 64% favorable, 35% unfavorable in September 2025). The overall decline in favorability of the ACA is driven by Republicans, of whom one in five (22%) now say they have a “very” or “somewhat” favorable view, compared to one-third (36%) who said the same in September. Views of the ACA remain positive and stable among Democrats (91%) and independents (62%), as well as among individuals who buy their own health coverage (64%).

Split bar chart showing the shares adults who say they have a very or somewhat favorable view of the Affordable Care Act in January 2026 versus September 2025. Shown among total adults, among adults with self-purchased insurance coverage, and by party identification.

Favorable views of the ACA marketplaces where people and small businesses owners can shop for health insurance have also declined from 70% in September 2025 to 62% in the latest KFF Health Tracking Poll. Similarly to views of the ACA overall, this shift is driven by Republicans (41% now vs. 59% in September 2025 who said they view the marketplace favorably). Views of the ACA marketplaces are stable and favorable among Democrats (81%), independents (64%), and among those who self-purchase their insurance (64%).

Split bar chart showing the shares of adults who say they have a very or somewhat favorable view of the ACA health insurance exchanges or marketplaces in January 2026 versus September 2025. Shown among total adults, among adults with self-purchased insurance coverage, and by party identification.

Most Say Congress Did the “Wrong Thing” Not Extending the ACA Tax Credits

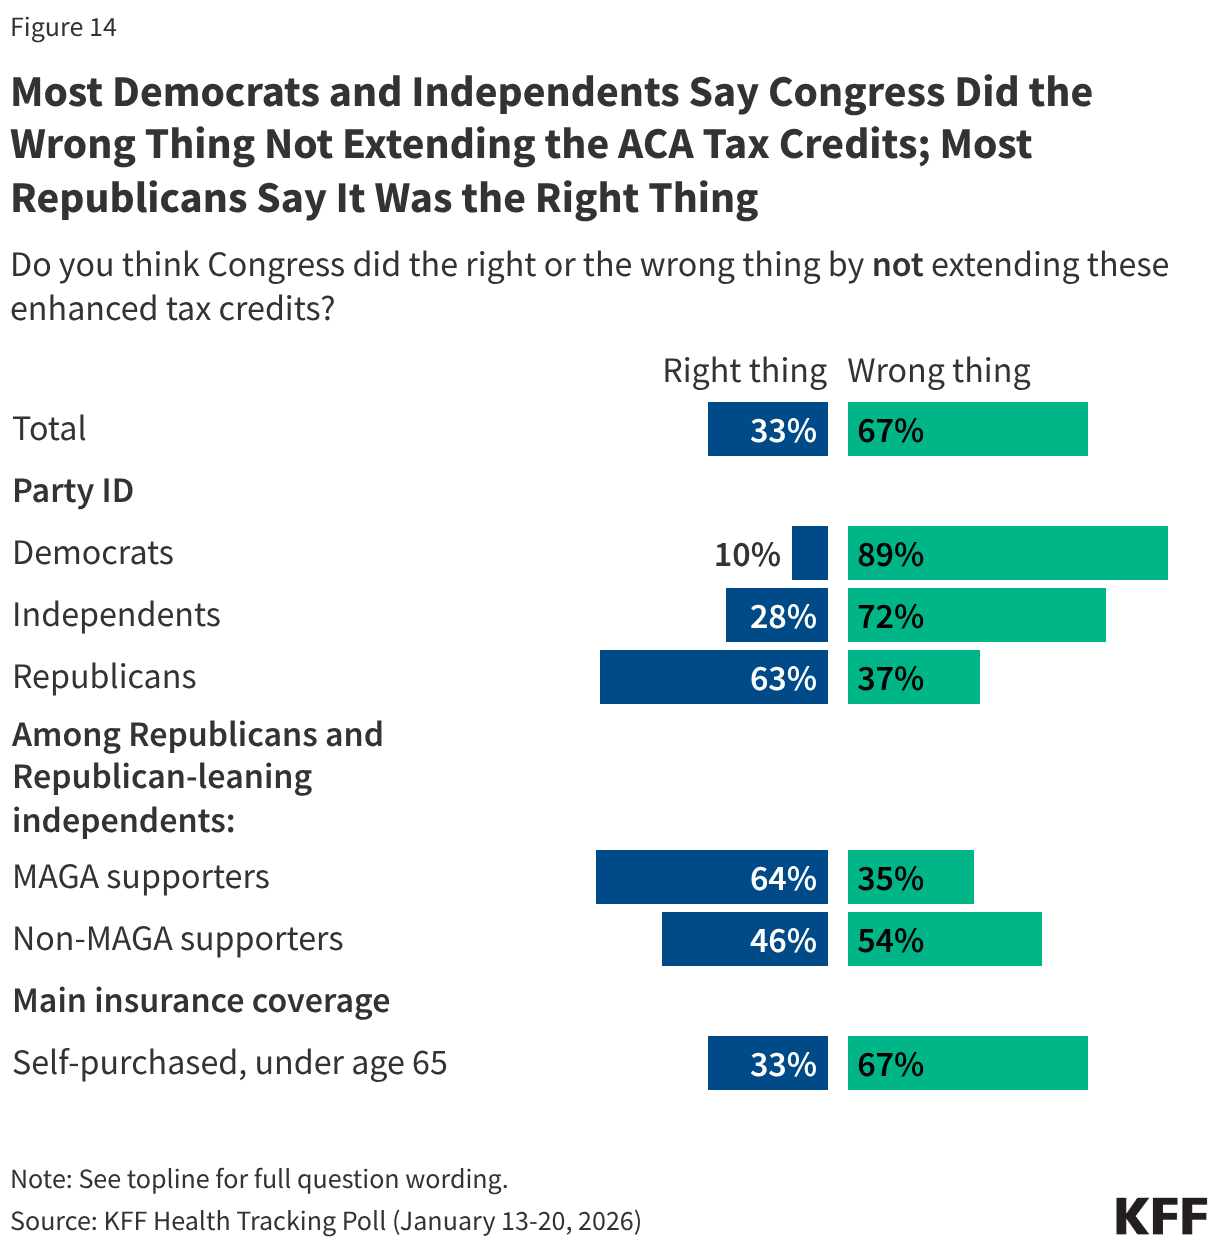
The public is largely critical of Congress not extending the ACA enhanced tax credits for people who buy their own health coverage. Two-thirds of the public say Congress did the “wrong thing” by not extending the ACA enhanced tax credits, compared to one-third who say Congress did the “right thing.” Majorities of Democrats (89%), independents (72%), non-MAGA Republicans (54%), and those who purchase their insurance themselves (67%) say Congress did the “wrong thing” by not extending the tax credits. While most (63%) Republicans say Congress did the “right thing” by not extending the tax credits, a sizeable share, about four in ten (37%), say Congress did the “wrong thing.” This marks a shift in views from when debates over to extend the tax credits or not were still ongoing in November, when half of Republicans said Congress should extend the tax credits, suggesting the debates have shifted opinion among the Republican base.

Mirrored bar chart showing the share of the public who say Congress did the right thing or the wrong thing by not extending the enhanced tax credits. Shown among total adults, among adults with self-purchased insurance coverage, and by party identification.

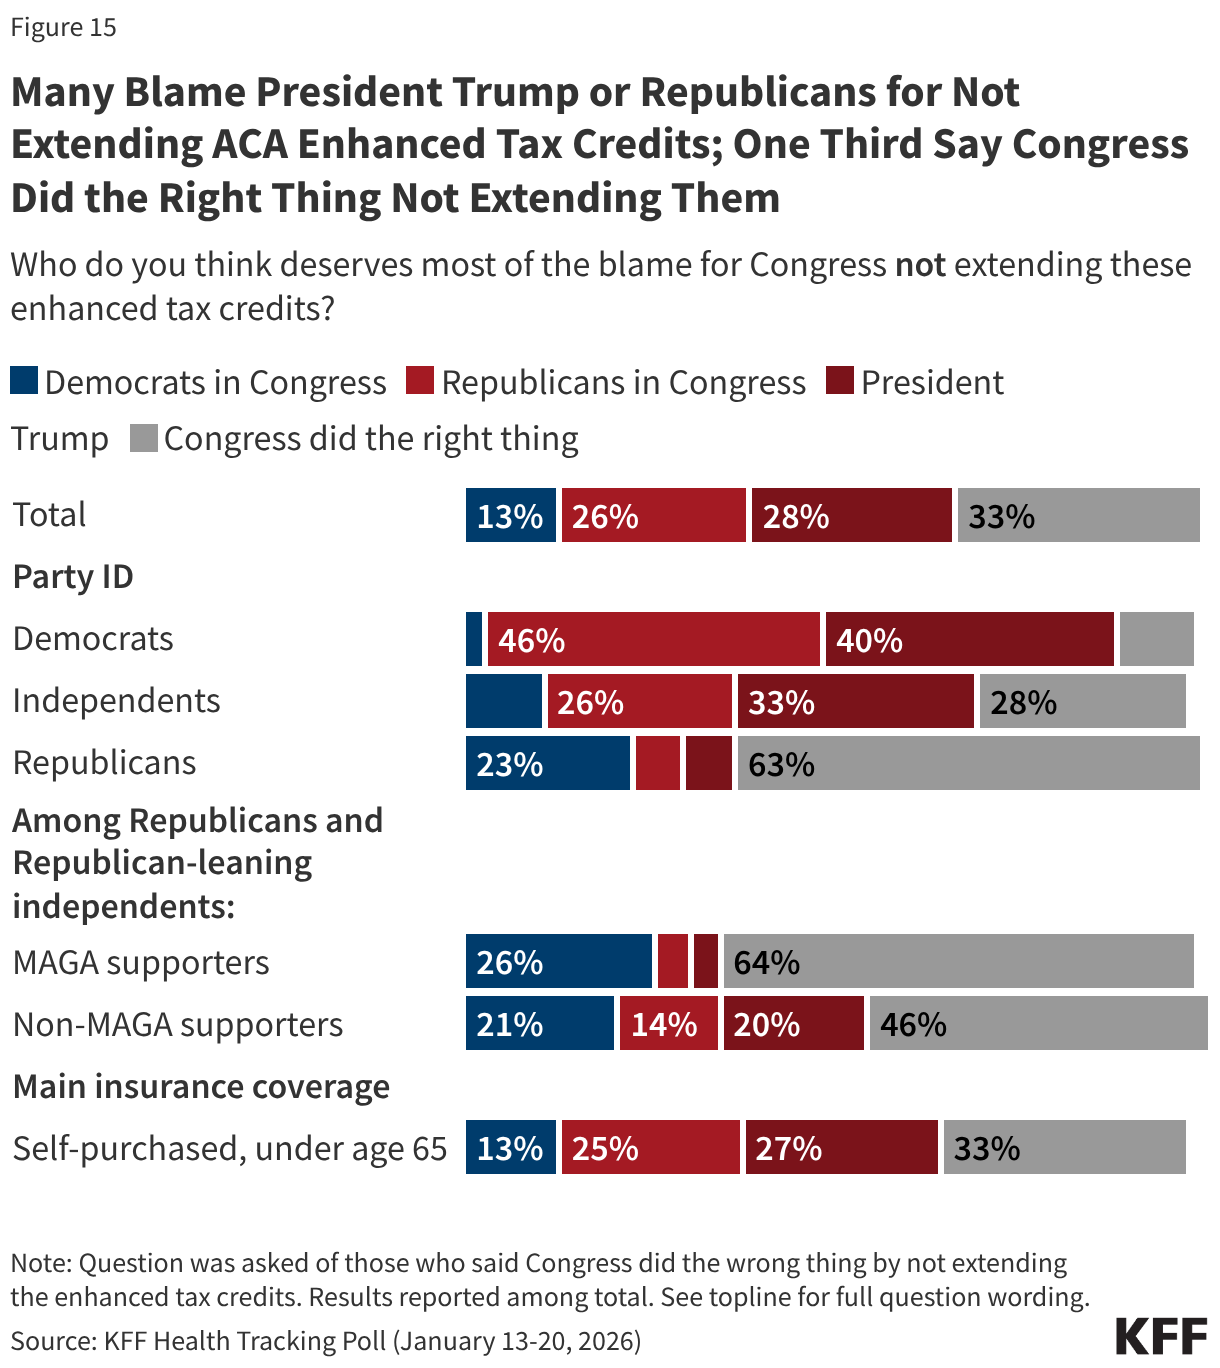
Among those who think the enhanced tax credits should have been extended, a group that leans more Democratic, many say most of the blame either falls on President Trump (42%, 28% of total adults) or Republicans in Congress (38%, or 26% of total adults). About one in five (19%, or 13% of total adults) say Democrats in Congress deserve the most blame. Among the four in ten Republicans who say Congress did the “wrong thing” not extending the tax credits, two-thirds (64%) blame Democrats in Congress for their expiration, rising to seven in ten (72%) MAGA-supporters.

Stacked bar chart showing who the public thinks deserves the most blame for Congress not extending the enhanced tax credits. Shown among total adults, among adults with self-purchased insurance coverage, and by party identification.

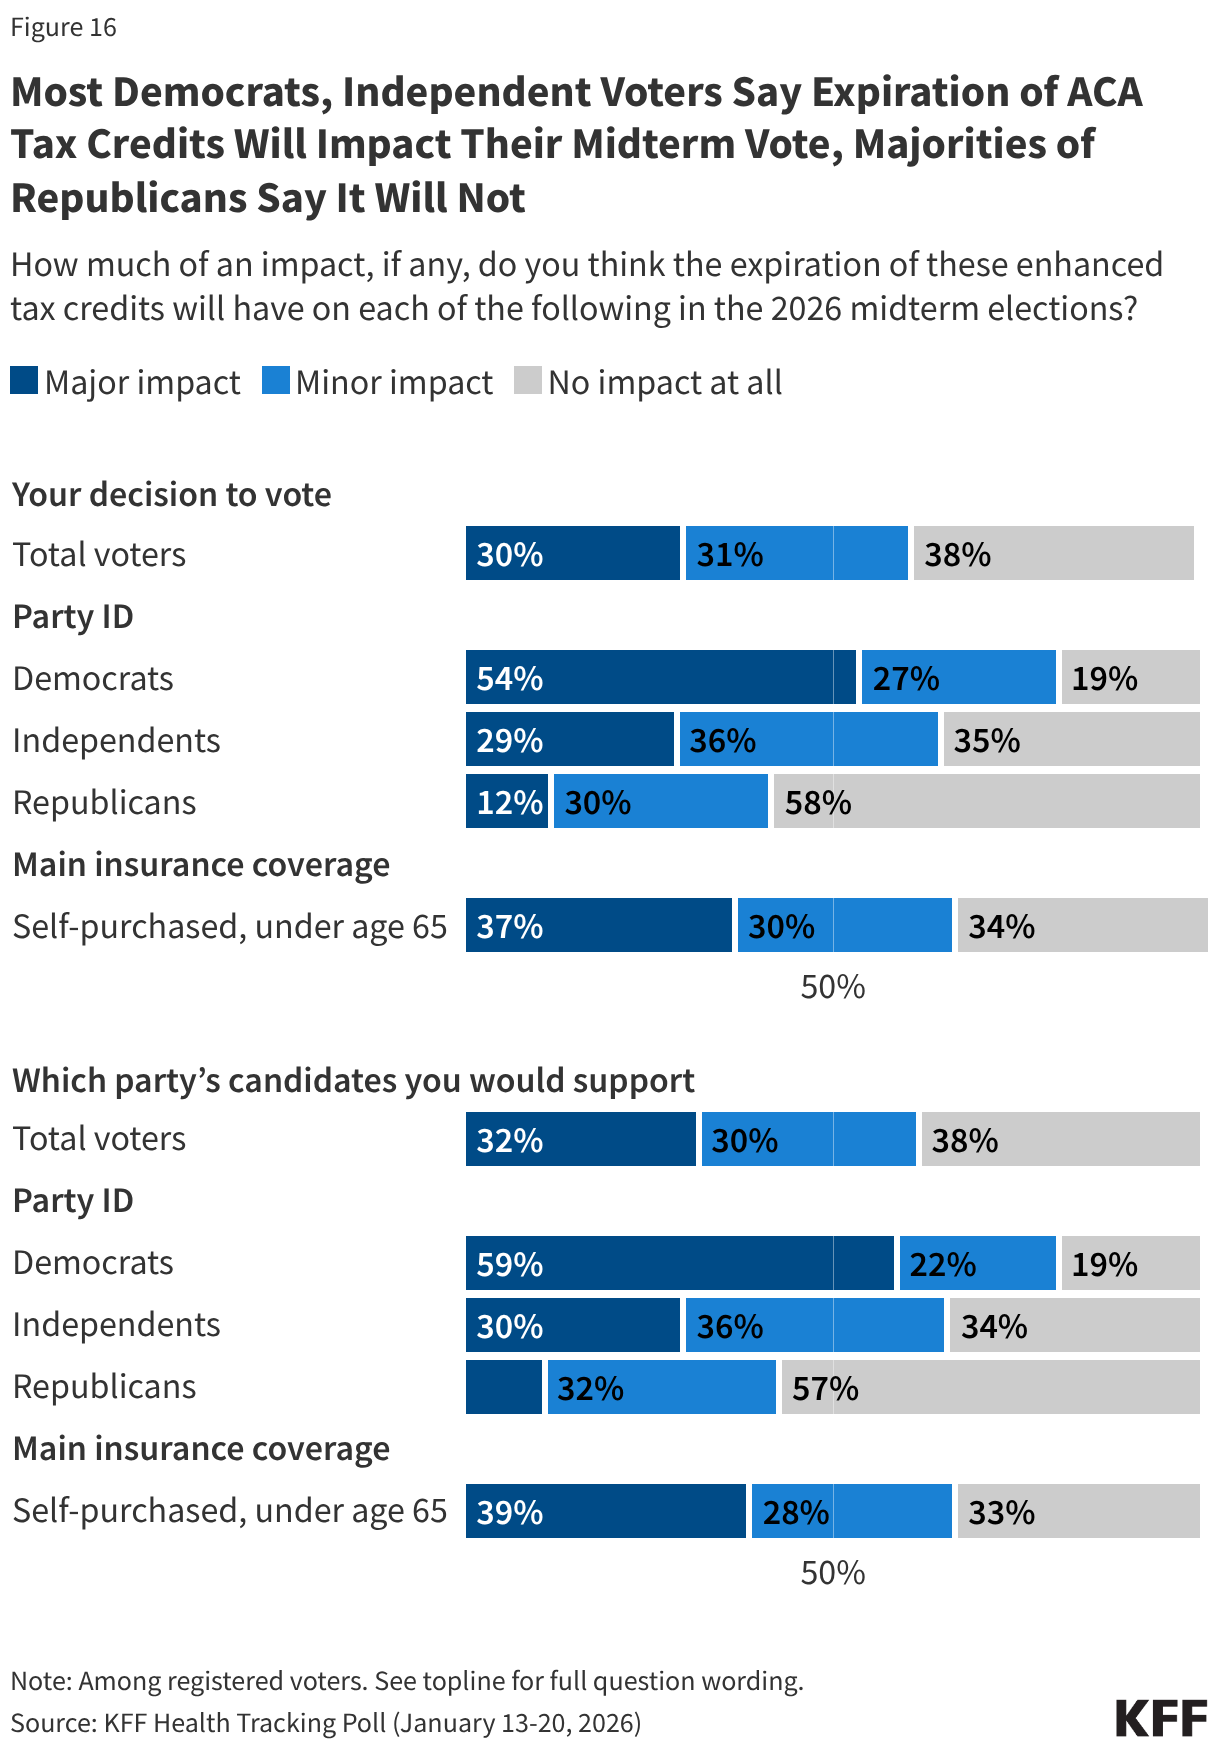
There are some indications that the expiration of the enhanced tax credits will play a role in how voters make decisions in the coming November election. Among those who self-purchase their insurance, two-thirds say it will impact their decision to vote (66%) and which party’s candidate they will vote for (67%) in the upcoming election. And although the expiring enhanced premium tax credits directly affect only those who purchase their own coverage on the ACA marketplaces, among voters overall, six in ten (62%) say their expiration will have an impact on their decision to vote, including 30% who say it will have a “major impact” and 31% who say it will have a “minor impact.” An additional four in ten (38%) voters say it will have “no impact at all” on their decision to vote. The expiration of the tax credits is a stronger motivator for Democratic voters and independent voters than for Republican voters. About eight in ten Democratic and two-thirds of independent voters say it will impact their voting behavior, compared to about four in ten Republican voters.

Stacked bar chart showing the shares of adults who say the expiration of the enhanced tax credits will have a major impact, minor impact, or no impact at all on their decision to vote or which party's candidates they would support in the 2026 midterm elections. Shown among total adults, among adults with self-purchased insurance coverage, and by party identification.

Methodology

This KFF Health Tracking Poll/KFF Tracking Poll on Health Information and Trust was designed and analyzed by public opinion researchers at KFF. The survey was conducted January 13-20, 2026, online and by telephone among a nationally representative sample of 1,426 U.S. adults in English (n=1,355) and in Spanish (n=71). The sample includes 1,028 adults (n=60 in Spanish) reached through the SSRS Opinion Panel either online (n= 1,003) or over the phone (n=25). The SSRS Opinion Panel is a nationally representative probability-based panel where panel members are recruited randomly in one of two ways: (a) Through invitations mailed to respondents randomly sampled from an Address-Based Sample (ABS) provided by Marketing Systems Groups (MSG) through the U.S. Postal Service’s Computerized Delivery Sequence (CDS); (b) from a dual-frame random digit dial (RDD) sample provided by MSG. For the online panel component, invitations were sent to panel members by email followed by up to three reminder emails.

Another 398 (n=11 in Spanish) adults were reached through random digit dial telephone sample of prepaid cell phone numbers obtained through MSG. Phone numbers used for the prepaid cell phone component were randomly generated from a cell phone sampling frame with disproportionate stratification aimed at reaching Hispanic and non-Hispanic Black respondents. Stratification was based on incidence of the race/ethnicity groups within each frame. Among this prepaid cell phone component, 149 were interviewed by phone and 249 were invited to the web survey via short message service (SMS).

Respondents in the prepaid cell phone sample who were interviewed by phone received a $15 incentive via a check received by mail or an electronic gift card incentive. Respondents in the prepaid cell phone sample reached via SMS received a $10 electronic gift card incentive. SSRS Opinion Panel respondents received a $5 electronic gift card incentive (some harder-to-reach groups received a $10 electronic gift card). In order to ensure data quality, cases were removed if they failed two or more quality checks: (1) attention check questions in the online version of the questionnaire, (2) had over 30% item non-response, or (3) had a length less than one quarter of the mean length by mode. Based on this criterion, 2 cases was removed.

The combined cell phone and panel samples were weighted to match the sample’s demographics to the national U.S. adult population using data from the Census Bureau’s 2025 Current Population Survey (CPS), September 2023 Volunteering and Civic Life Supplement data from the CPS, and the 2025 KFF Benchmarking Survey with ABS and prepaid cell phone samples. The demographic variables included in weighting for the general population sample are gender, age, education, race/ethnicity, region, civic engagement, frequency of internet use and political party identification. The weights account for differences in the probability of selection for each sample type (prepaid cell phone and panel). This includes adjustment for the sample design and geographic stratification of the cell phone sample, within household probability of selection, and the design of the panel-recruitment procedure.

The margin of sampling error including the design effect for the full sample is plus or minus 3 percentage points. Numbers of respondents and margins of sampling error for key subgroups are shown in the table below. For results based on other subgroups, the margin of sampling error may be higher. Sample sizes and margins of sampling error for other subgroups are available on request. Sampling error is only one of many potential sources of error and there may be other unmeasured error in this or any other public opinion poll. KFF public opinion and survey research is a charter member of the Transparency Initiative of the American Association for Public Opinion Research.

GroupN (unweighted)M.O.S.E.
Total1,426± 3 percentage points
Party ID  
Democrats473± 6 percentage points
Independents483± 6 percentage points
Republicans367± 6 percentage points
   
MAGA Republicans/Rep leaners352± 6 percentage points
MAHA supporters618± 5 percentage points
Parents or guardians of children under 18 living in their household436± 6 percentage points
News Release

Health Care Costs Tops the Public’s Economic Worries as the Runup to the Midterms Begins; Independent Voters Are More Likely to Trust Democrats than Republicans on the Issue

Two Thirds of Public Say Congress "Did the Wrong Thing" by Not Extending ACA Enhanced Tax Credits, But Republicans Largely Say Congress “Did the Right Thing”

Published: Jan 29, 2026

Heading into this midterm election year, the cost of health care tops the public’s economic anxieties and more than 4 in 10 voters say the issue will have a major impact on their vote, a new KFF Health Tracking poll finds. Voters, including independents, currently trust Democrats more than Republicans to address the cost of health care and most other health care issues, though neither party has an advantage on addressing the overall cost of living, the poll finds.

The poll provides an early look at how the public and voters view health care issues, including costs, following a year of substantial debate and changes. Congress last year enacted major Medicaid changes expected to cut federal spending and increase the number of uninsured and allowed the Affordable Care Act’s enhanced tax credits to expire, sharply increasing the premium payments for most ACA Marketplace enrollees.

Across a range of measures, the poll finds significant concerns about health care costs:

  • The public was given a list of household expenses families worry about. A third (32%) say that they are “very worried” about their ability to afford health care for them and their families – more than say the same about affording food and groceries (24%), rent or mortgage (23%), monthly utility bills (22%), or gasoline and other transportation costs (17%).
  • Health care costs are the top economic worry for Democrats, independents, Republicans, and supporters of President Trump’s “Make America Great Again” movement.
  • A majority (56%) of the public expect health care costs for their family to become less affordable in the coming year. About 1 in 5 say that their health care costs have increased more quickly than other necessities such as monthly utilities (23%) and food and groceries (21%).
  • Among independent voters, more trust the Democratic Party (35%) than the Republican Party (15%) to address health care costs. Independent voters also give Democrats an advantage over Republicans on Medicaid, the ACA, Medicare, and the cost of prescription drugs, though sizeable shares say they trust neither party. Among all voters, trust in Republicans (30%) is within 5 percentage points of Democrats (35%) on drug prices, an issue President Trump has championed.

More than 4 in 10 voters say that health care costs will have a “major impact” both on their decision to vote in the midterm elections (44%) and on which party’s candidates they will support (43%). This includes two thirds of Democrats, more than 4 in 10 independents, and about a fifth of Republicans.

“Republicans won the legislative battle to let the enhanced ACA tax credits expire, but that helped make health costs more of an economic worry and voting issue, and Democrats are well positioned to capitalize on that in the midterms,” KFF President and CEO Drew Altman said.

Most Continue to View ACA Favorably, But Support Falls Among Republicans After Debate

The poll also gauges the public’s views on the ACA after Congress allowed the law’s enhanced tax credits to expire after extensive debate.

Two thirds (67%) of the public say that Congress did “the wrong thing” by allowing the tax credits to expire, twice the share (33%) that says Congress did “the right thing.”

Large majorities of Democrats (89%) and independents (72%) say that Congress did the wrong thing. While most Republicans (63%) and MAGA supporters (64%) say Congress did the right thing, about a third of each group says that Congress did the wrong thing.

Most (58%) of the public continues to hold favorable views of the ACA, though support this month is down 6 percentage points since September (64%).

The shift reflects a drop in favorability among Republicans (22% now vs. 36% in September) and among MAGA supporters (16% now vs. 31% in September).

Designed and analyzed by public opinion researchers at KFF, this survey was conducted January 13-20, 2026, online and by telephone among a nationally representative sample of 1,426 U.S. adults in English and in Spanish. The margin of sampling error is plus or minus 3 percentage points for the full sample. For results based on other subgroups, the margin of sampling error may be higher.

Finding on other topics including prior authorization will be reported separately.