What Happens to Medicaid Drug Policy if the ACA is Overturned?

Author: Rachel Dolan
Published: Oct 26, 2020

Policy discussions around the potential elimination of the Affordable Care Act (ACA) under the court challenge California v. Texas have largely focused on coverage provisions related to the exchanges, Medicaid and preexisting condition protections. The repeal of the ACA could mean loss of Medicaid coverage for up to 15 million that were enrolled in the ACA Medicaid expansion group prior to the COVID-19 pandemic; however, repeal could also mean significant changes to Medicaid prescription drug policy with implications for state and federal spending for prescription drugs for non-expansion Medicaid enrollees.

Under the Medicaid Drug Rebate Program (MDRP), manufacturers who want their drugs covered by Medicaid must enter a federal rebate agreement under which they rebate a specified portion of the Medicaid payment for the drug to the states, who in turn share the rebates with the federal government. The rebate amount is set by statute and includes two main components: a rebate based on a percentage of average manufacturer price (AMP) or the largest “best price” discount provided to most private purchasers, and an inflationary component to account for price increases. The ACA made changes to the amount of rebates and also expanded states’ ability to collect rebates on drugs delivered through managed care plans. In 2010, CBO originally estimated more than $38 billion in federal savings over 10 years for the Medicaid drug-related provisions in the ACA.

How did the ACA affect Medicaid prescription drug policy?

The ACA increased federal drug rebates under the MDRP. The ACA increased base rebate amounts for both generic and brand drugs: the minimum rebate for brand drugs increased from 15.1 percent to 23.1 percent and the base rebate for generic drugs increased from 11 percent to 13 percent. The federal government captures all additional savings. In addition, the ACA established additional rebates for new formulations of existing productions (line extensions), minimum rebates for certain clotting and pediatric drugs, and capped the total rebate amount for drugs at 100% AMP. The law also excluded certain manufacturer discounts from AMP (the price used to calculate rebates) which increase AMP and manufacturer rebate obligations.

The ACA also extended eligibility for rebates to drug benefits provided through managed care. Previously, rebates were only available for drugs purchased through fee-for service (FFS) and many states carved out their drug benefit even if they otherwise provided services through managed care.

The ACA also made other changes to limit Medicaid payment for drugs. These changes include a decrease in federal limits on pharmacy reimbursement for certain multiple source drugs, drugs that have both a brand and generic (FULs).

What are the implications for states and the federal government if the ACA is overturned?

Overturning the ACA could increase federal Medicaid drug spending. Rebates under the MDRP provide a significant offset to Medicaid prescription drug spending, amounting to nearly 60% in 2018. Medicaid base rebates would return to lower, pre-ACA levels and the Medicaid program would receive smaller rebates on generic drugs and certain brand drugs for traditional Medicaid populations. This would largely impact federal spending, as the rebate increase from the ACA accrues to the federal government. Medicaid would also no longer receive additional rebates for line extension drugs and the federal reimbursement benchmark (FUL) would increase to pre-ACA amounts for certain multisource drugs. In addition, the AMP for some drugs could decrease without the exclusion of certain manufacturer discounts, lowering rebates and increasing spending for both states and the federal government.

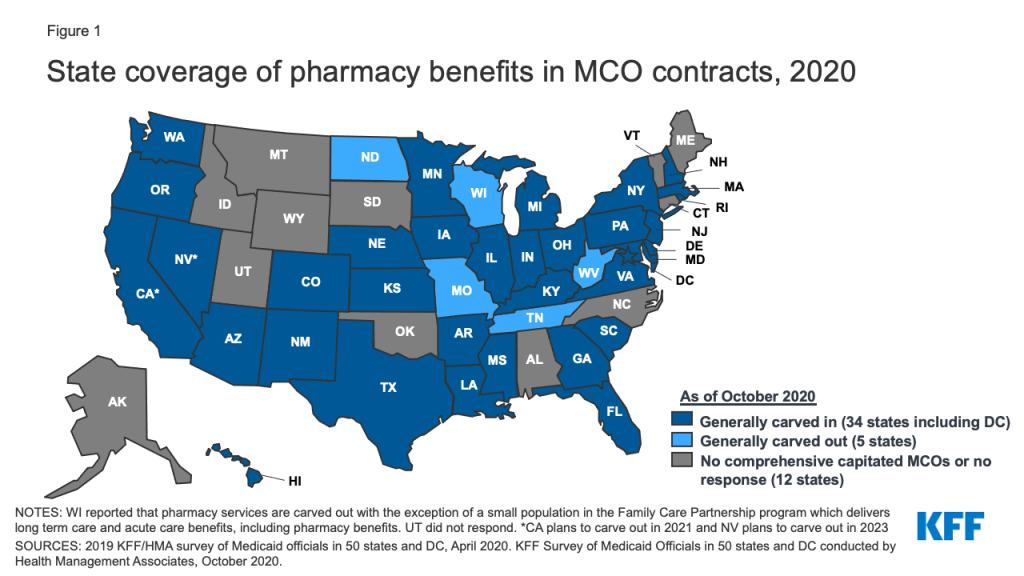
States would no longer be able to collect rebates for drugs provided through managed care. This would be a significant loss in rebates for states and the federal government, and to avoid these losses, states would need to carve out the pharmacy benefit from managed care. Over the 2010–2015 period, CBO estimated the share of Medicaid outpatient drug spending covered through Medicaid managed care plans grew from about 10 percent to roughly half. As of October 2020, 34 of 40 MCO states carved in the pharmacy benefit (Figure 1). States could negotiate additional supplemental rebates with manufacturers but they would be unlikely to offset other rebate losses.

Figure 1: State coverage of pharmacy benefits in MCO contracts, 2020

The elimination of the ACA would have fundamental implications for access to care for up to 15 million individuals in the expansion group, but would also increase federal drug spending for non-expansion Medicaid enrollees. Federal Medicaid drug spending could increase as the federal government would receive lower rebates on drug spending for traditional Medicaid populations. States would also need to restructure how the drug benefit is delivered to avoid rebate losses as most now provide the benefit through managed care.

This Week in Coronavirus: October 16 to October 22

Published: Oct 23, 2020

Here’s our recap of the past week in the coronavirus pandemic from our tracking, policy analysis, polling, and journalism.

Yesterday the U.S. hit its fourth highest daily total on the number of reported coronavirus cases with approximately 71,700. Through the 22nd of each month of the pandemic, October now has the second highest total number of cases, second to July only.

KFF’s October health tracking poll finds that two-thirds of the public are worried that they or their family will get sick from the coronavirus, which is up 13 percentage points since April. Through mid-October of this year, The U.S. has a higher coronavirus mortality rate than many of its peer countries, with the coronavirus ranking as the nation’s third-leading cause of death, behind only heart disease and cancer.

As the government and public health officials press forward via Operation Warp Speed on identifying a successful vaccine, a new brief examines the challenges for what comes next—successful distribution to the American people. The brief looks at the issues of funding, supply and monitoring, and the role of all levels of government. It also looks at larger related health policy issues of insurance coverage and out-of-pocket costs, racial and ethnic disparities and the challenge of building public confidence in a vaccine.

Here are the latest coronavirus stats from KFF’s tracking resources:

Global Cases and Deaths: Total cases worldwide is over 41 million this week – with an increase of approximately 2.8 million new confirmed cases in the past seven days. There were approximately 39,000 new confirmed deaths worldwide and the total confirmed deaths is over 1.1 million.

U.S. Cases and Deaths: Total confirmed cases in the U.S. surpassed 8.4 million this week. There was an increase of roughly 428,000 confirmed cases between October 16 and October 22. Approximately 5,300 confirmed deaths in the past week brought the total in the United States to approximately 223,000.

State Social Distancing Actions (includes Washington D.C.) that went into effect this week:

Extensions: IA, NC

Rollbacks: HI, MD, NY

New Restrictions: IL, NM, NY

New Face Mask Requirement: MS

The latest KFF COVID-19 resources:

  • Distributing a COVID-19 Vaccine Across the U.S. – A Look at Key Issues (News Release, Issue Brief)
  • KFF Health Tracking Poll: COVID-19 in the U.S. (News Release, Report)
  • Webinar: How Might the Pandemic Affect Health Premiums, Utilization, and Outcomes in 2021 and Beyond? (Archived Recording)
  • The Pandemic’s Effect on the Widening Gap in Mortality Rate between the U.S. and Peer Countries (News Release, Issue Brief)
  • U.S. Global Funding for COVID-19 by Country and Region (Issue Brief)
  • Updated: COVID-19 Coronavirus Tracker – Updated as of October 23 (Interactive)
  • Updated: State Data and Policy Actions to Address Coronavirus (Interactive)

The latest KHN COVID-19 stories:

  • Can Ordinary COVID Patients Get the Trump Treatment? It’s OK to Ask (KHN, NBC News)
  • Bridging the Miles — And the Pandemic — Teledentistry Makes Some Dentists Wince (KHN, Fortune)
  • Older COVID Patients Battle ‘Brain Fog,’ Weakness and Emotional Turmoil (KHN, CNN)
  • Despite Pandemic Threat, Gubernatorial Hopefuls Avoid COVID Nitty-Gritty (KHN, Bozeman Daily Chronicle)
  • Lost on the Frontline: Explore the Database (KHN, The Guardian)
  • KHN’s ‘What the Health?’: A Little Good News and Some Bad on COVID-19 (KHN)
  • Analysis: Winter Is Coming for Bars. Here’s How to Save Them. And Us. (KHN, New York Times)
  • Travel on Thanksgiving? Pass the COVID (KHN, MinnPost)
  • Trump Says He Saved 2 Million Lives From COVID. Really? (KHN, PolitiFact)

A Year of Crisis: How COVID-19 Upended the Election’s Focus on Health Care Policy—Or Did It?

Published: Oct 23, 2020

In this October 2020 post for The JAMA Health Forum, Ashley Kirzinger and Mollyann Brodie examine how the COVID-19 pandemic and other crises shook up the mix of issues voters care about without changing the 2020 presidential race’s core dynamic as a referendum on President Trump’s first term in office.

Other contributions to The JAMA Forum are also available.

U.S. Global Funding for COVID-19 by Country and Region

Published: Oct 23, 2020

As of October 16, Congress has enacted four emergency supplemental funding bills to address the COVID-19 pandemic, which collectively provide almost $3.2 billion for the global response. Of this amount, approximately $2.4 billion (75%) was designated for country, regional, and worldwide programming efforts through the State Department ($350 million), the U.S. Agency for International Development (USAID) ($1.24 billion), and the Centers for Disease Control and Prevention (CDC) ($800 million); the remainder was for operating expenses, including the evacuation of U.S. citizens and consular operations. With negotiations between Congress and the Administration over a fifth supplemental package on shaky ground, we examined the status of global COVID-19 country, regional, and worldwide funding to assess how much has been committed to date and where it has been directed.

Data were available to analyze virtually all (97%) of the $1.59 billion provided to State and USAID, specifically the funding that had been committed as of August 21, 2020.1  The data also included $99 million in existing funding provided by USAID through its Emergency Reserve Fund for Contagious Infectious Disease Outbreaks (ERF),2  bringing the total to approximately $1.64 billion. Data were not available on funding provided to CDC, including data disaggregated by country or region.3 

The analysis shows that:

  • As of August 21, 2020, more than $1.6 billion has been committed by State and USAID to respond to COVID-19 globally, including virtually all (approximately $1.54 billion) of the funding provided through COVID-19 emergency supplemental appropriations and $99 million of existing funding from the ERF.
  • Funding was first committed on February 7, through the ERF and before the passage of emergency supplemental funding bills. Funding commitments were next announced on March 27, soon after the first emergency supplemental bill was enacted, and announcements of commitments continued through August 21. See Figure 1.
  • Most funding has been directed to Africa (30%), followed by Asia (17%), the Middle East and North Africa (13%), Latin America and the Caribbean (9%), and Europe and Eurasia (7%). An additional 25% is categorized as “worldwide” funding, which is not designated for a specific region or country at this time. See Figure 2.
  • Funding has been committed to 117 countries (additional countries may be reached through regional and worldwide programming) to support a range of activities, including (but not limited to): case management, community engagement, disease surveillance, infection prevention and control in health facilities, laboratory systems capacity and preparedness, and risk communications. See Table 1.
  • The ten countries with the largest funding commitments, by region, include:
    • Africa (4 countries: Ethiopia [which receives the greatest amount of funding], Nigeria, South Sudan, and Sudan);
    • Asia (2 countries: Afghanistan and Bangladesh);
    • the Middle East and North Africa (3 countries: Iraq, Jordan, and Lebanon); and
    • Europe and Eurasia (1 country: Italy, the only high income country in the top 10, receives the second greatest amount of funding – $50 million).

See Figure 3. These ten countries each received at least $35 million and together account for more than a quarter of funding ($444.3 million) committed by State and USAID.

Figure 1: U.S. Committed Global COVID-19 Funding: A Timeline


  1. State Department, “UPDATE: The United States Continues to Lead the Global Response to COVID-19” fact sheet, August 21, 2020. Data also provided by the State Department in response to a special data request from KFF in May 2020. Some but not all of this funding has been formally obligated; see Testimony of James Richardson, Director, Office of Foreign Assistance, State Department, during SFRC full committee hearing “Pandemic Preparedness, Prevention, and Response,” June 18, 2020, https://www.foreign.senate.gov/hearings/covid-19-and-us-international-pandemic-preparedness-prevention-and-response-061820. ↩︎
  2. In earlier fiscal years, Congress has provided funding to the ERF at USAID to allow this funding to be made available to support future responses to any “emerging health threat that poses severe threats to human health.” See KFF, The U.S. Government and Global Health Security. ↩︎
  3. CDC has posted broad information on how it plans to spend $300 million of the emergency funding; see CDC, “CDC COVID-19 Global Response,” webpage, updated Aug. 5, 2020, https://www.cdc.gov/coronavirus/2019-ncov/global-covid-19/global-response.html. ↩︎
News Release

Analysis: COVID-19 Ranks as a Top 3 Leading Cause of Death in the U.S., Higher than in Almost All Other Peer Countries

Published: Oct 22, 2020

A new KFF analysis examines leading causes of death and mortality rates in the United States and comparable countries.

The U.S. has a higher COVID-19 mortality rate than many of its peer countries, with COVID-19 ranking as the nation’s third-leading cause of death in 2020, behind only heart disease and cancer. Among similarly large and wealthy countries, only in Belgium does COVID-19 also rank as the third highest cause of death. COVID-19 ranks fourth in France, Sweden, and the United Kingdom, but much lower in Germany and Austria, where it ranks 17th and 18th respectively.

The analysis compares the number of COVID-19 deaths in each country through October 15th with annual deaths for other conditions in the most recent full year of data, generally 2017. On the heels of a CDC study finding nearly 300,000 excess deaths in the U.S., this KFF analysis looks at excess death data internationally, finding that the per capita rate of excess deaths in the U.S. is among the highest compared to similarly large and wealthy countries.

Prior to the pandemic, the U.S. had the highest overall mortality rate compared to peer countries. The coronavirus will likely widen the gap in mortality rates between the U.S. and its peer countries, both due to the higher number of deaths directly attributed to COVID-19 in the U.S. compared to peer countries, as well as due to causes potentially exacerbated by the pandemic, including delayed or forgone care.

The analysis is available on the Peterson-KFF Health System Tracker, an online information hub dedicated to monitoring and assessing the performance of the U.S. health system.

The Pandemic’s Effect on the Widening Gap in Mortality Rate between the U.S. and Peer Countries

Authors: Krutika Amin, Giorlando Ramirez, and Cynthia Cox
Published: Oct 22, 2020

A new KFF brief looks at where COVID-19 falls as a leading cause of death in the U.S. compared to similarly large and wealthy countries. The analysis finds that COVID-19 mortality rates are the third leading cause of death in the U.S., a ranking shared by only one peer country, Belgium. In several other peer countries, including Australia and Germany, COVID-19 is not close to breaking into the top 10 leading causes of death.

The brief also addresses high per capita excess deaths in the U.S. – the number of deaths exceeding what is expected in a typical year.

The analysis is available on the Peterson-KFF Health System Tracker, an online information hub dedicated to monitoring and assessing the performance of the U.S. health system.

Want to protect people with preexisting conditions? You need the full Affordable Care Act.

Author: Larry Levitt
Published: Oct 22, 2020

In this perspective published by the Washington Post, KFF Executive Vice President for Health Policy Larry Levitt explains why the popular Affordable Care Act provisions that ensure people with pre-existing conditions can access affordable health insurance can’t easily be preserved if other related provisions are overturned.

News Release

Health Policy Resources for Covering the 2020 Elections

Published: Oct 21, 2020

As the 2020 Election Day approaches, many candidates continue to focus on health care issues, including on the public health and economic response to COVID-19, the future of the Affordable Care Act, health care costs and abortion.

To help reporters understand and cover these issues, KFF offers independent, non-partisan policy analysis, polling and other research and has experts who can provide context, explain trade-offs and provide key data points on health care issues that may arise in the debates and broader campaign. Some key resources:

Overview

  • This overview slideshow compares President Trump’s record and Democratic nominee Biden’s positions across a wide range of key health issues. This JAMA Health Forum column also summarizes key differences.
  • This brief reviews the Trump administration’s record on a wide range of health issues.
  • The October KFF Health Tracking Poll assesses voters’ views of the presidential candidates on key health care issues. The KFF/Cook Political Report’s Sun Belt Voices Project polls voters in Arizona, Florida and North Carolina, three critical battleground states.
  • These health care snapshots provide state-specific health policy data on costs, Medicaid, Medicare, private insurance, the uninsured, women’s health, health status, and access to care.

COVID-19

  • This overview and detailed side-by-side compares President Trump and Democratic nominee Biden on their records, actions and proposals related to the COVID-19 pandemic.
  • Our September poll examines the public’s knowledge and views of the coronavirus outbreak, and their trust in public health experts and institutions, including concerns about how political pressure may affect vaccine development.
  • KFF President and CEO Drew Altman’s essay in The BMJ examines two fundamental policy decisions made by the Trump administration that set the U.S. on the controversial and highly criticized course it has taken on COVID-19.
  • This topic page highlights several pieces on how people of color have fared worse during the pandemic and also provides data on underlying health care disparities and racial inequities.
  • The post looks at how insurers could treat COVID as a pre-existing condition if the federal protections in the ACA were overturned as a result of a pending case before the Supreme Court.

Affordable Care Act and Coverage Expansions

  • This explainer examines the potential impact of the Texas v. California case, supported by the Trump administration, that aims to overturn the ACA. The U.S. Supreme Court is scheduled to hear the case on Nov. 10, a week after the election. This analysis examines key provisions of the law and how they impact nearly every American, with national, state, and public opinion data.
  • This analysis estimates the number and share of people by state with pre-existing conditions that would have prevented them from buying health insurance based on the underwriting practices in place in most states prior to the ACA. This post looks at variation by age, gender and in and outside metro areas.
  • This analysis examines the impact of expanding ACA premium subsidies as Democratic nominee Biden has proposed on the cost of Marketplace coverage.
  • This post looks at what we know about recent trends in health insurance coverage. This report assesses the effects of the ACA’s Medicaid expansion on coverage, access to care, state budgets, and the economy.
  • This brief provides key public opinion data about the public’s views and knowledge about the ACA.

Prescription Drug and Health Costs

  • This slideshow explains the similarities and differences among major proposals to lower prescription drug costs introduced by the Trump Administration, members of Congress, and the Biden campaign.
  • This explainer examines key issues regarding importation of drugs from Canada and other countries.
  • This brief looks at Medicare negotiation of drug prices.
  • This analysis estimates how often consumers receive surprise medical bills when getting emergency room and hospital care, and describes key proposals to protect consumers. This brief looks at the chance of getting an unexpected out-of-network medical bill for different health conditions, including heart attacks and mastectomies.
  • This slideshow captures key polling data on Americans’ views and experiences with prescription drug costs, and this data note looks at Americans’ experiences with surprise medical bills.

Abortion and Reproductive Health

  • This brief looks at the potential implications of the presidential election on women’s health issues, while this one summarizes four state ballot initiatives related to abortion, sex education and paid leave.
  • This poll explores the public’s views and knowledge about abortion and reproductive health issues, including Roe v. Wade, state-level restrictions, and family planning services.
  • This analysis examines the likely impact of Trump administration regulations, currently blocked by court orders, for abortion coverage in ACA marketplace plans.
  • This slideshow looks at the impact of state abortion policies on clinical practice.

If you have questions about any of these resources or want to talk to a KFF expert, please contact Rakesh Singh, Craig Palosky or Chris Lee for assistance.

Demographics, Insurance Coverage, and Access to Care Among Transgender Adults

Authors: Wyatt Koma, Matthew Rae, Amrutha Ramaswamy, Tricia Neuman, Jennifer Kates, and Lindsey Dawson
Published: Oct 21, 2020

On June 12th, the Trump Administration released a final regulation implementing Section 1557 of the Affordable Care Act, and revising an Obama era rule. In it, the administration removed explicit nondiscrimination protections based on gender identity and sexual orientation in health care. In light of a recent Supreme Court decision, and based on other legal grounds, five lawsuits are currently challenging the Trump Administration rule and blocking its implementation. If the explicit protections provided under the Obama era rule are lifted, it could be easier for health care providers to refuse to see individuals who are transgender or who do not conform to traditional sex norms. Explicit protections on the basis of sexual orientation and gender identity could have significant and lasting implications for LGBTQ people, including the estimated 1.4 million transgender adults living in the US.

This analysis seeks to better understand the experiences of transgender people in the US health care system. We examine the demographic characteristics of transgender adults ages 18 and over and their access to health care. We analyzed pooled, cross-sectional data from a subset of the 2017 and 2018 Behavioral Risk Factor Surveillance System (BRFSS). We consider adults to be transgender based on their response to survey questions and define all other adults to be cisgender.

Key Takeaway

Our analysis finds that transgender adults are more likely to be uninsured (19% vs. 12%) and report cost-related barriers to care (19% vs. 13%) than cisgender adults. Transgender adults are also more likely to be non-Hispanic Black and low income than cisgender adults (Figure 1).

Findings

DEMOGRAPHICS

  • Age. A much larger share of transgender adults are under age 35 (44%) than cisgender adults (27%) with one in four (25%) transgender adults under age 25 (data not shown). At the other end of the age spectrum, 16% of transgender adults are 65 years old or older, compared to 22% of cisgender adults (Figure 2).
  • Education. Transgender adults report fewer years of education compared to cisgender adults, holding age constant (analysis not shown). Nearly one quarter of all transgender adults (23%) have less than a high school education compared to 13% of their cisgender peers. A smaller share of transgender than cisgender adults graduated from college or technical school (15% vs. 27%, respectively).
  • Race/Ethnicity. While a majority of transgender and cisgender adults are white, a larger share of transgender than cisgender adults are Black (16% vs. 12%, respectively).
  • Annual Household Income. A larger share of transgender than cisgender adults live on lower incomes: 25% of transgender adults report an annual household income under $20,000 compared to 15% of cisgender adults, based on income reported for 2017-2018 (Figure 3). Transgender adults are more likely to report an annual income under $20,000 holding age constant (analysis not shown).
  • Employment Status. Among adults still in the labor force, a higher share of cisgender adults report being employed compared to transgender adults (56% vs. 48%, respectively). Nearly one in ten (9%) of transgender adults report they were unemployed from 2017-2018, a share much higher than that of cisgender adults (5%). 

HEALTH STATUS, INSURANCE COVERAGE, AND ACCESS TO CARE

  • Health Status. Transgender adults are more likely than cisgender adults to report being in poor health (10% vs. 5%, respectively).
  • Lifetime Depression. Transgender adults report lifetime depression at twice the rate of cisgender adults (38% vs. 19%, respectively) (Figure 4).
  • Health Insurance Coverage. A larger share of transgender than cisgender adults (19% vs. 12%, respectively) report that they were uninsured over the 2017-2018 period.
  • Cost-Related Barriers to Care. Nearly one in five (19%) transgender adults report experiencing barriers to care due to cost, more than the share reported by cisgender adults (13%).
  • Personal Doctor. A similar share of transgender (22%) and cisgender (21%) adults report that they do not have a personal doctor or health care provider.
  • Time Since Last Checkup. A similar share of transgender and cisgender adults report having gone more than one year since their last checkup (25% vs. 24%, respectively).

Discussion

Our analysis finds that transgender people differ from cisgender adults in a number of ways that could impact their health care, as a backdrop for understanding the potential implications of lifting anti-discrimination protections. Transgender adults are younger, less educated, have lower incomes, are in poorer health, with higher rates of lifetime depression, and are less likely to be white, employed and have health insurance. Transgender adults are also more likely than cisgender adults to experience barriers to care due to cost. In other ways, barriers to care faced by transgender people are similar to those faced by cisgender people.

Past research shows that younger adults report lower incomes, and that people of color are also more likely to be uninsured, which may  explain some of the differences in demographic characteristics and insurance coverage. However, it has also been suggested that demographic differences alone do not completely explain why transgender adults experience more difficulty in accessing care in certain circumstances than their cisgender peers do.

Our analysis suggests that transgender adults experience barriers to care even with the Section 1557 health care protections based on gender identity in place. Removing these protections may exacerbate already-existing access problems, which may lead to increased barriers to care among these adults, at a time when access to health care is critical.

This work was supported in part by the Elton John AIDS Foundation. We value our funders. KFF maintains full editorial control over all of its policy analysis, polling, and journalism activities.

Methods

This brief analyzes pooled, cross-sectional data from the 2017 and 2018 Behavioral Risk Factor Surveillance System (BRFSS). BRFSS is an ongoing, state-based, random-digit-dialed telephone survey of non-institutionalized civilian adults living in the community. The BRFSS core questionnaire does not include questions about sexual orientation or gender identity; however, both the 2017 and 2018 BRFSS offer an optional, unified module on sexual orientation and gender identity. In each survey wave, select states opted to add the sexual orientation and gender identity module to the survey (2017: 27 states and Guam; 2018: 28 states and Guam).

In the subset of states which administered the optional module, adults were asked if they considered themselves to be transgender. We defined adults as transgender if they considered themselves to be: 1) transgender female; 2) transgender male; or 3) transgender, gender non-conforming. Of adults who identify as transgender adults in this analysis, 23% (n=433) identified as gender non-conforming. We considered adults who did not identify as transgender to be cisgender. Our study population includes 1,872 transgender adults and 430,817 cisgender adults in the subset of states which opted to administer the module in 2017 and 2018. Our analysis excluded adults who responded that they did not know or were not sure (n=1,684) or adults who refused to answer (n=3,184).

We examined differences in demographics and access to care through questions administered in the core BRFSS questionnaire. Our estimates of transgender and cisgender adults use the BRFSS survey weights to account for the complex sampling design, and our analysis excludes missing values. Missing is included as a valid category for education (.3%), race/ethnicity (1.6%), employment status (.9%) and income (15.4%). We did not provide estimates of sex assigned at birth as several studies have shown that measurement of sex assigned at birth using BRFSS significantly misclassifies transgender adults. All reported differences in demographics and access to care between transgender and cisgender adults are statistically significant. Results from all statistical tests were reported with p< .05 considered statistically significant.

News Release

Abortion at SCOTUS: Potential Cases this Term and Possible Rulings

Published: Oct 20, 2020

A new KFF issue brief examines the implications of a Supreme Court with a solid conservative majority. Two abortion cases have pending requests for Supreme Court review: Dobbs v. Jackson Women’s Health Organization and FDA v. ACOG. If the Court chooses to take these cases, abortion laws and who can legally challenge them could be affected in major ways, including:

  • The option for doctors and clinics to challenge laws regulating abortion on behalf of their patients could be eliminated, and only patients themselves could challenge the laws.
  • The constitutional right to an abortion established in Roe v. Wade could be overturned allowing states to ban or further restrict abortion.
  • The legal standard for evaluating abortion laws’ constitutionality could be changed.

Read the brief, Abortion at SCOTUS: A Review of Potential Cases this Term and Possible Rulings, for the detailed history and legal issues in question for the two abortion cases pending the Supreme Court’s review.Also available is A Reconfigured U.S. Supreme Court: Implications for Health Policy, for a broader discussion on health care cases to be reviewed or potentially coming before the Court in the current term.