Maternal Health in the Build Back Better Act

Published: Dec 16, 2021

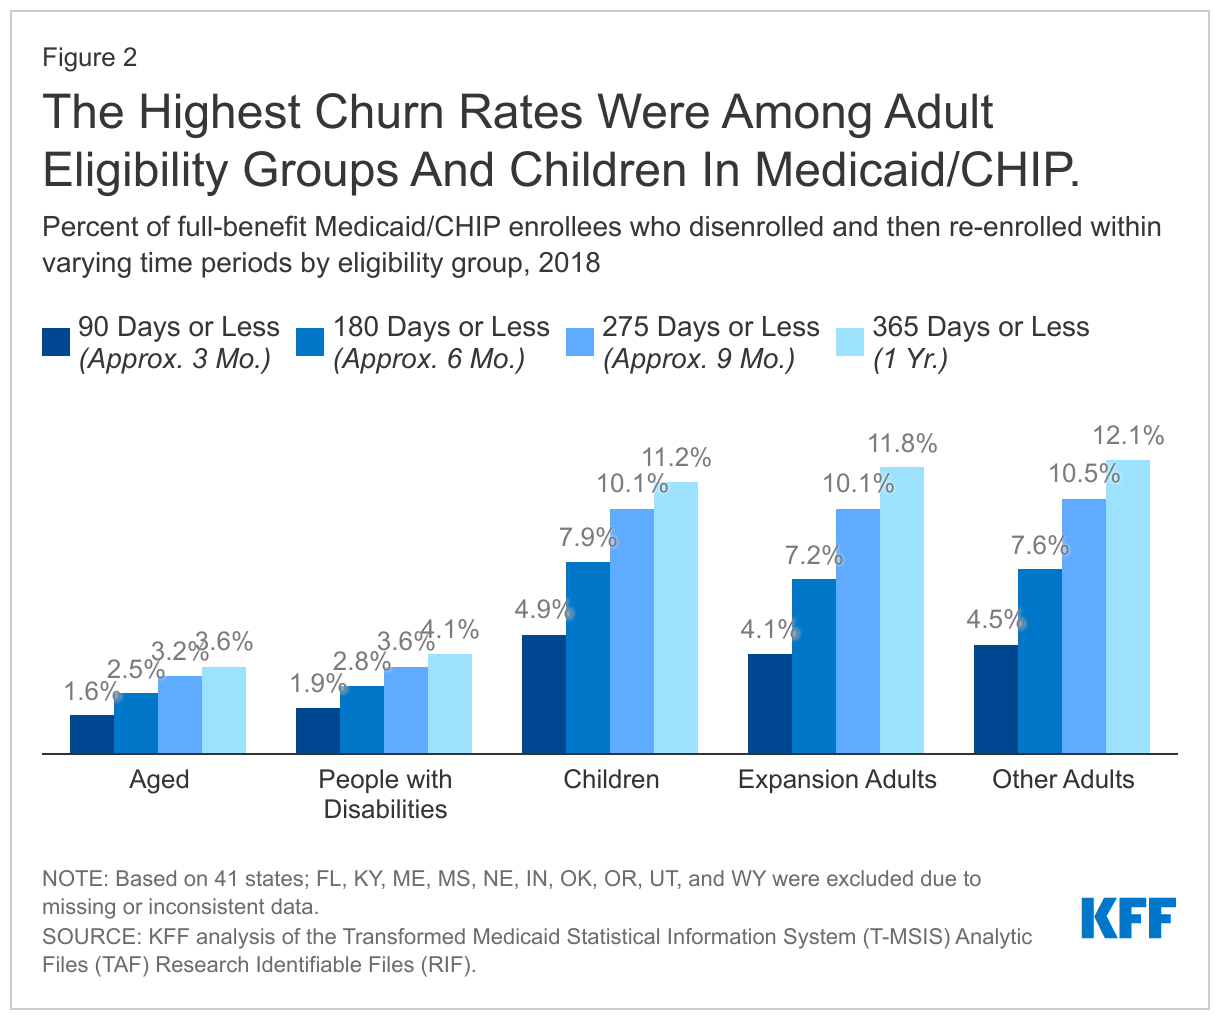
Maternal health is receiving new attention by policymakers in the U.S. who are trying to address pregnancy-related deaths, particularly the substantially higher rates among Black and American Indian and Alaska Native (AIAN) people compared to other racial and ethnic groups.

The Build Back Better Act (BBBA) includes several provisions aimed at improving maternal health, particularly for people of color. The debate over the BBBA comes at the same time that numerous other efforts to improve maternal health are under way, by the federal government as well as non-governmental organizations.

Medicaid Postpartum Coverage Extension

Increasing attention has centered on postpartum care, including recovery from childbirth, follow up on health complications, management of chronic conditions, access to family planning, and mental health care. However, for many birthing parents who live in states that have not expanded Medicaid under the ACA, coverage for this care is elusive and access to services is poor. The Medicaid program covers more than 40% of births nationally, including two-thirds among Black and AIAN people.

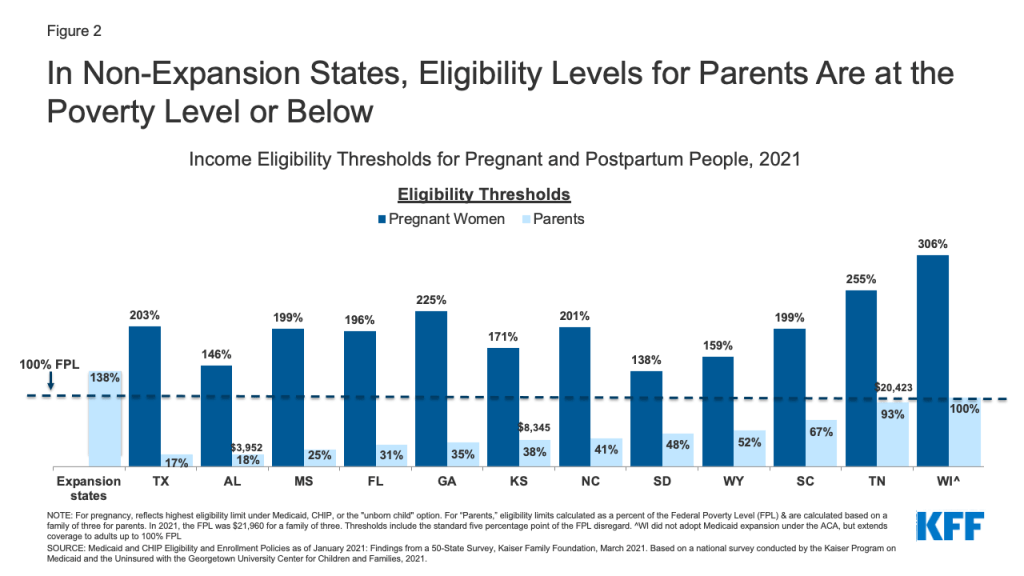
Federal law requires states to extend Medicaid eligibility to pregnant individuals with household incomes up to 138% of the federal poverty level (FPL) through 60 days postpartum. In non-expansion states, after the postpartum period, birthing parents lose pregnancy eligibility and must re-qualify as “parents of dependent children” to remain on Medicaid. However, many do not qualify and become uninsured because Medicaid income eligibility levels for parents are much lower than for pregnant people. Additionally, for many, their incomes are too low to qualify for subsidized private plans through the ACA Marketplace, which are only available to those with incomes above the poverty level. There were about 632,000 Medicaid births in non-expansion states in 2019 (Figure 1).

Figure 1: Four in Ten Births Financed by Medicaid Were in Non-Expansion States in 2019

For example, in Alabama (Figure 2), a married mother with a newborn is in this coverage gap if she and her partner have an annual income above $3,952 (18% FPL). In contrast, their counterparts in expansion states can remain on Medicaid if their income is up to 138% FPL or qualify for Marketplace subsidies if it is higher. (Note: Currently postpartum people covered by Medicaid can remain on the program beyond 60 days because of a continuous enrollment requirement enacted in 2020 that lasts through the COVID public health emergency.)

Figure 2: In Non-Expansion States, Eligibility Levels for Parents Are at the Poverty Level or Below

The 2021 American Rescue Plan Act (ARPA) gave states the option to extend Medicaid postpartum coverage to 12 months for up to five years, which some states plan to adopt. The BBBA builds upon this by requiring all states to extend Medicaid postpartum coverage to 12 months permanently. Postpartum coverage transitions happen in all states, but more parents become uninsured in non-expansion states. The federal government estimates that mandatory postpartum extension would result in about 720,000 additional people remaining eligible through 12 months postpartum, with the number of continuously eligible increasing by 65 percentage points in non-expansion states and 38 percentage points in expansion states. The estimated cost of this provision is $1.2 billion over 10 years.

In addition to extending the postpartum period, the BBBA seeks to close the coverage gap temporarily by allowing people with incomes below 100% FPL who reside in non-expansion states and are ineligible for Medicaid to qualify for subsidies on the ACA Marketplace until 2025. This would provide a pathway to coverage for people before pregnancy, for all parents, and for those without children, at an estimated federal cost of $57 billion over 10 years.

Maternal Health Homes

The idea behind the maternal health home model is to provide financial incentives for providers to better coordinate and improve quality of care through the perinatal period. Some states have piloted maternal health homes and seen positive impacts on health outcomes. A provision of the BBBA would give states an increase in the federal match (FMAP) of 15 percentage points for two years if they deliver care through maternal health homes. The estimated federal cost is $1.0 billion over 10 years.

Improving Care and Addressing Inequities

The BBBA also seeks to strengthen care by authorizing approximately $1 billion in grants that would incorporate many elements of the MOMNIBUS, a legislative package that focuses on improving maternal and infant health for people of color. Funds would:

  • Social Determinants of Health—Support community-based groups addressing issues that intersect with maternal health such as poverty, food, housing, and climate change.
  • Workforce—Support universities, training programs, and other organizations to grow and diversify the perinatal workforce, including nurses, midwives, doulas, and substance use and mental health workers and to identify areas with shortages of maternity care workers.
  • Delivery System—Enhance perinatal quality collaboratives that provide quality improvement tools for maternity providers; expand and incorporate use of technology and digital tools in maternity care; provide and strengthen anti-bias training to perinatal workers.
  • Data and Research—Expand research and data collection on maternal health and inequities through academic institutions, federal surveys, state-level maternal mortality review committees, and the NIH.

The BBBA also proposes to establish a national paid family and medical leave policy, which has been associated with mental and physical health and well-being for new parents and infants, workforce retention and gender equity. Paid leave provides an important foundation for postpartum health and child rearing and is available in every other industrialized nation. The BBBA proposes four weeks of paid family and medical leave annually to all workers for time off to welcome a child, recover from serious illness, or care for an ill family member, with an estimated federal cost over 10 years of approximately $205 billion. However, while paid leave was included in the bill passed by the House of Representatives, it may not pass in the Senate, as Senator Manchin of West Virginia has expressed opposition to this proposal.

Many states have already indicated an interest in expanding postpartum Medicaid coverage and addressing maternal health disparities. The BBBA could provide more supports to states and community organizations to invest further in improving maternal health.

Explaining the New COVID-19 Vaccination Requirement for Health Care Provider Staff

Author: MaryBeth Musumeci
Published: Dec 15, 2021

On November 5, 2021, the Centers for Medicare and Medicaid Services (CMS) published regulations that established the first ever federal vaccination requirements for health care provider staff.1  Drawing on its authority to establish patient health and safety standards, CMS’s regulations require health care providers that participate in the Medicare and/or Medicaid programs to ensure that their staff are fully vaccinated against COVID-19.2  The new rule applies to staff who provide any care, treatment, or other services for providers or patients, including contractors and volunteers. The first phase of the new regulations was to take effect on December 6, 2021, with staff required to have received their first vaccine dose or requested an exemption by that date.3  However, the new regulations have been put on hold by federal courts, and the pending lawsuits create uncertainty about whether the new requirements ultimately will be implemented.4  This issue brief examines the new regulations, explains the status of the pending litigation, and identifies issues to watch.

CMS says it decided to require health care staff to be vaccinated because its earlier efforts to simply encourage vaccination have been “insufficient” to protect patient health and safety. For example, CMS cites data showing that COVID-19 cases in nursing homes surged with the rise of the Delta variant. The nursing home staff vaccination rate is nearly 76% nationally as of November 2021, with substantial variation by region. CMS concluded that standard federal requirements across provider types are needed because the existing “patchwork” of state and employer requirements has not been enough to bring the pandemic under control in health care settings. CMS notes that the vaccines are safe and highly effective at preventing severe illness and death, and unvaccinated staff can strain the health care system by transmitting COVID-19 to patients and having to miss work if they are recovering from COVID-19 or quarantining after exposure. CMS acknowledges that some staff may leave their jobs because they do not want to receive the vaccine but cites examples of vaccine mandates adopted by health systems in Texas and Detroit and a long-term care parent corporation with 250 facilities as well as the New York state health care worker mandate, all of which resulted in high rates of compliance and few employee resignations.

In response to the new regulations, 26 states led by Republican officials filed four federal lawsuits challenging the new rules (Table 1). While the specific legal claims vary somewhat among the different cases, the states essentially raise four major arguments. First, the states challenge the process that CMS used to adopt the new rules, arguing that CMS did not have good cause to forgo public notice and comment under the Administrative Procedure Act (APA). The states also argue that CMS’s authority to establish health and safety regulations for Medicare and Medicaid providers does not allow it to adopt a “broad” vaccine requirement. And, they assert that CMS’s new rule is arbitrary and capricious under the APA because CMS did not appropriately consider factors such as potential staffing disruptions, the “limitations” of vaccines, and the “benefits” of natural immunity. Finally, the states contend that the new rules violate Constitutional principles about the appropriate balance between federal and state government power. For example, the states argue that the rules place “new” conditions on state receipt of federal funds in violation of the Constitution’s Spending Clause. The states also argue that the new rules improperly force states to administer federal regulations and unconstitutionally infringe on the states’ police powers to regulate for public health and safety.

Table 1:  State Lawsuits Challenging CMS COVID-19 Vaccine Requirement for Medicare and Medicaid Provider Staff, as of 12/12/21
Case NameStates Joining LawsuitCurrent Status
District CourtAppeals Court
MO v. Biden10 states (AK, AR, IA, KS, MO, NE, NH, ND, SD, WY)On 11/29/21, the court granted a preliminary injunction preventing CMS from enforcing the new rules in these 10 states while the lawsuit is pending.CMS has appealed the preliminary injunction order to the 8th Circuit.

On 12/13/21, the 8th Circuit in a 2:1 order denied CMS’s motion to lift the preliminary injunction pending appeal.

LA v. Becerra14 states (AL, AZ, GA, ID, IN, KY, LA, MS, MT, OH, OK, SC, UT, WV)On 11/30/21, the court granted a preliminary injunction preventing CMS from enforcing the new rules nationwide while the lawsuit is pending.*CMS has appealed the preliminary injunction order to the 5th Circuit.
TX v. Becerra1 state (TX)On 12/3/21, the court put the case on hold, pending subsequent court action in the LA case.N/A
FL v. HHS1 state (FL)On 11/20/21, the court denied FL’s motion for a preliminary injunction. On 12/1/21, the court issued an opinion reaffirming the preliminary injunction denial.FL has appealed the preliminary injunction denial to the 11th Circuit.

On 12/6/21, the 11th Circuit in a 2:1 decision denied FL’s motion for an injunction pending appeal.

NOTES:  *The LA preliminary injunction applies nationwide except in the 10 states that are subject to the MO preliminary injunction.SOURCE:  KFF analysis of court documents.

Currently, CMS is unable to enforce the new rules nationwide, as a result of court orders, though circumstances may change as cases are appealed. To date, the 8th Circuit Court of Appeals has ruled that a Missouri federal court’s decision preventing CMS from enforcing the new rules should remain in place while the appeal in that case is pending. Additionally, a federal court in Louisiana has blocked the new rules, while the 11th Circuit Court of Appeals has affirmed a Florida federal court’s decision that the new regulations can be implemented while litigation is pending. (A fourth case in Texas federal court is on hold, pending further court action in the Louisiana case.) The Missouri court’s preliminary injunction blocking the new rules applies in the 10 states that brought that case. However, the Louisiana court went further, applying its preliminary injunction not only to the 14 states in the case before it but also to all other states (except the 10 states in the Missouri case). This means that the new rules are now on hold even in states that did not challenge them. The Louisiana decision also put the new rules on hold in Florida, despite the Florida court’s decision that the new rules should go into effect. However, as the 11th Circuit points out in its review of the Florida decision, the Louisiana decision could be changed when it is reviewed by the 5th Circuit on appeal. Specifically, the 11th Circuit found that it is reasonably likely that the 5th Circuit will conclude that the Louisiana court should not have applied its decision nationwide, even if the 5th Circuit ultimately upholds the Louisiana court’s decision to block the new rules in the 14 states that brought the Louisiana case.

Court decisions in the lawsuits to date demonstrate opposing views about the scope of CMS’s authority to respond to the pandemic and what constitutes the public’s interest (Table 2). The 11th Circuit’s decision defers to the agency’s expertise in the face of an unprecedented pandemic and notes that accepting Florida’s arguments in opposition would amount to substituting the state’s “views on epidemiology for the Secretary’s judgment about the best way to protect the public from infection.” By contrast, the Missouri and Louisiana courts fault the agency for not giving more credence to the arguments advanced by states that oppose CMS’s rule. When articulating the public’s interest in these issues, the 11th Circuit emphasizes the public’s interest in slowing COVID-19 spread and protecting patients from preventable infection, while the Missouri and Louisiana decisions emphasize the public’s interest in being free from vaccine requirements. The Louisiana court’s characterization of the public interest is notable in light of its ultimate decision to block the rule in states that are not part of the litigation. The Louisiana court says that it entered a nationwide ruling because there are “unvaccinated healthcare workers in other states who also need protection,” though it does not discuss other aspects of the public interest, which may favor the rule.

The fate of CMS’s new rules may ultimately be determined by the Supreme Court. The preliminary injunctions blocking implementation of the rules issued by Missouri and Louisiana courts currently are awaiting review on appeal by the 8th and 5th Circuits, respectively. If one or both appeals courts affirms the preliminary injunction, that decision would conflict with the 11th Circuit’s conclusion that the rule should not be blocked. A conflict among different appeals courts could increase the likelihood of the Supreme Court stepping in. As litigation to determine CMS’s authority to mandate health care provider vaccines as part of its pandemic response continues to play out, the emergence of the Omicron variant is raising new questions about the pandemic’s future course. This development likely will further challenge CMS as it seeks to adopt policies to bring the pandemic under control which ultimately could prove successful but may never be implemented if courts decide to limit the agency’s authority.

Table 2:  Comparison of Court Decisions About Whether to Preliminarily Enjoin CMS’s Health Care Provider Vaccine Rule, as of 12/12/21
Issue

MO* and LA courts(granting preliminary injunction)

11th Circuit(affirming FL court’s denial of preliminary injunction)
1. Is the state likely to succeed on the merits of its challenge to CMS’s rule?

(A)   Did CMS have good cause to issue the rule as interim final and bypass public notice and comment?

(B)   Is CMS’s rule within its authority to regulate Medicare and Medicaid as delegated by Congress?

(C)   Is CMS’s rule arbitrary and capricious?

(D)   Does the new rule inappropriately infringe on state power?

(A) No. CMS took too long to issue the new rule for circumstances to be considered an emergency. The MO court also concluded that public health and safety is an insufficient reason to waive notice and comment, especially for an “unprecedented” new rule.

(B) No. Though Congress has given CMS “general” authority to issue regulations about Medicare and Medicaid patient health and safety, CMS needs “clear authorization” to adopt a vaccine mandate because this involves “powers of vast economic and political significance.”

(C) Yes. CMS acknowledges that the extent to which vaccines prevent COVID-19 spread and their long-term effectiveness are “unknown.” CMS should not have used evidence about COVID-19’s impact on long-term care facilities to extrapolate about effects on other providers that do not care for “vulnerable” patients. CMS’s rule is too broad because it acknowledges that children are less affected by COVID-19 but subjects pediatric facilities to the new rule. CMS did not appropriately consider alternatives such as testing or natural immunity or the harm the rule will cause by exacerbating worker shortages.

(D) The preliminary injunction decisions do separately analyze this issue in detail, though the LA court notes that the rule infringes on state power because it specifically preempts state law.

(A) Yes. CMS provided a “detailed explanation” to justify good cause and the need for “urgency” due to the ongoing pandemic, the Delta variant, and the upcoming flu season, and determined that further delay would endanger patient health and safety.

(B) Yes. Federal law expressly authorizes CMS to establish Medicare and Medicaid provider health and safety standards. Congress did not need to be more specific because until now, vaccination has not been a political issue and instead has been regarded as a “common-sense measure designed to prevent healthcare workers, whose job it is to improve patients’ health, from making them sicker.”

(C) No. The court should defer to CMS’s decision about how to best protect patients, which is supported by “ample evidence.” CMS cites evidence showing that health care workers respond to mandates by getting vaccinated instead of leaving their jobs.

(D) While not separately analyzed by the 11th Circuit, the court notes that federal law preempts conflicting state law.

2. Will the state experience irreparable harm without a preliminary injunction?Yes. States are irreparably harmed if they cannot enforce laws that prohibit vaccine mandates, and their citizens will be harmed by the rule’s exacerbation of staffing shortages that may comprise patient safety and lead to facility closures and by the choice between job loss or vaccination.No. CMS has authority to issue the new rule, and FL is not irreparably harmed because federal law preempts conflicting state law. FL’s evidence predicting new staffing shortages is “speculative” and “conclusory.”
3. Does the public interest favor a preliminary injunction?Yes. The MO court found that, while the public has an interest in stopping COVID spread, it would “suffer little, if any, harm” if the rule is blocked. The LA court found that the “public interest is served by maintaining the liberty of individuals who do not want to take the COVID-19 vaccine.”No. Barring enforcement of the new rule would harm the public’s interest in slowing COVID-19 spread and protecting patients from “infliction of a potentially deadly virus. . . by those who are supposed to be taking care of them,” which is preventable by vaccination.
NOTE:  *The 8th Circuit issued an order keeping the MO preliminary injunction in place pending appeal but did not write an opinion.SOURCE:  KFF analysis of court documents.
  1. The new rule applies to Medicare and Medicaid providers that are directly regulated by CMS and therefore does not reach all Medicaid providers, such as certain home and community-based services (HCBS) providers. The rule applies to nursing homes, hospitals, outpatient rehab facilities, federally qualified health centers, rural health centers, and home health agencies, among other provider types. Residents and staff of other HCBS providers, such as group homes, assisted living facilities, and day habilitation programs, face increased risk of serious illness or death from COVID-19, similar to their counterparts in nursing homes. But, because states (and not CMS) license and regulate these providers, CMS has not required them to comply with the new rule. States or individual providers could adopt staff vaccination mandates, and providers may be subject to other rules such as the Occupational Safety and Health Administration requirement for large employers (which also has been put on hold by courts) or state or local requirements. ↩︎
  2. CMS says that provider compliance with the new rule will be part of the existing oversight process through which state or federal inspectors review all Medicare and Medicaid program requirements. CMS envisions that inspectors will review facility policies and records and conduct staff interviews to verify vaccination status. CMS will provide guidance about oversight as well as penalties for noncompliance, which could include civil monetary penalties, denial of payment for new long-term care facility admissions, or termination of Medicare and/or Medicaid program participation. ↩︎
  3. The new rule also provides that staff must be fully vaccinated by January 4, 2022, or have been granted an exemption (based on disability or sincere religious belief) or temporary delay (based on CDC clinical guidelines). Providers also must implement “additional precautions” to mitigate COVID-19 transmission and adopt contingency plans to address staff who are not fully vaccinated. ↩︎
  4. Before the rule was put on hold by courts, CMS said that it would determine whether to make the new rule permanent based on public comments (due January 4, 2022) and the future course of the pandemic. The new rule is not tied to the duration of the COVID-19 public health emergency (PHE), and CMS expects that it will “remain relevant for some time beyond” the PHE end. Medicare interim final rules expire after three years unless they are finalized. ↩︎

Politics and Boosters

Authors: Liz Hamel, Audrey Kearney, and Mellisha Stokes
Published: Dec 15, 2021

Early studies suggest that while vaccine-induced immunity against COVID-19 may wane over time, booster shots help strengthen individuals’ level of protection against omicron and other variants. Findings from the KFF COVID-19 Vaccine Monitor show that just over half of U.S. adults have received a booster (16%) or are likely to get one (37%). This leaves about one in five who are either fully vaccinated but unlikely to get a booster (12%) or only partially vaccinated (6%), and one-quarter who still have not gotten a first shot, including 14% who say they will “definitely not” get vaccinated.

Partisans look very different on this measure. Three in four Democrats have already received a booster or are likely to get one compared to about half of independents and just over a third of Republicans. While omicron could change this calculation, the partisan divide that has emerged early into America’s booster campaign could increase pressure on health systems in heavily Republican areas if fewer individuals choose to get boosters that offer maximum protection against future waves of the virus.

Source

KFF COVID-19 Vaccine Monitor: November 2021

Characteristics of Vaccinated Patients Hospitalized with COVID-19 Breakthrough Infections

Published: Dec 15, 2021

While people who are fully vaccinated against COVID-19 have a significantly reduced risk of severe illness, some hospitalizations and deaths have been reported among fully vaccinated people with breakthrough COVID-19 infections.

This brief describes the characteristics of fully vaccinated hospitalized patients who have COVID-19 breakthrough infections, in comparison to people who are not fully vaccinated and hospitalized with COVID-19. Compared to those who are unvaccinated, a small share (15%) of hospital admissions for COVID-19 between June and September involve people who were fully vaccinated against the disease.

It finds that age is highly correlated with breakthrough hospitalizations, and a greater share of people hospitalized with a breakthrough COVID-19 infection had a comorbidity than people hospitalized with COVID-19 who were not fully vaccinated. It also finds that fewer breakthrough COVID-19 hospitalizations included COVID-related respiratory complications or treatments, suggesting fully vaccinated patients hospitalized with breakthrough COVID-19 may have been more likely to be hospitalized for unrelated reasons.

The analysis examines data from the four-month period from Epic’s Cosmos research platform, which includes data for more than 120,000 hospitalizations with a COVID diagnosis during the four-month period. Patients are considered “fully vaccinated” if they received a dose of Johnson & Johnson vaccine or two doses of the Pfizer or Moderna vaccine at least two weeks before they were hospitalized, regardless of whether they were eligible for or received a booster shot.

The analysis is available on the Peterson-KFF Health System Tracker, an online information hub dedicated to monitoring and assessing the performance of the U.S. health system.

News Release

“Breakthrough” COVID-19 Hospitalizations Among Fully Vaccinated Patients Occur Most Often among Older Adults and Involve People with Chronic Health Conditions

Compared to Hospitalizations of Unvaccinated Patients, Breakthrough Cases Involve Shorter Stays on Average and Appear More Likely to Be Hospitalized Primarily for Non-COVID Ailments

Published: Dec 15, 2021

“Breakthrough” hospitalizations involving COVID-19 among people who are fully vaccinated against the disease most often affected older adults and people with other chronic health conditions, finds a new analysis of hospital data from June through September by KFF and Epic Research.

More than two-thirds (69%) of breakthrough COVID-19 hospitalizations occurred among people ages 65 and older, who are more likely than younger age groups to have gotten vaccinated. A fifth (21%) of breakthrough hospitalizations occurred among people ages 50-64, while 10% occurred among younger adults.

COVID-19 hospitalizations among people who were not fully vaccinated skew much younger, with about 3 in 10 (30%) involving patients ages 50-64 and 4 in 10 (41%) involving patients under age 50.

The analysis examines data from June to September from Epic’s Cosmos research platform, which includes data for more than 120,000 hospitalizations with a COVID diagnosis during the four-month period. Patients are considered “fully vaccinated” if they received a dose of Johnson & Johnson vaccine or two doses of the Pfizer or Moderna vaccine at least two weeks before they were hospitalized, regardless of whether they were eligible for or received a booster shot.

Compared to those who are unvaccinated, a small share (15%) of hospital admissions for COVID-19 during the four-month period involve people who were fully vaccinated against the disease.

Other findings include:

  • Larger shares of fully vaccinated adults hospitalized with breakthrough COVID-19 had selected chronic conditions including, hypertension, diabetes, heart failure, or chronic obstructive pulmonary disease) compared to those hospitalized with COVID-19 who were not fully vaccinated.
  • Fully vaccinated people who are hospitalized with breakthrough COVID-19 are less likely than those who are not fully vaccinated to have COVID-related complications such as viral pneumonia or respiratory failure, or to receive a ventilator or dexamethasone treatment. This suggests that fully vaccinated patients with COVID-19 diagnoses may be somewhat more likely to be in the hospital primarily for reasons other than COVID-19.
  • Fully vaccinated people with breakthrough infections had shorter hospital stays compared to others in their age group who were not fully vaccinated. For example, among those at least 65 years old with COVID-19, the median stay was 5.6 days for those who were fully vaccinated compared to 6.7 days for those who were unvaccinated or partly vaccinated.

The analysis is available on the Peterson-KFF Health System Tracker, an online information hub dedicated to monitoring and assessing the performance of the U.S. health system

News Release

New Analysis of Historical Rates of Medicaid Enrollment Churn Sheds Light on the Implications for the End of the Continuous Enrollment Requirement Tied to Pandemic Funding

Published: Dec 14, 2021

For more than a year-and-a-half, the continuous enrollment requirement tied to enhanced Medicaid funding during the COVID-19 pandemic has all but halted enrollment “churn,” the temporary loss of coverage in which people disenroll from Medicaid and then re-enroll within a short period of time.

Such disenrollments are expected to resume once the requirement ends and states begin processing Medicaid eligibility redeterminations. Individuals may lose coverage if they are no longer eligible or face barriers during the redetermination process, such as providing required documentation.

A new KFF analysis that examined churn rates before the pandemic finds that about 10 percent of full-benefit Medicaid enrollees experienced a gap in coverage of less than a year. Rates, which varied by state, were higher for children and adults compared to the elderly and people with disabilities. Federal rules and state policy decisions on resuming disenrollments will influence churn rates following the end of the continuous enrollment requirement.

All of this is important context for the debate over the Build Back Better Act (BBBA) in Congress. The House-passed version of the bill includes provisions to phase out the continuous enrollment requirement for Medicaid, with rules that would limit how aggressively states could disenroll people. For example, states could only disenroll individuals who have been enrolled at least 12 consecutive months and must limit eligibility redeterminations to no more than one-twelfth of all enrollees per month through September 2022. States could not disenroll individuals based on returned mail unless there were at least two failed attempts to contact the individual by at least two different methods (e.g., mail and text messages).

The BBBA also would require states to extend 12-month continuous coverage for children in Medicaid and CHIP (currently an option for states) and would require 12-month continuous coverage for postpartum individuals, a change from the current requirement of 60-day postpartum coverage and a temporary option provided to states through the American Rescue Plan Act (ARPA).

For the full analysis about historical rates of Medicaid enrollment churn and a summary of BBBA provisions that would limit a return to churn, visit kff.org.

Medicaid Enrollment Churn and Implications for Continuous Coverage Policies

Authors: Bradley Corallo, Rachel Garfield, Jennifer Tolbert, and Robin Rudowitz
Published: Dec 14, 2021

Issue Brief

Recent policy actions and proposals in Medicaid have renewed focus on the problem of churn, or temporary loss of coverage in which enrollees disenroll and then re-enroll within a short period of time. The Families First Coronavirus Response Act (FFCRA) passed during the coronavirus pandemic requires states to provide continuous coverage to Medicaid enrollees until the end of the month in which the public health emergency (PHE) ends to receive enhanced federal funding. During this time, people did not churn on and off Medicaid, but churn may resurface when the continuous enrollment requirement ends. The Build Back Better reconciliation bill under consideration in Congress would begin to phase out the continuous enrollment requirement and the enhanced match beginning April 1, 2022. Additionally, the bill would require states to provide 12-month continuous coverage for children and for postpartum individuals in Medicaid and the Children’s Health Insurance Program (CHIP), which could reduce churn for those groups. Currently more than half of states already provide 12-month continuous coverage for children on an optional basis.

To help inform the current policy discussion, this brief provides estimates of churn for people enrolled in Medicaid in 2018. We use 2017 and 2019 as look-back and look-ahead years, respectively, so we can examine what happens to people a full year before and after an enrollment date or disenrollment date in 2018. We also provide estimates of churn by eligibility group and compare rates in Medicaid expansion versus non-expansion states. Overall, we find that 10% of full-benefit enrollees have a gap in coverage of less than a year, and rates are higher for children and adults compared to aged and people with disabilities. Churn rates also vary substantially by state, ranging from 5% or less in some states to 15% or more in others. Churn has implications for access to care as well as administrative costs faced by states. Detail on the data and methods underlying this analysis are in the Methods section at the end of the brief.

Background

The temporary loss of Medicaid coverage in which enrollees disenroll and then re-enroll within a short period of time, often referred to as “churn,” occurs for a several reasons. Enrollees may experience short-term changes in income or circumstances that make them temporarily ineligible. Alternatively, some people who remain eligible may face barriers to maintaining coverage due to renewal processes and periodic eligibility checks. Eligible individuals are at risk for losing coverage if they do not receive or understand notices or forms requesting additional information to verify eligibility or do not respond to requests within required timeframes.

Some enrollees may be at higher risk of churn than others. Working individuals whose monthly income fluctuates may be more likely to experience churn in states that have adopted frequent electronic data matches during the year. For example, adult enrollees without disabilities, most of whom are working, may have irregular work hours, overtime, or multiple part-time jobs that can lead to month-to-month changes in income. In contrast, elderly adults and people with disabilities, particularly those who qualify for Supplemental Security Income (SSI), are less likely to experience monthly income changes or other changes in circumstances. Most states conduct data matches on a periodic basis to identify changes in circumstances between annual renewal periods. If the data checks identify changes in income or other factors that affect eligibility and the individual is unable to resolve the discrepancy within the specified timeframe (often limited to within 10 days from the date of the notice), the person can be disenrolled from coverage.

Churn can result in access barriers as well as additional administrative costs. When individuals who remain eligible for coverage are disenrolled, they may experience gaps in coverage that could limit access to care and lead to delays in getting needed care. Research indicates that enrollees who experience fluctuations in coverage are more likely to report difficulties getting medical care and are more likely to end up in the hospital with a preventable condition. In addition, there are administrative costs associated with disenrolling an enrollee and then subsequently processing a new application.

What are the rates of churn in Medicaid?

Among full-benefit beneficiaries enrolled at any point in 2018, 10.3% had a gap in coverage of less than a year. About 4.2% were disenrolled and then re-enrolled within three months and 6.9% within six months (Figure 1).

One In Ten Medicaid/CHIP Enrollees Disenrolled And Then Re-enrolled In Less Than One Year, And Many Of Them Did So In Less Than Six Months.

Rates of churn were higher for children and adults compared to aged adults and people with disabilities (Figure 2). We estimate that 11.2% of full-benefit children and 12.1% of adults were disenrolled and then subsequently re-enrolled within one year. Analysis also shows that rates of churn are higher for enrollees with partial benefit packages, but there are similar churn rates across expansion and non-expansion states (Appendix Table 1). However, there is considerable variation in churn rates across states, with 4 states (HI, AZ, DC, and NC) having 5% of enrollees or fewer disenrolling and then re-enrolling within a year, and 4 states (TX, WI, NH, and PA) having 15% of enrollees or more disenrolling and re-enrolling within a year.

The Highest Churn Rates Were Among Adult Eligibility Groups And Children In Medicaid/CHIP.

The continuous enrollment requirement related to the coronavirus pandemic has all but halted Medicaid churn for the past year and a half, but disenrollments are expected resume once the requirement ends. In part due to the continuous enrollment requirement, Medicaid/CHIP enrollment has increased from February 2020 to May 2021 by 11.5 million (or 16.2%) to 82.8 million individuals. However, when the continuous enrollment requirement ends, states will begin processing renewals and individuals may lose coverage if they are no longer eligible or face barriers during the redetermination process, such as providing required documentation.

The Build Back Better Act (BBBA) that is currently being debated in Congress would phase out the continuous enrollment requirement beginning April 1, 2022. To continue receiving a phased-down enhanced federal match rate, states would be required to follow rules about disenrolling people that could help to reduce rates of churn. For example, states could only disenroll individuals who have been enrolled at least 12 consecutive months and must limit eligibility redeterminations to a set proportion of enrollees each month through September 2022. States could not disenroll individuals based on returned mail unless there were at least two failed attempts to contact the individual through at least two modalities (e.g., mail and text messages). States would also have to report monthly data on call center statistics (average volume, wait times, and abandonment rates) as well as rates of eligibility renewals, redeterminations, and coverage terminations due to changes in circumstances (e.g., increased income) or due to administrative reasons (e.g., failing to provide required documentation).

Prior to the pandemic, some states had adopted policies and processes to reduce churn and promote continuous coverage. For example, as of January 2020, 35 states account for anticipated income changes, such as recurring seasonable employment or a job change, when determining eligibility at renewal. Some states also use projected annual income for the remainder of the calendar year when determining ongoing eligibility at renewal or when an individual has a potential change in circumstances between renewal periods. States can also implement processes that improve communications with enrollees to help prevent them from losing coverage because they do not receive or respond to notices from the state. Such actions include conducting regular data matches with the U.S. Postal Service National Change of Address Database, working with managed care plans and providers to update enrollees’ address information, and calling enrollees or sending email or text notifications when returned mail from a notice sent to an enrollee is received.

The BBBA would require states to implement 12-month continuous coverage for children and postpartum individuals. States have the option to provide 12 months of continuous coverage for children. Under this option, states allow a child to remain enrolled for a full year unless the child ages out of coverage, moves out of state, voluntarily withdraws, or does not make premium payments. As such, 12-month continuous eligibility eliminates coverage gaps due to fluctuations in income over the course of the year. A recent MACPAC analysis found that states with 12-month continuous coverage for children had lower rates of churn among children enrolled in Medicaid and CHIP compared to states without this policy. Currently, 34 states provide 12-month continuous eligibility to at least some children in either Medicaid or CHIP. The Build Back Better Act would require states to extend 12-month continuous coverage for children in Medicaid and CHIP and would also require 12-month continuous coverage for postpartum individuals, a change from the current requirement of 60-day postpartum coverage.

Methods

Data Source and Linkage

Our analysis is based on the Transformed Medicaid Statistical Information System (T-MSIS) Analytic Files (TAF) Research Identifiable Files (RIF). We include beneficiaries who were enrolled at any point in 2018. We use the 2018 Demographic Eligibility (DE) Base file to determine eligibility pathway based on last-best eligibility data. We draw enrollment dates from the 2017-2019 DE Dates files. Our analysis uses enrollment dates from 2017 and 2019 for look-back and look-ahead years, respectively, so that we can examine what happens to enrollees a full year before and after an enrollment start date or disenrollment date in 2018. Data for 2019 are from the preliminary version of the T-MSIS RIF. All other DE Base and DE Dates files are final versions (Release 1).

State Exclusion Criteria

We use 41 states in our analysis. We exclude 10 states (FL, IN, KY, ME, MS, NE, OK, OR, UT, and WY) due to missing or inconsistent data based on state-level information available at the DQ Atlas as well as our own analysis. We relied on data quality assessments from DQ Atlas to exclude states that have a “medium concern”, “high concern”, or “unusable” data quality assessment for: (1) the average monthly Medicaid/CHIP enrollment compared to an external enrollment benchmark (Medicaid/CHIP Performance Indicator Data) (five states (IN, KY, ME, MS, NE)); (2) the average length of enrollment gaps, and (3) the percent of beneficiaries with overlapping Medicaid and S-CHIP enrollment spans (no states were excluded based on measures 2 or 3). We further excluded states based on: (4) the percent of beneficiaries missing an eligibility group code (threshold of >=10%, excluded OR); (5) the percent of beneficiaries with only one enrollment span (threshold of >=99.5, excluded FL, KY, and WY); and (6) the percent of beneficiaries with three or more enrollment spans in a year (threshold of >=5%, excluded OK). Notably, our exclusion criteria for related to the number of enrollment spans in a year are less restrictive than that in the DQ Atlas because we did not want to make assumptions about the number of enrollment spans in our analysis, but did want to remove extreme cases that are the most likely to represent inaccurate enrollment dates.

For analysis that includes restricted benefit enrollees, we further excluded two states (CA and ND) due to large amounts of missing data among restricted benefit enrollees. CA was excluded because roughly 75% of observations coded with restricted benefits in the DE Base file were missing a federal identifier (BENE_ID). ND was excluded due to large amounts of missing enrollment data in the DE Dates files and, after merging the DE Dates and DE Base files, more than half (53%) of restricted benefit enrollees in the DE Base file did not have a matching BENE_ID in the DE Dates file and were dropped from the analysis.

Beneficiary Linking, Eligibility Classification, and Exclusion

We linked individuals across years using BENE_ID, which are unique enrollee identifiers created by the Chronic Conditions Warehouse and are recommended for use when combining data for multiple years. We also use BENE_ID to link the DE Base and DE Dates files. We assigned restricted benefit status and eligibility group code using a last-best approach for 2018, which assigns eligibility based on the most recent eligibility code in 2018. We classified eligibility groups using a hierarchy that first checked if the eligibility group code was missing, then for medically needy eligibility, disability (under age 65), and expansion adult. Any enrollees in the DE Base file that had a non-missing eligibility code and had not been assigned an eligibility group through this hierarchy were then were assigned by age to children (ages 20 and under), adults (ages 21 to 64), and aged (ages 65 and over).

The 2018 DE Base files for 41 states in our analysis contained 82.9 million observations after removing a small number of “dummy” records that represent enrollees who have claims data but no eligibility data provided by the states. We removed observations missing eligibility codes or restricted benefit status codes (624,000 observations), people qualifying through a medically needy pathway (1.7 million observations), people missing a BENE_ID for linking files (3.1 million observations), and people with duplicated BENE_ID (262,000 observations). After merging with the DE Dates files, there were less than 5,000 enrollees who did not have a matching BENE_ID in the DE Dates and DE Base files and were dropped from the final sample. Our final sample included 77.2 million unduplicated enrollees. Of these, 71.3 million were full-benefit enrollees. Our analysis of restricted benefit enrollees included 5.4 million people in the 39 states included in that component of the analysis.

Calculating Churn

The DE Dates files provide a start and end date for every enrollment span in our time period. As noted above, our analysis uses enrollment dates from 2017 and 2019 for look-back and look-ahead years for a more complete picture of churning. Before calculating churn rates, we first merged all overlapping and contiguous enrollment spans for enrollees, which we defined as enrollment spans that are separated by one day or less. For example, if a person has two enrollment spans with an end date and a start date that are one day apart (i.e., the person disenrolled and re-enrolled the next day), we considered these spans to be contiguous and merged them into one enrollment span. After merging overlapping and contiguous spans, we identified enrollment gaps, which we defined as the number of days between two enrollment spans for an enrollee. To be counted as “churn” in our analysis, a person would have had (1) an enrollment gap of 365 days or less and (2) and enrollment gap that started or ended in 2018. For example, a person that disenrolled in 2017 but then re-enrolled within 365 days in 2018 would be included in our churn estimates. Similarly, a person who disenrolled in 2018 and then re-enrolled in less than 365 days would also be counted in our churn estimates. Sensitivity analyses that only included gaps longer than 31 days showed a marginal decrease in churn rates (approximately 1 percentage point); while shorter gaps could reflect data reporting errors, they also could be true disenrollments followed by relatively quick re-enrollment.

Previous studies have estimated Medicaid churn rates at around 10%. There is some variation across studies due to use of different data sources, national versus state-specific estimates, and the focus on different populations (e.g., children versus adults). A recent analysis from MACPAC, which used the same data source but different methods as our analysis found that 8% of Medicaid and CHIP enrollees re-enrolled in coverage within one year of disenrolling. The most significant difference in our methods from MACPAC analysis was that the MACPAC analysis only utilized a look-ahead year, while our analysis includes a look-ahead year and a look-back year. There are other differences in methods from MACPAC’s analysis, but those likely have a smaller impact than the use of a look-back year. Our estimate of a 10% churn rate overall is also similar to estimates of 9% and 11% from studies of churn in specific states.

Appendix

Appendix Table 1: Percent of Medicaid/CHIP Enrollees Who Disenrolled And Then Re-Enrolled Within Varying Time Periods For Various Populations, 2018
Appendix Table 2: Percent of Medicaid/CHIP Enrollees Who Disenrolled And Then Re-Enrolled Within Varying Time Periods by Eligibility Group, 2018

Medicaid Outpatient Prescription Drug Trends During the COVID-19 Pandemic

Published: Dec 14, 2021

Issue Brief

Introduction

The Build Back Better Act (BBBA) includes several prescription drug provisions; while much of the focus has been on Medicare and private insurance, the bill includes a number of provisions with implications for Medicaid prescription drug spending. Before the pandemic, Medicaid outpatient prescription drug utilization, measured in terms of the number of prescriptions, was decreasing while Medicaid gross spending on prescription drugs was increasing. COVID-19 and social distancing practices changed health care needs and utilization, in turn impacting Medicaid prescription drug utilization and spending in 2020. Further, Medicaid enrollment has increased throughout the pandemic, which could influence Medicaid prescription drug trends. This issue brief describes Medicaid prescription drug utilization and spending trends in calendar year 2020 compared to previous years to explore how the pandemic impacted Medicaid prescription drug utilization and spending. This brief builds on a previous KFF analysis of Medicaid prescription drug trends using the most recent data available.

Medicaid outpatient prescription drug utilization decreased during the pandemic. Overall, there were a total of 703.6 million Medicaid outpatient prescriptions in 2020, which is down from 734.1 million prescriptions in 2019 (Figure 1). While outpatient prescription drug utilization started to decline even before the pandemic, the decline from 2019 to 2020 (4.2%) was greater than the decline from 2018 to 2019 (0.8%). Immediately following the onset of the COVID-19 pandemic, Medicaid prescription drug utilization dropped in the second quarter (April – June) of 2020, experiencing a 10.1% decrease in prescription drug utilization compared to the same quarter in 2019 (Figure 2). Utilization was higher in the third and fourth quarters of 2020, but still below 2018 and 2019 levels. This decrease in outpatient drug utilization occurred as Medicaid enrollment increased by 12.5% between February 2020, right before the pandemic began, and December 2020.

Percent Change in Number of Medicaid Outpatient Prescriptions from Previous Year, 2018-2020
Number of Medicaid Outpatient Prescriptions by Quarter, 2018-2020

Prescription drug utilization trends varied across drug groups in 2020. The same drug groups comprise the top ten most prescribed drug groups in 2019 and 2020, but the order changed (Table 1). Among the top ten most prescribed drug groups in 2020, seven experienced declines in utilization and three experienced increases. Drug groups that saw large utilization declines from 2019 to 2020 compared to 2018 to 2019 included antibiotics, allergy immunotherapy and antihistamines, sympathomimetic agents, and adrenals and combinations. Further, analgesics/antipyretics, which include opioids, were declining before the pandemic and continued to decline in 2020. On the other hand, three drug groups, psychotherapeutics, anticonvulsants, and antidiabetic agents, saw increases in drug utilization from 2019 to 2020, which could be due to the routine nature of the drugs that comprise these groups. Psychotherapeutic agents were the most prescribed drug group in 2020 and experienced a 4% increase in utilization, which mirrors national trends and the increase in mental health challenges throughout the pandemic.

Table 1: Top Ten Drug Groups by Number of Medicaid Prescriptions

While utilization declined, Medicaid spending on outpatient prescription drugs before rebates1  increased in 2020. Overall, Medicaid paid $73.4 billion before rebates for outpatient prescription drugs in 2020, which is up from $69.1 billion in 2019 (Figure 3). Medicaid gross spending on prescription drugs increased 9.8% from 2018 to 2019 compared to 6.2% from 2019 to 2020, indicating spending increases may have slowed somewhat due to the pandemic. Immediately following the onset of the COVID-19 pandemic, the second quarter (April – June) of 2020 saw the lowest spending, which mirrors the dip in utilization in the same quarter, though Q2 2020 spending was still above Q2 spending in previous years (Figure 4). Gross spending rebounded and was higher in the third and fourth quarters of 2020 than in the first quarter of 2020.

Percent Change in Gross Spending on Medicaid Outpatient Prescriptions from Previous Year, 2018-2020
Gross Spending on Medicaid Outpatient Prescriptions by Quarter, 2018-2020

Gross Medicaid spending continued to increase for almost all of the most costly drug groups before rebates in 2020. The same drug groups comprise the top ten most costly drug groups before rebates in 2019 and 2020, but the order changed (Table 2). Antivirals were consistently the most costly drug group in Medicaid before rebates from 2015 to 2019, driven by spending for drugs used to treat HIV and hepatitis C drugs; however, antiviral spending declined from 2019 to 2020 and antidiabetic agents became the most costly drug group before rebates in 2020. While not in the top 10 most costly drug groups, respiratory agents, a drug group used to relieve and treat respiratory diseases such as COVID-19, experienced a 61% increase in gross spending and a 44% increase in utilization from 2019 to 2020.2 

Table 2: Top Ten Drug Groups by Gross Medicaid Spending

Despite remaining stable in prior years, net Medicaid prescription drug spending, or spending after rebates, increased in federal fiscal year 2020. While gross Medicaid spending on outpatient prescription drugs increased from 2015 to 2019, rebates also increased during the period, leaving Medicaid net spending in 2019 almost the same as net spending in 2015. However, recent data for the federal fiscal year (FFY) 2020 (October 1, 2019 – September 30, 2020) shows rebates for Medicaid prescription drugs increased by $2.1 billion from FFY 2019 while Medicaid gross spending increased by $3.6 billion, leading to an increase in net Medicaid spending in FFY 2020.3 

Discussion

There are many factors that may have contributed to the decline in prescription drug utilization during the pandemic, including decreases in service utilization, drug adherence, and the diminished spread of illnesses other than COVID-19. Following the onset of the pandemic, there was a drop in emergency department visits, hospital admissions, preventive service utilization, and elective health services. The use of telemedicine increased, but it did not increase enough to make up for the decline in in-person visits. Declines in health care utilization likely led to fewer clinicians writing prescriptions, thus contributing to the decline in Medicaid prescription drug utilization. Additionally, a recent study found US patients were more likely to discontinue use of chronic medications during the pandemic and less likely to begin new medications, signaling changes in drug adherence could have contributed to the decline. Declines across specific drug groups also likely reflects the decline medical service utilization during the pandemic and the impact of COVID-19 mitigation measures. Social distancing lessened the spread of other illnesses, such as the flu, which saw sharp declines in cases and deaths during the pandemic. Antibiotics saw the largest decline (-23%) in utilization from 2019 to 2020 (Table 1), likely due in part to fewer bacterial infections during the pandemic.

Medicaid prescription drug utilization declined at time when Medicaid enrollment was increasing. Administrative data for Medicaid show that after declines in enrollment from 2017 through 2019, total enrollment nationwide began to grow after February 2020, right before the pandemic began. By December 2020, enrollment had increased by 8.9 million, or 12.5%, from actual enrollment in February 2020. The overall number of prescriptions per enrollee per year decreased from approximately ten prescriptions per person in 2019 down to nine in 2020.4 

While prescription drug utilization decreased during the pandemic, Medicaid spending before rebates increased. Overall, 2020 continued with the same utilization and spending trends seen before the pandemic in 2019, but utilization decreased to a larger degree and spending increased to a smaller degree in 2020 compared to 2019. All drug groups in both the top 10 for utilization and gross spending, saw larger growth in their gross spending than in utilization from 2019 to 2020, which contributes to the increase in spending despite declines in utilization overall. Further, increases in gross spending despite decreases in utilization in 2020 may be due in part to decreased use of less costly drugs. For example, antibiotics experienced a 23% decline in use from 2019 to 2020 (Table 1), but antibiotics only made up 2% of gross spending in 2020. Also, despite the pandemic, the number of new drug approvals remained high in 2020, likely contributing to the increase in spending despite decreases in utilization.

Looking Ahead

Medicaid prescription drug policy is likely to remain an issue at both the federal and state levels due to budgetary constraints and the entry of new, high-cost drugs to the market. States remain concerned about specialty and high-cost drugs and report developing strategies and policies to address these drugs. Though much of the focus on the Build Back Better Act (BBBA), recently passed by the House of Representatives and currently being debated in the Senate, has been on Medicare and private insurance prescription drug provisions, the BBBA includes a number of provisions that affect Medicaid prescription drug spending. The BBBA would require retail community pharmacy participation in the National Average Drug Acquisition Cost (NADAC) survey, which could better align pharmacy reimbursement rates with pharmacy actual costs. The BBBA prohibits the implementation of a rule issued by the Trump Administration estimated to increase federal and state Medicaid spending. The rule would have eliminated rebates negotiated between drug manufacturers and pharmacy benefit managers (PBMs) or health plan sponsors in Medicare Part D by eliminating the safe harbor protection under the federal anti-kickback law. The BBBA also proposes to apply the Medicaid Drug Rebate Program to separate state CHIP programs, likely allowing state CHIP programs to receive larger rebates. Lastly, there may be implications for Medicaid prescription drug spending resulting from Medicare proposals in the BBBA that allow the federal government to negotiate prices for some high-cost drugs and implement an inflationary rebate for some drugs under Medicare Part B and Part D.

Appendix

Methodology

This analysis of Medicaid prescription drug utilization and spending trends builds on a previous KFF analysis of Medicaid prescription drug trends using the most recent data available. This analysis uses 2017 through 2020 State Drug Utilization Data (SDUD), downloaded in November 2021, merged with data from IBM Micromedex RED BOOK. The SDUD is publicly available data provided as part of the Medicaid Drug Rebate Program. It provides data on the number of prescriptions, Medicaid spending before rebates, and cost-sharing for rebate-eligible Medicaid outpatient drugs. The RED BOOK data is from September 2021. The use of RED BOOK data does not represent and should not be characterized as a RED BOOK endorsement of any data, findings, or other content presented in this report. The SDUD and the RED BOOK data were merged at the NDC-level to incorporate the therapeutic/pharmacologic category of the product.

Limitations

The SDUD provides spending and utilization data by NDC, quarter, managed care or fee-for-service, and state. It also provides this data summarized for the whole country. CMS has suppressed data cells with fewer than 11 prescriptions, citing the Federal Privacy Act and the HIPAA Privacy Rule. This analysis used the national data because less data is suppressed at the national versus state level.

This analysis uses gross Medicaid spending because rebate data is unavailable to the public at the NDC level. Rebates have a considerable effect on Medicaid drug spending overall, lowering net spending, but this effect varies at the drug level as different drugs receive different rebates. We do include analysis of the Medicaid Budget and Expenditure System’s (MBES) FMR net expenditure data, available for the federal fiscal year, to understand overall Medicaid rebate trends. Additionally, although Medicaid beneficiaries largely self-administer drugs that are prescribed in an outpatient setting, medical practitioners must administer some drugs. Although states are instructed to collect drug rebates on physician-administered outpatient drugs that are not billed as a bundled service, physician-administered drugs subject to a rebate can vary from state to state. Because specialty drugs are often physician-administered, it is possible that the data reflects lower Medicaid spending and utilization of certain drugs of this kind.

Endnotes

  1. Under the Medicaid Drug Rebate Program, manufacturers that want their drugs covered by Medicaid must sign an agreement with the Secretary of Health and Human Services stating that they will rebate a specified portion of the Medicaid payment for the drug to the states, who in turn share the rebates with the federal government. In addition to federal statutory rebates, most states negotiate supplemental rebates. Both statutory and supplemental rebates account for a sizeable share of prescription drug spending, lowering aggregate drug spending by about 55% in 2019. Rebates are not included in this analysis due to lack of data availability (see Appendix for details). While rebates have implications for net Medicaid spending, understanding trends in gross spending and utilization provides important context for pharmacy benefit policy by highlighting underlying cost factors. ↩︎
  2. KFF analysis of 2019-2020 State Drug Utilization Data, November 2021; IBM Micromedex RED BOOK, September 2021. ↩︎
  3. KFF analysis of Medicaid Budget and Expenditure System (MBES) FMR net expenditure data as of September 2021; 2018-2020 State Drug Utilization Data, November 2021; IBM Micromedex RED BOOK, September 2021. ↩︎
  4. KFF analysis of CMS, Medicaid & CHIP: Monthly Application and Eligibility Reports, last updated October 26, 2021; 2019-2020 State Drug Utilization Data, November 2021; IBM Micromedex RED BOOK, September 2021.   ↩︎

Build Back Better Would Change the Ways Low-Income People get Health Insurance

Authors: Cynthia Cox, Jennifer Tolbert, Robin Rudowitz, and Karen Pollitz
Published: Dec 14, 2021

The Build Back Better Act would make a number of changes to the way people get health insurance and how health care is financed, including by temporarily closing the Medicaid coverage gap. Under current law, 2.2 million uninsured people living in the 12 states that have not expanded Medicaid under the Affordable Care Act (ACA) fall into the Medicaid coverage gap, meaning they are generally ineligible for financial assistance to get health coverage.

What are current health coverage options for low-income people?

The ACA expanded health coverage to millions of people, including by expanding Medicaid and creating health insurance Marketplaces with subsidized coverage starting in 2014. The ACA originally intended to expand Medicaid for nearly all adults with incomes below 138% of the poverty level (about $17,770 for a single individual in 2021) and for those with incomes over that level who did not get insurance through work or Medicare to buy health insurance on the Marketplaces with subsidies based on income. However, a 2012 Supreme Court decision effectively made it optional for states to expand Medicaid, and to this day 12 states have not adopted the expansion, leaving many adults (including low-income parents as well as adults without dependent children) without affordable coverage options. Although Wisconsin has not adopted the Medicaid expansion, there is no one in the coverage gap in Wisconsin because the state provides Medicaid to people under 100% of poverty through a waiver.

Under current law, in non-expansion states, non-elderly adults who do not qualify for Medicaid based on disability and who do not have dependent children are not eligible for Medicaid regardless of their income. And, while all Medicaid programs cover parents, the eligibility levels in non-expansion states are very low (the median eligibility level is 40% FPL). Because Marketplace subsidies are only available to those with income above the poverty level, poor adults who are not eligible for Medicaid are also ineligible for subsidized Marketplace coverage, unless they are American Indian or are recent immigrants who would otherwise be eligible for Medicaid.

Adults with incomes over the federal poverty level in non-expansion states are eligible for generous Marketplace subsidies that help with both the monthly premium and deductibles if they are not otherwise eligible for affordable coverage through work or Medicare. The recent COVID-19 relief legislation – the American Rescue Plan Act (ARPA) – increased the amount of financial assistance available to low-income Marketplace enrollees, making those with incomes between 100 and 150% of the poverty level eligible for $0 premium silver plans with very low deductibles. But, the ARPA did not extend these subsidies below the poverty level, meaning the Medicaid coverage gap persists in non-expansion states. The ARPA did however include additional temporary fiscal incentives for states to newly adopt the Medicaid expansion.

How would Build Back Better change health coverage options for low-income people?

If passed, the Build Back Better Act would temporarily close the Medicaid coverage gap by extending Marketplace subsidies below the poverty level in non-expansion states to adults who may not be eligible through a non-expansion pathway. In states that have adopted the expansion, the legislation would increase the federal match rate from 90% to 93% from 2023 through 2025 to encourage states to maintain their expansion status).

In states that do not expand Medicaid, starting in 2022, the ACA Marketplaces subsidies would offer $0 silver plans with reduced cost-sharing. In 2022, people below poverty would have access to 94% actuarial value silver plans with no monthly premium and deductibles typically under $200. (The actuarial value is the share of a typical populations’ costs that are covered by insurance). In 2023 through 2025, silver plan premiums would still be $0, but for those under 138% of poverty, silver plans would have a 99% actuarial value – meaning their plan will have little or no deductible.

Coverage for Low-Income Non-Elderly Adults under the ACA, ARPA, and BBB
IncomeAffordable Care Act(ACA)2014-2020American Rescue Plan Act (ARPA) and ACA

2021-2022

Build Back Better Act (BBB, as proposed) and ACA

2022-2025

Below 100% FPL (not otherwise eligible for Medicaid through non-expansion pathway)*If state expands Medicaid:
  • Medicaid eligible

If state does not expand:

  • Not eligible for financial assistance
If state expands Medicaid:
  • Medicaid eligible

If state does not expand:

  • Not eligible for financial assistance
If state expands Medicaid:
  • Medicaid eligible

If state does not expand:

  • Marketplace eligible (2022-2025)
  • 0% of income for benchmark silver premium (2022-2025)
  • 94% actuarial value first year (2022)
  • 99% actuarial value later years (2023-2025)
100% – 138% FPL (not otherwise eligible for Medicaid through non-expansion pathway)*If state expands Medicaid:
  • Medicaid eligible

If state does not expand:

  • Marketplace eligible
  • About 2% of income for benchmark silver plan premium
  • 94% actuarial value
If state expands Medicaid:
  • Medicaid eligible

If state does not expand:

  • Marketplace eligible
  • 0% of income for benchmark silver plan premium
  • 94% actuarial value
If state expands Medicaid:
  • Medicaid eligible

If state does not expand:

Marketplace eligible

  • 0% of income for benchmark silver plan premium (2022-2025)
  • 94% actuarial value first year (2022)
  • 99% actuarial value later years (2023-2025)
138% – 150% FPL (not otherwise eligible for Medicaid through non-expansion pathway)**
  • Marketplace eligible
  • About 3-4% of income for benchmark silver premium
  • 94% actuarial value
  • Marketplace eligible
  • 0% of income for benchmark silver premium
  • 94% actuarial value
  • Marketplace eligible
  • 0% of income for benchmark silver premium
  • 94% actuarial value
NOTES: *Undocumented immigrants and some legal immigrant adults are not eligible for Medicaid under traditional or expansion pathways. Some pregnant people, parents and people with disabilities may qualify for Medicaid without Medicaid expansion. American Indians and certain immigrants can receive Marketplace subsidies. In 2021, anyone eligible for unemployment insurance was eligible for $0 silver premiums and 94% actuarial value plans. If passed, BBB would extend the special Marketplace subsidy rule for individuals receiving UI benefits for an additional 4 years, through the end of 2025.**If ineligible for affordable employer coverage. BBB modifies the affordability test for employer-sponsored health coverage. The ACA makes people ineligible for Marketplace subsidies if they have an offer of affordable coverage from an employer, currently defined as requiring an employee contribution of no more than 9.61% of household income in 2022. The BBB would reduce this affordability threshold to 8.5% of income, bringing it in line with the maximum contribution required to enroll in the benchmark plan.SOURCE: KFF

How would Marketplace coverage compare to Medicaid expansion?

In addition to lowering out-of-pocket costs, the Build Back Better Act would make other changes to how Marketplace plans work for low-income enrollees to bring the plans closer to Medicaid standards. For years 2024 and 2025, silver plans for individuals with incomes under 138% of poverty would have to cover non-emergency transportation services and family planning services and supplies that are required under state Medicaid plans with no cost sharing. The requirement to file federal tax returns in order to reconcile premium tax credits would also be waived for these new enrollees with income below 138% of the poverty level. And, an offer of employer-sponsored health insurance would not make these new enrollees ineligible for marketplace subsidies.

Low-income enrollees also would not be limited to signing up during the open enrollment period, and could have access to Marketplace coverage year-round. One advantage of using the Marketplace to expand coverage to low-income people is that, if their income rises above 138% of poverty, they can keep the same Marketplace plan and not have to reapply for a different source of coverage, which might mitigate some coverage loss during transitions.

However, there are some disadvantages to Marketplace coverage compared to Medicaid for low-income individuals. While some states require nominal co-payments for certain services, Marketplace coverage under the Build Back Better Act will likely require higher cost sharing for some enrollees than what they would have paid in Medicaid. (While plans with cost sharing subsidies have very low deductibles and copays for most services, coinsurance might apply for key costly services, such as hospitalization, emergency room care, or specialty drugs).

Medicaid requires retroactive coverage for three months prior to application, so Medicaid covers costs incurred during this period. Coverage in marketplace plans will only take effect prospectively, generally on the first day of the month following plan selection. As a result, marketplace plans will not cover health care expenses incurred prior to the effective date of coverage.

Additionally, Marketplace plans, particularly lower cost plans, often have narrow provider networks, which may limit the choice of hospitals or other providers compared to Medicaid, though this will depend on the state and the plans offered on the Marketplace. On the Marketplace, if a low-income enrollee wants to enroll in a plan with more choices of doctors or hospitals, and if such a plan is offered in their area, they may have the option to pay the difference in the monthly premium between the benchmark silver plan and the broader network plan.

Finally, while people in the Medicaid gap will generally qualify for $0 silver plans, the Marketplace tax credit can only be applied to the portion of the premium that is for essential health benefits. If both the lowest-cost and second-lowest-cost (benchmark) silver plans include non-essential health benefits, the enrollee must pay a small monthly amount to cover the non-essential benefit portion of the premium. In about 13% of counties in states using Healthcare.gov, both of the two lowest-cost silver plans include non-essential health benefits in 2022. Low-income enrollees in those counties would otherwise be eligible for $0 premium plans, but may instead have to pay a few dollars per month. If payment is missed, coverage can be terminated.

Looking ahead

While navigating and signing up for health insurance will remain a complicated task for many low-income people, the Build Back Better Act would provide $105 million in additional funding through 2025 for targeted outreach to individuals in the Medicaid coverage gap to inform them of their eligibility for subsidized coverage in the Marketplaces. In addition, the Act directs the federal Marketplace to make no less than an additional $70 million—at least $10 million in FY 2022 and $20 million in each of FY 2023-2025—available to Navigators in non-expansion states to help individuals sign up for coverage. Finally, to facilitate enrollment in coverage, the legislation would allow individuals with income below 138% of poverty to enroll in Marketplace coverage throughout the year.

Seven years after the Medicaid coverage gap was created, passage of the Build Back Better Act would provide affordable, comprehensive coverage, albeit temporarily, to the more than 2 million that are uninsured because their states have chosen not to expand Medicaid. However, the Build Back Better Act’s closure of the Medicaid coverage gap is only temporary, at a cost to the federal government of $57 billion according to the Congressional Budget Office. After the year 2025, if Congress does not act to extend the subsidies, approximately 2.2 million people living in non-expansion states who have incomes under 100% of poverty would fall back into the Medicaid coverage gap unless the state adopts the Medicaid expansion (with the ARPA financial incentive). Similarly, Marketplace-eligible people with incomes between 100-138% of poverty would see their monthly silver plan premiums rise.

News Release

Health Employment Continues Slow Recovery Since the Beginning of the Pandemic

Published: Dec 10, 2021

Unlike past recessions, the health sector saw a big drop in employment in early 2020 similar to other sectors as the COVID-19 pandemic shut down much of the nation’s economy and remains below expected employment levels through November 2021, a new KFF chart collection shows.

The chart collection takes a deep dive into the Bureau of Labor Statistics data to analyze how jobs and wages in the industry shrank and recovered compared to other sectors. Key findings include:

  • After a sharp drop in employment at the beginning of the pandemic, jobs in the health sector began to return in May 2020 but the recovery remains incomplete. In November, employment in the health sector remains 2.7% lower than its peak in February 2020.
  • The number of workers in nursing care and elder care facilities has continued to decline even after other health settings experienced a rebound. As of November, nursing care facilities and elder care facilities employed 15% and 11.1% fewer workers than they did in February 2020.
  • Outside of hospitals, unemployment for men in health care has declined to 2.9% in November from 3.5% in February 2020. By contrast, women in non-hospital health jobs saw an increase in unemployment to 3% in November compared to 2.3% in February 2020.

The chart collection is available through the Peterson-KFF Health System Tracker, an online information hub that monitors and assesses the performance of the U.S. health system.