KFF designs, conducts and analyzes original public opinion and survey research on Americans’ attitudes, knowledge, and experiences with the health care system to help amplify the public’s voice in major national debates.
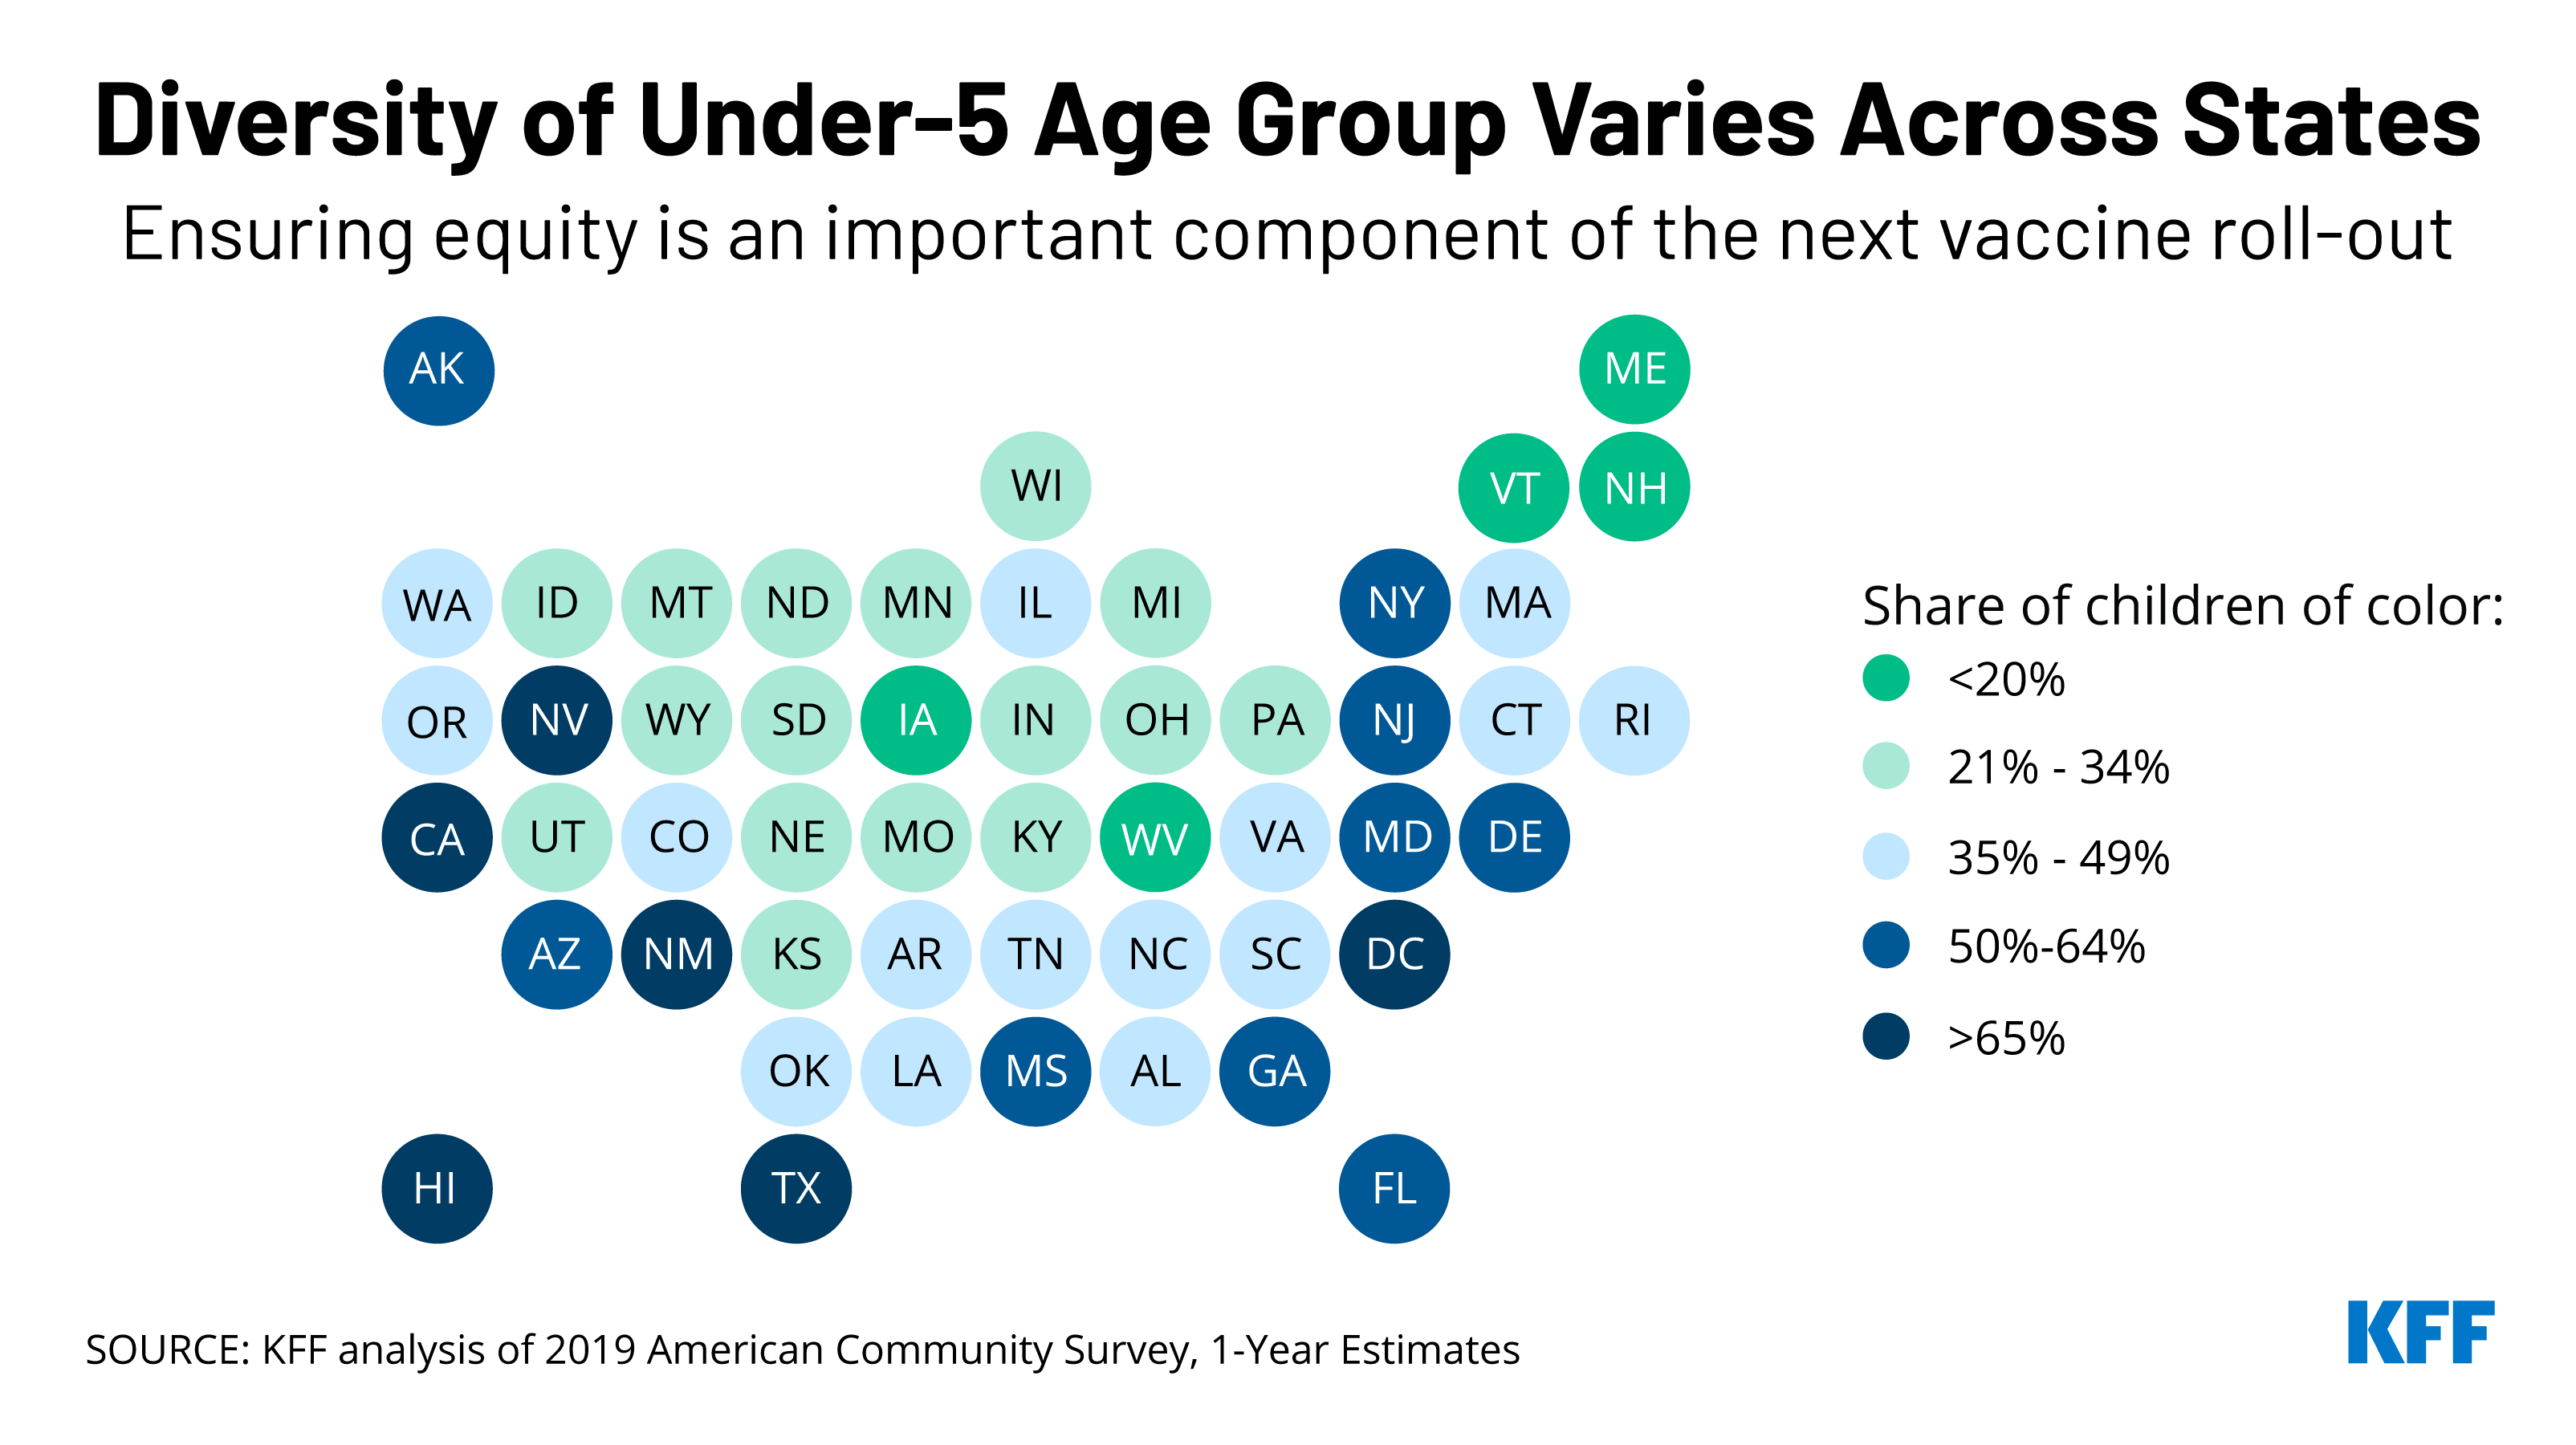
Prioritizing equity will be a key component of the anticipated rollout of Pfizer’s COVID-19 vaccine to children under 5 years old, which could be authorized as early as next week. Of the 19 million children under 5 in the United States, half are children of color, making this group more diverse than the U.S. population overall (40%).
There is also significant variation across the country. In five states and Washington, DC, children of color account for at least two-thirds of all children in this age group: Hawaii, New Mexico, California, Texas, and Nevada. In eight other states, the share is above half: Arizona, Florida, Maryland, Georgia, New Jersey, New York, Delaware, and Mississippi.
While Black and Hispanic people during the pandemic have been less likely than their White counterparts to have received a COVID-19 vaccine, racial disparities in vaccination rates have narrowed over time and have closed for Hispanic people. Our recent brief on the upcoming vaccination roll-out to young children discusses the importance of addressing potential access barriers and enlisting trusted community messengers to mitigate similar disparities in vaccination rates among this group.
Telehealth use skyrocketed during the early months of the pandemic. While it has since decreased somewhat from that high, it still represents a much more substantial share of health care than before COVID, this KFF-Epic Research analysis finds.
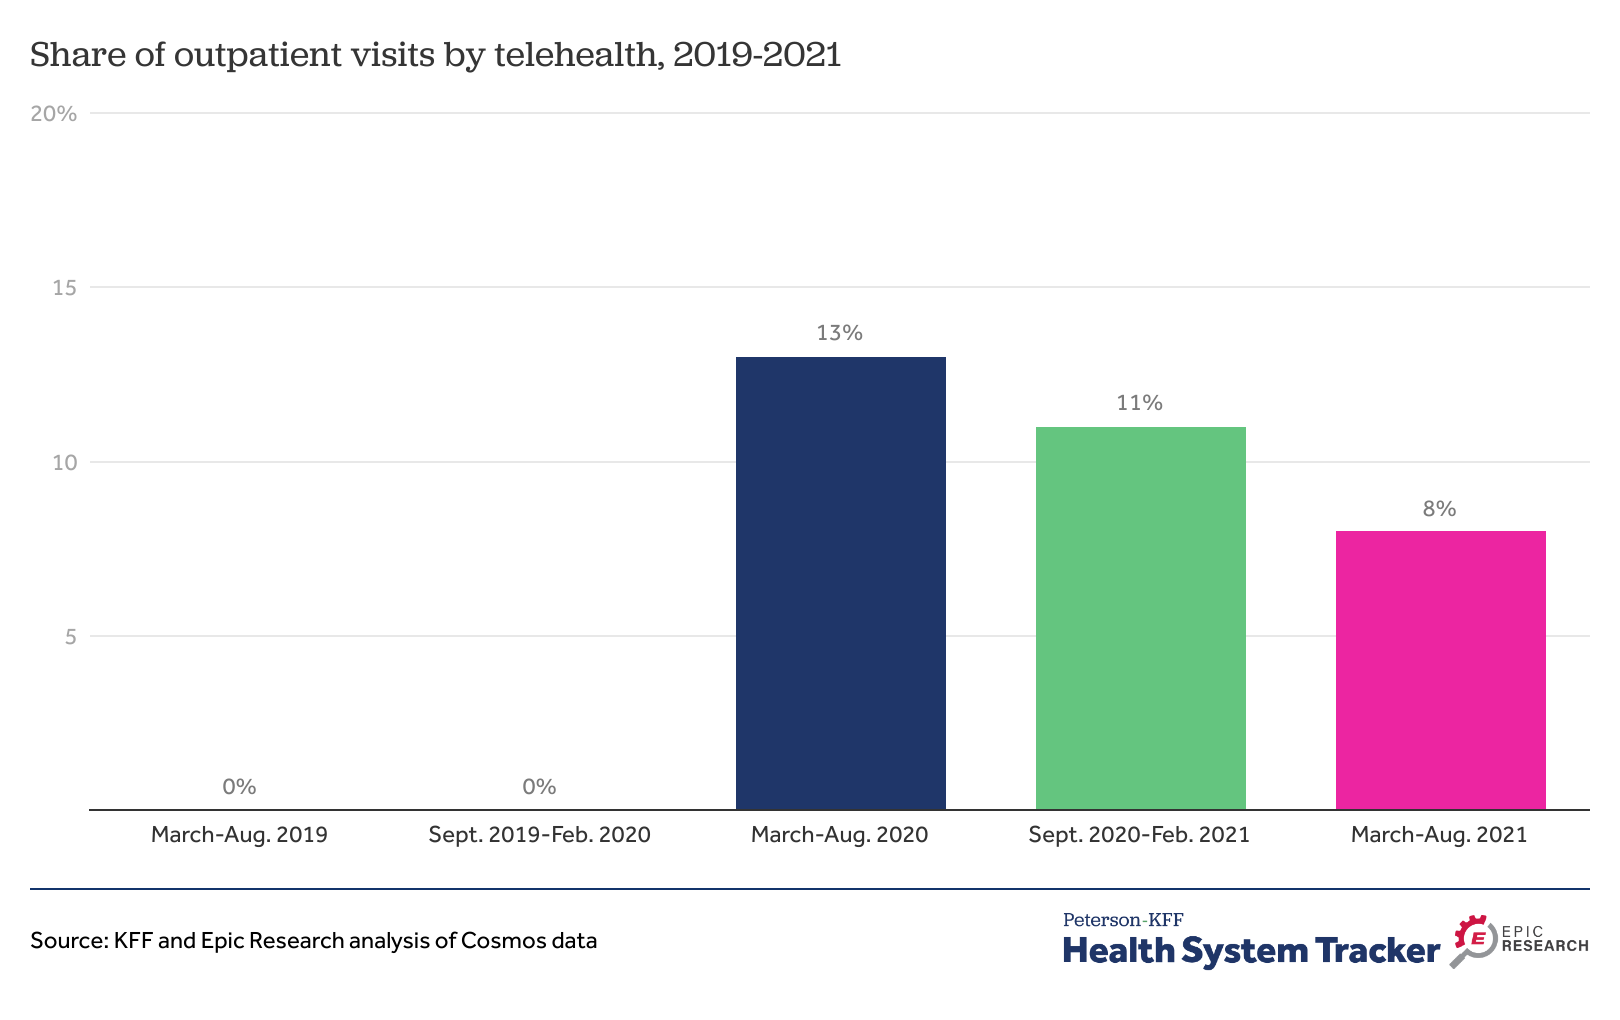
From March through August 2021, 8% of all outpatient visits were conducted via telehealth– down from 13% in the first six months of the pandemic, but well above pre-pandemic levels, when telehealth accounted for a negligible share of outpatient visits.
The report also looks at telehealth use by chronic condition and by gender and summarizes potential implications for expanded telehealth use for access, costs and quality of care, as well as the regulatory environment likely to affect telehealth in the future.
The analysis can be found on the Peterson-KFF Health System Tracker, an information hub dedicated to monitoring and assessing the performance of the U.S. health system.
Telehealth Accounted for 8% of Outpatient Visits More Than a Year into COVID-19 Pandemic, Suggesting a More Permanent Shift in How Patients Receive Care
Telehealth use skyrocketed during the early months of the pandemic. While it has since decreased somewhat from that high, it still represents a much more substantial share of health care than before COVID, a new KFF-Epic Research analysis finds.
From March through August 2021, 8% of all outpatient visits were conducted via telehealth – down from 13% in the first six months of the pandemic, but well above pre-pandemic levels, when telehealth accounted for a negligible share of outpatient visits (rounding to 0%).
The analysis examines data from Cosmos, Epic’s HIPAA-defined limited data set of more than 126 million patients from hospitals and clinics across the country. Other findings include:
Adults ages 65 and older relied on telehealth for a smaller share (5%) of outpatient visits between March and August 2021 than younger adults (8%) and children (11%).
Patients in rural and urban areas used telehealth at similar rates during the six-month period (10% and 8%, respectively).
The report also looks at telehealth use by chronic condition and by gender and summarizes potential implications for expanded telehealth use for access, costs and quality of care, as well as the regulatory environment likely to affect telehealth in the future.
The report is available through the KFF-Peterson Health System Tracker, an online information hub that monitors and assesses the performance of the U.S. health system.
The U.S territories – American Samoa, the Commonwealth of the Northern Mariana Islands (CNMI), Guam, Puerto Rico, and the U.S. Virgin Islands (USVI) – have faced an array of longstanding fiscal and health challenges that were exacerbated by recent natural disasters and the COVID-19 pandemic. Over time, Congress has provided additional federal funding often to address emergencies and additional financing needs beyond the Medicaid allotments set in law. Recent funding increases were set to expire at the end of FY 2021, but administrative action helped to avoid a sharp decline in federal Medicaid financing at the end of FY 2021. The Build Back Better Act (BBBA) includes a permanent statutory increase to the territories’ Medicaid allotments and match rates. This policy watch examines how Medicaid funding for the territories works, the current allotments, and how BBBA would change Medicaid funding for the territories going forward. While a version of BBBA has passed the house, its fate in the Senate remains uncertain.
Unlike in the 50 states and D.C., annual federal funding for Medicaid in the U.S. territories is subject to a statutory cap and fixed matching rate. Both the capped federal allotment (known as the Section 1108 allotment) and the territories’ federal matching rate (known as the federal medical assistance percentage, or FMAP) are fixed in statute. This funding arrangement is unlike federal Medicaid funding for states where federal dollars are uncapped and the FMAP is adjusted annually based on a state’s relative per capita income. Once a territory exhausts its capped federal funds, it no longer receives federal financial support for its Medicaid program during that fiscal year.
Over time, Congress has provided increases in federal funds for the territories broadly and in response to specific emergency events. Most recently, the Further Consolidated Appropriations Act of 2020 and the Families First Coronavirus Response Act (FFCRA) significantly increased the allotments for each of the territories for FY 2020 and FY 2021 (seven to nine times the statutory levels) and also raised the FMAP rates from the statutory level of 55% to 76% for Puerto Rico and 83% for the other territories. These statutory changes to the allotments and the match rate expired at the end of September. However, like other states, the territories are also eligible to receive a 6.2 percentage point increase to the statutory Medicaid match rate through the end of the quarter in which the public health emergency (PHE) expires if certain maintenance of eligibility requirements are met.
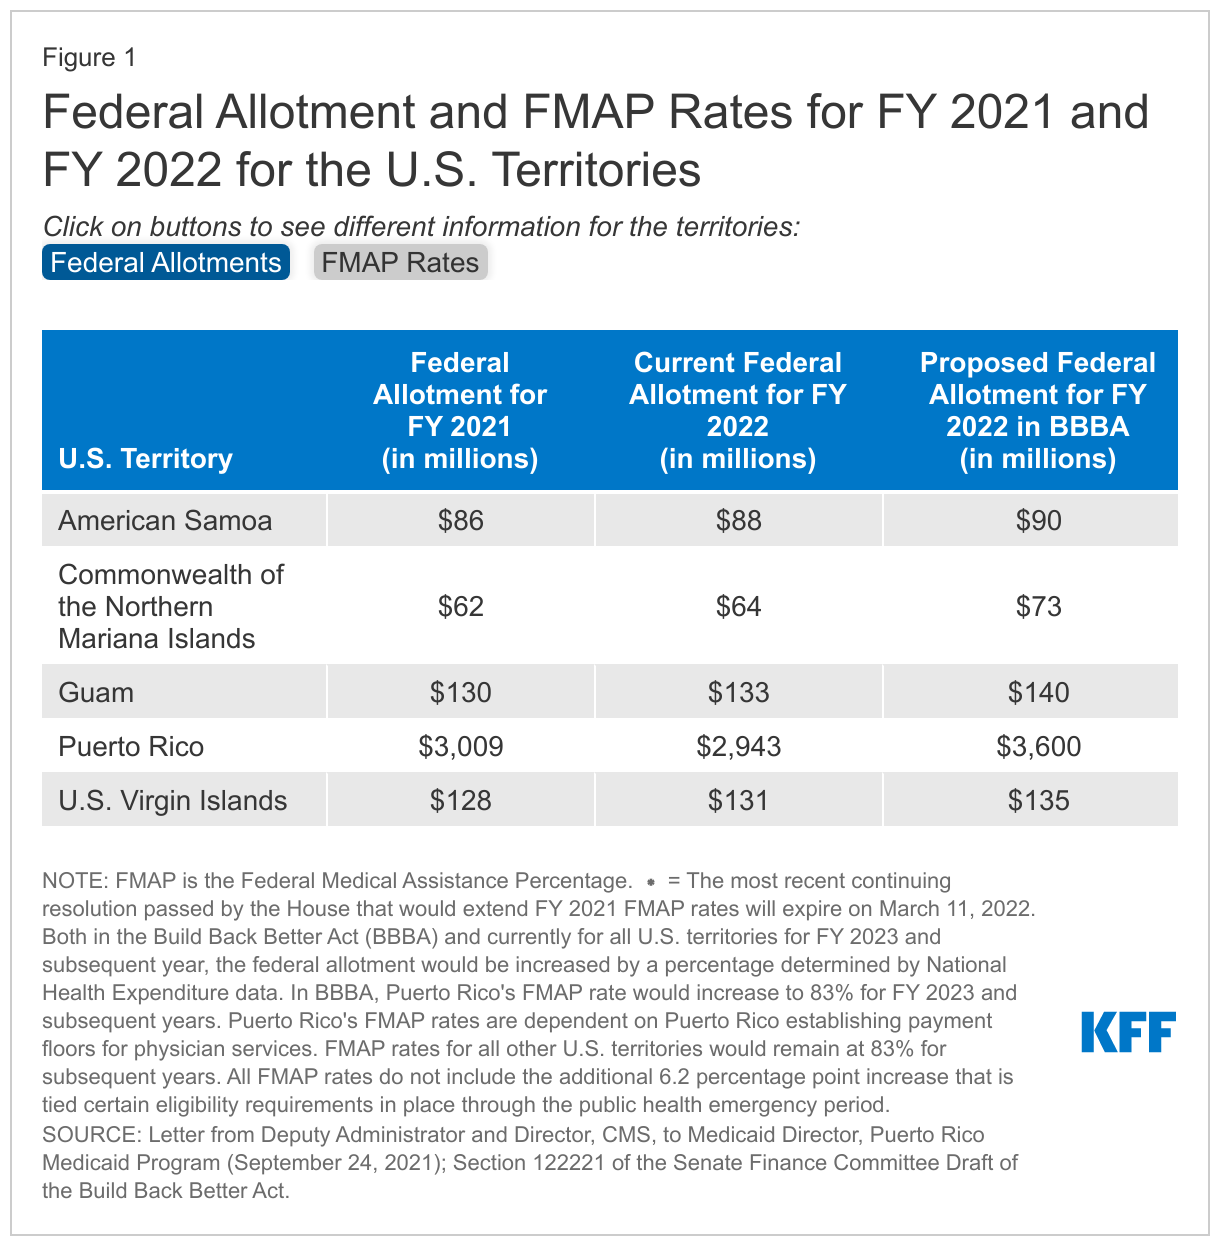
At the end of September 2021, CMS calculated FY 2022 allotments for the territories based on allotments for FY 2021 (except for Puerto Rico where calculations were based on allotments for FY 2020). These calculations helped to avoid a fiscal cliff in federal Medicaid funding for the territories that could have resulted in significant reductions to eligibility levels and benefits. These calculations represent increases of around 3% for all territories compared to their FY 2021 allotment except for Puerto Rico, which would see a decrease of around 2% from FY 2021 (Figure 1). In November 2021, the GAO released a non-binding legal opinion that CMS did not have the authority to adjust the base for the FY 2022 federal allotment for Puerto Rico based on the FY 2020 allotments, but President Biden recently stated that Puerto Rico will receive $2.9 billion in Medicaid funding. CMS noted the calculations related to the allotments would not affect the FMAP rates that would return to the statutory 55% (with an additional 6.2 percentage points available under the public health emergency) on October 1, 2021. However, a prior continuing resolution maintained FMAP rates of 76% for Puerto Rico and 83% for the rest of the U.S. territories through December 3, 2021. The most recent continuing resolution passed by the House would extend these FMAP rates for all territories (except Puerto Rico) through March 11, 2022. Puerto Rico’s current FMAP rate is 55%.
The Build Back Better Act (BBBA) proposed permanent increases in federal allotments and matching rates for the U.S. territories. The BBBA that passed the House and the draft released by the Senate Finance Committee both include provisions to increase the capped federal allotment and fixed matching rates for the U.S. territories (Figure 1). Compared to their FY 2021 allotments these proposed allotments represent modest increases of 5 – 8% for American Samoa, USVI, and Guam and more significant increases of 17% and 20% for CNMI and Puerto Rico, respectively. Additionally, FMAP rates would increase to 83% for all territories except Puerto Rico. Puerto Rico would receive an FMAP rate of 76% in FY 2022 and a rate of 83% in subsequent years dependent on Puerto Rico establishing a reimbursement floor for provider payments.
The passage of the BBBA would provide Puerto Rico and the territories with more certainty in their federal funding and FMAP rates. The BBBA provides a permanent increase in the federal allotments and match rates for all territories. Without the BBBA, the FY 2022 allotment for Puerto Rico will remain slightly lower relative to FY 2021. In addition, the continuing resolution that would extend the enhanced match rate for the territories (except Puerto Rico) will expire on March 11, 2022. When this happens, all territories would see lower FMAP rates resulting in the territories needing to contribute more local funds to draw down federal funds.
In 2019, the U.S. spent more than $1,000 per person on prescribed medicines, an amount higher than any peer nation. This chart collection examines what we know about prescription drug spending and use in the U.S. and comparably large and wealthy countries, using data from the Organization for Economic Cooperation and Development (OECD).
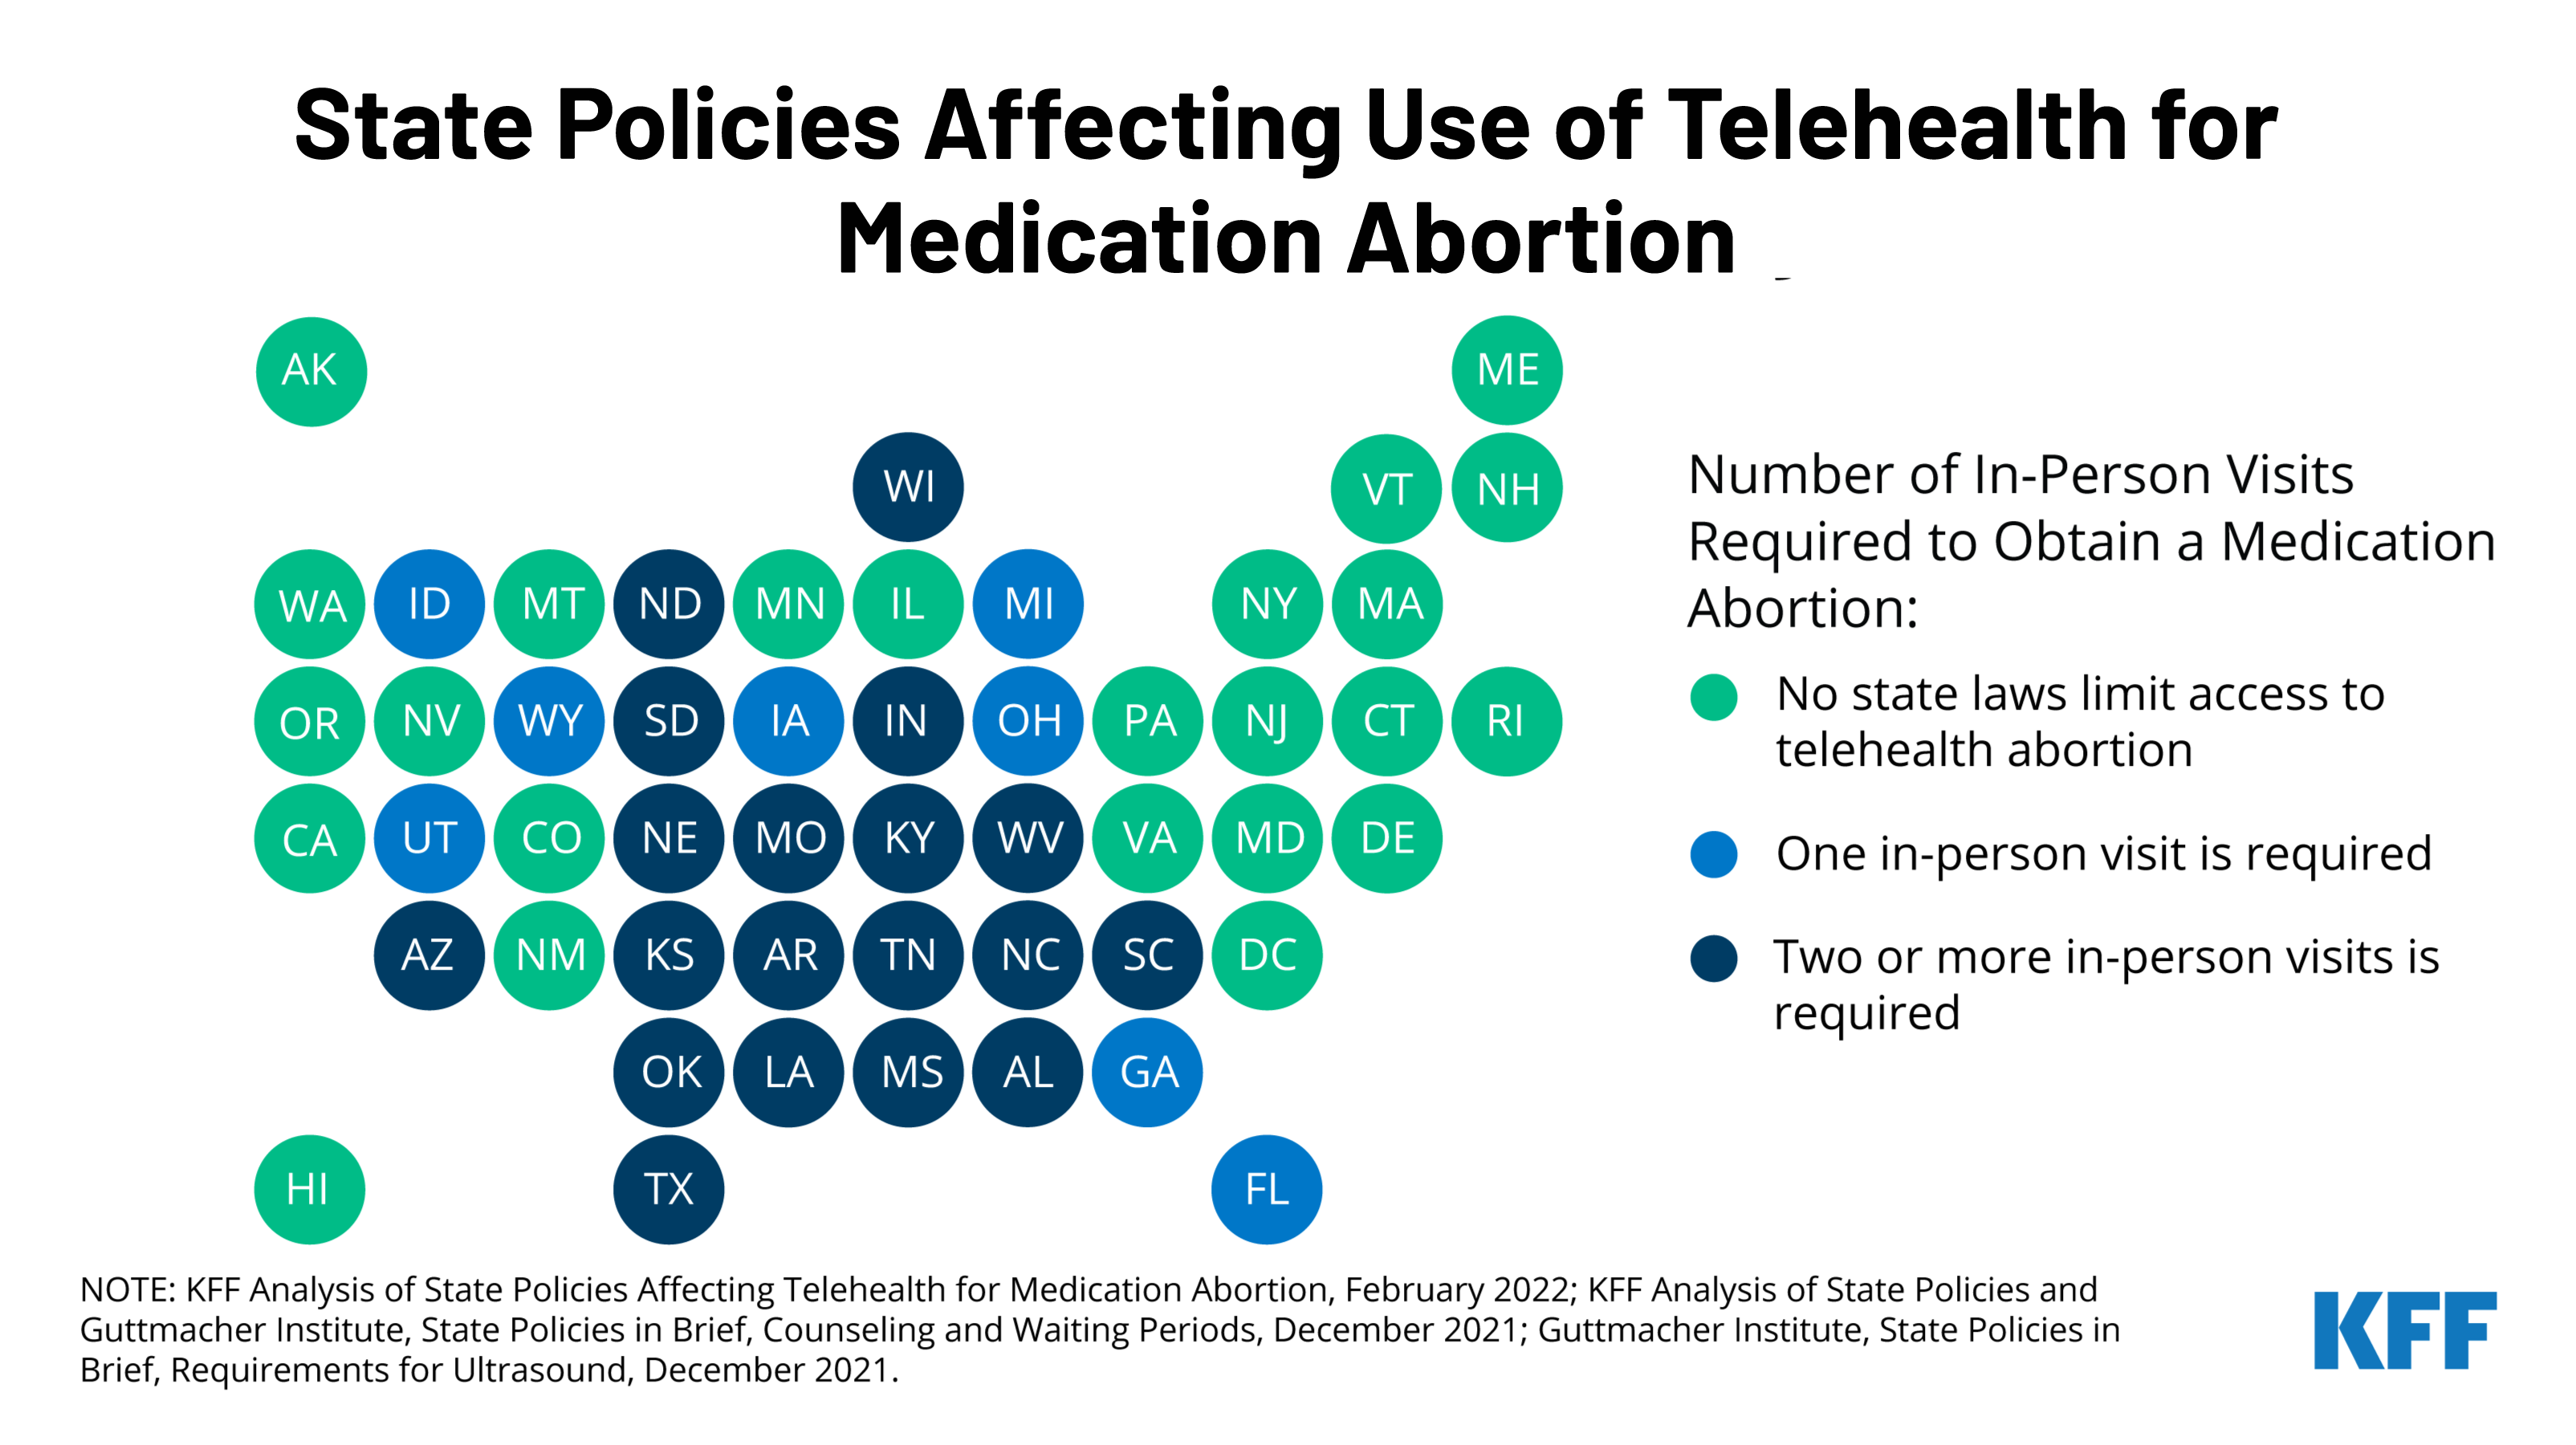
With the country waiting on the Supreme Court’s decision on Dobbs v. Jackson Women’s Health Organization, the case that could overturn Roe v. Wade, many are looking towards telehealth as an alternative to expand access to medication abortion. A new KFF issue brief explains the newly revised Food and Drug Administration (FDA) policy on medication abortion and the differential impact this could have on states by assessing the intersection of federal policy regarding dispensing medication abortion pills with state laws regulating the provision of abortion services.
Prior to the COVID-19 pandemic, dispensing medication abortion via telehealth was limited by a FDA requirement which allowed only certified clinicians to dispense mifepristone, the medication abortion pill, at a health care setting. After temporarily suspending the enforcement of the requirement during the pandemic public health emergency, the FDA permanently lifted the requirement on December 16, 2021. While this change will likely expand access to medication abortion in some states, many states have other policies that will still restrict medication abortion via telehealth.
The new brief reviews state requirements and regulations that affect the availability of medication abortion via telehealth, including which states have directly banned telehealth abortions already. To learn more about the latest news on abortion, visit www.kff.org/womens-health-policy/.
Adoption of evidence-based guidelines, laws, and policies is important for improving HIV-related health outcomes. While PEPFAR’s primary focus is on HIV service delivery, it also aims to create conditions within countries that can contribute to successful implementation of HIV programs, which includes helping to foster policy environments through both operational guidance and diplomacy.
We examined the policy environments in PEPFAR countries to assess alignment with international HIV-related standards, looking at four main categories (clinical care and treatment, testing and prevention, structural, and health systems). We also compared PEPFAR countries to other low- and middle-income countries (LMICs).
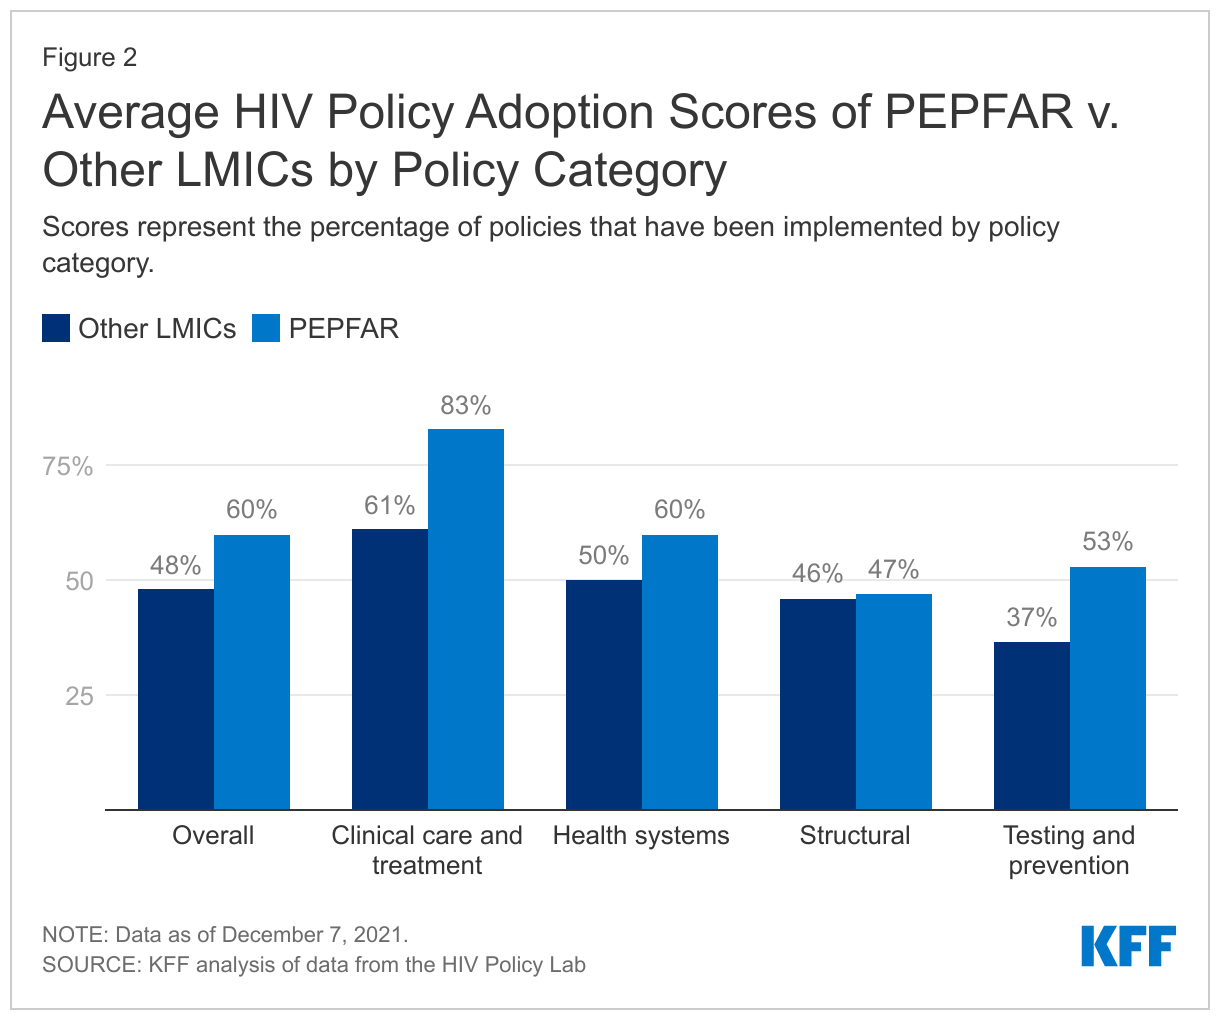
Overall, we find that PEPFAR countries have stronger policy alignment than other LMICs – PEPFAR countries as a group have adopted 60% of recommended policies, compared with 48% among other LMICs, and PEPFAR countries have higher alignment scores than other LMICs in three of the four categories.
Policy alignment was particularly strong, including relative to other LMICs, in areas in which PEPFAR directly focuses and supports. PEPFAR countries scored highest (81%) in the area of clinical care and treatment, which includes policies related to early treatment initiation, treatment regimens, and viral load testing, and scored 20 percentage points higher than other LMICs. While the overall score on testing and prevention was lower than that of clinical care and treatment, there was still a large differential compared to other LMICs (57% compared to 37%). Scores were lowest and similar for both groups on policies and laws related to structural factors, such as HIV-related non-criminalization policies.
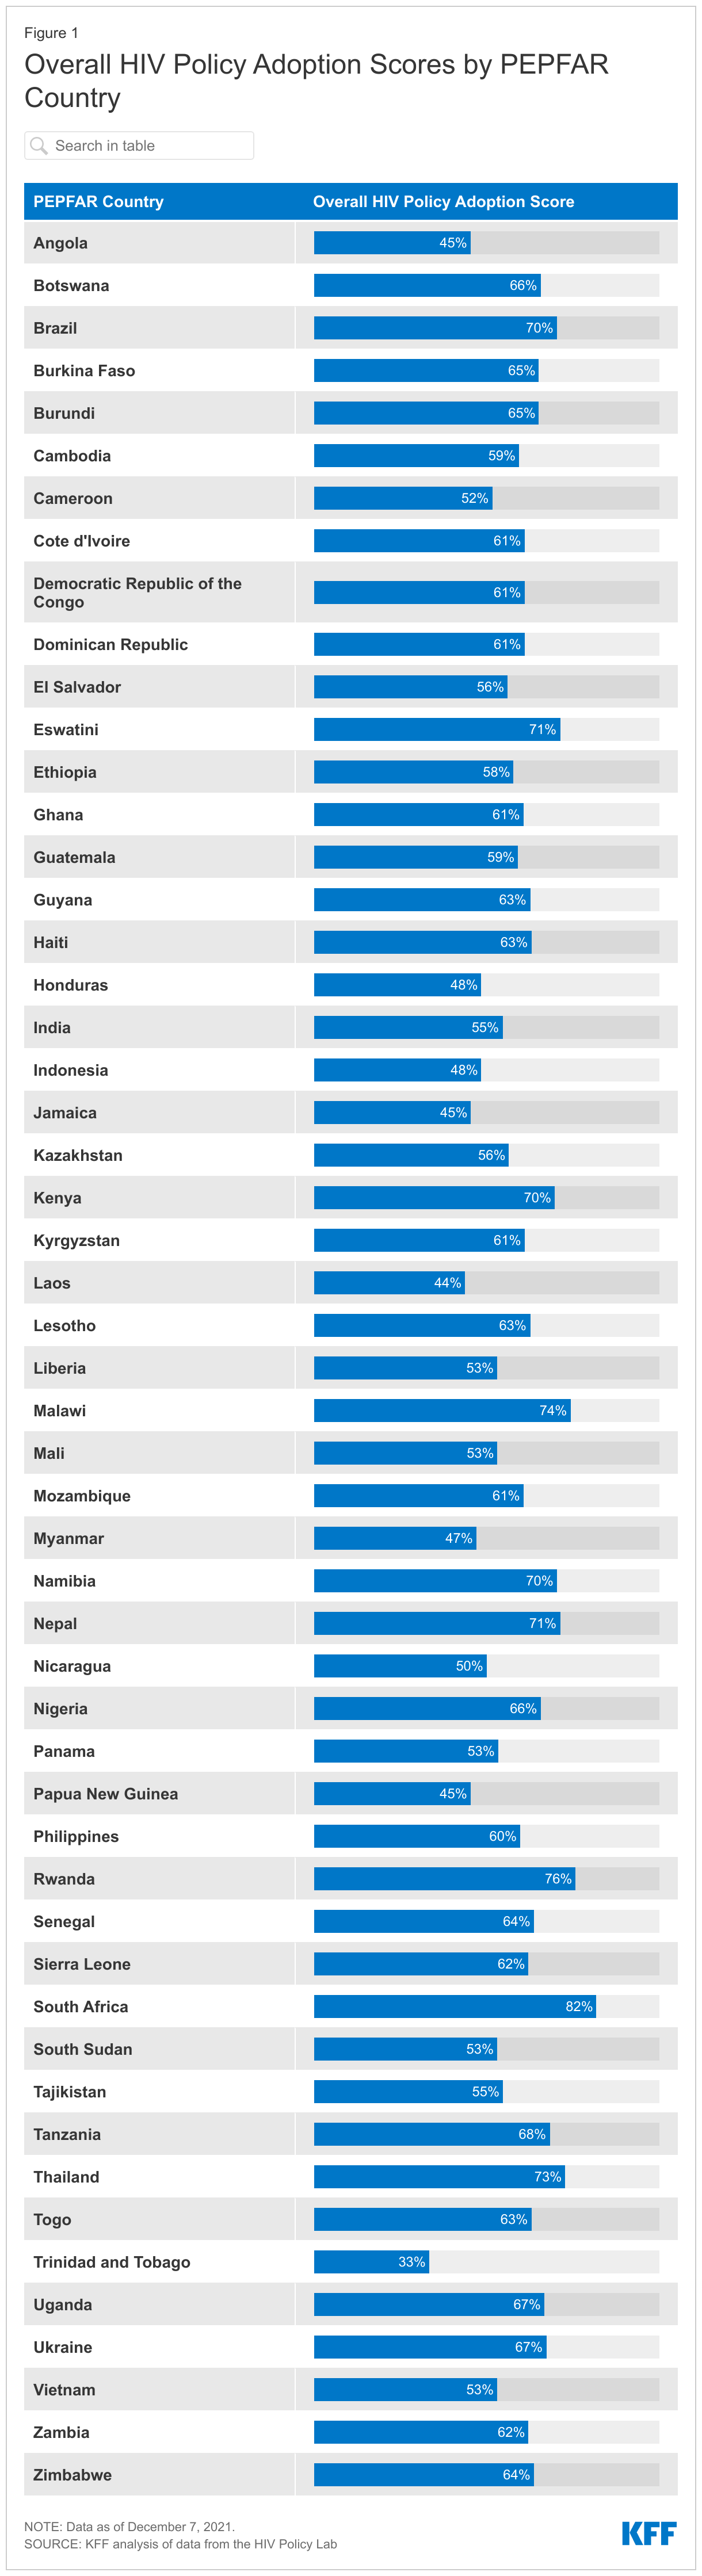
Policy alignment across PEPFAR countries varies substantially – overall policy adoption scores range from 33% in Trinidad & Tobago to 82% in South Africa and there is also variation within each main category – for instance, while no PEPFAR country has adopted policies related to drug use non-criminalization (structural), all 53 PEPFAR countries have fully aligned viral load testing policies (clinical care and treatment) with international standards.
While PEPFAR countries scored higher than other LMICs overall, a significant share of recommended policies have yet to be adopted in PEPFAR countries, particularly in the area of structural barriers, which may be the most difficult to affect at the country level, given that they often require national legal changes and/or reach beyond HIV. Going forward, these findings may serve as a baseline for targeting and assessing future PEPFAR efforts as the program seeks to further improve HIV outcomes in the countries within which it works.
Introduction
The U.S. government’s President’s Emergency Plan for AIDS Relief (PEPFAR), the world’s largest commitment by any nation to address a single disease, has played a significant role in addressing HIV/AIDS in the hardest-hit countries around the world and is credited with helping to shift the trajectory of the epidemic.1 While most of PEPFAR’s efforts are focused on providing services to those with and at risk for HIV, PEPFAR also aims to create conditions that can contribute to the successful implementation of HIV programs. 2,3,4 This includes working to foster the adoption of normative, evidence-based guidance and policies developed by international bodies aimed at improving HIV-related health outcomes.5,6,7
Through its operational guidance and direct diplomatic engagement,8 PEPFAR has worked to encourage and in some cases require that country programs adopt certain policies, such as new antiretroviral treatment guidelines; differentiated service delivery9 – including multi-month dispensing of antiretrovirals (ARVs) to reduce the need for frequent refills, which has become particularly important to ensure continuity of treatment during COVID-19; and the removal of user fees that can serve as obstacles to HIV service access; as well as increase domestic budgets for HIV.10,11,12,13,14 PEPFAR also has emphasized the importance of addressing stigma and a human rights approach, particularly for reaching key populations that some societies have historically shunned.15,16,17,18 As a result, the program has been found to have played an important role in helping to shape the HIV policy environments in the countries in which it operates.19,20,21,22,23,24
We sought to assess policy alignment with international HIV standards in PEPFAR countries. We included PEPFAR countries that were required to develop Country or Regional Operating Plans (COPs or ROPs), which are used for approval of funding and serve as annual strategic plans for U.S. HIV/AIDS efforts in host countries in 2020.25,26,27 In addition to assessing how PEPFAR COP/ROP countries align with international standards, we also compared this group to other LMICs.28,29
Because we looked only at a point-in-time snapshot, findings cannot necessarily be attributed to PEPFAR. Rather, they may serve as a baseline for targeting and assessing future PEPFAR efforts, as the program seeks to further improve HIV outcomes in the countries within which it works. It is possible that policies may have changed in PEPFAR countries since we completed the analysis. For instance, according to a presentation by PEPFAR headquarters staff to stakeholders on August 2, 2021, numerous PEPFAR countries have been making modifications to their polices or guidelines related to multi-month dispensing of antiretrovirals during the COVID-19 pandemic.30
We analyzed data from the HIV Policy Lab, a joint project of Georgetown University’s O’Neill Institute and other academic, civil society, and multilateral partners, with the support of PEPFAR, which compiles and measures the HIV-related policies of the 194 World Health Organization (WHO) member states against international normative guidance. The policies that the HIV Policy Lab uses as benchmarks are those recommended by internationally-recognized authorities, including the WHO, UNAIDS, the U.N. Development Programme, the Global Commission on HIV and the Law, and others based on current science and evidence and aimed at improving HIV-related outcomes. The HIV Policy Lab database uses information reported by governments through the National Commitments and Policy Instrument (NCPI) housed on UNAIDS’ Laws and Policies Analytics platform,33 and collects additional data from official countries sources, reports from U.N. member states, and other partner organizations.
We used the most recent year of data available (through 2020) on policies by country to assess their status in 53 PEPFAR countries required to submit a COP and ROP in 2020, and 85 other LMICs that either did not receive PEPFAR support (82 countries) or received some U.S. HIV support, but were not required to submit a COP or ROP in 2020 (3 countries).34,35,36 We included the full set of 33 indicators – along with more than 30 sub-indicators – across the four categories that the HIV Policy Lab tracks: clinical care and treatment; testing and prevention; health systems; and structural barriers (see Table 1 and the Appendix; more detailed explanations of each indicator can be found in the HIV Policy Lab’s Codebook).
For each indicator where data are available, the HIV Policy Lab assigns points based on adoption status – “Adopted” (1 point), “Partially Adopted” (0.5), and “Not Adopted” (0). For indicators with sub-indicators, the HIV Policy Lab assigns a full point if all sub-indicators are adopted, a half point (0.5) if some are adopted, and 0 if none are adopted. The points for all indicators are added to obtain a raw score for each country. Adoption percentages are calculated by dividing the raw scores by the total possible scores; indicators for which there are no data available are excluded. Scores for groups (e.g., PEPFAR countries, regions) were calculated by averaging country scores at the overall- and category-level. Scores presented in the text are for the main indicators unless otherwise noted. Countries without data were excluded.
Our analysis is based on data downloaded on December 7, 2021.
Table 1: Policy Indicators Included in Analysis, by Category
Clinical Care and Treatment
Testing and Prevention
Health Systems
Structural
Treatment Initiation
Self-testing
Task Shifting
Same-sex Sex Non-Criminalization
Same-day Treatment Start
Partner Notification/Index Testing
Healthcare Financing
Sex Work Non-Criminalization
Treatment Regimen
Compulsory Testing
Universal Health Coverage
Drug Use Non-Criminalization
Differentiated Service Delivery
Age Restrictions on Testing & Treatment
User Fees
HIV Exposure Non-Criminalization
Viral Load Testing
PrEP
Access to Medicines (TRIPS)
Non-discrimination Protections
Pediatric Diagnosis & Treatment
Harm Reduction
Unique Identifiers with Data Protections
National Human Rights Institutions
Migrant Access to Healthcare
Comprehensive Sexuality Education
Data Sharing
Constitutional Right to Health
Tuberculosis Diagnosis
Prisoners Prevention
Girls Education
Gender-based Violence
Civil Society
Findings
PEPFAR countries, as a group, have greater policy alignment, than other LMICs.
Overall, PEPFAR countries have an average adoption score of 60% for the recommended policies, compared to 48% for other LMICs. Policy adoption scores in PEPFAR countries range from 33% in Trinidad & Tobago to a high of 82% in South Africa (see Figure 1).
PEPFAR countries score higher on three of the four policy categories tracked, with an average score 22 percentage points greater than that of other LMICs for clinical care and treatment indicators; 16 percentage points higher for testing and prevention indicators; and 10 points higher for health systems indicators. The score for the fourth category — structural indicators – was similar to that of other LMICs (see Figure 2).
PEPFAR countries have the strongest policy alignment in the area of clinical care and treatment and the weakest on structural indicators.
On average, PEPFAR countries have an adoption score of 83% for policies related to clinical care and treatment (see Figure 2), ranging from a low of 31% (Nicaragua) to a high of 100% in eight countries (Eswatini, Ethiopia, Haiti, Malawi, Papua New Guinea, South Sudan, Uganda, and Zimbabwe).
For testing and prevention indicators, PEPFAR countries have an average adoption score of 53%, ranging from 0% (Trinidad and Tobago) to 94% (Nigeria).
PEPFAR countries scored an average of 60% for health systems indicators, ranging from 14% (Laos) to 93% in three countries (Eswatini, South Africa, and Thailand).
PEPFAR countries have the weakest alignment for policies related to structural indicators (47%), with Lesotho scoring the lowest in this category at 11%, and Rwanda and South Africa scoring the highest at 70%.
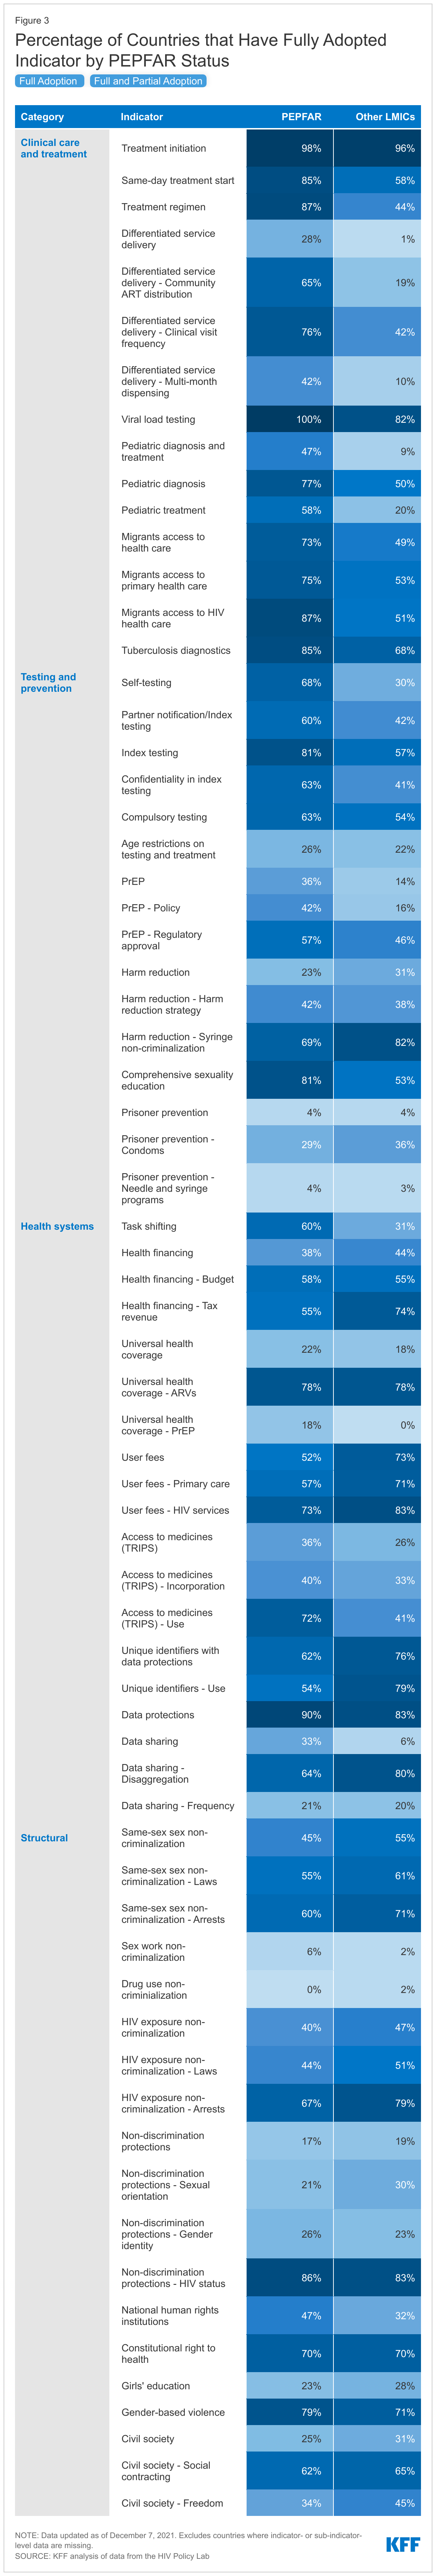
There is also significant variation in policy alignment within each main category– for instance, while no PEPFAR country has adopted policies related to drug use non-criminalization (structural), all 53 PEPFAR countries have fully aligned viral load testing policies (clinical care and treatment) with international standards.
Clinical Care and Treatment
All PEPFAR countries in this analysis (53) have fully adopted viral load testing policies aligned with international standards (whether a national policy is in place to monitor viral load in people with HIV at least once a year). This was the only indicator among the 33 for which 100% of countries have fully aligned policies. Treatment initiation policies (whether a national policy is in place that states that people with HIV, regardless of CD4 count, are eligible to start treatment) followed closely with 52 of the 53 PEPFAR countries fully adopting.
Differentiated service delivery (DSD) policies (whether national policy allows for differentiated HIV treatment services such as multi-month dispensing and community antiretroviral therapy) had the smallest share of PEPFAR countries fully adopting – 15 of the 53 PEPFAR countries, although an additional 36 had adopted some DSD policies.
Testing and Prevention
Adoption of prevention policies is greatest for comprehensive sexuality education (whether national policies require curriculum that meets international standards be taught in primary and secondary schools), with 42 PEPFAR countries fully adopting (out of 52 with available data).
Policies related to HIV prevention among prisoners (whether national policy stipulates that prevention tools, such as condoms, lubricants, and syringe access/exchange programs available to prisoners) were the least likely to be aligned, with just two countries (Kyrgyzstan and Tajikistan) fully adopting policies aligned with international standards (out of 52 with available data), although an additional 13 had adopted some policies in this area.
Health Systems
Within this category, PEPFAR countries are most aligned on policies related to unique identifiers with data protections (whether the country utilizes unique identifiers for continuity of care across multiple facilities and has legally-enforceable data privacy protections) – 33 of 53 PEPFAR countries have policies fully aligned with international standards and an additional 17 countries had some national policy related to patient data protection.
More than half of PEPFAR countries (27 of 52 with available data) have fully aligned policies related to user fees (whether national policy stipulates that public primary care and HIV services are available without user fees) and an additional 20 have adopted some policies in this area.
PEPFAR countries are least likely to be aligned on policies related to universal health coverage of HIV treatmentand PrEP (whether national health coverage includes medications for HIV treatment and PrEP) – 11 PEPFAR countries (out of 51 with available data) have fully aligned policies with international standards, with an additional 22 having adopted some policies related to universal health coverage of HIV treatment and PrEP.
Structural
PEPFAR countries have the strongest alignment on policies related to gender-based violence – an indicator that assesses whether or not countries have laws that explicitly address domestic violence with enforceable penalties (42 of 53 countries).
On the other end of the spectrum, no PEPFAR country has adopted policies related to drug use non-criminalization (whether national policy avoids criminalizing personal possession of drugs). Additionally, only three of 53 PEPFAR countries have policies related to sex work non-criminalization (whether national policy avoids criminalizing the buying, selling, and organizing of sex work) that are fully aligned with international standards (Haiti, Honduras, and Panama).
Discussion
While no PEPFAR country has fully aligned its laws and policies with international standards, this analysis shows that they have, on average, greater alignment than other LMICs and this differential is greatest in areas in which PEPFAR focuses most of its direct support, such as treatment and testing policies. As noted above, PEPFAR has actively worked toward changing local policies in countries, principally with regard to the adoption of treatment guidelines, the removal of user fees for HIV services, and the implementation of differentiated service delivery strategies, such as the multi-month dispensing of antiretrovirals – which has become critically important during the COVID-19 pandemic – and increasing domestic budgets for HIV. Further, PEPFAR has played a role in spotlighting the need for countries to address HIV among some of the most vulnerable populations, which have been historically shunned by some countries. At the same time, as this analysis demonstrates, there is still a significant share of recommended policies that have yet to be adopted in PEPFAR countries, particularly in the area of structural barriers, such as policies related to non-discrimination of marginalized groups and decriminalization of activities including sex work and drug use, which may be the most difficult to affect at the country level given that they often require national legal changes and/or reach beyond HIV.
While the data included in this analysis do not measure the extent or quality of implementation, policy adoption can be viewed as a step in the direction of evidence-based practices and indicate a country’s commitment to addressing HIV and creating a foundation that can facilitate and optimize HIV/AIDS efforts. This is especially important in PEPFAR countries, which include those that have been hardest hit by the HIV/AIDS epidemic. Indeed, PEPFAR’s most recent draft guidance to COP and ROP countries for 2022 places an even greater premium on policy change, including requiring country programs to either ensure change in some areas as a condition of receiving funding, or submit a detailed description of existing barriers and proposed plan to be able to meet these requirements.
Looking ahead, there are important questions surrounding PEPFAR’s role, beyond service delivery, in countries, especially as the program awaits the confirmation of a new coordinator, is expected to release a new five-year strategy, and is due for reauthorization in two years, all of which could provide openings for strengthening PEPFAR even further. The findings presented here, while not necessarily attributable to PEPFAR, may serve as a baseline for targeting and assessing future PEPFAR efforts, as the program seeks to further improve HIV outcomes in the countries within which it works and policymakers consider PEPFAR’s next phase.
Appendix
Appendix 1: Policy Indicators and Sub-Indicators Included in Analysis, by Category
Category
Name
Indicator or Sub-Indicator
Clinical care and treatment
Treatment initiation
Indicator
Same-day treatment start
Indicator
Treatment regimen
Indicator
Differentiated service delivery
Indicator
Differentiated service delivery – Community ART distribution
Sub-indicator
Differentiated service delivery – Clinical visit frequency
Sub-indicator
Differentiated service delivery – Multi-month dispensing
Sub-indicator
Viral load testing
Indicator
Pediatric diagnosis and treatment
Indicator
Pediatric diagnosis and treatment – Pediatric diagnosis
Sub-indicator
Pediatric diagnosis and treatment – Pediatric treatment
Sub-indicator
Migrants’ access to health care
Indicator
Migrants’ access to health care – Primary health care
Sub-indicator
Migrants’ access to health care – HIV health care
Sub-indicator
Tuberculosis diagnostics
Indicator
Testing and prevention
Self-testing
Indicator
Partner notification/Index testing
Indicator
Partner notification/Index testing – Index testing
Sub-indicator
Partner notification/Index testing – Confidentiality in index testing
Sub-indicator
Compulsory testing
Indicator
Age restrictions on testing and treatment
Indicator
PrEP
Indicator
PrEP – Policy
Sub-indicator
PrEP – Regulatory approval
Sub-indicator
Harm reduction
Indicator
Harm reduction – Harm reduction strategy
Sub-indicator
Harm reduction – Syringe non-criminalization
Sub-indicator
Comprehensive sexuality education
Indicator
Prisoner prevention
Indicator
Prisoner prevention – Condoms
Sub-indicator
Prisoner prevention – Needle and syringe exchange program
Sub-indicator
Health systems
Task shifting
Indicator
Health financing
Indicator
Health financing – Budget
Sub-indicator
Health financing – Tax revenue
Sub-indicator
Universal health coverage
Indicator
Universal health coverage – ARVs
Sub-indicator
Universal health coverage – PrEP
Sub-indicator
User fees
Indicator
User fees – Primary care
Sub-indicator
User fees – HIV services
Sub-indicator
Access to medicines (TRIPS)
Indicator
Access to medicines (TRIPS) – Incorporation
Sub-indicator
Access to medicines (TRIPS) – Use
Sub-indicator
Unique identifiers with data protections
Indicator
Unique identifiers with data protections – Unique identifiers use
Sub-indicator
Unique identifiers with data protections – Data protections
Sub-indicator
Data sharing
Indicator
Data sharing – Disaggregation
Sub-indicator
Data sharing - Frequency
Sub-indicator
Structural
Same-sex sex non-criminalization
Indicator
Same-sex sex non-criminalization – Laws
Sub-indicator
Same-sex sex non-criminalization – Arrests
Sub-indicator
Sex work non-criminalization
Indicator
Drug use non-criminalization
Indicator
HIV exposure non-criminalization
Indicator
HIV exposure non-criminalization – Laws
Sub-indicator
HIV exposure non-criminalization – Arrests
Sub-indicator
Non-discrimination protections
Indicator
Non-discrimination protections – Sexual orientation
Specific examples of normative, evidence-based guidance and policies developed by international bodies include the WHO’s Consolidated guidelines on HIV prevention, testing, treatment, service delivery and monitoring: recommendations for a public health approach (see: https://www.who.int/publications/i/item/9789240031593) and Key Considerations for Differentiated ART Delivery for Specific Populations jointly produced by the WHO, U.S. Centers for Disease Control and Prevention, PEPFAR, USAID, and the International AIDS Society (see: https://www.who.int/publications/i/item/WHO-HIV-2017.34), among others. All guidelines and policies that the HIV Policy Lab uses as benchmarks with which to assess countries are included in their codebook (see: https://hivpolicylab.org/codebook). ↩︎
PEPFAR is administered through the Office of the U.S. Global AIDS Coordinator and Health Diplomacy within the U.S. Department of State, led by a Senate-confirmed coordinator with the rank of ambassador, and is housed within U.S. diplomatic missions under the oversight of the U.S. ambassador in country. ↩︎
O’Neill Institute for National and Global Health Law at Georgetown University Law Center, Reorganization and the Future of PEPFAR; Implications of State and USAID Reform, 2018. ↩︎
The COP/ROP documents serve as annual strategic plans for U.S. HIV/AIDS efforts in host countries, as well as serve as the basis for the approval of U.S. funding. Each COP focuses on PEPFAR’s efforts in one county in most cases, whereas the ROPs focus on a group of countries. Most, but not all, COP countries receive a greater level of investment than ROP countries. ↩︎
PEPFAR’s 2020 Country Operational Plan Guidance for all PEPFAR Countries includes a list of 55 countries that were required to submit a COP or ROP that year. This list served as the basis for our “PEPFAR countries” group. Two countries on this list (Barbados and Suriname) were excluded from our analysis following communication with staff in the Office of the Global AIDS Coordinator that confirmed that direct bilateral support had been discontinued to those countries in recent years. ↩︎
According to the U.S. government database www.foreignassistance.gov, three countries that were not required to develop a COP or ROP received some HIV funding in FY 2020 – Colombia, Peru, and Venezuela. These countries were not included in the PEPFAR group. ↩︎
U.S. Department of State, “PEPFAR Update – Stakeholder Townhall,” presentation delivered on August 2, 2012. ↩︎
O’Neill Institute for National and Global Health Law at Georgetown University Law Center, HIV Policy Lab, accessed: https://hivpolicylab.org/. ↩︎
Kavanagh M, et al, “Understanding and comparing HIV-related law and policy environments: cross-national data and accountability for the global AIDS response,” BMJ Global Health, 2020, accessed: https://gh.bmj.com/content/5/9/e003695. ↩︎
PEPFAR’s 2020 Country Operational Plan Guidance for all PEPFAR Countries includes a list of 55 countries that were required to submit a COP or ROP that year. This list served as the basis for our “PEPFAR countries” group. Two countries on this list (Barbados and Suriname) were excluded from our analysis following communication with staff in the Office of the Global AIDS Coordinator that confirmed that direct bilateral support had been discontinued to those countries in recent years. ↩︎
According to the U.S. government database www.foreignassistance.gov, three countries that were not required to develop a COP or ROP received some HIV funding in FY 2020 – Colombia, Peru, and Venezuela. These countries were not included in the PEPFAR group. ↩︎
The toll the COVID-19 pandemic has exacted on the global economy has been significant, with the International Monetary Fund (IMF) estimating that median global GDP dropped by 3.9% from 2019 to 2020, making it the worst economic downturn since the Great Depression. While the global economy was estimated to have recovered in 2021, recovery has been uneven and disparities in vaccine access and coverage could threaten improvement in much of the world.
Among other priorities, the White House’s U.S. COVID-19 Global Response and Recovery Framework seeks to bolster the economies of countries that have suffered due to the pandemic. This will be especially important in countries where the U.S. has major investments in other health areas, such as PEPFAR, the U.S. global HIV program. The economic impacts of COVID-19 on the HIV response could be as consequential as the direct health impacts, and as such, may significantly affect U.S. efforts in these countries. To inform such efforts, we examined the current and projected economic impact of COVID-19 in 53 PEPFAR countries.
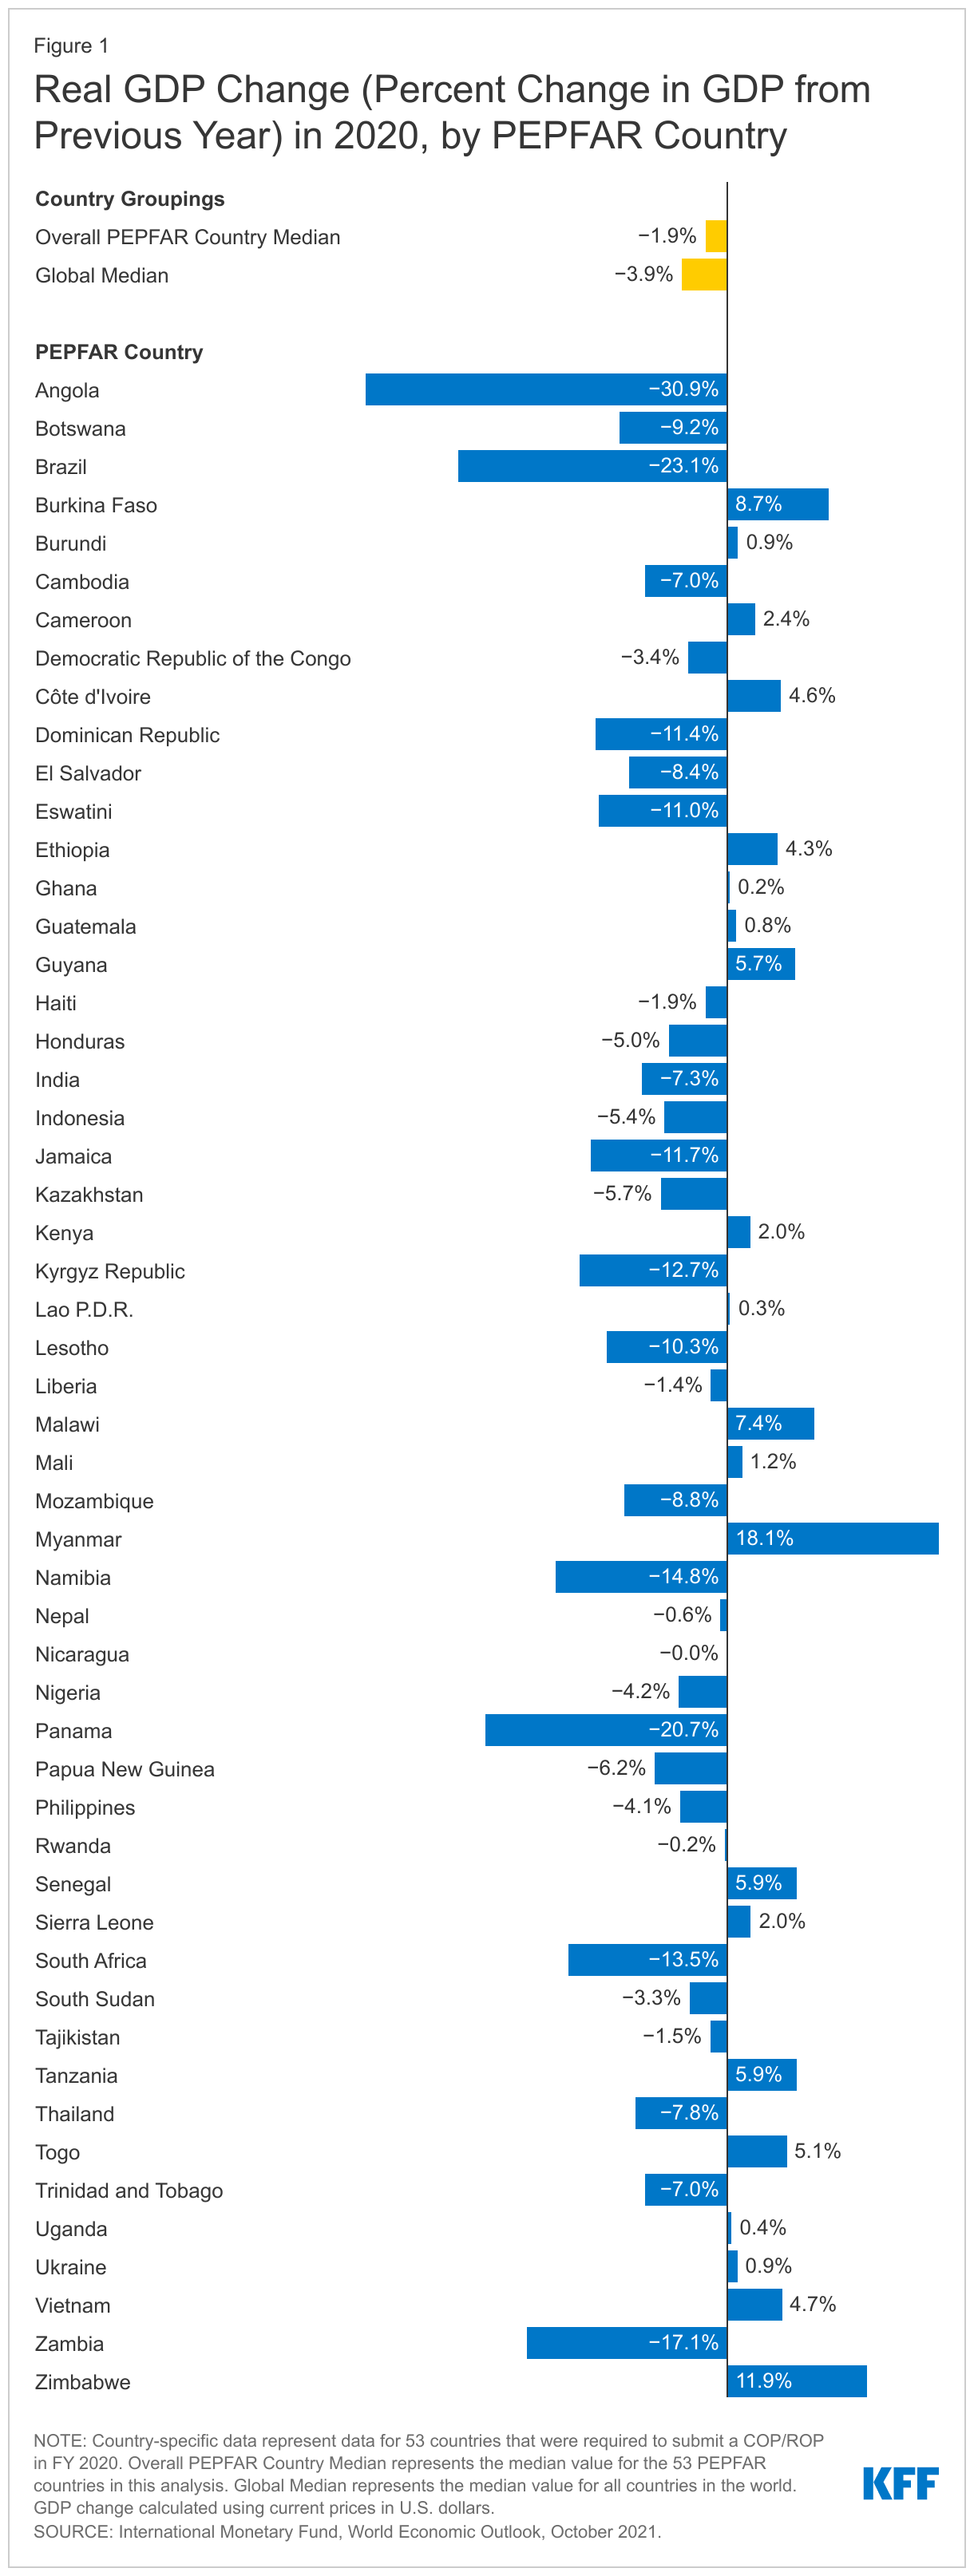
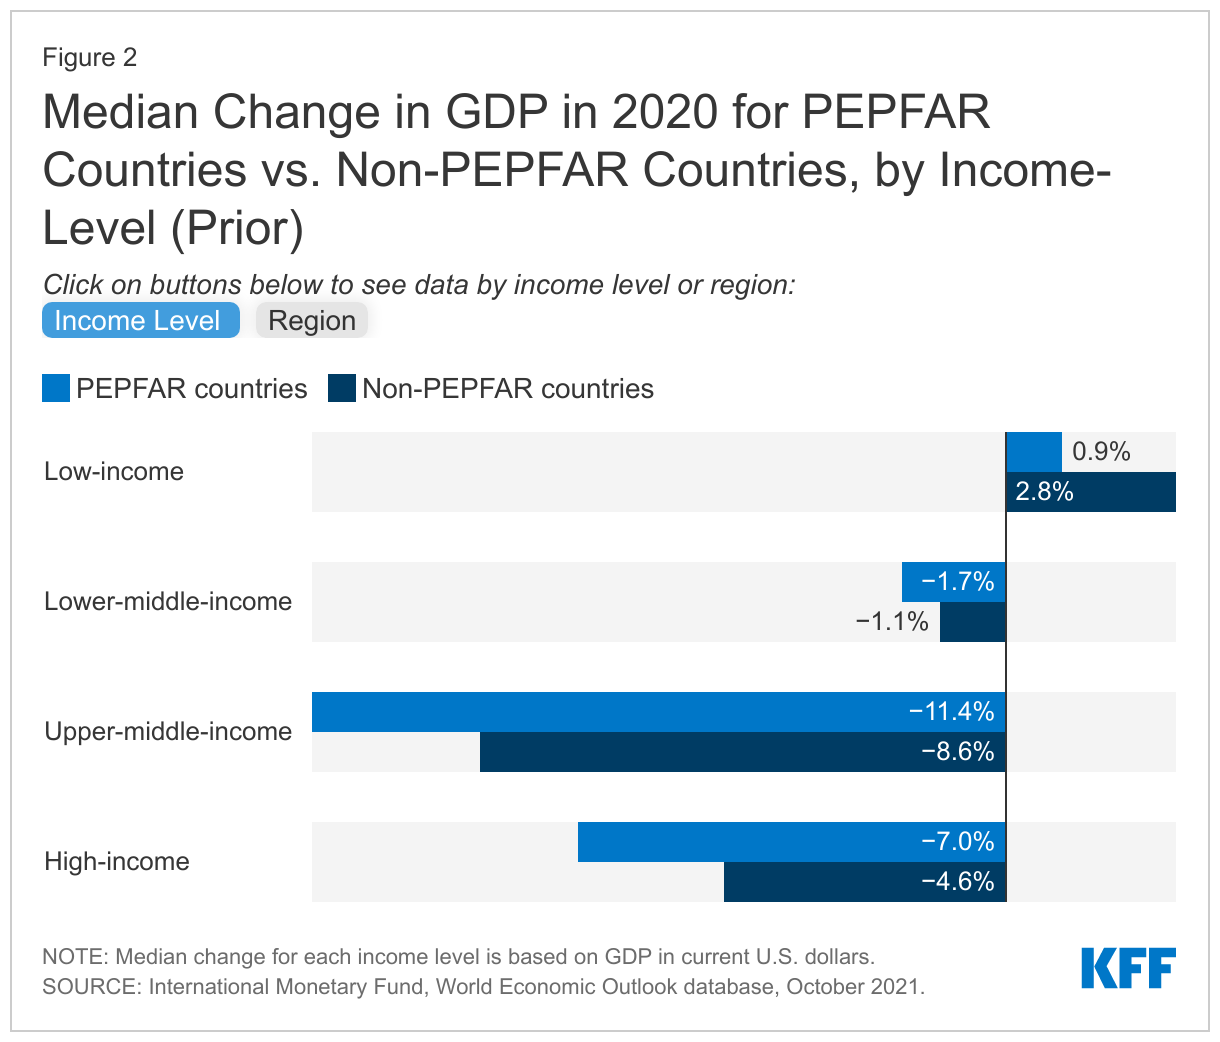
Overall, we find that in the majority of PEPFAR countries, GDP fell in 2020, the year the pandemic emerged, compared to 2019. In 11 countries, the contraction was greater than 10%. While PEPFAR countries experienced less of a median GDP drop than the global economy overall in 2020 (1.9% compared to 3.9%), they generally fared worse than their economic and regional peers.
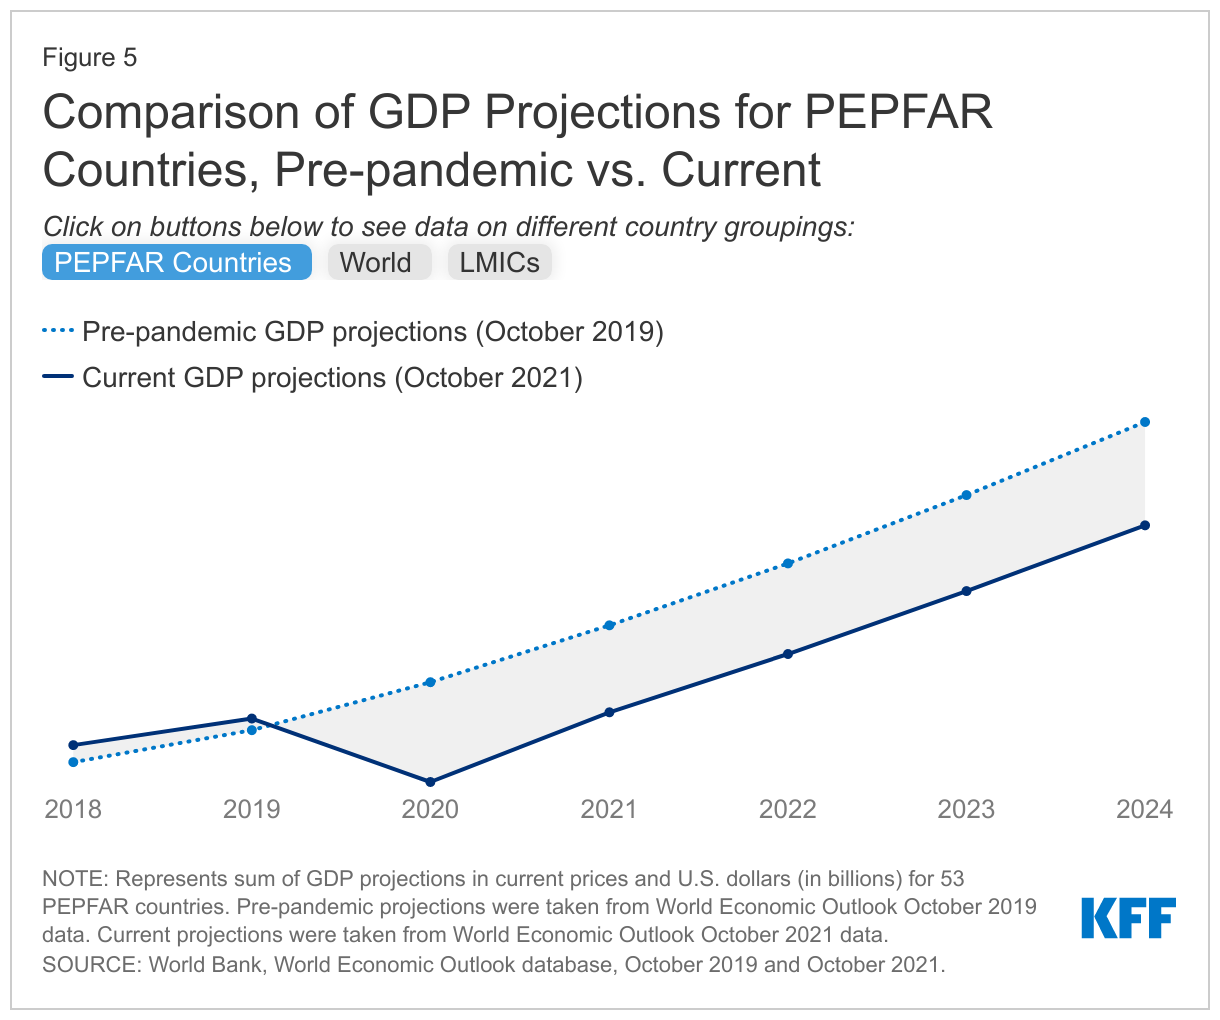
While the global economy was estimated to have recovered in 2021, this was not the case in PEPFAR countries. While almost all PEPFAR countries were estimated to have experienced some GDP growth in 2021, the projected growth, at least through 2024, remains below pre-pandemic projections (10-13% below). By contrast, the current projections of global GDP exceed the pre-pandemic projections. In addition, the challenges facing the global economy are likely to continue, particularly in low and middle-income countries, as the strong rebound in 2021 is expected to decelerate in 2022.
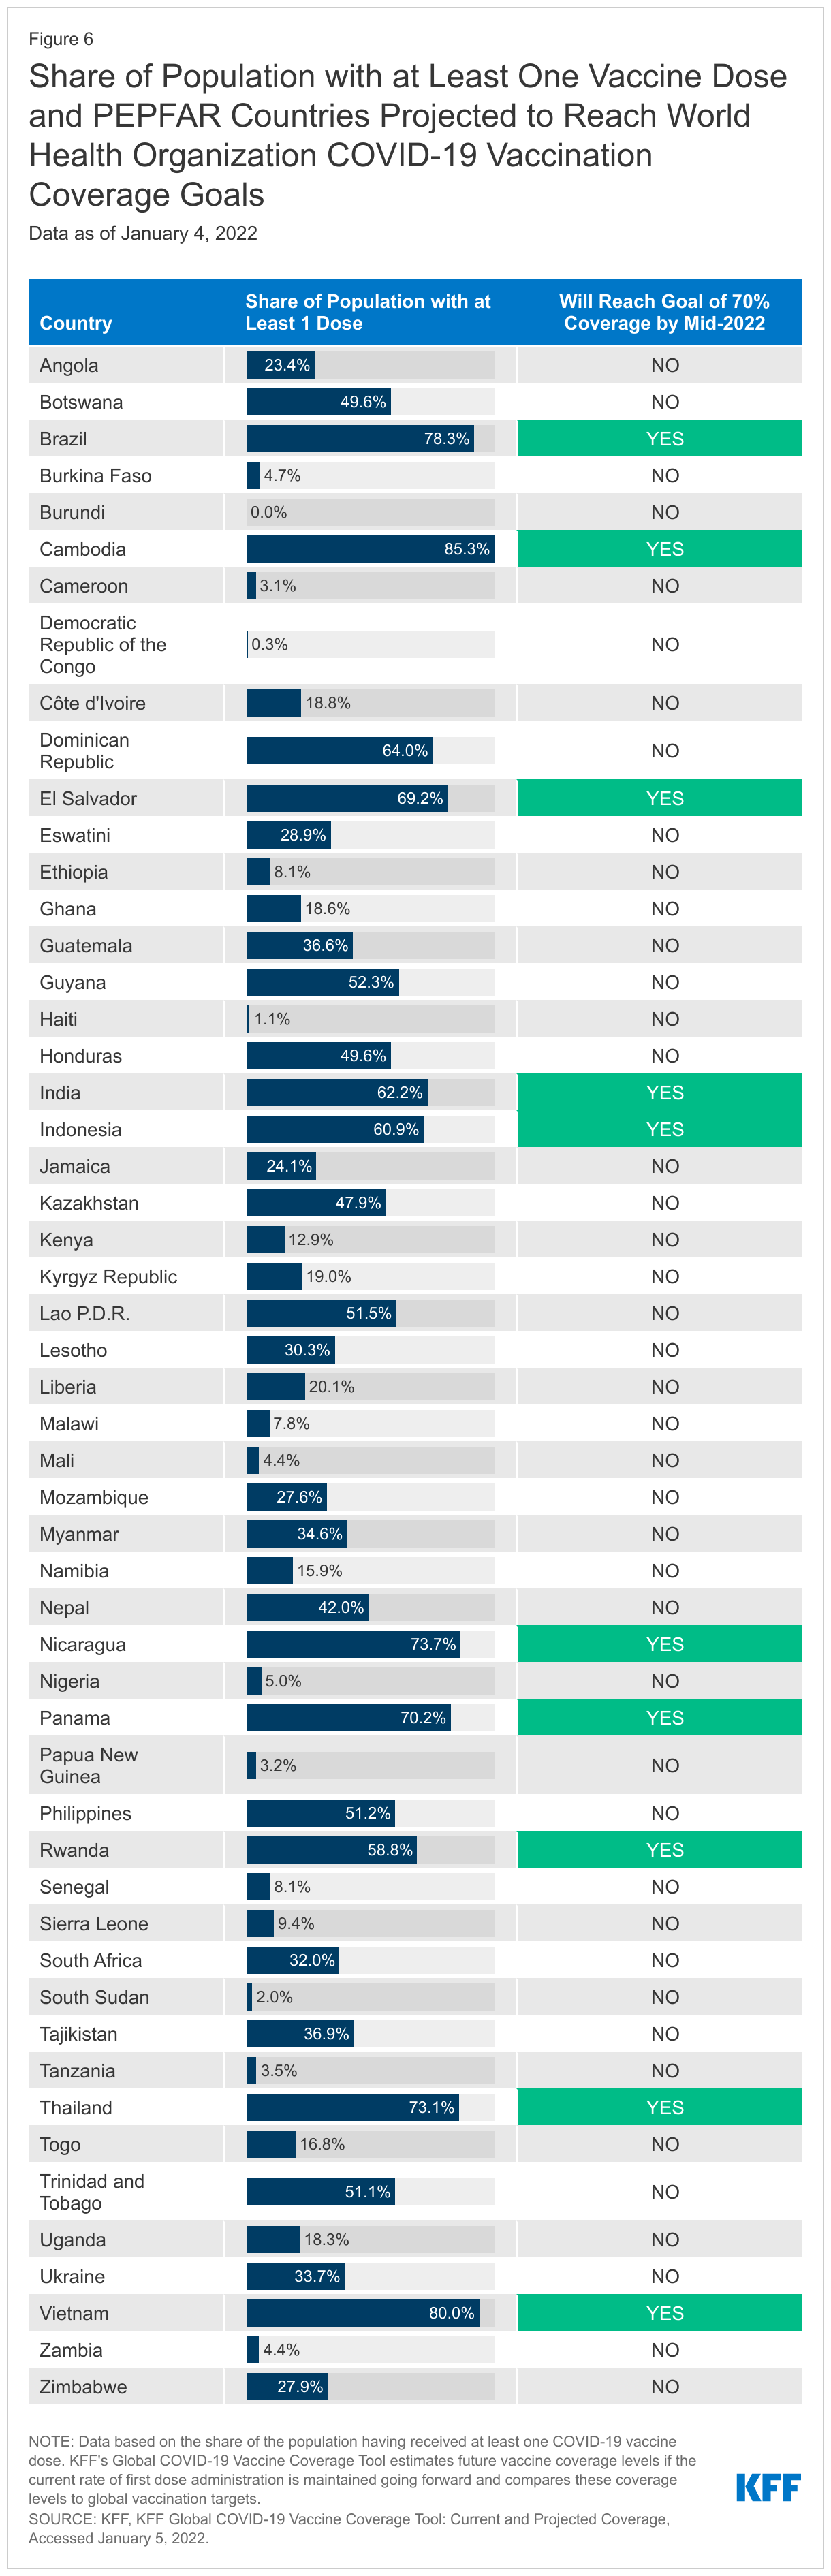
Finally, there is significant uncertainty facing economic recovery in PEPFAR countries, which will be highly dependent on the future course of the COVID-19 pandemic, economic relief efforts, and vaccine roll-out. Currently, in 30 of the 53 PEPFAR countries, less than a third of the population has received at least one vaccine dose and only 10 are on track to meet global COVID-19 vaccine targets this year.
Introduction
The toll the COVID-19 pandemic has exacted on the global economy has been significant, with the International Monetary Fund (IMF) estimating that global median GDP dropped by 3.9% from 2019 to 2020, making it the worst downturn since the Great Depression. Last year, in 2021, as countries started to reopen and vaccines became available, the global economy was estimated to grow, though still below pre-pandemic projections, and recovery has been uneven across countries and regions. In addition, the IMF has warned that vaccine access is the economic recovery “fault line”, as some countries look to resume normal activity and others continue to face new waves of infections and rising deaths. Indeed, vaccine coverage in low-income countries is well below all others and, at current rates, many are unlikely to reach global vaccine targets.
The White House U.S. COVID-19 Global Response and Recovery Framework includes an objective to “bolster economies and other critical systems under stress due to COVID-19 to prevent backsliding and enable recovery.” This will be especially important in countries where the U.S. has major investments in other health areas, such as PEPFAR, the U.S. global HIV/AIDS program. Because HIV is also an infectious disease, but one without a vaccine or cure, the economic impacts of COVID-19 on the HIV response could be as consequential as and exacerbate the direct health impacts.
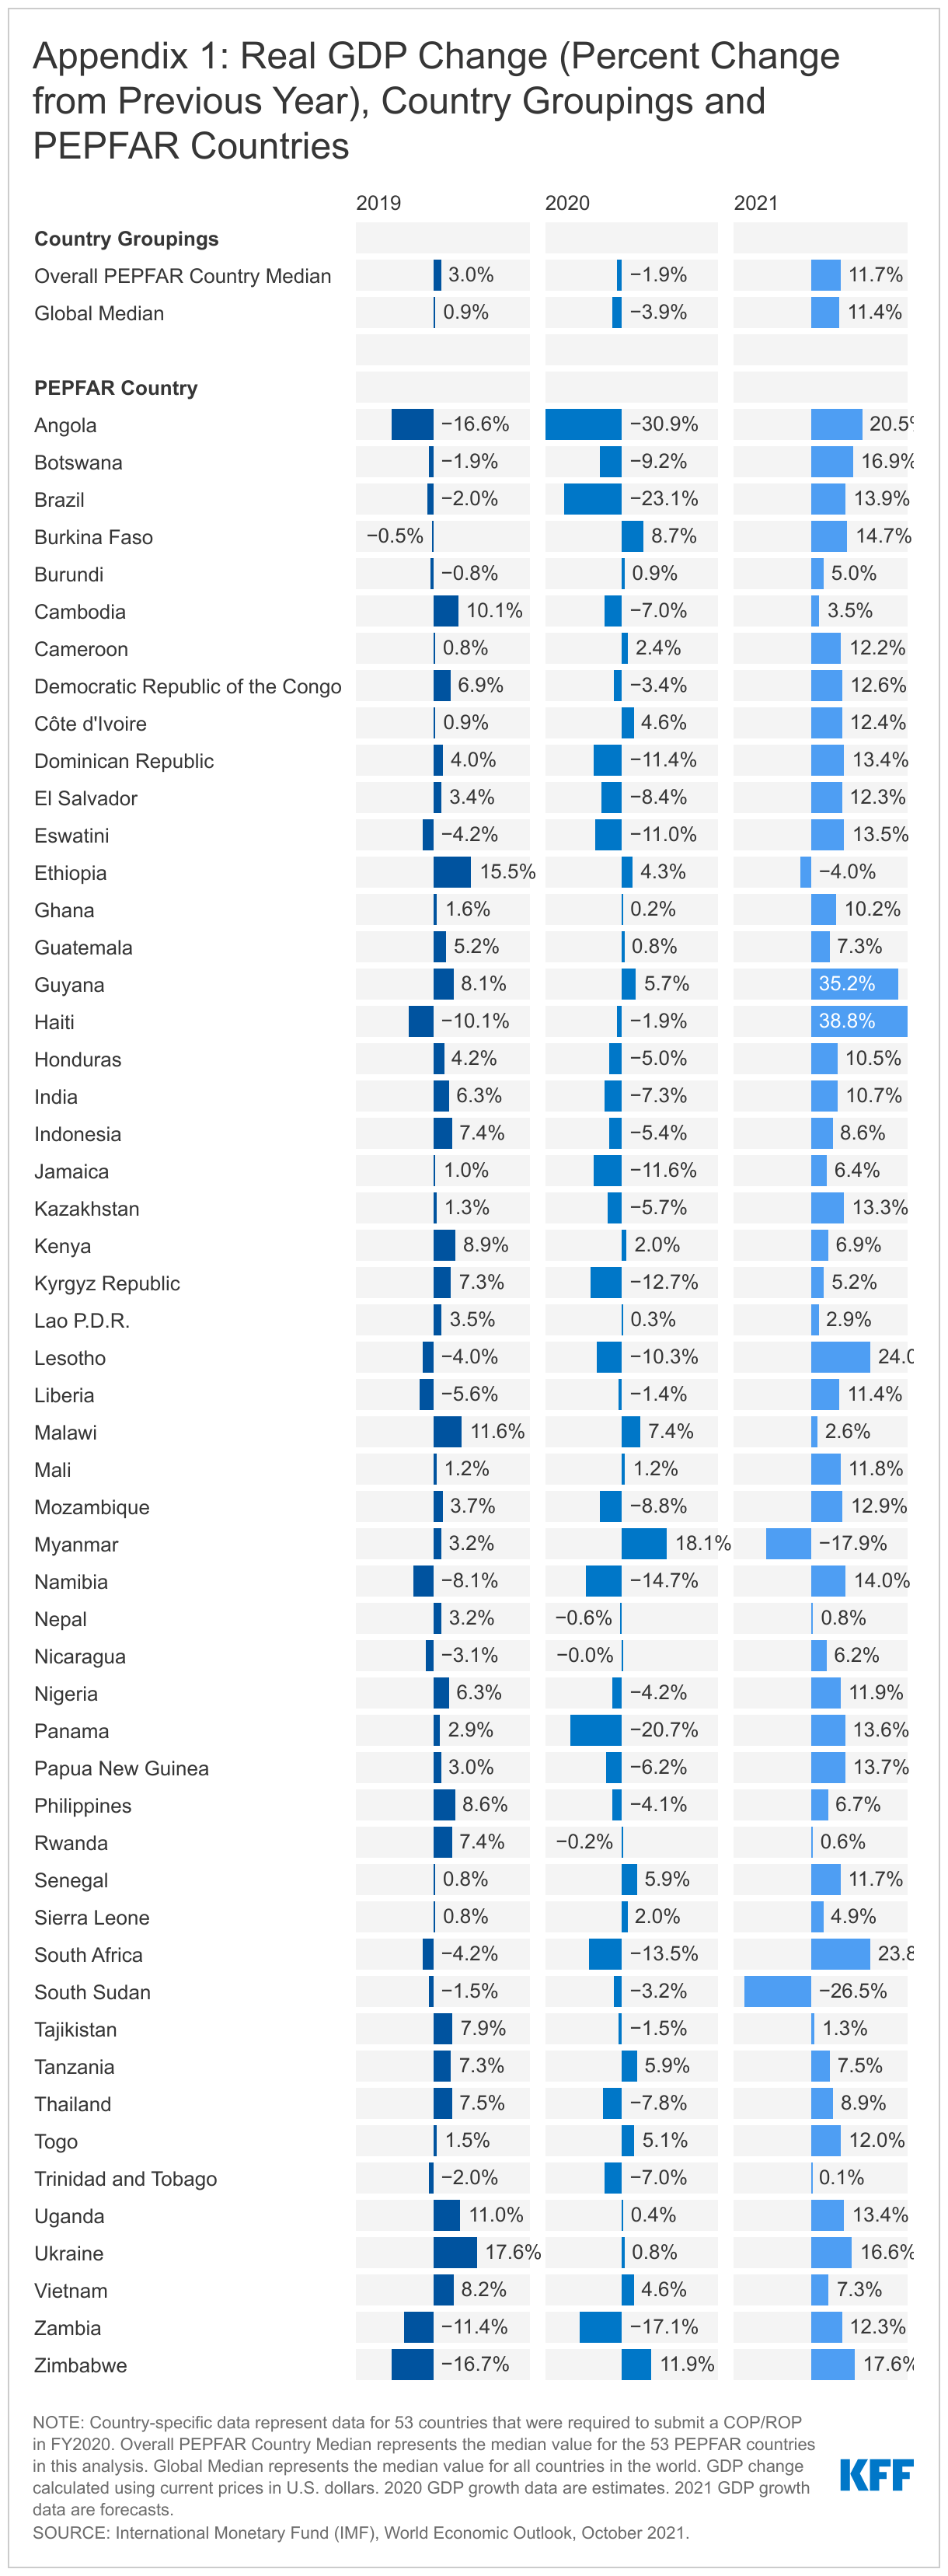
This brief examines the current and projected economic impact of COVID-19 in PEPFAR countries. We used data from the International Monetary Fund’s (IMF) World Economic Outlook (WEO),1 on GDP and GDP growth projections2 for 53 countries3 that were required by PEPFAR to submit a Country Operational Plan or Regional Operational Plan (COP/ROP) in FY 2020.4 We also compared the IMF’s WEO pre-pandemic and current data projections to better understand the estimated economic impact. Pre-pandemic projections were taken from the October 2019 WEO database, and current data projections were taken from the October 2021 WEO database. The appendix contains WEO 2019-2021 GDP growth data, as of October 2021 for all 53 PEPFAR countries as well as the world median aggregate.
Key Findings
Economic Impact of COVID-19 in 2020
Almost all PEPFAR countries experienced GDP contractions in 2020 compared to 2019, and many fared worse than their economic and regional peers. Still, as a group, PEPFAR countries experienced less of a contraction than the global economy in 2020.
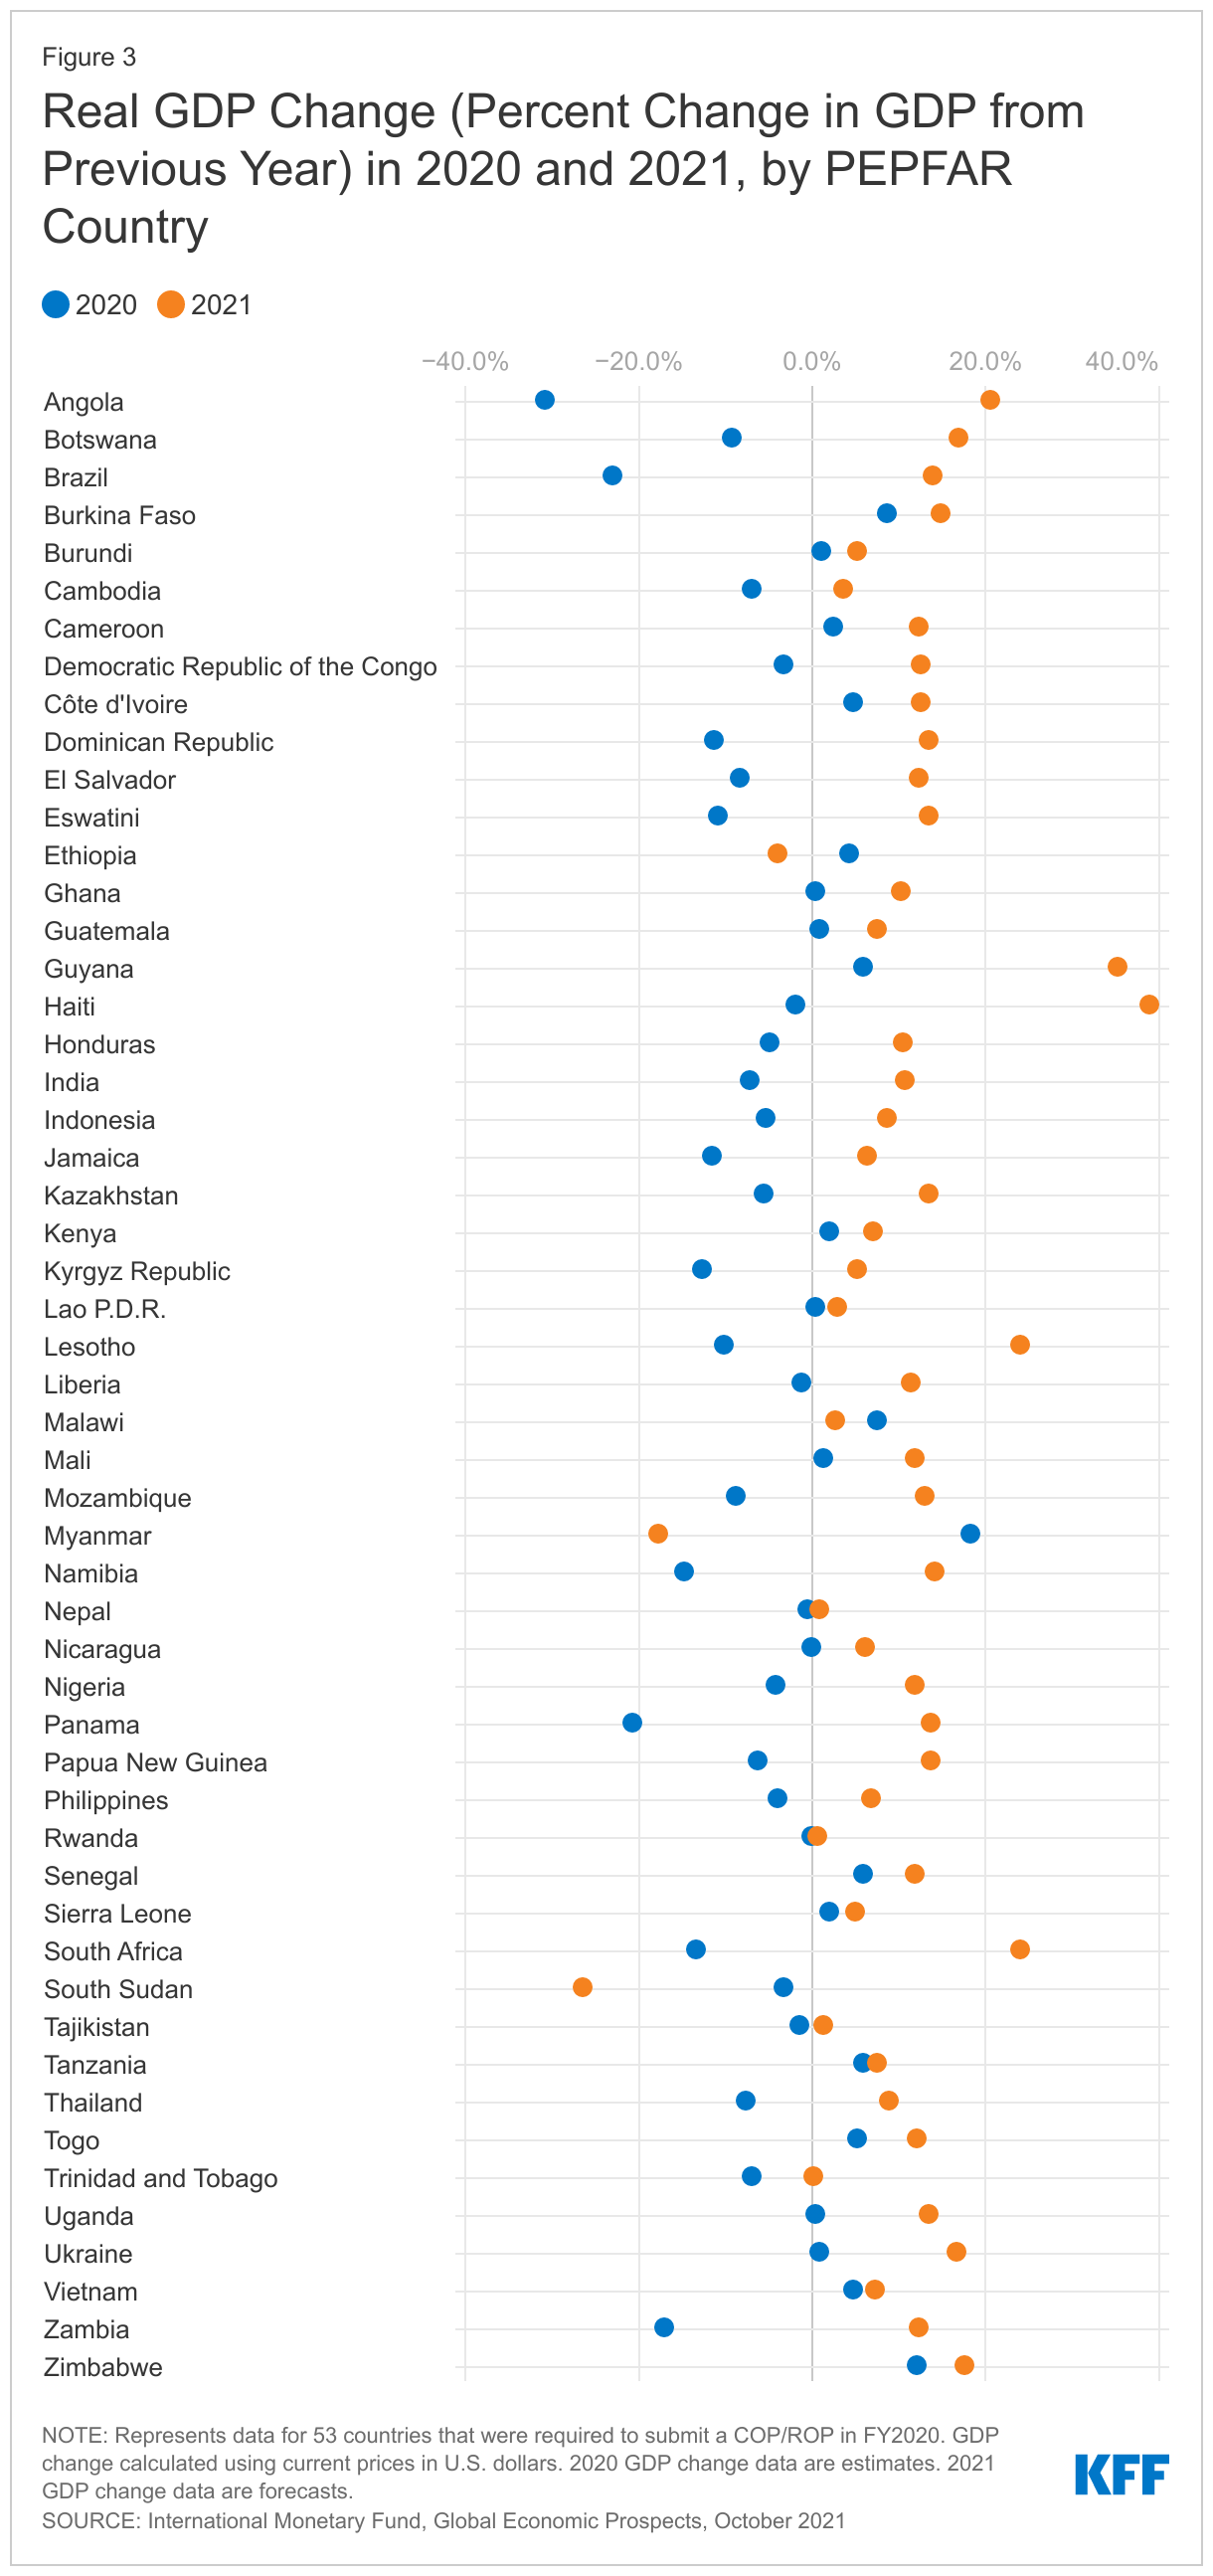
32 of the 53 PEPFAR countries (60%) were estimated to have experienced contractions in GDP in 2020. In 11 countries, the contraction was greater than 10%. Of the top five countries with the largest estimated contractions, three were in Sub-Saharan Africa (Angola, Zambia, and Namibia); the other 2 (Brazil and Panama) were in the Western Hemisphere. The contractions ranged from -0.04% (Nicaragua) to -30.9% (Angola) (see Figure 1).
21 PEPFAR countries experienced positive GDP growth in 2020 (see Figure 1), although in 11 of these countries, growth was lower than in 2019 (see Appendix 1).
Compared to the global economy, PEPFAR countries as a group experienced less of a contraction in 2020 (1.9% median drop in PEPFAR countries compared to a 3.9% median drop globally) (see Figure 1), though compared to their economic and regional peers, PEPFAR countries generally lagged behind non-PEPFAR countries (see Figure 2).
Economic Impact in 2021 and Beyond
While almost all PEPFAR countries were estimated to see GDP grow in 2021, growth remains below pre-pandemic projections, in contrast to the global economy overall which is estimated to have fully recovered. In addition, there is future uncertainty.
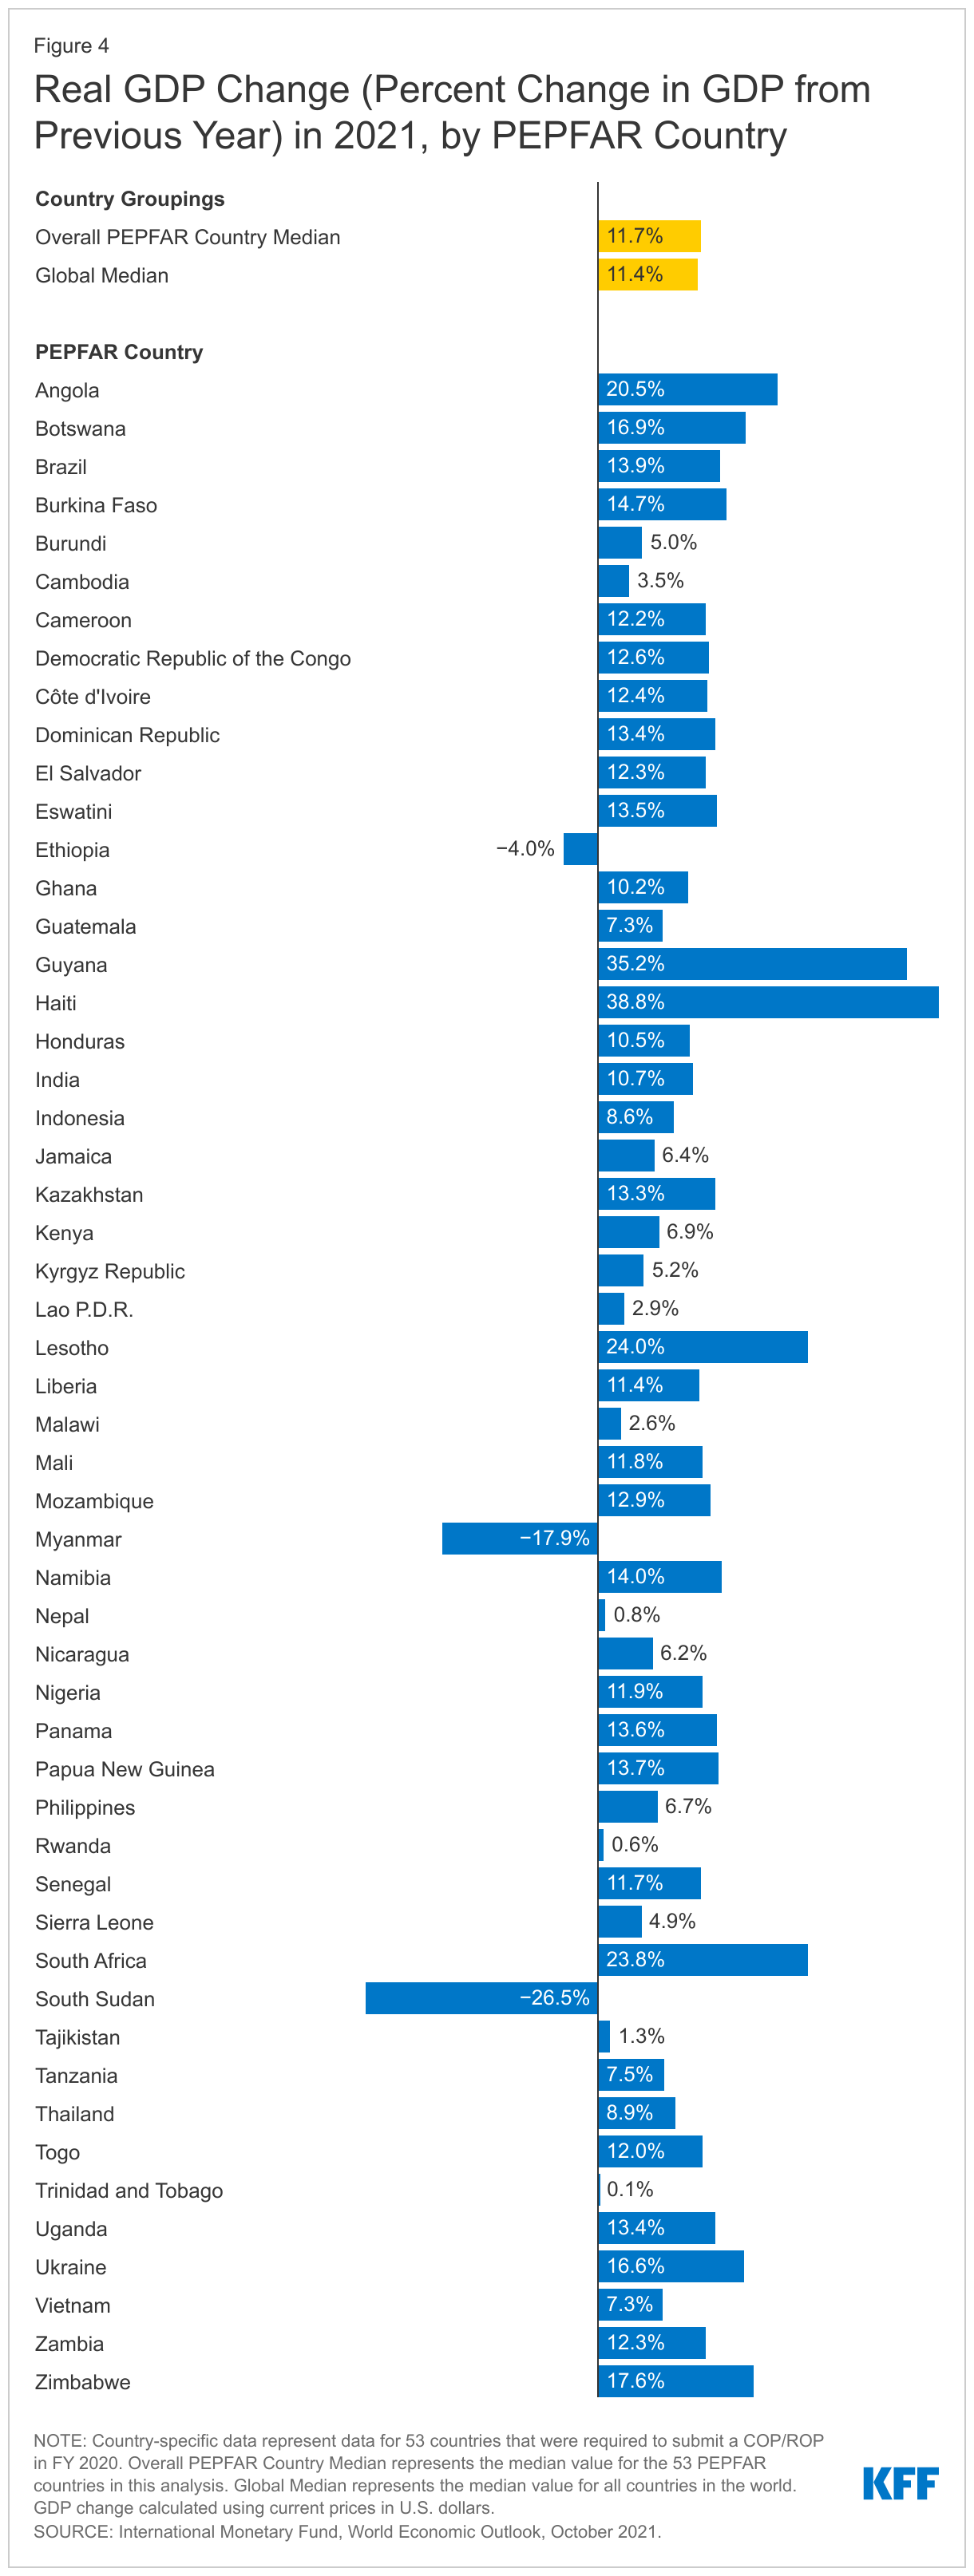
Almost all PEPFAR countries (49 countries or 92%) were estimated to have experienced some economic recovery in 2021, with higher GDP growth compared to 2020 (see Figure 3). Of the top five with the largest estimated GDP growth in 2021, two were in the Western Hemisphere (Haiti and Guyana); the other three were in Sub-Saharan Africa (Lesotho, South Africa, and Angola). GDP growth ranged from 0.06% (Rwanda) to 39% (Haiti) (see Figure 4). On the other hand, negative growth, or contractions, occurred for Ethiopia, Myanmar, and South Sudan.
Still, projected GDP of the 53 PEPFAR countries, as a group, is expected to remain below pre-pandemic projections, at least through 2024 (at 10-13% lower than the pre-pandemic outlook) (see Figure 5), as it does for 34 of the 53 countries.
By contrast, global GDP5 is not only estimated to have returned to its pre-pandemic projections in 2021, it is projected to exceed these as of 2022 and beyond. This largely reflects the strong and rebounding economies in high-income countries which have greater access to vaccines and a larger share of their populations vaccinated.6 And even though LMICs7 as a group are still projected to see lower GDP growth than their pre-pandemic projections (2-4% lower through 2024), they are anticipated to outperform PEPFAR countries over this period (see Figure 5). In addition, following the strong rebound in 2021, global economic growth is likely to decelerate putting further pressures on the recovery in low and middle-income countries.8
Future recovery in PEPFAR countries is uncertain and highly dependent on the future course of the COVID-19 pandemic, economic relief efforts, and, ultimately, vaccine roll-out. Currently, in 30 of the 53 PEPFAR countries, less than a third of the population has received at least one vaccine dose and only 10 PEPFAR countries (18%) are on target to reach the WHO goal of 70% vaccine coverage by mid-2022 (see Figure 6).9
Looking Ahead
It is clear that COVID-19 has set back economic progress worldwide and in PEPFAR countries. While PEPFAR countries, most of which are LMICs, did not appear to be as hard hit economically in the first year of the pandemic compared to the global economy, their current economic outlook is worse and recovery is slower compared to pre-pandemic estimates. This reflects several factors, including the challenges faced by many low-income countries, compared to hic-income counterparts, in providing fiscal relief to address the domestic effects of COVID-19 as well as the variation in the severity of pandemic-related disruptions and now, vaccine access. Moreover, this situation is unstable. Several PEPFAR countries are experiencing a significant increase in COVID-19 cases due to the emergence of the Omicron variant, and most are on the other side of the “vaccine fault line”, not expected to obtain significant vaccine access until well into this next year or beyond. The ongoing effects of COVID-19 and the fluidity of the global environment make it difficult to predict what the ultimate impact will be on PEPFAR countries’ economies and their HIV responses in the future. Recent PEPFAR data also show that economic problems are worse in countries with high HIV prevalence.10 This combination of factors may have particular implications for the U.S. role in supporting the HIV response, including the extent to which the U.S. seeks to provide broader economic relief or additional health funding to PEPFAR countries and/or focus additional efforts on their vaccine roll-out, some of which has already been piloted in select PEPFAR countries.11
Appendix
Endnotes
International Monetary Fund (IMF), World Economic Outlook, October 2021. ↩︎
GDP growth represents annual percentage change calculated using current prices in U.S. dollars. ↩︎
While 55 countries are included in the COP FY20 Guidance, activities in two of these countries – Barbados and Suriname—were discontinued over the past several years; as such, these countries are not included in the analysis. ↩︎
PEPFAR, PEPFAR 2020 Country Operational Plan Guidance for all PEPFAR Countries. ↩︎
Global estimate includes data for 196 countries and territories. ↩︎
KFF, KFF Global COVID-19 Vaccine Coverage Tool: Current and Projected Coverage, Accessed December 13, 2021. ↩︎
LMICs estimate includes data for 81 low- and lower-middle-income countries and territories. ↩︎
World Bank, Global Growth to Slow through 2023, Adding to Risk of ‘Hard Landing’ in Developing Economies, January 2022. ↩︎
KFF, KFF Global COVID-19 Vaccine Coverage Tool: Current and Projected Coverage, Accessed December 13, 2021. ↩︎
PEPFAR, PEPFAR 2022 Country Operational Plan Draft Guidance for all PEPFAR-Supported Countries. ↩︎
In this Health AffairsGrantWatch article, experts at KFF and the Peterson Center on Healthcare summarize findings from analyses on the KFF-Peterson Health System Tracker related to COVID-19 pandemic’s impact, including significant disruptions to longstanding trends in health outcomes, spending, and access to care. The article also looks ahead to 2022.
The Affordable Care Act (ACA) requires qualified health plans (QHPs) offered through the Marketplace to ensure a sufficient choice of providers and provide information to enrollees and prospective enrollees on the availability of in-network and out-of-network providers. Health plan networks are a key factor determining whether patients can actually get needed care, as claims for out-of-network services may be denied altogether or covered at a reduced rate.
Insurers can design provider networks to control utilization and reduce costs, and there are signs that “shrinkflation” (the practice of reducing the size of a product while maintaining its sticker price) may be taking place in the marketplace today. Describing recent trends in the marketplace, the Centers for Medicare and Medicaid Services (CMS) notes
“the proliferation of narrower networks … presents a number of potential consumer protection concerns including whether a narrow network has sufficient capacity to serve plan enrollees, or whether providers may be too geographically dispersed to be reasonably accessible.”
Studies find nearly 8 in 10 QHPs are health maintenance organizations (HMO) or exclusive provider organizations (EPO); both types of plans have closed networks, meaning nonemergency care from out-of-network providers generally is not covered. And many QHP provider networks are narrow. One study reviewing 2017 QHP physician networks found 21% of plans included less than one-fourth of available providers, while another 20% included fewer than 40% of available providers. Another study of 2017 QHP hospital networks found 21% of plans included fewer than one-third of available hospitals, and a further 28% of plans covered fewer than 70% of available hospitals. That study also observed that 29% of marketplace participants had only narrow network plans available. By contrast, job-based plans tend to have more robust provider networks; only 6% of employers offering health benefits say their most popular plan network is narrow.
There is no national standard for network adequacy,1 and standards that are applied vary significantly across states and types of coverage. Evaluation of health plan networks relies on plan provider directory data, which often have been found to be inaccurate or out of date. There is no national standard for the accuracy of information in health plan provider network directories; a new federal law establishing national standards for private health plans has yet to be implemented. Finally, there also is no standard measure of network size or breadth, nor any way for consumers or regulators to easily discern differences in network size.
To date federal regulation and oversight of QHP provider networks has been limited. For the 2023 plan year, CMS has proposed new network adequacy standards through regulations and guidance. The agency has also proposed a pilot network transparency indicator. This brief reviews background on federal network adequacy regulation, the availability of information about QHP networks, and options for strengthening oversight and enforcement.
Network Adequacy Regulation Overview
The federal government certifies QHPs offered in 30 federal marketplace states. Initially federal marketplace issuers were required to submit provider networks for CMS review and certain federal standards applied. Beginning with the 2018 plan year, the Trump Administration ended direct federal oversight of the adequacy of QHP networks, deferring to state oversight, accreditation by private organizations, or the issuer’s attestation. A federal court subsequently ruled this change was arbitrary and capricious, and as a result, federal oversight is scheduled to resume for the 2023 plan year. The regulation of health plan network adequacy can involve the use of various quantitative standards, as well as other oversight activities. Examples of quantitative standards include:
Time/distance standards – This type of standard is used to determine whether participating providers are geographically accessible to plan enrollees. For marketplace plans beginning in 2023, CMS has proposed time/distance standards for various types of providers and facilities. (Table 1) At least 90 percent of enrollees must live within the maximum distance to at least one provider of each type. For QHPs with tiered networks, only providers on the lowest cost-sharing tier would be counted.
Time/distance standards measure geographic proximity but not the breadth of a network. For example, in Cook County, Illinois – which measures approximately 60 miles north to south and 40 miles east to west, and where approximately 113,500 marketplace enrollees reside – a QHP network conceivably could satisfy this metric if it included just a handful of each of the provider and facility types shown in Table 1.
Table 1: Proposed Federal Marketplace Time/Distance Standards for Selected Specialties, 2023
Maximum Time and Distance Standards (minutes/miles) Per County Type
As late as 2017, CMS applied time/distance standards in the federal marketplace. Reviews took place during the annual certification process. During the 2016 certification process, CMS reports more than 90% of issuers passed for each of these metrics. Issuers failing to meet numeric standards could submit a “justification” explaining why its network provided reasonable access given the local availability of providers, or why offering the plan would nonetheless be in the interest of marketplace consumers. CMS did not publish data on QHPs approved pursuant to justification or on the metrics plans failed to meet.
For Medicare Advantage (MA) plans, CMS applies time/distance standards similar to those proposed for the federal marketplace, though standards were reduced in 2020, for example, requiring that only 85% of enrollees in non-metro areas live within time/distance standards, and further reducing the standard in all counties for MA plans that include telehealth providers.
Network adequacy standards for Medicaid managed care plans2differ by state. In 2016, CMS required states to establish time and distance standards for specific types of providers, but the Trump Administration ended this requirement effective in December of 2020, instead allowing states to establish any type of quantitative network adequacy standard. CMS is currently developing a “comprehensive access strategy” across Medicaid fee-for-service and managed care delivery systems, with a notice of proposed rule-making planned for October 2022.
Minimum number of providers – Another standard establishes minimum provider-to-enrollee ratios. Here again, standards vary, where they exist. For example, in MA plan networks serving large metro areas, plans must contract with at least 1.67 primary care physicians per 1,000 beneficiaries. Under MA rules, contracted providers must also be within the maximum time and distance of at least one beneficiary to count toward the minimum number. CMS does not require minimum ratios for Medicaid managed care plans, though this is one of the quantitative standards that states can adopt to comply with federal Medicaid managed care rules. Where they have been adopted, these standards also vary (e.g. the minimum ratio of primary care providers to enrollees in Michigan, California, and Tennessee is 1:500, 1:2,000, and 1:2,500).
To date CMS has not applied a minimum provider ratio standard for the federal marketplace, nor has it proposed one for 2023. A review of state network adequacy regulation found that 10 states (including 5 that use the federal marketplace today) established minimum provider-to-enrollee ratios; so such a standard could apply to some federal marketplace QHPs via state regulation.
Appointment wait-times – Another type of standard sets maximum appointment wait-times for certain types of services. CMS has proposed this standard for 3 types of outpatient appointments shown in Table 2. Issuers would attest that 90% of contracted providers meet the wait-time standard; CMS would conduct compliance reviews in response to complaints and random audits. CMS has not proposed to create a complaints hotline for federal marketplace enrollees.
Table 2: Proposed Appointment Wait Time Standard for Federal Marketplace Plans, 2023
Maximum appointment wait-times are another type of quantitative standard that state Medicaid programs can adopt to comply with federal requirements. Many states have done so, though these also vary based on times and services. For example, state maximum appointment wait-time standard for routine primary care services can range from 10 to 45 days, routine specialty care from 10 to 60 days, and urgent appointments from 1 to 4 days. Medicare Advantage plans are not currently required to meet appointment wait-time standards.
Essential community providers – In addition to other network standards, QHPs are required to contract with a minimum number of available essential community providers (ECP) in their service area. These include community health clinics, Ryan White providers, and other specified providers that serve predominately low-income and medically underserved individuals. In 2017 federal marketplace plans were required to contract with at least 30 percent of available ECPs; the Trump Administration reduced this threshold to 20% of available ECPs beginning in 2018. For 2023, CMS has proposed to increase the threshold to 35% of available ECPs.
Other standards – CMS proposes to require QHPs to report data in 2023 on whether network providers offer telehealth services and seeks comment on whether and how telehealth availability might be incorporated into network adequacy standards. The QHP rule proposes no new standards related to cultural and linguistic competency of network providers. Under Medicaid managed care, state standards must address the capacity of providers to communicate with patients with limited English proficiency in their preferred language and to accommodate patients with disabilities. Federal rules also require Medicaid managed care plan directories to indicate providers’ cultural and linguistic capabilities and the availability of skilled medical interpreters.
Finally as a condition of certification in the Exchange, QHP issuers must conduct an annual survey of enrollee experiences and report data to CMS. The survey includes questions about timely access to care, patient/provider communication capacity, and patient ratings of their doctors and of the care provided. Results inform a “star-rating” system for QHPs, and aggregated results are posted publicly.
Accuracy of Provider Network Directories
Regulators evaluate plans against quantitative network adequacy standards using network directory data, which often contain errors. Plans offered on HealthCare.gov are required to include directory links showing providers’ location, contact information, specialty, and whether they are accepting new patients. Issuers are required to update directories at least monthly. As part of its annual compliance review, CMS selects a small sample of issuers and reviews the machine-readable provider directory to verify accuracy. The most recent report found inaccuracies in all directories examined in 2020, with similar compliance problems observed in prior years.
Oversight of appointment wait-time standards also rely on directory data. In a secret shopper study of California QHPs in 2015, 73% of calls to providers listed in network directories were unable to secure appointments. Failures generally related to inaccurate phone numbers or addresses for listed providers, inaccurate specialty listings, or listed providers who were not actually in the network. Similarly, a 2014 review of Medicaid managed care plans conducted by the HHS Office of Inspector General found half of listed providers called could not offer appointments, most often because they were not practicing at the location listed in the directory or participating in the network at all. A 2018 review of the accuracy of Medicare Advantage plan directories found nearly half (48.7%) contain inaccuracies.
Starting in 2022, the No Surprises Act requires all private health plans, including QHPs, to maintain accurate provider directories and requires providers to regularly update plans about any changes in their information. Plans must verify and update directories at least every 90 days and, on an ongoing basis, post any changes within 2 business days. Plans are also required to apply in-network cost sharing for covered services provided by facilities or providers mistakenly listed as in-network. However, enforcement will be delayed because implementing regulations have not yet been published; CMS expects plans to make good faith efforts to comply with new requirements beginning in 2022.
Network Transparency
Even while meeting minimum standards, insurers can and do design provider networks of substantially different sizes. This year the average marketplace participant in HealthCare.gov states is offered 107 different plan options. The only consumer tool for evaluating networks is to look up names of individual providers in each plan’s directory. There is no easy way to compare the size of networks overall.
In 2017, CMS piloted a “network transparency” measure in 3 states (Maine,3 Tennessee, and Texas) to indicate the relative breadth of a plan’s provider network compared to other QHPs in the same area. For three categories of providers – hospitals, primary care providers, and pediatricians – CMS compares the number of providers in a QHP network to the total number participating in any of the QHP networks. Comparisons are made on a county-basis. Plan networks for each category are then labeled as “smaller,” “larger,” or “about the same” as other QHPs in the county.
For 2023, CMS has proposed modifications to this measure for QHPs in pilot states. The provider categories measured will be general acute care hospitals, adult primary care, and pediatric primary care. The number participating in any QHP network in a county will be totaled for each category. CMS will then label QHP networks based on threshold percentages. Those containing fewer than 30% of providers participating in any of the QHP networks will be labeled as “Basic.” Those containing 30-69% of available providers will be labeled “Standard,” and those containing 70% or more will be labeled as “Broad.”
This revised indicator still provides information only about the relative breadth of a network compared to other QHPs and is therefore not an absolute measure of network size. For example, assume there are 50 general acute care hospitals in a large urban county and 3 QHP options are offered in that county. Assume further that Plan-A has 10 general acute care hospitals participating in network; Plan-B has 15 hospitals (the 10 in A’s network and 5 others); and Plan-C has 20 hospitals (the 15 in B’s network and 5 others). Under the proposed network transparency indicator, Plan A would be described as basic, Plan B standard, and Plan C broad. Yet arguably all three plan networks are narrow, excluding at least 60% of the available area hospitals.
A Unique State Approach to Network Regulation and Transparency – The New Hampshire Insurance Department (NHID) developed a novel approach to assessing private health plan provider networks that highlights the actual breadth of plan networks, not just their relative breadth, by measuring the share of all available providers that participate in a health plan’s network. Regulators determine the number of all available providers in a county by analyzing claims from the state’s all-payer claims data base (APCD), then count the share of available providers in each plan’s network. Marketplace consumers can compare QHP hospital networks on the NHID site. The state also offers an interactive tool that consumers and group purchasers can use to compare hospital networks in state-regulated health plans. Consumer-facing tools to compare other categories of provider networks have not yet been developed.
New Hampshire also categorizes providers based on their claims for key covered services that appear in the APCD. Regulators have identified core, common, and specialized services for each specialty. For example, to count a doctor as an adult primary care provider, the NHID counts those who have claims in the APCD for preventive and routine care provided to an adult. Regulators then compare this provider list to health plan directory data to determine the number of participating primary care providers in each plan. This approach, relying on APCD claims data, helps to correct for misclassification of specialties in provider directories and for other types of directory mistakes (e.g., continuing to list as participating a doctor who has actually retired or moved away, and so who no longer shows claims in the APCD).
The federal government does not currently have an all-payer claims database like New Hampshire to implement an approach like this. It does have a claims database of providers participating in Medicare, which includes nearly all available hospitals and physicians, although adjustments would be needed for pediatricians and other providers that participate less frequently in Medicare.
One Illustration
To explore the variation in network size and accessibility of information, we conducted a manual search of QHPs provider directories in the Houston, Texas area. Directories for the benchmark silver plan and for the lowest cost silver plan offered by other issuers were examined. Where it was clear that issuers offer multiple network options, these different networks were also included in the search. Participating general acute care hospitals within 25 miles of Houston (zip code 77002) were counted, with results shown in Table 3. The number participating in plans ranged from 9 to 42, with a total of 52 general acute care hospitals participating in at least one of the Houston-area QHP networks. Table 3 also shows the current network transparency indicator displayed on HealthCare.gov today and shows what the proposed revised network transparency indicator would be, based on this search.
Finally, as a proxy measure for the total number of available general acute care hospitals in the Houston area, Table 3 also shows the number participating in the most popular health plan option offered to federal employees (the FEHBP Blue Cross standard plan), which includes 56 general acute care hospitals according to that plan’s online directory.
Marketplace consumers in the Houston area appear to have a choice of at least 11 different hospital provider networks. In six of these networks (applicable to 125 of the 202 QHPs offered), at least 75% of available hospitals are not included. Broader hospital networks are for sale in the Houston area marketplace, though these plans cost more. Table 3 also shows that the added premium for a 45-year-old for a plan with a broader hospital network would cost $85-$157/month, an increment not covered by marketplace premium subsidies.
Table 3: Participating Hospitals in Marketplace Plans vs. FEHBP, Houston, TX, 2022
Issuer/ Network (total number of plans offered)
Number of PAR Hospitals Shown in Directory *
Percent of all QHP PAR hospitals
Percent of all available hospitals
Current Marketplace Network Transparency Indicator
* Participating hospitals were counted using provider directory links for HealthCare.gov plans displayed for zip code 77002 (within 25 miles), viewed on January 12-14, 2022. Counts include only general acute cares hospitals, not rehab or psychiatric hospitals, freestanding emergency rooms, imaging centers, clinics, or other facilities that commonly display as “hospitals” in QHP provider directories.** This column compares the unsubsidized premium for each issuer’s lowest-cost silver plan for a 45-year-old to the unsubsidized premium for a 45-year-old for the benchmark plan (Bright HealthCare Super Silver 1), which is $423.63. Marketplace subsidies are tied to the cost of the benchmark plan. Consumers can also buy plans that cost more, but must pay 100% of the additional cost.*** The lowest cost silver plan offered by Community Health Choice indicates it has a “Limited Provider Network” which costs $535.58/month, or $57.47 more than the benchmark silver plan. However, the provider directory for this plan is the same as that for all other plans offered by this insurer, none of which include “limited network” in the name. The next lowest cost silver plan offered by this insurer costs $111.95 more than the benchmark plan for a 45-year-old. Also of note, the provider directory for this insurer indicates certain participating hospitals in its Silver Plan networks are not included in Bronze plan networks.
The current HealthCare.gov network transparency indicator offers a clue as to differences in network size, though the indicator provides limited information. Hospital networks are either described as “about the same” or “smaller” when compared to each other.4 The proposed revised network transparency indicator, as applied to the results shown in Table 3, would label 6 of the 11 networks as “basic,” 4 as “standard,” and one as “broad.”
While this illustration looked only at general acute care hospitals, network transparency indicators could also report on inclusion of providers of specialized services for seriously and chronically ill patients. For example, a 2016 KFF study of hospital networks in Medicare Advantage plans specifically examined the participation of National Cancer Institute (NCI)-designated cancer centers and found most MA plans in the Houston area did not include the University of Texas MD Anderson Cancer Center. None of the Houston-area QHP directories included this cancer center in network, either, though it does participate in the FEP plan network.
Discussion
Insurers offer a range of network designs in marketplace plans, including some that may be exceedingly narrow. What this means for patient access to care – and for continuity of care for consumers transitioning from other coverage to the marketplace – is not clear, nor is it measured. Proposed new standards for 2023 set minimum standards for QHP provider networks, but these alone will not assure networks meet any minimum standard of breadth. Time-distance standards as proposed require at least 1 participating provider be in proximity to most enrollees, but do not assure a sufficient number will be available. Appointment wait-time standards begin to measure actual access to care but have been proposed only for 3 types of routine care, not specialized or urgent care services.
Other aspects of network adequacy have not been incorporated into proposed standards, though public comment was requested on some issues. It remains to be seen whether QHP network standards will measure provider language and cultural competencies, or accessibility for people with disabilities, or access to specialized care for specified groups such as children, patients with chronic health conditions, or other underserved communities.
Differences in the breadth of health plan networks could be more clearly measured and described. Because the marketplace primarily offers transitional coverage, it could help consumers to show which QHPs, if any, offer comparable networks to the plans they’re leaving, whether job-based plans left by workers during the “Great Resignation” or Medicaid managed care plans left by beneficiaries disenrolled as the public health emergency unwinds.
Better transparency measures can also inform oversight, helping regulators identify differences in provider networks and consider how to deploy other tools to understand how differences affect access to care. For example, data from QHP consumer experience surveys could highlight access concerns meriting further investigation. ACA transparency data could also be enhanced and used in oversight to monitor differences in out-of-network claims for specific services or by specified groups of patients. A complaints hotline for QHP shoppers and enrollees could alert regulators to potential problems, as could mid-year reviews.
Network adequacy is a key factor affecting patient access to care, yet it is challenging to operationalize. There is also an inherent trade-off with costs and affordability, as broader networks could increase premiums through higher prices and greater use of services. Close monitoring and improved transparency may provide mechanisms to help evaluate standards and refine them over time.
Federal law requires Medicaid managed care plans to assure that they have capacity to serve expected enrollment in their service area and maintain a sufficient number, mix, and geographic distribution of providers. A Medicaid managed care plan must make covered services accessible to its enrollees to the same extent that such services are accessible to other state residents with Medicaid who are not enrolled with that plan. ↩︎
Maine has since become a state-based marketplace. ↩︎
The results in Table 3 show counts only of participating general acute care hospitals. It is not clear whether CMS also counts other types of facilities in calculating the pilot network transparency indicator. For example, using online directories to search general acute care hospitals, we found results often included other types of facilities including psychiatric hospitals, rehab facilities, addiction treatment facilities, freestanding emergency rooms, imaging centers, and clinics. While we excluded all of these other types of facilities from our count, the CMS pilot might have classified facilities differently. ↩︎