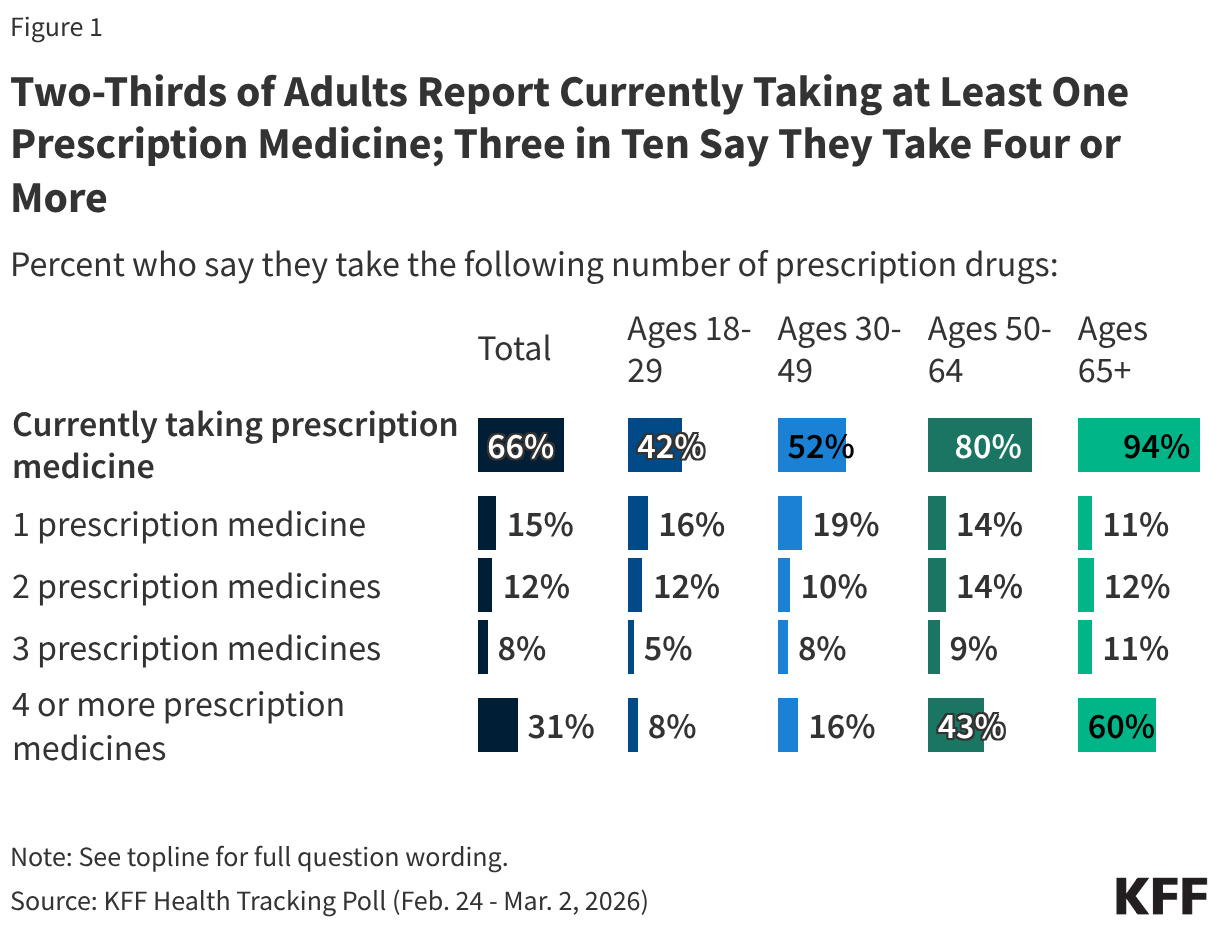
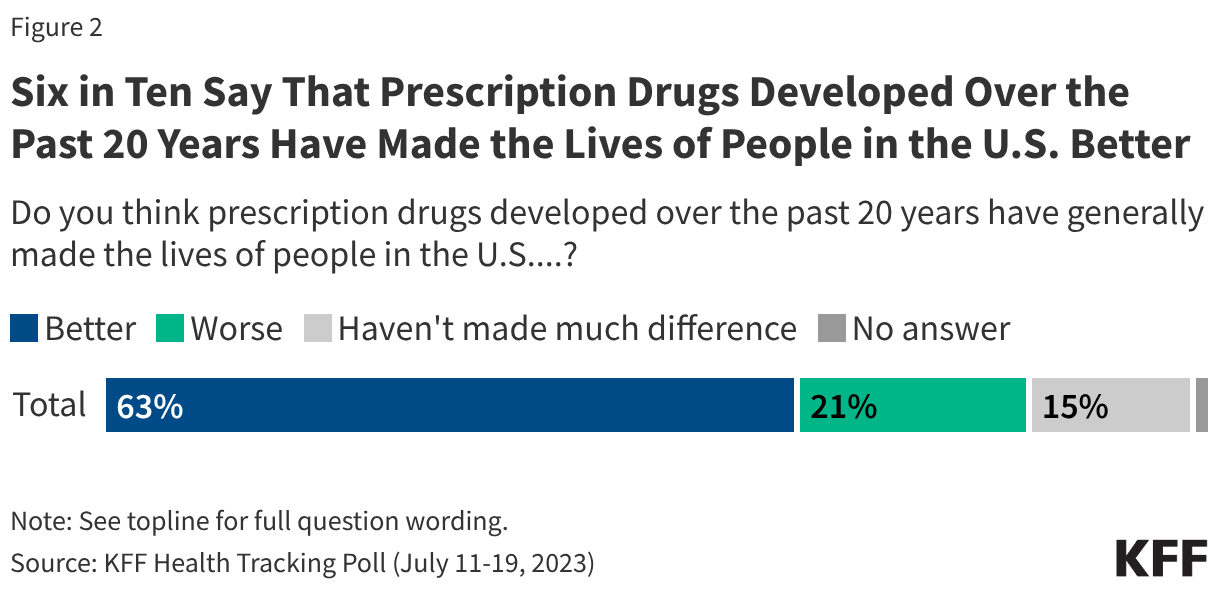
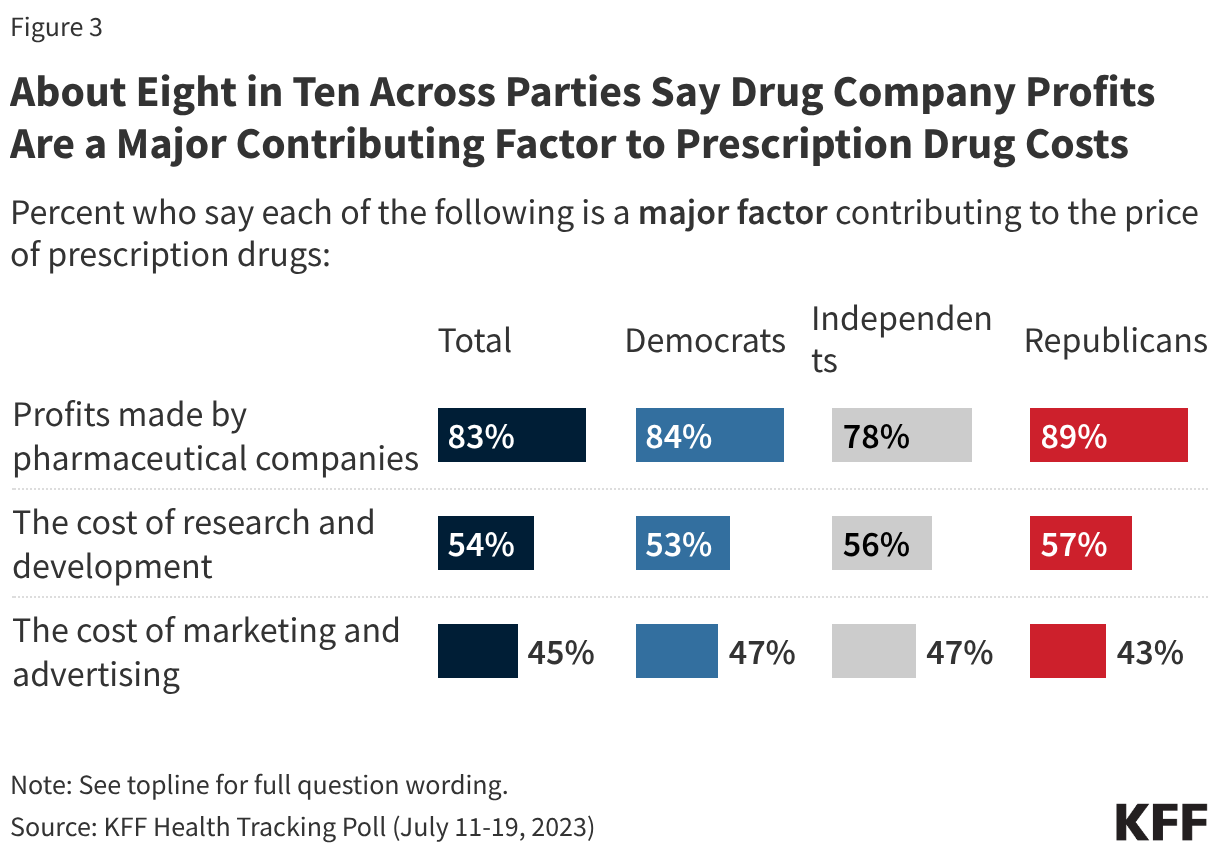
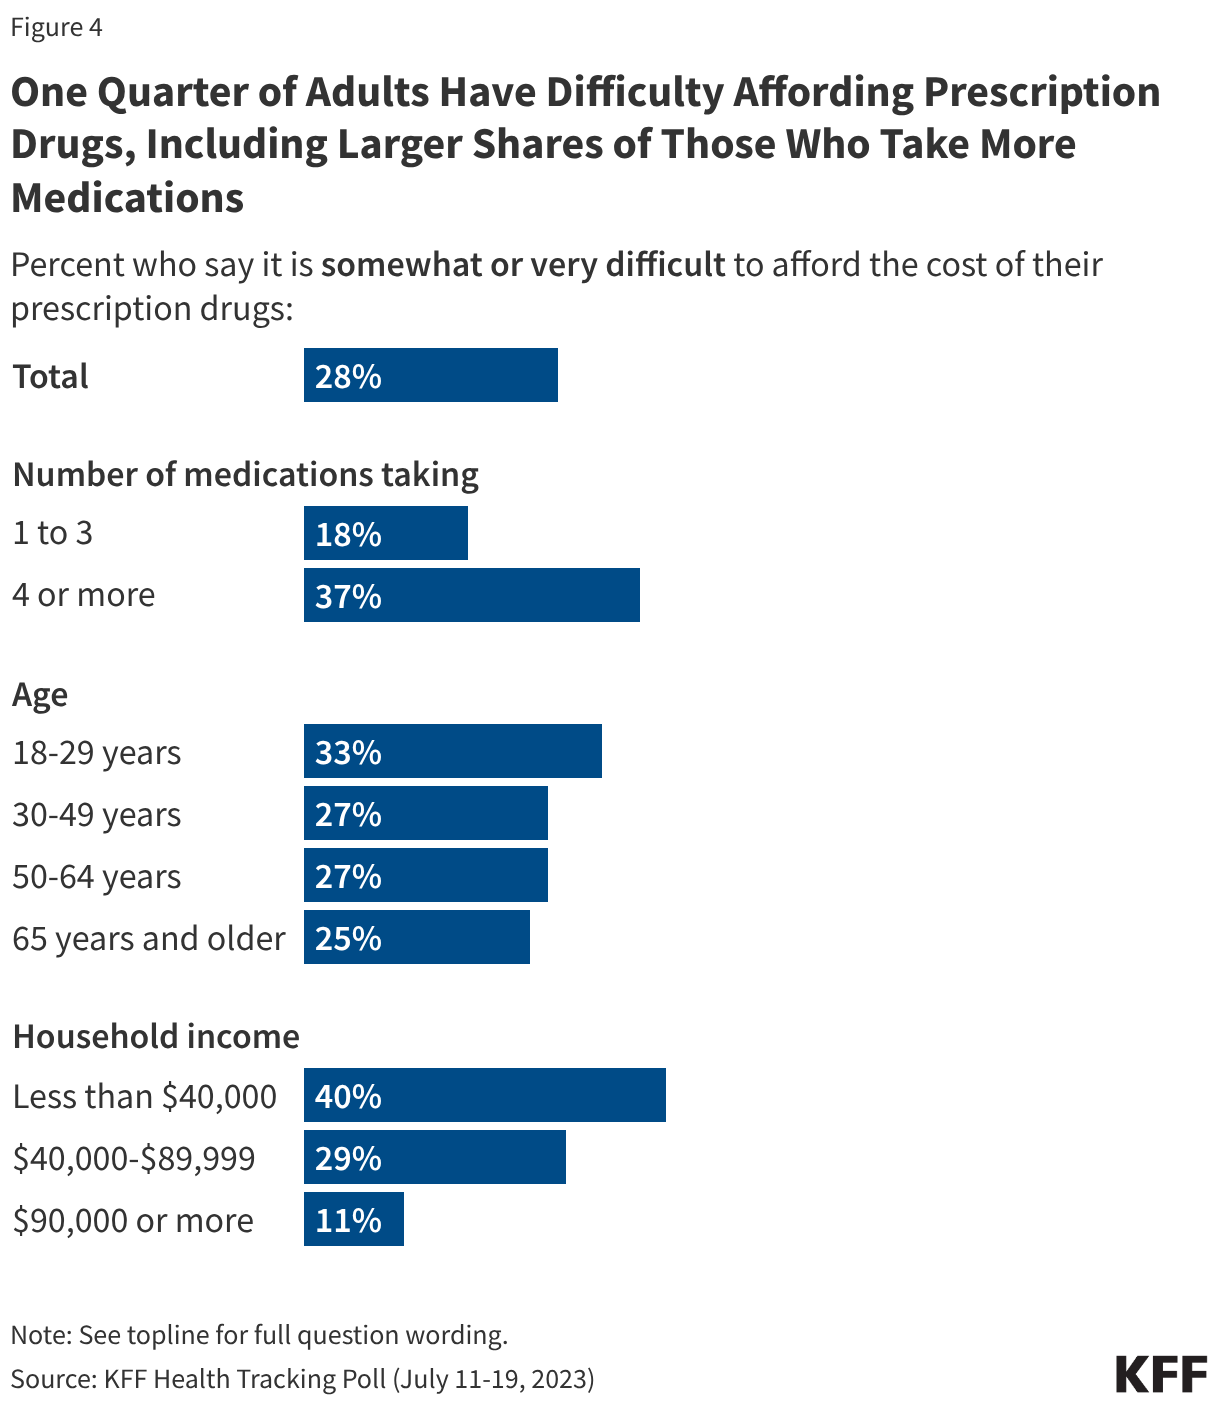
Editorial Note: This brief updates a previous analysis with more recent data, an evaluation of increases in concentration over time, and minor adjustments to the Methods.
National health spending totaled $5.3 trillion in 2024—18% of gross domestic product (GDP)—and is projected to grow faster than GDP through 2033, contributing to higher costs for families, employers, states, and the federal government. As policymakers consider a variety of strategies to make health care more affordable, they have been increasingly attentive to the effects of consolidation in health care markets and the potential implications for cost and quality of care. Hospital consolidation has been a subject of particular focus in part because spending on hospital care is the largest source of spending on health. Hospital care has also contributed more than other categories to the growth in national health spending over time, including from 2022 to 2024, when it accounted for 40% of spending growth. Consolidation may allow providers to operate more efficiently and help struggling providers keep their doors open in underserved areas, but it often reduces competition. A substantial body of evidence has found that consolidation can contribute to higher prices, with unclear effects on quality.
This analysis examines the competitiveness of markets for hospital care, based on RAND Hospital Data—a cleaned and processed version of cost reports from Medicare-certified hospitals—and American Hospital Association (AHA) survey data. The analysis examines competition among independent hospitals and health systems, referring to both as “health systems” throughout for brevity. Competition is measured in three ways: the share of metropolitan statistical areas (MSAs) controlled by a small number of health systems, the level of market concentration in MSAs based on the Herfindahl-Hirschman Index (HHI), and the share of hospitals affiliated with health systems over time. Using hospital data from 2024 (the most recent year available), this analysis focuses on general short-term or general medical and surgical hospitals depending on the dataset and excludes federal hospitals (see Methods for more details).
Key Takeaways
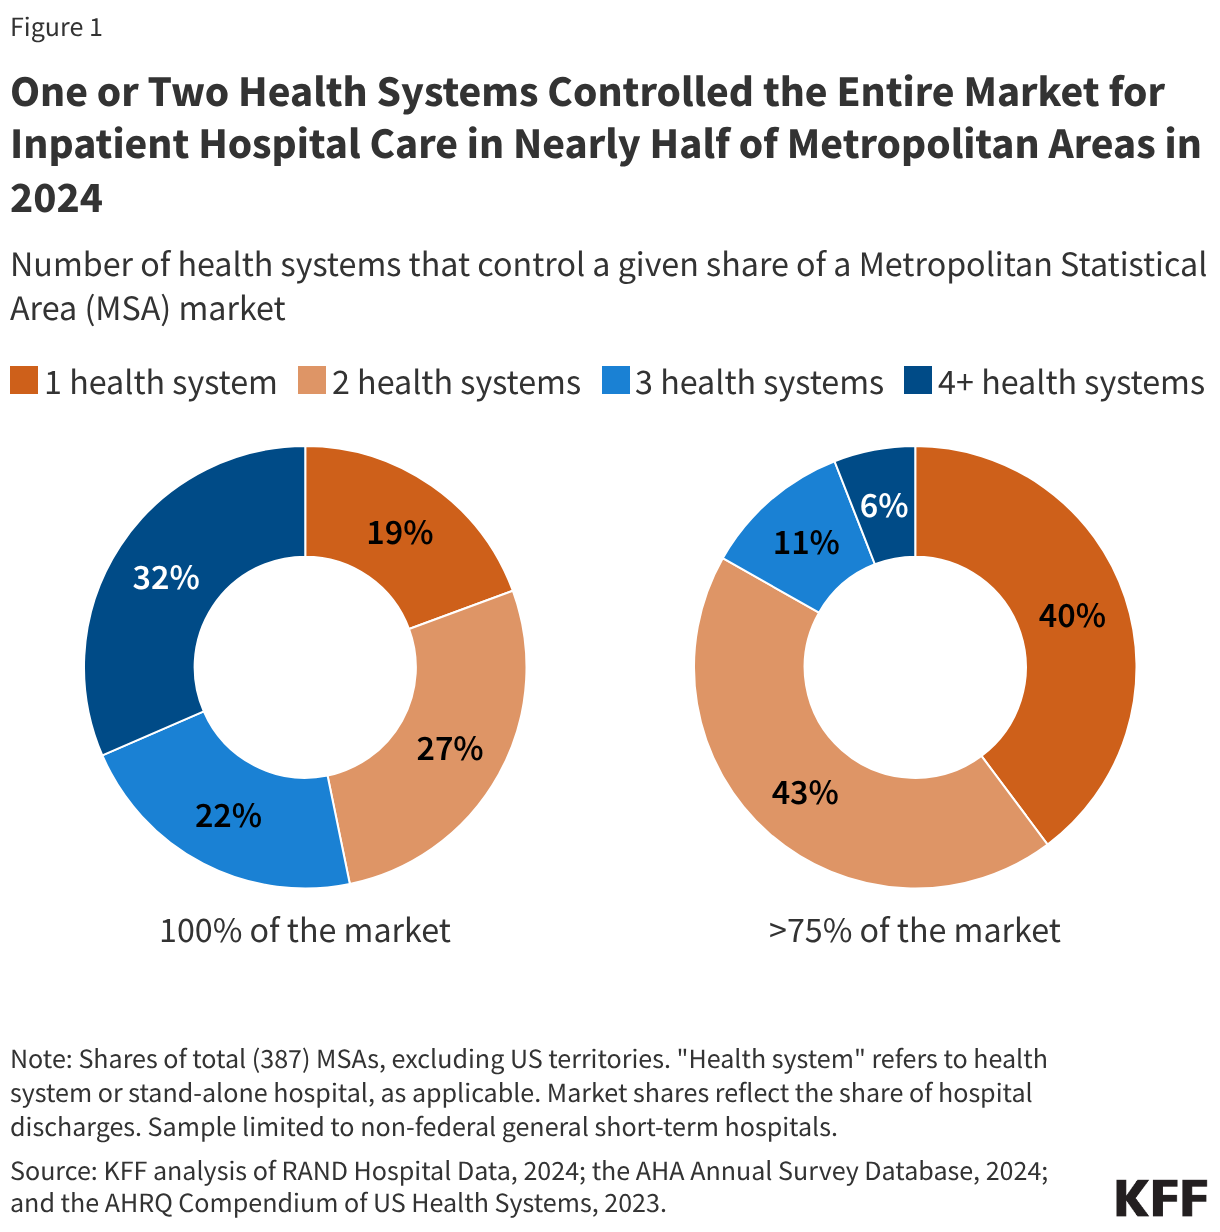
- One or two health systems controlled the entire market for inpatient hospital care in nearly half (47%) of metropolitan areas in 2024.
- In more than four of five metropolitan areas (83%), one or two health systems controlled more than 75 percent of the market.
- Nearly all (97% of) metropolitan areas had highly concentrated markets for inpatient hospital care when applying HHI thresholds from antitrust guidelines to MSAs.
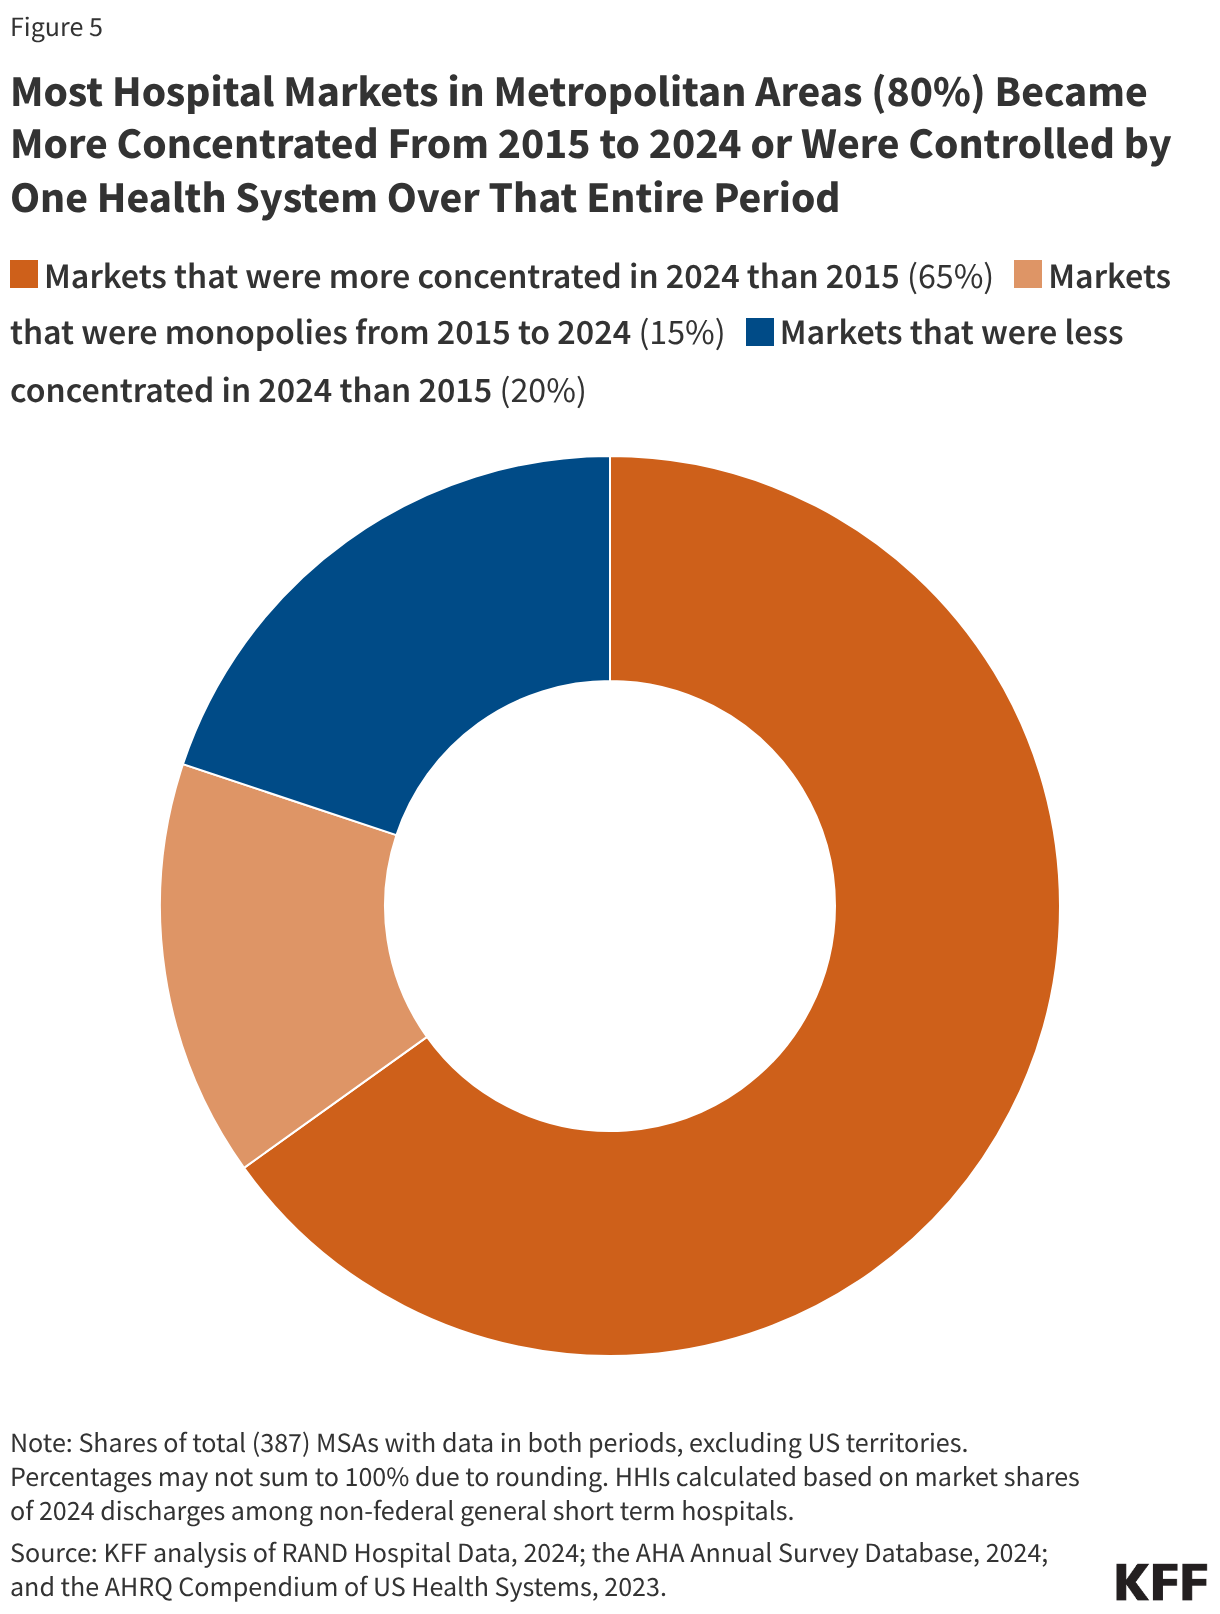
- Most hospital markets in metropolitan areas (80%) became less competitive from 2015 to 2024 or were controlled by one health system over that entire period.
One or Two Health Systems Controlled the Entire Market for Inpatient Hospital Care in Nearly Half (47%) of Metropolitan Areas in 2024
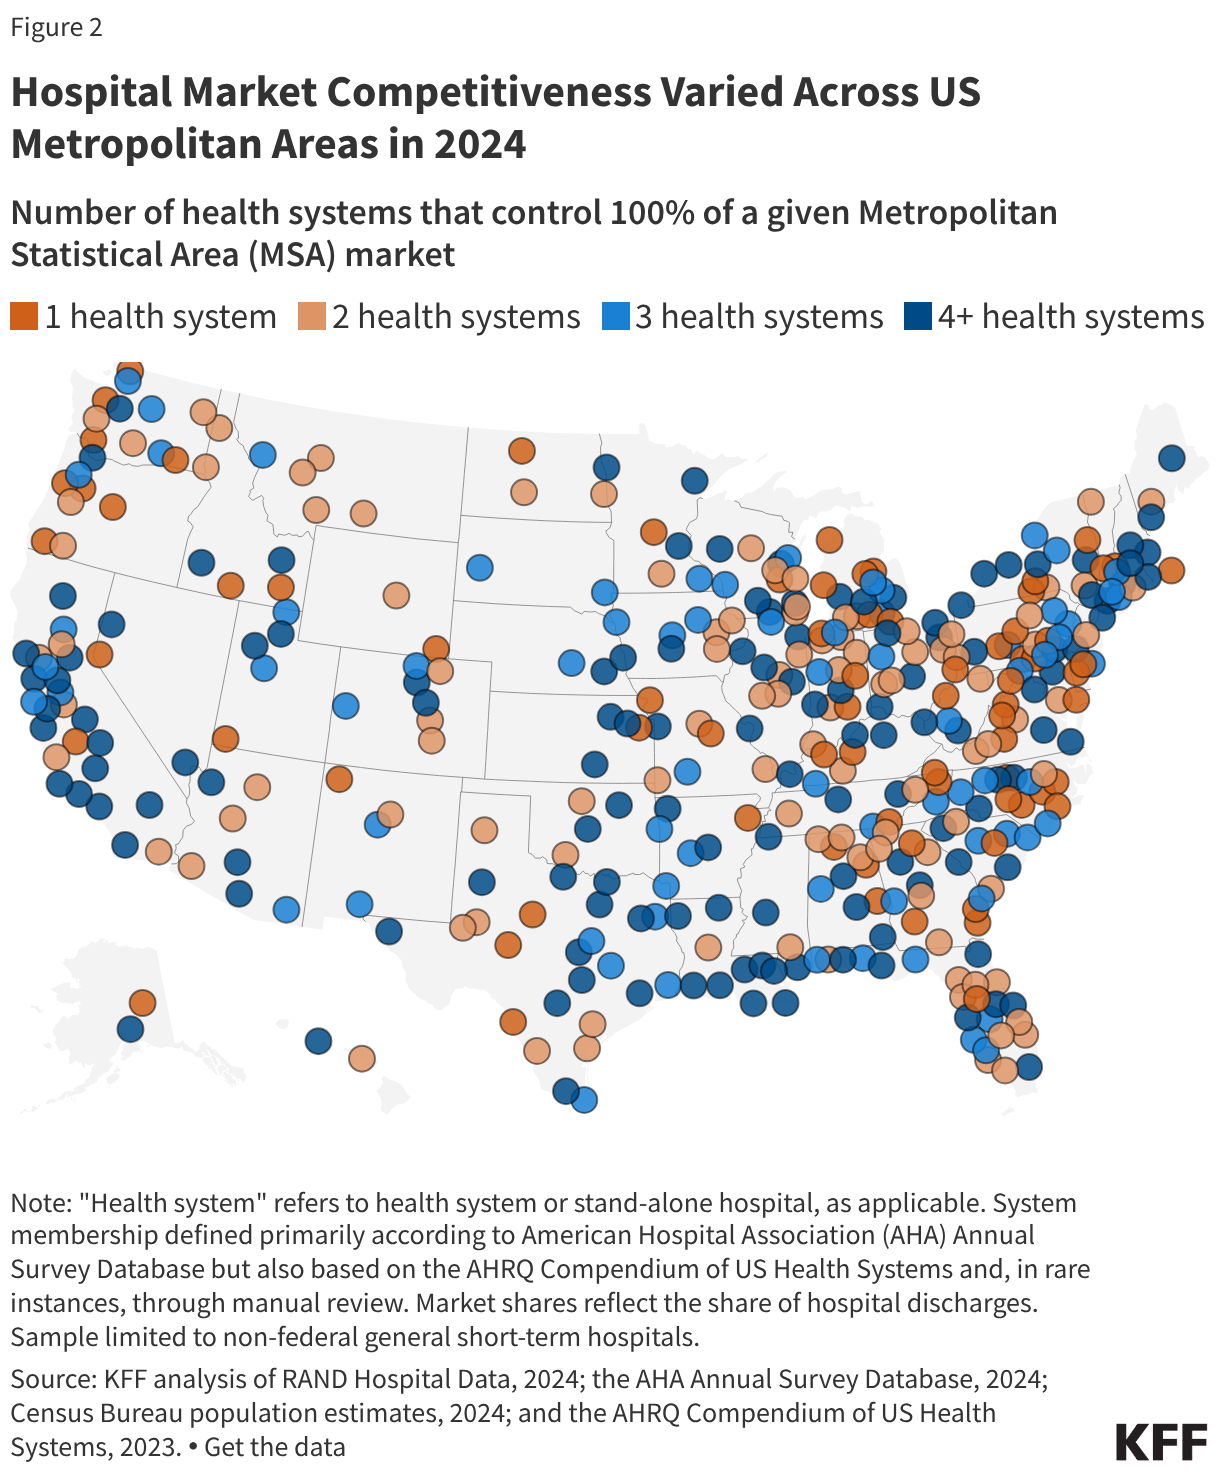
Nearly one in five (19%) metropolitan statistical areas (MSAs) were controlled by a single health system, and more than one in four (27%) markets were controlled by two systems in 2024 (see Figure 1). In more than four of five metropolitan areas (83%), one or two health systems controlled more than 75 percent of the market. These markets all met the definition of highly concentrated markets based on thresholds in current antitrust guidelines (see below). One health system controlled at least half of the market in about three out of four MSAs (76%) and at least a quarter of the market in nearly every MSA (98%).
The number of health systems in a given MSA tends to increase with the population of the region. For example, in 79% of MSAs with a population of less than 200,000, one or two health systems controlled the entire market for inpatient hospital care in 2024, as in the Muncie, IN; Napa, CA; and Amherst Town-Northampton, MA MSAs (Figure 2). MSAs with one or two health systems account for nearly half (47%) of all MSAs but 12% of the U.S. population living in metropolitan areas.
Conversely, virtually all (54 of 55) MSAs with a population of at least one million people had at least four health systems, as in the MSAs encompassing Detroit, Miami, and Phoenix. MSAs with four or more health systems accounted for 35% of all MSAs but 79% of the U.S. population living in metropolitan areas.
However, in fourteen of these relatively large MSAs with four or more health systems, the two largest health systems controlled at least 75% of the market, and in 44 of these areas, they controlled at least 50% of the market. For example, in the MSA encompassing Austin, TX, with 2.6 million residents, two systems (HCA Healthcare and Ascension Healthcare) controlled 89% of the inpatient hospital care market, though Austin is home to more than four health systems. The metropolitan area encompassing Portland, OR, with 2.5 million residents and more than four health systems, is a less concentrated market than Austin’s, but the two largest systems (Legacy Health and Providence) still control a combined 62% of the market. (See Methods for discussion about MSAs as geographic hospital markets).
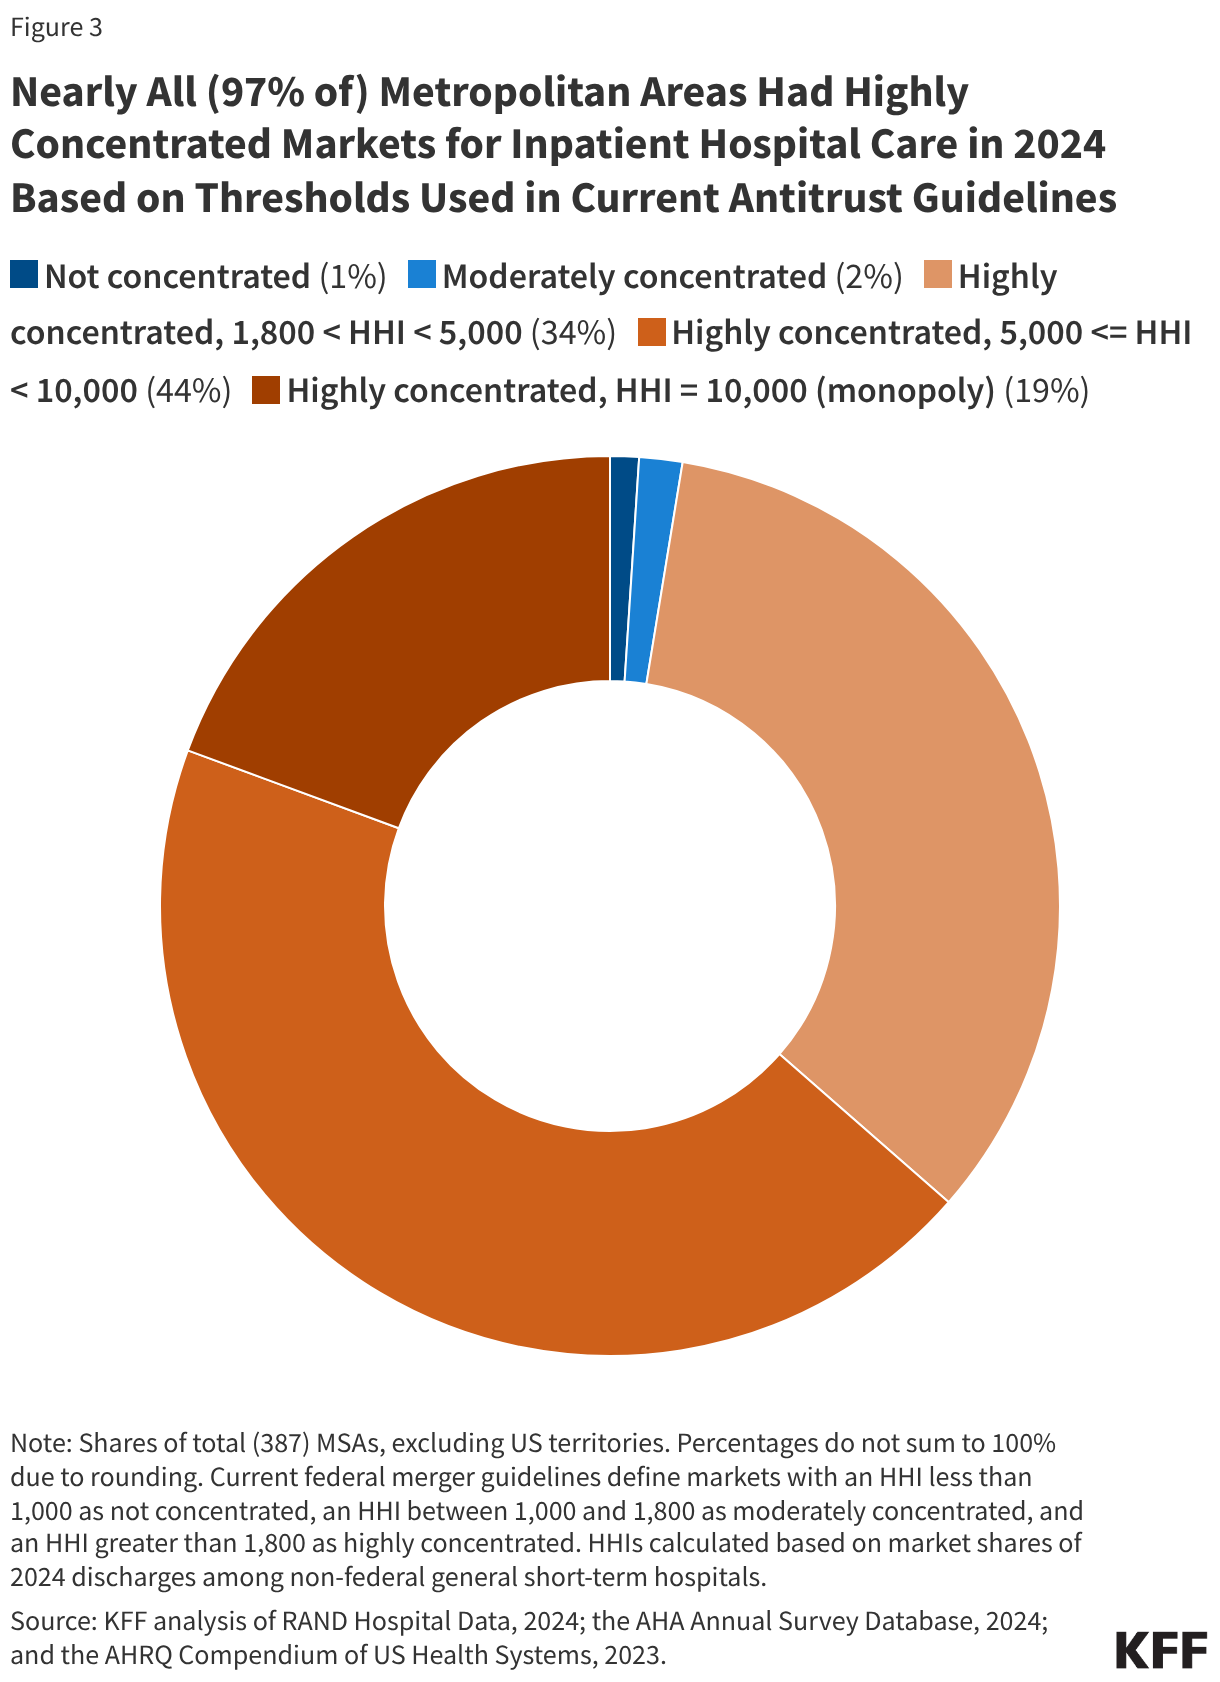
Nearly All (97% of) Metropolitan Areas Had Highly Concentrated Markets for Inpatient Hospital Care in 2024 Based on Thresholds Used in Current Antitrust Guidelines
Another way to assess market competitiveness is to evaluate a measure of concentration known as the Herfindahl-Hirschman Index (HHI), which is based on the number of participants in a market and their respective shares. The measure runs from 0 (perfectly competitive) to 10,000 (monopoly market). Based on current merger guidelines from the Federal Trade Commission (FTC) and Department of Justice (DOJ), markets can be grouped into three categories: not concentrated (HHI < 1,000), moderately concentrated (1,000 – 1,800), and highly concentrated (HHI > 1,800). This analysis calculates HHIs for MSAs and groups these regions accordingly, though there are other ways of defining the boundaries of hospital markets (see Methods).
Nearly all (97% of) MSAs had highly concentrated markets for inpatient hospital care in 2024 based on thresholds used in current merger guidelines (Figure 3). These guidelines reflect updates in 2023 that lowered the HHI thresholds for moderately concentrated and highly concentrated markets. Based on the thresholds used in prior guidelines, a large majority but somewhat smaller share (93%) of MSAs were highly concentrated markets for inpatient hospital care in 2024, closer to an estimate from an earlier study (90%) that used data from 2016.
As was the case when looking at counts of health systems in MSAs, larger metropolitan areas tended to be less concentrated and more competitive than less populated metropolitan areas, although this was not always the case. All 10 MSAs that were identified as either not concentrated or moderately concentrated had more than one million residents, such as the MSAs encompassing Cincinnati, Los Angeles, and Miami. However, 45 MSAs with more than one million residents—including the MSAs encompassing Houston, Denver, and Atlanta—had highly concentrated hospital markets. Overall, 72% of people living in metropolitan areas lived in highly concentrated hospital markets.
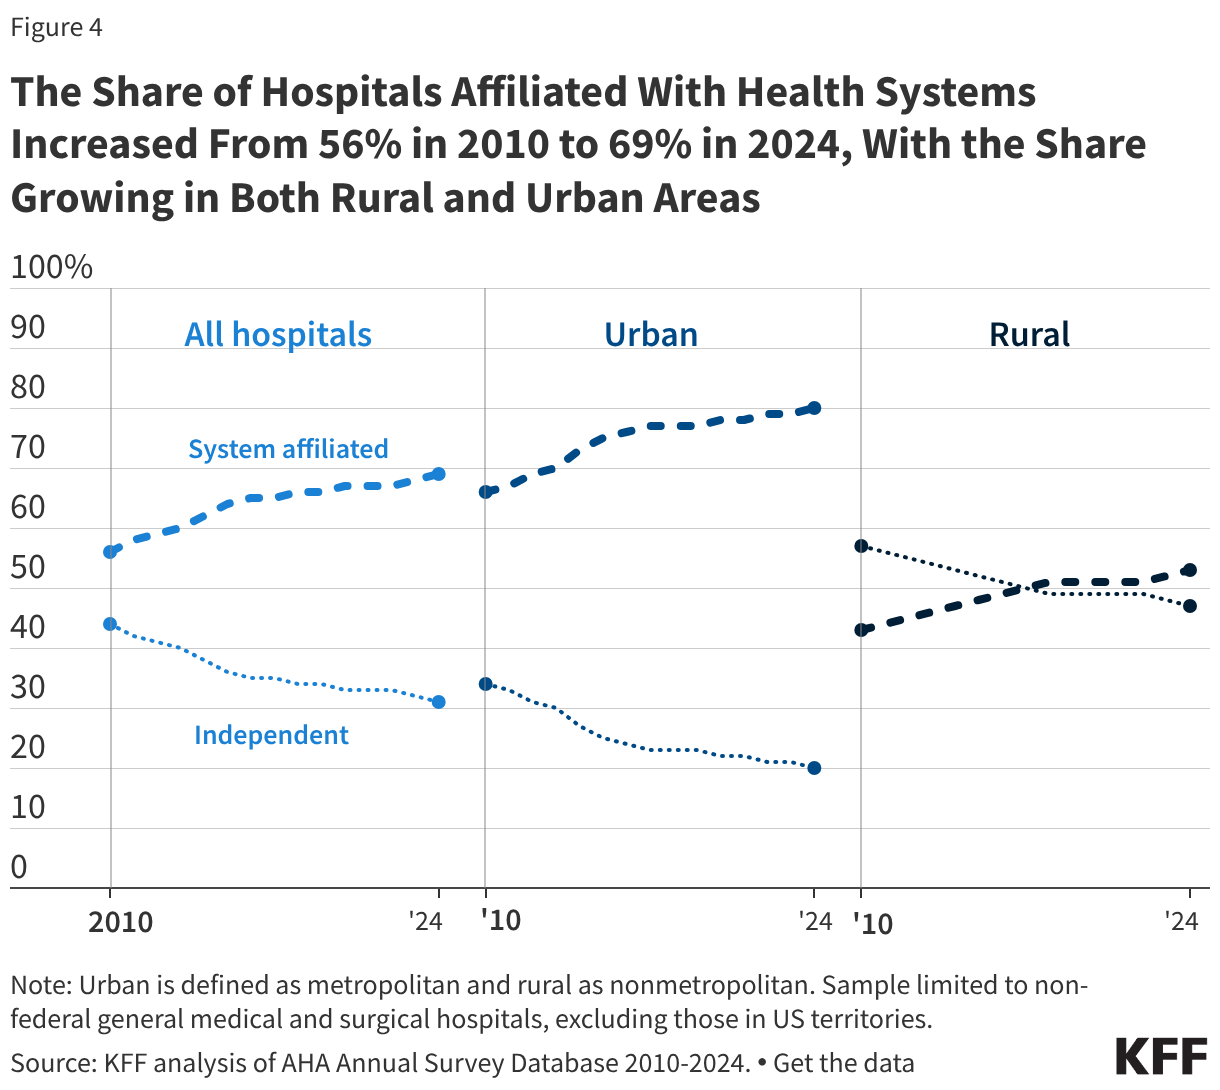
The Share of Hospitals Affiliated With Health Systems Increased From 56% in 2010 to 69% in 2024, With the Share Growing in Both Rural and Urban Areas
More than two thirds of hospitals (69%) are now part of a larger system, an increase from 56% in 2010 (Figure 4). A smaller share of rural than urban hospitals were part of a health system in 2024 (53% versus 80%), though shares have increased over time for both rural and urban regions: from 43% in 2010 to 53% in 2024 among rural hospitals and from 66% in 2010 to 80% in 2024 among urban hospitals.
Most system-affiliated hospitals in 2024 (52%) were part of a system with at least 15 hospitals, and 19% were in a system with at least 50 hospitals. Systems with at least 100 hospitals accounted for 10% of system-affiliated hospitals.
Hospitals joining larger systems may not always reduce local market competition, for example, if an independent hospital is acquired by a larger system that does not own facilities in the same market. However, mergers between hospitals that operate in different geographic markets for patient care—also known as “cross-market” mergers—may nonetheless lead to higher prices in some cases.
Most Hospital Markets in Metropolitan Areas (80%) Became More Concentrated From 2015 to 2024 or Were Controlled by One Health System Over That Entire Period
Four out of five metropolitan areas (80%) experienced an increase in hospital market concentration between 2015 and 2024 (Figure 5) or were controlled by a single hospital or health system for the duration. About two thirds of MSAs (65%) saw an increase in market concentration over this period, as measured by HHI, and the share of MSAs that were highly concentrated increased by two percentage points, from 95% to 97%. Fifteen percent of metropolitan areas were controlled by a single health system in both 2015 and 2024, meaning that concentration could not increase further in these markets. Concentration declined in only 20% of markets. In some cases, increases or decreases in concentration were very small.
The trend toward greater concentration was widespread across metropolitan areas of different sizes and regions. Among the 65% of MSAs that experienced increased concentration, the average HHI increased from 4,545 to 5,273, a 728 point increase. In markets that are not already controlled by one hospital or health system, market concentration may rise as a result of continued consolidation through mergers and acquisitions (Figure 4), shifts in hospital stays towards larger hospitals and health systems and away from smaller competitors, or hospital closures that reduce the number of competitors in a given market.
This work was supported in part by Arnold Ventures. KFF maintains full editorial control over all of its policy analysis, polling, and journalism activities.
Methods
Analyses of market shares and HHI (e.g., every figure except for Figure 4) were based in part on RAND Hospital Data. RAND Hospital Data are a cleaned and processed version of annual cost reports that Medicare-certified hospitals are required to submit to the federal government. Although limited to Medicare-certified hospitals, in 2024, the analysis of RAND data included the vast majority (98%) of non-federal general medical and surgical hospitals in US metropolitan areas included in the analysis of system affiliation based on the AHA Annual Survey Database (see below). Cost reports were assigned to years based on the end of the reporting period and were scaled up or down to reflect a 365-day period, as necessary. In cases where a hospital had multiple cost reports assigned to the same analysis year, the cost report covering the longer reporting period was retained. When cost reports were longer than 365 days and fully spanned a calendar year (such as one beginning 1/1/2022 and ending 7/31/2023), the cost report was assigned to both the year spanned in full (2022) and the year in which it ended (2023).
Analyses of market shares and HHI were restricted to non-federal, general short-term hospitals as identified in the RAND Hospital Data. Some general short-term hospitals in the analysis were identified as other hospital types, such as surgical hospitals, in the AHA data (6% of those that could be matched), though these represented a small share of discharges (1%). Market shares were calculated as the share of inpatient discharges in an MSA that occurred within a given health system or independent hospital. One percent of hospitals that met the other sample restrictions had missing values for inpatient discharges and were excluded. Hospitals were grouped into health systems, as applicable, based primarily on the hospital’s system affiliation in the AHA Annual Survey Database. A previous version of this analysis relied on the AHRQ Compendium of US Health Systems, but that file has not been updated to include 2024 information.
For 2024 analyses, in the small number of cases where a cost report could not be matched to the AHA Annual Survey database (2% of observations), the 2023 AHRQ Compendium was used to identify the hospital's corresponding AHA system identifier, where available. Twelve hospitals could not be matched to AHA or AHRQ records, of which 7 were manually assigned system affiliations based on internet searches. System affiliations for 40 hospitals (2% of the sample) were updated using the 2023 AHRQ Compendium when confirmed by internet searches in cases where: (1) the Compendium identified at least two hospitals in an MSA as being part of a Compendium health system that did not correspond to an AHA system and (2) at least one of those hospitals was identified as independent in the AHA data. In 3 instances (covering 11 hospitals), two AHA systems were combined into one when indicated by the AHRQ Compendium and confirmed through internet searches.
Analyses of changes in system affiliation and market structure over time (Figures 4 and 5) relied only on AHA system identifiers. When cost reports did not match to AHA data in the Figure 5 analysis, those hospitals were treated as independent.
MSAs reflect 2023 geographic definitions from the Census Bureau delineated based on data from the 2020 decennial census. HHIs were calculated as the sum of squared market shares for all health systems in a given MSA (e.g., an MSA divided evenly between two systems would have an HHI of 502 + 502 = 5,000). MSA population estimates for 2024 were obtained from the Census Bureau.
MSAs were used as a proxy for hospital markets, which is one approach used by other studies summarizing hospital market competition across the country. There are other ways of defining markets that would yield different results when calculating the level of competition. For example, one report also evaluated MSAs but focused on where residents received their care, including at hospitals outside of a given MSA. As another example, some have defined markets based on a radius around the hospital defined by distance or estimated travel time. More precise market definitions, such as those used to define competition in antitrust cases, were not feasible. This study did not exclude MSAs with populations of at least three million as some others have done, because the analysis sought to describe competition across all metropolitan areas.
The analysis of the share of hospitals affiliated with systems was based on the AHA Annual Survey Database alone. This analysis was restricted to nonfederal, general medical and surgical hospitals. Urban hospitals were defined as those operating in a metropolitan area, while rural hospitals were defined as those operating in nonmetropolitan areas. Metropolitan and nonmetropolitan designations were identified using Urban Influence Codes (UIC) data.