COVID-19 Cases, Deaths, and Vaccinations by Race/Ethnicity as of Winter 2022

Published: Mar 7, 2023

As we pass the three-year mark since the World Health Organization characterized the COVID-19 pandemic on March 11, 2020, data from the U.S. show that cases and deaths have remained relatively low through the second half of 2022, over 8 in 10 people (81%) had received at least one COVID-19 vaccination dose as of February 23, 2023, while only 17% of people ages five and older had received an updated bivalent booster dose. Over the course of the pandemic, racial disparities in cases and deaths have widened during variant surges and narrowed when cases and deaths fall. However, overall, Black, Hispanic, and American Indian and Alaska Native (AIAN) people have borne the heaviest health impacts of the pandemic, particularly when adjusting data to account for differences in age by race and ethnicity. While Black and Hispanic people were less likely than their White counterparts to receive a vaccine during the initial phases of the vaccination rollout, the disparities in the share that have received at least one COVID-19 vaccination dose have narrowed over time and reversed for Hispanic people. Despite this progress, a vaccination gap persists for Black people and Black and Hispanic people are about half as likely as their White counterparts to have received an updated bivalent booster dose.

This data note presents an update on the status of COVID-19 cases and deaths by race and ethnicity as of December 2022 and vaccinations by race/ethnicity as of February 2023, based on federal data reported by the Centers for Disease Control and Prevention (CDC).

What is the status of COVID-19 cases and deaths by race/ethnicity?

Racial disparities in COVID-19 cases and deaths have widened and narrowed over the course of the pandemic, but when data are adjusted to account for differences in age by race/ethnicity, they show that AIAN, Black, and Hispanic people have had higher rates of infection and death than White people over most of the course of the pandemic. 

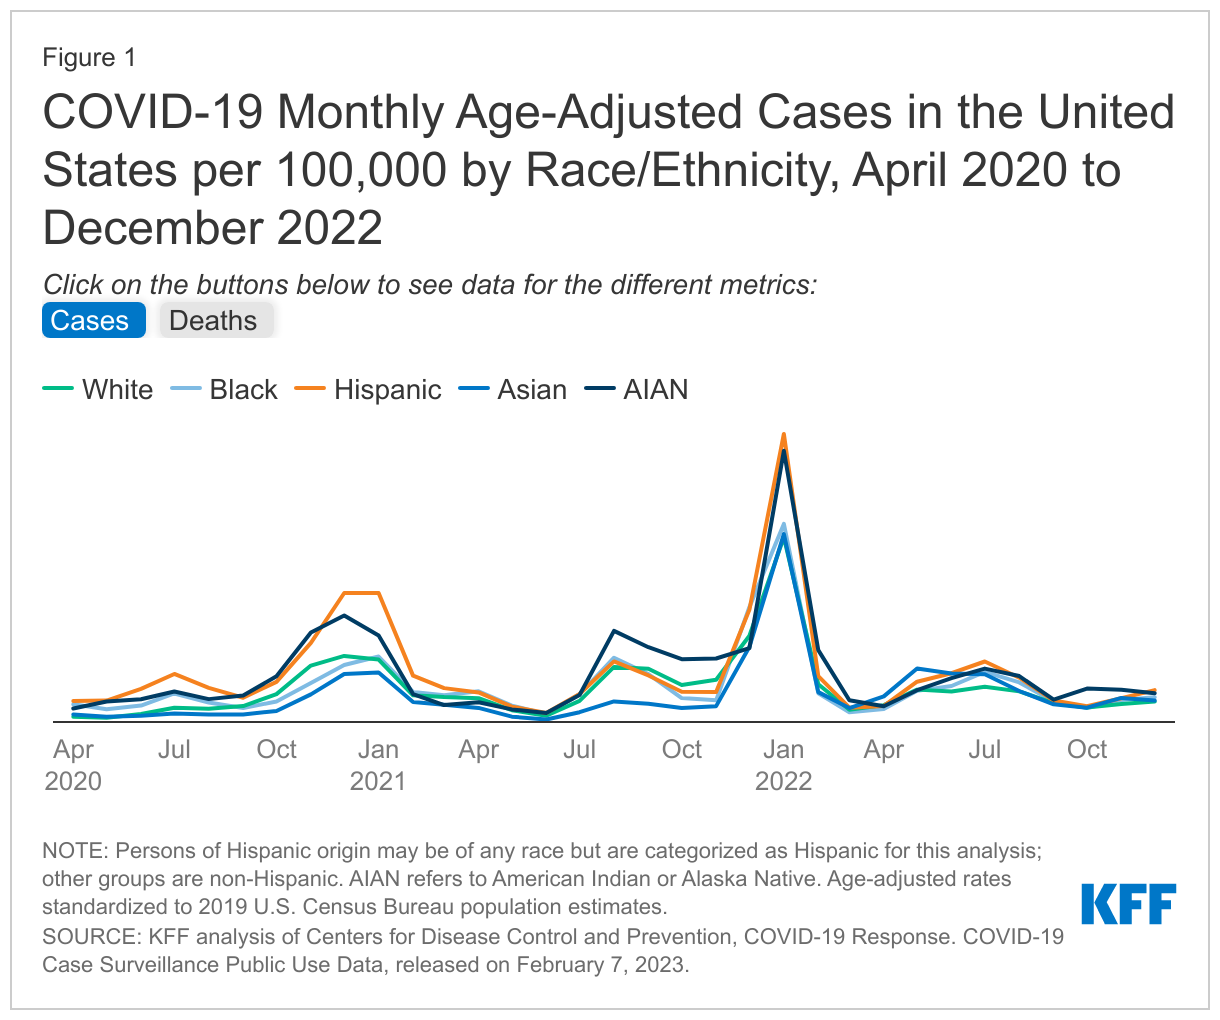
Early in the pandemic, there were large racial disparities in COVID-19 cases. Disparities narrowed when overall infection rates fell. However, during the surge associated with the Omicron variant in Winter 2022, disparities in cases once again widened with Hispanic (4,404.9 per 100,000), AIAN (4,148.6 per 100,000), Black (3,029.4 per 100,000) people having higher age-adjusted infection rates than Asian (2,873.4 per 100,000) and White people (2,826.4 per 100,000) as of January 2022 (Figure 1). Following that surge, infection rates fell in Spring 2022 and disparities once again narrowed. During Summer 2022, there was a slight rise in infection rates with higher age-adjusted infection rates for Hispanic, AIAN, Black, and Asian people compared to White people. Between Fall/Winter 2022, infection rates fell across groups, but as of December 2022, the age-adjusted COVID-19 infection rates were highest for Hispanic people (488 per 100,000) and AIAN people (440 per 100,000). White and Asian people had the lowest infection rates at 313 per 100,000 and 329 per 100,000, respectively.

While death rates for most groups of color were substantially higher compared with White people early in the pandemic, since late Summer 2020, there have been some periods when death rates for White people have been higher than or similar to some groups of color. However, age-adjusted data show that AIAN, Black, and Hispanic people have had higher rates of death compared with White people over most of the pandemic and particularly during surges. For example, as of January 2022, amid the Omicron surge, age-adjusted death rates were higher for Black (37.6 per 100,000), AIAN (34.8 per 100,000), and Hispanic people (30.0 per 100,000) compared with White people (23.5 per 100,000) (Figure 1). Following that surge, disparities narrowed when death rates fell. As of December 2022, age-adjusted death rates were similar across groups at 4.4 per 100,00 for White people, 3.8 per 100,000 for AIAN people, 3.7 per 100,000 for Black people, 3.5 per 100,000 for Hispanic people, and 3.2 per 100,000 for Asian.

COVID-19 Monthly Age-Adjusted Cases in the United States per 100,000 by Race/Ethnicity, April 2020 to December 2022

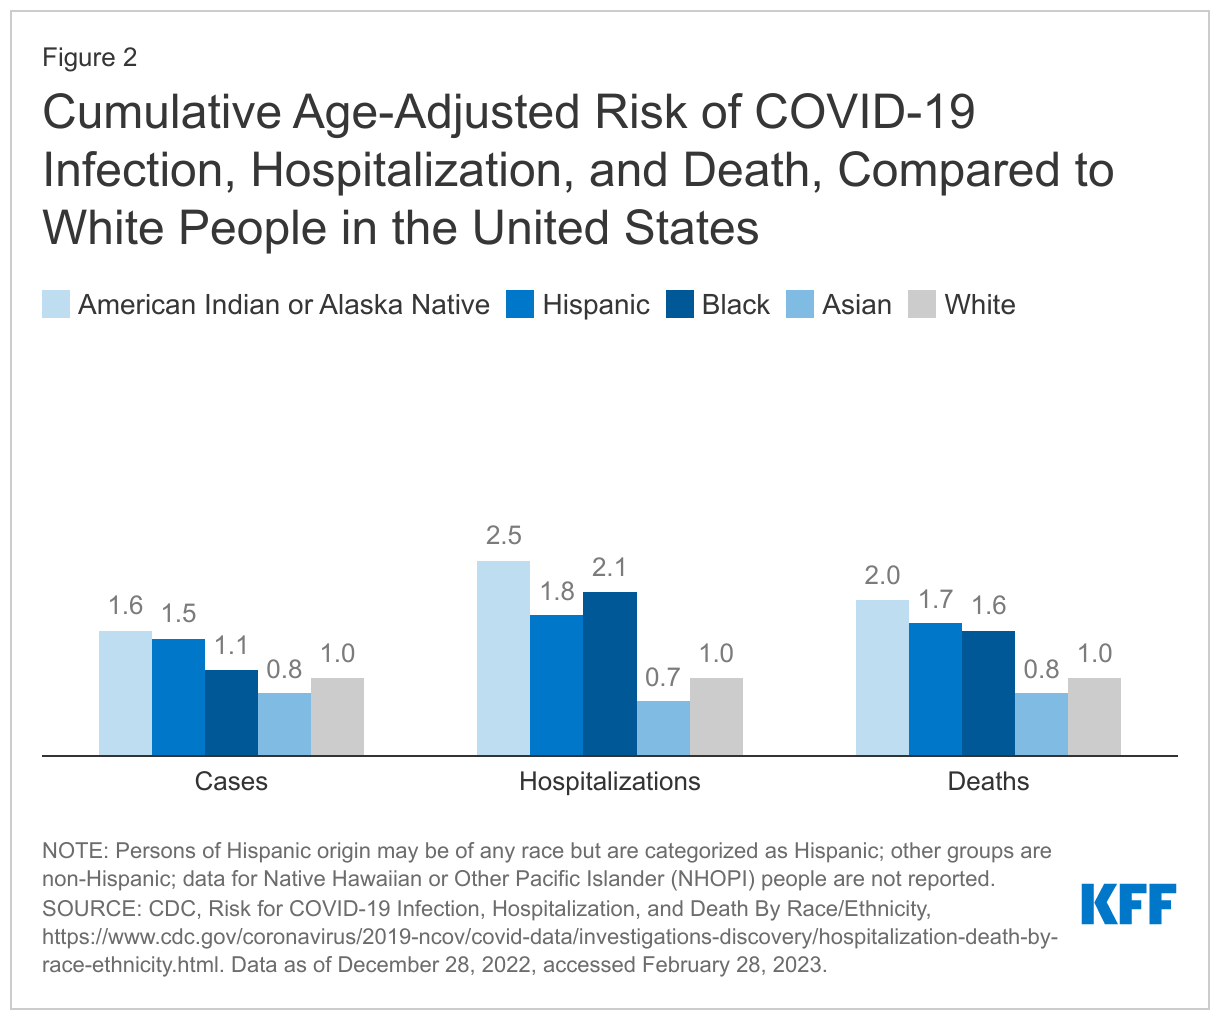
Despite these fluctuations in patterns of cases and deaths by race and ethnicity over time, total cumulative age-adjusted data show that AIAN and Hispanic people have had higher risk for COVID-19 infection and AIAN, Hispanic, and Black people have had higher risk for COVID-19 deaths compared with White people. As of December 28, 2022, cumulative age-adjusted data showed that AIAN and Hispanic people were about 1.5 times as likely to be infected with COVID-19 compared with White people (Figure 2). AIAN people were twice as likely as White people to die from COVID-19, and death rates for Hispanic and Black people were 1.7. and 1.6 times higher than White people, respectively. AIAN, Black, and Hispanic people also have had increased risk of hospitalization due to COVID-19 compared with White people.

Cumulative Age-Adjusted Risk of COVID-19 Infection, Hospitalization, and Death, Compared to White People in the United States

What are COVID-19 vaccination and booster patterns by race/ethnicity?

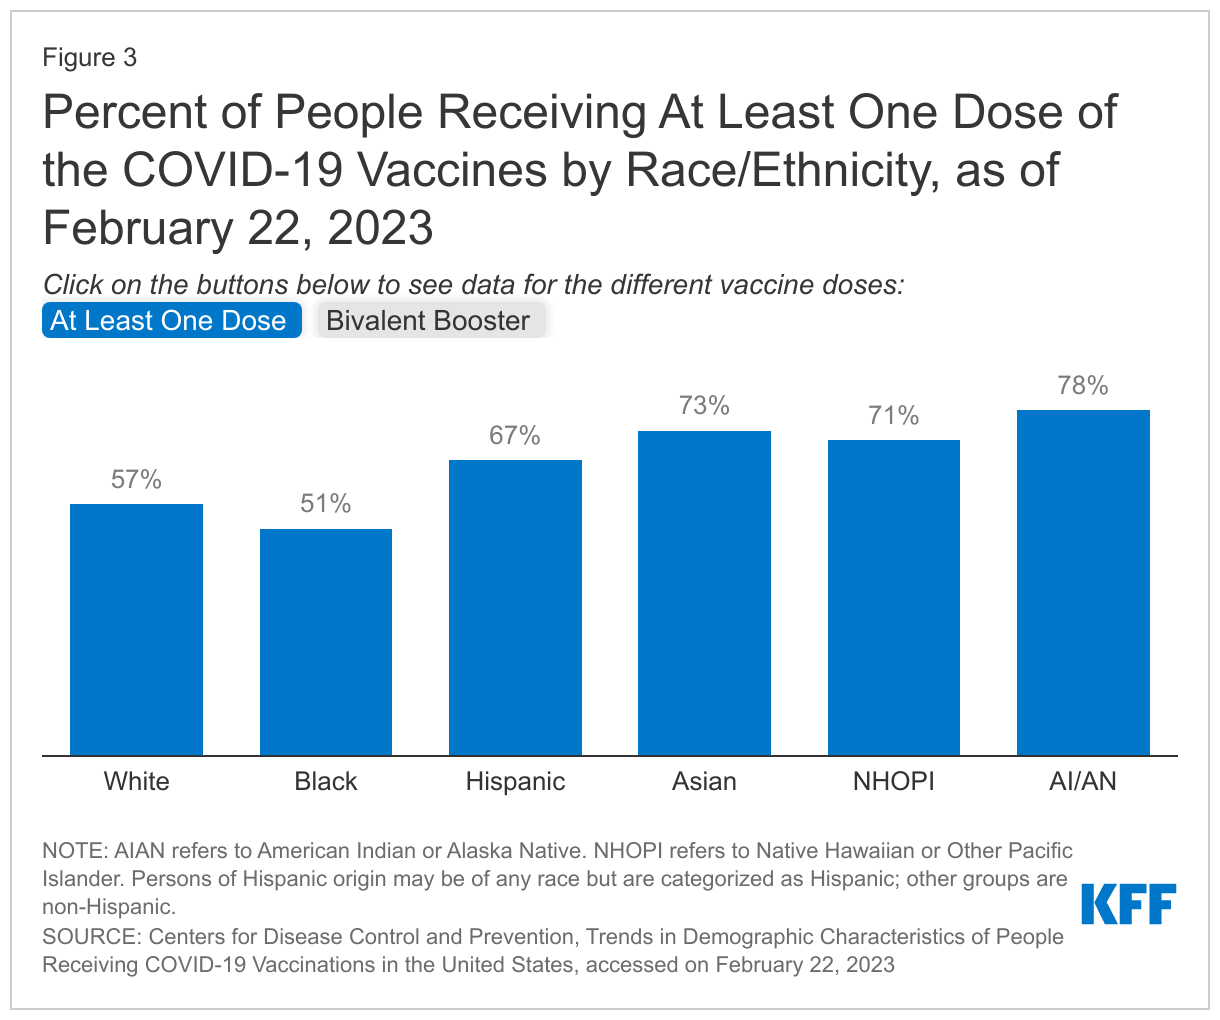
While disparities in the uptake of at least one COVID-19 vaccination dose have narrowed over time and have been reversed for Hispanic people, they persist for Black people. KFF analysis shows that at both the federal and state level, there were large gaps in vaccination for Black and Hispanic people in the initial phases of the vaccination rollout, which narrowed over time and eventually reversed for Hispanic people. Despite this progress, a vaccination gap persists for Black people. According to the CDC, over 8 in 10 people (81%) had received at least one COVID-19 vaccination dose as of February 23, 2023, and race/ethnicity was known for 76% of people who had received at least one dose. Based on those with known race/ethnicity, about half (51%) of Black people had received at least one dose compared with 57% of White people, roughly two-thirds (67%) of Hispanic people, and over seven in ten Native Hawaiian and other Pacific Islander (NHOPI) (71%), Asian (73%), and AIAN (78%) people (Figure 3).

Overall, few people have received the updated bivalent booster vaccine dose, and Black and Hispanic people are about half as likely as White people to have received this booster so far. The updated bivalent boosters protect against both the original virus that causes COVID-19 and the BA.4 and BA.5 Omicron variants. These boosters became available for people ages 12 years and older on September 2, 2022, and for people ages 5-11 years old on October 12, 2022. The CDC recommends that people ages 5 years and older receive one bivalent booster at least 2 months after their last COVID-19 vaccine dose. The CDC reports that, overall, 17% of people over age five have received the updated bivalent booster vaccine dose as of February 23, 2023, with race/ethnicity data available for 90% of recipients. Based on those with known race/ethnicity, 21% of eligible Asian people had received a bivalent booster dose, higher than the rate for White people (16%). Rates were slightly lower for eligible AIAN (14%) and NHOPI (11%) people, while eligible Black (9%) and Hispanic 8%) people were about half as likely as their White counterparts to have received the bivalent booster dose (Figure 3).

Percent of People Receiving At Least One Dose of the COVID-19 Vaccines by Race/Ethnicity, as of February 22, 2023

Discussion

While disparities in cases and deaths have widened and narrowed over the course of the pandemic, age-adjusted data show that AIAN, Black, and Hispanic people have had higher rates of cases and death compared with White people over most of the course of the pandemic and that they have experienced overall higher rates of infection, hospitalization, and death.

Data point to significantly increased risks of COVID-19 illness and death for people who remain unvaccinated or have not received an updated bivalent booster dose. During the initial vaccine rollout, Black and Hispanic people were less likely to receive vaccines than their White counterparts. However, disparities in the uptake of at least one COVID-19 vaccination dose have narrowed over time and reversed for Hispanic people, though they persist for Black people. Despite this progress in initial vaccination uptake, overall uptake of the updated bivalent booster dose has been slow so far, and eligible Black and Hispanic people have been about half as likely to have received an updated booster than their White counterparts.

Overall, these data show that although the pandemic has contributed to growing awareness and focus on addressing racial disparities, they persist, reflecting the underlying structural inequities that drive them. The findings highlight the importance of a continued focus on equity and efforts to address inequities that leave people of color at increased risk for exposure, illness, and death as well as to close gaps in access to health care, as COVID-19 recovery continues.

Ten Numbers to Mark Three Years of COVID-19

Published: Mar 6, 2023

On March 11, 2020, the World Health Organization (WHO) first characterized COVID-19 as a “pandemic,” stating, “We have rung the alarm bell loud and clear.” As we mark three years since then, here are 10 key data points that illuminate the challenges, and progress, made to date. All data provided are as of Feb. 28, 2023, unless otherwise noted.

1,095

The number of days elapsed between March 11, 2020, to March 11, 2023

March 11, 2023 marks 1,095 days since WHO first characterized COVID-19 as a pandemic.  Even prior to that date, on January 30, 2020, the WHO had already declared COVID-19 to be a “Public Health Emergency of International Concern” (PHEIC)  and the U.S. government declared COVID-19 to be a “Public Health Emergency” (PHE) on Jan. 31, 2020. The U.S. PHE has been renewed every 90 days since, although the Biden administration recently announced that the PHE will end on May 11, 2023.

6,859,093

Global number of COVID-19 deaths to date*

Since the pandemic began, there have been almost 7 million reported COVID-19 deaths worldwide. This is likely an underestimate, as many COVID deaths have gone unreported and uncounted. Estimates using excess death calculations place the true toll at closer to 15 to 20 million, or even more.

1,115,637

U.S. number of COVD-19 deaths to date

Since the start of the pandemic, more than 1.1 million of all reported COVID-19 deaths have been in the United States.

758,390,564

Global number of COVID-19 cases to date

There have been more than three-quarters of a billion confirmed COVID-19 cases to date, likely a fraction of the true number of SARS-CoV-2 infections, the virus that causes COVID. An accurate and up-to-date picture of where and how much the virus is transmitting has been challenging given limited testing, imperfect surveillance and reporting systems, and other factors.

103,268,408

U.S. number of COVID-19 Cases to date

More than a hundred million COVID-19 cases have been reported in the U.S. to date.

71%

Share of global population vaccinated against COVID-19

Overall, seven in 10 people worldwide have received at least one dose of a COVID-19 vaccine, and 65% have been fully vaccinated. However, much smaller shares have received a booster shot. In low-income countries, fewer than three out of 10 people have received at least one dose of a vaccine.  More information on vaccine coverage is available here.

81.2%

Share of U.S. population vaccinated against COVID-19

As of February 23, about 8 in 10 people in the U.S. have received at least one vaccine dose and 69.3% have been fully vaccinated against COVID-19, but the share who have received the updated booster, among those eligible, remains quite low, at just 17.2%.

671,582,379

Total number of vaccine doses administered in the U.S.

In the two years since COVID-19 vaccines have become widely available, over 671 million doses have been administered in the U.S., for a population that stands at approximately 330 million.

683,700,000

Number of vaccine doses delivered by the U.S. government for global use

In 2021, the U.S. government pledged to donate over 1 billion doses of COVID-19 vaccines to countries in need. As of February 2023, the U.S. had delivered over 680 million of these doses, and is the largest government donor to COVID-19 vaccination efforts.  The difference between total vaccines pledged and those delivered largely reflects increasing supply and falling demand for COVID-19 vaccinations globally.

Five

Number of named variants of concern

SARS-CoV-2 evolves and changes as it spreads over time, which has sometimes given rise to new “variants of concern”, or genetic changes in the virus with potentially harmful implications for public health. Since the original version of the virus emerged, WHO has identified 5 different variants of concern: Alpha, Beta, Gamma, Delta, and Omicron (the dominant global variant now in circulation).

*Case and death numbers used here are based on reports, and do not account for undercounts including in countries with very large populations, such as India and China.

Mapping Medicaid Managed Care Models & Delivery System and Payment Reform

Published: Mar 6, 2023

Map

Delivery system and payment reform are dynamic and ever-evolving policy areas of state Medicaid programs; virtually every state has initiatives underway. This interactive is designed to provide users with an environmental scan of the activity.

Users can toggle between initiative types in the map below to see what initiatives are at play in each state. Definitions of each initiative type can be found on the next tab.

Medicaid Delivery System and Payment Reform as of July 1, 2022

Definitions

General notes

State Medicaid programs are using managed care and an array of other service delivery and payment system reforms, financial incentives, and managed care contracting requirements to help achieve better outcomes and lower costs. Common delivery and payment reform models used by state Medicaid programs include patient-centered medical homes (PCMHs), ACA Health Homes, accountable care organizations (ACOs), and episodes of care. However, there is variation in which models are most widely used, how states combine and implement these models, and how long states have been engaged in efforts to transform payment and delivery systems. Some models may be implemented in Medicaid fee-for-service (FFS) delivery systems while other payment and delivery system reform models are implemented through managed care.

While the shift to using managed care has increased budget predictability for states, the evidence about the impact of managed care on access to care and costs is both limited and mixed. Additionally, the literature about delivery and payment reform models is not conclusive regarding the impact of these initiatives and more research is needed, states have seen successes and many models have evolved over time in response to state experience and evaluation finding.

Medicaid Managed Care

Medicaid Managed Care Organizations (MCOs) cover a comprehensive set of benefits (acute care services and sometimes long-term services and supports). MCOs are at financial risk for the services covered under their contracts and receive a per member per month “capitation” payment for these services.

Primary Care Case Management (PCCM) programs retain fee-for-service (FFS) reimbursements to providers but enroll beneficiaries with a primary care provider who is paid a small monthly fee to provide case management services in addition to primary care.

Patient-Centered Medical Home (PCMH)

Under a PCMH model, a physician-led, multi-disciplinary care team holistically manages the patient’s ongoing care, including recommended preventive services, care for chronic conditions, and access to social services and supports. Generally, providers or provider organizations that operate as a PCMH seek recognition from organizations like the National Committee for Quality Assurance (NCQA). PCMHs are often paid (by state Medicaid agencies directly or through MCO contracts) a per member per month (PMPM) fee in addition to regular FFS payments for their Medicaid patients.

ACA Health Homes

The ACA Health Homes option, created under Section 2703 of the ACA, builds on the PCMH concept. By design, Health Homes must target beneficiaries who have at least two chronic conditions (or one and risk of a second, or a serious and persistent mental health condition), and provide a person-centered system of care that facilitates access to and coordination of the full array of primary and acute physical health services, behavioral health care, and social and long-term services and supports. This includes services such as comprehensive care management, referrals to community and social support services, and the use of health information technology (HIT) to link services, among others. States receive a 90% federal match rate for qualified Health Home service expenditures for the first eight quarters under each Health Home State Plan Amendment; states can (and have) created more than one Health Home program to target different populations. For substance use disorder (SUD) Health Homes approved on or after October 1, 2018, the SUPPORT Act extends the enhanced federal match rate from eight to ten quarters.

Accountable Care Organization (ACO)

While there is no uniform, commonly accepted federal definition of an ACO, an ACO generally refers to a group of health care providers or, in some cases, a regional entity that contracts with providers and/or health plans, that agrees to share responsibility for the health care delivery and outcomes for a defined population. An ACO that meets quality performance standards that have been set by the payer and achieves savings relative to a benchmark can share in the savings. States use different terminology in referring to their Medicaid ACO initiatives, such as Regional Accountable Entities in Colorado and Accountable Entities in Rhode Island.

Episode of Care

Unlike fee-for-service (FFS) reimbursements, where providers are paid separately for each service, or capitation, where a health plan receives a PMPM payment for each enrollee intended to cover the costs for all covered services, episode of care payments provide a set dollar amount for the care a patient receives in connection with a defined condition or health event (e.g., heart attack or knee replacement). Episode-based payments usually involve payment for multiple services and providers, creating a financial incentive for physicians, hospitals, and other providers to work together to improve patient care and manage costs.

All-Payer Claims Database (APCD)

All-payer claims databases are state databases that include medical claims, pharmacy claims, dental claims (typically, but not always), and eligibility and provider files collected from private and public payers in a state. Through the aggregation of data across all public and private payers, APCDs can provide states with a perspective on cost, service utilization and quality of health care services across the full spectrum of payers in a state, representing a tool that can support state efforts to control health care costs and promote value-based care.

KFF Quick Take: Marking Three Years of COVID-19

Published: Mar 6, 2023

Jen Kates, Senior Vice President and Director of Global Health and HIV Policy at KFF, describes the state of global health three years into the COVID-19 pandemic.

News Release

KFF’s Kaiser Health News and CBS News Team Up to Investigate a Dental Device That Allegedly Has Left a Trail of Mangled Mouths and Devastated Patients

Published: Mar 3, 2023

In a months-long project, KFF’s Kaiser Health News correspondent Brett Kelman joined forces with CBS News National Consumer Investigative Correspondent Anna Werner to investigate an unregulated dental device that is at the heart of numerous accounts of pain and disfigurement.

At least 10,000 dental patients have been fitted with the fixed Anterior Growth Guidance Appliance (“AGGA”), which costs about $7,000. The device resembles a retainer, is typically worn for several months, and uses springs to apply pressure to the front teeth and upper palate, according to the patent application filed by the inventor of the device.

In videos of the inventor training dentists, he says the pressure can expand a patient’s jaw, which he cites as the key to making people more beautiful and curing common ailments like sleep apnea and TMJ. But dental specialists interviewed by KHN and CBS News said that based on their experiences with former AGGA patients the device pushed teeth out of position and sometimes left them loose and weak.

At least 20 patients have filed lawsuits in the past three years claiming the device — which has not been reviewed by the Food and Drug Administration — left them with flared teeth, damaged gums, exposed roots, or erosion of the bone that holds teeth in place. The inventor and other defendants have denied liability in all the lawsuits.

The joint KHN-CBS News investigation aired on “CBS Mornings” in two installments, on March 1 and March 2. A digital version of the story, which includes embedded video of the TV segments, appears on kffhealthnews.org and cbsnews.com. This is the first investigative project stemming from a broader editorial partnership between CBS News and KFF.

“A hallmark of KHN’s investigative journalism is that we illuminate systemic flaws in American health care,” said KHN Publisher David Rousseau, the executive director of journalism and technology at KFF. “This investigation shows no one was watching.”

“This is a great example of reporters teaming up to expose a problem that can impact the health and finances of everyday Americans,” said Shawna Thomas, Executive Producer of CBS Mornings. “By partnering with Kaiser Health News, we’re able to expand the depth of our health care and consumer coverage.”

The editorial partnership also features regular appearances by Dr. Céline Gounder, KHN’s senior fellow and editor-at-large for public health, on all of CBS News’ platforms, as well as stories, segments, and specials drawing upon reporting from across KHN’s newsroom and bureaus. It includes the popular “Bill of the Month” series, in which KHN Editor-in-Chief Elisabeth Rosenthal appears regularly on “CBS Mornings” to discuss surprising medical bills and what they tell us about the health care system. (“Bill of the Month” is a collaborative investigative project of KHN and NPR.) And it now includes the KHN Health Minute, a weekly feature for CBS News Radio stations that will help millions of listeners understand how  developments in health care delivery and policy affect them.

For the dental device story, KHN and CBS News journalists interviewed 11 dental patients who said they were harmed by the AGGA device — eight of whom have active lawsuits concerning the device — plus attorneys who represent or have represented at least 23 others.

In every case, the patients said they mistakenly assumed the device would not be for sale unless it was proven safe and effective. Dental experts said, based on their experience with former AGGA patients, that patients can suffer tens of thousands of dollars in damage to their mouths.

According to a KHN and CBS News review of the FDA’s device database, the AGGA does not appear to be on the radar of the agency, which is responsible for regulating medical and dental devices in the United States. A manufacturer is supposed to register devices with the FDA, and those that pose even a moderate risk to a patient can be required to go through a pre-market review to check if they are safe and effective. The manufacturer of the AGGA said in a court document it has no record of communicating with the FDA about the device before beginning to make or sell it, and claimed that the device is exempt from premarket review under an exemption for dental labs.

About KFF and KHN

KHN (Kaiser Health News) is a national newsroom that produces in-depth journalism about health issues. Together with Policy Analysis, Polling and Survey Research and Social Impact Media, KHN is one of the four major operating programs at KFF. KFF is an endowed nonprofit organization providing information on health issues to the nation.

About CBS News and Stations

CBS News and Stations brings together the power of CBS News, 28 owned television stations in 17 major U.S. markets, the CBS News Streaming Network, CBS News Streaming local platforms, local websites and cbsnews.com, under one umbrella. CBS News and Stations is home to the nation’s #1 news program 60 MINUTES, the CBS News Streaming Network, the first 24/7 digital streaming news network, the award-winning broadcasts CBS MORNINGS, CBS SATURDAY MORNING, the CBS EVENING NEWS WITH NORAH O’DONNELL, CBS SUNDAY MORNING, CBS WEEKEND NEWS, 48 HOURS and FACE THE NATION WITH MARGARET BRENNAN. CBS News and Stations provides news and information for the CBS Television Network, CBSNews.com, CBS News Radio and podcasts, Paramount+, all digital platforms, and the CBS News Streaming Network, the premier 24/7 anchored streaming news service that is available free to everyone with access to the internet. The CBS News Streaming Network is the destination for breaking news, live events, original reporting and storytelling, and programs from CBS News and Stations’ top anchors and correspondents working locally, nationally, and around the globe. CBS News’ streaming services, across national and local, amassed nearly 1 billion streams in 2022. Launched in November 2014 as CBSN, the CBS News Streaming Network is available on 30 digital platforms and apps, as well as CBSNews.com and Paramount+. The service is available live in 91 countries. CBS News and Stations is dedicated to providing the highest-quality journalism under standards it pioneered and continues to set in today’s digital age. CBS News earns more prestigious journalism awards than any other broadcast news division.

News Release

As States Prepare to Resume Disenrollments, Medicaid/CHIP Enrollment Will Reach Nearly 95 million in March, and the Pandemic-Era Enrollment Growth of 23 million Accounts for 1 in 4 Enrollees

Published: Mar 2, 2023

A new KFF analysis estimates that enrollment in Medicaid and the Children’s Health Insurance Program (CHIP) will have grown by 23.3 million enrollees, to nearly 95 million, by the end of March. That is when the federal continuous enrollment provision expires, and states can resume disenrollments, which have been paused since February 2020. Millions of beneficiaries are expected to be disenrolled over the next year, and the new estimates illustrate the extent to which enrollment could decline and who will be most affected.

Over half of the 23.3 million enrollment increase is among low-income adults under age 65 (56%), and nearly one-third is among children. According to the KFF estimates, the increase in low-income adults includes 8.9 million (38%) in the Affordable Care Act (ACA) Medicaid expansion group and 5.8 million (25%) other adults (mostly low-income parents) who do not qualify for Medicaid based on disability. Estimated enrollment increases have been smaller for adults eligible based on disability or age (1.3 million) and for CHIP enrollees (0.2 million).

It is expected that the groups that experienced the most growth due to the continuous enrollment provision—ACA expansion adults, other adults, and children—will see the largest enrollment declines.

The increase in enrollment is concentrated in a small number of states with large populations and, consequently, large Medicaid programs. Our analysis shows that California, New York, Texas, Florida, and Illinois account for over one-third of the increase in Medicaid/CHIP enrollment. Because Texas and Florida have not adopted the ACA Medicaid expansion, children and other adults account for higher percentages of enrollment gains in those states.

Growth rates in Medicaid/CHIP enrollment vary considerably by state, ranging from 22 percent in Connecticut to 81 percent in Oklahoma. States that implemented Medicaid expansion after 2020 (Oklahoma, Missouri, Nebraska, Utah, and Idaho) have particularly high enrollment growth.

The number and share of individuals who will be disenrolled across states is expected to vary, but studies estimate that between 5 percent and 17 percent of current enrollees might lose Medicaid coverage. (A previous KFF analysis estimates that between 5.3 million and 14.2 million people will lose Medicaid coverage during the unwinding of the continuous enrollment provision.)

As states start to resume renewal procedures for all current Medicaid enrollees, there is substantial uncertainty as to how much of the Medicaid enrollment growth during the pandemic will be sustained, how many people will transition to other coverage, and how many people could end up uninsured. Our recent analysis of coverage outcomes after disenrolling from Medicaid or CHIP found that nearly two-thirds of people experienced a period of uninsurance. Policies to smooth the transition from Medicaid to other coverage sources could reduce that rate as the Medicaid continuous enrollment period unwinds.

The analysis uses a combination of enrollment data from the Centers for Medicare and Medicaid Services (CMS) Performance Indicator Project (PI data), Medicaid claims data (T-MSIS data), and some state-specific data. (A detailed explanation of the methods is available in the paper.) While our estimates are based on the best available public data on states’ Medicaid and CHIP enrollment, they will likely differ somewhat from data maintained by individual states because we use modeling and assumptions to project enrollment through March 2023 and to allocate states’ adult enrollment across eligibility groups.

Medicaid Enrollment Growth: Estimates by State and Eligibility Group Show Who may be at Risk as Continuous Enrollment Ends

Authors: Alice Burns, Elizabeth Williams, Bradley Corallo, and Robin Rudowitz
Published: Mar 2, 2023

In the Consolidated Appropriations Act, 2023, signed into law at the end of 2022, Congress set an end to the Medicaid continuous enrollment provision on March 31, 2023 and phased down the enhanced federal Medicaid matching funds through December 2023. At the start of the pandemic, Congress enacted the Families First Coronavirus Response Act, which included a requirement that Medicaid programs keep people continuously enrolled during the COVID-19 public health emergency in exchange for enhanced federal funding. As a result, enrollment in Medicaid and the Children’s Health Insurance Program (CHIP) has grown substantially compared to before the pandemic, contributing to declines in the uninsured rate which dropped to the lowest level on record in early 2022. But, millions of people could lose coverage when the continuous enrollment provision ends, reversing recent gains in coverage.

This analysis estimates Medicaid enrollment growth by state and eligibility group between February 2020, before the pandemic, and March 31, 2023, at the end of the continuous eligibility period. These estimates can help paint a picture of the overall number and composition of enrollees who may risk coverage loss after the continuous enrollment provision ends. Prior to the continuous enrollment period, typical patterns of enrollment included disenrollments throughout the year. Some enrollees disenroll and then re-enroll within a short period of time (or “churn” in and out of Medicaid). The continuous enrollment provision halted disenrollment and churn, resulting in overall program growth. While states will need to conduct renewals for all enrollees, understanding the overall growth in enrollment and the composition of that growth can help inform understanding the range of potential outcomes as the continuous enrollment unwinds. How individual states implement the unwinding will affect the ultimate loss of coverage.

We use a combination of enrollment data from the Centers for Medicare and Medicaid Services (CMS) Performance Indicator Project (PI data), Medicaid claims data (T-MSIS data), and some state-specific data to inform the analysis (see Methods for a detailed explanation of the methods used in this analysis). While our estimates are based on the best available public data on states’ Medicaid and CHIP enrollment, they will likely differ somewhat from data maintained by individual states because we use modeling and assumptions to project enrollment through March 2023 and to allocate states’ adult enrollment across eligibility groups.

Distribution and Rates of Enrollment Growth By Eligibility Group

By the time the continuous enrollment period ends, we estimate that enrollment in Medicaid and CHIP will have grown by 23.3 million enrollees; nearly two-thirds of the enrollment increase is among low-income adults under age 65 (63%) and nearly one-third is among children (Figure 1, tab 1). The increase in low-income adults includes 8.9 million (38%) adults in the Affordable Care Act (ACA) Medicaid expansion group and 5.8 million (25%) other adults (mostly low-income parents) who do not qualify based on disability. Estimated enrollment increases have been smaller for adults eligible based on disability or age (1.3 million) and for CHIP enrollees (0.2 million).

Adults are experiencing the highest rates of enrollment growth during the continuous enrollment period (Figure 1, tab 2). There are very low rates of growth in CHIP, likely because the continuous enrollment provision does not apply to separate CHIP programs and some children may be moving from CHIP into Medicaid. Several factors contribute to the variation in growth rates among Medicaid eligibility groups. First, several states newly expanded Medicaid under the ACA during the continuous enrollment period resulting in high enrollment growth in those states. Adult groups and children typically experience higher rates of churn, which is when enrollees disenroll and then re-enroll within a short period of time and may occur due to temporary changes in income or administrative barriers during renewal that may result in a lapse in coverage even if an individual remains eligible for Medicaid. A recent KFF analysis found that churn rates for children more than doubled following annual renewal, signaling that many eligible children lose coverage at renewal. By halting disenrollment, the continuous enrollment provision has also halted this churning among Medicaid enrollees. People who qualify based on age or disability are historically less likely to churn on and off Medicaid as they are more likely to live on fixed income and therefore, less likely to experience changes in eligibility.

Medicaid Children, Adults Eligible through the ACA, and Other Adults Comprised the Vast Majority of New Enrollment Growth

Distribution and Rates of Enrollment Growth By State

The increase in enrollment is concentrated in a small number of states with large populations and consequently large Medicaid programs. Our analysis shows that California, New York, Texas, Florida, and Illinois account for over one-third of the increase in Medicaid/CHIP enrollment (Figure 2, tab 1). Because Texas and Florida have not adopted the ACA Medicaid expansion, children and other adults account for higher percentages of enrollment gains in those states (Appendix Table 1).  

Growth rates in Medicaid/CHIP enrollment vary considerably by state (Figure 2, tab 2). Rates range from 22% in Connecticut to 81% in Oklahoma. States that implemented Medicaid expansion after 2020 (Oklahoma, Missouri, Nebraska, Utah, and Idaho) have particularly high enrollment growth. Beyond Medicaid expansion, several factors may contribute to variation including:

  • Churn rates prior to the pandemic (states with higher rates of churn would be likely to have faster growth on account of the continuous enrollment provision),
  • The economic effects of the pandemic (in states where more people are out of work, enrollment growth may be faster), and
  • State policies to conduct outreach about coverage (states that increased outreach efforts during the pandemic are likely to experience faster growth).
Five States Comprised Over One-Third of All New Enrollment Growth

Looking Ahead to Unwinding

We estimate Medicaid/CHIP enrollment will reach nearly 95 million in March 2023, with enrollment growth since February 2020 accounting for one in four enrollees (Appendix Table 1). While the number of Medicaid enrollees who may be disenrolled during the unwinding period is highly uncertain, studies estimate that between 5% and 17% of current enrollees might be disenrolled. Earlier KFF analysis estimates that between 5.3 million and 14.2 million people will lose Medicaid coverage during the unwinding of the continuous enrollment provision. These projected coverage losses are consistent with, though a bit lower than, estimates from the Department of Health and Human Services (HHS) suggesting that as many as 15 million people will be disenrolled.

It is expected that the groups that experienced the most growth due to the continuous enrollment provision—ACA expansion adults, other adults, and children—will experience the largest enrollment declines. In states that haven't expanded Medicaid, many low-income parents and new mothers will be most at risk of losing coverage. HHS estimates that of those disenrolled, 6.8 million will likely still be eligible. Many children may remain eligible even if their parents are no longer eligible because most states’ income limits for children are considerably higher than for adults, and many adults eligible based on disability or age (65+) may remain eligible if they are living on fixed incomes.

Actual enrollment outcomes will vary across states depending on an array of state policy decisions including how states prioritize renewals and efforts to conduct outreach and enrollment assistance. These policies can help ensure that those who remain eligible for Medicaid are able to retain coverage, and that those who are no longer eligible can transition to other sources of coverage, particularly the ACA marketplace. Our state-by-state estimates of enrollment gains by eligibility group can help illustrate how many people are at risk of coverage loss (for enrollment increases by state and eligibility group see Appendix Table 1). As states start to resume renewal procedures for all current Medicaid enrollees, there is substantial uncertainty as to how much of the Medicaid enrollment growth during the pandemic will be sustained, how many people will transition to other coverage, and how many people could end up uninsured. Because a large share of people are covered by Medicaid, including an analysis that shows that over half of all children are covered by Medicaid and CHIP, declines in Medicaid coverage could directly impact the number of uninsured. Our recent analysis of coverage outcomes after disenrolling from Medicaid or CHIP found that nearly two-thirds of people experienced a period of uninsurance. Policies to smooth the transition from Medicaid to other coverage sources could reduce that rate as the Medicaid continuous enrollment period unwinds.

Appendix Table

Estimated Enrollment Growth From February 2020 to March 2023, by Eligibility Group and State

Methods

Data: This analysis uses date from the Centers for Medicare and Medicaid Services (CMS) Performance Indicator Project Data (PI data) and the T-MSIS Research Identifiable Demographic-Eligibility (T-MSIS data). We used PI data from February 2020 through August 2022 and TMSIS data from 2019, Release 1.

Overview of Approach: To estimate enrollment by state and eligibility through the end of the continuous eligibility period (March 2023), we:

  • Use PI data through August 2022 to estimate enrollment by subpopulation (Medicaid child, Medicaid adult, and CHIP),
  • Estimate growth in Medicaid through March 2023 assuming growth continues at a similar pace to last summer, and
  • Apportion enrollment among Medicaid adults to eligibility groups with T-MSIS data.

Definitions and Limitations: Our estimates are likely to be very similar to states’ PI-reported enrollment for Medicaid children, Medicaid adults, and CHP enrollees, but will differ from estimates of enrollment maintained by individual states. There are three primary reasons for these differences: the exclusion of some enrollees, the use of age-based eligibility for children, and our estimates of adult enrollment by eligibility group use a national model and our own assumptions. Specifically:

  • The PI enrollment data exclude people who are not eligible for full Medicaid coverage, such as enrollees who are only eligible for coverage of Medicare premiums, family planning services, or emergency care. Such enrollees are excluded from the enrollment totals in this analysis, resulting in lower estimates of total enrollment than in data maintained by individual states.
  • We define children as Medicaid enrollees who are grouped with children in the PI data, which are based on age rather than eligibility group.
  • We use national growth rates from a simulation model that estimates how enrollment would change under a continuous enrollment scenario for Medicaid enrollees over age 18 in all states. There is great uncertainty as to how enrollment will change over the three-year continuous enrollment period and the simulation model relied on an 11-month observation period.

We provide more detail about each step in the details below.

1. Enrollment Among Groups: The PI data provide state enrollment for all Medicaid and CHIP adults, all children (defined as anyone under the age of 19), and everyone in CHIP.

  • We removed CHIP enrollees from the Medicaid adult and child groups using T-MSIS data to estimate the percent of CHIP enrollees who are children in each state.
  • Arizona did not report separate adult and child enrollment but did report total Medicaid and CHIP enrollment. We used the 2019 T-MSIS data to apportion Arizona’s enrollment among the child and adult populations.

2. Estimated Growth Through March 2023. From step 1, we had monthly enrollment by state for Medicaid adults, Medicaid children, and all CHIP enrollees.

  • We projected growth through March 2023 at the national level for each subpopulation using growth rates from May 2022 through August 2022.
  • We allocated national enrollment to states using the enrollment distributions from August 2022 for Medicaid adults, Medicaid children, and all CHIP enrollees.

3. Apportion Adult Enrollment to Eligibility Categories. We divided Medicaid adult enrollment into eligibility groups using the T-MSIS data. We analyzed these eligibility groups separately because enrollment patterns of adults eligible based on age or disability are different from those of other adults.

  • We used the T-MSIS data from 2019 to estimate the eligibility group distribution for of adult Medicaid enrollees in each state as of February 2020.
  • We used a simulation model with T-MSIS data to estimate enrollment growth by eligibility group in 2019 under a scenario in which enrollees were not disenrolled unless they died or moved out of state. This model is similar to our earlier analyses of enrollment during continuous enrollment period, but differs in that earlier analyses did not match the PI data and did include enrollees who were eligible for partial benefits.
      • We restricted the analysis to adults ages 19 and older who were eligible for full Medicaid benefits and deduplicated enrollees with multiple periods of enrollment in 2019.
      • We identified deaths and inter-state moves in the Demographic-Eligibility file.
      • We conducted a sensitivity analysis with 2018 T-MSIS data and found similar results.
  • We used the outputs from the simulation model to estimate the growth rates for each adult eligibility group during the continuous enrollment period and then scaled those eligibility-group specific growth rates so that the weighted average of groups’ rates equaled the growth rates we observed in the PI data.
  • We projected eligibility-group enrollment among adults using the scaled growth rates and calibrated the totals so that total adult enrollment continued to equal the enrollment states reported in the PI data.
  • We used the projected enrollment by adult eligibility groups to estimate how the composition of adult Medicaid enrollees changed during the continuous enrollment period. We applied the changes in the distribution of adult enrollees to each state’s adult enrollment distribution from 2019.
  • We assumed the major distributional changes occurred between February 2020 and September 2022, that distribution changes slowed during FY 2022, and that by FY 2023, enrollment growth was similar among all eligibility groups.
  • The T-MSIS data did not include adults in the ACA group for Virginia which expanded Medicaid in 2019 or for states that expanded Medicaid after 2019: Idaho (2020), Missouri (2022), Nebraska (2020), and Oklahoma (2022). For those states, we used publicly available data to estimate the percentage of adults enrolled in ACA coverage and adjusted enrollment in the other groups proportionally.
News Release

As Debate Heats Up in Washington Over Possible Entitlement Cuts, A New KFF Analysis Details the 30% of Federal Spending That Goes to Health Care Programs

Published: Mar 1, 2023

As some policymakers in Washington are pushing to reduce the federal deficit and debt, a new KFF resource provides a concise explanation of federal spending for domestic and global health programs and services, which could be part of any conversation about curbing federal spending.

Federal spending on health programs and services accounted for 30 percent of net federal spending in fiscal year 2022 — or $1.7 trillion out of a total of $5.9 trillion. Specifically, Medicare accounted for 13 percent of the total, Medicaid and CHIP accounted for 10 percent, other domestic health spending accounted for 5 percent, hospital and medical care for veterans was 2 percent, and global health was 0.1 percent. (By comparison, Social Security accounted for 21 percent of net federal spending that year, while defense accounted for 13 percent.)

The large majority of federal health spending (86%, or $1.5 trillion) is mandatory spending that is not subject to annual appropriations votes by Congress. This includes nearly all Medicare spending, federal spending on Medicaid and CHIP (which are jointly funded by states and the federal government), and part of the money devoted to premium tax credits for coverage through the ACA Marketplaces, among other categories of spending.  Medicare accounts for half of mandatory spending on federal health programs and services, while Medicaid accounts for another 37 percent.

The federal government also provides several tax benefits that support health-related activities, known as tax expenditures because they result in lower federal tax revenues.

Some Republican lawmakers have pushed for reductions in future federal spending as part of a deal to raise the debt limit. The Biden Administration has said it will not negotiate spending reductions as part of debt limit talks but is open to separate discussions about approaches to debt and deficit reduction.

Members of both major political parties have indicated that cuts to Social Security and Medicare are “off the table” in these discussions, leaving open the question of whether Medicaid, the ACA’s premium tax credits, and possibly other health programs and services could be targeted for spending reductions.

Our FAQs answer basic questions about health spending and the federal budget and budget enforcement tools, including the debt limit and sequestration. We include detailed explanations and charts about what counts as mandatory spending and what falls into the category of discretionary spending. The debt limit itself does not directly affect levels of spending by the federal government, including mandatory and discretionary health spending.

News Release

New Data Show Increased Outreach to 988 Following Implementation of the Number for the National Suicide Prevention and Crisis Hotline

National 988 Answer Rates Were at 91% But There was Considerable Variation in “In-State” Answer Rates

Published: Feb 28, 2023

A KFF analysis finds that outreach to the new 988 number for the national suicide prevention and crisis hotline increased after its implementation in mid-July, then steadied until December 2022, when it rose again. Text volume increased more than 700 percent compared to the year prior but remains a smaller share of overall outreach.

Since the launch of 988, Lifeline has received over 2.1 million contacts—consisting of over 1.43 million calls, over 416,000 chats, and more than 281,000 texts.

The easy-to-remember three-digit number steers callers who are suicidal or experiencing a behavioral health crisis to the renamed 988 Suicide & Crisis Lifeline, where they can be connected to a local Lifeline counselor and may receive crisis counseling, resources, and referrals. Before 988, the Lifeline crisis hotline–established in 2005–was typically accessed through a 10-digit number, which was difficult for callers experiencing a mental health crisis to recall.

The analysis shows that nationally, about 10 percent of calls are transferred to out-of-state overflow facilities and 11 percent are abandoned by the caller. However, the 988 in-state answer rate varies widely across states. In December 2022, in-state answer rates ranged from a low of 51 percent to 69 percent in seven states to a high of 90 percent to 98 percent in 13 states.

As states debate their FY 2024 budgets, long-term funding of local 988 crisis call centers may become an issue. Although the federal government spent money to assist with the implementation of 988, ongoing funding relies heavily on local and state funds. To date, five states have chosen to enact legislation for 988 telecommunication fees that could provide ongoing funding for local crisis call centers. Longer term, additional state and national crisis center metrics related to the referral source, reason, outcome and user experience of using 988 may help inform the 988 implementation and future program improvements.

News Release

Medicare Advantage Insurers Report Much Higher Gross Margins Per Enrollee Than Insurers in Other Markets

Published: Feb 28, 2023

A new analysis of health insurers’ 2021 financial data shows that insurers continue to report much higher gross margins per enrollee in the Medicare Advantage market than in other health insurance markets.

The analysis examines insurers’ financial data in the Medicare Advantage, Medicaid managed care, individual (non-group), and fully insured group (employer) markets.

In 2021, Medicare Advantage insurers reported gross margins averaging $1,730 per enrollee, at least double the margins reported by insurers in the individual/non-group market ($745), the fully insured group/employer market ($689), and the Medicaid managed care market ($768).

For Medicare Advantage insurers, the gross margins per enrollee in 2021 were similar to the period before the COVID-19 pandemic. Margins per enrollee for the individual and group markets in 2021 were below pre-pandemic levels, while the margins per enrollee for Medicaid managed care insurers are higher.

The high margins per member for Medicare Advantage insurers occur following years of rapid growth in the market, with more than half of eligible beneficiaries expected to enroll in Medicare Advantage plans this year.

The analysis also examines the percentage of premium income that insurers pay out in claims, also called the medical-loss ratio, and finds insurers across the four markets reported similar medical-loss ratios in 2021.

“Health Insurer Financial Performance in 2021” is available online.