Women’s Health Care Affordability Challenges
Findings from the 2026 KFF Women's Health Survey
Findings
Affordability has dominated national conversations. High inflation rates, increased gas and grocery prices, and the constant rise in health care costs and insurance premiums have emerged as major political issues. Historically, national surveys find that many Americans report difficulties affording health care and have problems paying for health care services, particularly women, who have lower incomes, fewer financial resources, and use the health care system more than men. In recent years, people with health coverage have increasingly experienced difficulties affording care. The 2026 KFF Women’s Health Survey was fielded between March 11, 2026 to April 14, 2026 to better understand women’s experiences accessing and using health care services including barriers to care. The survey is a nationally representative survey of 4,688 women, ages 18 to 64, and 1,148 men, ages 18 to 64. This brief provides new information about the affordability challenges women report experiencing in the past 12 months and their impact on access and utilization of health care services.1
Key Findings
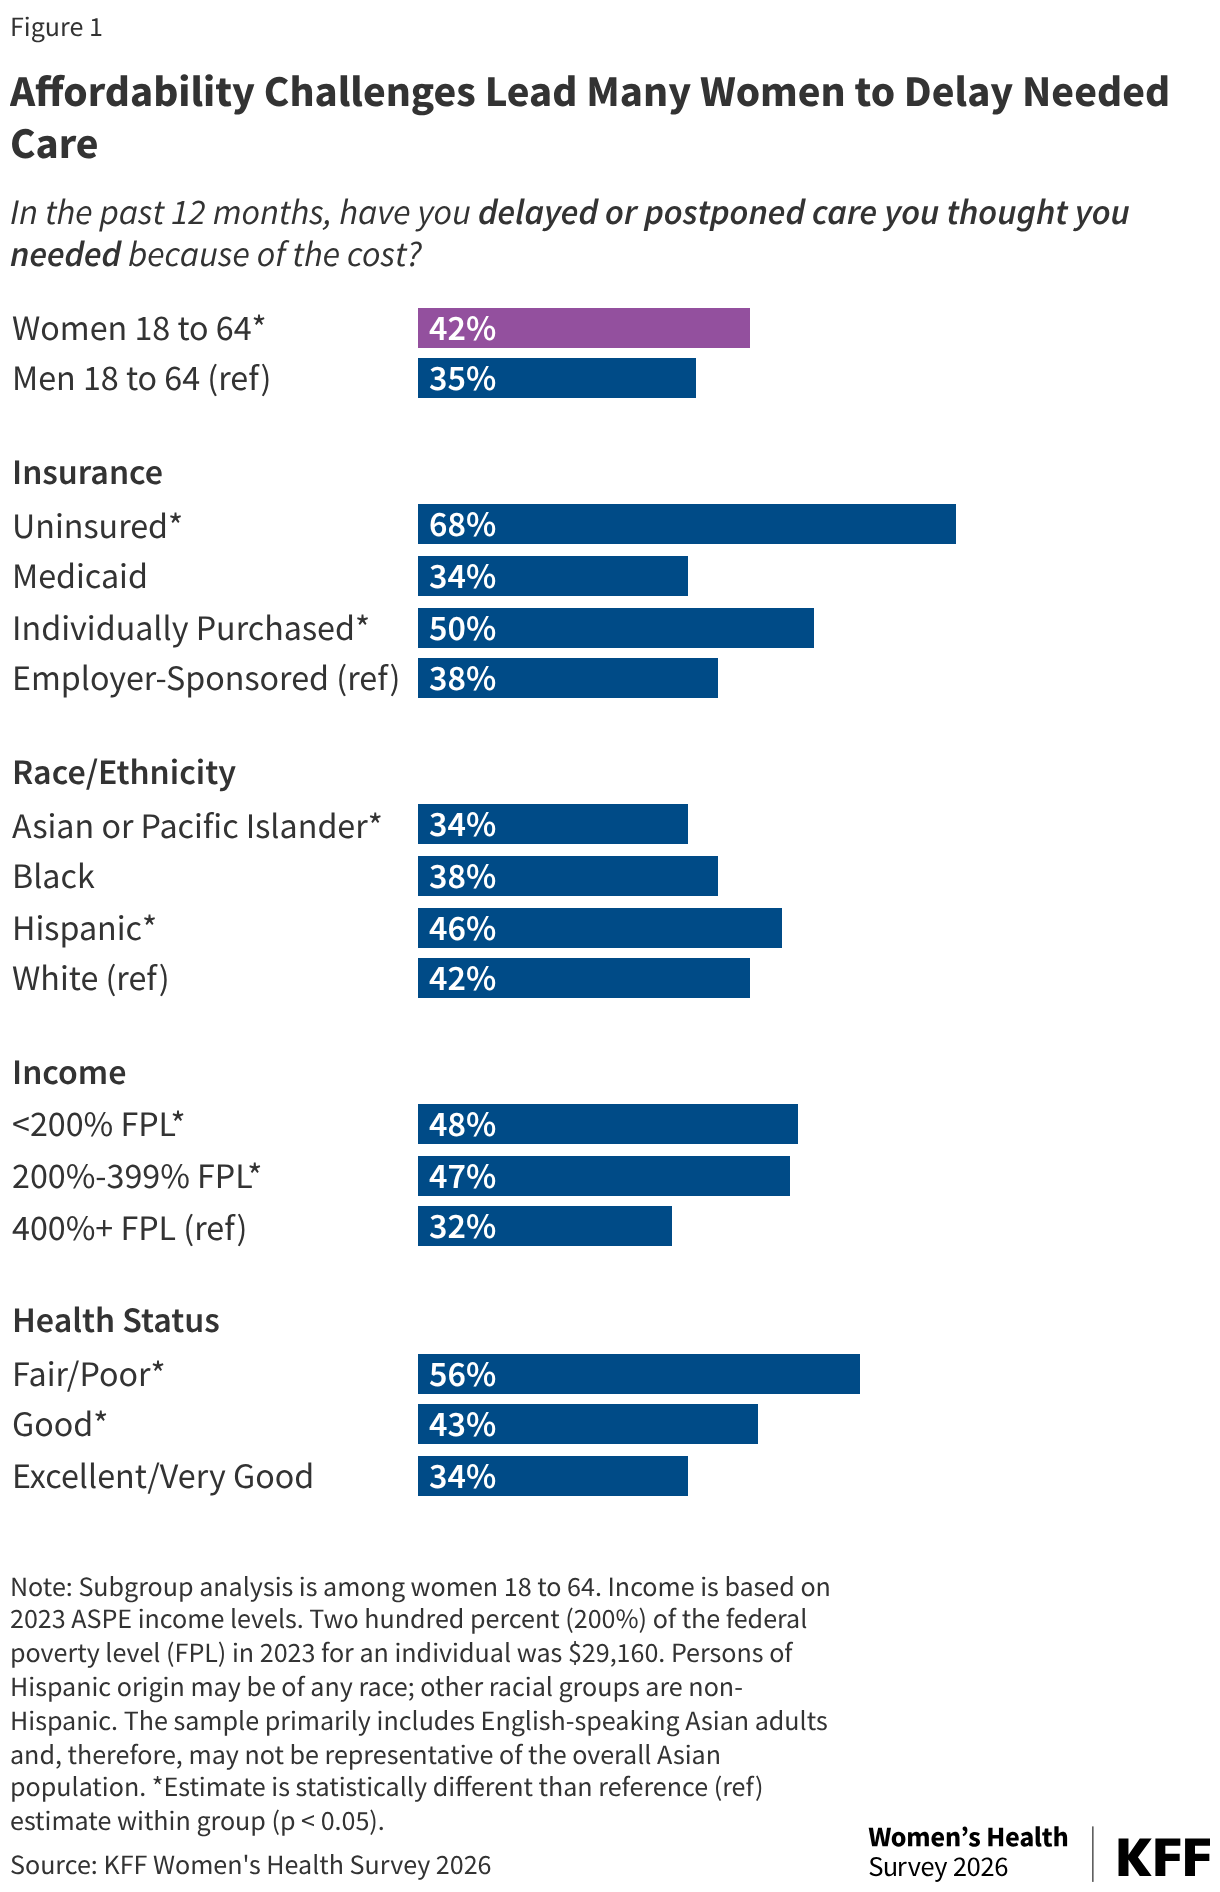
- Many women, even those with insurance coverage, have delayed or postponed care they thought they needed in the past 12 months because of cost. Four in ten (42%) women, ages 18-64, and 35% of men, ages 18-64, report they have delayed or postponed care they thought they needed in the past year. While about two-thirds (68%) of uninsured women report putting off needed care due to costs, those with insurance are not immune from this problem. Half of women with individually purchased plans and a third of women with Medicaid (34%) and employer sponsored coverage (38%) report delaying or postponing needed care because of cost.
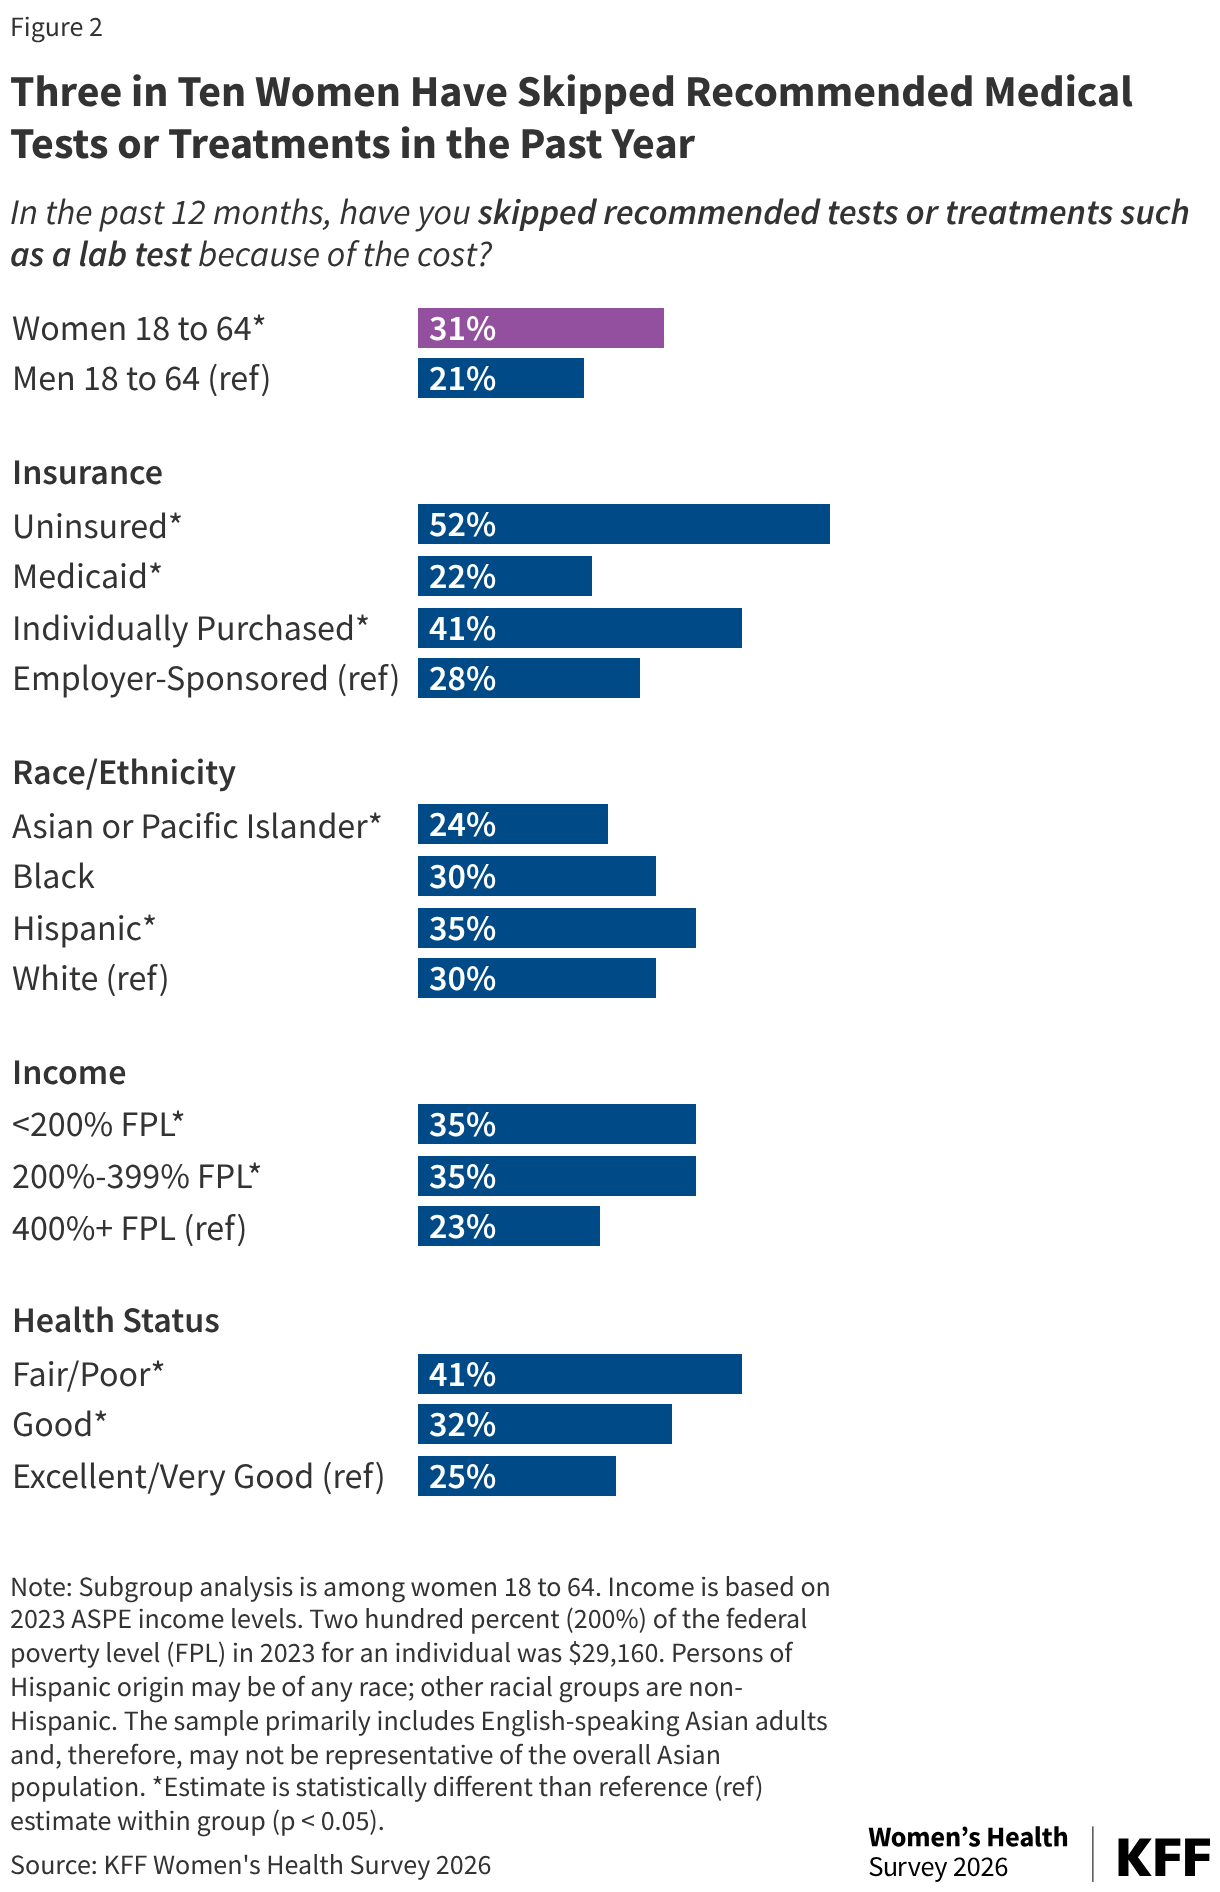
- The cost of care is a barrier to a sizable minority of women in getting specific recommended tests and treatments. Three in ten (31%) women ages 18 to 64 report they have skipped or postponed recommended medical tests or treatments in the past year because of costs. Higher shares of uninsured women, women with low or modest incomes, and those with self-reported fair or poor health report skipping or postponing tests or treatments due to the costs of care.
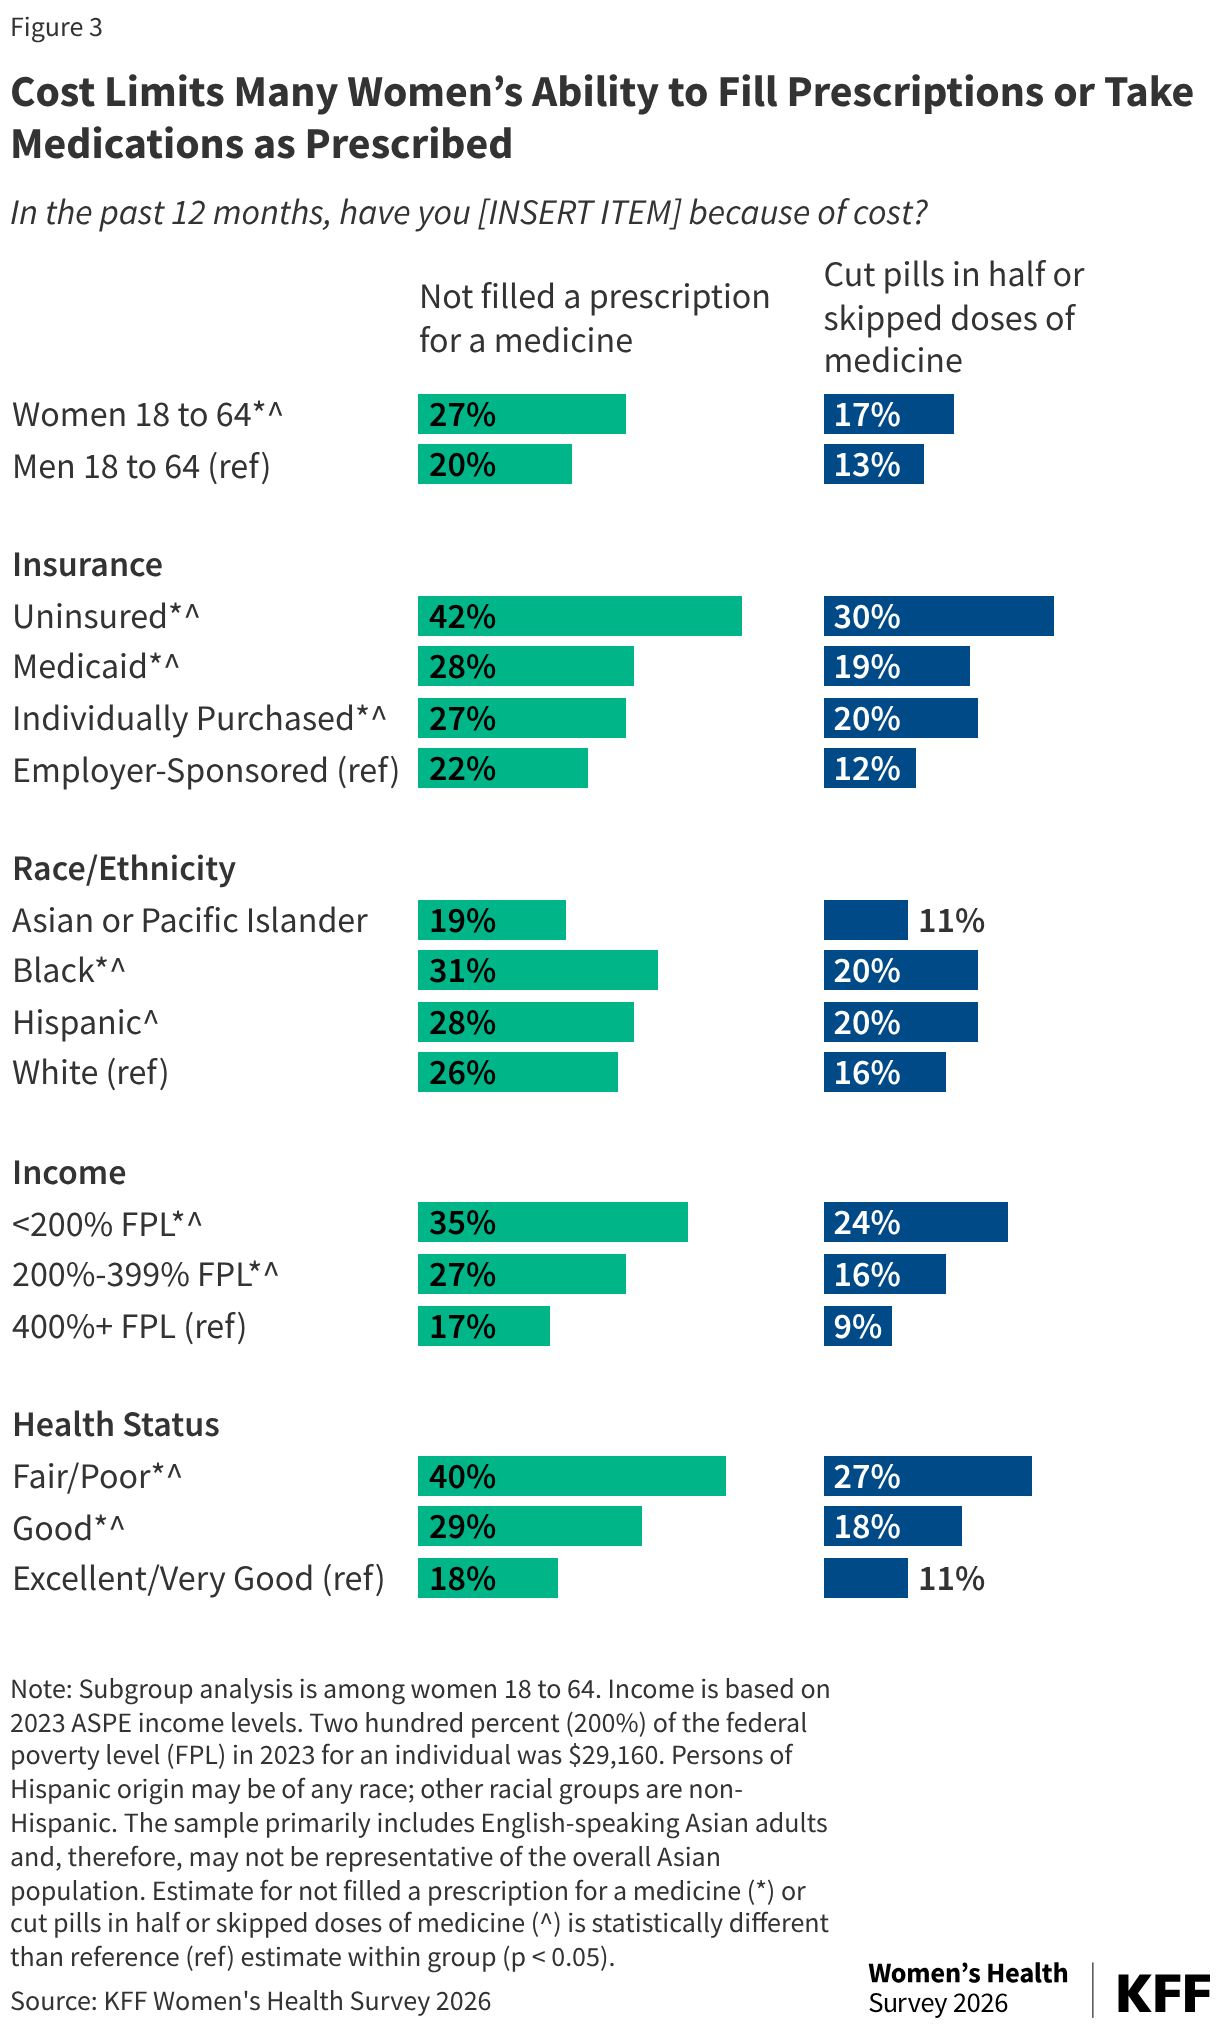
- The cost of prescription drugs leads some women to alter their prescription drug use by not filling prescriptions, skipping doses, or cutting pills in half. A quarter (27%) of women ages 18 to 64 report they didn’t fill a prescription in the last year because of cost and almost a fifth (17%) report they cut pills in half or skipped doses of medicine because of cost. Four in ten women in fair or poor health didn’t fill prescriptions and one quarter cut pills or skipped doses because of costs.
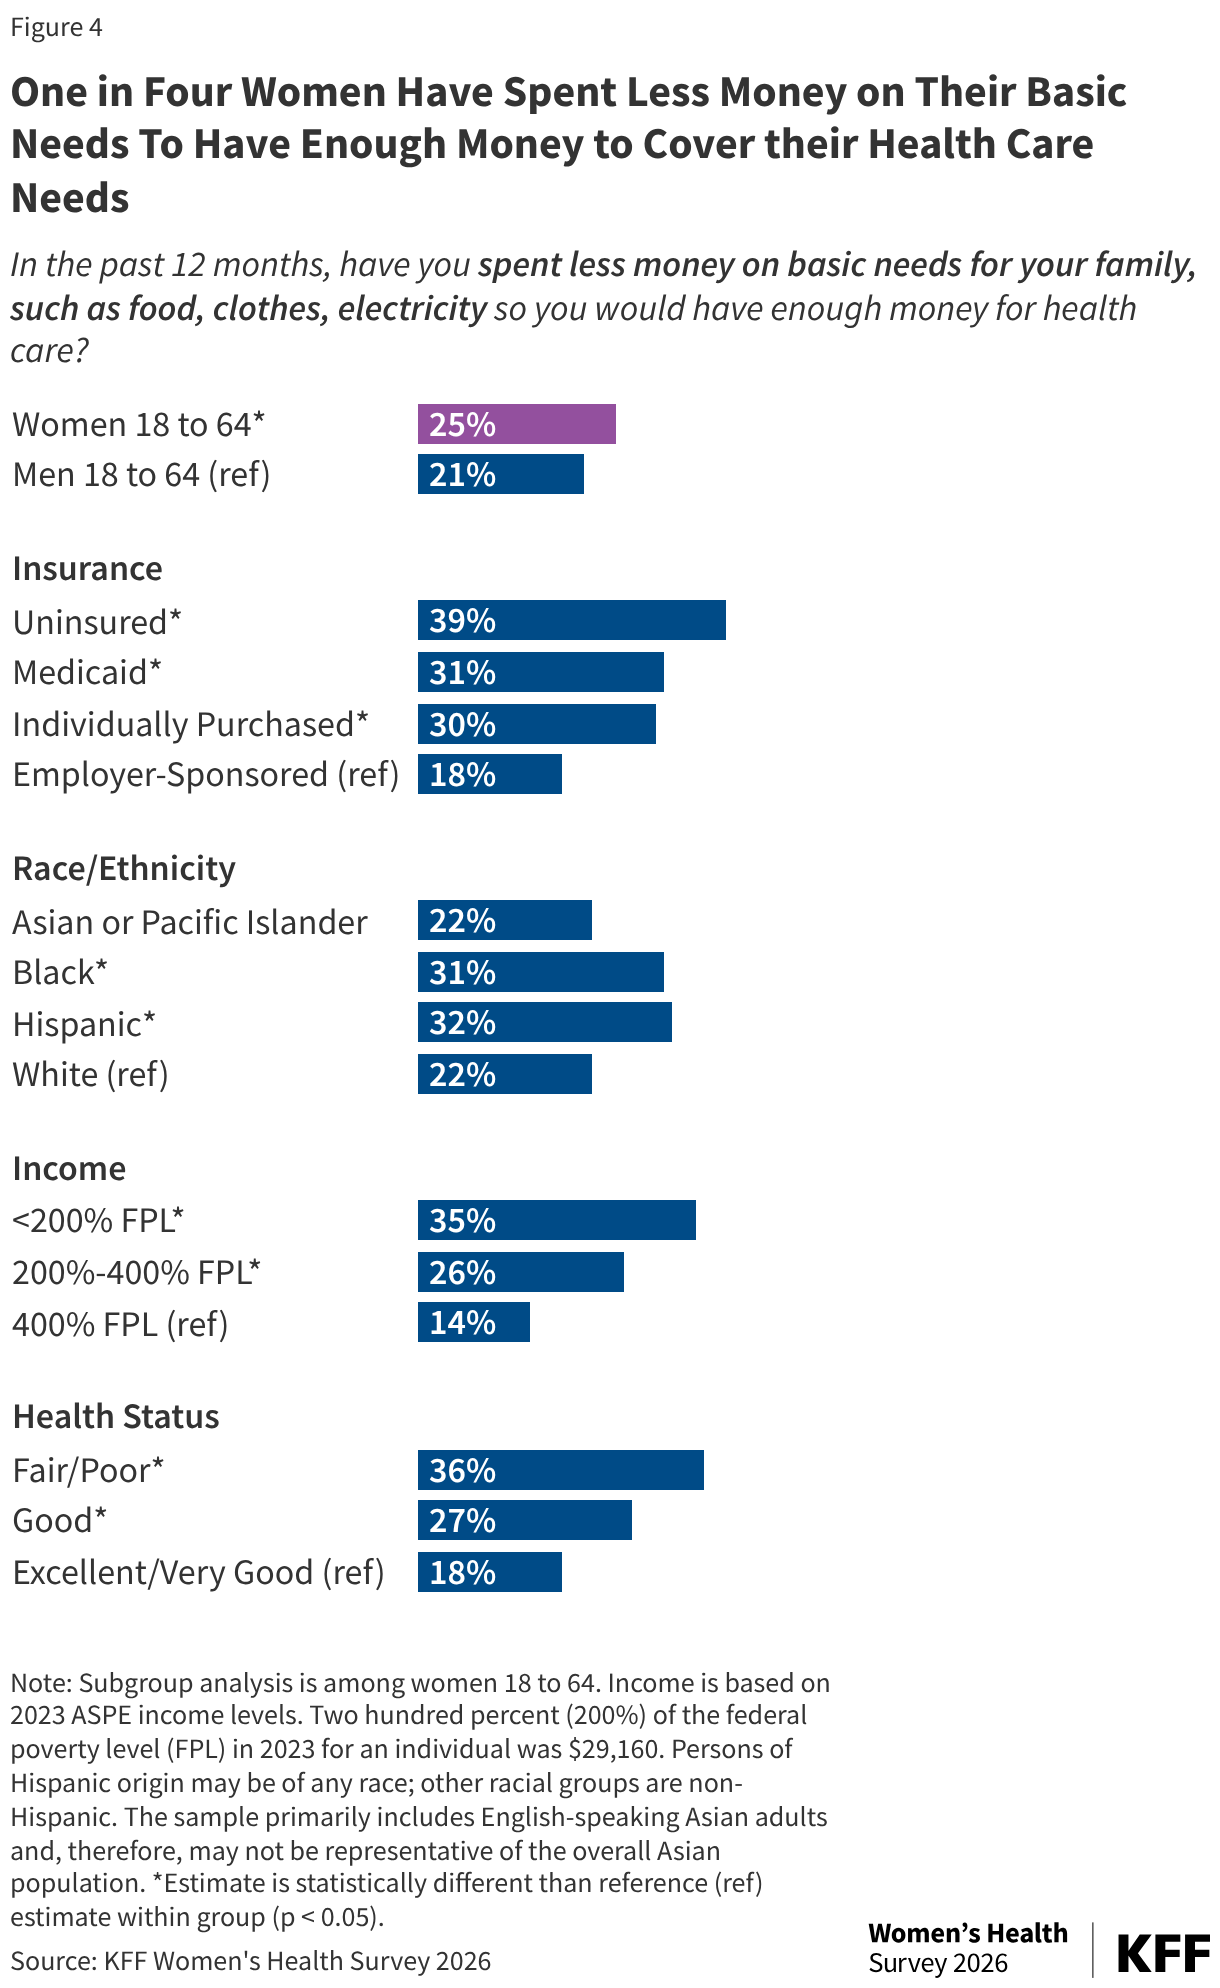
- Health care costs can force some women to make tradeoffs in paying for other basic needs. One in four (25%) women ages 18 to 64 report that in the past 12 months they have spent less money on their basic needs, such as food, clothes and electricity so they could have enough money for health care. Among uninsured women, the share was 42%. Approximately three in ten women on Medicaid or with individually purchased insurance, who were Black or Hispanic, low-income or in fair or poor health report making health-related financial tradeoffs.
Affordability Challenges
Four in ten (42%) women report that they delayed or postponed care they thought they needed because of the cost in the last 12 months. While women and men both can feel the impact of health costs, such as insurance premiums, co-payments, and deductibles, they can be particularly burdensome for women who on average earn lower wages, have fewer financial assets, accumulate less wealth, and have higher rates of poverty than men. Four in ten (42%) women and 35% of men ages 18 to 64 report they have delayed or postponed care they thought they needed. One in three women (31%) report they have skipped recommended tests or treatments, over a quarter (27%) report they haven’t filled a prescription for a medicine, and 17% report they have cut pills in half or skipped recommended doses of medicine, all because of cost. Half of women and four in ten (42%) men report one of these cost delays or gaps in the past 12 months.
Many women, even those with insurance coverage, report having delayed or postponed care because of cost. Nearly seven in 10 (68%) uninsured women say theydelayed or postponed care in the past 12 months because of the cost. While younger adults, those with lower incomes, poor health and people of color have higher uninsured rates, even after controlling for these characteristics in a regression model, the association between being uninsured and delaying or postponing care remains. Even women with insurance are susceptible to cost barriers (Figure 1). Half of women ages 18 to 64 with individually purchased plans, which often have higher deductibles and premiums as well as narrower networks, report cost was a reason for delaying or postponing care in the past 12 months, as do 38% of women with employer sponsored plans. Medicaid, the national health coverage program for people with low incomes, is supposed to have only nominal out of pocket costs, but a third (34%) of women with Medicaid coverage also say they had to delay or postpone care due to costs. While Medicaid copayments are modest, they could still be a financial burden for low-income people. Women could also face challenges paying for uncovered services or services during a period when they were uninsured. Women with lower incomes, Hispanic women, and women with fair/poor and good health are also more likely to report having delayed or postponed care in the past year.
High costs can cause many women to skip specific recommended tests and treatments, even women with health coverage. Half (52%) of uninsured women ages 18 to 64 report skipping recommended tests or treatments due to cost, as do four in ten (41%) of women with individually purchased health plans, three in 10 (28%) women with employer sponsored plans, and one in five (22%) of women with Medicaid coverage (Figure 2). Higher shares of women with self-reported fair/poor health (40%) or good health (32%) report skipping recommended tests or treatments in the past year compared to a quarter of women (23%) who rate their health as excellent/ very good. Hispanic women and women with low or modest incomes (up to 399% FPL) are also more likely to report skipping recommended services compared to their White and higher income counterparts.
Cost limits women’s ability to fill their prescriptions or take their medications as prescribed. The majority of women ages 18 to 64 (62%) report they take at least one prescription medication on a regular basis, yet many women report issues affording prescription drugs. A quarter (27%) of all women ages 18-64, report they didn’t fill a prescription in the last year and almost a fifth (17%) report they cut pills in half or skipped doses of medicine because of cost. Among the share who report currently taking a prescription medication, the share who say they have not filled a prescription increases to 32% and one in five say they have cut pills in half or skipped doses in the past year because of cost.
Women with self-reported fair/poor and good health and women with lower incomes are more likely to report they have either not filled a prescription or taken medications as prescribed. A higher share of uninsured women report not filling a prescription (42%) or taking medication as prescribed (17%), but substantial shares of insured women also report having trouble with their prescriptions because of cost in the past 12 months (Figure 3).
Health care costs can force women to make tradeoffs in paying for other basic needs. One in four (25%) women ages 18 to 64 report that in the past 12 months they have spent less money on their basic needs, such as food, clothes and electricity so they could have enough money for health care (Figure 4). Four in ten (39%) women without insurance and three in ten women with Medicaid (31%) coverage and individually purchased coverage (30%) report spending less in their basic needs to have enough money for health care compared to one in five (18%) women with employer-sponsored plans. This is more common amongwomen with lower incomes, Black and Hispanic women, as well as women with poorer self-reported health status.
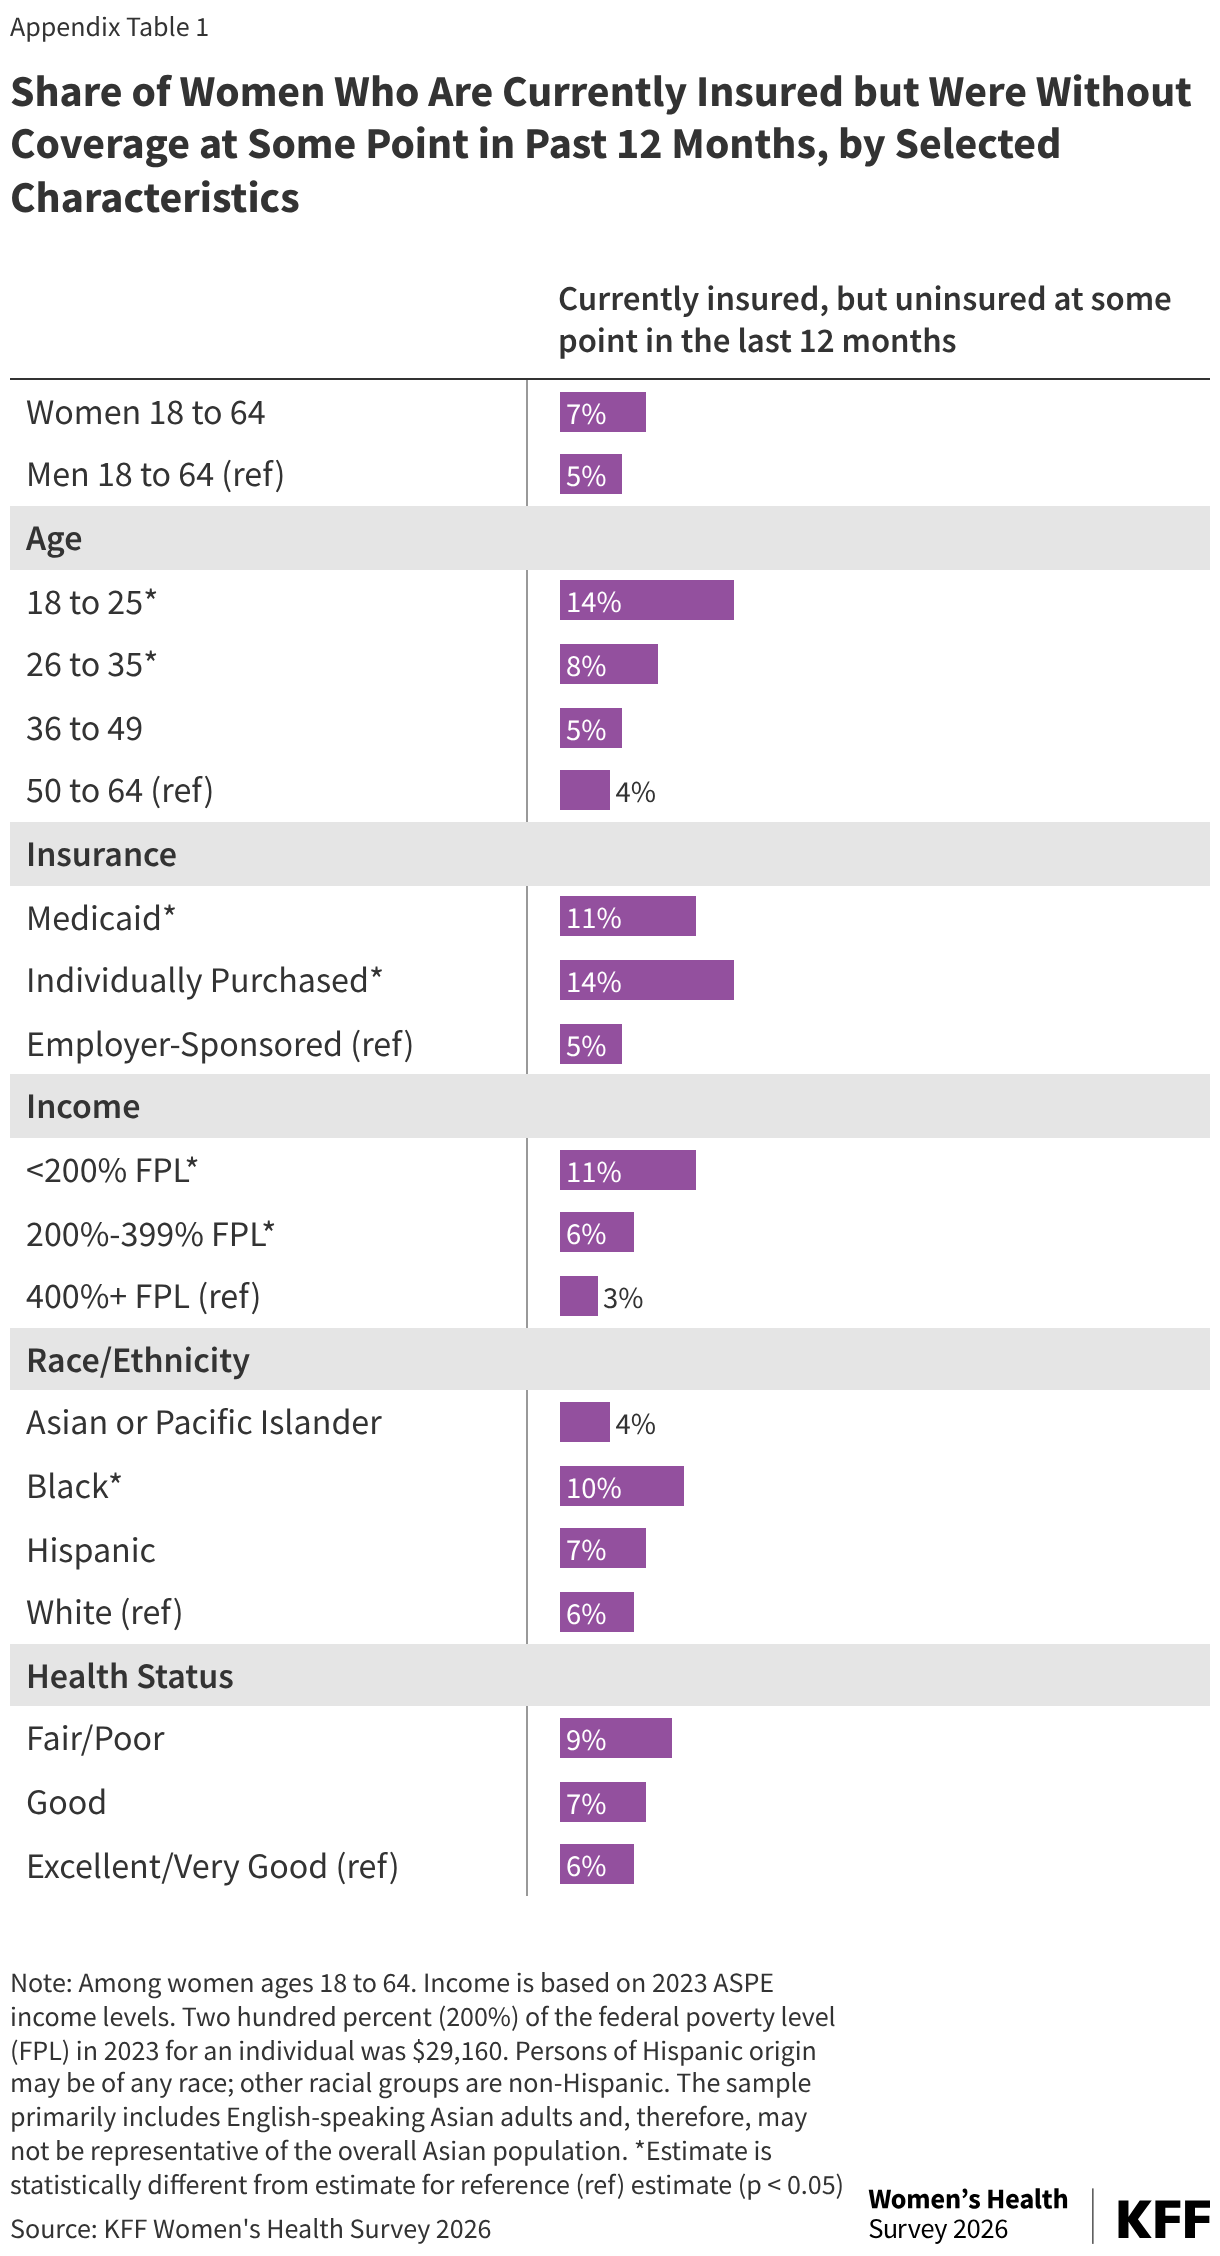
The majority of women 18 to 64 report they are insured, but almost one in five women 18 to 64 (18%) report they are either currently uninsured or were uninsured at some point in the past 12 months. Health insurance coverage is an important factor in making health care affordable and accessible to women.Seven percent of women say they are currently insured but were uninsured at some point during the past 12 months. Women can be uninsured for periods of time because of job loss or change, premium prices becoming unaffordable, or in the case of dependent coverage, a spouse’s job loss, divorce, or widowhood. Younger women, women with lower incomes and women with poor/fair health are uninsured at higher rates and larger shares report being currently insured but having been uninsured at some point during the year (Appendix Table 1).
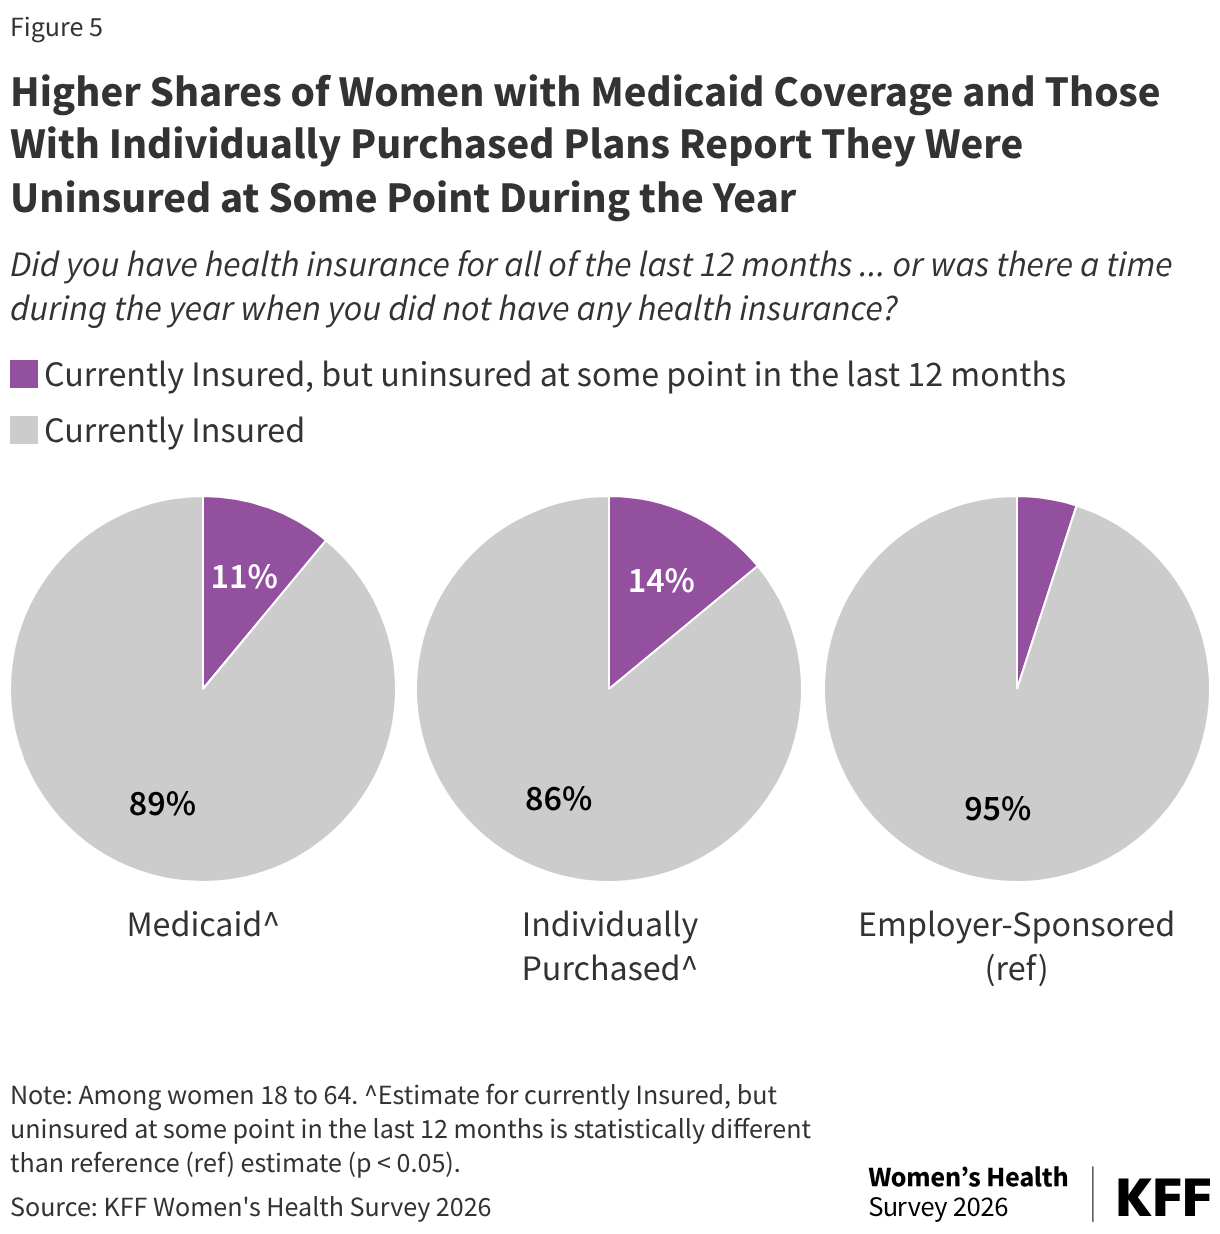
Women with Medicaid coverage (11%) and those with individually purchased private plans (14%) are more likely to report having been uninsured at some point in the past 12 months compared to women covered by an employer-sponsored plan (5%) (Figure 5). In the coming years, the number of uninsured is expected to increase significantly due to recent federal policy changes in Medicaid and the expiration of the ACA enhanced tax credits. Many women with Medicaid coverage and ACA marketplace plans will be directly impacted by these policy changes and will likely see more periods without insurance coverage.
Appendix
Methodology
The 2026 KFF Women’s Health Survey was designed and analyzed by women’s health researchers at KFF. The survey was conducted from March 11 – April 14, 2026, online and by telephone among a nationally representative sample of 5,854 adults ages 18 to 64, including 3,538 women ages 18 to 49. Women include anyone who selected woman as their gender. Sampling, data collection, weighting, tabulation, and IRB approval by the University of Southern Maine’s Collaborative Institutional Review Board were managed by SSRS of Glenn Mills, Pennsylvania in collaboration with women’s health researchers at KFF.
Throughout the reports of findings, we refer to “women.” This includes respondents who said their gender is “woman,” and includes those who selected “woman” in addition to another gender, such as “transgender,” or “non-binary,” or another gender. We followed this approach to try to include as many people as possible but recognize that some people who need and seek abortion and other reproductive health care services may not be represented in the findings or identify as women. Some questions about sexual and reproductive health were only asked among those with a specific sex assigned at birth (i.e. male or female).
The national sample was drawn from two nationally representative probability-based panels: the SSRS Opinion Panel and the Ipsos Knowledge-Panel. The SSRS Opinion Panel is a nationally representative probability-based panel where panel members are recruited randomly in one of two ways: (a) Through invitations mailed to respondents randomly sampled from an Address-Based Sample (ABS) provided by Marketing Systems Groups (MSG) through the U.S. Postal Service’s Computerized Delivery Sequence (CDS); (b) from a dual-frame random digit dial (RDD) sample provided by MSG. For the online panel component, invitations were sent to panel members by email followed by up to five reminder emails. 5,660 panel members completed the survey online and panel members who do not use the internet were reached by phone (n=194). Another 514 respondents were reached online through the Ipsos Knowledge Panel to help reach adequate sample sizes among subgroups of interest, specifically women ages 18 to 49. This panel is recruited using ABS, based on a stratified sample from the CDS. The questionnaire was translated into Spanish, so respondents were able to complete the survey in English or Spanish.
The national sample was weighted by splitting the sample into three groups: [1] Women 18-49, [2] Women 50-64, and [3] Men 18-64 and each group was separately weighted to match known population parameters (see table below for weighting variables and sources). Weights within the three groups were then trimmed at the 4th and 96th percentiles, to ensure that individual respondents do not have too much influence on survey-derived estimates. After the weights were trimmed, the samples were combined, and the weights adjusted, so that the groups were represented in their proper proportions for a final combined, gender by age-adjusted weight.
| Dimensions | Source |
| CPS 2024 Voting and Registration Supplement | Current Population Survey 2025 |
| Education | |
| Age by Education | |
| Age by Gender | |
| Census Region | |
| Race/Ethnicity by Nativity | |
| Home Tenure | |
| Civic Engagement | 2023 CPS Volunteering and Civic Life Supplement |
| Internet Frequency | Pew Research Center’s National Public Opinion Reference Survey (NPORS 2025) |
| Population Density | Claritas Pop-Facts Premier 2026 |
| Voter Registration | CPS 2024 Voting and Registration Supplement |
The margins of sampling error for the national sample of women ages 18 to 64 and reproductive age women ages 18 to 49 are plus or minus 2 percentage points. Numbers of respondents and margins of sampling error for key subgroups are shown in the table below. For results based on other subgroups, the margin of sampling error may be higher. Sampling error is only one of many potential sources of error and there may be other unmeasured error in this survey.
| Group | N (unweighted) | M.O.S.E. |
| National Women Ages 18-64 | 4,688 | ± 2 percentage points |
| White, non-Hispanic | 2,262 | ± 2 percentage points |
| Black, non-Hispanic | 767 | ± 4 percentage points |
| Hispanic | 1,135 | ± 4 percentage points |
| Asian or Pacific Islander | 347 | ± 6 percentage points |
| 18-25 | 508 | ± 5 percentage points |
| 26-35 | 1,313 | ± 3 percentage points |
| 36-49 | 1,715 | ± 3 percentage points |
| 50-64 | 1,152 | ± 3 percentage points |
| <200% FPL | 1,641 | ± 3 percentage points |
| 200%-399% FPL | 1,232 | ± 3 percentage points |
| 400%+ FPL | 1,475 | ± 3 percentage points |
| Employer-Sponsored | 2,490 | ± 2 percentage points |
| Individually Purchased | 386 | ±6 percentage points |
| Medicaid | 977 | ± 4 percentage points |
| Uninsured | 537 | ± 5 percentage points |
General Notes:
The sample primarily includes English-speaking Asian adults and, therefore, may not be representative of the overall Asian adult population. Despite this limitation, it is important to report the views of Asian adults on the topics in this study. As always, Asian adults’ responses are incorporated into the general population figures throughout this report.
Income is based on 2023 ASPE income levels. Two hundred percent (200%) of the federal poverty level (FPL) in 2023 for an individual was $29,160.
Endnote
- The data in this brief report affordability challenges for adults ages 18 to 64. Other KFF polling data includes estimates for all adult women and men, including those 65 and older. ↩︎