Section 1115 Waiver Watch: Continuous Eligibility Waivers

Published: Feb 15, 2024

Note: For the latest information on states with approved and pending waivers to extend multi-year continuous eligibility for children, view our Section 1115 tracker “Key Themes Maps.

The pandemic continuous enrollment provision and other research show that continuous eligibility reduces Medicaid disenrollment and “churn” rates and helps to ensure stable coverage. Guaranteeing 12-month continuous coverage for children has long been an option in Medicaid and CHIP without a waiver, but not for adults. The Consolidated Appropriations Act required all states to implement 12-month continuous eligibility for children beginning on January 1, 2024. As many Medicaid enrollees are currently experiencing disruptions in coverage as a result of the Medicaid unwinding, a number of states are pursuing strategies to help promote continuity of coverage, including through unwinding waivers and Section 1115 demonstration waivers. This Waiver Watch summarizes approved and pending Section 1115 waivers with continuous eligibility provisions for children and adults in Medicaid.

What is continuous eligibility?

States are required to provide 12-month continuous eligibility for children in Medicaid and CHIP. Continuous eligibility generally allows individuals to remain enrolled for a specific period even if there are fluctuations in income. States have long had the option to provide 12 months of continuous eligibility to children (under age 19) without a waiver, and many states (23 as of January 2023) had taken up that option for all children in Medicaid and CHIP (additional states had adopted 12-month continuous eligibility for only some children or only children in CHIP). However, the Consolidated Appropriations Act required all states to implement 12-month continuous eligibility for all children in Medicaid and CHIP beginning on January 1, 2024. Additional guidance issued on October 27, 2023 prohibits states from terminating coverage of children enrolled in CHIP for failure to pay premiums. Under the previous 12-month continuous eligibility option, states were permitted to disenroll children in CHIP during the continuous eligibility period if a family did not pay their premiums; this exception to continuous eligibility was not available in Medicaid. On February 1, 2024, the state of Florida filed a lawsuit against HHS challenging the implementation of the law, asserting states should be allowed to terminate CHIP coverage (during the 12-month period) when premium payments are not made.

Under current law, states cannot provide continuous eligibility for adults without a Section 1115 waiver submitted to the federal government. States cannot require a renewal process for Medicaid coverage for adults who are eligible based on income more than once every 12 months. While states may conduct renewals for individuals who qualify for Medicaid based on age or disability more than once every 12 months, most states conduct annual renewals for these groups. However, because states cannot guarantee continuous eligibility for adults absent a waiver, adults may lose coverage if there are “changes in circumstance,” including changes in family income, during the year. Enrollees are required to report changes in circumstances, and some states conduct periodic electronic data matches between renewal periods to identify changes in circumstance.

Continuous eligibility has been shown to reduce Medicaid disenrollment and “churn” rates. Churn occurs when individuals temporarily lose Medicaid coverage and then re-enroll within a short period of time suggesting they are experiencing short-term changes in income or difficulty completing the renewal process. When individuals churn on and off coverage, the gaps in coverage may limit access to care or lead to delays in getting needed care, which can be especially problematic for young children who receive frequent screenings and check-ups. Research has found continuous eligibility for Medicaid is associated with improved child health. While continuous eligibility increases coverage costs due to longer average eligibility periods, there are also administrative costs associated with disenrolling individuals and then subsequently processing new applications.

How are states using 1115 waivers to provide extended continuous eligibility for children?

As of February 15, 2024, three states have approved Section 1115 demonstration waivers to provide multi-year continuous eligibility to children (Table 1). Section 1115 waivers allow states to obtain federal approval to operate Medicaid programs in ways that differ from federal standards and requirements. In September 2022, CMS approved Oregon’s waiver to implement continuous eligibility for children from birth to age six as well as 24 months of continuous eligibility for nearly all enrollees ages six and older. Since then, CMS has approved multi-year continuous eligibility requests for children in Washington and New Mexico. Hawaii, Minnesota, North Carolina, and Pennsylvania have requests pending with CMS.

A number of states are developing waivers to provide multi-year continuous eligibility to children. Several states have waiver proposals under development that have recently been released for state-level public comment (California, Colorado, and New York) that include multi-year continuous eligibility for children (Table 1). Other tracking shows state activity, including legislation directing the state Medicaid agency to seek approval for multi-year continuous eligibility for children, in Illinois, Ohio and the District of Columbia. In December 2023, growing concern over loss of Medicaid coverage for children prompted federal officials to issue additional guidance with strategies to protect coverage; one strategy CMS highlighted in its guidance is providing multi-year continuous eligibility for children through Section 1115 demonstration authority.

States can use Section 1115 waivers to extend multi-year continuous eligibility to children.

What options do states have to provide continuous eligibility for adults?

As of February 15, 2024, five states have approved Section 1115 waivers to provide varying lengths of continuous eligibility to certain adults (Table 2). Oregon provides 24 months of continuous eligibility to nearly all enrollees over age six. New York and New Jersey provide 12-month continuous eligibility to all income-eligible Medicaid adults. Kansas provides 12-month continuous eligibility to parents and caretaker relatives. Massachusetts provides 12-month continuous eligibility for individuals following release from a correctional institution and 24-month continuous eligibility for individuals under age 65 experiencing homelessness for at least 6 months; however, the state is seeking CMS approval to expand 12-month continuous eligibility to all adults (including those eligible based on income, age, or disability status) and 24 months of continuous eligibility to all adults experiencing homelessness. Minnesota is seeking to provide 12-month continuous eligibility to young adults ages 19 and 20, and Pennsylvania is seeking to provide 12-month continuous eligibility to individuals that qualify for proposed reentry services following release from a correctional facility.

As of February 2024, five states have implemented 12-month continuous eligibility for certain adults.

Looking Ahead

Experience during the pandemic demonstrated that continuous enrollment can ensure stable coverage and reduce churn. While increased enrollment may result in increased overall costs, the policy can also improve health outcomes and potentially lead to some longer-term savings due to less fragmented care. While the unwinding of the pandemic-era continuous enrollment provision is leading to high rates of procedural disenrollments and is expected to increase the number of people who are uninsured longer term, mandatory 12-month continuous eligibility for children as well as new continuous eligibility policies that some states are pursuing through 1115 waivers can help to provide more stable coverage once the unwinding period ends.

What Would Another Trump Presidency Mean for Health Care?

Published: Feb 15, 2024

In this JAMA Health Forum column,  Larry Levitt, KFF’s Executive Vice President for Health Policy, explores what a second Trump presidency would mean for health care based on President Trump’s record and remarks, and concludes that a new term likely would result in efforts to weaken the Affordable Care Act, reduce federal Medicaid costs, restrict abortion access to abortion, and scale back benefits for immigrants.

News Release

Few Nursing Facility Residents and Staff Have Gotten the Latest COVID-19 Vaccines

Published: Feb 13, 2024

Fewer nursing facility residents and staff are getting COVID-19 vaccines, according to a new KFF analysis of federal data. Only 38% of residents and 15% of staff have received the latest vaccine. In comparison, 50% of residents and 22% of staff received updated vaccines in 2022 and 87% of residents and 88% of staff completed the initial vaccination series.

The percentage of residents who received the latest COVID-19 vaccine varies by state and type of facility. Vaccination rates range from 20% in Arizona to 63% in Vermont and North Dakota and were higher in nonprofit facilities (46%) than in for-profit (35%) or government (43%) facilities. Nursing staff had less variation and lower vaccination rates across states and in all facilities.

Residents’ and staff vaccination rates have declined with the release of each new COVID-19 shot for a variety of reasons, including fewer federal initiatives aimed at increasing vaccinations, the end of vaccine mandates for health care workers, and declining concerns about COVID-19 risks. Recent KFF polling shows that more than half of previously vaccinated adults are not worried about getting COVID-19.

Variation in nursing facility vaccine rates across states may be affected by several factors, including ownership patterns and partisanship, with higher rates in states that have more non-profit facilities and states that voted for President Biden in 2020, as well as whether facilities have established successful vaccination programs.

Few Nursing Facility Residents and Staff Have Received the Latest COVID-19 Vaccine

Published: Feb 13, 2024

Keeping 2 million nursing facility staff and 1.2 million residents current on their COVID-19 vaccines is one tool for reducing deaths from COVID-19 as the virus continues to evolve. KFF analysis found that despite over one-fifth of all U.S. COVID-19 deaths occurring in long-term care facilities, as of January 14, 2024, only 38% of residents and 15% of staff were “up-to-date” with their COVID-19 vaccines, which the CDC defines as having received the updated Fall 2023 vaccine. Those rates are lower than uptake was for the 2022 vaccine. This data note also finds lower uptake rates for for-profit facilities and state uptake rates that vary from 20% to 63%. Data for this analysis include 14,318 nursing facilities (96% of all nursing facilities, home to 1.2 million residents) that had reported COVID-19 vaccination data as of January 21, 2024.

Uptake of the most recent COVID-19 vaccine is lower among nursing facility residents and staff than uptake was for the fall 2022 vaccine: Only 38% of residents and 15% of staff have received the new vaccine (Figure 1). In comparison, at the same point in time last year, 50% of residents and 22% of staff had received the updated vaccine. Those rates represent the share that received the newly available COVID-19 vaccines, 18 weeks after each shot was made available to the public. These rates are much lower than the 87% of residents and 88% of staff who received their primary vaccination series when measured in September 2022. On January 1, 2024, the CDC changed the way it collects data to calculate the percent of staff who are up to date with their COVID-19 vaccination. CMS reports that it may take facilities some time to adapt to the new methodology.

A Lower Share of Residents & Staff Received the Current Vaccine When Compared to the Previous Vaccine

Uptake of the current COVID-19 vaccine is higher in non-profit facilities than in for-profit or government facilities (Figure 2). The percentage of nursing facility residents who received the updated vaccine is 46% in non-profit facilities compared with 35% in for-profit facilities and 43% in government facilities. Uptake of the fall 2022 vaccine was also highest in non-profit facilities and lowest in for-profit facilities. Rates of vaccine uptake for nursing facility staff were low in all types of facilities with minimal variation across facility types (data not shown).

A Higher Share of Residents in Non-Profit Facilities Received Vaccines When Compared to Other Facility Types

The percentage of nursing facility residents who received the latest COVID-19 vaccine ranges from 20% in Arizona to 63% in Vermont and North Dakota (Figure 3). In eleven states, half or more of nursing facility residents received the newest vaccine while in two states, 25% or fewer have received the most recent vaccine. Uptake among staff of the most recent vaccine ranges from 5% in Arkansas to 51% in Washington D.C. In 42 states, fewer than 20% of staff have received the most recent vaccine. There are a number of factors that may contribute to the variation in nursing facility vaccine uptake across states including ownership patterns and partisanship, with higher rates in states that have more non-profit facilities and states that voted for President Biden in 2020. Other factors include whether facilities have established programs to keep residents current on their vaccines and the success of those various programs. Additionally, some state variation in staff rates may be attributed to variation in how facilities are adapting to new CMS reporting methodology for staff vaccinations.

The Share of Residents Who Received an Updated Vaccine Ranges From 20% in Arizona to 63% in Vermont and North Dakota

Federal vaccine clinics contributed to high initial vaccination rates among nursing facility residents, but without ongoing federal initiatives, uptake of vaccines among nursing facility residents may remain low and vary across facilities. Earlier KFF analysis found that nearly 90% of residents completed the initial COVID-19 vaccination series. High take-up of the primary vaccine series stems from high death rates among nursing facility residents, which contributed to a fear of contracting COVID-19, and a concerted policy effort to vaccinate nursing facility residents, including through federally supported on-site vaccination clinics. According to AARP, federal supports have ended and long-term care facilities now coordinate their own COVID-19 vaccination programs, contributing to greater variation across facilities and lower overall rates.

Recent KFF polling shows that over half of previously vaccinated adults are not worried about getting COVID-19, suggesting that uptake of vaccines among nursing facility staff may remain low in the absence of federal mandates. Among nursing facility staff, initial take-up of COVID-19 vaccines was low until a health care worker vaccination mandate required providers that participate in Medicare and/or Medicaid to be vaccinated. This mandate was not updated to include follow-up vaccines, which may contribute to lower uptake of new vaccines among staff, particularly as concern about contracting COVID-19 drops among the U.S, population more broadly.

As winter viruses circulate, COVID-19 vaccines may help decrease sickness and preventable deaths among nursing facility residents and staff. Though people living and working in nursing facilities have likely built some immunity against COVID-19 through prior vaccinations and natural immunity, periodic vaccines have been shown to decrease mortality and increase antibody concentrations among nursing facility residents. For older adults—who constitute most people who use nursing facilities—the risks of COVID-19 may be seven times higher than that of the flu. The CDC finds that 72% of residents had received the flu vaccine as of December 10, 2023, among the small number of nursing facilities that had reported such data, a rate that is nearly twice that of the most recent COVID-19 vaccine. Beyond the flu and COVID-19, RSV is another high-risk respiratory virus. Although there is a new vaccine for RSV, uptake of the new vaccine among nursing facility residents has been hampered by shortages of RSV vaccines and the prioritization of the vaccine for infants and high-risk children. Increasing access to all vaccinations for this population may be a key strategy to preventing respiratory illnesses.

News Release

People with Medical Debt are Much More Likely to Experience Other Forms of Financial Stress

Published: Feb 12, 2024

People with medical debt are much more likely than those without such debt to show other signs of financial vulnerability, like having no “rainy day” fund, overdrawing a checking account, or relying on costly loans, according to a new KFF analysis of national survey data.

Medical debt remains a significant issue in the U.S., including among people with health insurance. In 2021, 23% of U.S. adults had one or more unpaid and past due bills from a medical service provider.

KFF’s 2022 Health Care Debt Survey found similar results: Among adults, 24% say they had medical or dental bills that were past due or that they could not pay, and a total of 41% had some type of health care debt, including on credit cards or owed to family members.

Medical debt and other forms of financial instability affect people and households across the income spectrum and can cause individuals to forgo needed care. In its award-winning series, “Diagnosis: Debt”, KFF Health News examined the epidemic of medical debt that has become a defining feature of the U.S. health care system.

The Consumer Financial Protection Bureau is expected to release requirements that remove medical debt from credit reports and could crack down on certain debt collection practices. Some states and localities have also bought or are seeking to buy their residents’ medical debt, in part with remaining COVID relief funds.

KFF’s new analysis relies on data from the 2021 National Financial Capabilities Survey. The survey uses information from more than 27,000 adults in each state and D.C.

How Financially Vulnerable are People with Medical Debt?

Authors: Aubrey Winger, Gary Claxton, Matthew Rae, Shameek Rakshit, and Anthony Damico
Published: Feb 12, 2024

This analysis of government data finds that people with medical debt are much more likely to have other forms of financial distress than those without medical debt, like having no “rainy day” fund, overdrawing a checking account, or relying on costly loans.

Medical debt is associated with financial vulnerability across a range of other indicators and can cause people to delay or forgo needed medical care due to cost.

The analysis relies on data from the 2021 National Financial Capabilities Survey. The survey uses information from more than 27,000 adults in each state and D.C.

The analysis is available through the KFF-Peterson Health System Tracker, an online information hub that monitors and assesses the performance of the U.S. health system.

The Burden of Medical Debt in the United States

Authors: Shameek Rakshit, Matthew Rae, Gary Claxton, Krutika Amin, and Cynthia Cox
Published: Feb 12, 2024

This analysis of government data estimates that people in the United States owe at least $220 billion in medical debt. Approximately 14 million people (6% of adults) in the U.S. owe over $1,000 in medical debt and about 3 million people (1% of adults) owe medical debt of more than $10,000.

The share of adults with medical debt varies considerably across the U.S. Hawaii (2.3%) and D.C. (2.7%) have the lowest share of adults with medical debt. States with the highest share of adults with medical debt include South Dakota (17.7%), Mississippi (15.2%), North Carolina (13.4%), West Virginia (13.3%), and Georgia (12.7%).

The analysis is based on data from the 2021 Survey of Income and Program Participation, a nationally representative survey that asks every adult in a household whether they owed money for medical bills and how much they owe.

The report also examines variations in medical debt by age, race and ethnicity, health status, and for people with a disability.

The analysis is available through the KFF-Peterson Health System Tracker, an online information hub that monitors and assesses the performance of the U.S. health system.

10 Things to Know About Medicare Advantage Dual-Eligible Special Needs Plans (D-SNPs)

Authors: Salama Freed, Meredith Freed, Jeannie Fuglesten Biniek, Anthony Damico, Nolan Sroczynski, and Tricia Neuman
Published: Feb 9, 2024

About 12.9 million people received health coverage under both Medicare and Medicaid in 2021. Medicare-Medicaid enrollees, known as dual-eligible individuals, are a diverse group, as nearly half are people of color and nearly 40% are under age 65. However, this group of people share some common characteristics, such as limited financial means and health care needs that are more wide-ranging and complex than the average Medicare enrollee.

Prior KFF research has described the complex landscape of coverage options available to dual-eligible individuals when enrolling in Medicare and Medicaid. Medicare, the primary source of health insurance coverage for dual-eligible individuals, may be provided under traditional Medicare or a Medicare Advantage plan. Medicaid, which typically wraps around Medicare, covers the cost of Medicare premiums and in many cases, cost sharing assistance. Full dual-eligible individuals are also eligible for benefits not otherwise covered by Medicare, such as long-term services and supports. Dual-eligible individuals may receive Medicaid benefits through fee-for-service or managed care, and coverage and eligibility vary by state. Separate eligibility requirements, benefits, and rules for Medicare and Medicaid sometimes contribute to what has been described as a “fragmented and disjointed system of care for dual eligibles” which may lead to difficulty in navigating care among dual-eligible individuals.

In 2023, 5.2 million dual-eligible individuals were enrolled in a Medicare Advantage plan designed specifically for dual-eligible individuals, known as Dual-Eligible Special Needs Plans (D-SNPs). D-SNPs are required to provide greater coordination of Medicare and Medicaid benefits than other Medicare Advantage plans to improve coordination across programs and patient outcomes. D-SNPs typically provide benefits not otherwise available in traditional Medicare and generally do not charge a premium.

This brief highlights 10 things to know about D-SNPs, including national and state enrollment trends, plan availability, insurer participation, benefits, and prior authorization rates and denials, based on data from various sources (see methods for details). While D-SNPs can help with coordination for dual-eligibles in Medicare and Medicaid and they are growing rapidly, fewer than one in ten D-SNP enrollees were in fully integrated dual eligible (FIDE) special needs plans (SNPs), raising questions about how well coverage and care is being coordinated between Medicare and Medicaid. In addition, gaps in data make it difficult to assess the quality of D-SNPs, prior authorization rates and denials by type of service, and the extent to which extra benefits are used.

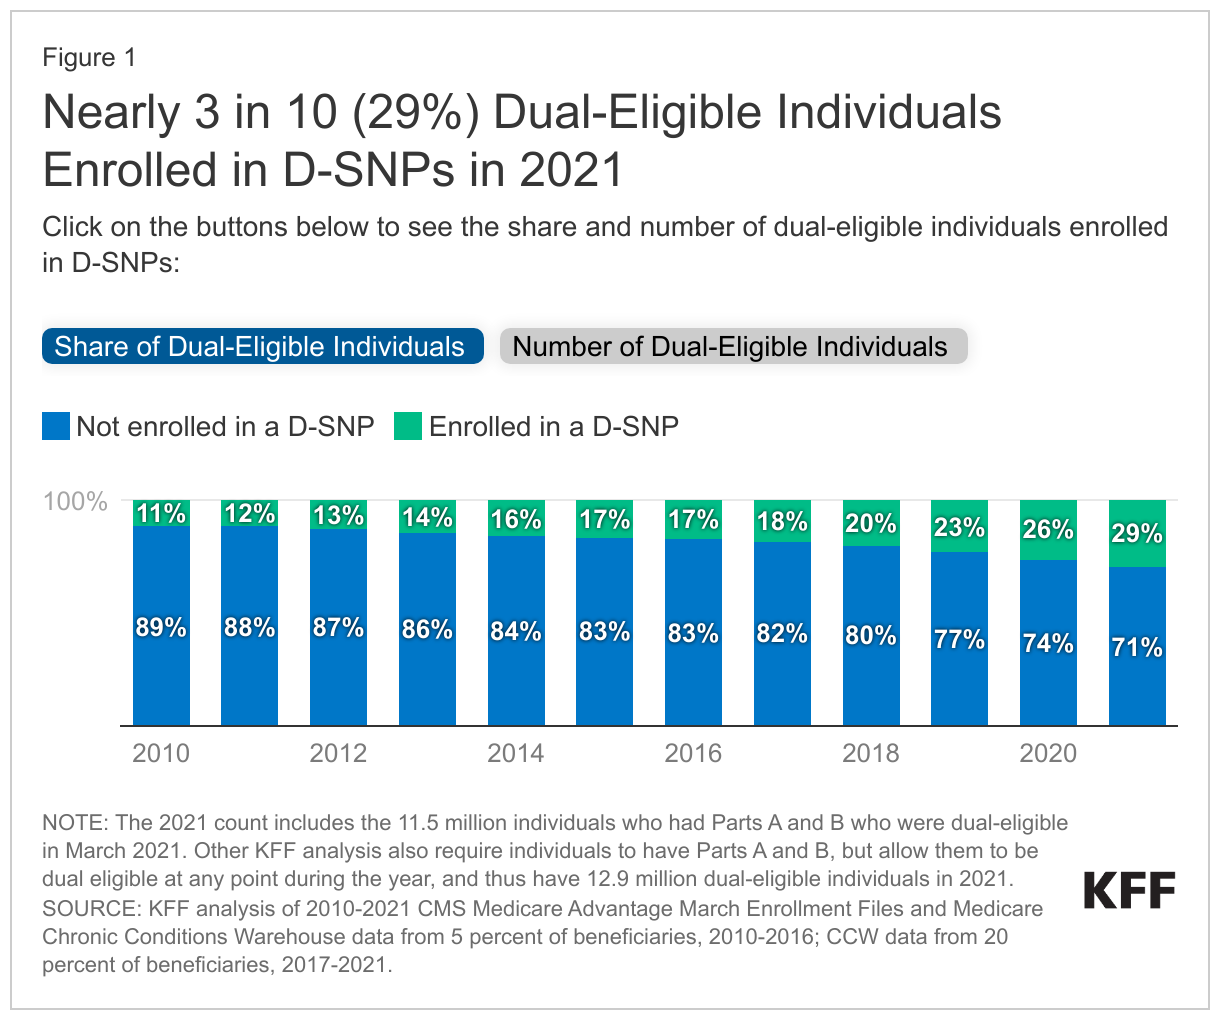
1. About 3 in 10 (29%) dual-eligible individuals enrolled in D-SNPs in 2021.

In 2021, nearly 3 in 10 (29%) dual-eligible individuals were enrolled in a D-SNP. Between 2010 and 2021, the share of dual-eligible individuals enrolled in D-SNPs nearly tripled from 11% to 29%.

Nearly 3 in 10 (29%) Dual-Eligible Individuals Enrolled in D-SNPs in 2021

As of 2023, most D-SNP enrollees (57%) were in coordination-only (CO) plans that are required to provide a minimum level of coordination between Medicare and Medicaid but are not fully integrated within the same plan. Another 35% of D-SNP enrollees were in what is known as highly integrated dual eligible (HIDE) SNPs that meet the requirements of CO plans and also require coverage of long-term services and supports and behavioral health. The remaining 8% were in plans that were fully integrated dual eligible (FIDE) special needs plans (SNPs), which coordinate care for dual-eligible individuals within a single managed care organization.

2. The share of dual-eligible individuals enrolled in D-SNPs varies by state, ranging from 5% (Nevada) to 58% (Hawaii) in 2021.

In 2021, D-SNP enrollment as a share of dual-eligible individuals ranged from 5% in Nevada to 58% in Hawaii, as compared to 29% nationwide. In seven states, 40% or more of all dual-eligible individuals were enrolled in D-SNPs: Alabama (42%), New York (42%), Florida (46%), Tennessee (46%), Arizona (47%), and Hawaii (58%), as well as in Puerto Rico (98%, not shown). Conversely, less than 10% of dual-eligible individuals were enrolled in D-SNPs in Nevada (5%), where D-SNPs were first available in 2021, and Montana (8%).

Nearly 3 in 10 (29%) Dual-Eligible Individuals Nationwide Enrolled in D-SNPs in 2021, But the Share Varied Across States

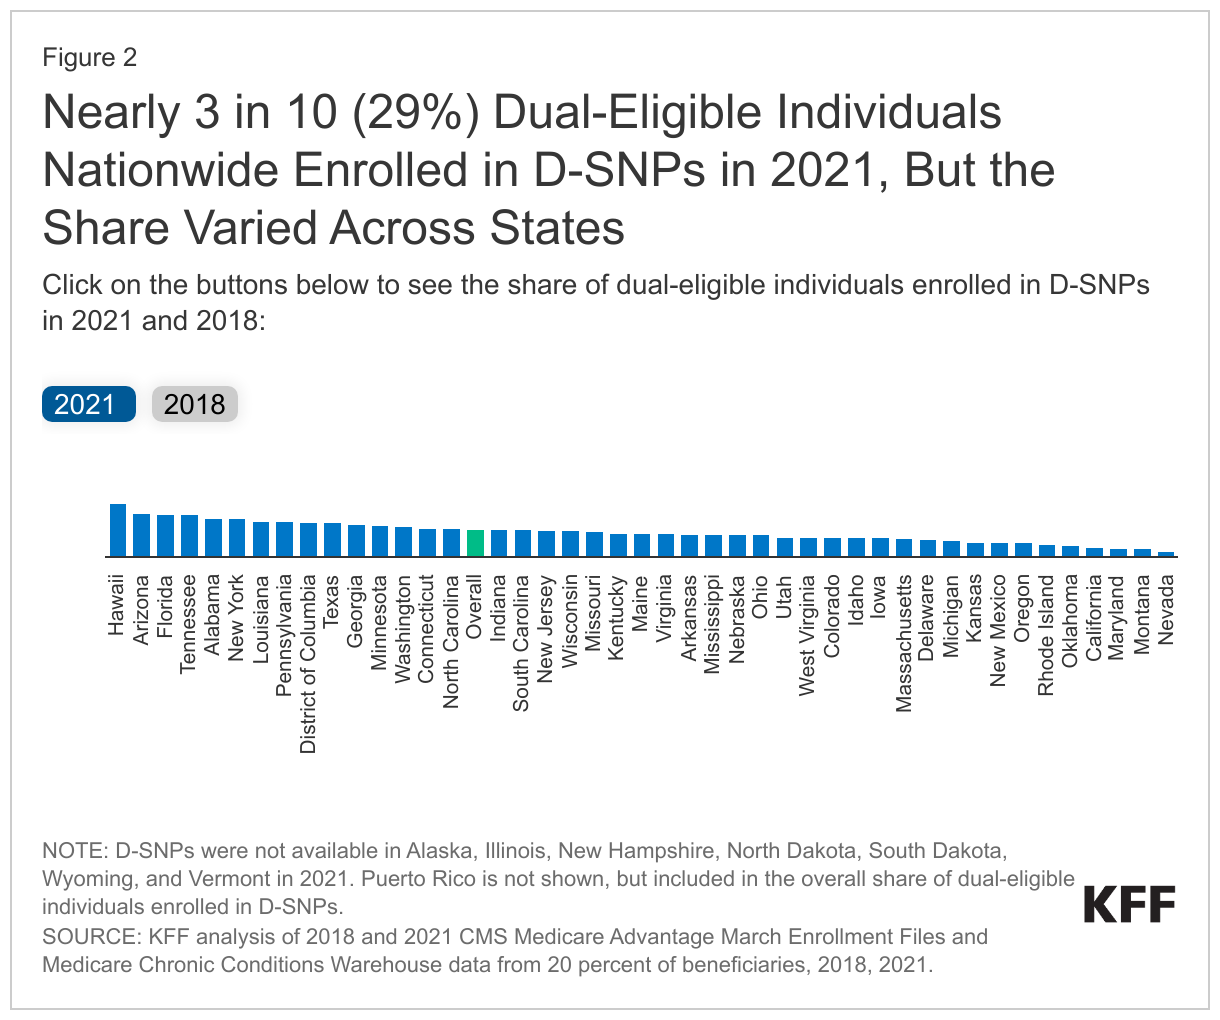
The share of dual-eligible individuals enrolled in D-SNPs more than doubled in 19 states between 2018 and 2021. States with relatively low D-SNP enrollment relative to the dual-eligible population in 2018, such as Oklahoma, Iowa, and West Virginia, had the highest percentage growth in share of dual-eligible individuals enrolled in D-SNPs between 2018 and 2021. For example, the share of dual-eligible individuals enrolled in D-SNPs in Oklahoma increased from 1% in 2018 to 12% in 2021. Several states, such as Arizona (45% vs. 47%), California (10% vs. 10%), Hawaii (57 vs. 58%), Massachusetts (16% vs. 19%), and Minnesota (30% vs. 34%), maintained similar shares of dual-eligible individuals enrolled in D-SNPs between 2018 and 2021. New Mexico, Oregon, and Utah were the only states where a smaller share of dual-eligible individuals enrolled in D-SNPs in 2021 compared to 2018. Insurers in Alaska, Illinois, New Hampshire, Wyoming, Vermont, North Dakota, and South Dakota did not offer D-SNPs in 2018 or 2021. Overall, Medicare Advantage enrollment in these states tends to be lower than the national average, partially explaining the relatively low enrollment among dual-eligible individuals in D-SNPs.

Differences in D-SNP enrollment across states may be reflective of several factors, including variation in: state-level policies pertaining to D-SNP enrollment, demographic characteristics of the dual-eligible population in the state, firm strategy, and the ability to establish care networks for dual-eligible individuals.

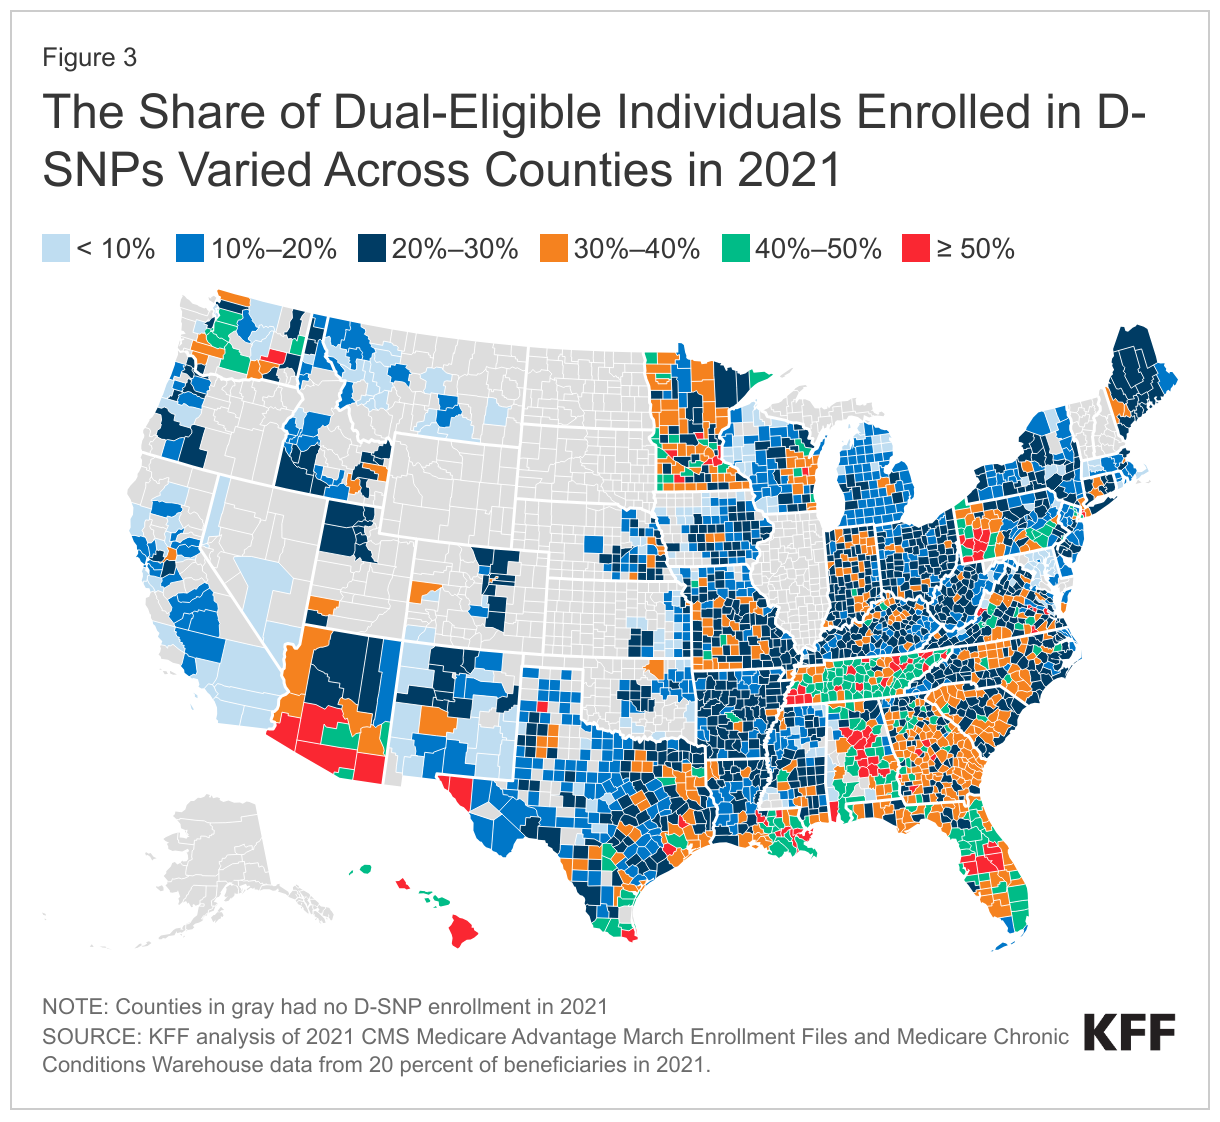
3. Within states, the share of dual-eligible individuals enrolled in a D-SNP varied across counties in 2021.

Within states, D-SNP enrollment among dual-eligible individuals often varies by county. For example, in Northern California, 20% of dual-eligible individuals in San Francisco County were enrolled in D-SNPs in 2021, compared to only 5% in nearby Santa Clara County. Although there was roughly the same number of dual-eligible individuals in Alameda and Sacramento Counties in 2021, only 16% of dual-eligible individuals in Alameda County were enrolled in D-SNPs, while over one-third (34%) of dual-eligible individuals in Sacramento County were enrolled in D-SNPs. In Florida, the share of dual-eligible individuals in Orlando was 54% (Pasco County) compared to 64% in nearby Tampa (Osceola County). However, in counties in the Florida Panhandle, the share of dual-eligible individuals enrolled in D-SNPs was much lower: 24% in Jackson County and 45% in adjacent Gadsden County. In Puerto Rico (not shown), enrollment of dual-eligible individuals in D-SNPs is nearly universal.

Variations in D-SNP enrollment at the county level may be attributed to several factors, such as rurality and Medicare payment rates.

The Share of Dual-Eligible Individuals Enrolled in D-SNPs Varied Across Counties in 2021

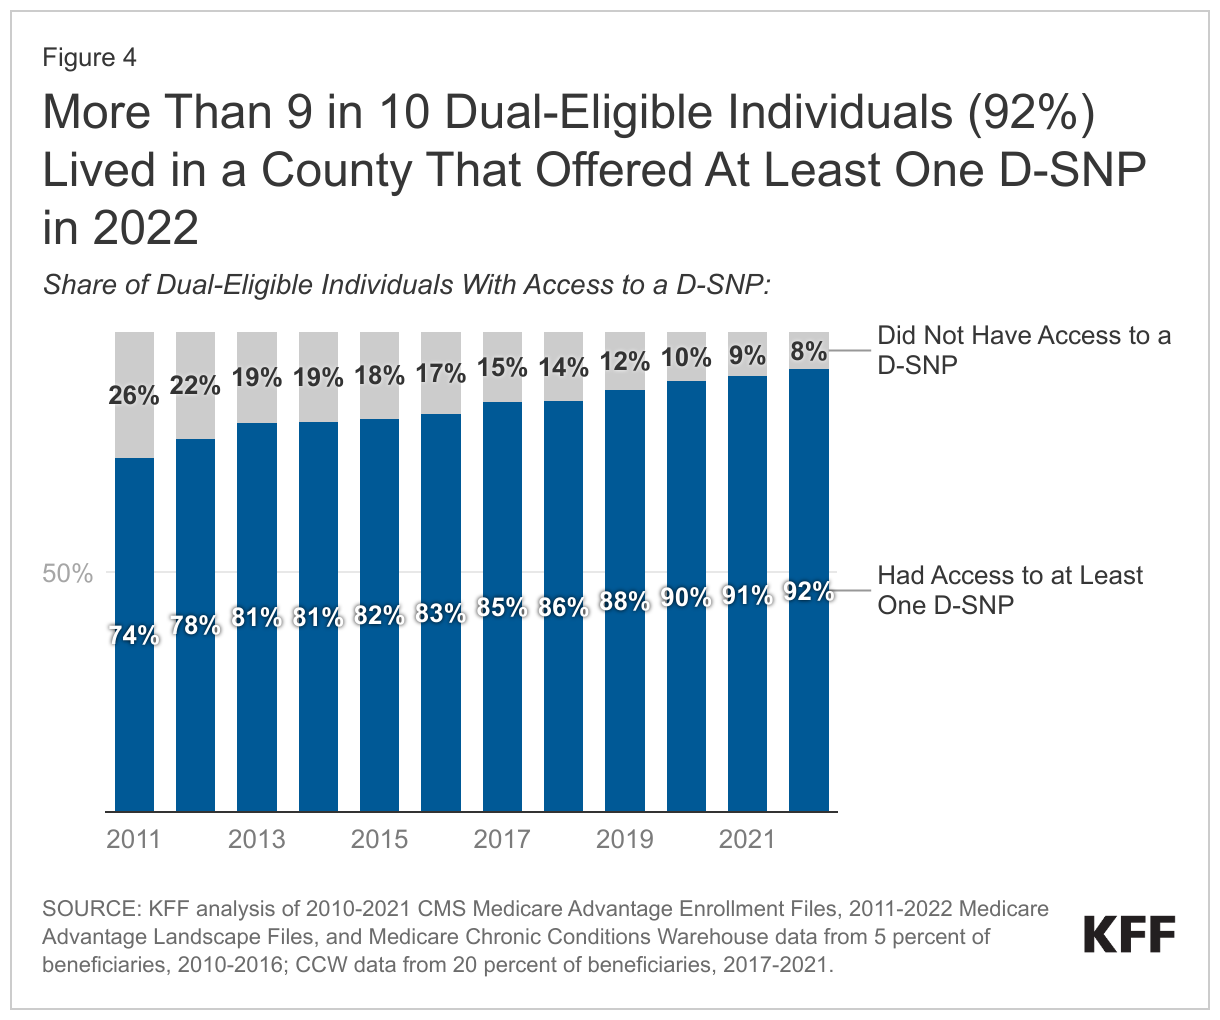
4. More than 9 in 10 dual-eligible individuals (92%) lived in a county that offered at least one D-SNP in 2022.

More than 9 in 10 (92%) dual-eligible individuals could choose from at least one D-SNP when selecting coverage for 2022, up from 86% in the 2018 plan year. Most of the remaining 8% of dual-eligible individuals without access to a D-SNP lived in the 5 states where D-SNPs were not available in 2022 (Illinois, New Hampshire, South Dakota, Vermont, and Alaska).

More Than 9 in 10 Dual-Eligible Individuals (92%) Lived in a County That Offered At Least One D-SNP in 2022

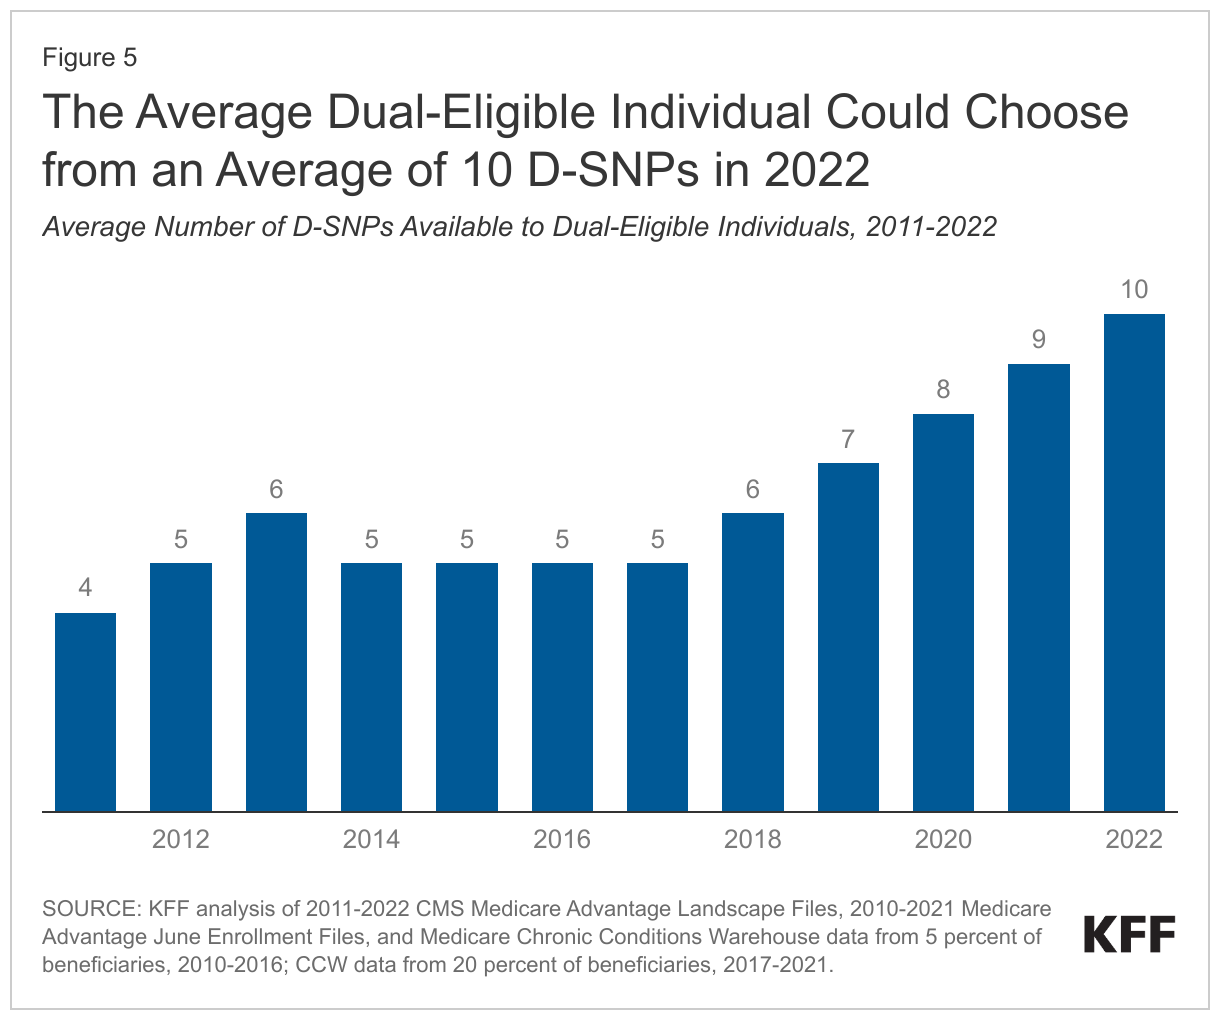
5. The average dual-eligible individual could choose from 10 D-SNPs in 2022.

The Average Dual-Eligible Individual Could Choose from an Average of 10 D-SNPs in 2022

The average dual-eligible individual could choose from 10 D-SNPs in 2022 – more D-SNPs than in any previous year. The number of D-SNPs available to the average dual-eligible individual has more than doubled since 2011. While the average dual-eligible individual could choose from 10 D-SNPs, plan availability varied widely by county in 2022. For example, dual-eligible individuals in most counties composing metropolitan New York City had access to up to 40 D-SNP options, while dual-eligible individuals in neighboring Suffolk County could choose from 17 plans. Dual-eligible individuals in states such as Wyoming and Montana were able to access only one D-SNP. Dual-eligible individuals in Illinois, North Dakota, New Hampshire, Vermont, and Alaska did not have access to a D-SNP in 2022 (and will also not have access to a D-SNP in 2024).

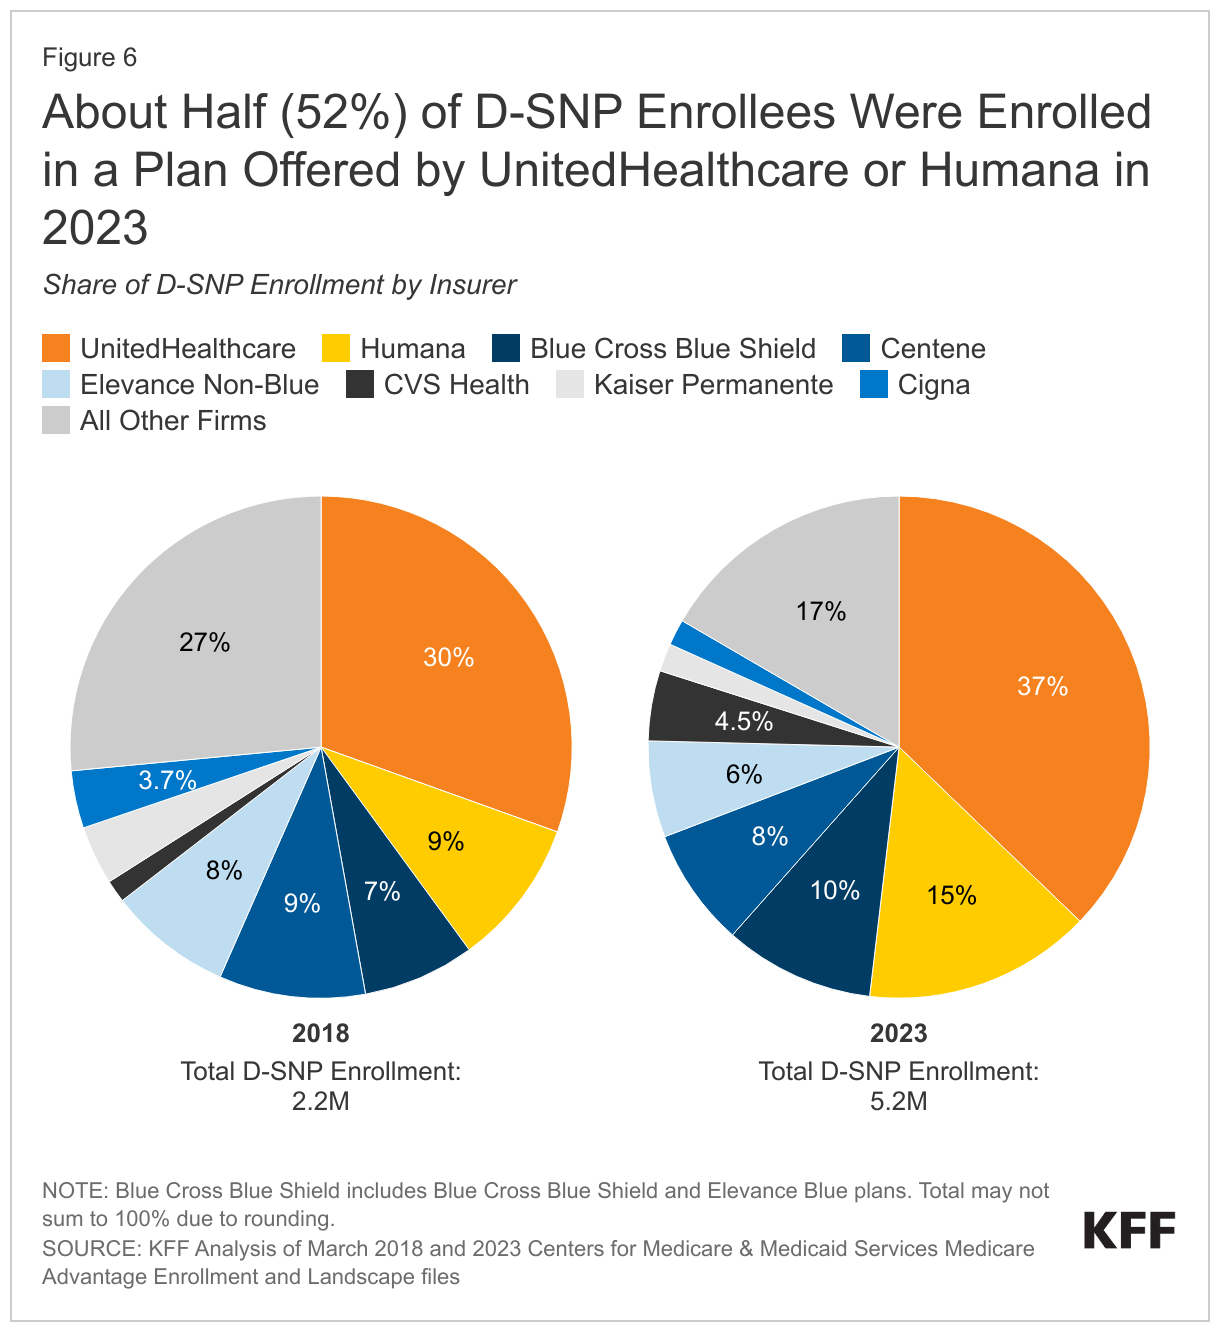
6. About half (52%) of D-SNP enrollees were in UnitedHealthcare or Humana plans in 2023.

About Half (52%) of D-SNP Enrollees Were Enrolled in a Plan Offered by UnitedHealthcare or Humana in 2023

UnitedHealthcare and Humana were the dominant providers of D-SNPs in 2023, accounting for 52% of total D-SNP enrollment. Enrollment in UnitedHealthcare plans alone accounted for nearly two-fifths of total D-SNP enrollment (37%) and exceeded combined enrollment of BCBS, Centene, Elevance Non-Blue, CVS Health, Kaiser Permanente, and Cigna (31%) in 2023.

Between 2018 and 2023, the share of enrollees in plans offered by smaller firms has declined from 27% to 17%. Between 2018 and 2023, the share of D-SNP enrollees choosing plans offered by Kaiser Permanente, Cigna, Centene, BCBS, and Elevance Non-Blue declined, while the share of enrollees choosing UnitedHealthcare, CVS Health, and Humana plans increased.

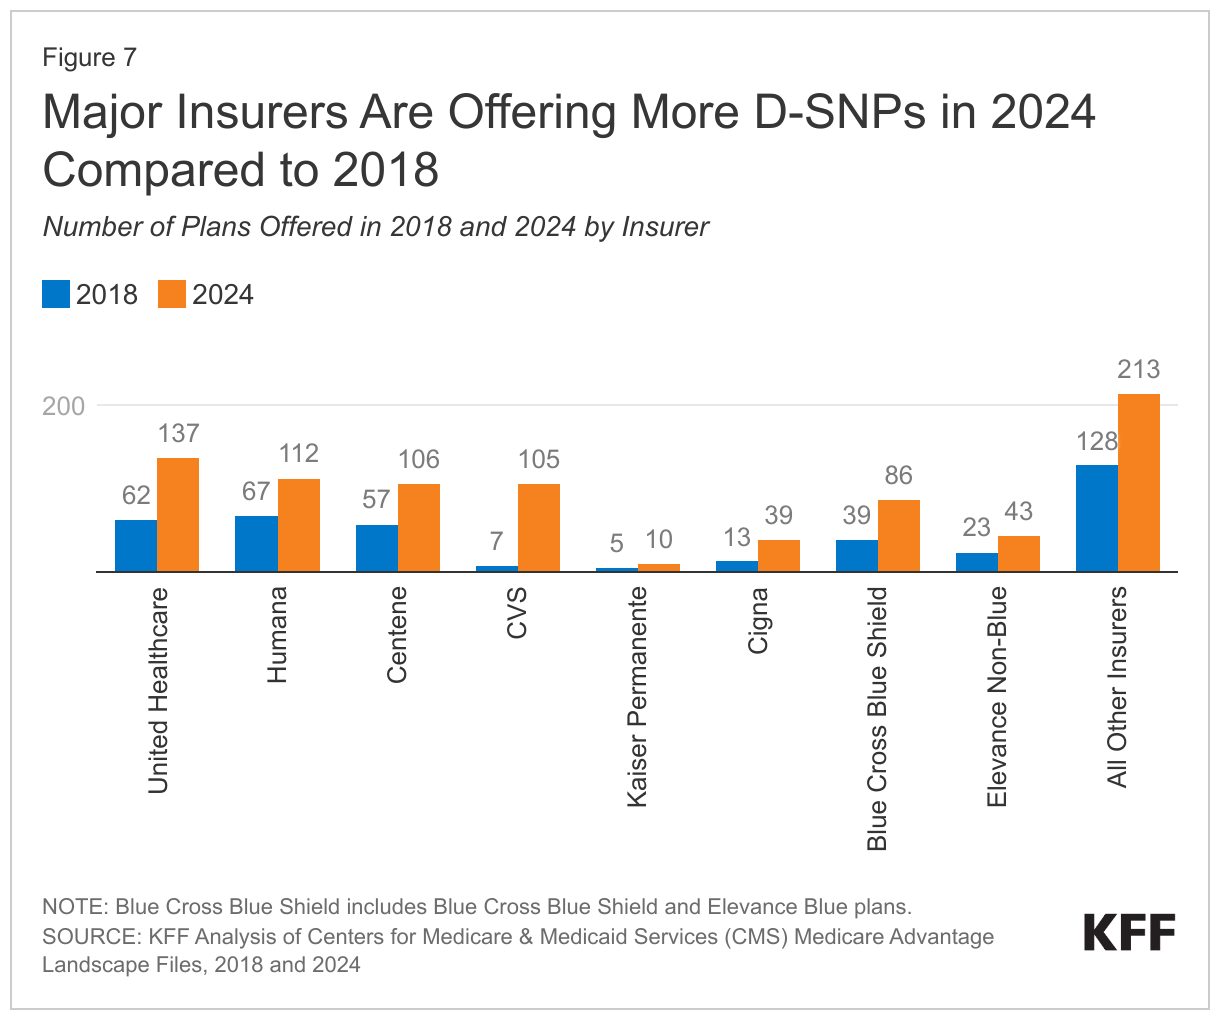
7. Every major insurer increased the number of D-SNP offerings between 2018 and 2024.

In plan year 2024, insurers are offering 851 plans, more than double the number offered in plan year 2018 (401). The growth in offerings between plan years 2018 and 2024 can be attributed to insurers increasing offerings in existing counties and expanding the number counties in which D-SNPs are offered.

Eight major insurers are offering 75% (638) of plans in 2024, up from 68% in plan year 2018. The remaining 25% (213) of plans are offered by smaller insurers. In plan year 2024, CVS will offer 105 plans, an increase of 98 plans since the 2018 plan year. This represents the largest growth in plan offerings among the major insurers. Kaiser Permanente will offer 10 plans, an increase of 5 plans since the 2018 plan year. This represents the smallest growth in plan offerings among major insurers.

Major Insurers Are Offering More D-SNPs in 2024 Compared to 2018

One firm, Florida Complete Care, is entering the D-SNP market in 2024 (though it has offered other types of SNPs in prior years), while 5 firms that offered D-SNPs (Ascension, Health Choice Generations Utah, AgeWell New York, Essence Healthcare, and Vantage Health Plan) are exiting the D-SNP market. This differs from prior KFF analysis which examines entries and exits for the overall Medicare Advantage market.

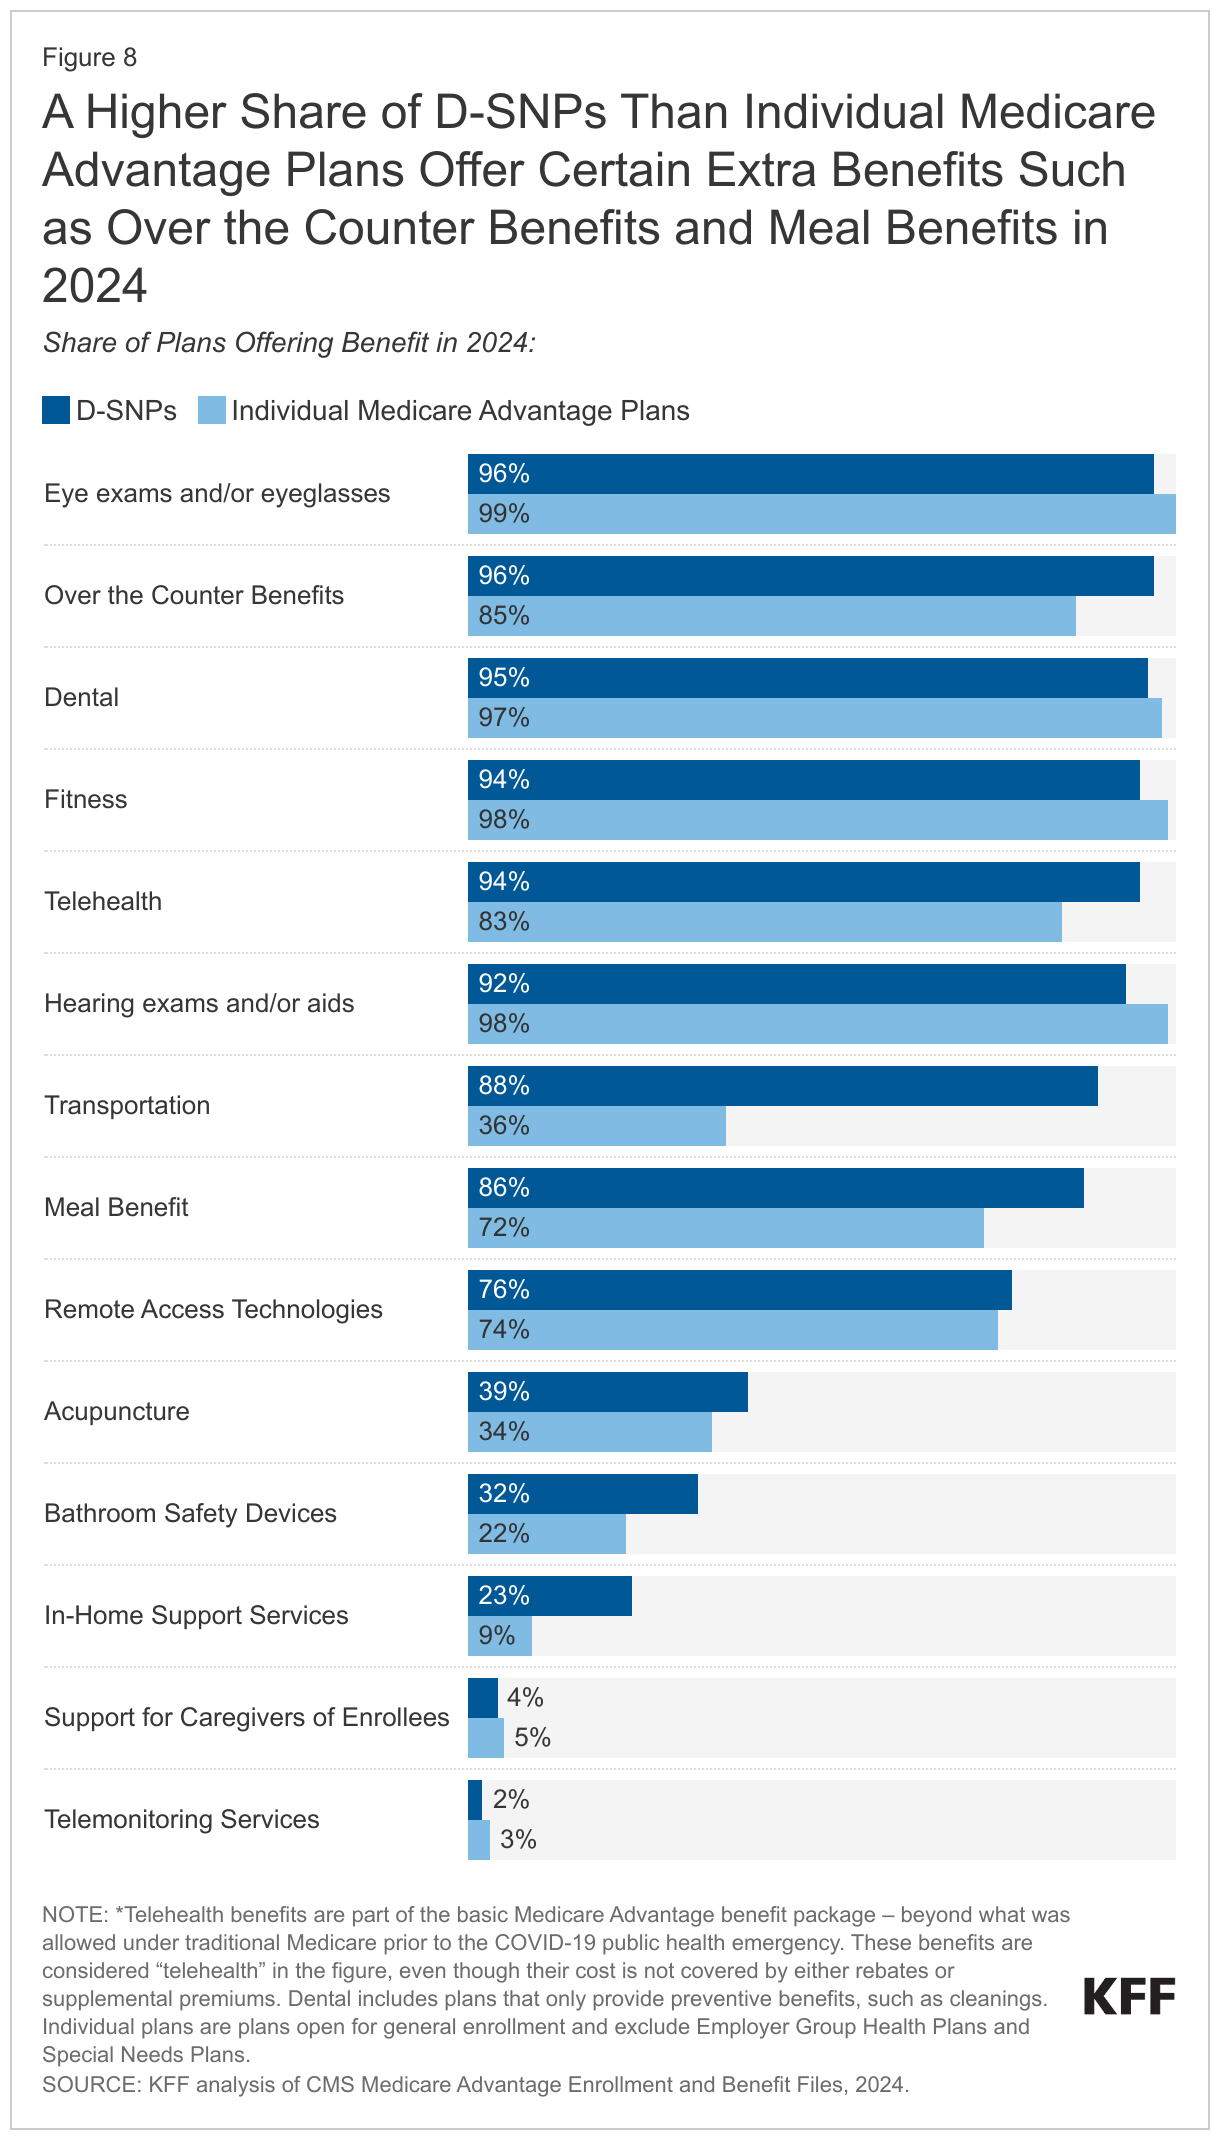
8. D-SNPs are more likely than other Medicare Advantage plans to offer some extra benefits such as over the counter benefits and meal benefits.

The share of D-SNPs offering eye exams and/or eyeglasses (96%), dental care (95%), fitness benefits (94%), or hearing exams and/or aids (92%) was nearly universal for enrollees in D-SNPs as well as individual Medicare Advantage plans in 2024 (Figure 8). However, D-SNPs are more likely than individual Medicare Advantage plans to offer over the counter benefits (96% vs. 85%), meal benefits (86% vs. 72%), bathroom safety devices (32% vs. 22%), and in-home support services (23% vs. 9%). D-SNPs are also more likely to offer transportation services than other Medicare Advantage plans (88% vs. 36%). Many of the additional benefits may be covered by Medicaid as “Medicaid wraparound services.” States are required to cover non-emergency medical transportation (NEMT), all states provide some home-based care (including meals, bathroom safety, or in-home supports), and many states cover some dental and vision services. D-SNPs may expand upon the services offered through Medicaid and it is unknown to what extent the D-SNP offerings supplement the Medicaid services for specific states or plans.

A Higher Share of D-SNPs Than Individual Medicare Advantage Plans Offer Certain Extra Benefits Such as Over the Counter Benefits and Meal Benefits in 2024

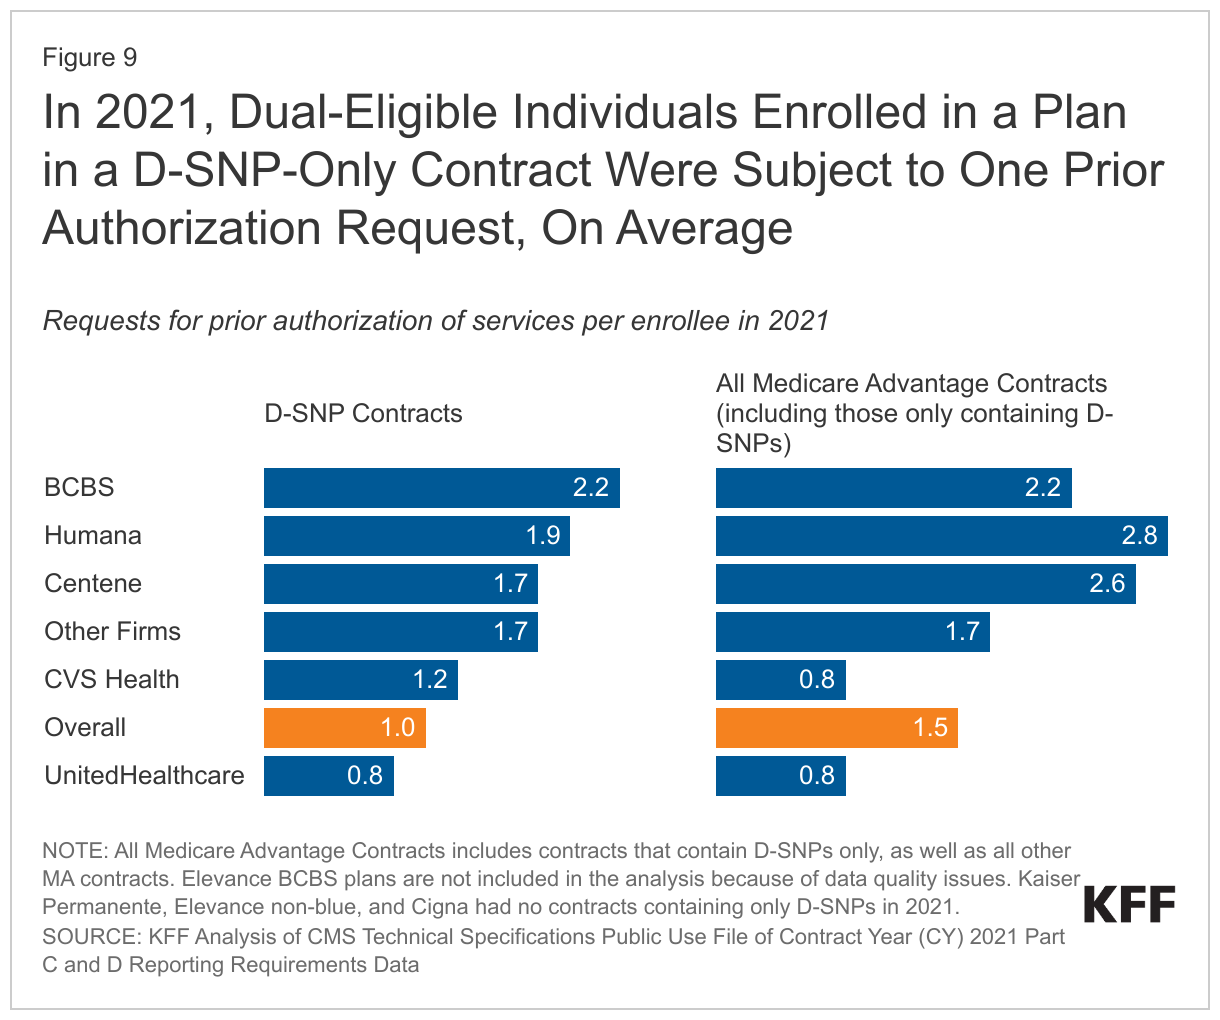
9. In 2021, dual-eligible individuals enrolled in a plan in a D-SNP-only contract were subject to one prior authorization request, on average.

In 2021, Dual-Eligible Individuals Enrolled in a Plan in a D-SNP-Only Contract Were Subject to One Prior Authorization Request, On Average

CMS publishes prior authorization data by contract and not by plan type, which makes it impossible to document the total number of prior authorization requests or denials for D-SNP enrollees. This analysis, therefore, relies on data about contracts containing only D-SNPs, which account for about 19% of total D-SNP enrollment. Most D-SNP enrollees (81%) are in plans that are in a contract with other Medicare plan types, which means CMS does not collect or publish prior authorization data for most D-SNP enrollees.

On average, firms with contracts containing only D-SNPs received one prior authorization request per beneficiary in 2021, as compared to previous KFF analysis showing 1.5 prior authorization requests per enrollee for all Medicare Advantage plans, although that estimate included contracts that included both D-SNPs and other plans. This is somewhat surprising, considering dual-eligible individuals generally utilize more health care services than the average Medicare beneficiary.

Unlike other insurers, CVS had more prior authorization requests for enrollees in D-SNP-only contracts than for enrollees in all Medicare Advantage contracts. Prior authorizations ranged across firms from less than one per beneficiary (UnitedHealthcare) to 2.2 per beneficiary (BCBS) for contracts containing only D-SNPs.

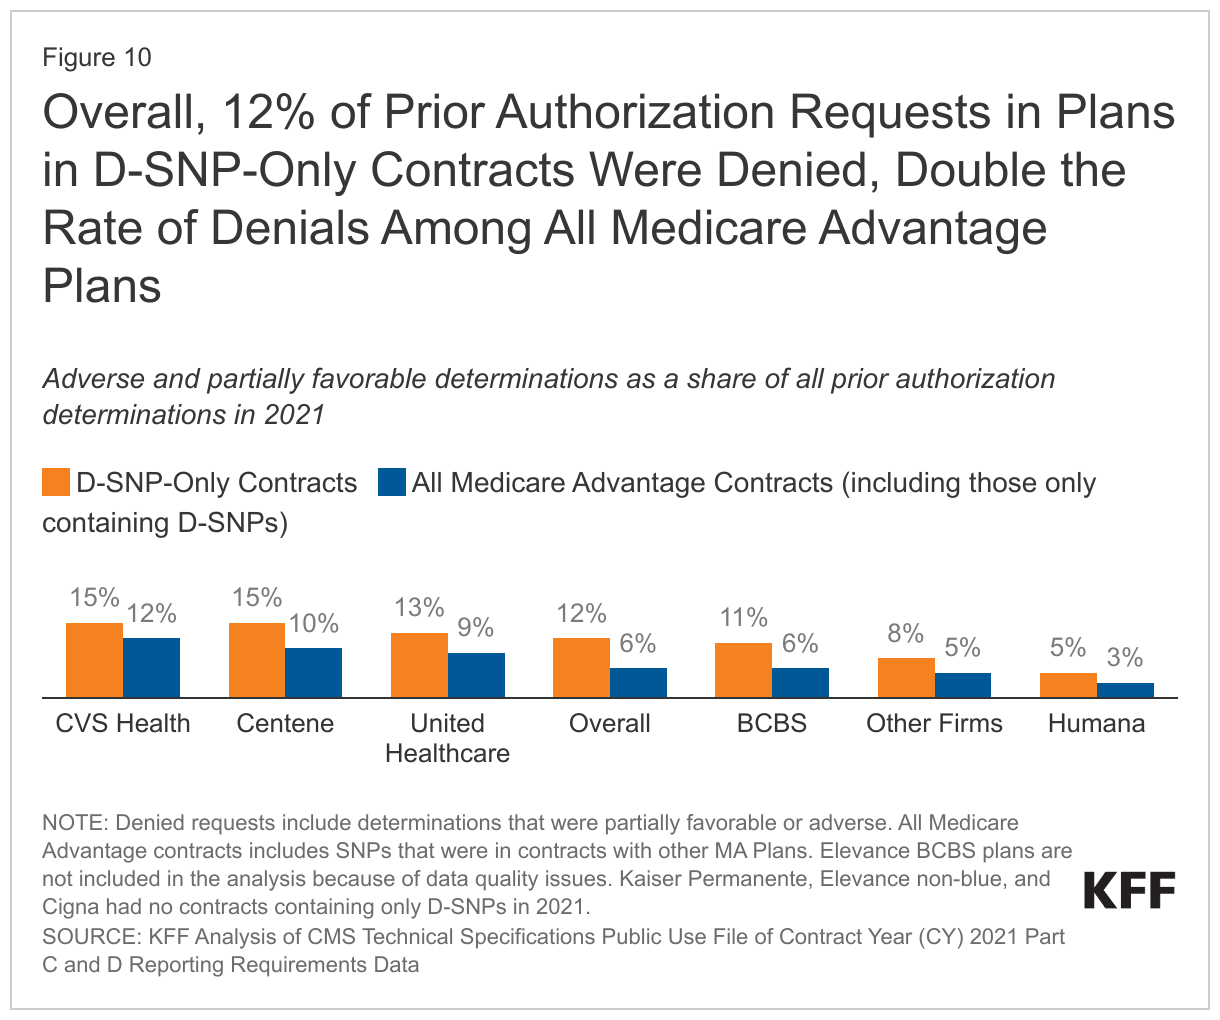
10.Despite fewer prior authorizations in D-SNP-only plans compared to all Medicare Advantage plans, the rate of denials was twice as high.

Overall, 12% of Prior Authorization Requests in Plans in D-SNP-Only Contracts Were Denied, Double the Rate of Denials Among All Medicare Advantage Plans

In 2021, firms with contracts containing only D-SNPs received nearly 670,000 prior authorization requests, 12% of which were denied. This is double the denial rate for all Medicare Advantage plans (6%), according to previous KFF analysis. The rate of prior authorization request denials ranged from 5% (Humana) to 15% (CVS Health and Centene) among contracts containing only D-SNPs. Nearly 7% of just over 80,000 denials were appealed, compared to 11% of denials for all Medicare Advantage plans. Just over two-thirds (68%) of those appeals were resolved favorably, in contrast to prior KFF analysis that found over 82% of appeals for all Medicare Advantage contracts were resolved favorably.

Previous KFF analysis of Medicare Advantage prior authorization data revealed an inverse relationship between the insurer’s volume of prior authorization requests and share of requests that were denied. This relationship among D-SNP-only contracts holds for some firms, such as UnitedHealthcare and Humana, but not others. For example, Centene D-SNP-only contracts received on average 1.7 requests per enrollee, higher than the overall rate of one prior authorization request and denied 15% of those requests compared to 12% overall. As with prior authorization data, denial rates are collected and reported at the contract level, which means denial rates in D-SNP-only contracts represent a fraction of individuals enrolled in D-SNPs.

Discussion

In 2021, nearly 3 in 10 (29%) dual-eligible individuals enrolled in D-SNPs, an increase from 20% in 2018. Growth in D-SNP enrollment may be driven by several factors. D-SNPs may be attractive to dual-eligible individuals due to the availability of extra benefits, including benefits that are offered more frequently in D-SNPs than Medicare Advantage plans for general enrollment, such as over the counter benefits and meals. There is also strong interest in D-SNPs among insurers, given relatively high margins. Since 2018, more insurers have offered D-SNPs and larger insurers have offered more plans. Growth in enrollment may be due to some extent to the automatic enrollment of some individuals into D-SNPs. In 2022, more than 9 in 10 dual-eligible individuals (92%) lived in counties where insurers offered at least one D-SNP, with an average of 10 D-SNPs offered per dual-eligible individual, compared to 6 plans in 2018.

While enrollment and plan availability continue to grow, it is not clear how well D-SNPs coordinate with Medicaid to provide the full range of benefits to dual-eligible enrollees. Fewer than one in ten D-SNP enrollees are in fully integrated plans.

Relatedly, little is known about the quality of D-SNPs. Because quality ratings are reported at the contract level, rather than the plan level, it is not possible to assess the quality of D-SNPs that are included in contracts with other plans, affecting most D-SNP enrollees. Most D-SNP enrollees (81%) are in plans that are part of a contract with other plans, which means the quality ratings are at the contract level, not of their specific plan. Further, MedPAC has raised concerns that the current quality measures are not sufficient to adequately assess care delivery in D-SNPs. Early attempts at quality measurements have produced mixed results, with some reporting little variation in quality measurements between plans and others reporting little difference in care quality between D-SNPs and other methods of care for dual-eligible individuals.

Lack of data transparency also contributes to limited understanding of the impact of prior authorization requirements and denials for dual-eligible individuals enrolled in D-SNPs. KFF’s analysis suggests that contracts containing D-SNPs (but no other plans) deny prior authorization requests at a much higher rate than Medicare Advantage plans overall, even though firms with contracts containing only D-SNPs received few authorization requests per enrollee. Again, because prior authorization requests and denials are reported at the contract level, it is not possible to document the number of prior authorization requests for D-SNP enrollees overall or per person, or denial rates.

Further, although most plans offer some extra benefits to D-SNP enrollees, it is not clear how often D-SNP enrollees take advantage of these extra benefits, whether insurers offer adequate networks to access these services, and whether they are of value to a population with such diverse health needs. A recent proposed rule by the Biden Administration would require insurance providers to periodically notify D-SNP enrollees if they are not utilizing supplemental benefits offered by their plan, but there is an absence of comprehensive data pertaining to the use of supplemental benefits among D-SNP and other Medicare Advantage enrollees, according to KFF. In addition, there is some concern among advocates and policymakers about marketing benefits, such as transportation, dental, and vision when dual-eligible individuals may already be eligible for these services through Medicaid. Given the significant needs of the dual-eligible population, and incentives for rapid growth in D-SNP enrollment, including proposed policy changes to institute Special Enrollment Periods to increase D-SNP participation, greater insight into the experiences of D-SNP enrollees would be valuable for beneficiaries and policymakers.

This work was supported in part by Arnold Ventures. KFF maintains full editorial control over all of its policy analysis, polling, and journalism activities.

Salama Freed, Meredith Freed, Jeannie Fuglesten Biniek, Nolan Sroczynski, and Tricia Neuman are with KFF. Anthony Damico is an independent consultant.

Box 1: Medicare and Medicaid in Puerto Rico

Puerto Rico is included in this analysis of dual-eligible individuals in Medicare. Notably, Puerto Rico’s Medicare and Medicaid programs differ from the 50 states and the District of Columbia. In Puerto Rico, nearly all Medicare beneficiaries are enrolled in a Medicare Advantage plan. Medicare Advantage penetration is higher across Puerto Rico than in the 50 states and District of Columbia. In 2023, at least 90% of eligible Medicare beneficiaries are enrolled in a Medicare Advantage plan across virtually all Puerto Rican counties. In particular, enrollment in D-SNPs accounts for a much larger share of Medicare Advantage enrollment than in any of the 50 states or the District of Columbia. For this reason, data for Puerto Rico is not shown on the maps for Figures 2 and 3.

Puerto Rico’s Medicaid program eligibility rules, benefits, delivery system and financing differ in some ways from those in the 50 states and the District of Columbia. For example, Puerto Rico does not cover most of the benefits that full-benefit dual-eligible individuals use such as long-term services and supports, and in Puerto Rico, cost-sharing assistance is provided to full-benefit dual-eligible individuals, but not to partial-benefit dual-eligible individuals, because Medicare Savings Programs are not available in Puerto Rico.

Methods for identifying dual-eligible individuals in Puerto Rico differed than in other states and DC. Please see methods in the following KFF analysis: How Do Dual-Eligible Individuals Get Their Medicare Coverage?


Methods and Limitations

This analysis uses data from the Centers for Medicare & Medicaid Services (CMS) Medicare Advantage Benefit and Landscape files for the respective year. Dual-eligible beneficiary enrollment is based on analysis of the Centers for Medicare & Medicaid Services (CMS) Chronic Conditions Data Warehouse (CCW) research-identifiable Master Beneficiary Summary File (MBSF) Base. The estimates are based on data from 5 percent of beneficiaries, 2010-2016; CCW data from 20 percent of beneficiaries, 2017-2021. The most recent snapshot of the dual-eligible population was available in 2021.

D-SNP enrollment data are from the Special Needs Plan (SNP) data published by CMS in the Medicare Advantage (MA)/Part D Contract and Enrollment Data section in March of the respective year. Enrollment data are only provided for plan-county combinations that have at least 11 beneficiaries; thus, we exclude any plans that do not meet this enrollment threshold. We excluded D-SNPs that were sanctioned by CMS, as these plans had no enrollment.

The 2021 count of dual-eligible individuals includes the 11.5 million individuals who had Parts A and B who were dual-eligible in March 2021. Other KFF analysis also require individuals to have Parts A and B, but allow them to be dual eligible at any point during the year, and thus have 12.9 million dual-eligible individuals in 2021.

Counts of dual-eligible individuals and D-SNP enrollees include both full-benefit and partial-benefit dual eligible individuals. Partial-benefit dual eligibles are eligible to enroll in D-SNPs in all but 7 states (Arizona, Hawaii, Idaho, Massachusetts, Minnesota, New Jersey, and Oregon). A limitation of this analysis is partial-benefit dual eligible individuals are not excluded from those 7 states when evaluating access to a D-SNP from 2010 to 2022.

Supplemental benefits in Medicare Advantage and Dual Special Needs Plans were identified using the 2023 Quarter 4 Centers for Medicare & Medicaid Services (CMS) Plan Benefit Package data. KFF defines a plan as offering a benefit if it is available to enrollees as either a mandatory or optional supplemental benefit. Optional supplemental benefits require an additional premium, which KFF does not examine in this analysis. KFF also does not examine all the extra benefits that Medicare Advantage and D-SNPs offer – for example, special supplemental benefits for the chronically ill.

Prior authorization data were obtained from organization determinations and reconsiderations – Part C data from the Centers for Medicare and Medicaid Services (CMS) Part C and D reporting requirements public use file for contract year 2021. Medicare Advantage insurers submit the required data at the contract level to CMS and CMS performs a data validation check. For the 2021 plan year, 114 contracts did not pass the data validation process, including all contracts for Elevance Blue Cross Blue Shield plans, and are excluded from this analysis. This analysis reflects data on service determinations and does not include claims determinations (for payment for services already provided). This analysis also does not include withdrawn or dismissed determination requests. KFF identified D-SNP-Only contracts by merging the plan-county enrollment data and plan type data. If all plans in the contract are a D-SNP, no matter the coordination type, this is considered a D-SNP-Only contract.

Addressing Abortion Access through State Ballot Initiatives

Authors: Mabel Felix, Laurie Sobel, and Alina Salganicoff
Published: Feb 9, 2024

This brief is not updated as efforts to get abortion-related measures on the ballot progress. For an up-to-date list of states that may have abortion-related state constitutional amendment measures on the ballot, please see our ballot tracker.

Updated on February 9, 2024

Key Takeaways

  • There are efforts underway to put constitutional amendments regarding abortion on the 2024 ballot in as many as 13 states: Arizona, Arkansas, Colorado, Florida, Iowa, Maine, Maryland, Missouri, Montana, Nebraska, Nevada, Pennsylvania, and South Dakota.
  • Since Dobbs, 6 states – California, Kansas, Kentucky, Michigan, Vermont, and Ohio – have voted on abortion related constitutional amendments, and the side favoring access to abortion prevailed in every state.
  • Citizen-initiated constitutional amendments are a powerful tool that is being utilized to allow voters to garner signatures to place abortion on the ballot without directly involving the legislature or the governor.
  • This approach, however, cannot be used in 15 of the states that currently have abortion bans or early gestational limits on the books because they do not have a pathway for citizens to place potential constitutional amendments on the ballot. In those states, the legislature controls the process.

Since the Supreme Court’s Dobbs decision overturning Roe v. Wade, voters in 6 states have weighed in on constitutional amendments regarding abortion. Every time these constitutional amendments have been on the ballot, voters have elected to approve measures that would explicitly protect abortion and deny those that sought to limit abortion. Since then, potential ballot initiatives have captured nationwide attention, and in 2024, 13 states may have abortion measures on their ballot. These measures seek to either explicitly affirm that the state constitution protects the right to abortion or that nothing in the constitution confers such a right. Advocates on both sides are hoping that having abortion on the ballot will motivate voter turnout in this election cycle. This issue brief explains why initiatives have become so popular with advocates on both sides of the issue, reviews the current initiatives that are in progress and may appear in on state ballots the next general election, and outlines the processes states have available to them to use to place initiatives on the ballot.

13 States May Have Abortion on the 2024 Ballot

Interest in Reproductive Rights Ballot Measures Post-Dobbs

State constitutional amendments have drawn much interest since SCOTUS’ decision in Dobbs because they provide more stable protections than laws or state Supreme Courts’ decisions recognizing a right to abortion. Laws are relatively easy to amend or repeal if there is a change in the make-up of the state legislature. For swing states, where neither party has a strong hold on the majority of the legislature, it is difficult to ensure that abortion protections or restrictions will not be repealed if there is a change in party control. Additionally, state Supreme Court rulings recognizing a right to abortion – or stating that there is no such right – in the state constitution may be overruled when there are subsequent changes in the make-up of the court. For example, the South Carolina Supreme Court ruled in January 2023 that the state’s 6-week ban was unconstitutional, but after the legislature appointed a new justice to replace a retiring justice, the Court reversed its ruling in August 2023 and found the restriction is constitutional. Constitutional amendments, on the other hand, would have to be repealed with a ballot measure receiving a majority of the popular vote.

Furthermore, in states where their supreme court has interpreted and recognized a right to abortion based on the state constitution, a constitutional amendment declaring there is no right to abortion would supersede the Court’s decision and allow abortion restrictions and bans to survive judicial review. For example, the goal of the 2022 Kansas ballot measure was to negate the state Supreme Court’s ruling that the Kansas constitution protects the right to abortion. If the ballot measure had passed and the Kansas constitution had been amended to state that nothing in it creates a right to abortion, the state legislature would have been able to ban or severely restrict abortion in Kansas. Conversely, in states where their supreme court has ruled the state constitution does not protect the right to abortion, amending the state constitution to include an explicit right to abortion would supersede supreme court precedent and require the court to block an abortion ban.

Importantly, aside from providing stronger, more stable protections and changing the judicial review of abortion laws, ballot measures seeking to amend state constitutions place issues directly in front of voters. In states where the legislature has sought to limit abortion in ways that are more restrictive than the public favors, a citizen-initiated ballot measure is a way to enact constitutional protections for abortion without directly involving the legislature or Governor. And once the constitution is amended, state policy makers cannot repeal these protections or fully ban or restrict abortion. Citizen-initiated ballot measures provide a direct pathway for the electorate to decide whether or not abortion should be legal in their state, regardless of how their elected representatives have decided to approach abortion policy. According to a recent KFF poll, nationally, the majority of voters say abortion should be legal in all or most cases.

Constitutional Ballot Measures in 2022 and 2023

Due to the advantages presented by ballot measures amending state constitutions, legislatures and citizen groups in several states have moved to add measures enshrining a right to abortion in their constitutions or declaring that there is no such right in the constitution. In 2022, there were four legislatively referred measures on the ballot regarding abortion or reproductive rights more broadly. In 2022, Michigan voters passed the first citizen-initiated constitutional measure protecting the right to abortion and in 2023, Ohio voters also passed a similar citizen-initiated constitutional measure protecting the right to abortion.

Abortion-Related State Ballot Measures Amending the State’s Constitution, 2022 and 2023

Constitutional Ballot Measures That May Be on the 2024 Ballot

Abortion rights groups are seeking to qualify ballot initiatives to uphold abortion rights in three states (Colorado, Montana, and Nevada) where there is no early gestational limit and in six states that ban abortion or have early gestational limits (Arizona, Arkansas, Florida, Missouri, Nebraska, South Dakota) in 2024. There is ongoing litigation challenging the abortion bans in most of these states, but without a constitutional amendment establishing a right to abortion, it is not certain that the respective supreme courts in these states will find the bans unconstitutional, or in the case of Florida, that the Court will uphold its prior decisions recognizing a right to abortion. However, if the initiatives establishing a right to abortion succeed in these states, abortion-rights advocates would have the certainty that these bans will be blocked in court.

Four state legislatures have constructed potential initiatives for constitutional amendments pertaining to abortion. The legislatures in Iowa and Pennsylvania have introduced measures that would amend the state constitution to declare that it does not protect the right to abortion. In Maine and Maryland, state representatives drafted initiatives protecting the right to reproductive freedom or autonomy (which includes the right to abortion). The Maryland initiative passed in the legislature and so far, is the only measure that is certain to appear on the 2024 ballot. The remaining legislatively-referred initiatives must pass in both chambers of the state legislatures, and the citizen-initiated measures are either gathering signatures, or awaiting initial approval or signature certification. See Appendix A for state-by-state details.

Pathways to Getting an Initiative on the Ballot

Legislatively-Referred Initiatives

For legislatively-referred initiatives seeking to amend a state constitution by the electorate, state legislators draft language for the initiative and introduce it to the legislature, in a process that is similar to how they introduce language for bills. Both chambers of the state’s legislature must vote to approve the language before it is placed on the ballot. In every state except for Delaware, initiatives seeking to amend a state’s constitution must be placed on the ballot and cannot be enacted without voter approval.

The process of approving a ballot initiative in the state legislature differs from state to state. While most states require the initiative to pass only once in the legislature, some states require it to pass over two successive legislative sessions. States also have differing requirements for what percentage of the legislature must vote in favor of the initiative for it to move forward, ranging from a simple majority to a two-thirds majority. Once the measure is on the ballot, there are also differing requirements for what share of the votes it must receive to become law.

Citizen-Initiated Measures

Citizens are allowed to propose a constitutional amendment for the ballot in 17 states. The rules for doing so differ slightly from state to state, but generally, citizen groups must submit a draft of the proposed amendment and ballot title to a government official – usually the Secretary of State – for approval. Once the petition has been approved, groups must gather signatures in support of their measure, often with distribution requirements across the states’ congressional districts, and submit their support signatures for validation. If enough signatures from a sample are deemed valid, the measure is cleared to be on the ballot, where it must receive anywhere from a simple majority to 60% of the vote in favor to be approved.

In 17 States, Citizens Can Place Potential Constitutional Amendments on The Ballot

There are different stages of review for ballots in each state. Some states require that ballot measures address only one subject, and the reviewing body or official might reject a petition if they decide it violates this requirement. Petitions may also be rejected if they contain vague or confusing language. However, beyond these considerations, state officials are generally not allowed to reject a petition based on its substance. In the past few years, this has meant that state attorneys general, secretaries of state, or electoral boards that oppose abortion have nevertheless had to approve petitions for ballot measures that would enshrine the right to abortion in the state’s constitution. This has also resulted in state legislatures taking steps to attempt to make it more difficult for measures to pass or even get on the ballot in the first place. For instance, in Ohio, Missouri, Florida, Oklahoma, and Utah, these attempts have included proposed measures to increase the percentage of the vote needed for the ballot initiative to pass. Lawmakers in Missouri and North Dakota have additionally attempted to increase the number of signatures needed to get a measure approved. The North Dakota 2024 constitutional ballot measure additionally seeks to require that constitutional ballot initiatives pass in two separate elections (the primary and general elections) before they can successfully amend the constitution.

Citizen-Initiated Ballot Measures Are Not an Option in All States

Not every state has a pathway for a citizen-initiated constitutional amendment. In twelve states that currently ban abortion or have early gestational limits in effect, there is no process for a citizen-initiated ballot measure. Three additional states (Wyoming, Iowa, and Utah) that have abortion bans currently blocked by courts, also have no process for a citizen-initiated ballot measure. In these fifteen states, unless the state legislatures repeal their bans, the only avenue reproductive rights supporters have to potentially change the legal status of abortion, short of electing pro-choice legislators and policy makers, is to challenge these bans in court. If the State Supreme Court upholds the bans, they will remain in place. This is the current situation in Idaho, Indiana, and South Carolina. Their respective supreme courts ruled their state constitutions do not protect the right to abortion and that the states’ abortion bans are constitutional. Since these rulings, abortion-rights advocates have not had any avenues to change the legal status of abortion in these states. Litigation challenging abortion bans in seven other states (Georgia, Iowa, Kentucky, Louisiana, North Carolina, Utah, Wyoming) with bans and no process for a citizen-initiated ballot measure is making its way through the courts. There are no legal challenges to the bans in Alabama, Mississippi, or West Virginia.

15 States with Abortion Bans or Early Gestational Limits Do Not Have a Pathway for Citizen-Initiated Constitutional Amendments

Moreover, three states with abortion bans in place and no process for a citizen-initiated ballot measure (Louisiana, Tennessee, and West Virginia), have state constitutional amendments that explicitly state their constitutions do not protect the right to abortion. These amendments preclude these states’ Supreme Courts from ruling that an abortion ban is unconstitutional because it violates a right to abortion. In other words, the only way for the legal status of abortion to change in these states is for their legislatures to repeal their bans or pass a new constitutional amendment protecting the right to abortion. In two of these states (Louisiana and Tennessee) and in Idaho, Indiana, and Texas, there is ongoing litigation focused only on whether the exceptions to the bans are constitutional, but not challenging the underlying bans

Citizen-Initiated Ballot Measures for State Statutes

In 21 states, citizens can initiate laws and place proposed laws on the ballot. The process for placing on the ballot an initiative that would enact a law is very similar to that for placing constitutional amendment initiatives, except that they typically require either fewer signatures for approval or fewer affirmative votes to pass. Some states with processes for statute ballot initiatives restrict the legislature’s ability to repeal or amend laws initiated by citizens. Other states simply treat these laws as they would any other law written by state representatives, and as such, can be repealed or amended as easily as any other law. This process allows citizens to propose laws that the current state legislators would not support. Currently, there are two proposed citizen-initiated statutes, brought by anti-abortion advocates, that may appear on the 2024 ballot, one in Colorado and the other in Nebraska. Both proposed statutes would ban abortion in each respective state, and both have been cleared for signature gathering. If they obtain the required number of signatures, these measures may appear on the ballot in 2024. In both states, abortion rights supporters are also seeking to place constitutional amendments protecting the right to abortion on the ballot. The placement of a statute seeking to ban abortion, and a constitutional amendment to protect the right to abortion on the same ballot is anticipated to cause confusion. In the unlikely event that both measures pass, the constitutional amendment would block the implementation of the abortion ban.

Looking Ahead

When the Supreme Court’s decision in Dobbs gave states the ability to ban or limit abortion, the legal landscape at the state level was activated as never before. In many states, legislators moved quickly to pass new statutes banning, or severely limiting access to abortion, and reproductive rights supporters turned to courts to challenge many of these new and already-existing laws. As the legality of and restrictions of abortion has been debated in state legislatures and courthouses, ballot measures amending state constitutions have emerged as a potential tool for proponents on both sides of the issue. State constitutional amendments explicitly stating whether the state’s constitution protects the right to abortion offer more stable protections for individuals’ right to abortion or the state’s right to ban abortion. These initiatives are being closely watched and it remains to be seen whether they will have an impact on voter turnout, as well as the outcome of candidate races.

Additionally, as the post-Dobbs legal landscape has shifted and begun to settle, many states have abortion laws on the books that do not reflect popular sentiment around abortion. Citizen-initiated constitutional ballot measures allow citizens to put abortion rights directly before the voters, although this is not an option in every state. Still, in many of the states where this is an option, advocacy groups on both sides of the issue are seeking to use this powerful tool to address the legality of abortion in their state.

Appendix

Abortion-Related State Constitutional Amendment Measures Potentially on the 2024 Ballot, as of January 23, 2024
News Release

New $2,000 Medicare Part D Cap Could Reduce Out-of-Pocket Drug Costs for Over One Million Beneficiaries Beginning Next Year, Including Tens of Thousands of Beneficiaries in Most States 

Millions More Will Reach the Spending Threshold and Benefit From the Cap Over Time

Published: Feb 8, 2024

A KFF analysis shows that a new out-of-pocket spending cap in Medicare Part D could translate into savings for well over 1 million beneficiaries when it takes effect next year, including more than 100,000 people each in California, Florida and Texas, based on analyses of drug spending in 2021.

The $2,000 cap, part of the Inflation Reduction Act of 2022, will lead to thousands of dollars in savings for Medicare patients who take high-cost drugs for cancer, rheumatoid arthritis, and other serious conditions. This new limit follows the elimination this year of a longstanding requirement that Part D enrollees pay 5% of their drug costs out-of-pocket after their drug expenditures reach a certain threshold. 

Based on KFF’s review of Part D drug claims data, if the cap been in place in 2021, 1.5 million Medicare beneficiaries would have benefited because their out-of-pocket costs for prescription drugs exceeded $2,000. Of the total 1.5 million, about 200,000 Medicare beneficiaries spent $5,000 or more for their prescriptions that year, while another 300,000 expended between $3,000 and $5,000. The rest spent between $2,000 and $3,000. 

Moreover, the number of people who will see savings from the cap will rise over a longer period of time. A total of 5 million Part D enrollees had out-of-pocket drug costs of $2,000 or more in at least one year during the 10-year period ending in 2021, for instance.

In most states, tens of thousands of Medicare beneficiaries could save money from the new cap next year. In six states — New York, Pennsylvania, Ohio, Illinois, North Carolina, and New Jersey — between 50,000 and 82,000 beneficiaries spent more than $2,000 out-of-pocket for prescription drugs in 2021. The numbers were higher in California, Florida, and Texas, where more than 100,000 Part D enrollees exceeded the threshold that year.