Former President Donald Trump and President Joe Biden are now the presumptive nominees for the Republican and Democratic parties, and their respective records as president and their campaign platforms suggest very different visions for the future of U.S. health care. This new KFF Health Tracking Poll looks at voters’ views of some of the country’s major health and entitlement programs and how these views line up with the candidates’ approaches to these issues based on their track records, policy positions, and statements on the campaign trail. While previous polls show that many other issues outrank health care on voters’ minds this election cycle (and issues are only one part of how voters make decisions), these findings help illustrate how voters may react to talking points about health care that the candidates may make during the course of the campaign.
Key Takeaways
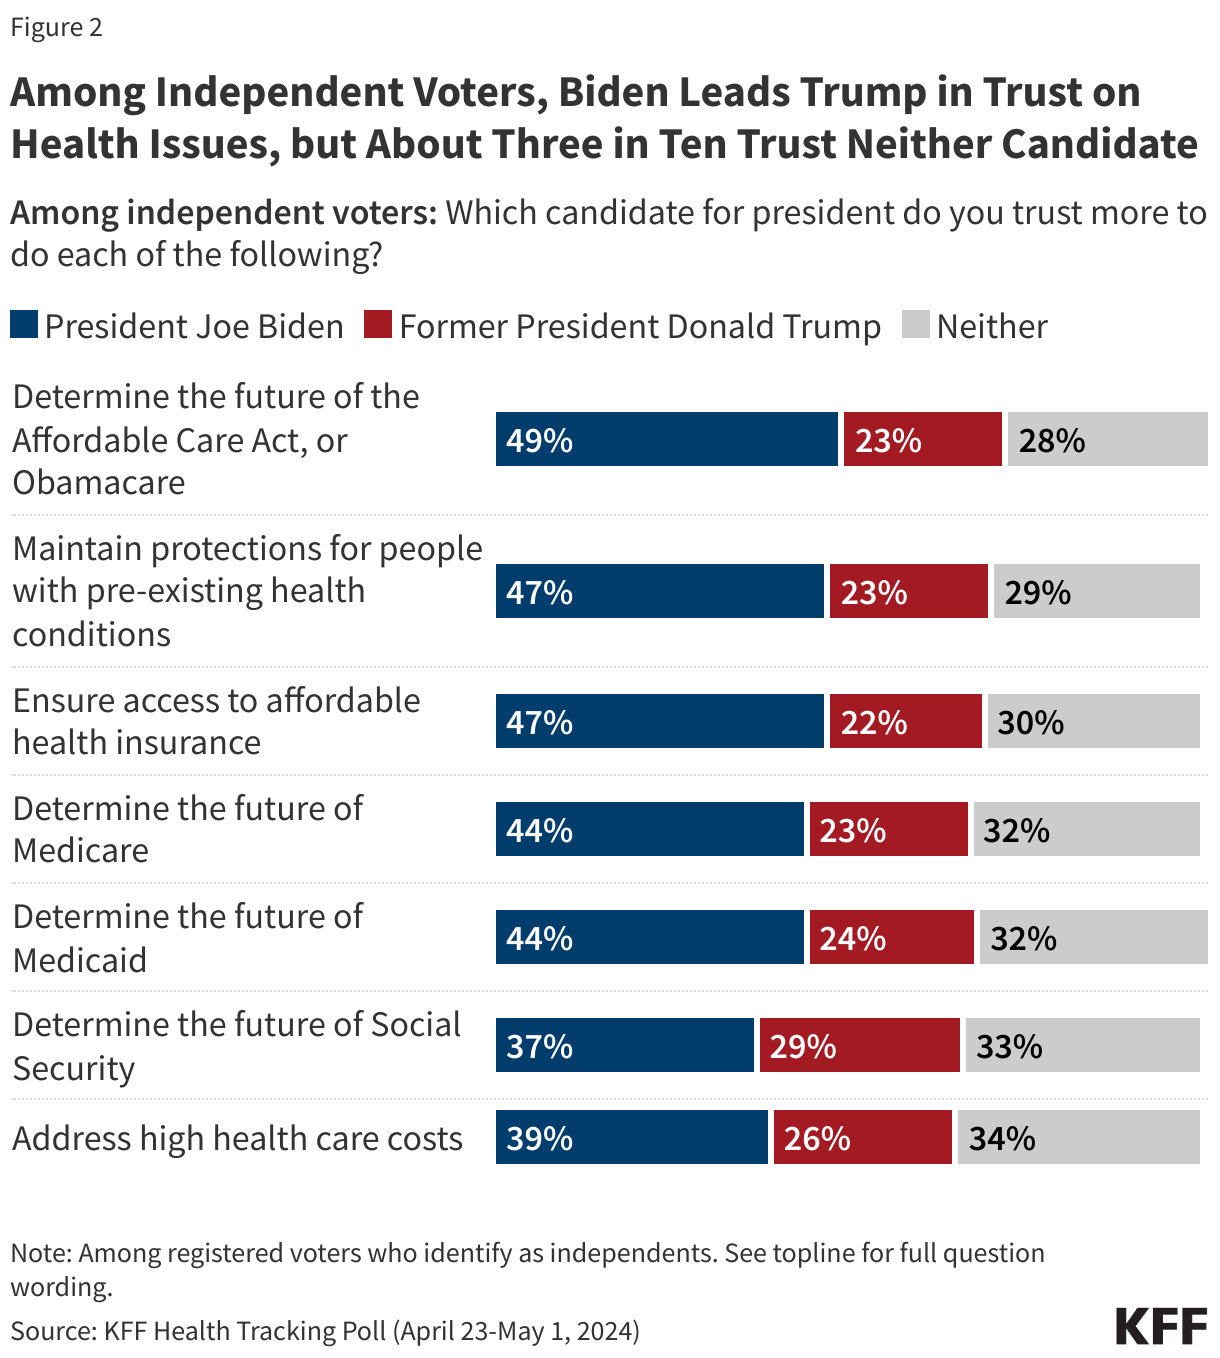
- Six months out from the 2024 presidential election, partisans predictably put more trust in their own party’s candidate on health issues, but President Biden has a clear trust advantage over former President Trump with independent voters, a key voting group, on many areas of health care. For example, when it comes to addressing high health care costs, an issue that rises to the top of many voters’ priority lists, while neither candidate has a majority of trust among independent voters, Biden has an advantage over Trump (39% v. 26%), with 34% of independent voters saying they trust neither candidate on this issue.
- Most voters overall are still unaware of the Medicare drug pricing provisions in the Inflation Reduction Act (IRA) that President Biden signed into law, but awareness is higher and has increased since November among older voters and among Biden’s base of Democratic voters. Large shares of voters across partisan groups also support Biden’s proposals to extend some of the IRA’s drug provisions to cover all adults with private insurance, including capping monthly costs for insulin and placing a limit on out-of-pocket prescription drug costs. Voters are also supportive of expanding the Medicare prescription drug price negotiation of the IRA to cover a larger number of drugs, with three-quarters saying more drugs should be subject to price negotiations, including majorities across partisanship.
- While most voters are supportive of the proposals President Biden has made for addressing prescription drug costs, most are pessimistic about what either candidate would accomplish in this area if elected. Among independent voters, Biden has a slight edge, with half saying it is likely that his administration’s policies will lower prescription drug costs if he is elected, compared to about four in ten who say the same about Trump.
- Regarding abortion policy, a key voting issue for Democratic and younger voters in this election, a majority of voters (62%) support guaranteeing a federal right to abortion while fewer (42%) support leaving it up to individual states to decide the legality of abortion. Majorities of Democratic voters and stronghold Democratic groups such as young voters and Black voters are supportive of a federal guarantee, while a majority of Republican voters support leaving the legality of abortion up to individual states. Notably, support among Democratic voters for a federal guarantee (89%) is higher than support among Republican voters for leaving abortion policy up to the states (60%).
- When it comes to determining the future of the nation’s major entitlement programs – Social Security, Medicare, and Medicaid – older voters give a clear advantage to President Biden. Majorities of voters are worried that, in the future, people covered by Medicare, Social Security, and Medicaid won’t be able to get the same level of benefits that are available today, and many also agree that fraud, waste, and abuse are problems in these programs, which is a criticism that former President Trump has made. For context, most voters also see fraud, waste, and abuse as a major problem in private health insurance plans.
- Asked about the future of Medicaid, seven in ten voters want Medicaid to largely continue as it is today, while three in ten support changing Medicaid to cap federal funding and give states greater flexibility in designing their programs (a recurrent Republican proposal sometimes referred to as a Medicaid block grant). While large shares of Democratic and independent voters prefer to keep Medicaid as it is today, Republican voters are evenly divided, with about half preferring to keep Medicaid as is and half supporting a cap on federal spending.
- While a majority of voters have favorable views of the ACA, attitudes towards the law overall continue to be marked by partisanship. One-third of Republican voters now view the law favorably (up from 11% when the law was passed), but three-quarters of Republican voters say they would support “repealing and replacing” the ACA. Previous polling and past repeal efforts have shown that public support for repeal erodes considerably when popular provisions like the protections for people with pre-existing conditions are put at risk, so while these views don’t necessarily imply enduring support for repealing the ACA, they do suggest there is some receptivity among Republican voters for “repeal and replace” as a talking point. Notably, about four in ten Republican voters think Trump will try to repeal the entire ACA if elected, compared to two-thirds of Democratic voters.
- Despite divided views on the ACA overall, there is majority support for strengthening one key piece of the ACA: about seven in ten voters – including majorities across partisanship – support extending enhanced financial assistance for people who purchase health coverage through the ACA marketplace. Currently, enhanced subsidies that were provided in recent years are set to expire at the end of 2025.
Biden Has Trust Advantage On Many Areas of Health Care, But Trump Ties On Addressing High Costs
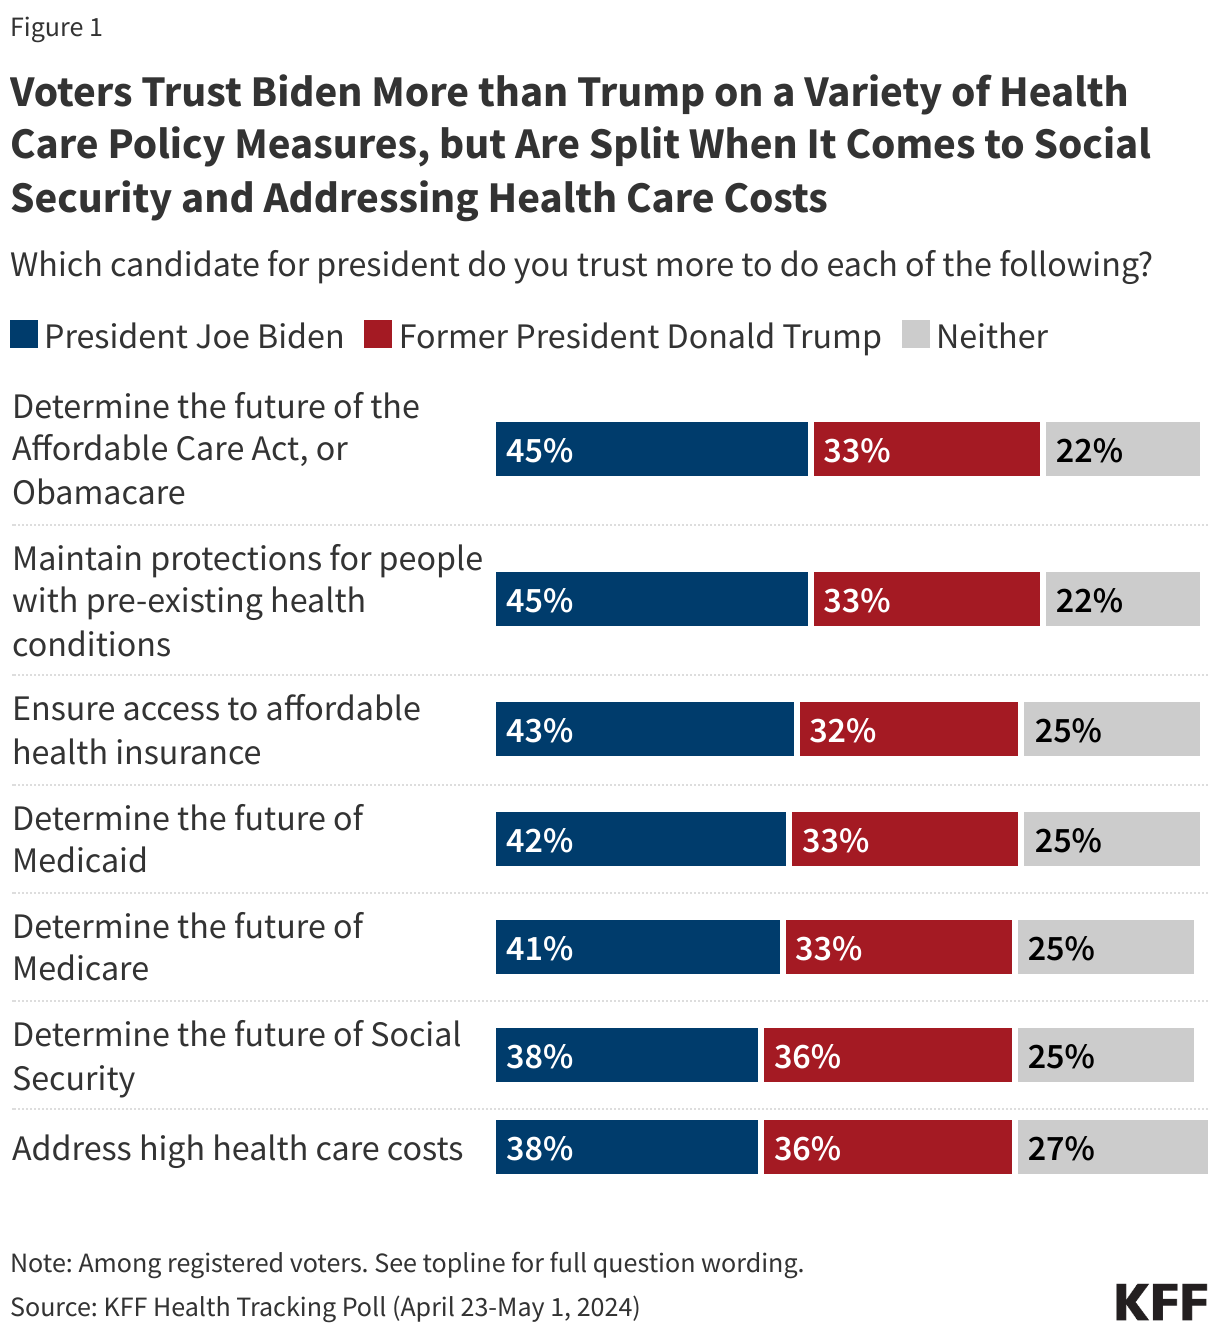
When it comes to trust of the presumptive 2024 presidential candidates, larger shares of voters trust President Joe Biden than former President Donald Trump on several key health care policy issues, but neither candidate has a clear lead when it comes to addressing high health care costs, with similar shares of voters saying they trust Biden (38%) and Trump (36%).
Not surprisingly, voters are split along party lines in their trust of the presumptive candidates on health care issues, with Democrats largely trusting Biden over Trump and Republicans trusting Trump over Biden. Still, even among partisans, substantial shares say they trust “neither” candidate on some health care issues. For example, about one in five Democratic voters and Republican voters say they trust “neither” candidate to address high health care costs.
Independent voters are more likely to say they trust Biden more than Trump in each are of health care, including addressing care costs. Biden has a notable trust lead among independent voters when it comes to determining the future of the ACA (49% v. 23%), ensuring access to affordable health insurance (47% v. 22%), and maintaining protections for people with pre-existing health conditions (47% v. 23%) and a substantial lead on determining the future of Medicare (44% v. 23%) and Medicaid (44% v. 24%). When it comes to addressing high health care costs, independent voters give the edge to Biden, with four in ten (39%) saying they trust him more compared to a quarter (26%) for Trump. However, a third (34%) of independent voters say they don’t trust either candidate.
Voters’ Views in Key Health Policy Areas
Prescription Drug Prices
Lowering prescription drug prices has been a frequent talking point of both President Biden and former President Trump. While Trump kept drug prices on the political agenda during his time as president, his administration ultimately did little to contain them. President Biden has touted passage of the Inflation Reduction Act (IRA), including its provisions aimed at lowering prescription drug prices for people with Medicare, as one of the signature achievements of his administration.
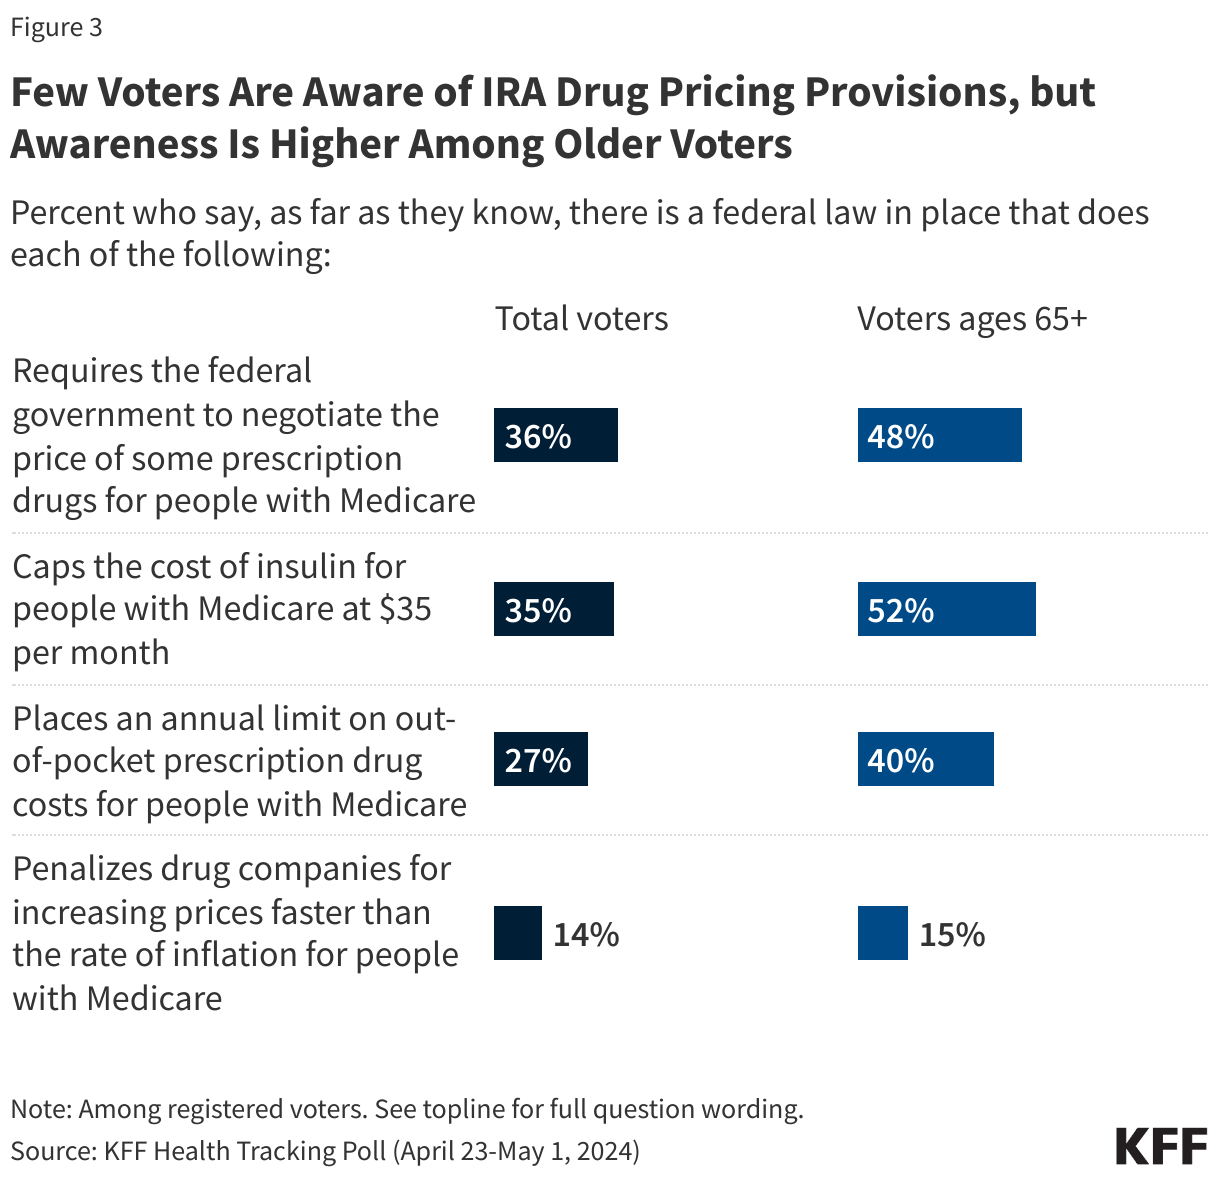
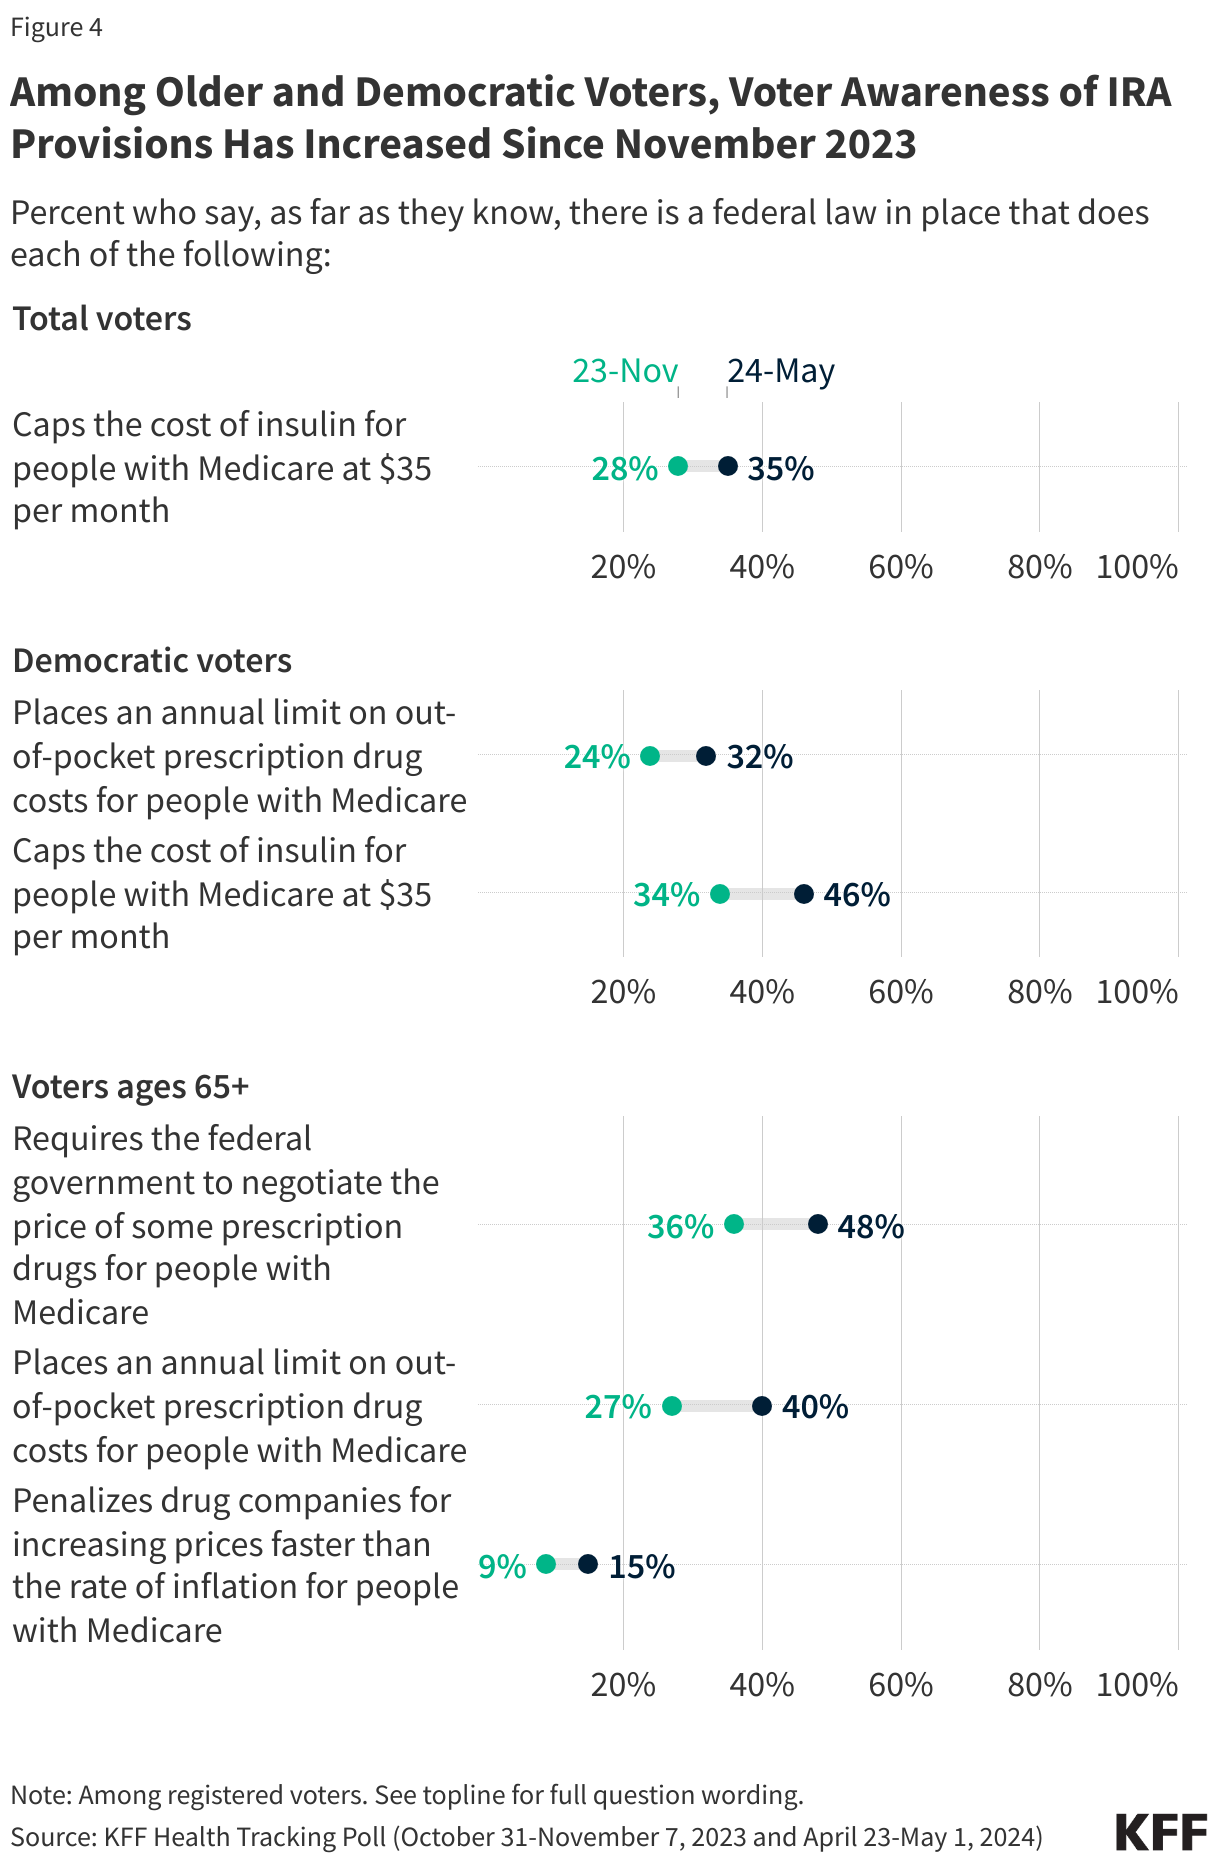
Most voters overall are unaware of the Medicare drug pricing provisions in the IRA, but awareness is higher among older voters and among Biden’s base of voters who identify as Democrats. Overall, about a third of voters correctly say there is a federal law in place that requires the federal government to negotiate the price of some prescription drugs for people with Medicare (36%) or one that caps the cost of insulin for people with Medicare (35%), while about a quarter (27%) know there is a law that limits annual out-of-pocket prescription drug costs for people with Medicare and one in seven (14%) know there is a law that penalizes drug companies for increasing prices for Medicare faster than the rate of inflation.
Awareness of these provisions is higher among voters ages 65 and older – a group that is mostly covered by Medicare and tends to vote at higher rates than younger adults. About half (52%) of older voters are aware of the IRA’s $35 cap on insulin for people with Medicare and a similar share (48%) correctly identify that there is a law that requires the federal government to negotiate the price of prescription drugs for Medicare enrollees.
Across partisans, fewer than half of Democrats, independents, and Republican voters are aware of any of these health care provisions. However, Democratic voters are more likely than Republican voters to correctly say there is a law that caps the cost of insulin for people with Medicare at $35 per month (46% v. 28%) or requires the federal government to negotiate the price of some prescription drugs for people with Medicare (43% v. 32%).
Voter awareness of the IRA’s $35 insulin cap for people with Medicare has increased by about seven percentage points since November 2023 when about a quarter (28%) of voters were aware of this provision of the IRA. Awareness of the IRA’s other Medicare drug pricing provisions has not changed significantly among all voters since November, but there have been increases in awareness of some provisions among Democratic voters and older voters, suggesting that Biden’s campaigning on the successes of the IRA may be breaking through with some groups.
Among Democratic voters, between November 2023 and May 2024 there was a 12 percentage point increase in the share correctly identify the cap on insulin (from 34% to 46%) and an 8 percentage point uptick in awareness of the law placing limits on out-of-pocket prescription drug costs for people with Medicare (from 24% to 32%). Similarly, among voters ages 65 and older, the share who are aware there is a federal law that limits annual out-of-pocket prescription drug costs for people with Medicare increased from 27% to 40% between November and May, the share who are aware of the negotiation provision increased from 36% to 48%, and the share who are aware there is a law that penalizes drug companies for increasing prices faster than the rate of inflation for people with Medicare from 9% to 15%.
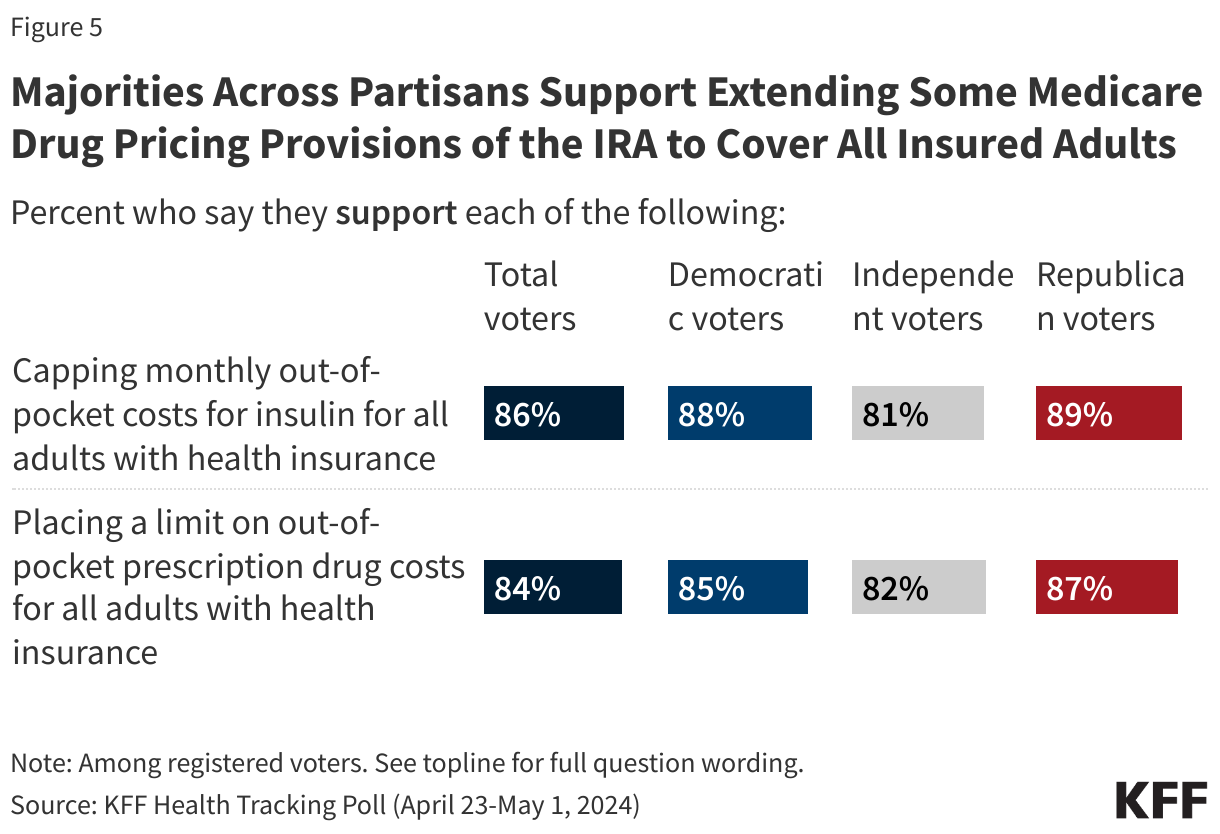
President Biden has expressed support for several policies that would extend some of the prescription drug provisions of the IRA to cover all adults with private insurance. The KFF Health Tracking Poll finds that large shares of voters support these proposals, including capping monthly out-of-pocket costs for insulin for all adults with health insurance (86%) and placing a limit on out-of-pocket prescription drug costs for all adults with health insurance (84%).
Large majorities across partisans support both drug pricing provisions, including nearly nine in ten Democratic voters (88%) and Republican voters (89%) who support capping out-of-pocket costs for insulin and similar shares who support placing an out-of-pocket limit on prescription drug costs (85% of Democrats and 87% of Republicans).
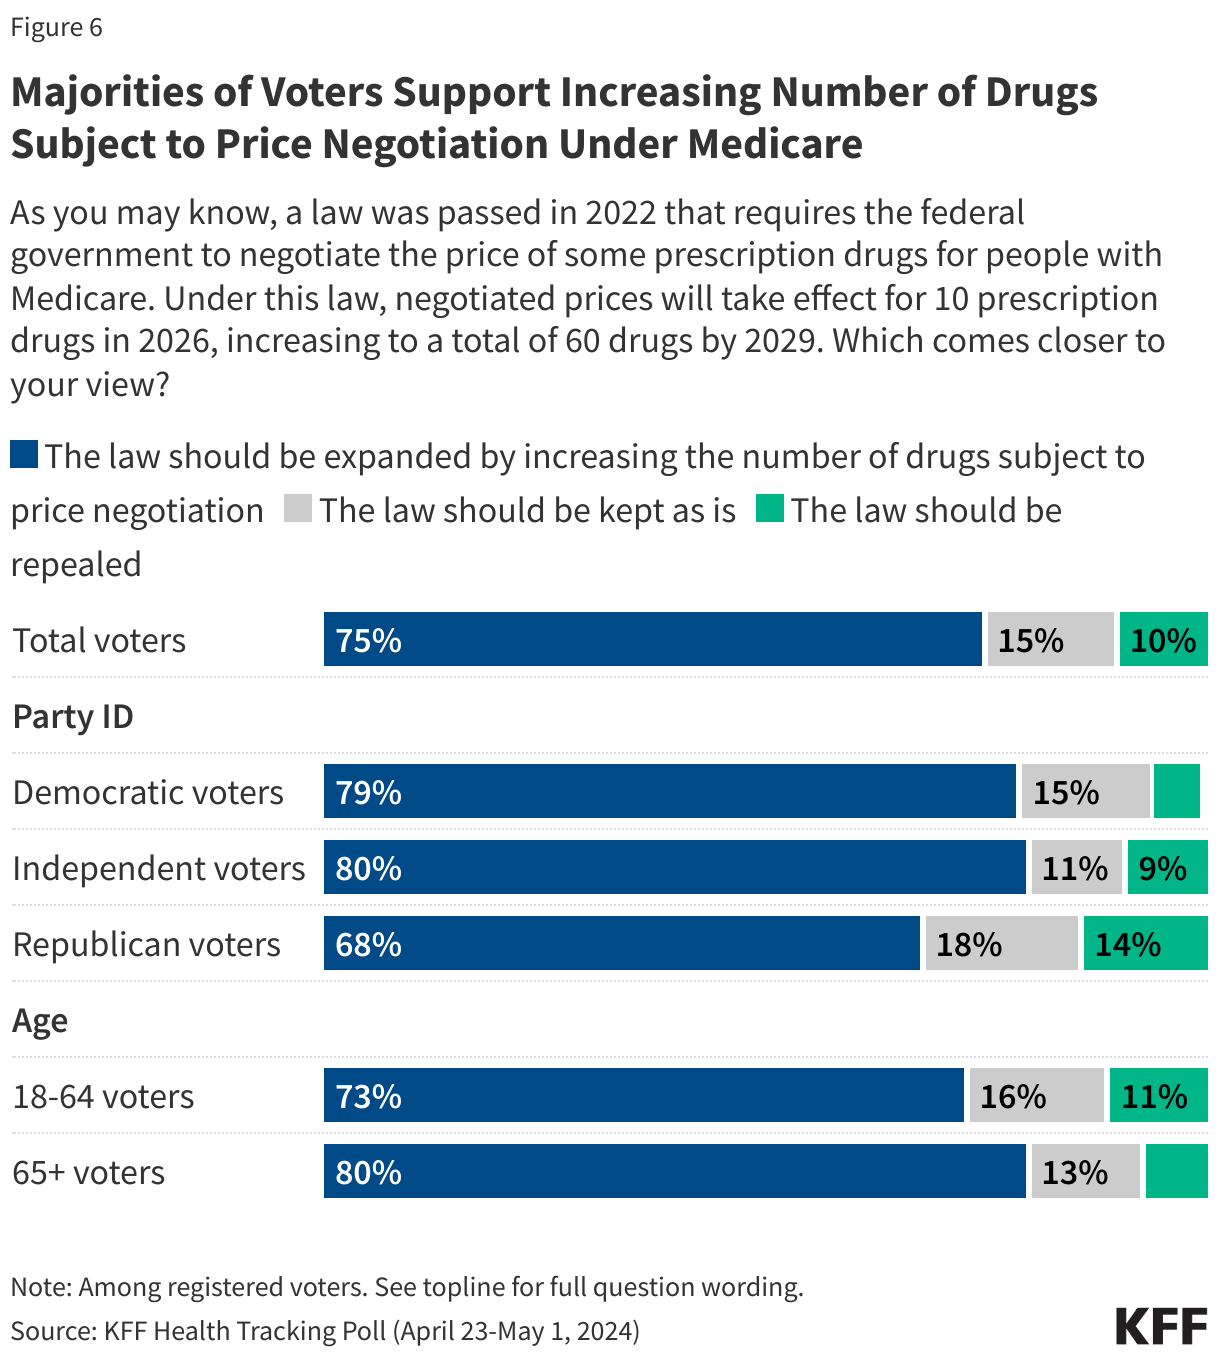
Voters are also supportive of expanding the Medicare prescription drug price negotiation of the IRA to cover a larger number of drugs. Under the law, negotiated prices will take effect for 10 prescription drugs in 2026, increasing to a total of 60 drugs by 2029. Three-quarters (75%) of voters say the law should be expanded by increasing the number of drugs subject to price negotiation. Another 15% think the law should be kept as is, while one in ten (10%) voters want the law to be repealed.
Among the biggest proponents for expansion of the drug price negotiation aspect of Medicare are those ages 65 and older (80% want the law to be expanded) and Democratic (79%) and independent (80%) voters. However, a majority of Republicans (68%) also agree that the law should be expanded.
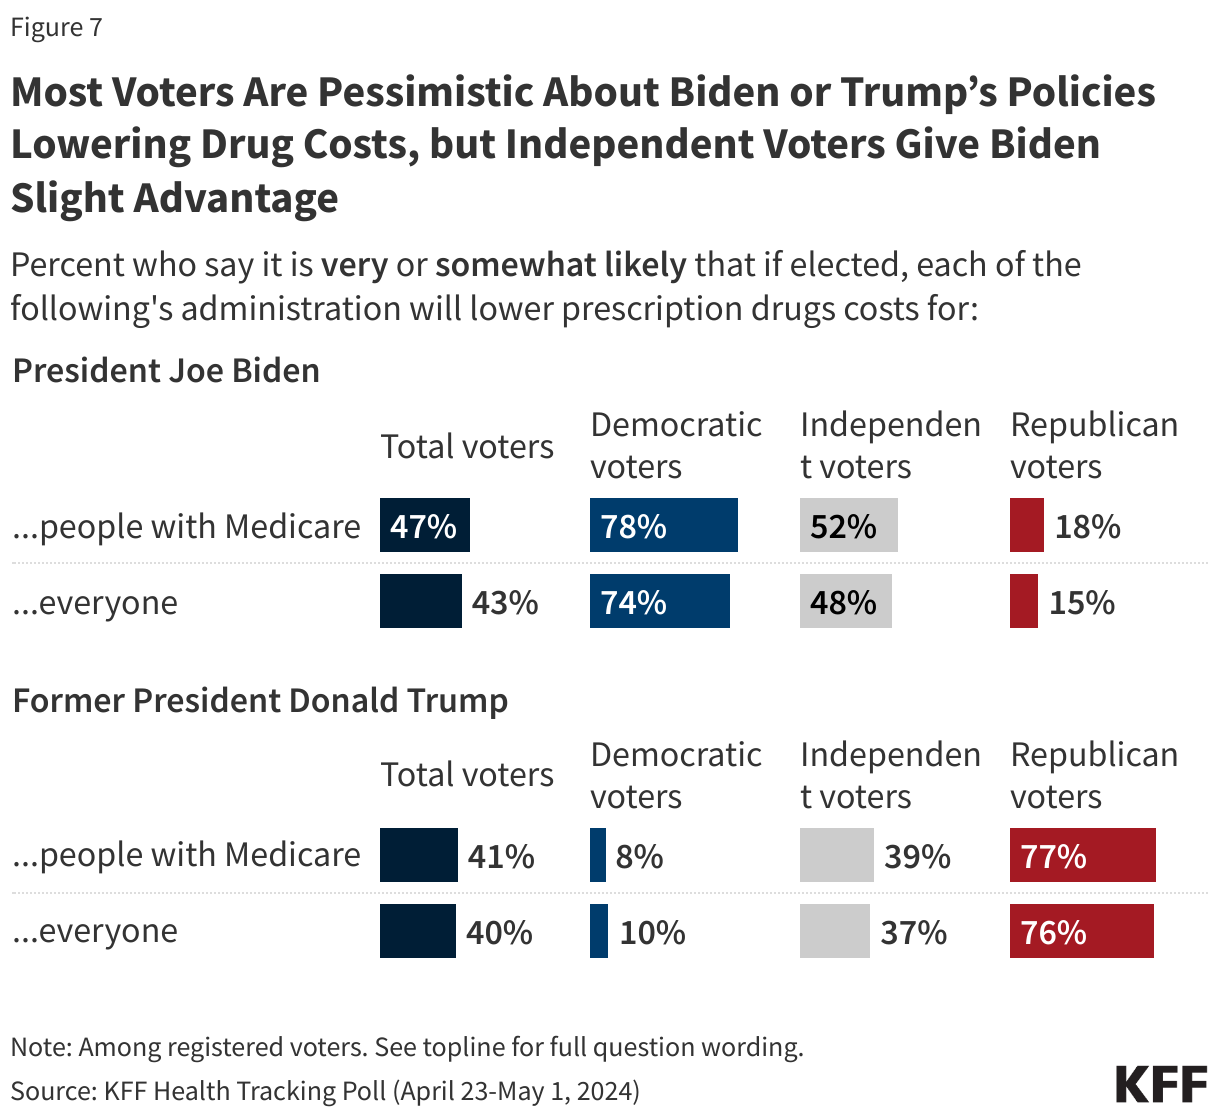
While most voters are supportive of the proposals President Biden has made for addressing prescription drug costs, most are pessimistic about what either candidate would accomplish in this area if elected, with fewer than half saying it is “very” or “somewhat” likely that Biden’s policies would lower prescription drug costs for people on Medicare (47%) or for everyone (43%) if he were re-elected. About four in ten voters say the same about former President Trump (41% for people with Medicare, 40% for everyone).
Not surprisingly, majorities of partisans say they think it is likely their party’s respective candidate will lower drug costs if elected, while few say the same about the other party’s candidate. Among independent voters, about half think it is likely that Biden’s policies would lower prescription drug costs for people with Medicare (52%) or for everyone (48%), while slightly fewer say the same about Trump (39% and 37%, respectively).
Abortion Policy
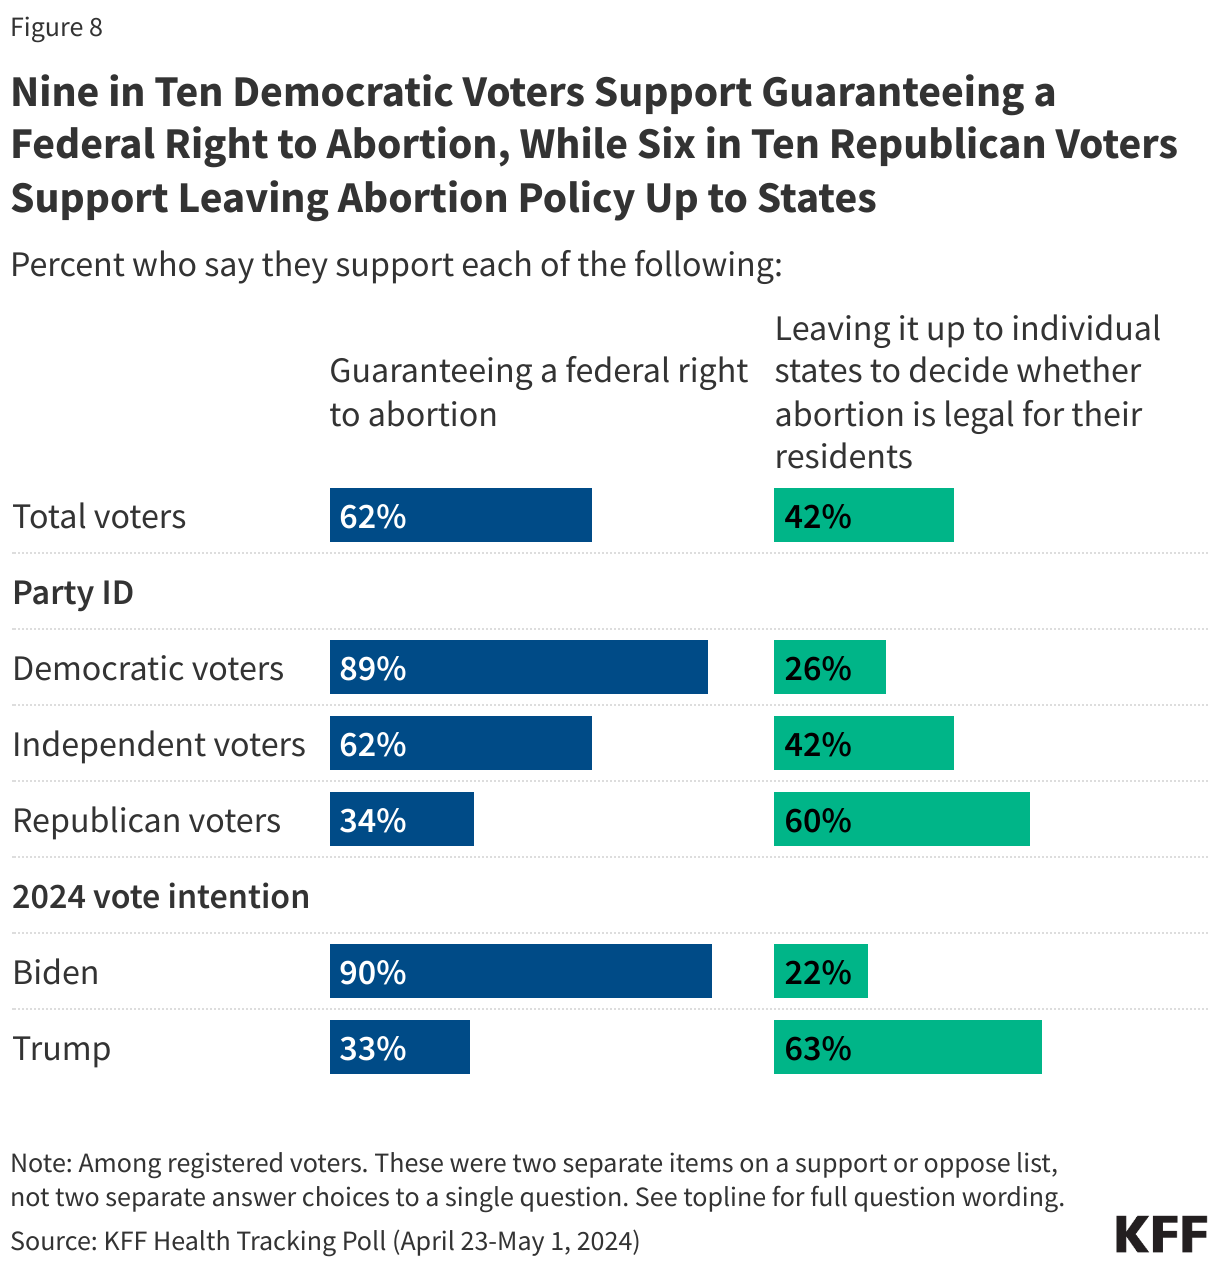
The March KFF Health Tracking Poll provided an extensive look at voters’ views of abortion and the role it may play in the upcoming election. In this poll we examine voter support for two approaches to abortion policy for which President Biden and former President Trump have voiced support. President Biden has expressed support for a federal right to abortion while former President Donald Trump has stated that abortion policies should be left to the states. When it comes to abortion policy – a key voting issue for Democratic and younger voters in this election – a majority of voters (62%) support guaranteeing a federal right to abortion while fewer (42%) support leaving it up to individual states to decide the legality of abortion1 .
About nine in ten (89%) Democratic voters support guaranteeing a federal right to abortion compared to about six in ten independent voters (62%) and one-third of Republican voters (34%). Conversely, about six in ten Republican voters support leaving abortion up to individual states compared to 42% of independent voters and a quarter (26%) of Democratic voters.
Those who plan on voting for Biden in 2024 (90%), Democrats (89%), young voters ages 18-29 (79%), and Black voters (78%) are among the largest groups in support of guaranteeing a federal right to abortion. Majorities of those who plan to vote for Trump in 2024 (63%) and Republican voters (60%), support leaving abortion up to individual states.
Health and Entitlement Programs
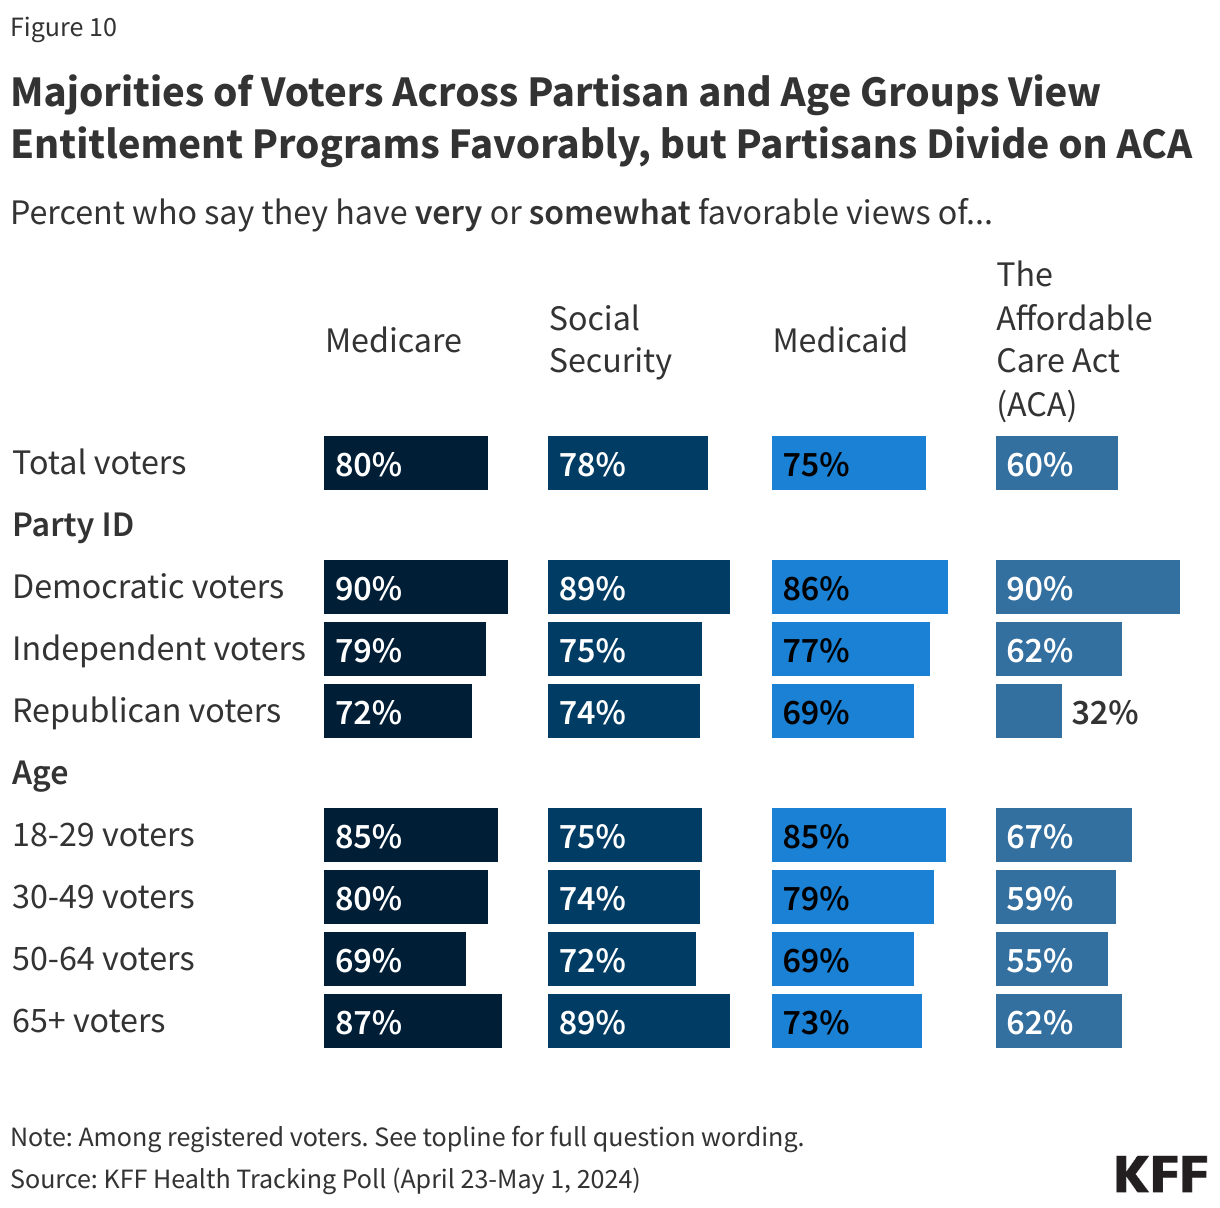
Besides issues of prescription drugs prices for Medicare, there are signs that Trump and Biden would approach the future of the nation’s major health and entitlement programs differently if elected. Majorities of voters have a favorable opinion of the major entitlement programs, with at least three in four voters saying they have a “very” or “somewhat” favorable opinion of Medicare (80%), Social Security (78%), and Medicaid (75%). A smaller share of voters – but still a majority — say they have a favorable opinion of the Affordable Care Act (ACA), or Obamacare (60%). While its passage and enactment were embroiled in partisan battles, the public has consistently held a more favorable than unfavorable view of the ACA since 2018.
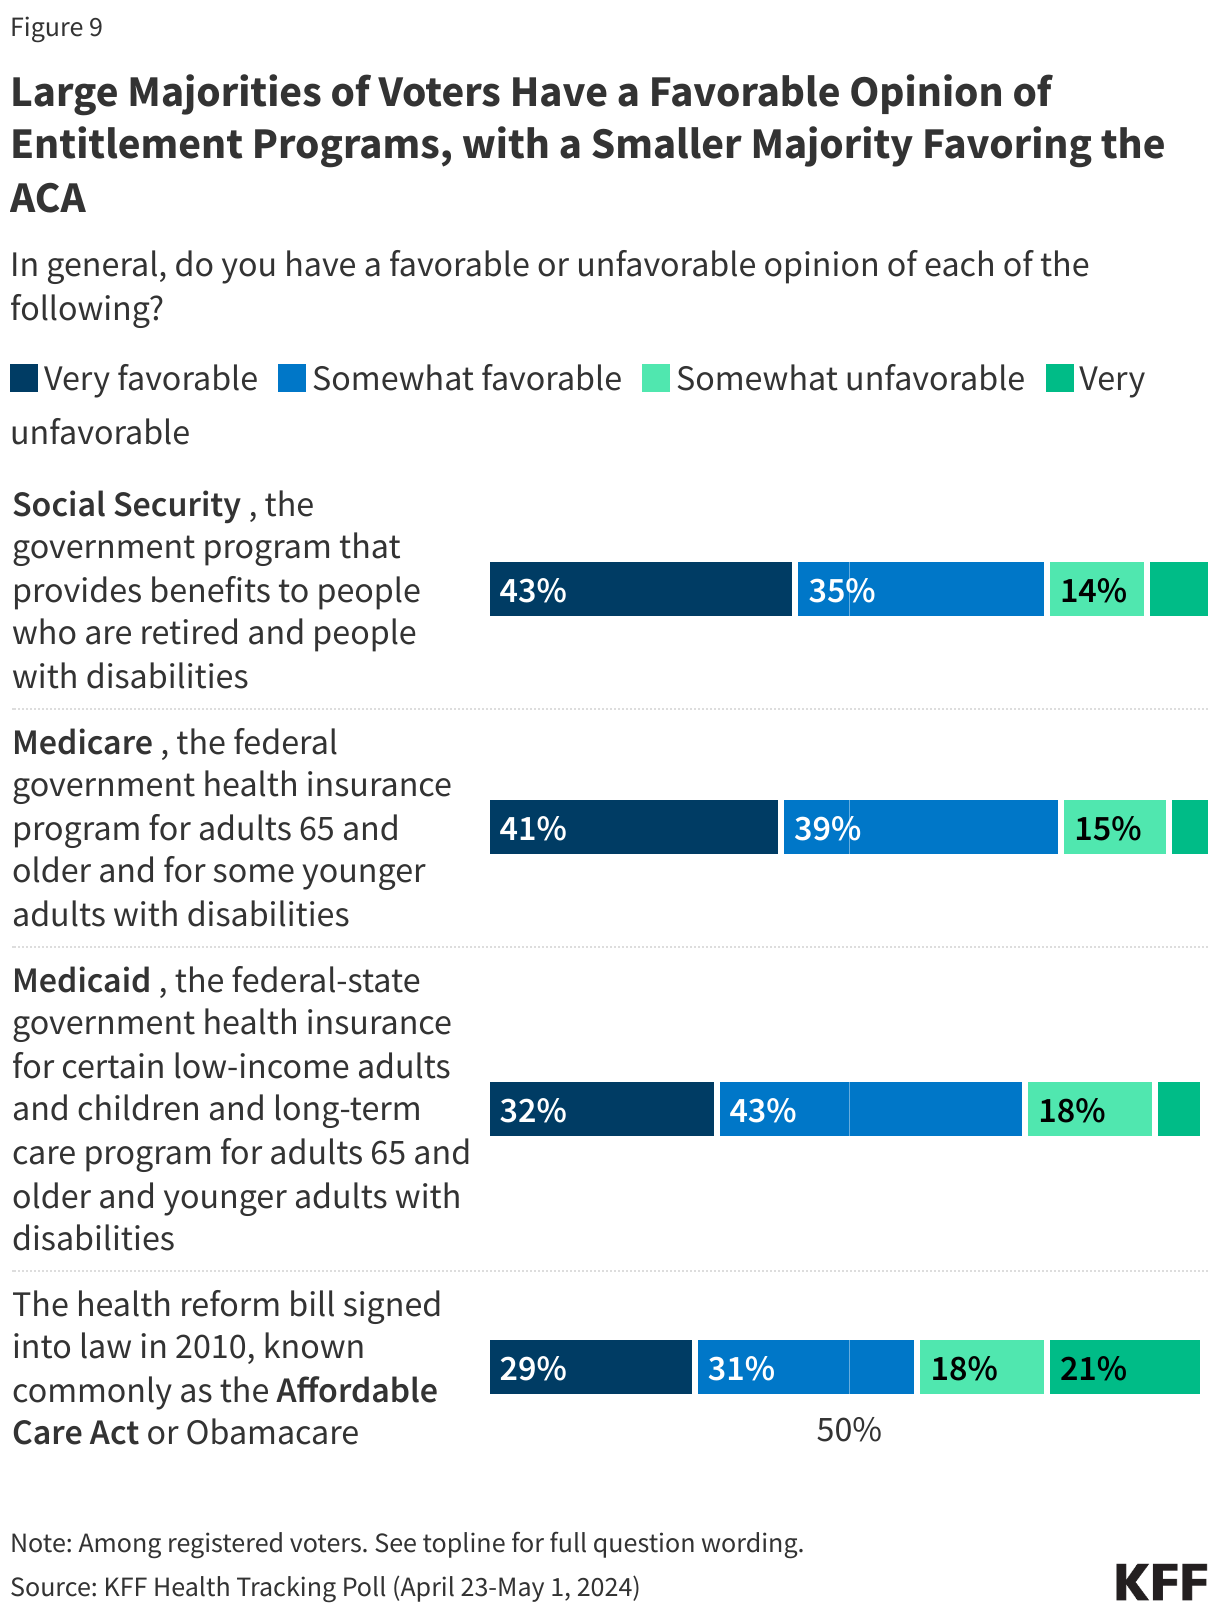
While Democratic voters are somewhat more likely than Republican voters to express favorable views of Medicare, Medicaid, and Social Security, majorities across partisans are favorable towards each of these programs. Partisan divisions are more notable when it comes to the ACA, with nine in ten Democratic voters (90%) holding favorable views of the ACA compared to a third (32%) Republican voters – a share that has increased since the law was enacted (in April 2020, just 11% of Republican voters had a favorable view of the law).
Medicare, Social Security, Medicaid, and the ACA are also popular with voters across age groups, although voters ages 65 and older are somewhat more likely than younger voters to express favorable opinions of Social Security and Medicare – programs that largely provide benefits to older adults. In turn, younger voters ages 18-29 are more likely than older voters to have a favorable opinion of Medicaid.
Future of Medicare, Social Security, and Medicaid
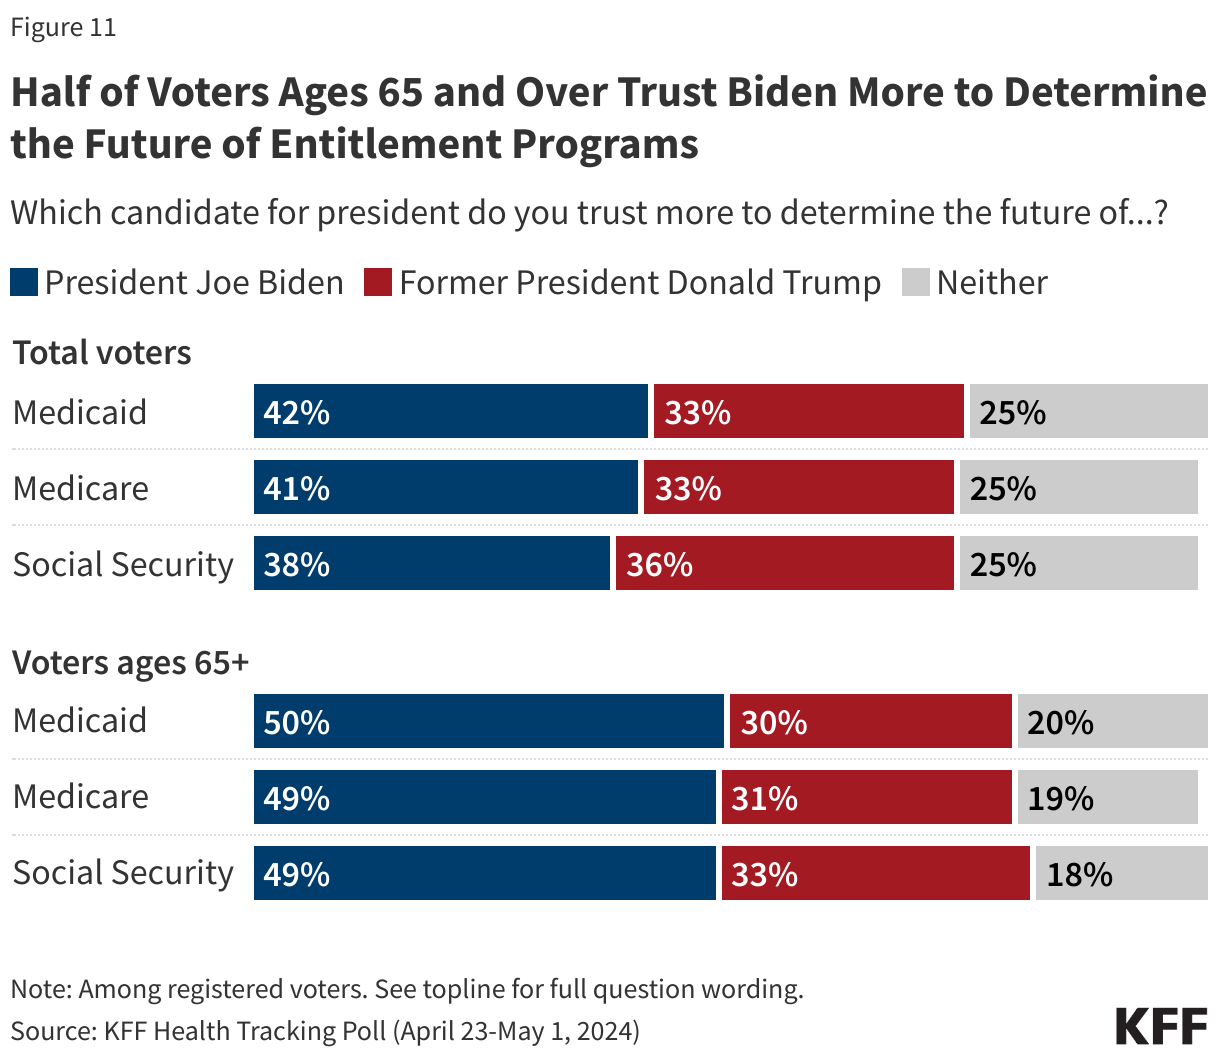
When it comes to determining the future of Social Security, Medicare, and Medicaid, neither candidate garners a clear majority of trust among voters on all three items. About four in ten voters overall say they trust President Biden more to determine the future of Medicare and Medicaid, while one-third trust former President Trump more. Voters are more evenly split on the future of Social Security, with 38% who trust Biden more and 36% for Trump.
Older voters, a key voting bloc and the primary beneficiaries of Social Security and Medicare, are more likely to trust Biden when it comes to determining the future of each program. About half of voters ages 65 and older say they trust Biden more to determine the future of Social Security (49%), Medicare (49%), and Medicaid (50%), while about a third of older voters say they trust Trump more on each.
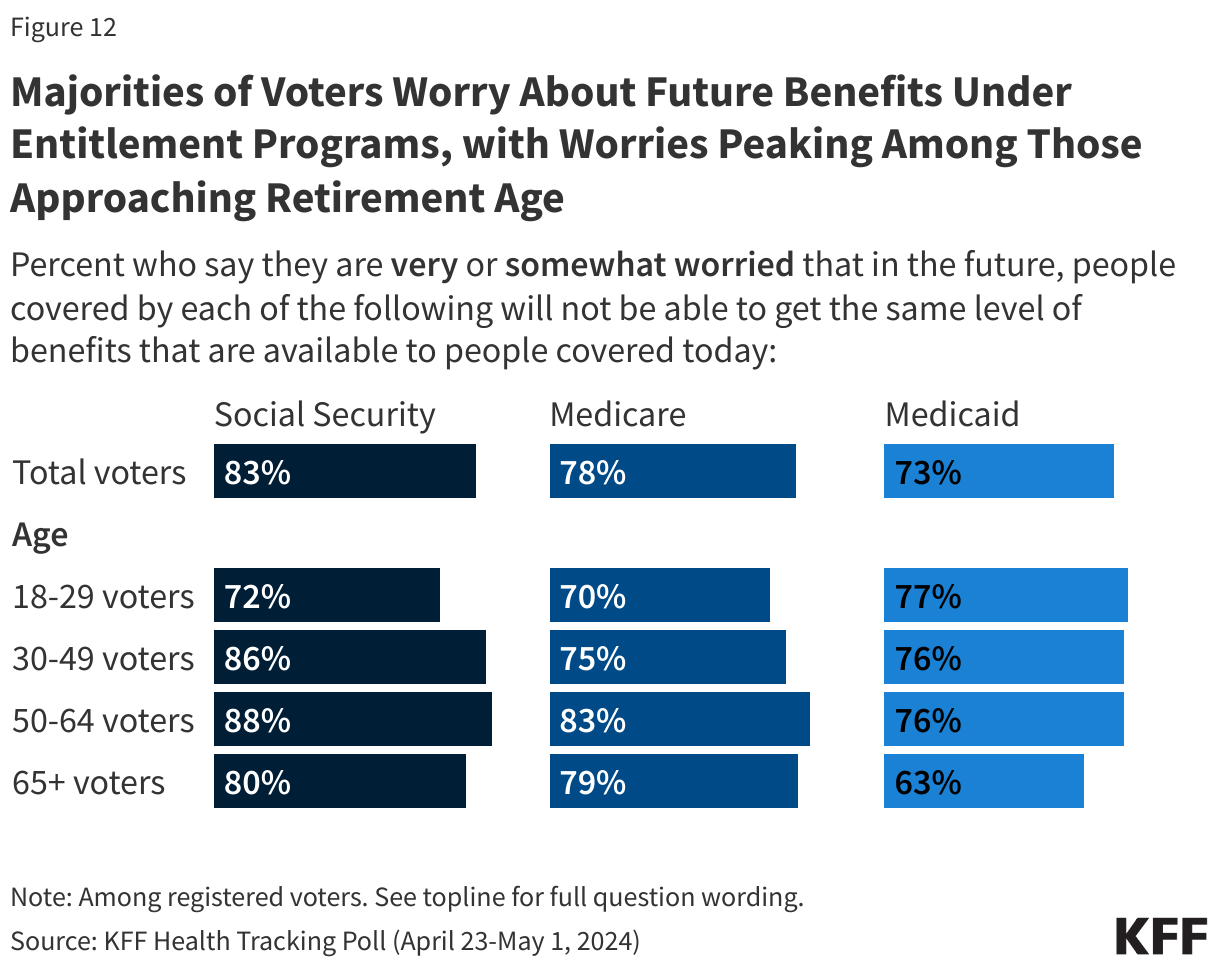
Majorities of voters are worried that, in the future, people covered by Medicare, Social Security, and Medicaid won’t be able to get the same level of benefits that are available today, with at least three in four saying they are at least somewhat worried about this when it comes to Social Security (83%), Medicare (78%), and Medicaid (73%). While large shares of voters across the age spectrum worry about future benefits available under these programs, worries about future benefits under Medicare and Social Security tend to peak among those ages 50-64, the next age group to become eligible for these programs in the coming years. A new report issued by the Medicare and Social Security trustees projects both programs will have insufficient funds to pay full benefits in about a decade.
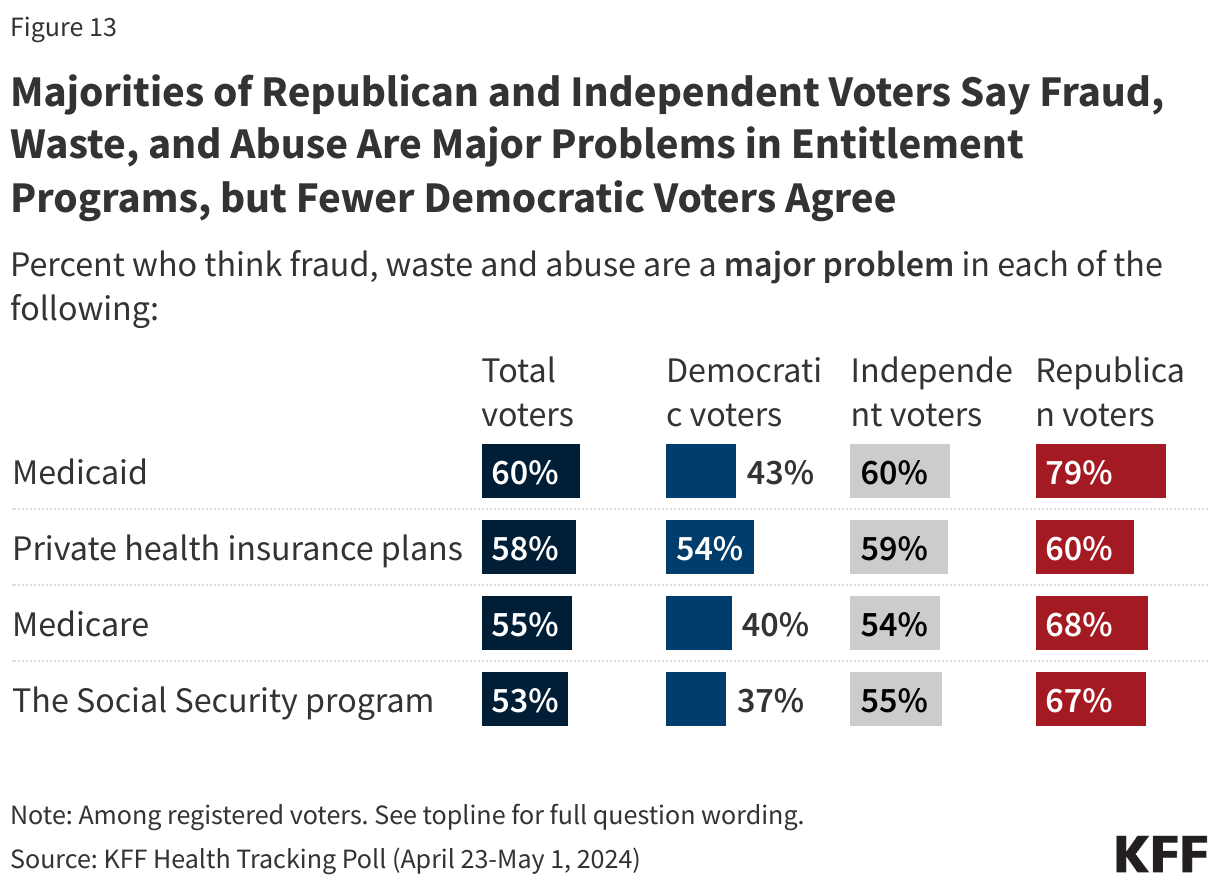
While former President Trump’s remarks on the future of entitlement programs have been inconsistent, in some appearances he has criticized the Social Security and Medicare programs, stating that he will cut these programs by targeting “waste” and “fraud.” Many voters agree that fraud, waste, and abuse are problems in the nation’s entitlement programs, with over half saying fraud, waste, and abuse are a “major” problem in Medicaid (60%), Medicare (55%), and Social Security (53%). For context, 58% of adults also see fraud, waste, and abuse as a major problem in private health insurance.
Larger shares of Republican voters say fraud, waste, and abuse are a “major” problem in Medicare Medicaid, and Social Security than Democrats, with no differences by partisanship when it comes to concerns about private health insurance.
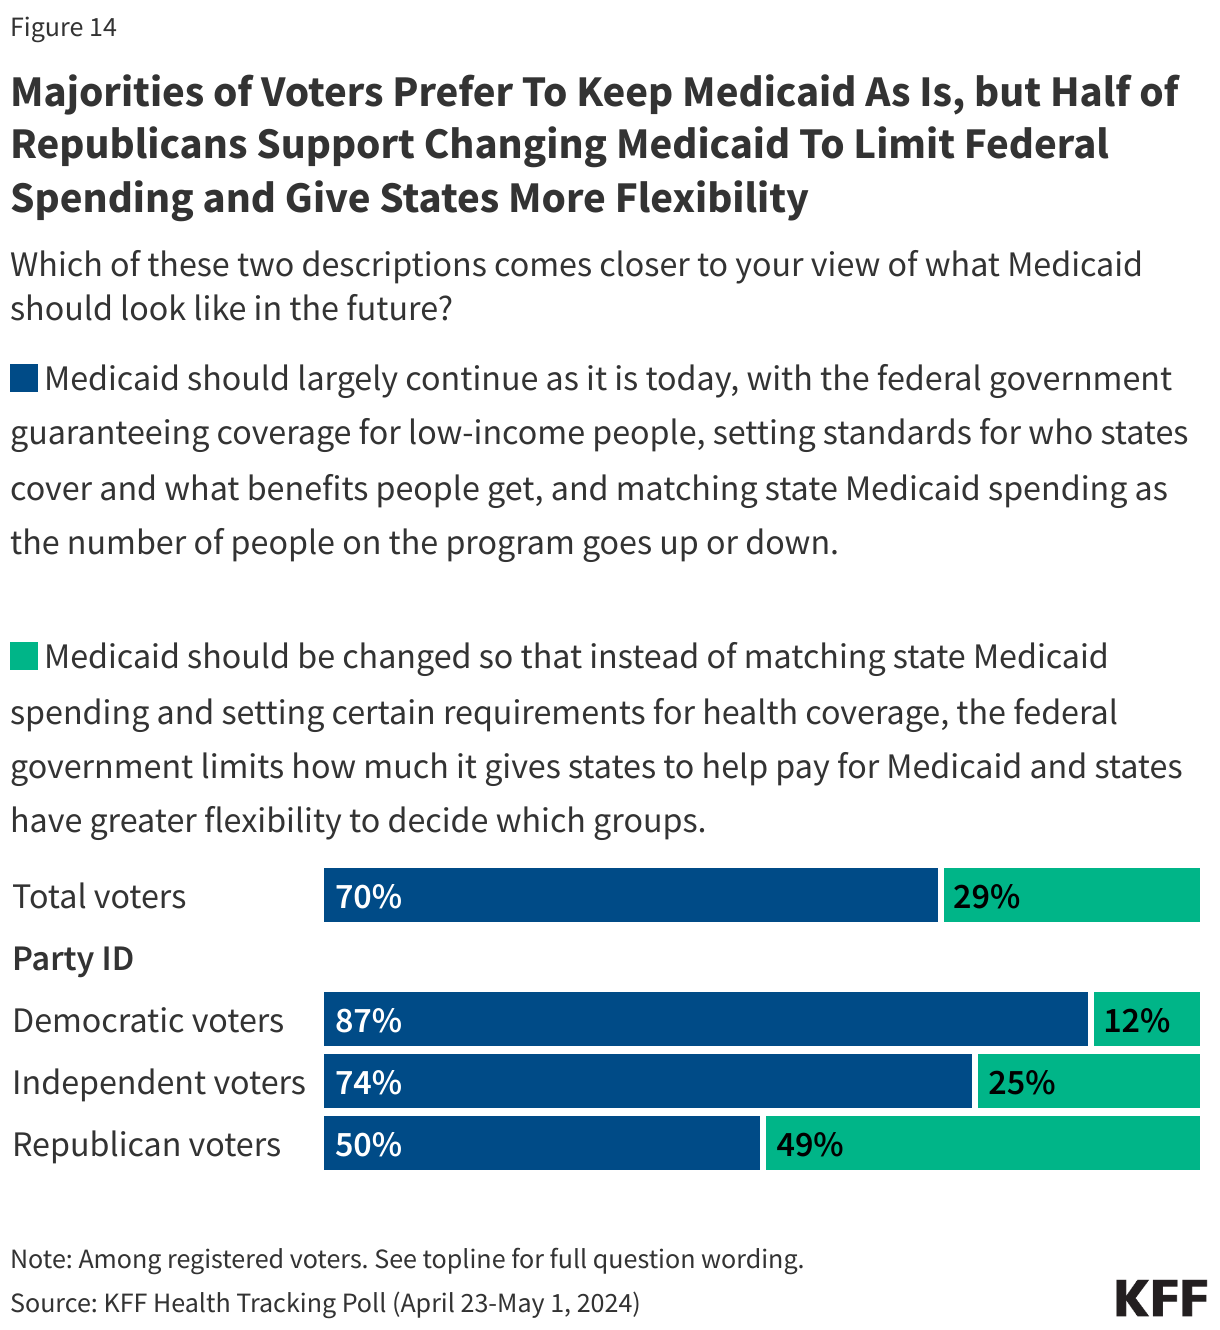
Former President Trump has not released any detailed statements on his plans for the future of Medicaid if elected, but his budget proposals as president included plans to cap federal Medicaid spending. Asked which comes closer to their view of what Medicaid should look like in the future, seven in ten voters say “Medicaid should largely continue as it is today, with the federal government guaranteeing coverage for low-income people, setting standards for who states cover and what benefits people get, and matching state Medicaid spending as the number of people on the program goes up or down.” About three in ten voters (29%) say “Medicaid should be changed so that instead of matching state Medicaid spending and setting certain requirements for health coverage, the federal government limits how much it gives states to help pay for Medicaid and states have greater flexibility to decide which groups of people to cover without federal guarantees.”
Majorities of voters across gender, age, and racial and ethnic groups agree that Medicaid should largely continue as it is today. However, while large shares of Democratic voters (87%) and independent voters (74%) say they want Medicaid to continue as it is today, Republican voters are evenly divided, with 50% preferring Medicaid to stay as it is today and 49% saying the federal government should limit how much it pays states and give states greater flexibility to administer their Medicaid programs.
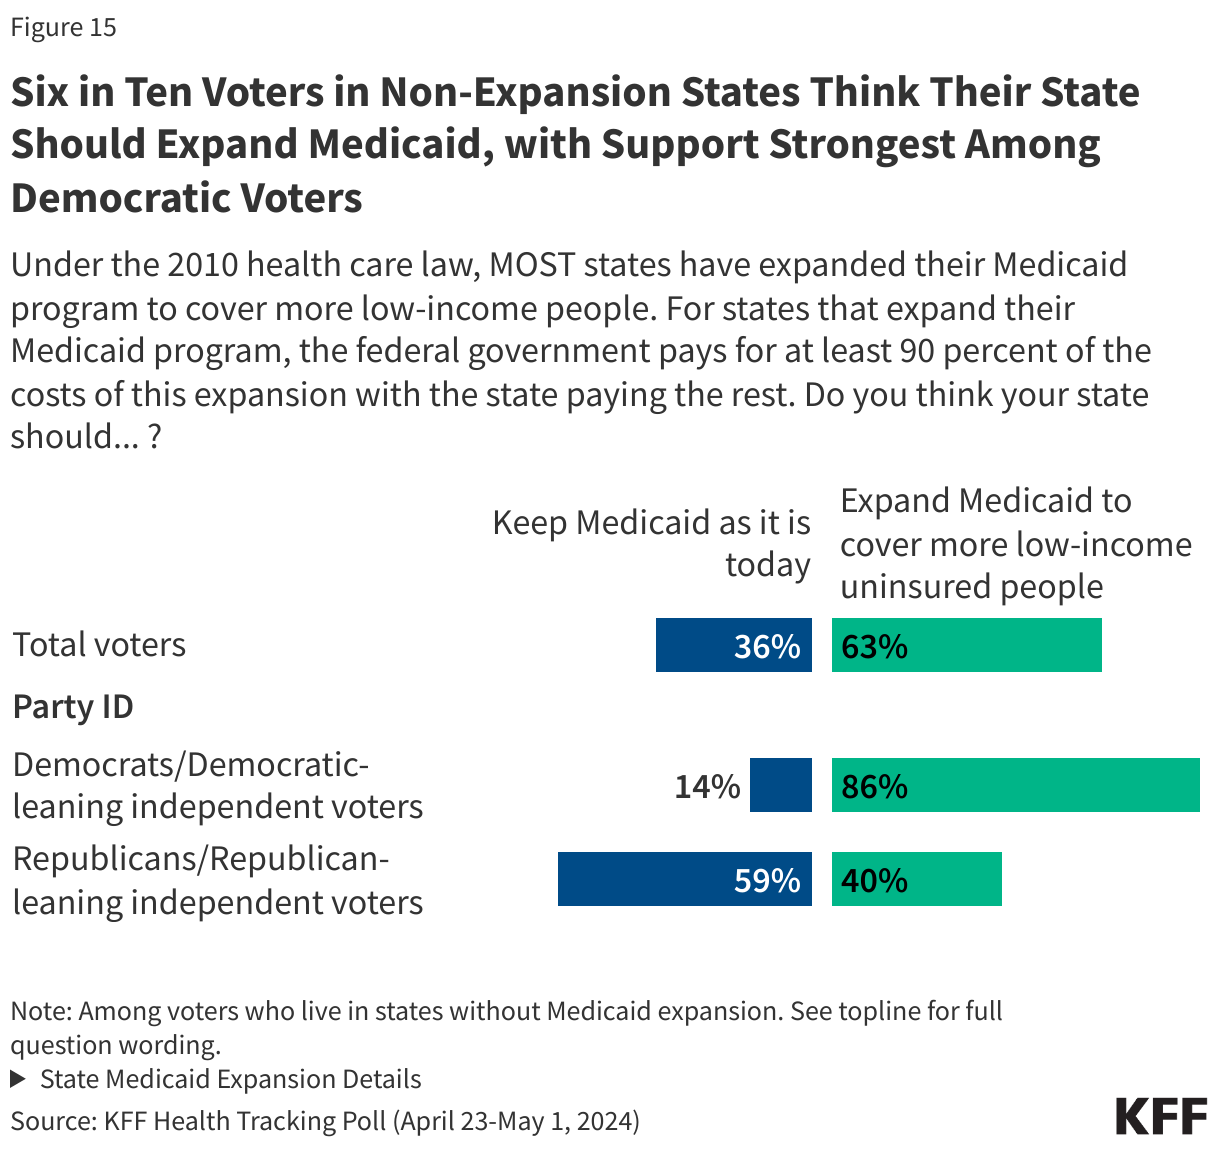
Under the ACA, most states have expanded their Medicaid programs to cover more low-income people. For states that expand their Medicaid program, the federal government pays for 90 percent of the costs of this expansion with the state paying the rest.
Two-thirds (63%) of voters who live in a non-expansion state want their state to expand Medicaid to cover more low-income uninsured people, while one-third (36%) would rather keep Medicaid as it is today. Expanding Medicaid is largely split along partisan lines, with nearly nine in ten (86%) of Democrats or Democratic-leaning independent voters who live in a state without Medicaid expansion saying they want to expand Medicaid, compared to six in ten (59%) of Republicans or Republican-leaning independent voters who want to keep Medicaid as it is today.
Future of the ACA
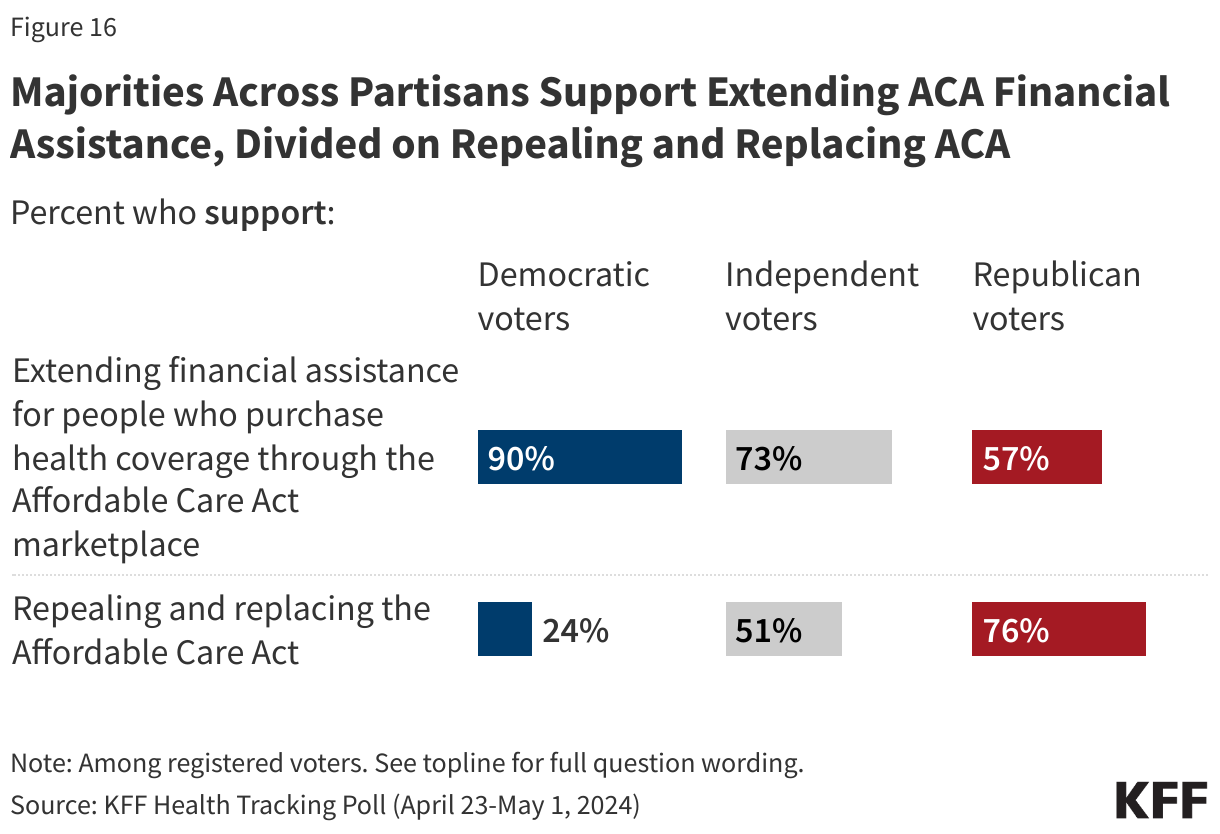
Although a majority of voters now have favorable views of the ACA, attitudes towards the law overall continue to be marked by partisanship. Three quarters of Republican voters say they would support “repealing and replacing” the ACA, as do about half of independent voters. This poll did not test other options (such as expanding or scaling back the law, which generally produce much lower levels of support for repeal). Previous polling and past repeal efforts have shown that public support for repeal erodes considerably when popular provisions like the protections for people with pre-existing conditions are put at risk, so while these views don’t imply that repealing the ACA is a political reality, they do suggest there is some receptivity among Republican voters to “repeal and replace” as a talking point. Previous KFF polling has found that few voters think Trump has a plan to replace the ACA.
Aside from views on repeal, there is majority support for strengthening one key piece of the ACA: about seven in ten voters (72%) support extending financial assistance for people who purchase health coverage through the ACA marketplace, including large majorities of Democratic (90%) and independent voters (73%) and a smaller majority of Republican voters (57%). Notably, two-thirds (65%) of voters are worried that in the future, people covered by ACA marketplace insurance will not be able to get the same level of benefits that are available today.
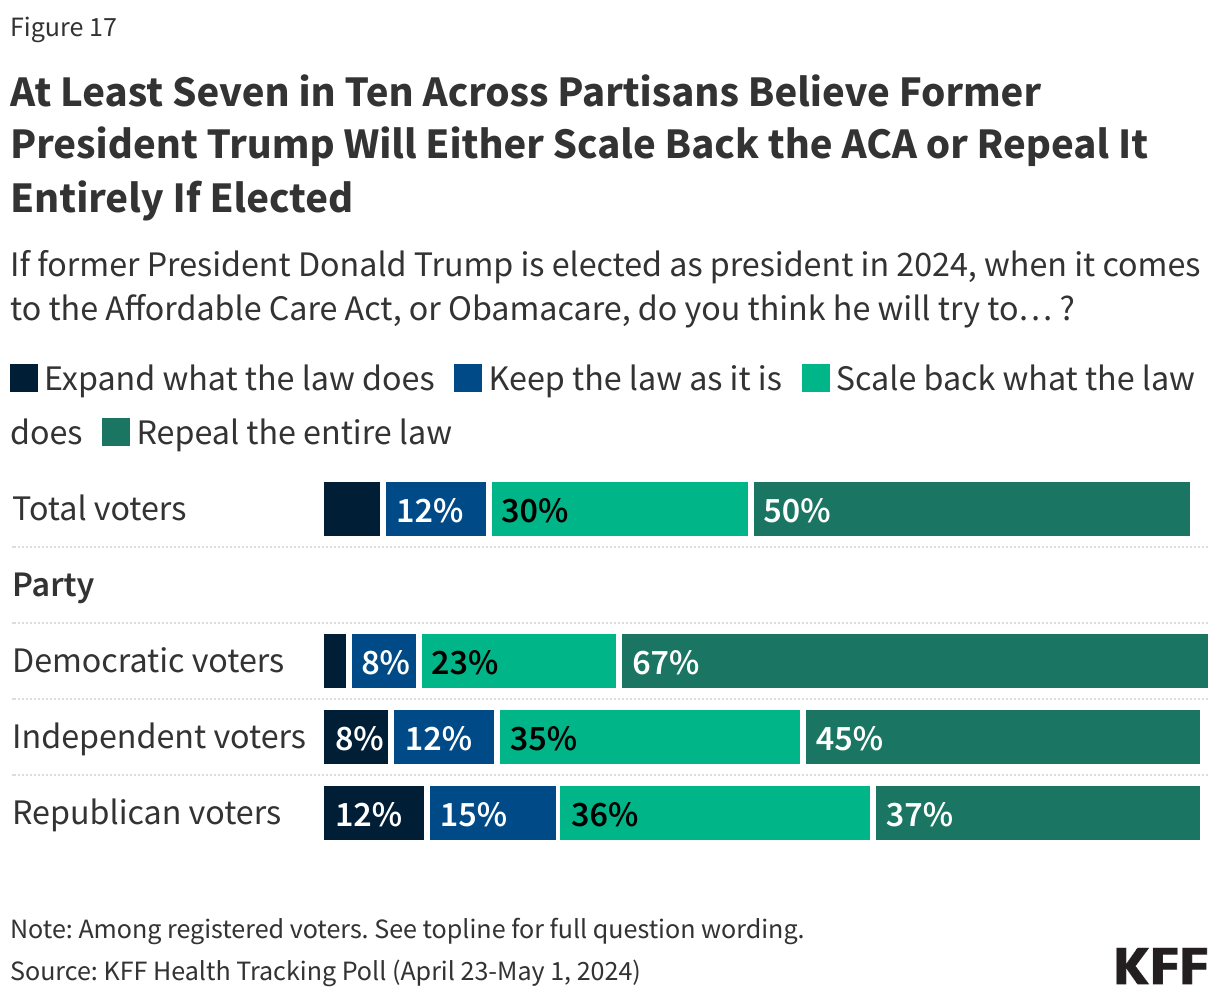
While former President Trump recently stated he is not running to terminate the ACA, he has routinely criticized the law, saying he will make it “better” and “less expensive” and unsuccessfully pushed to repeal it during his time in office. A large majority of voters think Trump would try to either repeal the ACA (50%) or scale back what the law does (30%) if he is re-elected in 2024. About one in eight voters (12%) say they think he will keep the law as is and just 7% say they think he would try to expand what the law does. Despite the large share of Republican voters saying they would support repealing and replacing the ACA, Republican voters are less likely than Democratic voters to say they think Trump would attempt to repeal the entire ACA if elected in 2024 (37% v. 67%).