KFF designs, conducts and analyzes original public opinion and survey research on Americans’ attitudes, knowledge, and experiences with the health care system to help amplify the public’s voice in major national debates.
Falsehoods About Transgender People and Gender Affirming Care
This is Irving Washington and Hagere Yilma. We direct KFF’s Health Misinformation and Trust Initiative and on behalf of all of our colleagues across KFF who work on misinformation and trust we are pleased to bring you this edition of our bi-weekly Monitor.
This volume explores politically motivated misinformation targeting gender-affirming care, transgender people, and its impact on online discourse, legislation, and health care access. We also examine Florida Surgeon General Ladapo’s recent misleading claims about mRNA vaccines and new technology that can predict if social media users will share disinformation.
Featured
KFF Publishes New Health Policy 101 Chapter On LGBTQ+ Health Policy
In the latest Health Policy 101 chapter, KFF explores factors that impact the health and well-being of LGBTQ+ people. The chapter includes a discussion of the role gender-affirming care plays in the lives of transgender and nonbinary people in the U.S. Gender-affirming care is a comprehensive approach to healthcare that can support transgender and nonbinary people in aligning their physical appearance and gender identity. Among transgender and nonbinary people who transition, many do so without any medical intervention (referred to as social transitioning), instead taking actions like changing their appearance, name, or pronouns to fit their gender identity. Among those who do seek medical care as a part of their transition, common types of gender-affirming care include puberty blockers, which are reversible and temporarily delay the onset of puberty to allow a young person time to make decisions about their gender identity, and hormone replacement therapy (HRT), which helps individuals develop physical traits that match their gender identity. Gender-affirming care can also include surgeries, but surgical interventions are relatively uncommon among adults and extremely rare among minors. Gender-affirming care is a medically necessary evidence-based system of care and supported by all major U.S. medical associations.
The effectiveness of gender-affirming care is well-documented, with numerous studies showing that it significantly improves mental health outcomes, as well as lead to better physical health outcomes by encouraging regular medical check-ups and preventive care. But the services used in gender-affirming care are not exclusive to transgender individuals; the very same services used in gender affirming care are commonly used in other medical interventions, including in minors. For example, puberty blockers might be used for a young person experiencing “precocious puberty” and hormone treatments are used to treat a wide range of conditions in young people and adults.
Polling Insights:
The KFF/Washington Post Trans Survey found that most trans adults (88%) say they have taken at least one action in transitioning, however many of these actions are non-medical. Most trans adults say they have changed their physical appearance, pronouns, or name during the process of transitioning, but smaller shares report using hormone treatments (31%) or undergoing gender-affirming surgery to change their physical appearance (16%).
KFF polling also shows that trans adults report significant issues accessing gender-affirming health care, including having experiences with doctors not providing appropriate care, having discriminatory encounters with providers, and facing issues with health insurance coverage. About three in ten trans adults say they have had to teach a doctor or other health care provider about trans people so they could get appropriate care (31%), had a doctor or other health care provider refuse to acknowledge their preferred gender identity and instead refer to their sex assigned at birth (31%), or been asked unnecessary or invasive questions about their gender identity unrelated to their visit (29%). About one in six (17%) trans adult say they have had a doctor or other health care provider refuse to provide them with gender-affirming treatment, such as hormone treatments.
Emerging Misinformation Narratives
Political Figures Falsely State Schools Are Performing Gender-Affirming Surgeries on Students
Fotis Vrotsis Photography / Getty Images
A new AP-NORC/USAFacts survey shows that the public thinks both presidential campaigns are generating messages based on misinformation, with about four in ten adults saying it is difficult to know if what candidates are saying is true or not when it comes to information about the upcoming election. One example is misinformation about gender-affirming care, which has increasingly been weaponized for political gain, with online sentiments echoing these false claims. For example, former President Donald Trump has continued to falsely claim that children are undergoing gender-affirming surgeries at school. Trump initially made this claim on August 30 at an event hosted by Moms of Liberty and repeated the claim on September 7 at a Wisconsin campaign rally, reigniting online debate about the ethics, safety, and necessity of gender-affirming care for youth. But fact checkers explain that schools do not provide medical care without parental consent. Gender-affirming surgeries for minors are also extremely rare and decisions around all gender affirming care involve a meticulous and lengthy process with minor, parental, and medical provider involvement.
Between August 30th and September 25, the claim was mentioned approximately 121,000 times in posts, articles, comments on articles. Most posts mocked or debunked the claim, noting that gender-affirming surgeries for minors are exceedingly rare and that children are not undergoing any kind of surgery at school. One X post, for example, that received approximately 2.8 million views, 147,000 likes, and 13,000 reposts as of September 26 joked, “My daughter just texted she’s opted in for the transgender surgery at the high school nurses office. She’s like 5th in line.”
Some Incorrectly Claim Identifying as Transgender is Temporary and That Gender-Affirming Care Is Experimental
Other online posts share the false claim that gender-affirming care is associated with high rates of regret, despite research showing that less than one percent of people who undergo gender-affirming surgery regret the decision. Between August 28 and September 25, this narrative was mentioned approximately 41,000 times in posts, articles, comments on articles. Many used the term “detransitioner” to describe formerly trans-identified people who return to identifying with their sex assigned at birth. One popular X post from September that received over a million views and 8,500 reposts read, “I’m a detransitioner and I am voting for Donald Trump. When I was 19 years old, doctors led me to believe that I was transgender. I was told that hormones and surgeries were my only options — they were wrong.” The author then accused Vice President Kamala Harris of “pushing” children into gender-affirming care. Some comments supported the author’s false claim about Harris, while others attempted to debunk the notion that gender-affirming care is harmful.
Some also falsely claim that it is experimental and lacks an evidence base. However, this is not accurate and similar treatments are readily accepted for cis-gender children. For instance, puberty blockers are frequently portrayed as dangerous and experimental when prescribed to transgender youth, despite their long-standing use in treating early puberty in any child without controversy. Such fallacies not only perpetuate misinformation but also contribute to the stigmatization and marginalization of transgender youth, denying them the same standard of care afforded to their cis-gender peers. The types of false claims that emerged following Trump’s comments suggest that the public needs further education about what gender-affirming care for youth is and what it is not and how access to gender-affirming care improves mental health outcomes in trans youth.
Recent Developments
Misinformation About Gender-Affirming Care Has Fueled Recent Legislation
boonchai wedmakawand / Getty Images
Despite the scientific evidence supporting the provision of gender-affirming care, misinformation has led to policy restrictions on health care for transgender people in the U.S. The KFF Gender Affirming Care Policy Tracker reports that, at the time of publication, 26 states have enacted bans on gender-affirming care for minors and some limit this care for adults too. Many of these laws restricting health care for transgender people are being challenged in court as a violation of the 14th Amendment (and on other grounds), but misinformation continues to impact support for these bans. False claims often portray gender-affirming care as experimental and harmful, but all 26 laws have provisions that allow the same services used in gender-affirming care for other medical care. These measures exploit the general public’s limited understanding of transgender health to push a political agenda and prohibit medically necessary care.
Misleading Information in Amicus Briefs Could Influence Supreme Court’s Review of Transgender Youth Healthcare Case
Grant Faint / Getty Images
At the request of the Biden Administration, the Supreme Court will review a challenge against Tennessee’s law banning hormone therapy for transgender youth in U.S. v. Skrmetti. As the Court prepares for the hearing, false information is presented to the Court through amicus briefs. These briefs are meant to provide additional perspectives for the Court but can contain misleading information from non-credible sources. For example, some amicus briefs have used anecdotal or flawed evidence to claim that transgender identities are temporary or that gender-affirming care is experimental. Another source of misleading information is the Cass Review, a UK report that has been used to justify restrictions on gender-affirming care for minors in the U.S. The review, commissioned by the NHS, claimed there was “no good evidence” supporting the long-term outcomes of gender-affirming care, contradicting over 100 studies demonstrating its safety and efficacy. Although criticized as a biased review that applied unattainable standards not required in other areas of pediatric medicine, it has been cited in some amicus briefs submitted to the Court as evidence. On the other hand, amicus briefs supporting the challenge explain that the Cass Review does not offer any new evidence.
More to Watch: Florida Department of Health Shares False Information About mRNA Vaccines
IMAGINESTOCK / Getty Images
On September 12, the Florida Department of Health issued updated guidance advising against the use of updated mRNA COVID-19 vaccines, contradicting federal and public health officials who recommend updated vaccines for everyone 6 months and older. The guidance falsely claimed that the mRNA vaccines pose health risks, a stance that has been refuted by the FDA before. Experts interviewed by KFF Health News believe Ladapo’s guidance is politically motivated, aligning with Governor DeSantis’s stance against public health mandates. Even with COVID-19 cases rising, medical professionals have been slow to counter this misinformation, possibly due to fear of political repercussions. Previous KFF polling has found that most adults have at least a fair amount of trust in the CDC (66%), the FDA (65%), and in their state and local public health officials (64%) to make the right recommendations when it comes to health issues. However, when state and federal public health officials offer contradicting recommendations, the public may be confused on how to proceed.
Within a day of the vaccine guidance announcement, 25,600 social media posts emerged, especially in anti-vaccine circles, spreading false claims about the risks of mRNA COVID-19 vaccines, including death, cancer, and blood clots. A top post on X from a doctor supporting the guidance garnered around 283,000 views,14,000 likes, 5,200 reposts by September 26. At the same time, posts debunking the Florida Department of Health’s claims also gained traction. One doctor’s thread criticizing the guidance as “antivaccine propaganda” and explaining the safety of mRNA vaccines received about 109,100 views, 2,900 likes, 840 reposts, and 20 comments, with most agreeing that Florida’s guidance was dangerous.
Research Insights
University Staff Training for Countering Misinformation
Vladimir Vladimirov / Getty Images
A study from 2020 explored the impact of a university staff development training designed to address misinformation and biases surrounding transgender people’s identities. The training emphasized the importance of challenging misinformation and fostering an inclusive environment, by committing to incorporating principles of equality, diversity, and inclusion into their work. Following the training, participants reported increased awareness of transphobic media coverage and became more confident in identifying and countering transphobic narratives. Staff who participated also felt better equipped to support transgender students and staff and contribute to wider institutional change that supports trans inclusivity.
Source: Krutkowski, S., Taylor-Harman, S., & Gupta, K. (2020). De-biasing on university campuses in the age of misinformation. Reference Services Review, 48(1), 113-128.
AI and Emerging Technologies
Machine Learning Algorithm Tries to Predict Future Disinformation Campaigns
Tero Vesalainen / Getty Images
A body of work demonstrates how machine learning can be used to detect existing fake news, but a group of researchers have developed a new machine learning algorithm that could potentially predict future malicious activity on social media. Their model aims to identify users who might spread disinformation or hate speech by tracking their behavior over time and comparing it to patterns seen in other malicious users. But even with these technological advances, the policy landscape for content moderation on social media remains unclear, raising questions about how such technology will be applied.
About The Health Information and Trust Initiative: the Health Information and Trust Initiative is a KFF program aimed at tracking health misinformation in the U.S., analyzing its impact on the American people, and mobilizing media to address the problem. Our goal is to be of service to everyone working on health misinformation, strengthen efforts to counter misinformation, and build trust.
The Monitor is a report from KFF’s Health Information and Trust initiative that focuses on recent developments in health information. It’s free and published twice a month.
Support for the Health Information and Trust initiative is provided by the Robert Wood Johnson Foundation (RWJF). The views expressed do not necessarily reflect the views of RWJF and KFF maintains full editorial control over all of its policy analysis, polling, and journalism activities. The Public Good Projects (PGP) provides media monitoring data KFF uses in producing the Monitor.
Assessing Equity in PEPFAR Countries: Analysis of HIV Outcomes by Urban/Rural Residence, Wealth, Sex, and Age
PEPFAR, the U.S. global HIV program, is the largest commitment by any nation to address a single disease in history. As the program increasingly focuses on sustainability for the future, a key pillar of its current five year strategy is equity, defined by the program as a “fair and just opportunity for everyone to achieve their highest level of health”. More broadly, a focus on equity has long been a part of the HIV response,1 often serving as a model for global health and development efforts more generally. Still, disparities in HIV access and outcomes persist and the stakes have increased in recent years, with a growing HIV funding gap and other financial pressures, deteriorating human rights environment, and shrinking space for civil society, among other challenges.2,3 Better understanding how equitable the HIV response has been, and where equity gaps remain, can aid policymakers and program implementers in mitigating gaps and guiding PEPFAR’s future directions.
This analysis, adapted from a recent report, examines differences in HIV outcomes by urban/rural residence, wealth quintile, sex and age. Three HIV outcomes were examined: the share of people living with HIV who are aware of their HIV status, the share on antiretroviral treatment, and the share virally suppressed. Data were obtained from Population-based HIV Impact Assessment (PHIA) Project surveys, nationally representative household surveys of adults and adolescents aged 15 and older that have been completed in 15 PEPFAR countries. Changes over time were assessed in six countries with follow-up surveys (see methodology for more detail). While the demographic data examined here are important for assessing equity, PHIA surveys do not currently collect data on other subpopulation groups that also face equity challenges, particularly key populations –men who have sex with men, people who are transgender, sex workers, and people who inject drugs – who, as documented in a recent analysis, continue to be disproportionately impacted by HIV and experience poorer health outcomes.
Overall, this analysis finds that in the 15 PEPFAR countries analyzed, HIV equity gaps were found for some, but not all, subpopulation groups. In addition, some groups that generally have poorer health outcomes, such as those in rural areas and those with lower incomes, had better HIV outcomes than their counterparts in several countries. Finally, HIV outcomes improved across all groups and countries over time, and equity gaps narrowed in several cases. These findings point to areas where resources and attention can be directed to further reduce HIV equity gaps, and also identify examples of HIV “equity successes,” which may offer lessons going forward.
Key Take-Aways
People living with HIV in rural areas were more likely to be on antiretroviral treatment and be virally suppressed in a greater number of PEPFAR countries than those in urban areas. For example, in seven countries, viral suppression rates in rural areas were better than in urban areas, compared to four countries where the opposite was found. In three countries, there were no differences.
While people with HIV in the highest wealth quintile had better HIV outcomes than those in the lowest in eight PEPFAR countries, in five countries, the opposite was found and in two countries, there were no differences.
There was a significant outcome gap by sex, with males faring more poorly than their female counterparts in all 15 PEPFAR countries and for all three HIV outcomes.
There was also a significant gap by age in all 15 countries, with younger cohorts having poorer HIV outcomes across the board and in many cases, the differences were quite large and greater than for any other subpopulation examined.
Over time, HIV outcomes improved across all groups in the six PEPFAR countries that have conducted two surveys. In addition, disparities narrowed in several cases, particularly by sex and age.
Findings
People with HIV in rural areas were more likely to be on antiretroviral treatment and be virally suppressed in a greater number of PEPFAR countries than those in urban areas. Differences, while significant, were generally small4(see Figure 1a and Appendix Table 1).
In six countries (Botswana, Eswatini, Lesotho, Malawi, Namibia, and Zimbabwe), people with HIV in rural areas had greater awareness of their HIV status than those in urban areas and in one country (Kenya), there was no difference. In seven countries (Cameroon, Côte d’Ivoire, Mozambique, Rwanda, Tanzania, Zambia, and Uganda) people with HIV in urban areas had greater HIV awareness.
In seven countries, there were greater shares of people with HIV on antiretroviral treatment in rural areas (Botswana, Eswatini, Lesotho, Malawi, Namibia, Zambia and Zimbabwe) and in two countries (Kenya and Rwanda) there were no significant differences. Five countries (Cameroon, Côte d’Ivoire, Mozambique, Tanzania and Uganda) had higher shares on treatment in urban areas.
Finally, seven countries (Botswana, Cameroon, Eswatini, Malawi, Namibia, Zambia and Zimbabwe) had higher HIV viral suppression rates among rural populations with HIV, and three countries (Côte d’Ivoire, Kenya and Rwanda) had no significant differences between rural and urban residents. Four had higher rates among urban populations (Lesotho, Mozambique, Tanzania, and Uganda).
With few exceptions, the differences between rural and urban groups were five percentage points or less.
While people with HIV in the highest wealth quintile had better HIV outcomes than those in the lowest in a greater number of PEPFAR countries, in several countries, the opposite was found (see Figure 1b and Appendix Table 2).
In eight of the 15 PEPFAR countries, people with HIV in the highest wealth quintile had better HIV awareness, treatment, and viral load suppression outcomes than those in the lowest wealth quintile (Cameroon, Ethiopia, Lesotho, Malawi, Mozambique, Tanzania, Uganda and Zambia) while in five countries (Botswana, Côte d’Ivoire, Eswatini, Namibia, and Zimbabwe), these outcomes were better among those in the lowest wealth quintile. Two countries—Kenya and Rwanda—showed no significant differences in outcomes between the lowest and highest wealth quintiles.
Differences between groups ranged by country and in some cases were large. For example, the difference between the lowest and highest wealth quintiles in viral suppression rates was 10 percentage points or greater in seven countries (Cameroon, Côte d’Ivoire, Ethiopia, Mozambique, Namibia, Tanzania, and Uganda).
There was a significant disparity by sex, with males faring more poorly than their female counterparts in all 15 PEPFAR countries and for all three HIV outcomes (see Figure 1c and Appendix Table 3).
In all 15 countries, males were significantly less likely to be aware of their HIV status, on antiretroviral therapy, or virally suppressed than females, and some countries, these equity gaps were 10 percentage points or higher.
The gap in awareness of HIV status was 10 percentage points or higher in four countries (Côte d’Ivoire, Kenya, Ethiopia, and Tanzania).
In five countries, there was at least a 10 percentage point gap in the share of males on antiretroviral treatment compared to females (Côte d’Ivoire, Ethiopia, Kenya, Namibia, and Tanzania).
Similarly, the gap in the share virally suppressed was at least 10 percentage points in five countries (Côte d’Ivoire, Kenya, Namibia, Rwanda, and Tanzania).
There was also a significant gap by age in all 15 PEPFAR countries, with younger cohorts having poorer HIV outcomes across the board; in most cases, differences were quite large and greater than for any other subpopulation examined (see Figure 1d and Appendix Table 4).
In all 15 countries, young people (ages 15-24) were significantly less likely to be aware of their HIV status, on antiretroviral therapy, and virally suppressed than those ages 25 and older and the equity gaps between age cohorts were greater than for other groups examined.
The equity gap for awareness of HIV status and in antiretroviral treatment coverage was at least 20 percentage points in three countries (Cameroon, Mozambique, and Uganda).
The gap in the share virally suppressed was at least 20 percentage points in five countries (Cameroon, Ethiopia, Mozambique, Uganda, and Zimbabwe).
Over time, HIV outcomes improved across all groups in the six PEPFAR countries that completed two surveys. In addition, equity gaps narrowed in several cases, particularly by sex and age (see Figures 2a-d and Appendix Tables 5-6).
Awareness of HIV status increased significantly for both urban and rural residents with HIV in each of the six countries. Increases were steepest for viral suppression rates. In three countries (Eswatini, Malawi, and Zambia), the equity gap between rural and urban residents narrowed across all three HIV outcomes, and the gap in viral suppression rates decreased in Zambia. Conversely, while overall outcomes improved, the gap between groups grew in Uganda and Zimbabwe.
Both those in the highest and lowest wealth quintiles had increases in all HIV outcomes over time, particularly for viral suppression rates. Two countries (Eswatini and Zambia) narrowed the equity gap by wealth for all three HIV outcomes, and the gap narrowed for Lesotho for awareness of HIV status and treatment coverage and in Malawi for treatment coverage. The gap grew, however, in Uganda and Zimbabwe for all three HIV outcomes.
Outcomes improved for females and males in all six countries, with the steepest improvements in viral suppression rates. In addition, the gap between males and females narrowed in all cases, except in Zambia where the disparity only narrowed for viral suppression rates.
Finally, HIV outcomes also improved for both age cohorts and the equity gap narrowed in almost all cases (with the exception of viral suppression rates in Uganda, where the gap remained approximately the same, and in Zimbabwe, where the gap in viral suppression rates grew).
As this analysis shows, HIV equity gaps were found for some, but not all, groups examined in PEPFAR countries. It also finds that outcomes improved over time across the board and, in most cases, equity gaps narrowed. In addition to helping to identify areas in need of further resources and attention, these findings also point to examples of HIV equity successes, which could serve as models for other countries and populations. Future research could examine how equity was achieved in these countries, including the role played by PEPFAR funding and programming.
This work was supported in part by the Gates Foundation. KFF maintains full editorial control over all of its policy analysis, polling, and journalism activities.
Jen Kates, Stephanie Oum, and Anna Rouw are with KFF. Gary Gaumer, Moaven Razavi, Deborah V Stenoien, Senthil Subbiah, Allyala K Nandakumar are with Brandeis University.
Methods
The analysis uses data from the Population-based HIV Impact Assessment (PHIA) Project, a series of cross-sectional, nationally representative household surveys funded by PEPFAR in PEPFAR countries, that are highly affected by HIV. To date, surveys have been completed in 15 PEPFAR countries with follow-up surveys done in six countries. Data from these countries were used to compare HIV outcomes among people living with HIV by the following characteristics available in the PHIA data: urban/rural residence, wealth quintile, sex, and age. Three HIV outcome measures were compared across groups: the share of people with HIV aware of their HIV status, share on antiretroviral treatment, and share virally suppressed. To measure equity, mean HIV outcome levels by subpopulation were compared. Statistical significance was assessed by performing Chi-squared and Fisher’s exact tests. Because surveys were conducted at different time periods by country, outcomes were not compared across countries in this analysis. It is important to note that findings from these 15 PEPFAR countries, or the six with follow-up data, may not be generalizable to other countries. In addition, while PHIA countries are PEPFAR countries, outcomes may not be attributable to PEPFAR alone, given that other funding sources and programs also support the HIV response.
Appendix
Appendix Table 1
HIV Outcomes by Urban/Rural Status, 15 PEPFAR Countries
Country (Year)
Percent Aware of HIV Status
Percent on Treatment
Percent Virally Suppressed
Rural
Urban
Difference
Sig.
Rural
Urban
Difference
Sig.
Rural
Urban
Difference
Sig.
Botswana (2021)
95.4%
94.6%
-0.9%
***
94.0%
93.0%
-1.0%
***
92.0%
91.0%
-1.0%
***
Cameroon (2017)
55.0%
56.0%
1.0%
***
51.0%
52.0%
1.0%
***
42.0%
41.0%
-1.0%
***
Côte d’Ivoire (2017)
46.0%
51.5%
5.6%
***
44.0%
47.0%
3.0%
***
34.0%
34.0%
0.0%
NS
Eswatini (2021)
94.0%
92.0%
-2.0%
***
91.0%
90.0%
-1.0%
***
88.0%
85.0%
-3.0%
***
Ethiopia (2017)
–
–
–
–
–
–
–
–
–
–
–
–
Kenya (2018)
79.3%
79.3%
0.0%
NS
76.0%
76.0%
0.0%
NS
69.0%
70.0%
1.0%
NS
Lesotho (2020)
90.3%
89.8%
-0.6%
***
88.0%
87.0%
-1.0%
***
79.0%
80.0%
1.0%
***
Malawi (2020)
89.0%
87.0%
-2.0%
***
87.0%
84.0%
-3.0%
***
85.0%
79.0%
-6.0%
***
Mozambique (2021)
68.1%
75.4%
7.3%
***
66.0%
73.0%
7.0%
***
58.0%
66.0%
8.0%
***
Namibia (2017)
89.0%
83.0%
-6.0%
***
86.0%
80.0%
-6.0%
***
78.0%
73.0%
-5.0%
***
Rwanda (2018)
82.0%
87.0%
5.0%
*
80.0%
85.0%
5.0%
NS
72.0%
77.0%
5.0%
NS
Tanzania (2016)
56.0%
63.0%
7.0%
***
52.0%
59.0%
7.0%
***
46.0%
51.0%
5.0%
***
Uganda (2020)
79.0%
84.0%
5.0%
***
75.0%
81.0%
6.0%
***
69.0%
75.0%
6.0%
***
Zambia (2021)
88.5%
88.9%
0.3%
***
87.4%
86.6%
-0.8%
***
85.0%
83.0%
-2.0%
***
Zimbabwe (2020)
88.0%
85.0%
-3.0%
***
86.0%
81.0%
-5.0%
***
78.0%
73.0%
-5.0%
***
Notes: * p<0.05, ** p<0.01, ***p<0.001, NS= Not significant based on Chi squared test or Fisher’s exact test. Difference represents the percentage point difference between the two groups. Results are based on the most recent PHIA survey for each country. Ethiopia’s PHIA doesn’t include data on urban/rural residence.
Appendix Table 2
HIV Outcomes by Wealth Quintile, 15 PEPFAR Countries
Country (Year)
Percent Aware of HIV Status
Percent on Treatment
Percent Virally Suppressed
Lowest
Highest
Difference
Sig.
Lowest
Highest
Difference
Sig.
Lowest
Highest
Difference
Sig.
Botswana (2021)
95.8%
95.4%
-0.4%
**
94.0%
92.0%
-2.0%
***
92.0%
91.0%
-1.0%
***
Cameroon (2017)
40.0%
55.0%
15.0%
***
37.0%
51.0%
14.0%
***
26.0%
41.0%
15.0%
***
Côte d’Ivoire (2017)
58.0%
30.0%
-28.0%
***
51.0%
29.0%
-22.0%
***
40.0%
16.0%
-24.0%
***
Eswatini (2021)
94.0%
92.0%
-2.0%
***
93.0%
90.0%
-3.0%
***
88.0%
87.0%
-1.0%
***
Ethiopia (2017)
74.0%
76.0%
2.0%
***
71.0%
72.0%
1.0%
***
57.0%
68.0%
11.0%
***
Kenya (2018)
79.0%
77.0%
-2.0%
NS
75.0%
75.0%
0.0%
NS
66.0%
71.0%
5.0%
NS
Lesotho (2020)
89.0%
91.0%
2.0%
***
87.0%
88.0%
1.0%
***
79.0%
81.0%
2.0%
***
Malawi (2020)
87.0%
88.0%
1.0%
***
83.0%
86.0%
3.0%
***
80.0%
83.0%
3.0%
***
Mozambique (2021)
59.0%
78.0%
19.0%
***
55.0%
76.0%
21.0%
***
49.0%
70.0%
21.0%
***
Namibia (2017)
88.0%
75.0%
-13.0%
***
86.0%
71.0%
-15.0%
***
78.0%
58.0%
-20.0%
***
Rwanda (2018)
82.0%
84.0%
2.0%
NS
81.0%
81.0%
0.0%
NS
73.0%
72.0%
-1.0%
NS
Tanzania (2016)
49.0%
63.0%
14.0%
***
46.0%
60.0%
14.0%
***
39.0%
51.0%
12.0%
***
Uganda (2020)
76.0%
85.0%
9.0%
***
71.0%
82.0%
11.0%
***
60.0%
79.0%
19.0%
***
Zambia (2021)
83.0%
90.0%
7.0%
***
81.0%
89.0%
8.0%
***
77.0%
85.0%
8.0%
***
Zimbabwe (2020)
89.0%
84.0%
-5.0%
***
86.0%
80.0%
-6.0%
***
77.0%
72.0%
-5.0%
***
Notes: * p<0.05, ** p<0.01, ***p<0.001, NS= Not significant based on Chi squared test or Fisher’s exact test. Difference represents the percentage point difference between the two groups. Results are based on the most recent PHIA survey for each country.
Appendix Table 3
HIV Outcomes by Sex, 15 PEPFAR Countries
Country (Year)
Percent Aware of HIV status
Percent on Treatment
Percent Virally Suppressed
Male
Female
Difference
Sig.
Male
Female
Difference
Sig.
Male
Female
Difference
Sig.
Botswana (2021)
92.8%
96.1%
3.4%
***
90.0%
95.0%
5.0%
***
87.0%
93.0%
6.0%
***
Cameroon (2017)
51.2%
57.1%
5.9%
***
48.0%
53.0%
5.0%
***
39.0%
42.0%
3.0%
***
Côte d’Ivoire (2017)
40.0%
54.0%
14.0%
***
34.0%
51.0%
17.0%
***
22.0%
39.0%
17.0%
***
Eswatini (2021)
91.0%
94.0%
3.0%
***
88.0%
93.0%
5.0%
***
85.0%
89.0%
4.0%
***
Ethiopia (2017)
70.0%
82.0%
12.0%
***
69.0%
80.0%
11.0%
***
63.0%
68.0%
5.0%
***
Kenya (2018)
72.0%
83.0%
11.0%
***
68.0%
80.0%
12.0%
***
62.0%
72.0%
10.0%
***
Lesotho (2020)
88.0%
91.0%
3.0%
***
84.0%
89.0%
5.0%
***
76.0%
82.0%
6.0%
***
Malawi (2020)
85.0%
90.0%
5.0%
***
83.0%
89.0%
6.0%
***
80.0%
86.0%
6.0%
***
Mozambique (2021)
68.0%
73.0%
5.0%
***
65.0%
71.0%
6.0%
***
57.0%
64.0%
7.0%
***
Namibia (2017)
80.0%
89.0%
9.0%
***
75.0%
87.0%
12.0%
***
67.0%
80.0%
13.0%
***
Rwanda (2018)
80.0%
86.0%
6.0%
*
78.0%
84.0%
6.0%
*
67.0%
77.0%
10.0%
***
Tanzania (2016)
51.0%
63.0%
12.0%
***
46.0%
60.0%
14.0%
***
38.0%
53.0%
15.0%
***
Uganda (2020)
76.0%
83.0%
7.0%
***
72.0%
81.0%
9.0%
***
66.0%
75.0%
9.0%
***
Zambia (2021)
87.0%
90.0%
3.0%
***
85.0%
88.0%
3.0%
***
83.0%
84.0%
1.0%
***
Zimbabwe (2020)
84.0%
88.0%
4.0%
***
81.0%
86.0%
5.0%
***
72.0%
79.0%
7.0%
***
Notes: * p<0.05, ** p<0.01, ***p<0.001, NS= Not significant based on Chi squared test or Fisher’s exact test. Difference represents the percentage point difference between the two groups. Results are based on the most recent PHIA survey for each country.
Appendix Table 4
HIV Outcomes by Age, 15 PEPFAR Countries
Country (Year)
Percent Aware of HIV status
Percent on Treatment
Percent Virally Suppressed
Age < 25
Age ≥25
Difference
Sig.
Age < 25
Age ≥25
Difference
Sig.
Age < 25
Age ≥25
Difference
Sig.
Botswana (2021)
84.5%
95.4%
10.9%
***
83.0%
93.0%
10.0%
***
76.0%
92.0%
16.0%
***
Cameroon (2017)
20.6%
59.8%
39.2%
***
19.0%
56.0%
37.0%
***
14.0%
45.0%
31.0%
***
Côte d’Ivoire (2017)
33.0%
51.0%
18.0%
***
32.0%
47.0%
15.0%
***
18.0%
35.0%
17.0%
***
Eswatini (2021)
85.0%
95.0%
10.0%
***
82.0%
92.0%
10.0%
***
73.0%
89.0%
16.0%
***
Ethiopia (2017)
63.0%
80.0%
17.0%
***
63.0%
77.0%
14.0%
***
47.0%
68.0%
21.0%
***
Kenya (2018)
70.0%
80.0%
10.0%
*
65.0%
77.0%
12.0%
*
52.0%
71.0%
19.0%
***
Lesotho (2020)
82.0%
91.0%
9.0%
***
78.0%
88.0%
10.0%
***
64.0%
81.0%
17.0%
***
Malawi (2020)
76.0%
89.0%
13.0%
***
73.0%
88.0%
15.0%
***
66.0%
85.0%
19.0%
***
Mozambique (2021)
54.0%
75.0%
21.0%
***
52.0%
72.0%
20.0%
***
41.0%
65.0%
24.0%
***
Namibia (2017)
71.0%
88.0%
17.0%
***
70.0%
84.0%
14.0%
***
60.0%
77.0%
17.0%
***
Rwanda (2018)
69.0%
85.0%
16.0%
***
66.0%
83.0%
17.0%
***
56.0%
75.0%
19.0%
***
Tanzania (2016)
49.0%
60.0%
11.0%
***
45.0%
56.0%
11.0%
***
38.0%
49.0%
11.0%
***
Uganda (2020)
60.0%
84.0%
24.0%
***
57.0%
81.0%
24.0%
***
49.0%
75.0%
26.0%
***
Zambia (2021)
73.0%
90.0%
17.0%
***
72.0%
89.0%
17.0%
***
67.0%
86.0%
19.0%
***
Zimbabwe (2020)
75.4%
88.0%
12.6%
***
72.0%
86.0%
14.0%
***
58.0%
78.0%
20.0%
***
Notes: * p<0.05, ** p<0.01, ***p<0.001, NS= Not significant based on Chi squared test or Fisher’s exact test. Difference represents the percentage point difference between the two groups. Results are based on the most recent PHIA survey for each country.
Appendix Table 5
Changes in HIV Outcomes Over Time, Six Countries
Population sub-group
Percent Aware of HIV status
Percent on Treatment
Percent Virally Suppressed
PHIA 1
PHIA 2
Difference (Within Group)
PHIA 1
PHIA 2
Difference (Within Group)
PHIA 1
PHIA 2
Difference (Within Group)
Eswatini (2016, 2021)
Urban/Rural
Rural
88.6%
93.7%
5.1%
79.1%
91.5%
12.4%
72.0%
88.0%
16.0%
Urban
83.0%
92.0%
9.0%
73.0%
90.0%
17.0%
67.5%
85.0%
17.5%
Wealth
Lowest
89.6%
94.8%
5.2%
81.0%
93.0%
12.0%
72.6%
88.5%
15.9%
Highest
85.0%
92.0%
7.0%
74.0%
91.1%
17.1%
68.5%
87.7%
19.2%
Sex
Male
80.0%
91.0%
11.0%
72.0%
88.0%
16.0%
65.0%
85.0%
20.0%
Female
91.0%
94.0%
3.0%
80.0%
93.0%
13.0%
73.0%
89.0%
16.0%
Age
Age <25
72.0%
85.0%
13.0%
61.0%
82.0%
21.0%
47.0%
73.6%
26.6%
Age ≥25
88.9%
94.6%
5.7%
79.0%
92.0%
13.0%
75.0%
89.0%
14.0%
Lesotho (2016, 2021)
Urban/Rural
Rural
81.0%
90.0%
9.0%
75.0%
88.0%
13.0%
66.6%
79.2%
12.6%
Urban
81.0%
90.0%
9.0%
73.0%
86.0%
13.0%
63.3%
79.6%
16.3%
Wealth
Lowest
80.0%
89.0%
9.0%
74.0%
87.0%
13.0%
65.0%
79.0%
14.0%
Highest
84.0%
91.0%
7.0%
76.0%
88.0%
12.0%
67.0%
81.0%
14.0%
Sex
Male
77.0%
88.0%
11.0%
70.0%
84.0%
14.0%
61.0%
76.0%
15.0%
Female
84.0%
91.0%
7.0%
77.0%
89.0%
12.0%
68.0%
82.0%
14.0%
Age
Age <25
68.0%
82.0%
14.0%
61.0%
78.0%
17.0%
47.3%
63.6%
16.3%
Age ≥ 25
82.0%
90.0%
8.0%
76.0%
88.0%
12.0%
67.0%
81.0%
14.0%
Malawi (2015, 2020)
Urban/Rural
Rural
78.0%
89.0%
11.0%
72.0%
87.0%
15.0%
66.0%
85.0%
19.0%
Urban
73.0%
87.0%
14.0%
66.0%
84.0%
18.0%
59.0%
80.0%
21.0%
Wealth
Lowest
73.0%
87.0%
14.0%
65.0%
84.0%
19.0%
60.0%
80.0%
20.0%
Highest
74.0%
88.0%
14.0%
68.0%
86.0%
18.0%
62.0%
83.0%
21.0%
Sex
Male
72.0%
85.0%
13.0%
63.0%
83.0%
20.0%
57.0%
80.0%
23.0%
Female
80.0%
90.0%
10.0%
74.0%
89.0%
15.0%
68.0%
86.0%
18.0%
Age
Age <25
54.0%
76.0%
22.0%
46.0%
73.0%
27.0%
37.0%
66.0%
29.0%
Age ≥ 25
79.0%
89.0%
10.0%
72.0%
88.0%
16.0%
67.0%
85.0%
18.0%
Uganda (2016, 2020)
Urban/Rural
Rural
73.0%
79.0%
6.0%
66.0%
75.0%
9.0%
55.0%
69.0%
14.0%
Urban
72.0%
84.0%
12.0%
65.0%
81.0%
16.0%
55.3%
75.5%
20.2%
Wealth
Lowest
71.0%
76.0%
5.0%
60.0%
71.0%
11.0%
46.0%
60.0%
14.0%
Highest
71.5%
84.7%
13.2%
65.0%
82.0%
17.0%
56.0%
79.0%
23.0%
Sex
Male
67.0%
76.0%
9.0%
58.5%
72.1%
13.6%
48.0%
66.0%
18.0%
Female
75.0%
83.0%
8.0%
69.4%
80.8%
11.4%
59.0%
75.0%
16.0%
Age
Age <25
48.0%
60.0%
12.0%
44.0%
57.0%
13.0%
33.0%
49.0%
16.0%
Age ≥ 25
77.0%
84.0%
7.0%
69.0%
81.0%
12.0%
58.4%
74.9%
16.5%
Zambia (2016, 2021)
Urban/Rural
Rural
66.0%
89.0%
23.0%
56.0%
87.0%
31.0%
51.0%
85.0%
34.0%
Urban
74.0%
89.0%
15.0%
65.0%
87.0%
22.0%
58.7%
82.5%
23.8%
Wealth
Lowest
64.0%
83.0%
19.0%
51.0%
80.0%
29.0%
43.0%
77.0%
34.0%
Highest
79.0%
90.0%
11.0%
71.0%
89.0%
18.0%
64.0%
85.0%
21.0%
Sex
Male
69.0%
87.0%
18.0%
61.0%
85.0%
24.0%
53.6%
83.0%
29.4%
Female
72.0%
90.0%
18.0%
62.0%
88.0%
26.0%
56.0%
84.0%
28.0%
Age
Age <25
46.0%
73.0%
27.0%
38.0%
72.0%
34.0%
28.0%
67.0%
39.0%
Age ≥ 25
75.0%
90.0%
15.0%
65.0%
89.0%
24.0%
59.6%
86.0%
26.4%
Zimbabwe (2015, 2020)
Urban/Rural
Rural
77.9%
87.8%
9.9%
69.5%
85.6%
16.1%
59.3%
77.5%
18.2%
Urban
75.0%
84.6%
9.6%
65.7%
81.1%
15.4%
56.2%
72.7%
16.5%
Wealth
Lowest
79.2%
88.6%
9.4%
71.2%
86.2%
15.0%
59.9%
77.4%
17.5%
Highest
75.9%
83.6%
7.7%
65.6%
80.3%
14.7%
56.9%
72.1%
15.2%
Sex
Male
72.2%
84.3%
12.1%
63.9%
80.9%
17.0%
52.8%
72.0%
19.2%
Female
80.0%
88.3%
8.3%
71.0%
86.2%
15.2%
61.8%
78.5%
16.7%
Age
Age <25
60.3%
75.4%
15.1%
52.4%
71.9%
19.5%
43.2%
58.2%
15.0%
Age ≥ 25
78.9%
88.1%
9.2%
70.1%
85.5%
15.4%
60.0%
78.0%
18.0%
Notes: *All changes were significant at the p<0.05, ** p<0.01, or ***p<0.001 level. Difference represents the percentage point difference between surveys by subgroup.
Appendix Table 6
Changes in HIV Outcome Gap Over Time, by Country (Green = Gap Narrowed)
Populationsub-group
Percent Aware of HIV Status
Percent on Treatment
Percent Virally Suppressed
PHIA1
PHIA2
PHIA1
PHIA2
PHIA1
PHIA2
Eswatini (2016, 2021)
Urban/Rural Gap
-5.6
-1.7
-6.1
-1.5
-4.5
-3.0
High/Low Wealth Quintile Gap
-4.6
-2.8
-7.0
-1.9
-4.1
-0.8
Female/Male Gap
11.0
3.0
8.0
5.0
8.0
4.0
Younger/Older Age Gap
16.9
9.6
18.0
10.0
28.0
15.4
Lesotho (2016, 2021)
Urban/Rural Gap
0.0
0.0
-2.0
-2.0
-3.3
0.4
High/Low Wealth Quintile Gap
4.0
2.0
2.0
1.0
2.0
2.0
Female/Male Gap
7.0
3.0
7.0
5.0
7.0
6.0
Younger/Older Age Gap
14.0
8.0
15.0
10.0
19.7
17.4
Malawi (2015, 2020)
Urban/Rural Gap
-5.0
-2.0
-6.0
-3.0
-7.0
-5.0
High/Low Wealth Quintile Gap
1.0
1.0
3.0
2.0
2.0
3.0
Female/Male Gap
8.0
5.0
11.0
6.0
11.0
6.0
Younger/Older Age Gap
25.0
13.0
26.0
15.0
30.0
19.0
Uganda (2016, 2020)
Urban/Rural Gap
-1.0
5.0
-1.0
6.0
0.3
6.5
High/Low Wealth Quintile Gap
0.5
8.7
5.0
11.0
10.0
19.0
Female/Male Gap
8.0
7.0
10.9
8.7
11.0
9.0
Younger/Older Age Gap
29.0
24.0
25.0
24.0
25.4
25.9
Zambia (2016, 2021)
Urban/Rural Gap
8.0
0.0
9.0
0.0
7.7
-2.5
High/Low Wealth Quintile Gap
15.0
7.0
20.0
9.0
21.0
8.0
Female/Male Gap
3.0
3.0
1.0
3.0
2.4
1.0
Younger/Older Age Gap
29.0
17.0
27.0
17.0
31.6
19.0
Zimbabwe (2015, 2020)
Urban/Rural Gap
-2.9
-3.2
-3.8
-4.5
-3.1
-4.9
High/Low Wealth Quintile Gap
-3.3
-5.0
-5.6
-5.9
-3.0
-5.3
Female/Male Gap
7.8
4.0
7.1
5.3
9.0
6.5
Younger/Older Age Gap
18.6
12.6
17.7
13.6
16.8
19.8
Notes: Difference represents the percentage point difference between subgroups in each survey period.
Endnotes
Equity in the HIV response: Assessing progress and charting a way forward. Geneva and WashingtonnD.C.: Joint United Nations Programme on HIV/AIDS, United States Presidentu2019s Emergency Plan for AIDS Relief, Bureau of Global Health Security and Diplomacy, United States Department of State; 2024. Licence: CC BY-NC-SA 3.0 IGO. ↩︎
Equity in the HIV response: Assessing progress and charting a way forward. Geneva and WashingtonnD.C.: Joint United Nations Programme on HIV/AIDS, United States Presidentu2019s Emergency Plan for AIDS Relief, Bureau of Global Health Security and Diplomacy, United States Department of State; 2024. Licence: CC BY-NC-SA 3.0 IGO. ↩︎
Beyrer, C. et al. u201cUnder threat: the International AIDS Societyu2013Lancet Commission on Health and Human Rights.u201d The Lancet. 2014 https://doi.org/10.1016/S0140-6736(24)00302-7. ↩︎
The Ethiopia PHIA did not include data by urban/rural residence. ↩︎
This post was edited on November 15, 2024 to update the number of stand-alone prescription drug plans for 2025, based on updated data on plan availability from the Centers for Medicare & Medicaid Services. CMS’s September 2024 Part D landscape file data initially used for this analysis incorrectly included data for Clear Spring Health PDPs, which were terminated for 2025. Using the October 2024 landscape file produces a lower total plan count and benchmark plan count for 2025.
Medicare Part D is a voluntary outpatient prescription drug benefit for people with Medicare provided through private plans that contract with the federal government. Beneficiaries can choose to enroll in either a stand-alone prescription drug plan (PDP) to supplement traditional Medicare or a Medicare Advantage plan, mainly HMOs and PPOs, that provides all Medicare-covered benefits, including prescription drugs (MA-PD). This brief provides an overview of the Medicare Part D program, plan availability, enrollment, and spending and financing, based on KFF analysis of data from the Centers for Medicare & Medicaid Services (CMS), the Congressional Budget Office (CBO), and other sources. It also provides an overview of changes to the Part D benefit based on provisions in the Inflation Reduction Act. (A separate KFF brief provides more detail about Part D plan availability, premiums, and cost sharing.)
Key Takeaways
In 2025, 464 PDPs will be offered across the 34 PDP regions nationwide (excluding the territories), a 35% decrease from 2024. Despite the overall reduction, beneficiaries in each state will have a choice of at least a dozen stand-alone plans, plus many Medicare Advantage drug plans.
Compared to 2024, fewer plans will be available for enrollment of Part D Low-Income Subsidy (LIS) beneficiaries for no premium (“benchmark” plans) in 2025 – 90 plans, a 29% reduction compared to 2024. The number of benchmark plans will vary across states from 1 to 5.
Changes to the Medicare Part D benefit under the Inflation Reduction Act are taking effect in 2025, including a new $2,000 out-of-pocket cap, an increase in the share of drug costs above the cap paid for by Part D plans and drug manufacturers, and a reduction in Medicare’s share of these costs.
In 2024, 53 million of the 67 million Medicare beneficiaries are enrolled in Medicare Part D plans, including employer-only group plans; of the total, 57% are enrolled in MA-PDs and 43% are enrolled in stand-alone PDPs. As of June 2024, 3 million Part D enrollees receive premium and cost-sharing assistance through the LIS program.
The Congressional Budget Office (CBO) estimates that spending on Part D benefits will total $137 billion in 2025, representing 15% of net total Medicare spending. Funding for Part D comes from general revenues (75%), beneficiary premiums (15%), and state contributions (13%).
Medicare’s aggregate reinsurance payments to Part D plans are projected to account for 17% of total Part D spending in 2025, a substantial reduction from 2024. This change reflects the reduction in Medicare’s liability for catastrophic drug costs from 80% in 2024 to 20% for brands and 40% for generics in 2025.
Medicare Prescription Drug Plan Availability in 2025
In 2025, 464 PDPs will be offered across the 34 PDP regions nationwide (excluding the territories), a 35% decrease from 2024 and the lowest number of PDPs available since the Part D program’s beginning in 2006 (Figure 1). While the availability of stand-alone PDPs has been trending downward over time, along with a decline in PDP enrollment, the availability of Medicare Advantage drug plans has expanded in recent years, and more people in Medicare are now getting Part D drug coverage through Medicare Advantage plans.
Despite the overall reduction in the number of PDPs for 2025, beneficiaries in each state will have a choice of at least a dozen stand-alone PDPs, ranging from 12 PDPs in 12 states and D.C. to 16 PDPs in California (Figure 2). In addition, beneficiaries will be able to choose from among many MA-PDs available at the local level.
Low-Income Subsidy Plan Availability in 2025
Beneficiaries with low incomes and modest assets are eligible for assistance with Part D plan premiums and cost sharing. Through the Part D Low-Income Subsidy (LIS) program, additional premium and cost-sharing assistance is available for Part D enrollees with low incomes (less than 150% of poverty, or $22,590 for individuals/$30,660 for married couples in 2024) and modest assets (up to $17,220 for individuals/$34,360 for couples in 2024). As of 2024, anyone who qualifies for the LIS program receives full benefits, under a provision of the Inflation Reduction Act, meaning they pay only modest copayments for prescription drugs and are eligible for a full premium subsidy; in previous years, people with incomes between 135% and 150% of poverty received partial LIS benefits.
In 2025, fewer plans will be available for enrollment of LIS beneficiaries for no premium (“benchmark” plans) compared to 2024 – 90 plans, a 29% reduction, and the lowest number of benchmark plans available since Part D started (Figure 3). Less than one-fifth (19%) of PDPs in 2025 are benchmark plans.
Some enrollees have fewer benchmark plan options than others because benchmark plan availability varies at the Part D region level. The number of premium-free PDPs in 2025 ranges across states from 1 plan in 4 states (Florida, Illinois, Nevada, and Texas) to 5 plans in 1 state (Wisconsin) (Figure 4). LIS enrollees can select any plan offered in their area, but if they are enrolled in a non-benchmark plan, they may be required to pay some portion of their plan’s monthly premium.
Changes to Part D Under the Inflation Reduction Act
The Inflation Reduction Act contained several provisions to lower prescription drug spending by Medicare and beneficiaries, including major changes to the Medicare Part D program, which started to take effect in 2023. These changes were designed to address several concerns, including the lack of a hard cap on out-of-pocket spending for Part D enrollees; the inability of the federal government to negotiate drug prices with manufacturers; a significant increase in Medicare “reinsurance” spending for Part D enrollees with high drug costs; prices for many Part D covered drugs rising faster than the rate of inflation; and the relatively weak financial incentives faced by Part D plan sponsors to control high drug costs. Provisions in the law include:
Limiting the price of insulin products to no more than $35 per month in all Part D plans and makes adult vaccines covered under Part D available for free, as of 2023.
Requiring drug manufacturers to pay a rebate to the federal government if prices for drugs covered under Part D and Part B increase faster than the rate of inflation, with the initial period for measuring Part D drug price increases running from October 2022-September 2023.
Expanding eligibility for full benefits under the Part D Low-Income Subsidy program in 2024.
Adding a hard cap on out-of-pocket drug spending under Part D by eliminating the 5% coinsurance requirement for catastrophic coverage in 2024 and capping out-of-pocket spending at $2,000 in 2025.
Shifting more of the responsibility for catastrophic coverage costs to Part D plans and drug manufacturers, starting in 2025.
The 2025 Part D base beneficiary premium – which is based on bids submitted by both PDPs and MA-PDs and is not weighted by enrollment – is $36.78, a 6% increase from 2024. Annual growth in the base beneficiary premium is capped at 6% due to a provision in the Inflation Reduction Act. A new Part D premium stabilization demonstration for PDPs is also helping to moderate premium increases that Part D enrollees might otherwise have faced in 2025, as insurers adjust to higher costs associated with the new $2,000 out-of-pocket spending cap and increased liability for drug costs above the cap. The demonstration limits monthly PDP premium increases to $35 between 2024 and 2025.
The monthly amount that Part D enrollees pay for individual Part D plans is different from the base beneficiary premium, and enrollees may see their premium increase by more than 6% (or less, or even decrease) if they stay in the same plan for 2025. Actual monthly premiums paid by Part D enrollees in 2025 will vary considerably, ranging from $0 to $100 or more in most regions. In addition to the monthly premium, Part D enrollees with higher incomes ($103,000/individual; $206,000/couple) pay an income-related premium surcharge, ranging from $12.90 to $81.00 per month in 2024 (depending on income).
The Part D defined standard benefit is changing for 2025 and will include a new $2,000 cap on out-of-pocket drug spending. The benefit will have three phases, including a deductible, an initial coverage phase, and catastrophic coverage. For 2025, under the standard benefit, Part D enrollees will pay a deductible of $590 (up from $545 in 2024), and will then pay 25% of their drug costs in the initial coverage phase until their out-of-pocket spending totals $2,000. At that point, they will qualify for catastrophic coverage and will pay no additional out-of-pocket costs.
Part D plans must offer either the defined standard benefit or an alternative equal in value (“actuarially equivalent”) and can also provide enhanced benefits. Both basic and enhanced benefit plans vary in terms of their specific benefit design, coverage, and costs, including deductibles, cost-sharing amounts, utilization management tools (i.e., prior authorization, quantity limits, and step therapy), and which drugs are covered on their formularies. Plan formularies must include drug classes covering all disease states, and a minimum of two chemically distinct drugs in each class. Part D plans are required to cover all drugs in six “protected” classes: immunosuppressants, antidepressants, antipsychotics, anticonvulsants, antiretrovirals, and antineoplastics.
Part D and Low-Income Subsidy Enrollment in PDPs and MA-PDs
Enrollment in Medicare Part D plans is voluntary, except for beneficiaries who are eligible for both Medicare and Medicaid and certain other low-income beneficiaries who are automatically enrolled in a PDP if they do not choose a plan on their own. However, beneficiaries face a penalty equal to 1% of the national average premium for each month they delay enrollment unless they have drug coverage from another source that is at least as good as standard Part D coverage (“creditable coverage”).
In 2024, 53 million Medicare beneficiaries are enrolled in Medicare Part D plans, including employer-only group plans; of the total, 57% are enrolled in MA-PDs and 43% are enrolled in stand-alone PDPs (Figure 6). Another 0.8 million beneficiaries are estimated to have drug coverage through employer-sponsored retiree plans where the employer receives a subsidy from the federal government equal to 28% of drug expenses between $590 and $12,150 per retiree in 2025. Several million beneficiaries are estimated to have other sources of drug coverage, including employer plans for active workers, FEHBP, TRICARE, and Veterans Affairs (VA). Around 11% of people with Medicare are estimated to lack creditable drug coverage.
Recent years have seen a growing divide in the Part D plan market between stand-alone PDPs, where the number of plans has generally been trending downward over time in conjunction with a reduction in PDP enrollment, and MA-PDs, where plan availability and enrollment have grown steadily in recent years. The widespread availability of low or zero-premium MA-PDs, while PDPs charge substantially higher premiums, could tilt enrollment even more towards Medicare Advantage plans in the future.
As of June 2024, 14.3 million Part D enrollees receive premium and cost-sharing assistance through the LIS program. As with overall Part D enrollment, more people receiving LIS are enrolled in MA-PDs than PDPs. Beneficiaries who are dual-eligible individuals, those enrolled in Medicare Savings Programs (QMBs, SLMBs, Qis), and those who receive Supplemental Security Income payments from Social Security automatically qualify for the additional assistance, and Medicare automatically enrolls them into PDPs with premiums at or below the regional average (the Low-Income Subsidy benchmark) if they do not choose a plan on their own. Other beneficiaries are subject to both an income and asset test and need to apply for the Low-Income Subsidy through either the Social Security Administration or Medicaid.
Part D Spending and Financing
Part D Spending
In its June 2024 Medicare baseline projections, the Congressional Budget Office (CBO) estimated that spending on Part D benefits would total $137 billion in 2025, representing 15% of total Medicare outlays (net of offsetting receipts from premiums and state transfers). However, based on actual bid data submitted by Part D plans for coverage in 2025, CBO estimates higher federal spending on Part D of between $10 billion and $20 billion relative to its initial projections for 2025. CBO also estimates that Medicare will spend an additional $5 billion in 2025 on subsidies to plans that are participating in the Part D premium stabilization demonstration.
In general, Part D spending depends on several factors, including the total number of people enrolled in Part D, their health status and the quantity and type of drugs used, the number of people with high drug costs (above the catastrophic threshold), the number of people receiving the Low-Income Subsidy, the price of drugs covered by Part D and the ability of plan sponsors to negotiate discounts (rebates) with drug companies and preferred pricing arrangements with pharmacies, and to manage use (e.g., promoting use of generic drugs, prior authorization, step therapy, quantity limits, and mail order).
Part D Financing
Financing for Part D comes from general revenues (75%), beneficiary premiums (15%), and state contributions (13%). The monthly premium paid by Part D enrollees was initially set to cover 25.5% of the cost of standard drug coverage, but with the Inflation Reduction Act’s 6% premium stabilization provision and the new Part D premium stabilization program in effect, enrollees are paying a lower share of costs overall. Medicare subsidizes the remainder, based on bids submitted by plans for their expected benefit payments, and taking into account the additional payments that insurers participating in the Part D premium stabilization demonstration are receiving. Higher-income Part D enrollees pay a larger share of standard Part D costs, ranging from 35% to 85%, depending on income.
Payments to Plans
For 2025, Medicare’s actuaries estimate that Part D plans will receive direct subsidy payments averaging $1,417 per enrollee overall, $1,504 for enrollees receiving the LIS, and $445 in reinsurance payments for high-cost enrollees; employers are expected to receive, on average, $640 for retirees in employer-subsidy plans. Part D plans also receive additional risk-adjusted payments based on the health status of their enrollees, and plans’ potential total losses or gains are limited by risk-sharing arrangements with the federal government (“risk corridors”).
As of 2025, Medicare’s reinsurance payments to plans for total spending incurred by Part D enrollees above the catastrophic coverage threshold will subsidize 20% of brand-name drug spending and 40% of generic drug spending, down from 80% in previous years, due to a provision in the Inflation Reduction Act. With this change in effect, Medicare’s aggregate reinsurance payments to Part D plans are projected to account for 17% of total Part D spending in 2025, based on KFF analysis of data from the 2024 Medicare Trustees report. This is a substantial reduction from 2024, when reinsurance spending had grown to account for close to half of total Part D spending (46%) (Figure 7). Moving forward, the largest portion of total Part D spending will be accounted for by direct subsidy payments to plans (54% of total spending in 2025).
This chart collection compares the United States and other large, high-income nations across various measures of care quality to show how the U.S. stacks up against its peers and how that has changed over time.
Generally, the U.S. performs worse in long-term health outcomes measures (such as life expectancy), certain treatment outcomes (such as maternal mortality and congestive heart failure hospital admissions), some patient safety measures (such as obstetric trauma with instrument and medication or treatment errors), and patient experiences of not getting care due to cost. The U.S. performs similarly to or better than peer nations in some other measures of treatment outcomes (such as mortality rates within 30 days of acute hospital treatment) and patient safety (such as rates of post-operative sepsis).
The chart collection is part of the Peterson-KFF Health System Tracker, an online information hub dedicated to monitoring and assessing the performance of the U.S. health system.
Family premiums for employer-sponsored health insurance rose 7% this year to reach an average of $25,572 annually, KFF’s 2024 benchmark Employer Health Survey finds. On average, workers contribute $6,296 annually to the cost of family coverage.
This marks the second year in a row that premiums are up 7%. Over the past five years—a period of high inflation (23%) and wage growth (28%)—the cumulative increase in premiums has been similar (24%).
While employers are seeing total premiums for family coverage rise steadily, the amount that workers, on average, pay toward their annual premiums is little changed over the past five years—up less than $300 since 2019, or a total of 5% over five years. This may be due to a tight labor market.
Among workers who face an annual deductible for single coverage, the average this year stands at $1,787, similar to last year’s $1,735 and up a modest 8% since 2019 when the average was $1,655.
On average, workers with a deductible at small firms (under 200 workers) face much larger deductibles than workers at larger firms ($2,575 vs. $1,538). Among all covered workers, nearly a third (32%) of covered workers at smaller firms face an average single deductible of at least $3,000.
“Employers are shelling out the equivalent of buying an economy car for every worker every year to pay for family coverage,” KFF President and CEO Drew Altman said. “In the tight labor market in recent years, they have not been able to continue offloading costs onto workers who are already struggling with health care bills.”
About 154 million non-elderly Americans rely on employer-sponsored coverage, and the 26th annual survey of more than 2,100 large and small employers provides a detailed picture of the trends affecting it. In addition to the full report and summary of findings released today, Health Affairs is publishing an article with select findings online. The article will also appear in its November issue.
The survey finds that some of the nation’s largest employers (at least 5,000 workers) are taking steps to shield lower-wage workers from the full impact of rising health care costs. Of these jumbo firms, 29% say they have a program to reduce lower-wage workers’ premiums, and 19% say they offer a reduced-benefit plan with more affordable coverage.
Employer Coverage of GLP-1 Drugs for Weight Loss is Limited and Restricted
Amid a boom in interest in costly GLP-1 drugs such as Wegovy to treat weight loss, this year’s survey also gauges how widely available such coverage is in employer plans.
Fewer than 1-in-5 large employers with at least 200 workers offering health benefits (18%) say that they cover GLP-1 drugs for weight loss, while half (52%) say they don’t cover them, and the others (31%) are unsure. Among the largest firms with at least 5,000 workers, more than a quarter (28%) say they cover GLP-1 drugs, and nearly two thirds (64%) say they don’t.
Among large firms that offer the drugs, about half (53%) have conditions or requirements associated with their coverage. These conditions could present obstacles to accessing the drugs, such as first requiring a meeting with a dietician, psychologist, or other professional (24%); requiring participation in a lifestyle or weight-loss program either before (8%) or while (10%) taking the drugs; or another type of condition or requirement (26%).
Coverage for these weight-loss drugs has significant cost implications for employers, as a previous KFF analysis estimated that almost 50 million adults in employer plans meet the clinical criteria for taking such drugs, which can cost thousands of dollars annually per person.
Among large firms covering GLP-1 drugs for weight loss, a third (33%) say it will have a “significant impact” on their plan’s prescription drug spending. Among all large firms, nearly half (44%) say it will be “very important” or “important” to cover GLP-1 drugs for their employees’ satisfaction with their health plan.
Among large firms that do not currently cover GLP-1 drugs for weight loss, few (3%) say they are “very likely” to do so in the next year. A quarter (23%) say they are somewhat likely to do so.
“Employers face the challenge of integrating these potentially important treatments into their already costly benefit plans,” KFF Vice President and study author Gary Claxton said.
Other findings include:
IVF and other family-building benefits. Among large employers with at least 200 workers, about a quarter (27%) say they cover in-vitro fertilization (IVF), and a similar share (26%) say they cover artificial insemination. More say they cover fertility medications (37%), while fewer say they cover egg or sperm freezing (12%). Roughly a third of firms are unsure if their plans cover each item.
Rebates from pharmacy benefit managers(PBMs). PBMs manage prescription drug benefits on behalf of payers, including employers, and typically negotiate rebates with drug manufacturers in exchange for favorable placement of their drugs on formularies. Among the largest firms with at least 5,000 workers, 34% say they receive “most” of the rebates negotiated by their PBM or health plan; 34% say they receive “some,” and 8% say they receive “very little.” The rest are unsure how much of the rebates they receive.
Abortion. Among large employers with at least 200 workers, 8% say that their plan does not cover legally provided abortions under any circumstances, and another 18% say that they cover such abortions under limited circumstances, such as rape, incest, or the life or health of the pregnant enrollee. Most (45%) other large employers say they were not sure whether and how their plans covered abortion. These numbers are little changed from 2023.
Mental health and substance abuse. About a quarter of offering employers say their plan’s network for mental health and substance abuse services is “somewhat” or “very” narrow, compared to 10% who say the same about their networks generally. About half (48%) of large firms with at least 200 workers say they have increased the mental health counseling resources available to their workers through an employee assistance program or third-party vendors such as Headspace or Lyra Health.
Spousal coverage and incentives not to enroll. Among large firms with at least 200 workers that offer health benefits to spouses of workers, a quarter (24%) either require higher premiums or restrict coverage when spouses were offered health insurance from another source. In addition, 12% of large firms offering health benefits provide extra compensation or benefits to employees who enroll in a spouse’s plan, and 13% provide extra compensation or benefits to employees if they do not participate in the firm’s health benefits.
This is the 26th annual Employer Health Benefits Survey. As in years past, the survey examines trends in employer-sponsored health coverage, including premiums, employee contributions, cost-sharing provisions, offer rates, wellness programs, and employer practices. This year we asked employers detailed questions about their provider networks, abortion coverage, family building benefits, coverage for GLP-1 agonists as well as programs for lower-wage workers. The 2024 survey includes 2,142 interviews with non-federal public and private firms.
Annual premiums for employer-sponsored family health coverage reached $25,572 this year, 7% higher. On average, workers contributed $6,296 toward the cost of family coverage. The average deductible among covered workers in a plan with a general annual deductible is $1,787 for single coverage.
Survey results are released in several formats, including a full report with downloadable tables on a variety of topics, a summary of findings, and an article published in the journal Health Affairs.
NEWS RELEASE
A news release announcing the publication of the Employer Health Benefits Survey is available.
SUMMARY OF FINDINGS
The Summary of Findings provides an overview of the survey results and is available under the Summary of Findings.
FULL REPORT
The complete Employer Health Benefits Survey report includes over 200 exhibits and is available under the Report. The “Report” tab contains 13 separate sections. Users can view each section separately or download the section exhibits from the right side of the respective section page.
Key slides from the 2024 Employer Health Benefits Survey are here.
ADDITIONAL RESOURCES
Standard errors for selected estimates are available in the Technical Supplement.
Employer Health Benefits Surveys from 1998–2023 are available here. Please note that historic survey reports have not been revised with methodological changes.
Researchers may request a public use dataset by completing a data use agreement (available here).
For questions about the Employer Health Benefits Survey, please visit Contact Us and choose “TOPIC: Health Costs.”
Summary of Findings
Employer-sponsored insurance covers 154 million nonelderly people1. To provide a current snapshot of employer-sponsored health benefits, KFF conducts an annual survey of private and non-federal public employers with three or more workers. This is the 26th Employer Health Benefits Survey (EHBS) and reflects employer-sponsored health benefits in 2024.
HEALTH INSURANCE PREMIUMS AND WORKER CONTRIBUTIONS
The average annual premiums for employer-sponsored health insurance in 2024 are $8,951 for single coverage and $25,572 for family coverage. Over the last year, the average single premium increased by 6% and the average family premium increased by 7%. Comparatively, there was an increase of 4.5% in workers’ wages and inflation of 3.2%2. Over the last five years, the average premium for family coverage has increased by 24%, compared to a 28% increase in workers’ wages and inflation of 23% [Figure A, Figure B].
The average premiums for small and large firms are comparable for covered workers with single coverage ($9,131 vs. $8,884) and family coverage ($25,167 vs. $25,719). The average premiums for covered workers in high-deductible health plans with a savings option (HDHP/SO) are lower than the overall average premiums for both single coverage ($8,275) and family coverage ($24,196) [Figure C]. On the other hand, average premiums for covered workers enrolled in PPOs are higher than the overall average premiums for both single ($9,383) and family coverage ($26,678). The average premiums for both single and family coverage are lower for covered workers at private for-profit firms and higher for covered workers in private not-for-profit firms. The average premiums for single coverage for covered workers at firms with a larger share of older workers (where at least 35% of the workers are age 50 or older) are higher than the average premium for covered workers at firms with smaller shares of older workers ($9,171 vs. $8,738).
Figure A: Average Annual Worker and Employer Premium Contributions for Family Coverage, 2014, 2019, and 2024
Figure B: Cumulative Premium Increases, Inflation, and Earnings for Covered Workers With Family Coverage, 2004-2024
Figure C: Average Annual Worker and Employer Premium Contributions for Single and Family Coverage, by Plan Type, 2024
Most covered workers contribute to the cost of the premium. On average, covered workers contribute 16% of the premium for single coverage and 25% of the premium for family coverage, lower than the percentages contributed in 2023. The average contribution rate for covered workers in small firms is lower than the average contribution rate for covered workers in large firms for single coverage (14% vs.16%) but higher than the average contribution rate for covered workers in large firms for family coverage (33% vs. 23%). On average, covered workers at private, for-profit firms have relatively high premium contribution rates for both single coverage and family coverage.
Thirty-seven percent of covered workers at small firms are enrolled in a plan where the employer pays the entire premium for single coverage. This is the case for only 5% of covered workers at large firms. In contrast, 26% of covered workers at small firms are in a plan where they must contribute more than half of the premium for family coverage, compared to 6% of covered workers at large firms [Figure D].
The average annual dollar amounts contributed by covered workers in 2024 are $1,368 for single coverage and $6,296 for family coverage, similar to the amounts last year. The average contribution amount for covered workers at small firms ($1,204) is lower than the average contribution amount for covered workers at large firms ($1,429). However, the opposite is true for family coverage, where the average contribution amount for covered workers at small firms ($7,947) is higher than the amount at large firms ($5,697). Eight percent of covered workers, including 21% of covered workers at small firms, are in a plan with a worker contribution of $12,000 or more for family coverage.
Figure D: Distribution of Percentage of Premium Paid by Covered Workers for Single and Family Coverage, by Firm Size, 2024
PLAN ENROLLMENT
PPOs remain the most common plan type. In 2024, 48% of covered workers are enrolled in a PPO, 27% in a high-deductible plan with a savings option (HDHP/SO), 13% in an HMO, 11% in a POS plan, and 1% in a conventional (also known as an indemnity) plan [Figure E]. This distribution of covered workers across plan types is similar to the distributions of covered workers by plan type in recent years.
Figure E: Distribution of Health Plan Enrollment for Covered Workers, by Plan Type and Firm Size, 2019 and 2024
SELF FUNDING
Many firms – particularly larger firms – have self-funded health plans, which means that they pay for the health services for their workers directly from their own funds rather than through the purchase of health insurance. Sixty-three percent of covered workers, including 20% of covered workers at small firms and 79% at large firms are enrolled in plans that are self-funded. The percentage of covered workers in self-funded plans in 2024 is similar to last year.
Thirty-six percent of covered workers in small firms offering health benefits are covered by a level-funded plan, similar to the percentage in 2023. Level-funded arrangements combine a relatively small self-funded component with stop-loss insurance, which limits the employer’s liability and transfers a substantial share of the risk to insurers. These plans have the potential to meaningfully affect competition in the small group market because, unlike insured plans, they use health status as a factor in rating and underwriting and are not required to provide all of the essential health benefits that are mandatory for other plans..
EMPLOYEE COST SHARING
Eighty-seven percent of workers with single coverage have a general annual deductible that must be met before most services are paid for by the plan, similar to the percentage last year (90%).
The average deductible amount in 2024 for workers with single coverage and a general annual deductible is $1,787, similar to last year. The average deductible is higher for covered workers at small firms ($2,575) than at large firms ($1,538). Among workers with single coverage and an annual deductible, the average amount is similar to the deductible amount five years ago ($1,655) but is 47% higher than the amount ten years ago.
In 2024, 32% of covered workers are in a plan with a general annual deductible of $2,000 or more for single coverage, similar to the percentage (31%) last year. Covered workers in small firms are more likely than those in large firms to be in such a plan (50% vs. 26%). The percentage of covered workers with a general annual deductible of $2,000 or more for single coverage has grown over the last ten years, from 18% to 32% [Figure F].
Some workers in health plans with high deductibles also receive contributions to savings accounts from their employers. These contributions can be used to reduce cost sharing amounts. Twenty-five percent of covered workers in an HDHP with a Health Reimbursement Arrangement (HRA), and 2% of covered workers in a Health Savings Account (HSA)-qualified HDHP receive an account contribution for single coverage that is greater than or equal to their deductible amount. Additionally, 24% of covered workers in an HDHP with an HRA and 9% of covered workers in an HSA-qualified HDHP receive account contributions that, if applied to their deductible, would reduce their personal annual liability to less than $1,000.
In addition to any general annual deductible they may have, most covered workers also pay a portion of the cost of care when they use health care services, typically a copayment (a fixed dollar amount) or coinsurance (a percentage of the covered amount). For physician office visits, the average copayments are $26 for a primary care visit and $42 for a visit to a specialist. The average coinsurance rate is 20% for both primary care and specialist visits. All of these amounts are similar to the amounts in 2023.
When admitted to the hospital, 59% of covered workers have coinsurance requirements, 16% have a copayment, and 9% have both a copayment and coinsurance requirement. The average coinsurance rate for a hospital admission is 21% and the average copayment amount is $343. The cost sharing requirements for outpatient surgery follow a similar pattern to those for hospital admissions, although the average copayment amount for outpatient surgery is lower, at $216.
Virtually all covered workers are in plans with an annual limit on in-network cost sharing (called an out-of-pocket maximum) for single coverage, though these limits vary significantly. Among covered workers in plans with an out-of-pocket maximum for single coverage, 14% are in a plan with an out-of-pocket limit of $2,000 or less, while 24% are in a plan with a limit above $6,000.
Figure F: Percentage of Covered Workers Enrolled in a Plan With a General Annual Deductible of $2,000 or More for Single Coverage, by Firm Size, 2009-2024
AVAILABILITY OF EMPLOYER-SPONSORED COVERAGE
In 2024, 54% of all firms offered some health benefits, similar to the percentage last year (53%). Large firms (200 or more workers) are much more likely than small firms to offer health benefits to at least some of their workers (98% vs. 53%).
Most firms are very small, leading to fluctuations in the overall offer rate, as estimates of the offer rate for small firms can vary widely from year to year. Most workers, however, work for larger firms, where the offer rates are higher and much more stable. Over ninety percent (93%) of firms with 50 or more workers offer health benefits in 2024. This percentage has remained consistent over the last 10 years. Overall, 89% of workers employed at firms with 3 or more workers are employed at a firm that offers health benefits to at least some of its workers.
Despite almost nine in ten workers being employed by firms that offer health benefits to at least some workers, many workers are not covered by their employers’ plans. Some are not eligible to enroll (due to factors such as waiting periods or part-time or temporary work status), while others who are eligible choose not to enroll (they may feel the coverage is too expensive, or they may be covered through another source). Additionally, some firms provide incentives for workers to not enroll in their plans, or to enroll in a spouses’ plan. Overall, at firms that offer coverage, an average of 81% of workers are eligible. Among eligible workers, 75% take up the firm’s offer. Ultimately, 61% of workers at firms that offer health benefits are enrolled in coverage. All these percentages are similar to those in 2023.
The average shares of workers covered by jobs vary with workforce characteristics. Among workers at firms offering health benefits, those working for firms with a relatively large share of younger workers are less likely to be covered by their own firm than workers in firms with a smaller share of younger workers (44% vs. 64%). Workers at firms with a relatively large share of lower-wage workers are less likely to be covered by their own firm than workers at firms with a smaller share of lower-wage workers (50% vs. 64%)3. The share of workers employed at public organizations covered by their own employer (72%) is higher than the shares of workers employed at private for-profit firms (59%), or private non-for-profit firms (60%) covered at their work.
Across firms that offer health benefits and firms that do not, 54% of all workers are covered by health plans offered by their employer.
Inducements Not to Enroll. Among firms with ten or more employees that offer health benefits, 9% provide additional compensation or benefits to employees if they enroll in a spouse’s plan, and 11% provide additional compensation or benefits to employees if they do not participate in the firm’s health benefits..
AVAILABILITY OF COVERAGE FOR SPOUSES OF COVERED WORKERS
A very large share of firms that offer health benefits offer to cover dependents of covered workers. Among firms offering health benefits, 95 percent of firms with 10 to 49 employees and virtually all (99%) larger firms offered spouses an opportunity to enroll.
Among firms with 200 or more workers offering coverage to spouses, 10% do not allow the spouse to enroll if they are offered health insurance from another source, 13% place conditions on spouses wishing to enroll, such as limiting plan choice, or requiring a surcharge for enrolling spouses if they are offered coverage from another source. Among firms with 200 or more workers offering coverage to spouses, 8% require a surcharge for spouses who are offered coverage from another source..
HEALTH PROMOTION AND WELLNESS PROGRAMS
Many firms sponsor programs to help workers identify health issues and manage chronic conditions. These programs include health risk assessments, biometric screenings, and health promotion programs.
Health Risk Assessments. Among firms offering health benefits, 31% of small firms and 56% of large firms provide workers the opportunity to complete a health risk assessment. Among large firms that offer a health risk assessment, 54% use incentives or penalties to encourage workers to complete the assessment.
Biometric Screenings. Among firms offering health benefits, 9% of small firms and 44% of large firms provide workers the opportunity to complete a biometric screening. Among large firms with a biometric screening program, 65% use incentives or penalties to encourage workers to complete the assessment, similar to the percentage last year.
Health and Wellness Promotion Programs. Many firms offering health benefits offer programs to help workers identify and address health risks and unhealthy behaviors. Fifty-four percent of small firms and 79% of large firms offer a program in at least one of these areas: smoking cessation, weight management, and behavioral or lifestyle coaching. The percentage of both small firms and large firms offering one of these programs are similar to the percentages last year (62% and 80%, respectively)..
GLP-1 DRUG COVERAGE FOR WEIGHT LOSS
GLP-1 (Glucagon-like peptide-1) agonists, used to help control blood sugar levels in people with type 2 diabetes, have also been shown to be an effective drug to help people lose weight. However, the high cost of these drugs, combined with the large number of people who could benefit and the potential for long-term usage, has raised questions about the potential costs to plans that cover them.
Eighteen percent of firms with 200 or more employees, including 25% of firms with 1,000 or more employees, cover GLP-1 agonists when used primarily for weight loss. Firms with 200 to 999 employees are more likely than larger firms to respond that they do not to know to this question [Figure G].
Among firms with 200 or more employees that provide coverage for GLP-1 agonists primarily for weight loss, 53% have some type of condition or requirement associated with covering these medications. These include 24% that require employees to meet with a professional, such as a dietitian, psychologist, case worker, or therapist before approving a GLP-1 drug prescription, 8% that require employees to enroll in a lifestyle or weight loss program for a period of time before approving a GLP-1 drug prescription and 10% that require employees to enroll in lifestyle or weight loss program while taking GLP-1 drugs.
Firms with 200 or more employees covering GLP-1 agonists primarily for weight loss were asked about the potential impacts on costs and employee satisfaction. Thirty-three percent of these firms, including 58% of firms with 5,000 or more employees, say that covering these medications for weight loss will have a “significant impact” on their prescription drug spending. Sixteen percent of firms offering health benefits say that covering these medications for weight loss will be “very important” for employees’ satisfaction with their health plan, including 28% which currently cover GLP-1 agonists for weight loss [Figure H].
Among firms with 200 or more employees that do not provide coverage for GLP-1 agonists primarily for weight loss, 62% say that they are “not likely” to begin covering these medications for weight loss within the next twelve months, 23% say that they are “somewhat likely” to do so, 3% say that they are “very likely” to do so, and 11% do not know.
Figure G: Percentage of Firms Covering Glp-1 Agonists When Used Primarily for Weight Loss, by Firm Size, 2024
Figure H: Firms View On How Much of an Impact Glp-1 Agonists Will Have On Prescription Drug Spending, by Firm Size, 2024
HEALTH PLAN PROVIDER NETWORKS
Tiered and Narrow Networks. Health plans structure their networks of providers to provide access to care and to encourage enrollees to use providers that are lower cost, or that provide better care. One option to accomplish these goals are high-performance or tiered network plans, which use cost-sharing or other incentives to encourage enrollees to use in-network providers that have better performance or quality, or have lower costs. Another option are narrow network plans, which significantly restrict the number of participating providers in order to reduce costs.
Among firms with 50 or more employees that offer health benefits, 20% have a high-performance network or tiered network as part of their health plan with the largest enrollment in 2024. Firms with 1,000 or more employees are more likely to include a high-performance or tiered network in their largest health plan than smaller employers (27% vs. 20%). Eight percent of firms with 50 or more employees that offer health benefits offer a health plan that can be considered a narrow network in 2024, similar to the percentage last year (11%). Firms with 5,000 or more employees are more likely to offer a narrow network plan than employers with fewer employees (18% vs. 8%).
Employer Views on the Breadth of Their Provider Networks.
Employers that offer health benefits were asked to characterize the breadth of the provider network in their plan with the largest enrollment overall, and for services for mental health and substance use conditions.
Fifty-four percent of firms characterize the network in their plan with the largest enrollment as ‘very broad,’ 35% say it is ‘somewhat broad’, and 10% say it is ‘somewhat narrow’ or ‘very narrow’. Firms with 200 or more employees are more likely than smaller firms to characterize the provider network in their plan with the largest enrollment as “very broad” (68% vs. 54%).
Thirty percent of firms characterize the network in their plan with the largest enrollment as ‘very broad’ for mental health and substance use condition services, 45% say it is ‘somewhat broad’ for these services, and 24% say it is ‘somewhat narrow’ or ‘very narrow’. Firms with 200 or more employees are more likely than smaller firms to characterize the provider network in their plan with the largest enrollment as “very broad” for mental health and substance use condition services (46% vs. 30%) [Figure I].
Employers that offer health benefits are less likely to characterize their network with the largest enrollment as ‘very broad’ for mental health and substance use condition services than for medical services overall. This is true for small firms (3 to 199 employees) (30% vs. 54%) and larger firms (46% vs. 68%). However, 48% of large employers have increased the number of mental health counseling resources available to employees through an employee assistance program or some other third-party vendors, such as Headspace or Lyra Health.
Figure I: How Broad the Firm Considers Their Largest Plan’s Provider Network, by Firm Size, 2024
BENEFITS FOR FAMILY BUILDING SERVICES
Some employers have introduced benefits to help employees trying to conceive or adopt a child. Among firms with 200 or more employees that offer health benefits, 37% provide coverage for fertility medications in their plan with the largest enrollment, 26% provide coverage for intrauterine (artificial) insemination, 27% provide coverage for in-vitro fertilization (IVF), 12% provide coverage for cryopreservation, sometimes called egg or sperm freezing, 13% provide coverage for adoption services, and 7% have coverage for other family-building services. Many large employers were uncertain about their coverage of family building benefits and reported don’t know, including 29% for fertility medications, 32% for artificial insemination, 30% for IVF, 38% for cryopreservation and 26% for adoption..
PRICE AND COST SHARING INFORMATION FOR ENROLLEES
New federal rules require health plans (including self-funded plans) to make information available to enrollees about the estimated cost of services and cost-sharing on a “real-time” basis. Among firms with 200 or more employees that offer health benefits, 41% say that providing employees with additional information about the cost of services will help their health care decision making “a great deal”, 38% of these firms say that it will help their decision making “somewhat”, 15% say that it will help their decision making “very little”, and 2% say that it will help their decision making “not at all”. Thirteen percent of these firms say that the new requirements will reduce health spending “a great deal”, 50% say that the new requirements will reduce health spending “somewhat”, 24% say that the new requirements will reduce health spending “very little”, and 7% say that the new requirements will reduce health spending “not at all”..
ABORTION SERVICES
The United States Supreme Court decision in Dobbs vs. Jackson, and subsequent state activity to regulate abortion has increased interest in coverage for abortion services in employer plans. Firms with 200 or more employees offering health benefits were asked which of several statements best described the coverage of abortion services in their largest health plan.
Twenty-nine percent of these firms said that legally provided abortions are covered in most or all circumstances (sometimes referred to as elective or voluntary abortion). Firms with 5,000 or more workers were more likely than smaller firms to give this response (39%) [Figure J].
Eighteen percent of these firms said that legally provided abortions are covered only under limited circumstances, such as rape, incest, or health or life endangerment of the pregnant enrollee. Firms with 5,000 or more workers were more likely than smaller firms to give this reply (31%).
Eight percent of these firms said that legally provided abortions are not covered under any circumstance. Firms reporting that legally provided abortions are not covered were asked to confirm that their largest plan would not cover abortion under any circumstance, even in states where abortion was legal. In total, 81% verified this was their policy.
Forty-five percent of responding firms answered “Don’t know” to this question. Respondents with 200 to 999 workers were more likely than other respondents to answer, “Don’t know,” while respondents with 1,000 to 4,999 workers and 5,000 or more workers were less likely to do so.
Five percent of large firms offering health benefits currently provide or plan to provide financial assistance for travel expenses for enrollees who travel out of state to obtain an abortion if they do not have access near their home. Firms with 5,000 or more workers are more likely than other firms to say they provide or plan to provide travel benefits (21% vs. 5%).
Figure J: Percentage of Firms Whose Largest Plan Covers Legally Provided Abortion, by Firm Size, 2024
ASSISTANCE FOR LOWER-WAGE WORKERS
Some firms have programs to make it easier for lower-wage workers to afford to enroll in a health plan. Among firms with 200 or more employees offering health benefits, 6% have a program that reduces cost sharing for lower-wage workers and 14% have a program that reduces their premium contributions.Employers with 5,000 or more workers are relatively more likely to have a program that reduces premium contributions for lower-wage workers while employers with 200 to 999 employees are relatively less likely to have such a program. Fourteen percent of these firms offer a plan with reduced benefits and a low premium contribution to make it affordable for lower-wage workers..
DISCUSSION
The average annual premium increased 6% for single coverage and 7% for family coverage in 2024, similar to the rates in 2023. These increases likely reflect higher prices for health care, which have followed the higher prices in the rest of the economy over the last several years. Changes in premiums can lag other economic measures because insurers lock in prospective prices with providers. Therefore, it may take some time for premium changes to reflect the more modest inflation in 2024. Looking over a longer period, family premiums have grown 24% over the last five years, roughly comparable to the rate of inflation (23%) and the change in wages (28%) over the period.
Unlike the change in premiums, deductible amounts have been stable for several years, though they are still quite high. The average deductible in 2024 for single coverage among those with a deductible ($1,787) is not statistically different than last year ($1,735) nor five years ago ($1,655).
Whether and how to cover GLP-1 agonists when used primarily for weight loss has been a much-discussed issue for employers and other public and private health insurance payers. These drugs, which have recently been shown to be an effective drug to help people lose weight, are quite costly and have the potential to be used for long periods of time. Among employers with 1,000 or more employees, only one-in-four employers cover these drugs when used primarily for weight loss in 2024; 69% of these employers that do not cover them for this purpose say that they are not likely to do so within the next twelve months. Among the one-in-four that do cover them, 46% say that covering these medications for weight loss will have a “significant impact” on their prescription drug spending, while only 31% say that covering these medications for weight loss will be “very important” for employees’ satisfaction with their health plan.
Coverage for these drugs is likely to remain a hot future topic as employers and other payers gain insights about the long-term effectiveness and costs associated with these drugs. A key issue for payers and users of these medications is whether those who use them can eventually maintain lower weights without continued reliance on these medications. Many payers that currently cover these drugs for weight loss have accompanying requirements such as counseling or enrollment in lifestyle or weight loss programs with the hope that users can reduce or eliminate their need for these medications over time. The effectiveness of these programs is likely to be an important factor for employers in their future decision making about whether and how to cover these medications..
METHODOLOGY
The KFF 2024 Employer Health Benefits Survey reports findings from a survey of 2,142 randomly selected non-federal public and private employers with three or more workers. Davis Research, LLC conducted the field work between January and July 2024. The overall response rate is 14%, which includes firms that offer and do not offer health benefits. Unless otherwise noted, differences referred to in the text and figures use the 0.05 confidence level as the threshold for significance. Small firms have 3-199 workers unless otherwise noted. Values below 3% are not shown on graphs to improve readability. Some distributions may not sum due to rounding. For more information about survey methodology, see the Survey Design and Methods section at ehbs.kff.org.
Filling the need for trusted information on national health issues, KFF is a nonprofit organization based in San Francisco, California.
This threshold is based on the twenty-fifth percentile of workers’ earnings ($35,000 in 2024). Seasonally adjusted data from the Current Employment Statistics Survey. Bureau of Labor Statistics. Current Employment Statistics—CES (national) [Internet]. Washington (DC): BLS. Available from: https://www.bls.gov/ces/publications/highlights/highlights-archive.htm↩︎
Survey Design and Methods
KFF has conducted this annual survey of employer-sponsored health benefits since 1999. Since 2020, KFF has employed Davis Research LLC (Davis) to field the survey. From January to July 2024, Davis interviewed business owners as well as human resource and benefits managers at 2,142 firms.
SURVEY TOPICS
The survey includes questions on the cost of health insurance, health benefit offer rates, coverage, eligibility, plan type enrollment, premium contributions, employee cost sharing, prescription drug benefits, retiree health benefits, and wellness benefits.
Firms that offer health benefits are asked about the plan attributes of their largest health maintenance organization (HMO), preferred provider organization (PPO), point-of-service (POS) plan, and high-deductible health plan with a savings option (HDHP/SO).4 We treat exclusive provider organizations (EPOs) and HMOs as one plan type and conventional (or indemnity) plans as PPOs. The survey defines an HMO as a plan that does not cover nonemergency out-of-network services. POS plans use a primary care gatekeeper to screen for specialist and hospital visits. HDHP/SOs are plans with a deductible of at least $1,000 for single coverage and $2,000 for family coverage and that either offer a health reimbursement arrangement (HRA) or are eligible for a health savings account (HSA). Definitions of the health plan types are available in Section 4, and a detailed explanation of the HDHP/SO plan type is in Section 8. Throughout this report, we use the term “in-network” to refer to services received from a preferred provider.
To reduce survey burden, questions on cost sharing for office visits, hospitalization, outpatient surgery and prescription drugs were only asked about the firm’s largest plan type. Firms sponsoring multiple plan types were asked about premiums, worker contributions and deductibles for their two largest plan types. Within each plan type, respondents are asked about the plan with the most enrollment.
Firms are asked about the attributes of their current plans during the interview. While the survey’s fielding period begins in January, many respondents may have a plan whose 2024 plan year lags behind the calendar year. In some cases, plans may report the attributes of their 2023 plans and some plan attributes (such as HSA deductible limits) may not meet the calendar year regulatory requirements. Decisions concerning plan features and costs may have taken place months before the interview..
SAMPLE DESIGN
The sample for the annual KFF Employer Health Benefits Survey includes private firms and nonfederal government employers with three or more employees. The universe is defined by the U.S. Census’ 2020 Statistics of U.S. Businesses (SUSB) for private firms and the 2022 Census of Governments (COG) for non-federal public employers. At the time of the sample design (December 2023), this data represented the most current information on the number of public and private firms nationwide with three or more workers. As in the past, the post-stratification is based on the most up-to-date Census data available (the 2021 SUSB). We determine the sample size based on the number of firms needed to ensure a target number of completes in six size categories.
We attempted to repeat interviews with prior years’ survey respondents (with at least ten employees) who participated in either the 2022 or the 2023 survey, or both. Firms with 3-9 employees are not included in the panel to minimize the potential of panel effects. In total, 278 firms participated in 2022, 464 firms participated in 2023, and 612 firms participated in both 2022 and 2023. Non-panel firms are randomly selected within size and industry groups.
Since 2010, the sample has been drawn from a Dynata list (based on a census assembled by Dun and Bradstreet) of the nation’s private employers and the COG for public employers. To increase precision, we stratified the sample by ten industry categories and six size categories. The federal government and businesses with fewer than three employees are not included. Education is a separate category for the purposes of sampling, and included in ‘Service’ category for weighting. For information on changes to the sampling methods over time, please consult the extended methods at ehbs.kff.org..
RESPONSE RATE
Response rates are calculated using a CASRO method, which accounts for firms that are determined to be ineligible in its calculation. The overall response rate is 14% [Figure M.1].5 The response rate for panel firms is higher than the response rate for non-panel firms. Similar to other employer and household surveys, the Employer Health Benefits Survey has seen a general decrease in response rates over time. Since 2017, we have attempted to increase the number of completes by increasing the number of non-panel firms in the sample. While this generally increases the precision of estimates by ensuring a sufficient number of respondents in various sub-groups, it has the effect of reducing the overall response rate.
The vast majority of questions are asked only of firms that offer health benefits. A total of 1,703 of the 2,142 responding firms indicated they offered health benefits. We asked one question of all firms in the study with which we made phone contact even if the firm declined to participate: “Does your company offer a health insurance program as a benefit to any of your employees?”. A total of 4,769 firms responded to this question (including 2,142 who responded to the full survey and 2,627 who responded to this one question). These responses are included in our estimates of the percentage of firms offering health benefits.6 The response rate for this question is 31% [Figure M.1].
Figure M.1: Response Rates for Various Subsets of the Sample, 2024
While response rates have decreased, elements of the survey design limit the potential impact of a response bias. Most major statistics are weighted by the percentage of covered workers at a firm. Collectively, 3,200,000 of the 71,600,000 workers covered by their own firm’s health benefits in the United States were employed by firms which completed in the survey. The most important statistic that is weighted by the number of employers is the offer rate; firms that do not complete the full survey are asked whether their firm offers health benefits to any employees. As noted, this question relies on a wider set of respondents than just those completing the full survey. As in years past the majority of firms are very small, so the considerable fluctuation we see across years in the offer rate for these small firms drives the overall offer rate..
FIRM SIZES AND KEY DEFINITIONS
Throughout the report, we report data by size of firm, region, and industry. Unless otherwise specified, firm size definitions are as follows: small firms: 3-199 workers; and large firms: 200 or more workers. [Figure M.2] shows selected characteristics of the survey sample. A firm’s primary industry classification is determined from Dynata’s designation on the sampling frame and is based on the U.S. Census Bureau’s North American Industry Classification System (NAICS), [Figure M.3]. A firm’s ownership category and other firm characteristics such as the firm’s wage level and the age of the work force are based on respondents’ answers. While there is considerable overlap in firms in the “State/Local Government” industry category and those in the “public” ownership category, they are not identical. For example, public school districts are included in the ‘Service’ industry even though they are publicly owned. Family coverage is defined as health coverage for a family of four.
Figure M.2: Selected Characteristics of Firms in the Survey Sample, 2024
Figure M.3: Industries by NAICS code
[Figure M.4] presents the breakdown of states into regions and is based on the U.S Census Bureau’s categorizations. State-level data are not reported both because the sample size is insufficient in many states and we only collect information on a firm’s primary location rather than where all workers may actually be employed. Some mid- and large-size employers have employees in more than one state, so the location of the headquarters may not match the location of the plan for which we collected premium information.
Figure M.4: States by Region, 2024
[Figure M.5] displays the distribution of the nation’s firms, workers, and covered workers (employees receiving coverage from their employer). Among the three million firms nationally, approximately 60.4% employ 3 to 9 workers; such firms employ 7.5% of workers, and 3.8% of workers covered by health insurance. In contrast, less than one percent of firms employ 5,000 or more workers; these firms employ 37.8% of workers and 43.1% of covered workers. Therefore, the smallest firms dominate any statistics weighted by the number of employers. For this reason, most statistics about firms are broken out by size categories. In contrast, firms with 1,000 or more workers are the most influential employer group in calculating statistics regarding covered workers, since they employ the largest percentage of the nation’s workforce. Statistics among small firms and those weighted by the number of firms tend to have more variability.
Figure M.5: Distribution of Employers, Workers, and Workers Covered by Health Benefits, by Firm Size, 2024
Although most firms in the United States are small, most workers covered by health benefits are employed at large firms: 73% of the covered worker weight is controlled by firms with 200 or more employees. Conversely, firms with 3–199 employees represent 98% percent of the employer weight.
The survey asks firms what percentage of their employees earn more or less than a specified amount in order to identify the portion of a firm’s workforce that has relatively lower or higher wages. This year, the income threshold is $35,000 or less per year for lower-wage workers and $77,000 or more for higher-wage workers. These thresholds are based on the 25th and 75th percentile of workers’ earnings as reported by the Bureau of Labor Statistics using data from the Occupational Employment Statistics (OES) (2022).7 The cutoffs were inflation-adjusted and rounded to the nearest thousand.
Annual inflation estimates are calculated as an average of the first three months of the year. The 12 month percentage change for this period was 3.2%.8 Data presented is nominal unless indicated specifically otherwise..
ROUNDING AND IMPUTATION
Some figures in the report do not sum to totals due to rounding. Although overall totals and totals for size and industry are statistically valid, some breakdowns may not be available due to limited sample sizes or high relative standard errors. Where the unweighted sample size is fewer than 30 observations, figures include the notation “NSD” (Not Sufficient Data). Estimates with high relative standard errors are reviewed and in some cases not published. Many breakouts by subsets may have a large standard error, meaning that even large differences between estimates are not statistically different. Values below 3% are not shown on graphical figures to improve the readability of those graphs. The underlying data for all estimates presented in graphs are available in the Excel documents accompanying each section on ehbs.kff.org.
To control for item nonresponse bias, we impute values that are missing for most variables in the survey. On average, 12% of observations are imputed. All variables, with the exception of some single coverage premiums, are imputed following a hotdeck approach. The hotdeck approach replaces missing information with observed values from a firm similar in size and industry to the firm for which data are missing. For a given firm, if both single and family coverage premiums are missing, the single coverage premium is predicted using other known characteristics of the plan and firm through a random forest algorithm. This method reduces bias and improves subsequently hotdecked values (such as family premiums and worker contributions). In 2024, there were sixty-one variables where the imputation rate exceeded 20%; most of these cases were for individual plan level statistics. When aggregate variables were constructed for all of the plans, the imputation rate is usually much lower. There are a few variables that we have decided not to impute; these are typically variables where “don’t know” is considered a valid response option. Some variables are imputed based on their relationship to each other. For example, if a firm provided a worker contribution for family coverage but no premium information, a ratio between the family premium and family contribution was imputed and then the family premium was calculated. We estimate separate single and family coverage premiums for firms that provide premium amounts as the average cost for all covered workers.
To ensure data accuracy we have several processes to review outliers and illogical responses. Every year several hundred firms are called back to confirm or correct responses. In some cases, answers are edited based on responses to open-ended questions or based on established logic rules.
Figure M.6: Imputation Rates of Premiums, Worker Contributions, and Deductibles, by Plan Type, 2020-2024
WEIGHTING
Because we select firms randomly, it is possible through the use of weights to extrapolate the results to national (as well as firm size, regional, and industry) averages. These weights allow us to present findings based on the number of workers covered by health plans, the number of total workers, and the number of firms. In general, findings in dollar amounts (such as premiums, worker contributions, and cost sharing) are weighted by covered workers. Other estimates, such as the offer rate, are weighted by firms.
The employer weight was determined by calculating the firm’s probability of selection. This weight was trimmed of overly influential weights and calibrated to U.S. Census Bureau’s 2021 Statistics of U.S. Businesses for firms in the private sector, and the 2022 Census of Governments totals. The worker weight was calculated by multiplying the employer weight by the number of workers at the firm and then following the same weight adjustment process described above. The covered-worker weight and the plan-specific weights were calculated by multiplying the percentage of workers enrolled in each of the plan types by the firm’s worker weight. These weights allow analyses of all workers covered by health benefits and of workers in a particular type of health plan.
The trimming procedure follows the following steps: First, we grouped firms into size and offer categories of observations. Within each strata, we calculated the trimming cut point as the median plus six times the interquartile range (M + [6 * IQR]). Weight values larger than this cut point are trimmed. In all instances, very few weight values were trimmed.
To account for design effects, the statistical computing package R version 4.4.0 (2024-04-24 ucrt) and the library “survey” version 4.4.2 were used to calculate standard errors..
STATISTICAL SIGNIFICANCE AND LIMITATIONS
All statistical tests are performed at the .05 confidence level. For figures with multiple years, statistical tests are conducted for each year against the previous year shown, unless otherwise noted. No statistical tests are conducted for years prior to 1999.
Statistical tests for a given subgroup are tested against all other firm sizes not included in that subgroup: For example, Northeast is compared to all firms NOT in the Northeast (an aggregate of firms in the Midwest, South, and West). However, statistical tests for estimates compared across plan types (for example, average premiums in PPOs) are tested against the “All Plans” estimate. In some cases, we also test plan-specific estimates against similar estimates for other plan types (for example, single and family premiums for HDHP/SOs against single and family premiums for HMO, PPO, and POS plans); these are noted specifically in the text. The two types of statistical tests performed are the t-test and the Wald test. The small number of observations for some variables resulted in large variability around the point estimates. These observations sometimes carry large weights, primarily for small firms. The reader should be cautioned that these influential weights may result in large movements in point estimates from year to year; however, these movements are often not statistically significant. Standard Errors for some key statistics are available in a technical supplement available at ehbs.kff.org.
Due to the complexity of many employer health benefits programs, this survey is not able to capture all the components of any particular plan. For example, many employers have complex and varied prescription drug benefits, premium contributions, and incentives for wellness programs. We attempted to complete interviews with the person who is most knowledgeable about the firm’s health benefits. In some cases, the firm may not know details of some elements of their plan and not others. While we collect information on the number of workers enrolled in health benefits, the survey is not able to capture the characteristics of the workers offered or enrolled in any particular plan..
DATA COLLECTION AND SURVEY MODE
Starting in 2022, we expanded the use of computer assisted web interview (CAWI), offering most respondents the opportunity to complete the survey using an online questionnaire rather a telephone interview. In 2024, fifty-seven percent of survey responses were completed via telephone interview, and the remainder were completed online.
Survey mode did not impact the survey results in a systematic or obvious manner. The effects of mode and firm size on major firm characteristics such as annual premiums, contributions, and deductibles was tested using standard linear regression. For certain plan types, survey implementation through telephone interview had a negative effect on the reported value. However, the plan types affected were random, so this effect is more likely due to confounding variables. When examining demographic characteristics between the two modes, there were small differences in the distribution of categorical variables such as region and age..
PRICSSA
In their Journal of Survey Statistics and Methodology article, Seidenberg, Moser, and West (2023) propose a checklist for survey administrators and sponsoring organizations to help external researchers quickly understand the methods used to create a complex sample dataset.9 The Preferred Reporting Items for Complex Sample Survey Analysis (PRICSSA) recommends a standard format to enumerate data collection and analysis techniques across a variety of different surveys. KFF has adopted this checklist to increase transparency for our readership and also to promote reproducibility among external researchers granted access to our public use files.
1.1 Data collection dates: January 15, 2024–July 12, 2024.
1.2 Data collection mode(s): fifty-seven percent computer-assisted telephone interviewing (CATI), and the remainder completed with computer assisted web interview (CAWI).
1.3 Target population: Private firms as well as state and local government employers with three or more employees in 50 US states and Washington DC.
1.4 Sample design: A sample stratified by ten industry categories and six size categories drawn from a Dynata list (based on a census assembled by Dun and Bradstreet) of the nation’s private employers and the Census of Governments for public employers.
1.5 Full Survey response rate: 14 percent (CASRO method).
2.1 Missingness rates: On average, 12% of observations are imputed.
2.2 Observation deletion: Observations found to be duplicated firms.
2.3 Sample sizes: 2,142 firms completed the entire survey, 4,769 completed at least the offer question, out of 26,426 initially sampled firms, generalizing to a total of three million firms.
2.4 Confidence intervals / standard errors: All statistical tests are performed at the .05 confidence level.
2.5 Weighting: empwt (firms), empwt_a6 (firms, including those answering only the offer question), wkrwt (workers), covwt (policyholders), hmowt, ppowt, poswt, and hdpwt (plan weights)
2.6 Variance estimation: Taylor Series Linearization with newcell used as the stratum variable but no PSU variable.
2.7 Subpopulation analysis: The R survey package toolkit such as svyby and a complex sample design’s subset method allowed for most analysis of subdomains.
2.8 Suppression rules: Where the unweighted sample size is fewer than 30 observations, figures include the notation “NSD” (Not Sufficient Data). Estimates with high relative standard errors are reviewed and in some cases not published.
2.9 Software and code: All design-based analyses were performed using R version 4.4.0 (2024-04-24 ucrt) and survey library version 4.4.2.
2024 SURVEY
The 2024 survey features new questions, on prescription drug policy, mental health and substance use, GLP-1 drug coverage, family-building services, transparency, and affordability issues for lower-wage workers.
As in previous years, modification were made to existing survey questions, both to improve clarity or respond to changes in the marketplace. Starting in 2024, the introductory text for web-based interviews was condensed. In an effort to reduce respondent burden, we removed questions on waiting periods, emergency room cost sharing, wellness program incentives, disease management, sites of care, and prior authorization. We also restricted clarification follow-up calls (or callbacks) to only firms with at least one premium or cost sharing-related item: observations for firms with outliers only in the drug tier section of the questionnaire were imputed based on logic rules.
In some cases respondents report they offer coverage, but do not offer a comprehensive major medical plan. This year we added additional questions to clarify whether plans with low premiums were major medical plans. We dropped fewer than five firms where the respondent told us they did not cover most physician services and hospital admissions other than preventative care from the premium average.
9.8 percent of respondents in 2024 were either unable to provide their firm’s single coverage premium, or provided a response which was logically inconsistent with other values. In these cases, in order to minimize non-response bias, missing responses were imputed. In prior years, if a firm was missing a single premium value, this value was imputed using a ‘hot deck’ approach in which a single premium was selected among firms with similar demographic characteristics. This year we revised this method. In cases in which both the single and family premiums were missing, the single premium was estimated based on other known characteristics of the plan and firm. This method is advantageous because it predicts single premiums based on specific firm characteristics related to the premium, such as cost-sharing and deductibles, as well as demographics. Then, the family premium, as well as single and family worker contributions (if missing), were subsequently hot decked based on their relationship to the single premium. In cases in which a firm provides a response to the family premium, the single premium is imputed based on a ratio of the premiums. Therefore, in total, 8% of responses were affected by this change.
The updated imputation process uses a random forest machine learning model. The model was trained on EHBS data from 2021-2023. Features were selected using step wise regression. The hyper-parameters of the model were tuned using the grid search algorithm. Compared to hot-decking, this method is significantly better at explaining the variation in the observed data (R-squared of 0.2071 versus 0.00018540). This methodological change has a relatively minor impact on the overall premium; the 2024 premium would be 0.8% different if we did not implement the new method. However, this change meaningfully impacts the precision of premium estimates for demographic subgroups..
OTHER RESOURCES
Additional information on the 2024 Employer Health Benefit Survey is available at ehbs.kff.org, including an article in the Journal Health Affairs, an interactive graphic and historic reports. Standard errors for some statistics are available in the online technical supplement. Researchers may also request a public use dataset here: https://www.kff.org/contact-us/
The survey design and methods section found on our website (ehbs.kff.org) contains an extended methods document that was not included in the portable document format (PDF) or the printed versions of this book. Readers interested in the extended methodology should consult the online edition of this publication.
Published: October 9, 2024. Last Updated: October 03, 2024..
HISTORICAL DATA
Data in this report focus primarily on findings from surveys conducted and authored by KFF since 1999. Between 1999 and 2017, the Health Research & Educational Trust (HRET) co-authored this survey. HRET’s divestiture had no impact on our survey methods, which remain the same as years past. Prior to 1999, the survey was conducted by the Health Insurance Association of America (HIAA) and KPMG using a similar survey instrument, but data are not available for all the intervening years. Following the survey’s introduction in 1987, the HIAA conducted the survey through 1990, but some data are not available for analysis. KPMG conducted the survey from 1991-1998. However, in 1991, 1992, 1994, and 1997, only larger firms were sampled. In 1993, 1995, 1996, and 1998, KPMG interviewed both large and small firms. In 1998, KPMG divested itself of its Compensation and Benefits Practice, and part of that divestiture included donating the annual survey of health benefits to HRET.
This report uses historical data from the 1993, 1996, and 1998 KPMG Surveys of Employer-Sponsored Health Benefits and the 1999-2017 Kaiser/HRET Survey of Employer-Sponsored Health Benefits. For a longer-term perspective, we also use the 1988 survey of the nation’s employers conducted by the HIAA, on which the KPMG and KFF surveys are based. The survey designs for the three surveys are similar.
[Figure M.7] displays the historic sample sizes and weights of firms, workers, and covered workers (employees receiving coverage from their employer).
Figure M.7: Historic Firm Sample Sizes and Weights, 1999-2024
[Figure M.8] displays the historic sample frames and weighting universes.
Figure M.8: Sampling and Weighting Targets, 1999-2024
1999
The Kaiser Family Foundation and The Health Research and Educational Trust (Kaiser/HRET) began sponsoring the survey of employer-sponsored health benefits supported for many years by KPMG Peat Marwick LLP, an international consulting and accounting firm. In 1998, KPMG divested itself of its Compensation and Benefits Practice, and donated the annual survey of health benefits to HRET, a non-profit research organization affiliated with the American Hospital Association. From 1999 until 2017, the survey was conducted under a partnership between HRET and The Kaiser Family Foundation, a health care philanthropy and policy research organization that is not affiliated with Kaiser Permanente or Kaiser Industries. Starting in 1999, survey continued a core set of questions from prior KPMG surveys, but was expanded to include small employers and a variety of policy-oriented questions. Some reports include data from the 1993, 1996 and 1998 KPMG Surveys of Employer-Sponsored Health Benefits. For a longer-term perspective, we also use the 1988 survey of the nation’s employers conducted by the Health Insurance Association of America (HIAA), on which the KPMG, Kaiser/HRET, and Kaiser Family Foundation surveys were based. Many of the questions in the HIAA, KPMG, Kaiser/HRET, and Kaiser Family Foundation surveys are identical, as is the sample design. Since Point-of-Service (POS) plans did not exist in 1988, reports do not include statistics for this plan type in that year. Starting in 1999, Kaiser/HRET drew its sample from a Dun & Bradstreet list of the nation’s private and public employers with three or more workers. To increase precision, Kaiser/HRET stratified the sample by industry and the number of workers in the firm. Kaiser/HRET attempted to repeat interviews with many of the 2,759 firms interviewed in 1998 and replaced non-responding firms with another firm from the same industry and firm size. As a result, 1,377 firms in the 1999 total sample of 1,939 firms participated in both the 1998 and 1999 surveys.
Kaiser/HRET attempted to repeat interviews with many of the 1,939 firms interviewed in 1999 and replaced non-responding firms with other firms of the same industry and firm size. As a result, 982 firms in the 2000 survey’s total sample of 1,887 firms participated in both the 1999 and 2000 surveys. The overall response rate was 45% down from 60% in 1999. Contributing to the declining response rate was the decision not to re-interview any firms with 3-9 workers who participated in the 1999 survey. In 1999, the survey weights had instead been adjusted to control for the fact that firms with 3-9 workers that are in the panel (responded in either 1998 or 1999) are biased in favor of offering a health plan. The response rate in 2000 for firms with 3-9 workers was 30%.
The list of imputed variables was greatly expanded in 2002 to also include self-insurance status, level of benefits, prescription drug cost-sharing, copay and coinsurance amounts for prescription drugs, and firm workforce characteristics such as average income, age and part-time status. On average, 2% of these observations are imputed for any given variable. The imputed values are determined based on the distribution of the reported values within stratum defined by firm size and region.
The calculation of the weights followed a similar approach to previous years, but with several notable changes in 2003. First, as in years past, the basic weight was determined, followed by a nonresponse adjustment added this year to reflect the fact that small firms that do not participate in the full survey are less likely to offer health benefits and, consequently, are unlikely to answer the single offer rate question. To make this adjustment, Kaiser/HRET conducted a follow-up survey of all firms with 3-49 workers that did not participate in the full survey. Each of these 1,744 firms was asked the single question, “Does your company offer or contribute to a health insurance program as a benefit to its employees?” The main difference between this follow-up survey and the original survey is that in the follow-up survey the first person who answered the telephone was asked whether the firm offered health benefits, whereas in the original survey the question was asked of the person who was identified as most knowledgeable about the firm’s health benefits. Conducting the follow-up survey accomplished two objectives. First, statistical techniques (a McNemar analysis which was confirmed by a chi-squared test) demonstrated that the change in method-speaking with the person answering the phone rather than a benefits manager-did not bias the results of the follow-up survey. Analyzing firms who responded to the offer question twice, in both the original and follow-up survey, proved that there was no difference in the likelihood that a firm offers coverage based on which employee answered the question about whether a firm offers health benefits. Second, the follow-up survey demonstrated that very small firms not offering health benefits to their workers are less likely to answer the one survey question about coverage. Kaiser/HRET analyzed the group of firms that only responded to the follow-up survey and performed a t-test between the firms who had responded to the initial survey as well as the follow-up, and those who only responded to the follow-up. Tests confirmed the hypothesis that the firms that did not answer the single offer rate question in the original survey were less likely to offer health benefits. To adjust the offer rate data for this finding an additional non-response adjustment was applied to increase the weight of firms in the sample that do not offer coverage. The second change to the weighting method in 2003 was to trim the weights in order to reduce the influence of weight outliers. On occasion one or two firms will, through the weighting process, represent a highly disproportionate number of firms or covered workers. Rather than excluding these observations from the sample, a set cut point that would minimize the variances of several key variables (such as premium change and offer rate) was determined. The additional weight represented by outliers is then spread among the other firms in the same sampling cell. Finally, a post-stratification adjustment was applied. In the past, Kaiser/HRET was poststratified back to the Dun & Bradstreet frequency counts. Concern over volatility of counts in recent years led to the use of an alternate source for information on firm and industry data. This year the survey uses the recently released Statistics of U.S. Businesses conducted by the U.S. Census as the basis for the post-stratification adjustment. These Census data indicate the percentage of the nation’s firms with 3-9 workers is 59% rather than the higher percentages (e.g., 76% in 2002) derived from Dun & Bradstreet’s national database. This change has little impact on worker-based estimates, since firms with 3-9 workers accounted for less than 10% of the nation’s workforce. The impact on estimates expressed as a percentage of employers (e.g., the percent of firms offering coverage), however, may be significant. Due to these changes, Kaiser/HRET recalculated the weights for survey years 1999-2002 and modified estimates published in the survey where appropriate. The vast majority of these estimates are not statistically different. However, please note that the survey data published starting in 2003 varies slightly from previously published reports.
In 2005, the Kaiser/HRET survey added two additional sections to the questionnaire to collect information about high-deductible health plans (HDHP) that are offered along with a health reimbursement account (HRA) or are health savings account (HSA) qualified. Questions in these sections were asked of all firms offering these plan types, regardless of enrollment. Specific weights were also created to analyze the HDHP plans that are offered along with HRAs or are HSA qualified. These weights represent the proportion of employees enrolled in each of these arrangements.
We updated our data to reflect the 2002 Census of Governments. We also removed federal government employee counts from our post-stratification.
For the first time in 2006, Kaiser/HRET asked questions about the highest enrollment HDHP/SO as a separate plan type, equal to the other plan types. In prior years, data on HDHP/SO plans were collected as part of one of the other types of plans. Therefore, the removal of HDHP/SOs from the other plan types may affect the year to year comparisons for the other plan types. Given the decline in conventional health plan enrollment and the addition of HDHP/SO as a plan type option, Kaiser/HRET eliminated nearly all questions pertaining to conventional coverage from the survey instrument. We continue to ask firms whether or not they offer a conventional health plan and, if so, how much their premium for conventional coverage increased in the last year, but respondents are not asked additional questions about the attributes of the conventional plans they offer. Because we have limited information about conventional health plans, we must make adjustments in calculating all plan averages or distributions. In cases where a firm offers only conventional health plans, no information from that respondent is included in all plan averages. The exception is for the rate of premium growth, for which we have information. If a firm offers a conventional health plan and at least one other plan type, for categorical variables we assign the values from the health plan with the largest enrollment (other than the conventional plan) to the workers in the conventional plan. In the case of continuous variables, covered workers in conventional plans are assigned the weighted average value of the other plan types in the firm.
The survey newly distinguished between plans that have an aggregate deductible amount in which all family members’ out-of-pocket expenses count toward the deductible and plans that have a separate amount for each family member, typically with a limit on the number of family members required to reach that amount.
In 2006, Kaiser/HRET began asking employers if they had a health plan that was an exclusive provider organization (EPO). We treat EPOs and HMOs together as one plan type and report the information under the banner of “HMO”; if an employer sponsors both an HMO and an EPO, they are asked about the attributes of the plan with the larger enrollment.
Kaiser/HRET made a slight change to one of the industry groups: we removed Wholesale from the group that also included Agriculture, Mining and Construction. The nine industry categories now reported are: Agriculture/Mining/Construction, Manufacturing, Transportation/Communications/Utilities, Wholesale, Retail, Finance, Service, State/Local Government, and Health Care.
Starting in 2006, we made an important change to the way we test the subgroups of data within a year. Statistical tests for a given subgroup (firms with 25-49 workers, for instance) are tested against all other firm sizes not included in that subgroup (all firm sizes NOT including firms with 25-49 workers in this example). Tests are done similarly for region and industry: Northeast is compared to all firms NOT in the Northeast (an aggregate of firms in the Midwest, South, and West). Statistical tests for estimates compared across plan types (for example, average premiums in PPOs) are tested against the “All Plans” estimate. In some cases, we also test plan specific estimates against similar estimates for other plan types (for example, single and family premiums for HDHP/SOs against single and family premiums in HMO, PPO, and POS plans). Those are noted specifically in the text. This year, we also changed the type of Chi-square test from the Chi-square test for goodness-of-fit to the Pearson Chi-square test. Therefore, in 2006, the two types of statistical tests performed are the t-test and the Pearson Chi-square test.
Kaiser/HRET drew its sample from a Survey Sampling Incorporated list (based on an original Dun and Bradstreet list) of the nation’s private and public employers with three or more workers.
In prior years, many variables were imputed following a hotdeck approach, while others followed a distributional approach (where values were randomly determined from the variable’s distribution, assuming a normal distribution). This year, all variables are imputed following a hotdeck approach. This imputation method does not rely on a normal distribution assumption and replaces missing values with observed values from a firm with similar characteristics, in this case, size and industry. Due to the low imputation rate for most variables, the change in methodology is not expected to have a major impact on the results. In some cases, due to small sample size, imputed outliers are excluded. There are a few variables that Kaiser/HRET has decided should not be imputed; these are typically variables where “don’t know” is considered a valid response option (for example, firms’ opinions about effectiveness of various strategies to control health insurance costs).
The survey now contains a few questions on employee cost sharing that are asked only of firms that indicate in a previous question that they have a certain cost-sharing provision. For example, the copayment amount for prescription drugs is asked only of those that report they have copayments for prescription drugs. Because the composite variables are reflective of only those plans with the provision, separate weights for the relevant variables were created in order to account for the fact that not all covered workers have such provisions.
National Research, LLC (NR), our Washington, D.C.-based survey research firm, introduced a new CATI (Computer Assisted Telephone Interview) system at the end of 2007, and, due to several delays in the field, obtained fewer responses than expected. As a result, an incentive of $50 was offered during the final two and a half weeks the survey was in the field. Kaiser/HRET compared the distribution of key variables between firms receiving the incentive and firms not receiving the incentive to determine any potential bias. Chi-square test results were not significant, suggesting minimal to no bias.
In 2008, we changed the method used to report the annual percentage premium increase. In prior years, the reported percentage was based on a series of questions that asked responding firms the percentage increase or decrease in premiums from the previous year to the current year for a family of four in the largest plan of each plan type (e.g., HMO, PPO). The reported premium increase was the average of the reported percentage changes (i.e., 6.1% for 2007) weighted by covered workers. This year, we calculate the overall percentage increase in premiums from year to year for family coverage using the average of the premium dollar amounts for a family of four in the largest plan of each plan type reported by respondents and weighted by covered workers (i.e., $12,106 for 2007 and $12,680 for 2008, an increase of 5%). A principal advantage of using the premium dollar amounts to calculate the annual change in premiums is that we are better able to capture changes in the cost of health insurance for those firms that are newly in the market or that change plan types, especially those that move to plans with very different premium levels. For example, in the first year that a firm offers a plan of a new plan type, such as a consumer-directed plan, the firm can report the level of the premium they paid, but using the previous method would be unable to report the rate of change from the previous year since the plan was not previously offered. If the premium for the new plan is relatively low compared to other premiums in the market, the relatively low premium amount that the firm reports will tend to lower the weighted average premium dollar amount reported in the survey, but the firm responses would not provide any information to the percentage premium increase question. Another advantage of using premium dollar amounts to examine trends is that these data directly relate to the other findings in the survey and better address a principal public policy issue (i.e., what was the change in the cost of insurance over some past period). Many users noted, for example, that the percentage change calculated from the reported premium dollar amounts between two years did not directly match the reported average premium increase for the same period. There are several reasons why we would not expect these questions to produce identical results: 1) they are separate questions subject to varying degrees of reporting error, 2) firms could report a premium dollar amount for a plan type they might not have offered in the previous year, therefore, contributing information to one measure but not the other, or 3) firms could report a premium dollar amount for a plan that was not the largest plan of that type in the previous year. Although the two approaches have generated similar results in terms of the long-term growth rate of overall family premiums, there are greater discrepancies in trends for subgroups like small employers and self-funded firms. Focusing on the dollar amount changes over time will provide a more reliable and consistent measure of premium change that also is more sensitive to firms offering new plan options.
As we have in past years, this year we collected information on the cost-sharing provisions for hospital admissions and outpatient surgery that is in addition to any general annual plan deductible. However, for the 2008 survey, we changed the structure of the question and now include “separate annual deductible or hospital admissions” as a response option rather than collecting the information through a separate question. We continue to examine and sometimes modify the questions on hospital and outpatient surgery cost sharing because this can be a complex component of health benefit plans. For example, for some plans it is difficult to distinguish a separate hospital deductible from one categorized as a general annual deductible, where office visits and preventive care are covered and the deductible only applies to hospital use. Because this continues to be a point of confusion, we continue to refine the series of questions in order to clearly convey the information we are attempting to collect from respondents.
As in 2007, we asked firms if they offer health benefits to opposite-sex or same-sex domestic partners. However, this year, we changed the response options because during early tests of the 2008 survey, several firms noted that they had not encountered the issue yet, indicating that the responses of “yes,” “no,” and “don’t know” were insufficient. Therefore, this year we added the response option “not applicable/not encountered” to better capture the number of firms that report not having a policy on the issue.
In the fall of 2008, with guidance from experts in survey methods and design from NORC, we reviewed the methods used for the survey. As a result of this review, several important modifications were made to the 2009 survey, including the sample design and questionnaire. For the first time, this year we determined the sample requirements based on the universe of firms obtained from the U.S. Census rather than Dun and Bradstreet. Prior to the 2009 survey, the sample requirements were based on the total counts provided by Survey Sampling Incorporated (SSI) (which obtains data from Dun and Bradstreet). Over the years, we have found the Dun and Bradstreet frequency counts to be volatile because of duplicate listings of firms, or firms that are no longer in business. These inaccuracies vary by firm size and industry. In 2003, we began using the more consistent and accurate counts provided by the Census Bureau’s Statistics of U.S. Businesses and the Census of Governments as the basis for post-stratification, although the sample was still drawn from a Dun and Bradstreet list. In order to further address this concern at the time of sampling, we now also use Census data as the basis for the sample. This change resulted in shifts in the sample of firms required in some size and industry categories.
This year, we also defined Education as a separate sampling category, rather than as a subgroup of the Service category. In the past, Education firms were a disproportionately large share of Service firms. Education is controlled for during post-stratification, and adjusting the sampling frame to also control for Education allows for a more accurate representation of both Education and Service industries.
In past years, both private and government firms were sampled from the Dun and Bradstreet database. For the 2009 sample, Government firms were sampled in-house from the 2007 Census of Governments. This change was made to eliminate the overlap of state agencies that were frequently sampled from the Dun and Bradstreet database. Each year the survey attempts to repeat interviews with respondents from past years (see “Response Rate” section below), and in order to maintain government firms that had completed the survey in the past (firms that have completed the survey in the past are known as panel firms), government firms from the 2008 survey were matched to the Census of Governments to identify phone numbers. All panel government firms were included in the sample (resulting in an oversample). In addition, the sample of private firms is screened for firms that are related to state/ local governments, and if these firms are identified in the Census of Governments, they are reclassified as government firms and a private firm is randomly drawn to replace the reclassified firm. These changes to the sample frame resulted in an expected slight reduction in the overall response rate, since there were shifts in the number of firms needed by size and industry. Therefore, the data used to determine the 2009 Employer Health Benefits sample frame include the U.S. Census’ 2005 Statistics of U.S. Businesses and the 2007 Census of Governments. At the time of the sample design (December 2008), these data represented the most current information on the number of public and private firms nationwide with three or more workers. As in the past, the post- stratification is based on the most up-to-date Census data available (the 2006 update to the Census of U.S. Businesses was purchased during the survey field period) and the 2007 Census of Governments. The Census of Governments is conducted every five years, and this is the first year the data from the 2007 Census of Governments have been available for use.
Based on recommendations from cognitive researchers at NORC and internal analysis of the survey instrument, a number of questions were revised to improve the clarity and flow of the survey in order to minimize survey burden. For example, in order to better capture the prevalence of combinations of inpatient and outpatient surgery cost sharing, the survey was changed to ask a series of yes or no questions. Previously, the question asked respondents to select one response from a list of types of cost sharing, such as separate deductibles, copayments, coinsurance, and per diem payments (for hospitalization only). We have also expanded the number of questions for which respondents can provide either the number of workers or the percentage of workers. Previously, after obtaining the total number of employees, the majority of questions asked about the percentage of workers with certain characteristics. Now, for questions such as the percentage of workers making $23,000 a year or less or the enrollment of workers in each plan type, respondents are able to respond with either the number or the percentage of workers. Few of these changes have had any noticeable impact on responses.
New topics in the 2010 survey include questions on eligibility for dependent coverage, coverage for care received at retail clinics, health plan changes as a result of the Mental Health Parity and Addiction Equity Act of 2008, and disease management. As in past years, this year’s survey included questions on the cost of health insurance, offer rates, coverage, eligibility, enrollment patterns, premiums, employee cost sharing, prescription drug benefits, retiree health benefits, wellness benefits, and employer opinions.
Firms in the sample with 3-49 workers that did not complete the full survey are contacted and asked (or re-asked in the case of firms that previously responded to only one question about offering benefits) whether or not the firm offers health benefits. As part of the process, we conduct a McNemar test to verify that the results of the follow-up survey are comparable to the results from the original survey. If the test indicates that the results are comparable, a nonresponse adjustment is applied to the weights used when calculating firm offer rates. This year, for the first time since we began conducting the follow-up survey, the test indicated that the results from those answering the one question about offering health benefits in the original survey and those answering the follow-up survey were different (statistically significant difference at the p<0.05 level between the two surveys), suggesting the results are not comparable. Therefore, we did not use the results of this follow-up survey to adjust the weights as we have in the past. In the past, the nonresponse adjustment lowered the offer rate for smaller firms by one to three percentage points, so not making the adjustment this year makes the offer rate look somewhat higher when making comparisons to prior years. For 2010, we saw a very large and unexpected increase in the offer rate (from 60 percent in 2009 to 69 percent in 2010) overall and particularly for firms with 3 to 9 workers (from 46 percent in 2009 to 59 percent in 2010). While not making the adjustment this year added to the size of the change, there would have been a large and difficult to explain change even if a nonresponse adjustment comparable to previous years had been made.
New topics in the 2011 survey include questions on stoploss coverage for self-funded plans, cost sharing for preventive care, plan grandfathering resulting from the Affordable Care Act (ACA), and employer awareness of tax credits authorized under the ACA.
This year, we became aware that the way we have been using the data from the Census Bureau for calibration was incorrect and resulted in an over-count of the actual number of firms in the nation. Specifically, firms operating in more than one industry were counted more than once in computing the total firm count by industry, and firms with establishments were counted more than once in computing the total firm count by state (which affects the regional count). Because smaller firms are less likely to operate in more than one industry or state, the miscounts occurred largely for larger from sizes. The error affects only statistics that are weighted by the number of firms (such as the percent of firms offering health benefits or sponsoring a disease management plan). Statistics that are weighted by the number of workers or covered workers (such as average premiums, contributions, or deductibles) were not affected. We addressed this issue by proportionally distributing the correct national total count of firms within each firm size as provided by the U.S. Census Bureau across industry and state based on the observed distribution of workers. This effectively weights each firm within each category (industry or state) in proportion to its share of workers in that category. The end result is a synthetic count of firms across industry and state that sums to the national totals. Firm-weighted estimates resulting from this change show only small changes from previous estimates, because smaller firms have much more influence on national estimates. For example, the estimate of the percentage of firms offering coverage was reduced by about .05 percentage points in each year (in some years no change is evident due to rounding). Estimates of the percentage of large firms offering retiree benefits were reduced by a somewhat larger amount (about 2 percentage points). Historical estimates used in the 2011 survey release have been updated following this same process. As noted above, worker-weighted estimates from prior years were not affected by the miscount and remain the same.
New topics in the 2012 survey include the use of biometric screening, domestic partner benefits, and emergency room cost sharing. In addition, many of the questions on health reform included in the 2011 survey were retained, including stoploss coverage for self-funded plans, cost sharing for preventive care, and plan grandfathering resulting from the Affordable Care Act (ACA).
There are several variables in which missing data is calculated based on respondents’ answers to other questions (for example, when missing employer contributions to premiums is calculated from the respondent’s premium and the ratio of contributions to premiums). In 2012 the method to calculate missing premiums and contributions was revised; if a firm provides a premium for single coverage or family coverage, or a worker contribution for single coverage or family coverage, that information was used in the imputation. For example, if a firm provided a worker contribution for family coverage but no premium information, a ratio between the family premium and family contribution was imputed and then the family premium was calculated. In addition, in cases where premiums or contributions for both family and single coverage were missing, the hotdeck procedure was revised to draw all four responses from a single firm. The change in the imputation method did not make a significant impact on the premium or contribution estimates.
In 2012, the method for calculating the size of the sample was adjusted. Rather than using a combined response rate for panel and non-panel firms, separate response rates were used to calculate the number of firms to be selected in each strata. In addition, the mining stratum was collapsed into the agriculture and construction industry grouping. In sum, changes to the sampling method required more firms to be included and may have reduced the response rate in order to provide more balanced power within each strata.
To account for design effects, the statistical computing package R and the library package “survey” were used to calculate standard errors. All statistical tests are performed at the .05 level, unless otherwise noted. For figures with multiple years, statistical tests are conducted for each year against the previous year shown, unless otherwise noted. No statistical tests are conducted for years prior to 1999. In 2012 the method to test the difference between distributions across years was changed to use a Wald test which accounts for the complex survey design. In general this method was more conservative than the approach used in prior years.
In 2012, average coinsurance rates for prescription drugs, primary care office visits, specialty office visits, and emergency room visits include firms that have a minimum and/or maximum attached to the rate. In years prior to 2012 we did not ask firms the structure of their coinsurance rate. For most prescription drug tiers, and most services, the average coinsurance rate is not statically different depending on whether the plan has a minimum or maximum.
In 2012 the calculation of the response rates was adjusted to be slightly more conservative than previous years.
Starting in 2013, information on conventional plans was collected under the PPO section and therefore the covered worker weight was representative of all plan types.
Starting in 2014, we elected to estimate separate single and family coverage premiums for firms that provided premium amounts as the average cost for all covered workers, instead of differentiating between single and family coverage. This method more accurately accounted for the portion that each type of coverage contributes to the total cost for the 1 percent of covered workers who are enrolled at firms affected by this adjustment.
Several provisions of the ACA took effect on January 1, 2014 which impacted non-grandfathered plans as well as plans renewing in calendar year 2014, such as the requirement to have an out of pocket limit and a waiting period of not more than three months. As a result, firms with non-grandfathered plans that reported that they did not have out-of-pocket limits, or waiting periods exceeding three months, were contacted during our data-confirmation calls. We did not have information on the month in which a firm’s plan or plans was renewed. Many of these firms indicated that they had a plan year starting prior to January 2014, so these ACA provision were not yet in effect for these plans.
Firms with 200 or more workers were asked: “Does your firm offer health benefits for current employees through a private or corporate exchange? A private exchange is one created by a consulting firm or an insurance company, not by either a federal or state government. Private exchanges allow employees to choose from several health benefit options offered on the exchange.” Employers were still asked for plan information about their HMO, PPO, POS and HDHP/SO plan regardless of whether they purchased health benefits through a private exchange or not.
Beginning in 2014, we collected whether firms with a non-final disposition code (such as a firm that requested a callback at a later time or date) offered health benefits. By doing so we attempt to mitigate any potential non-response bias of firms either offering or not offering health benefits on the overall offer rate statistic.
To increase response rates, firms with 3-9 employees were offered an incentive of $75 in cash or as a donation to a charity of their choice to complete the full survey.
In 2015, weights were not adjusted using the nonresponse adjustment process described in previous years’ methods. As in past years, Kaiser/HRET conducted a small follow-up survey of those firms with 3 to 49 workers that refused to participate in the full survey. Based on the results of a McNemar test, we were not able to verify that the results of the follow-up survey were comparable to the results from the original survey. In 2010, the results of the McNemar test were also significant and we did not conduct a nonresponse adjustment.
The 2015 survey contains new information in several areas, including on wellness and biometric screening. In most cases, information reported in this section is not comparable with previous years’ findings. Data presented in the 2015 report reflect the firm’s benefits at the time they completed the interview. Some firms may report on a plan which took effect in the prior calendar year. Starting in 2015, firms were able to have a contribution and deductible in compliance with HSA requirements for the plan year.
Starting in 2015, employers were asked how many full-time equivalents they employed. In cases in which the number of full-time equivalents was relevant to the question, interviewer skip patterns may have depended on the number of FTEs.
In cases where a firm had multiple plans, they were asked about their strategies for containing the cost of specialty drugs for the plan with the largest enrollment.
Under the Affordable Care Act, non-grandfathered plans are required to have an out-of- pocket maximum. Non-grandfathered plans who indicated that they did not have an out of pocket maximum were asked to confirm whether their plan was grandfathered and whether that plan had an out-of-pocket maximum.
Between 2015 and 2016, we conducted a series of focus groups that led us to the conclusion that human resource and benefit managers at firms with between 20 and 49 employees think about health insurance premiums more similarly to benefit managers at smaller firms than larger firms. Therefore, starting in 2016, we altered the health insurance premium question pathway for firms with between 20-49 employees to match that of firms with 3-19 employees rather than firms with 50 or more employees. This change affected firms representing 8% of the total covered worker weight. We believe that these questions produce comparable responses and that this edit does not create a break in trend.
Starting in 2016, we made significant revisions to how the survey asks employers about their prescription drug coverage. In most cases, information reported in the Prescription Drug Benefits section is not comparable with previous years’ findings. First, in addition to the four standard tiers of drugs (generics, preferred, non-preferred, and lifestyle), we began asking firms about cost sharing for a drug tier that covers only specialty drugs. This new tier pathway in the questionnaire has an effect on the trend of the four standard tiers, since respondents to the 2015 survey might have previously categorized their specialty drug tier as one of the other four standard tiers. We did not modify the question about the number of tiers a firm’s cost-sharing structure has, but in cases in which the highest tier covered exclusively specialty drugs we reported it separately. For example, a firm with three tiers may only have copays or coinsurances for two tiers because their third tier copay or coinsurance is being reported as a specialty tier. Furthermore, in order to reduce survey burden, firms were asked about the plan attributes of only their plan type with the most enrollment. Therefore, in most cases, we no longer make comparisons between plan types. Lastly, prior to 2016, we required firms’ cost sharing tiers to be sequential, meaning that the second tier copay was higher than the first tier, the third tier was higher than the second, and the fourth was higher than the third. As drug formularies have become more intricate, many firms have minimum and maximums attached to their copays and coinsurances, leading us to believe it was no longer appropriate to assume that a firm’s cost sharing followed this sequential logic.
In cases where a firm had multiple plans, they were asked about their strategies for containing the cost of specialty drugs for the plan type with the largest enrollment. Between 2015 and 2016, we modified the series of ‘Select All That Apply’ questions regarding cost containment strategies for specialty drugs. In 2016, we elected to impute firms’ responses to these questions. We removed the option “Separate cost sharing tier for specialty drugs” and added specialty drugs as their own drug tier questionnaire pathway. We added question options on mail order drugs and prior authorization.
In 2016, we modified our questions about telemedicine to clarify that we were interested in the provision of health care services, and not merely the exchange of information, through telecommunication. We also added dependent and spousal questions to our health risk assessment question pathway.
While the Kaiser/HRET survey similar to other employer and household surveys has seen a general decrease in response rates over time, the decrease between the 2016 and 2017 response rates is not solely explained by this trend. In order to improve statistical power among sub-groups, including small firms and those with a high share of low income workers, the size of the sample was expanded from 5,732 in 2016 to 7,895 in 2017. As a result, the 2017 survey includes 204 more completes than the 2016 survey. While this generally increases the precision of estimates (for example, a reduction in the standard error for the offer rate from 2.2% to 1.8%), it has the effect of reducing the response rate. In 2017, non-panel firms had a response rate of 17%, compared to 62% for firms that had participated in one of the last two years.
To increase response rates, firms with 3-9 employees were offered an incentive for participating in the survey. A third of these firms were sent a $5 Starbucks gift card in the advance letter, a third were offered an incentive of $50 in cash or as a donation to a charity of their choice after completing the full survey, and a third of firms were offered no incentive at all. Our analysis does not show significant differences in responses to key variables among these incentive groups.
In 2017, weights were not adjusted using the nonresponse adjustment process described in previous years’ methods. As in past years, Kaiser/HRET conducted a small follow-up survey of those firms with 3-49 workers that refused to participate in the full survey. Based on the results of a McNemar test, we were not able to verify that the results of the follow-up survey were comparable to the results from the original survey. In 2010 and 2015, the results of the McNemar test were also significant and we did not conduct a nonresponse adjustment.
To reduce the length of survey, in several areas, including stoploss coverage for self-funded firms and cost sharing for hospital admissions, outpatient surgery, and emergency room visits, we revised the questionnaire to ask respondents about the attributes of their largest health plan rather than each plan type they may offer. This expands on the method we used for prescription drug coverage in 2016. Therefore, for these topics, aggregate variables represent the attributes of the firm’s largest plan type, and are not a weighted average of all of the firms plan types. In previous surveys, if a firm had two plan types, one with a copayment and one with a coinsurance for hospital admissions, the covered worker weight was allotted proportionally toward the average copayment and coinsurance based on the number of covered workers with either feature. With of this change, comparison among plans types is now a comparison of firms where any given plan type is the largest. The change only affects firms that have multiple plan types (58% of covered workers). After reviewing the responses and comparing them to prior years where we asked about each plan type, we find that the information we are receiving is similar to responses from previous years. For this reason, we will continue to report our results for these questions weighted by the number of covered workers in responding firms.
Starting in 2017, respondents were allowed to volunteer that their plans did not cover outpatient surgery or hospital admissions. Less than 1% of respondents indicated that their plan did not include coverage for these services. Cost sharing for hospital admissions, outpatient surgery and emergency room visits was imputed by drawing a firm similar in size and industry within the same plan type.
As in past years, we conducted a small follow-up survey of those firms with 3-49 workers that refused to participate in the full survey. Based on the results of a McNemar test, we were not able to verify that the results of the follow-up survey were comparable to the results from the original survey, and weights were not adjusted using the nonresponse adjustment process described in previous years’ methods. In 2010, 2015, and 2017, the results of the McNemar test were also significant and we did not conduct a nonresponse adjustment.
In light of a number of regulatory changes and policy proposals, we included new questions on the anticipated effects of the ACA’s individual mandate penalty repeal on the firm’s health benefits offerings, and the impact of the delay of the high cost plan tax, also known as the Cadillac tax, on the firm’s health benefits decisions. Also new in 2018 are questions asking about smaller firms’ use of level-funded premium plans, an alternative self-funding method with integrated stop loss coverage and a fixed monthly premium.
In 2018, we moved the battery of worker demographics questions from near the beginning of the survey to the end of the survey in an effort to improve the flow. There is no evidence that this move has impacted our survey findings and we will continue to monitor any suspected impacts.
The 2018 survey also expands on retiree health benefits questions, asking firms about cost reduction strategies, whether they contribute to the cost of coverage, and how retiree benefits are offered (e.g., through a Medicare Advantage contract, a traditional employer plan, private exchange, etc.).
Starting in 2018, we allowed respondents who did not know the combined maximum incentive or penalty an employee could receive for health screening and/or wellness and health promotion to answer a categorical question with specified ranges. This method is consistent with how we handle the percent of low-wage and high-wage workers at a firm. In 2018, 18% of respondents did not know the dollar value of the their incentive or penalty and 39% were able to estimate a range.
Starting in 2018, the survey began asking small firms who indicated that their plan was fully-insured whether the plan was level-funded. In a level-funded plan, employers make a set payment each month to an insurer or third party administrator which funds a reserve account for claims, administrative costs, and premiums for stop-loss coverage. These plans are often integrated and firms may not understand the complexities of the self-funded mechanisms underlying them. Some small employers who indicate that their plan is self-funded may also offer a plan that meets this definition. Respondents offering level funded plans were asked about any attachment points applying to enrollees. These firms were not less likely to answer this question, and including them doesn’t not substantially change the average. Prior to 2018, all firms reporting coverage as underwritten by an insurer were excluded from the stop-loss calculations.
The response option choices for the type of incentive or penalty for completing biometric screening or a health risk assessment changed from 2017 to 2018.
Starting in 2019, we discontinued a weighting adjustment informed by a follow-back survey of firms with 3-49 workers that refused to participate in the full survey. This adjustment was intended to reduce non-response bias in the offer rate statistic, under the assumption that firms that did not complete the survey were less likely to offer health benefits. The adjustment involves comparing the distribution of offering to non-offering firms in the full survey and the follow-back sample in the three smallest size categories (3-9, 10-24, 25-49). The adjustment is based on the differences between the two groups of firms and generally operates to adjust the weights of offering firms and non-offering firms to bring the counts closer together. However, if the distributions of the two groups differ to a statistically significant extent, we consider the follow-back survey to be a different population from the full survey and do not make any adjustment to the weights.
Although we cannot be sure of the reason, we are no longer witnessing the systematic upward bias on estimates for the offer rates of small firms that gave rise to the adjustment. Looking at the decade from 2010 to 2019, offer rates among firms responding to the follow-up survey have been higher for five of ten surveys. Firms with 3-49 employees responding to this follow-up survey have reported a higher offer rate than the full EHBS survey during the 2014, 2016, 2017, 2018, and 2019 surveys. An alternative way to measure non-response bias is to compare estimates throughout the fielding period.
In 2019, the percent of firms offering health benefit was similar in the last month of fielding to offer rates throughout the entire fielding period. Changes in both the survey methodology and the health insurance market have led us to become increasingly cautious about assuming that the follow back survey is a suitable proxy for the true population. Since 2014, we have collected offer rate information from firms before a final disposition is assigned. This method was introduced to reduce a bias in which firms who offer health benefits face a longer average survey than non-offering firms. This had the effect of increasing the percentage of firms for whom contact was made from whom we collected offer rate information. Additionally, we have also attempted to reduce non-response bias by increasing our data collection.
Recent changes in the marketplace also raise some concerns about the validity of the follow-back survey to be the basis for a weight adjustment. We have in recent years seen an increase in non-offering firms reporting that they are providing funds to employees to purchase non-group health insurance. We do not consider this to be an offer of health insurance by the firm, but we are concerned that the person who responds to the follow-back survey may not be able to make that distinction. The follow-back survey is a very simple set of questions asked to whoever answers the phone at a firm that refused to participate in the survey. In contrast, during the full-survey, we attempt to talk to the person most knowledgeable about health benefits, and the interviewers are trained to distinguish between types of benefit programs.
For 2019, making the weight adjustment would change offer rate statistic for all firms from 57% to 60%. Neither estimate is different than the 57% we reported last year (when the weight adjustment was not made because the statistical test indicated that the follow-back group was significantly different than the full survey group).
Starting in 2019, all presented calculations of out-of-pocket maximums strictly relied on an arithmetic average across all plans weighted by covered worker plan enrollment. In prior surveys, some figures (for example Figures 7.43, 7.45, and 7.46 in the 2018 report) were calculated based on the out-of-pocket maximum of the largest plan. This change did not meaningfully change any findings and ensured consistency within the out-of-pocket maximum section of the Employee Cost Sharing section.
For prescription drug coverage, similar to years past, if the firm reports that the worker pays the full cost for drugs on a particular tier and/or that the plan only offers access to a discount program, we do not consider this as offering covering for that drug tier. Starting this year, firms with multiple tiers that cover exclusively specialty drugs, were asked about the cost-sharing of the tier that is used most often. Cost-sharing for prescription drugs does not typically include mail order. Hospital, outpatient surgery and prescription drug cost-sharing was only asked of a firm’s largest plan type.
For 2019, we clarified the question that we use to ask firms whether or not they provide retiree health benefits; particularly, we added language that explicitly stated that firms that had terminated retiree health benefits but still has some retirees currently getting coverage, or that had current employees who will get retiree health coverage in the future, should answer yes to the question. We made this clarification in response to a large decline in the 2018 survey in the prevalence of retiree coverage (from 25% in 2017 to 18% in 2018). In the 2018 survey, we expressed concern that the then current public focus on public entities eliminating retiree benefits for future (not existing) retirees may be influencing the responses we were getting and said that we were going to add clarifying language to the survey question in future years.
For 2019, two open-ended questions were added to the survey in order to examine employer responses to the opioid crisis and obstacles preventing firms from adopting narrow network health plans. All responses to these questions were reviewed in a consistent manner by KFF staff to determine whether they could be recoded as an earlier multiple choice item, or if they could be sorted into new categories.
To increase participation in the final two weeks of the survey, a financial incentive was offered to firms with 3-9 employees, but only 6 firms that completed the survey within that time period qualified for the incentive. All respondents received a printed copy of the survey findings.
2020 was a challenging year both in administering the survey, as well as for many of our respondents who were scrambling to respond to the pandemic and the ensuing economic downturn. Our questionnaire was developed before the extent of the pandemic became apparent and the fielding period included response from both before and after. We asked respondents about their plans at the time of the interview, with approximately half of the responses (composing 50% of the covered worker weight) collected between January and March. The remaining interviews were completed before the middle of July. The survey is designed to track changes in benefit and cost between years and is not well suited to answer many of the important questions that emerged this year for a couple of reasons. Firstly, employers make decisions about their plans before the plan year begins. Premiums for self-funded employers are usually reported as the cost for a former worker to enroll in COBRA (deflated by an administrative fee) and do not reflect real-time spending. Many other plan features, including provider networks and cost-sharing, are set before a plan’s open enrollment period. We expect to learn more about how changes in benefits and utilization affected cost in the 2021 survey. Secondly, the month in which a respondent completes the survey is not random, the data collection firm completes interviews with larger panel firms first. We do not believe that these firms are similar to the non-panel firms that complete the survey later in the year. We believe these firms differ in ways which are not corrected for by weighting, which means we cannot look at how responses changed over the period to detect patterns of change. Thirdly, our sample is not sufficient to make many comparisons across fielding period. We plan to ask employers about changes to their plans and the impact of COVID-19 on their decision making in the 2021 survey.
In the summer of 2019, National Research LLC, which had conducted the Employer Health Benefit Survey since its inception, ceased operation. We engaged in a search to identify a new firm to conduct the 2020 survey and selected Davis Research LLC, based on their extensive experience in research on firms and establishments. While we believe that the sampling methodology, questionnaire and survey procedures were consistent between years, readers are strongly encouraged to consider “total survey error” when drawing conclusions about differences between statistics. Survey-adjusted standard errors (and statistical testing) measure uncertainty in estimates based on the sampling strategy, but do not measure biases that may be introduced through the data collection process such as interviewer or house effects. House effects refer to the impact of a data collection firm’s management and workflow processes on final statistics. We do not know how, or if at all, changing the data collection firm from National Research to Davis impacted estimates. Empirical studies of house effects vary greatly, with some reporting almost no impact and others observing significant differences in point estimates.
In order to minimize house effect impacts, we conducted extensive interview training with managers and interviewers at Davis, including sessions lead by interviewers with prior experience on the project. In addition, KFF pretested and observed interviews to verify that Davis’ quality assurance process was consistent with our understanding of how the survey had been conducted historically.
Starting in 2020, we limited the number of margins used to calibrate weights and adjust for non-response. Until 2019, our weighting procedure incorporated offer status, firm size, geographic region, and metropolitan status to adjust for unit nonresponse. Our 2020 weighting algorithm no longer relies on metropolitan vs. non-metropolitan as part of the non-response calculation. Separately, earlier surveys post-stratified each firm’s set of weights to industry, firm size, census division, and panel versus non-panel margins. Starting in 2020, we reduced this weight calibration to only industry and firm size controls. Finally, we collapsed industries in our 5,000+ employee firm size category, owing to the fact that many large businesses operate across multiple industries. All three of these changes were prompted by an increase in the number of calibration cells with low sample, which can result in individual firms with highly influential weights if not revised. Without this revision, some 2020 statistics would had been driven by a small number of firms with overly influential weights. Reducing the number of variables in these improves the stability of some published estimates. This issue arose in part due to the smaller number of completed interviews in 2020 relative to 2019.
Historically we measured the annual changes in workers’ wages and in inflation by comparing the values for April of the previous year and April of the current year. This year the labor market underwent significant disruptions in March and April as employers laid off and furloughed large numbers of workers in response to the COVID-19 pandemic. A relatively high share of lower-wage workers were furloughed and laid off during these months, resulting in a high change in wages as measured from April to April. In response to this unprecedented change in the labor market, we have elected to change how we calculate workers wages and inflation. Beginning with our 2020 publication, we are now calculating the change in workers wages and inflation based on an average of the first quarter of each year. Using this method, workers wages increased 3.4% compared to 7.7% between April and April. And similarly inflation increased 2.1% compared to 0.3%. Prior to 2020, both methods produced very similar estimates.
This year we made several changes to the survey questionnaire in order to reduce the length and burden of the survey; rather than asking benefit managers about the characteristics of up to four plan types, we asked for the premiums and deductibles of the largest two plan types and other cost information for only the largest. We now only ask about cost-sharing for prescription drugs, hospitalizations, outpatient surgery and office visits for the plan type with the most enrollment. This change mostly impacts the largest firms which are more likely to sponsor multiple plan types. As in prior years, if a firm sponsors multiple plans, of the same plan type, for example, several PPOs across the country, we ask about only the one with the most enrollment. In 2021, 13% of respondents offered three or more plan types – in total the largest plan type accounts for 82% of workers covered by health benefits and the largest two plan types represents 98%. For this reason, this change will only have a minimal impact on most estimates. Furthermore, in prior years we observed no systematic bias in key metrics across the plan type rank at each firm. For example, in 2020, among firms with three or more plan types, the third-largest plan had statistically similar premiums and deductibles to the larger plan types on average. This change did not require a change in how many of the the all firm variables are calculated. To determine the all plan value for categorical variables describing plans, we continue to use the largest type as a proxy. To do so, we identify the plan type that has the largest enrollment within the observation and use data from that plan as a proxy for the all-plan aggregate for that firm. For example, in previous years, we would ask an employer whether their HMO, PPO, POS and HDHP/SO were self-funded, and then report the response from largest plan type as the all firm response.
For the first time, a subset of employers were invited to complete the survey online, though in total 99% of the interviews were completed through computer-assisted telephone interviewing.
In 2022, we incorporated the California Employer Health Benefits Survey (CHBS) from the California Health Care Foundation (CHCF) into EHBS by oversampling firms with any presence in California and including new questions into the main EHBS instrument to determine firms with any employment in the state of California. Unlike other years, the 2022 EHBS used as its panel both respondents to either of the prior two years of EHBS (2020 and 2021) and also respondents to either of the prior two years of CHBS (2018 and 2020). Since many larger firms operate across state lines, the integration of CHBS with EHBS aimed to reduce survey burden among firms that had previously responded to both surveys. Among the N=1,140 large firms responding to the 2022 EHBS, 419 of those responding firms (37%) had any presence in California, highlighting the overlap across these two projects. Given the size of the California oversample needed to assure statistical reliability both nationally and within California, firm weights were calibrated to California-specific targets from the SUSB.
In 2022, Davis extended computer assisted web interview (CAWI) capacity, offering most respondents the opportunity to complete the survey using an online questionnaire rather a telephone interview. Although only 1% of respondents used this survey mode during the initial 2021 attempt, 43% of 2022 survey respondents answered EHBS via CAWI.
Survey mode did not impact the survey results in a systematic or obvious manner. The effects of mode and firm size on major firm characteristics such as annual premiums, contributions, and deductibles was modeled using standard linear regression. For certain plan types, survey implementation through telephone interview had a negative effect on the reported value. However, the plan types affected were random, so this effect is more likely due to confounding variables. When examining demographic characteristics between the two modes, there were small differences in the distribution of categorical variables such as region and age. However, without multiple years of data utilizing the two modes, it is impossible to determine if these are systematic biases. The imputation rate between the two modes was almost identical.
The 2023 survey features questions which have not been asked for several years including questions on spousal benefits, voluntary benefits, such as dental and vision coverage, waiting periods and emergency room cost-sharing. In addition, the survey includes new questions, on abortion coverage, prior authorization, coverage limits and coverage for gender-affirming care.
In 2022, the Employer Health Benefit Survey over-sampled California based firms in order to provide estimates for the California Health Care Foundation’s Health Benefit Survey. For more information please see: https://www.chcf.org/publication/2023-edition-california-employer-health-benefits/. As a result, both our weighting and sampling in 2022 took into account whether a firm was located in California. In 2023, we sampled non-panel firms based on whether they were located in California. Our 2023 sampling method is similar to the methods used prior to 2022, and is based on a firms size and industry.
As in previous years, modification were made to existing survey questions, both to improve clarity or respond to changes in the marketplace. Starting in 2023, respondents are able to provider either monthly or annual HSA contribution amounts. The interview notes for the question on level-funding was editing to clarify that employing a third-party administrator does not necessarily mean a plan is level-funded. The question on whether a firm or plan gives workers the opportunity to complete biometeric screening was edited to include take-home kits, which collect biometetric data, not just in-person exams. The distribution of cost-sharing for hospital admission and outpatient surgery was edited, to make the categories “copay”, “coninsurance”, and “both copay and coinsurance”, mutually exclusive. The both category may include covered workers who face either both cost-sharing requirements or which ever is greater. Based on interview debriefs, we elected not to report the share of employers who believe that telehealth will be important for enrollees in remote settings. We continue to revise our data cleaning and editing procedures.
HDHP/SO includes high-deductible health plans with a deductible of at least $1,000 for single coverage and $2,000 for family coverage and that offer either a Health Reimbursement Arrangement (HRA) or a Health Savings Account (HSA). Although HRAs can be offered along with a health plan that is not an HDHP, the survey collected information only on HRAs that are offered along with HDHPs. For specific definitions of HDHPs, HRAs, and HSAs, see the introduction to Section 8.↩︎
Response rate estimates are calculated by dividing the number of completes over the number of refusals and the fraction of the firms with unknown eligibility to participate estimated to be eligible. Firms determined to be ineligible to complete the survey are not included in the response rate calculation.↩︎
Estimates presented in [Figure 2.1], [Figure 2.2], [Figure 2.3], [Figure 2.4], [Figure 2.5], and [Figure 2.6] are based on the sample of both firms that completed the entire survey and those that answered just one question about whether they offer health benefits.↩︎
Seidenberg, Andrew B, Richard P Moser, and Brady T West. 2023. “Preferred Reporting Items for Complex Sample Survey Analysis (PRICSSA).” Journal of Survey Statistics and Methodology 11 (4): 743–57. https://doi.org/10.1093/jssam/smac040.↩︎
Report
Section 1: Cost of Health Insurance
The average annual health insurance premiums in 2024 are $8,951 for single coverage and $25,572 for family coverage. The average single coverage premium increased 6% in 2024 while the average family premium increased 7%. The average family premium has increased 24% since 2019 and 52% since 2014.
The average premium for single coverage in 2024 is $8,951 per year. The average premium for family coverage is $25,572 per year [Figure 1.1].
The average annual premiums for single coverage are similar for covered workers at small firms ($9,131) and at large firms ($8,884) [Figure 1.3].
The average annual premiums for family coverage are similar for covered workers at small firms ($25,167) and at large firms ($25,719) [Figure 1.3].
The average annual premiums for covered workers in HDHP/SOs are lower than the average premiums for coverage overall for both single coverage ($8,275 vs. $8,951) and family coverage ($24,196 vs. $25,572). The average premiums for covered workers in PPOs are higher than the overall average premiums for both single coverage ($9,383 vs. $8,951) and family coverage ($26,678 vs. $25,572) [Figure 1.1].
The average premium for covered workers with both single and family coverage is relatively higher in the Northeast and relatively lower in the South [Figure 1.4].
The average premiums for covered workers at firms with a relatively large share of older workers (firms where at least 35% of the workers are age 50 or older) are higher than the average premium for covered workers at firms with smaller shares of older workers for single coverage ($9,171 vs. $8,738) [Figure 1.6].
The average premiums for single coverage and family coverage are lower for covered workers at private for-profit firms and higher for covered workers at private not-for profit firms [Figure 1.6] and [Figure 1.7].
Figure 1.1: Average Annual Premiums for Covered Workers, Single and Family Coverage, by Plan Type, 2024
Figure 1.2: Average Annual Premiums for Covered Workers, Single and Family Coverage, by Firm Size, 2024
Figure 1.3: Average Monthly and Annual Premiums for Covered Workers, by Plan Type and Firm Size, 2024
Figure 1.4: Average Monthly and Annual Premiums for Covered Workers, by Plan Type and Region, 2024
Figure 1.5: Average Monthly and Annual Premiums for Covered Workers, by Plan Type and Industry, 2024
Figure 1.6: Average Annual Premiums for Covered Workers With Single Coverage, by Firm Characteristics, 2024
Figure 1.7: Average Annual Premiums for Covered Workers With Family Coverage, by Firm Characteristics, 2024
Figure 1.8: Average Annual Premiums for Covered Workers, by Firm Characteristics and Firm Size, 2024
PREMIUM DISTRIBUTION
There is considerable variation in premiums for both single and family coverage.
Fifteen percent of covered workers are employed at a firm where the single coverage premium is at least 20% higher than the average single premium, while 19% of covered workers are at firms with a single premium less than 80% of the average single premium [Figure 1.9].
For family coverage, 17% of covered workers are employed at a firm with a family premium at least 20% higher than the average family premium, while 20% of covered workers are at firms with a family premium less than 80% of the average family premium [Figure 1.9].
Seven percent of covered workers are at a firm with an average annual premium of at least $12,500 for single coverage [Figure 1.10]. Ten percent of covered workers are at a firm with an average annual premium of at least $33,000 for family coverage [Figure 1.11].
Figure 1.9: Distribution of Annual Premiums for Single and Family Coverage Relative to the Average Annual Single or Family Premium, 2024
Figure 1.10: Distribution of Annual Premiums for Covered Workers With Single Coverage, 2024
Figure 1.11: Distribution of Annual Premiums for Covered Workers With Family Coverage, 2024
PREMIUM CHANGES OVER TIME
The average premiums for covered workers for single and family coverage increased 6% and 7% respectively from last year [Figure 1.12].
The average premium for single coverage has grown 25% in the past five years [Figure 1.12].
The $25,572 average family premium in 2024 is 24% higher than the average family premium in 2019 and 52% higher than the average family premium in 2014. The 24% family premium growth in the past five years is similar to the 22% growth between 2014 and 2019 [Figure 1.15].
The average family premiums for covered workers at small firms and at large firms have grown at similar rates since 2019 (24% at small firms and 24% at large firms). For small firms, the average family premium rose from $20,236 in 2019 to $25,167 in 2024. For large firms, the average family premium rose from $20,717 in 2019 to $25,719 in 2024 [Figure 1.13].
The average family premiums have grown at similar rates since 2014 for covered workers at small firms and at large firms (59% at small firms and 49% at large firms). At small firms, the average family premium rose from $15,849 in 2014 to $25,167 in 2024. In large firms, the average family premium rose from $17,265 in 2014 to $25,719 in 2024 [Figure 1.13].
Over the past five years, the average family premium for covered workers at large firms that are fully insured has grown at a similar rate to the average family premium for covered workers in fully or partially self-funded plan (26% for fully insured plans and 24% for self-funded firms) [Figure 1.14].
The average family premium grew 7% in 2024 while the rate of inflation was (3.2%). Over the last 5 years, family premiums grew 24%, similar to the rate of inflation during this period (23%). Over the last ten years, the growth in the average premium for family coverage far outpaced inflation (52% vs. 32%) [Figure 1.15].
The average family premium grew 7% in 2024 while wages grew 4.5%. Over the last 5 years, family premiums grew 24%, similar to the 28% growth in wages. Over the last ten years, the average family premium and average wages grew at roughly comparable rates (52% vs. 45%) [Figure 1.15].
Figure 1.12: Average Annual Premiums for Single and Family Coverage, 1999-2024
Figure 1.13: Average Annual Premiums for Covered Workers With Family Coverage, by Firm Size, 1999-2024
Figure 1.14: Among Workers in Large Firms, Average Annual Premiums for Family Coverage, by Funding Arrangement, 1999-2024
Figure 1.15: Cumulative Premium Increases, Inflation, and Earnings for Covered Workers With Family Coverage, 2004-2024
Section 2: Health Benefits Offer Rates
Nearly all (98%) firms with 200 or more workers offer health benefits to at least some workers, while just around one-half (53%) of smaller firms do so. The percentage of all firms offering health benefits in 2024 (54%) is similar to both the percentage of firms offering health benefits last year (53%), and five years ago (57%).
Most firms are very small, so the considerable fluctuation we see across years in the small firm offer rate drives fluctuations in the overall offer rate. However, most workers work for larger firms, where offer rates are high and much more stable. Over ninety percent (93%) of firms with 50 or more workers offer health benefits in 2024; this percentage has remained consistent over the last 10 years. Overall, 89% of workers at firms with 3 or more workers are employed at a firm that offers health benefits to at least some of its workers. Almost all (90%) firms that offer health benefits offer both single and family coverage.
Small firms not offering health benefits say the most important reasons they do not offer coverage are that “the firm is too small” or that “the cost of insurance is too high”.
FIRM OFFER RATES
In 2024, 54% of firms offer health benefits, similar to the percentage last year (53%) [Figure 2.1].
The smallest firms are least likely to offer health insurance: 46% of firms with 3-9 workers offer coverage, compared to 56% of firms with 10-24 workers, 68% of firms with 25-49 workers, and 92% of firms with 50-199 workers [Figure 2.3].
Since most firms in the country are small, variation in the overall offer rate is driven largely by changes in the offer rates of the smallest firms (3-9 workers) offering health benefits. For more information on the distribution of firms in the country, see the Survey Design and Methods Section and [Figure M.5].
Only 51% of firms with 3-49 workers offer health benefits to at least some of their workers, compared to 93% of firms with 50 or more workers [Figure 2.5].
Because most workers are employed by larger firms, most workers work at a firm that offers health benefits to at least some of its employees. Eighty-nine percent of all workers are employed by a firm that offers health benefits to at least some of its workers [Figure 2.6].
Figure 2.1: Percentage of Firms Offering Health Benefits, 1999-2024
Figure 2.2: Percentage of Firms Offering Health Benefits, by Firm Size, 1999-2024
Figure 2.3: Percentage of Firms Offering Health Benefits, by Firm Size, Region, and Industry, 2024
Figure 2.4: Percentage of Firms and Workers Offering Health Benefits,
Figure 2.5: Percentage of Firms Offering Health Benefits to at Least Some of Their Workers, by Firm Size, 2024
Figure 2.6: Percentage of Workers at Firms That Offer Health Benefits to at Least Some Workers, by Firm Size, 1999-2024
OFFERS TO SPOUSES AND DEPENDENTS
Almost all firms offering health benefits offer family coverage; in 2024, nearly all large firms and 90% of smaller firms offer family coverage [Figure 2.7].
The vast majority of firms with 10 or more workers offering health benefits offer to spouses and dependents, such as children. Ninety-six percent of firms with 10 to 199 workers and 99% of larger firms offering health benefits offer coverage to spouses. These percentages are similar to the percentages in 2023 [Figure 2.8].
Ninety-five percent of firms with 10 to 199 workers and 100% of larger firms offering health benefits offer coverage to dependents other that spouses, such as children. These percentages are similar to the percentages in 2023 [Figure 2.8].
Four percent of firms with 10 to 199 workers offering health benefits offer only single coverage to their workers, similar to the percentage (5%) last year [Figure 2.8].
Even when family coverage is offered, some workers may elect to enroll in self-only coverage, either because they do not have eligible dependents, or their family members have other coverage options. Among firms with 10 to 199 workers who offer coverage to dependents, 35% of firms report that more than three-quarters of their covered workers enroll in self-only coverage, compared to 23% at larger firms. Among firms offering health benefits to dependents with 5,000 or more workers, 9% of firms report that more than three-quarters of their covered workers enroll in self-only coverage [Figure 2.9].
Figure 2.7: Percentage of Firms Offering Health Benefits Which Offer Family Coverage, by Firm Size, 2024
Figure 2.8: Percentage That Offer to Spouses and Dependents, by Firm Size, 2024
Figure 2.9: Percentage of Covered Workers Enrolled in Self-Only Coverage, by Firm Size, 2024
PROVISIONS TO ENCOURAGE ENROLLMENT IN OTHER COVERAGE
Some firms have provisions to encourage workers or their spouses forgo enrolling in coverage or to choose other coverage when it is available.
Among firms with 10 or more workers offering coverage, 11% provide additional compensation or benefits to workers if they choose not to enroll in the firm’s health plan and 9% provide additional compensation or benefits to workers who choose to enroll in a spouses health plan [Figure 2.10].
Among firms with 200 or more workers offering coverage to spouses, 10% do not allow the spouse to enroll if they are offered health insurance from another source, 13% place conditions on spouses wishing to enroll, such as limiting plan choice, or requiring a surcharge for enrolling spouses if they are offered coverage from another source [Figure 2.12]. Among firms with 200 or more workers offering coverage to spouses, 8% require a surcharge for spouses who are offered coverage from another source. In total, 24% of firms with 200 or more workers offering coverage to spouses place a restriction on eligibility or require a surcharge for spouses who have an offer from another source [Figure 2.12].
Figure 2.10: Percentage of Firms That Provide Workers Additional Incentives for Various Enrollment Decisions, by Firm Size, 2024
Figure 2.11: Percent of Firms Offering Spousal Coverage Which Restrict Spouses’ Eligibility If They Have an Offer From Another Source, by Firm Size, 2024
Figure 2.12: Among Large Firms That Offer Spousal Coverage, Spouses’ Eligibility If They Have an Offer From Another Source, by Firm Size, 2024
PART-TIME WORKERS
Among firms offering health benefits, relatively few offer benefits to part-time workers.
The Affordable Care Act (ACA) defines “full-time” workers as those who work an average of at least 30 hours per week, and “part-time” workers as those who work fewer than 30 hours. The employer shared responsibility provision of the ACA requires that firms with at least 50 full-time equivalent employees offer most of their full-time employees coverage that meets minimum standards or be assessed a penalty.10
Beginning in 2015, we modified the survey to explicitly ask employers whether they offered benefits to employees working fewer than 30 hours per week. The question did not previously include a definition of “part-time.” For this reason, historical data on part-time offer rates are shown, but we did not test whether the differences between 2014 and 2015 were significant. Many employers use multiple definitions of “part-time” – one for compliance with legal requirements, and another for internal policies and programs.
Twenty-six percent of large firms that offer health benefits in 2024 offer health benefits to part-time workers, the same percentage that did so in 2023 [Figure 2.13]. The share of large firms offering health benefits to part-time workers increases with firm size [Figure 2.14].
Many firms offer voluntary benefits to their workers, separate from coverage provided through their health plans. These plans can help with costs that are not covered by the health plan, or provide additional financial assistance if an enrollee is hospitalized or for specialized services such as telehealth. Employers might contribute toward the cost of these benefits, or employees might pay the entire cost. Some employers extend coverage of voluntary benefits to part-time workers who are not enrolled in the firm’s health plans. In 2024, 3% of small firms and 14% of large firms not offering coverage to part-time workers offered them a voluntary benefit [Figure 2.15].
Figure 2.13: Among Firms Offering Health Benefits, Percentage That Offer to Part-Time Workers, by Firm Size, 1999-2024
Figure 2.14: Among Firms Offering Health Benefits, Percentage That Offer to Part-Time Workers, by Firm Size, 2024
Figure 2.15: Among Firms Not Offering Health Benefits to Part-Time Workers, Percentage That Offer Voluntary Benefits to Part-Time Workers, by Firm Size, 2024
ICHRA AND ASSISTING EMPLOYEES WITH PURCHASING COVERAGE IN THE NON-GROUP MARKET
Some employers provide funds to some or all of their employees to help them purchase coverage in the individual (“non-group”) market. Employers that do not otherwise offer health benefits may offer these funds as an alternative to offering a group plan. Additionally, employers that offer a group plan to some employees may use this approach for other types or classes of workers, such as part-time employees. One way an employer can provide tax-preferred assistance for employees to purchase non-group coverage is through an Individual Coverage Health Reimbursement Arrangement, or ICHRA. Both employers that offer and those that do not offer health benefits were asked if they provide funds to any employee to purchase non-group coverage.
Four percent of firms offering health benefits, and 7% of firms not offering health benefits, offered funds to one or more of their employees to purchase non-group coverage in 2024 [Figure 2.16].
Among small firms not offering health benefits, 7% offered funds to one or more of their employees to purchase non-group coverage, a similar percentage (12%) as last year [Figure 2.18].
Among firms offering health benefits that do not offer funds to any employees to purchase non-group coverage in 2024, 3% say they are “very likely” and an additional 6% are “somewhat likely” to offer an ICHRA to at least some employees in the next two years [Figure 2.17]. Among small firms not offering health benefits that do not offer funds to any employees to purchase non-group coverage in 2024, only 5% say they are “very likely” and an additional 15% say they are “somewhat likely” to offer an ICHRA to at least some employees in the next two years [Figure 2.19].
Figure 2.16: Among Firms Offering Health Benefits, Percentage of Firms That Provide Workers Funds to Purchase Non-Group Insurance, Such As Through an ICHRA, by Firm Size, 2024
Figure 2.17: Among Firms Offering Health Benefits, How Likely Is Firm to Offer an ICHRA in the Next Two Years, by Firm Size, 2024
Figure 2.18: Among Small Firms Not Offering Health Benefits, Percentage of Firms That Provide Workers Funds to Purchase Non-Group Insurance, 2012-2024
Figure 2.19: Among Small Firms Not Offering Health Benefits, How Likely Is Firm to Offer an ICHRA in the Next Two Years, by Firm Size, 2024
FIRMS NOT OFFERING HEALTH BENEFITS
The survey asks firms that do not offer health benefits several questions, including whether they have offered insurance or shopped for insurance in the recent past, what their most important reasons for not offering coverage are, and their opinion on whether their employees would prefer an increase in wages or health insurance if additional funds were available to increase their compensation. Because such a small percentage of large firms report not offering health benefits, we present responses for small non-offering firms only.
The “firm is too small” and the “cost of insurance is too high” are the most common reasons small firms cite for not offering health benefits. Among small firms asked about the most important reason for not offering health benefits, 28% say the “firm is too small,” 27% say the cost of insurance is too high, 19% say their “employees are covered under another plan, including coverage on a spouse’s plan” and 6% say their “employees are not interested.” A small share (3%) of small firms indicate that they do not offer health benefits because they believe employees will get a better deal on the health insurance exchanges [Figure 2.20].
Some small non-offering firms have either offered health insurance in the past five years or shopped for health insurance in the past year.
Ten percent of small non-offering firms have offered health benefits in the past five years, similar to the percentage reported last year [Figure 2.21]. Among these small non-offering firms, 35% stopped offering coverage within the past year.
Fourteen percent of small non-offering firms have shopped for coverage in the past year, the same as the percentage last year (13%) [Figure 2.21].
Eighty percent of small firms not offering health benefits agreed with the statement that their employees would prefer a two dollar per hour increase in wages rather than health insurance [Figure 2.22].
Figure 2.20: Among Small Firms Not Offering Health Benefits, Most Important Reason for Not Offering, 2024
Figure 2.21: Among Small Firms Not Offering Health Benefits, Percentage of Firms That Report the Following Actions, 2009-2024
Figure 2.22: Among Small Firms Not Offering Health Benefits, Firms’ View of Employees’ Preference for Higher Wages or Health Insurance Benefits, 2008-2024
Section 3: Employee Coverage, Eligibility, and Participation
Employers are the principal source of health insurance in the United States, providing health benefits for 154 million nonelderly people.11 Most workers are offered health coverage at work, and most of the workers who are offered coverage take it. Workers may not be covered by their own employer for several reasons: their employer may not offer coverage, they may not be eligible for the benefits offered by their firm, they may elect to receive coverage from another source (such as through their spouse’s employer), or they may just refuse the offer of coverage from their firm. In 2024, 61% of workers in firms offering health benefits are covered by their own firm, similar to the percentages last year, five years ago, and ten years ago.
ELIGIBILITY
Some workers employed at firms that offer health benefits may not be eligible to participate. Many firms, for example, do not offer coverage to part-time or temporary workers12. Among workers in firms offering health benefits in 2024, 81% are eligible to enroll in the benefits offered by their firm, similar to the percentages last year, five years ago, and ten years ago [Figure 3.1].
Eligibility varies considerably with firm wage level. Workers in firms with a relatively large share of lower-wage workers (where at least 35% of workers earn $35,000 a year or less) have a lower average eligibility rate than workers in firms with a smaller share of lower-wage workers (71% vs. 83%) [Figure 3.6].
Workers in firms with a relatively large share of higher-wage workers (where at least 35% earn $77,000 or more annually) have a higher average eligibility rate than workers in firms with a smaller share of higher-wage workers (87% vs. 77%) [Figure 3.6].
Eligibility also varies by the age of the workforce within firms. Those in firms with a relatively small share of younger workers (where fewer than 35% of the workers are age 26 or younger) have a higher average eligibility rate than those in firms with a larger share of younger workers (84% vs. 61%). Those in firms with a relatively large share of older workers (where more than 35% of the workers are age 50 or older) have a higher average eligibility rate than those in firms with a smaller share of older workers (84% vs. 78%) [Figure 3.6].
Eligibility rates vary considerably for workers in different industries. The average eligibility rate remains particularly low for workers in retail firms (57%) [Figure 3.3].
Figure 3.1: Eligibility, Take-Up, and Coverage Rates for Workers in Firms Offering Health Benefits, by Firm Size, 1999-2024
Figure 3.2: Eligibility and Coverage Rates for Workers in Firms Offering Health Benefits, 1999-2024
Figure 3.3: Eligibility, Take-Up, and Coverage Rates in Firms Offering Health Benefits, by Firm Size, Region, and Industry, 2024
Figure 3.4: Eligibility, Take-Up, and Coverage Rates in Firms Offering Health Benefits, by Firm Size, 2024
Figure 3.5: Among Workers at Small Firms, Eligibility for Workers at Their Own Firms, 1999-2024
Figure 3.6: Among Workers in Firms Offering Health Benefits, Percentage of Workers Eligible for Health Benefits Offered by Their Firm, by Firm Characteristics, 2024
TAKE-UP RATE
On average, 75% of eligible workers take up coverage when it is offered to them, similar to the percentage last year [Figure 3.7].
Eligible workers in small firms have a lower average take up rate than those in larger firms (72% vs. 77%) [Figure 3.8].
Eligible workers in firms with a relatively large share of higher-wage workers have a higher average take up rate than those in firms with a smaller share of higher-wage workers (80% vs. 72%) [Figure 3.7].
Eligible workers in private, for-profit firms have a lower average take up rate (72%) and eligible workers in public firms have a higher average take up rate (86%) than workers in other firm types [Figure 3.7].
Eligible workers in firms with some union workers have a higher average take up rate (81%) than eligible workers in firms with no union workers (72%) [Figure 3.7].
The average percentages of eligible workers taking up benefits in offering firms also varies across industries [Figure 3.3].
The share of eligible workers taking up benefits in offering firms (75%) is similar to the share in 2019 (76%) but lower than the share in 2014 (80%) [Figure 3.1].
Figure 3.7: Among Workers in Firms Offering Health Benefits, Percentage of Eligible Workers Who Take Up Health Benefits Offered by Their Firm, by Firm Characteristics, 2024
Figure 3.8: Among Workers in Firms Offering Health Benefits, Percentage of Eligible Workers Who Take Up Health Benefits Offered by Their Firm, by Firm Size, 1999-2024
COVERAGE
In 2024, the percentage of workers at firms offering health benefits covered by their firm’s health plan is 61%, similar to the percentage last year [Figure 3.10].
The coverage rate at firms offering health benefits is similar for small firms and large firms in 2024. These rates are similar to the rates last year for both small firms and large firms [Figure 3.1].
There is significant variation by industry in the coverage rate among workers in firms offering health benefits. The average coverage rate is particularly low in the retail industry (37%) [Figure 3.3].
The coverage rate also varies with firm wage levels. Among workers in firms offering health benefits, those in firms with a relatively large share of lower-wage workers are less likely to be covered by their own firm than workers in firms with a smaller share of lower-wage workers (50% vs. 64%). A similar pattern exists in firms with a relatively large share of higher-wage workers, with workers in these firms being more likely to be covered by their employer’s health benefits than those in firms with a smaller share of higher-wage workers (70% vs. 55%) [Figure 3.9].
The age distribution of workers is also related to variation in coverage rates. Among workers in firms offering health benefits, those in firms with a relatively small share of younger workers are more likely to be covered by their own firm than those in firms with a larger share of younger workers (64% vs. 44%). Similarly, workers in offering firms with a relatively large share of older workers are more likely to be covered by their own firm than those in firms with a smaller share of older workers (65% vs. 58%) [Figure 3.9].
Among workers in firms offering health benefits, those employed at a firm with some union workers are more likely than workers in firms without union workers to be covered by their own firm [Figure 3.9].
Among workers in firms offering health benefits, those working in public firms are more likely than workers in other firm types to be covered by their own firm [Figure 3.9].
Among workers in all firms, including those that offer and those that do not offer health benefits, 54% are covered by health benefits offered by their employer, similar to the percentages last year (53%), five years ago (55%), and ten years ago (55%) [Figure 3.10].
Figure 3.9: Among Workers in Firms Offering Health Benefits, Percentage of Workers Covered by Health Benefits Offered by Their Firm, by Firm Characteristics, 2024
Figure 3.10: Percentage of Workers Covered by Their Firm’s Health Benefits, 1999-2024
Figure 3.11: Percentage of All Workers Covered by Their Firm’s Health Benefits, Both in Firms Offering and Not Offering Health Benefits, by Firm Size, 1999-2024
See Section 2 for part-time and temporary worker offer rates.↩︎
Section 4: Types of Plans Offered
Most firms (76%) that offer health benefits offer only one type of health plan. Large firms (200 or more workers) are more likely than small firms (3-199 workers) to offer more than one plan type.
NUMBER OF PLAN TYPES OFFERED
Seventy-six percent of firms offering health benefits offer only one type of health plan in 2024. Large firms are more likely than small firms to offer more than one plan type (61% vs. 23%) [Figure 4.1].
Sixty percent of covered workers in 2024 are employed in a firm that offers more than one type of health plan. Seventy-one percent of covered workers in large firms are employed by a firm that offers more than one plan type, compared to 33% of covered workers in small firms [Figure 4.2].
Sixty-five percent of covered workers in firms offering health benefits work in firms that offer one or more PPOs; 60% work in firms that offer one or more HDHP/SOs; 20% work in firms that offer one or more HMOs; 14% work in firms that offer one or more POS plans; and 3% work in firms that offer one or more conventional plans [Figure 4.4].
Among covered workers in firms offering only one type of health plan, 54% are in firms that offer only PPOs and 24% are in firms that offer only HDHP/SOs [Figure 4.5].
Figure 4.1: Among Firms Offering Health Benefits, Percentage of Firms That Offer One, Two, or Three or More Plan Types, by Firm Size, 2024
Figure 4.2: Among Firms Offering Health Benefits, Percentage of Covered Workers in Firms Offering One, Two, or Three or More Plan Types, by Firm Size, 2024
Figure 4.3: Among Firms Offering Health Benefits, Percentage of Firms That Offer the Following Plan Types, by Firm Size, 2024
Figure 4.4: Among Firms Offering Health Benefits, Percentage of Covered Workers in Firms That Offer the Following Plan Types, by Firm Size, 2024
Figure 4.5: Among Firms Offering Only One Type of Health Plan, Percentage of Covered Workers in Firms That Offer the Following Plan Type, by Firm Size, 2024
The survey collects information on a firm’s plan with the largest enrollment in each of the plan types. While we know the number of plan types a firm has, we do not know the total number of plans a firm offers workers. In addition, firms may offer different types of plans to different workers. For example, some workers might be offered one type of plan at one location, while workers at another location are offered a different type of plan.
Section 5: Market Shares of Health Plans
Health plans are often characterized into plan types based on their coverage for out-of-network services and their use of primary care gate keeping. In 2024, PPOs remain the most common plan type.
Forty-eight percent of covered workers are enrolled in PPOs in 2024, followed by HDHP/SOs (27%), HMOs (13%), POS plans (11%), and conventional plans (1%). All of these percentages are similar to the enrollment percentages in 2023 [Figure 5.1].
The percentage of covered workers enrolled in HDHP/SOs is similar to last year (29%) and five years ago (30%), but higher than the percentage 10 years ago (20%). The percentage of covered workers enrolled in PPOs has decreased 10% over the past decade [Figure 5.1].
The percentage of covered workers enrolled in HMOs (13%) is similar to the percentages last year (13%) but lower than the percentage five years ago (19%) [Figure 5.1].
A larger share of covered workers are enrolled in HDHP/SOs than in HMOs in both small and large firms [Figure 5.2].
A similar share of covered workers in large firms and small firms are enrolled in HDHP/SO plans (29% and 24%). Covered workers in small firms are more likely than covered workers in large firms to be enrolled in POS plans (19% vs. 8%) [Figure 5.2].
Plan enrollment patterns also differ across regions.
HMO enrollment is significantly higher in the West (25%), and significantly lower in the Midwest (6%) [Figure 5.3].
Covered workers in the Midwest (40%) are more likely to be enrolled in HDHP/SOs than workers in other regions, while covered workers in the West (19%) are less likely to be enrolled in HDHP/SOs [Figure 5.3].
Figure 5.1: Distribution of Health Plan Enrollment for Covered Workers, by Plan Type, 1988-2024
Figure 5.2: Distribution of Health Plan Enrollment for Covered Workers, by Plan Type and Firm Size, 2024
Figure 5.3: Distribution of Health Plan Enrollment for Covered Workers, by Firm Size, Region, and Industry, 2024
Section 6: Worker and Employer Contributions For Premiums
The vast majority of covered workers make contributions towards the cost of their coverage.
In 2024, covered workers contribute, on average, 16% of the premium for single coverage and 25% of the premium for family coverage.
The average percentages contributed for single and family coverage are each lower than the average contribution levels last year [Figure 6.1].13
Covered workers in small firms, on average, contribute a lower percentage of the premium for single coverage than covered workers in large firms (14% vs. 16%) [Figure 6.2].
Covered workers in small firms contribute, on average, a much higher percentage of the premium for family coverage than covered workers in large firms (33% vs. 23%) [Figure 6.2].
The average contribution amount for covered workers for single coverage is $114 per month ($1,368 annually), similar to the amount last year [Figure 6.4].
The average contribution amount for covered workers for family coverage is $525 per month ($6,296 annually), similar to the amount last year [Figure 6.5].
The average contributions for workers enrolled in HDHP/SOs is lower than the overall average worker contributions for family coverage ($5,662 vs. $6,296) [Figure 6.6].
Covered workers in small firms, on average, contribute a lower amount annually for single coverage than covered workers in large firms ($1,204 vs. $1,429) [Figure 6.7].
Covered workers in small firms, on average, contribute a significantly higher amount annually for family coverage than covered workers in large firms ($7,947 vs. $5,697) [Figure 6.7].
Figure 6.1: Average Percentage of Premium Paid by Covered Workers for Single and Family Coverage, 1999-2024
Figure 6.2: Average Percentage of Premium Paid by Covered Workers for Single and Family Coverage, by Firm Size, 2024
Figure 6.3: Average Monthly Worker Premium Contributions for Single and Family Coverage, 1999-2024
Figure 6.4: Average Annual Worker and Employer Contributions to Premiums and Total Premiums for Single Coverage, 1999-2024
Figure 6.5: Average Annual Worker and Employer Contributions to Premiums and Total Premiums for Family Coverage, 1999-2024
Figure 6.6: Average Annual Worker and Employer Premium Contributions and Total Premiums for Single and Family Coverage, by Plan Type, 2024
Figure 6.7: Average Annual Worker and Employer Premium Contributions and Total Premiums for Single and Family Coverage, by Firm Size, 2024
Figure 6.8: Average Annual Worker and Employer Premium Contributions and Total Premiums for Single Coverage, by Plan Type and Firm Size, 2024
Figure 6.9: Average Annual Employer and Worker Premium Contributions and Total Premiums for Family Coverage, by Plan Type and Firm Size, 2024
DISTRIBUTIONS OF WORKER CONTRIBUTIONS TO THE PREMIUM
Almost nine in ten (89%) of covered workers are in a plan where the employer contributes at least half of the premium for both single and family coverage.
Fourteen percent of covered workers are in a plan where the employer pays the entire premium for single coverage, while only 5% of covered workers are in a plan where the employer pays the entire premium for family coverage [Figure 6.10].
Covered workers in small firms are much more likely than covered workers in large firms to be in a plan where the employer pays the entire premium for single coverage.
Thirty-seven percent of covered workers in small firms have an employer that pays the full premium for single coverage, compared to 5% of covered workers in large firms [Figure 6.10].
For family coverage, 14% of covered workers in small firms have an employer that pays the full premium, compared to 2% of covered workers in large firms [Figure 6.10].
Eleven percent of covered workers are in a plan where the worker contributes more than half of the premium for family coverage [Figure 6.10].
This percentage differs significantly with firm size. Twenty-six percent of covered workers in small firms work in a firm where the worker contribution for family coverage is more than half of the premium, a much higher percentage than the 6% of covered workers in large firms [Figure 6.10].
Small shares of covered workers in small firms (3%) and large firms (less than one percent) must pay more than 50% of the premium for single coverage [Figure 6.10].
There is substantial variation between small and large firms in the dollar amounts that covered workers must contribute towards health coverage.
Among covered workers in small firms, 43% have a contribution for single coverage of less than $500 a year, while 24% have a contribution of $2,000 or more [Figure 6.13]. For family coverage, 17% have a contribution of less than $1,500, while 28% have a contribution of $10,500 or more [Figure 6.14].
Among covered workers in large firms, 13% contribute less than $500 a year for single coverage, while 21% have a contribution of $2,000 or more [Figure 6.13]. For family coverage, only 4% contribute less than $1,500 a year, while 6% have a contribution of $10,500 or more [Figure 6.14].
Figure 6.10: Distribution of Percentage of Premium Paid by Covered Workers for Single and Family Coverage, by Firm Size, 2024
Figure 6.11: Distribution of Percentage of Premium Paid by Covered Workers for Single Coverage, 2002-2024
Figure 6.12: Distribution of Percentage of Premium Paid by Covered Workers for Family Coverage, 2002-2024
Figure 6.13: Distribution of Worker Contributions for Single Coverage, by Firm Size, 2024
Figure 6.14: Distribution of Worker Contributions for Family Coverage, by Firm Size, 2024
DIFFERENCES BY FIRM CHARACTERISTICS
The percentage of the premium paid by covered workers varies with firm characteristics.
Covered workers in private, for-profit firms have a relatively high premium contribution rates for single coverage (18%) and family (27%) coverage. [Figure 6.17].
Covered workers in firms with a relatively large share of older workers (where at least 35% are age 50 or higher) have a lower average percent contribution for family coverage than those in firms with a smaller share of older workers (24% vs. 27%) [Figure 6.17].
Covered workers in firms with a relatively large share of higher-wage workers (where at least 35% earn $77,000 or more annually) have a lower average contribution for family coverage than those in firms with a smaller share of higher-wage workers (23% vs. 27%) [Figure 6.17].
Covered workers in firms that have at least some union workers have a lower average contribution rate for family coverage than those in firms without any union workers (20% vs. 29%) [Figure 6.17].
Figure 6.15: Distribution of the Percentage of Total Premium Paid by Covered Workers for Single and Family Coverage, by Firm Wage Level, 2024
Figure 6.16: Average Annual Worker and Employer Contributions to Premiums and Total Premiums for Single and Family Coverage, by Firm Wage Level, 2024
Figure 6.17: Average Annual Premium Contributions Paid by Covered Workers for Single and Family Coverage, by Firm Characteristics, 2024
Figure 6.18: Average Percentage of Family Premium Paid by Covered Workers, by Firm Characteristics, 2024
Figure 6.19: Average Percentage of Premium Paid by Covered Workers, by Firm Characteristics and Size, 2024
DIFFERENCES BY REGION AND INDUSTRY
The average worker contribution for single coverage is relatively high in the Northeast and relatively low in the West (12%) [Figure 6.20].
The average worker contribution for family coverage is relatively low in the Northeast (22%) and the Midwest (23%) and relatively high in the South (28%) [Figure 6.20].
Average worker contributions vary across industries for single and family coverage [Figure 6.21].
Figure 6.20: Average Premium Paid by Covered Workers for Single and Family Coverage, by Plan Type and Region, 2024
Figure 6.21: Average Percentage of Premium Paid by Covered Workers, by Industry, 2024
CHANGES OVER TIME
The average worker contributions in 2024 for single coverage ($1,368) and for family coverage ($6,296) are similar to the average contribution levels last year [Figure 6.4] and [Figure 6.5].
Over the last five years, the average worker contributions for single coverage has increased 10% and the average worker contribution for family coverage increased 5%.
Over the last 10 years, the average worker contributions for single coverage has increased 27% and the average worker contribution for family coverage increased 31% [Figure 6.4] and [Figure 6.5].
Figure 6.22: Average Annual Worker Contributions for Covered Workers With Single Coverage, by Firm Size, 1999-2024
Figure 6.23: Average Annual Worker Contributions for Covered Workers With Family Coverage, by Firm Size, 1999-2024
Figure 6.24: Average Percentage of Premium Paid by Covered Workers for Single and Family Coverage, by Firm Size, 1999-2024
Figure 6.25: Among Large Firms, Average Annual Worker Contributions for Covered Workers With Family Coverage, by Firm Wage Level, 1999-2024
The average percentage contribution is calculated as a weighted average of all a firm’s plan types and may not necessarily equal the average worker contribution divided by the average premium.↩︎
Section 7: Employee Cost Sharing
In addition to any required premium contributions, most covered workers must pay a share of the cost for the medical services they use. The most common forms of cost-sharing are deductibles (an amount that must be paid before most services are covered by the plan), copayments (fixed dollar amounts), and coinsurance (a percentage of the charge for services). Some plans combine cost-sharing forms, such as requiring coinsurance for a service up to a maximum amount, or assessing either coinsurance or a copayment for a service, whichever is higher. The type and level of cost-sharing may vary with the type of plan in which the worker is enrolled. Cost sharing may also vary by the type of service, with separate classifications for office visits, hospitalizations, or prescription drugs.
The cost-sharing amounts reported here are for covered workers using in-network services. Plan enrollees receiving services from providers that do not participate in plan networks often face higher cost-sharing and may be responsible for charges that exceed the plan’s allowable amounts. The framework of this survey does not allow us to capture all of the complex cost-sharing requirements in modern plans, including ancillary services (such as durable medical equipment or physical therapy) or cost-sharing arrangements that vary across different settings (such as tiered networks). Therefore, we do not collect information on all plan provisions and limits that affect enrollee out-of-pocket liability.
GENERAL ANNUAL DEDUCTIBLES FOR WORKERS IN PLANS WITH DEDUCTIBLES
We consider a general annual deductible to be an amount that must be paid by enrollees before most services are covered by their health plan. Non-grandfathered health plans are required to cover some services, such as preventive care, without cost-sharing. Some plans require enrollees to meet a specific deductible for certain services, like prescription drugs or hospital admissions, in lieu of or in addition to a general annual deductible. As discussed below, some plans with a general annual deductible for most services exclude specified classes of care from the deductible, such as prescriptions or physician office visits.
Eighty-seven percent of covered workers in 2024 are enrolled in a plan with a general annual deductible for single coverage, similar to the percentage last year (90%) but higher than the percentages five years ago (82%) and ten years ago (80%) [Figure 7.2].
The percent of covered workers enrolled in a plan with a general annual deductible for single coverage is lower for covered workers in small firms (3-199 workers) (80%) than for those in large firms (200 or more workers) (89%) [Figure 7.2].
The likelihood of a plan having a general annual deductible varies by plan type. Forty-six percent of covered workers in HMOs do not have a general annual deductible for single coverage, compared to 12% of workers in POS plans and 12% of workers in PPOs [Figure 7.1].
For workers with single coverage in a plan with a general annual deductible, the average annual deductible is $1,787, similar to the average deductible last year ($1,735) [Figure 7.3] and [Figure 7.8].
For covered workers in plans with a general annual deductible, the average deductibles for single coverage are $1,484 in HMOs, $1,252 in PPOs, $2,094 in POS plans, and $2,666 in HDHP/SOs [Figure 7.6].
The average deductibles for single coverage are higher for covered workers at small firms than at large firms in most plan types. For covered workers in PPOs, the most common plan type, the average deductible for single coverage is considerably higher for covered workers in small firms as compared to those in large firms ($1,973 vs. $1,048) [Figure 7.6]. Overall, for covered workers in plans with a general annual deductible, the average deductible for single coverage at small firms ($2,575) is higher than the average deductible at large firms ($1,538) [Figure 7.3].
The average general annual deductible for single coverage for workers in plans with a deductible is similar to the amount five years ago ($1,787 v. $1,655) but is higher than the amount ten years ago ($1,787) v. $1,217) [Figure 7.8].
Figure 7.1: Percentage of Covered Workers With No General Annual Deductible for Single Coverage, by Plan Type and Firm Size, 2024
Figure 7.2: Percentage of Covered Workers in a Plan That Includes a General Annual Deductible for Single Coverage, by Plan Type and Firm Size, 2006-2024
Figure 7.3: Percentage of Covered Workers in a Plan That Includes a General Annual Deductible and Average Deductible for Single Coverage, by Firm Size and Region, 2024
Figure 7.4: Percentage of Covered Workers in a Plan That Includes a General Annual Deductible and Average Deductibles for Single Coverage, by Firm Characteristics, 2024
Figure 7.5: Among Covered Workers With No General Annual Deductible, Percentage Who Face Other Types of Cost Sharing, 2024
Figure 7.6: Among Covered Workers With a General Annual Deductible for Single Coverage, Average Deductible, by Plan Type and Firm Size, 2024
Figure 7.7: Percentage of Covered Workers With a General Annual Deductible for Single Coverage, 2006-2024
Figure 7.8: Among Covered Workers With a General Annual Deductible, Average Single and Family Coverage Deductible, by Plan Type, 2006-2024
GENERAL ANNUAL DEDUCTIBLES AMONG ALL COVERED WORKERS
As discussed above, the share of covered workers in plans with a general annual deductible has increased over time, from 80% in 2014 to 87% in 2024 [Figure 7.7]. The average deductible amount for covered workers in plans with a deductible has also increased over this period, from $1,217 in 2014 to $1,787 in 2024 [Figure 7.10]. Neither trend by itself, however, captures the full impact that changes in deductibles have had on covered workers. We can look at the average impact of both trends together by assigning a zero deductible value to covered workers in plans with no deductible and looking at how the resulting averages change over time. These average deductible amounts are lower in any given year than the averages for only people in plans with deductibles, but the changes over time reflect both workers facing higher monetary deductible amounts and a greater number of workers facing deductibles.
Using this approach, the average general annual deductible for single coverage for all covered workers (with or without a deductible) in 2024 is $1,562, similar to the amount last year ($1,568) [Figure 7.10].
The 2024 value is 12% higher than the average general annual deductible in 2019 ($1,396) and 58% higher than in 2014 ($989) [Figure 7.10].
Another way to examine the impact of deductibles on covered workers is to look at the percent of all covered workers who are in a plan with a deductible that exceeds a certain amount. Thirty-two percent of covered workers are in plans with a general annual deductible of $2,000 or more for single coverage, similar to the percentages last year (31%) and five years ago (28%) [Figure 7.14].
Workers at small firms are considerably more likely to have a general annual deductible of $2,000 or more for single coverage than workers at large firms (50% vs. 26%) [Figure 7.12].
Figure 7.9: Prevalence and Value of General Annual Deductibles for Single Coverage, by Firm Size, 2006-2024
Figure 7.10: Average General Annual Deductibles for Single Coverage, 2006-2024
Figure 7.11: Among Covered Workers Who Face a Deductible for Single Coverage, Average General Annual Deductible for Single Coverage, by Firm Size, 2006-2024
Figure 7.12: Percentage of Covered Workers Enrolled in a Plan With a High General Annual Deductible for Single Coverage, by Firm Size, 2024
Figure 7.13: Percentage of Covered Workers Enrolled in a Plan With a General Annual Deductible of $1,000 or More for Single Coverage, by Firm Size, 2009-2024
Figure 7.14: Percentage of Covered Workers Enrolled in a Plan With a General Annual Deductible of $2,000 or More for Single Coverage, by Firm Size, 2009-2024
GENERAL ANNUAL DEDUCTIBLES AND ACCOUNT CONTRIBUTIONS
One of the reasons for the growth in general annual deductibles is the growth in enrollment in HDHP/SOs, which have higher deductibles than other plans. While having a higher deductible in other plan types generally increases enrollee out-of-pocket liability, the shift in enrollment to HDHP/SOs does not necessarily do so, because many HDHP/SO enrollees receive an account contribution from their employers, reducing the higher cost-sharing in these plans.
Twenty-five percent of covered workers in an HDHP with an HRA and 2% of covered workers in an HSA-qualified HDHP receive an account contribution from their employer for single coverage that is at least equal to their deductible. Another 24% of covered workers in an HDHP with an HRA and 9% of covered workers in an HSA-qualified HDHP receive account contributions that, if applied to their deductible, would reduce the deductible to $1,000 or less [Figure 7.16].
If we subtract employer account contributions from the general annual deductibles, the percent of covered workers with a deductible of $1,000 or more would be reduced from 60% to 54% [Figure 7.13] and [Figure 7.15].
Figure 7.15: Percentage of Covered Workers Enrolled in a Plan With a High General Annual Deductible for Single Coverage, Reduced by Any HRA/HSA Contributions, by Firm Size, 2024
Figure 7.16: Among Covered Workers With a General Annual Deductible, Average General Annual Deductibles for Single Coverage, Reduced by Any HRA/HSA Contributions, by Plan Type and Firm Size, 2024
Figure 7.17: Among Covered Workers With a General Annual Deductible, Distribution of General Annual Deductibles for Single Coverage, Reduced by Any HRA/HSA Contributions, 2007-2024
Figure 7.18: Among Covered Workers With a General Annual Deductible, Distribution of General Annual Deductible for Single Coverage, 2007-2024
Figure 7.19: Among Covered Workers With a General Annual Deductible, Distribution of General Annual Deductibles for Single Coverage, by Plan Type, 2024
GENERAL ANNUAL DEDUCTIBLES FOR WORKERS ENROLLED IN FAMILY COVERAGE
General annual deductibles for family coverage are structured in two primary ways: (1) an aggregate family deductible, where the out-of-pocket expenses of all family members count against a specified family deductible amount and where the deductible is considered met when the combined family expenses exceed the deductible amount, or (2) a separate per-person family deductible, where each family member is subject to a specified deductible amount before the plan covers expenses for that member. However, many plans with a per-person deductible consider the deductible for all family members met once a certain number of family members (typically two or three) meet their specified deductible amount.14
Forty-six percent of covered workers in HMOs are in plans without a general annual deductible for family coverage. The percent of workers in plans without family deductibles is lower for workers in PPOs (12%) and POS plans (12%). As defined, all covered workers in HDHP/SOs have a general annual deductible for family coverage [Figure 7.20].
Among covered workers enrolled in family coverage, the percent of covered workers in a plan with an aggregate general annual deductible is 29% for workers in HMOs, 55% for workers in PPOs, 68% for workers in POS plans, and 78% for workers in HDHP/SOs [Figure 7.20].
The average deductible amounts for covered workers in plans with an aggregate annual deductible for family coverage are $3,777 for HMOs, $2,770 for PPOs, $4,217 for POS plans, and $4,991 for HDHP/SOs [Figure 7.21]. The average deductible amounts for aggregate family deductibles are similar to last year for each plan type.
For covered workers in plans with an aggregate deductible for family coverage, the average annual family deductibles at small firms are higher than at large firms for covered workers in PPOs, HMO plans, and HDHP/SOs [Figure 7.21].
Among workers enrolled in family coverage, the percent of workers in plans with a separate per-person annual deductible for family coverage is 25% for workers in HMOs, 33% for workers in PPOs, 20% for workers in POS plans, and 22% for workers in HDHP/SOs [Figure 7.20].
The average deductible amounts for covered workers in plans with separate per-person annual deductibles for family coverage are $1,635 for PPOs, and $4,055 for HDHP/SOs [Figure 7.21].
Forty percent of covered workers in plans with a separate per-person annual deductible for family coverage have a limit for the number of family members required to meet the separate deductible amounts [Figure 7.24]. Among those covered workers, the most frequent number of family members who are required to meet the separate per-person deductible is two [Figure 7.25].
Figure 7.20: Distribution of Type of General Annual Deductible for Covered Workers With Family Coverage, by Plan Type, 2024
Figure 7.21: Among Covered Workers With a General Annual Deductible, Average Deductibles for Family Coverage, by Deductible Type, Plan Type, and Firm Size, 2024
Figure 7.22: Among Covered Workers With a Separate Per-Person General Annual Deductible for Family Coverage, Distribution of Deductibles, by Plan Type, 2024
Figure 7.23: Among Covered Workers With an Aggregate General Annual Deductible for Family Coverage, Distribution of Deductibles, by Plan Type, 2024
Figure 7.24: Among Covered Workers With a Separate Per-Person General Annual Deductible for Family Coverage, Structure of Deductible Limits, by Plan Type, 2024
Figure 7.25: Among Covered Workers With a Separate Per-Person General Annual Deductible for Family Coverage and a Per-Person Limit, Distribution of Maximum Number of Family Members Required to Meet the Deductible, by Plan Type, 2024
Figure 7.26: Among Covered Workers With an Aggregate General Annual Deductible for Family Coverage, Distribution of Aggregate Deductibles, by Plan Type, 2019 and 2024
COVERAGE OF SERVICES AND PRODUCTS BEFORE MEETING THE GENERAL ANNUAL DEDUCTIBLES
The majority of covered workers with a general annual deductible are enrolled in plans where the deductible does not have to be met before certain services, such as physician office visits or prescription drugs, are covered. Covered workers in HSA qualified HDHP/SOs are not included in these estimates, because HSA-qualified plans generally only pay for preventive services before the deductible is met.
Among covered workers enrolled in a plan with a general annual deductible, large shares (71% in HMOs, 75% in PPOs, 61% in POS plans, and 60% in HDHP/HRAs) are enrolled in plans where the deductible does not have to be met before physician office visits for primary care are covered [Figure 7.27].
Similarly, among covered workers enrolled in a plan with a general annual deductible, large shares (87% in HMOs, 87% in PPOs, 79% in POS plans, and 72% in HPHD/HRAs) do not have to meet the general annual deductible before prescription drugs are covered [Figure 7.27].
Figure 7.27: Among Covered Workers With a General Annual Deductible, Percentage With Coverage for the Following Services Without Having to First Meet the Deductible, by Plan Type, 2024
HOSPITAL ADMISSIONS AND OUTPATIENT SURGERY
Whether or not a worker has a general annual deductible, most workers face additional types of cost-sharing (such as a copayment, coinsurance, or a per diem charge) when admitted to a hospital or having outpatient surgery. The distribution of workers with cost-sharing for hospital admissions or outpatient surgery does not equal 100%, as workers may face a complex combination of types of cost-sharing. For this reason, the average copayment and coinsurance rates include workers who may have a combination of these cost-sharing methods. Coinsurance, in particular, may include minimums or maximums which affect an enrollee’s liability. We report the distribution of cost-sharing for covered workers enrolled in a plan which covers hospital admissions and outpatient surgery, respectively. A small share of respondents indicate that they have an “other” type of cost-sharing arrangement.
In addition to any general annual deductible that may apply, 59% of covered workers have coinsurance and 16% have a copayment that applies to inpatient hospital admissions. A lower percentage of covered workers have per-day (per diem) payments (5%), a separate hospital deductible (2%), or both a copayment and coinsurance (9%). Fifteen percent of covered workers have no additional cost-sharing for hospital admissions after any general annual deductible has been met [Figure 7.28]. Covered workers with both a copay and coinsurance may be required to pay both or whichever is greater.
On average, covered workers in HMO plans are more likely than workers in other plan types to have a copayment for hospital admissions, while workers in HDHP/SOs are less likely [Figure 7.28].
The average coinsurance rate for a hospital admission is 21%, the average copayment is $343 per hospital admission, and the average per diem charge is $369 [Figure 7.31]. Seventy-two percent of workers enrolled in a plan with a per diem for hospital admissions have a limit on the number of days for which a worker must pay the cost-sharing amount [Figure 7.32].
The cost-sharing provisions for outpatient surgery are similar to those for hospital admissions, as most workers have coinsurance or copayments. In 2024, 13% of covered workers have a copayment and 64% have a coinsurance rate for outpatient surgery. In addition, 7% have both a copayment and a coinsurance rate, while 15% have no additional cost-sharing after any general annual deductible has been met [Figure 7.29] and [Figure 7.30].
For covered workers with cost-sharing for outpatient surgery, the average coinsurance rate is 20% and the average copayment is $216 [Figure 7.31].
Figure 7.28: Distribution of Covered Workers’ Cost Sharing for Hospital Admissions, by Plan Type, 2024
Figure 7.29: Distribution of Covered Workers’ Cost Sharing for Outpatient Surgery, by Plan Type, 2024
Figure 7.30: Percentage of Covered Workers With the Following Types of Cost Sharing for Hospital Admissions and Outpatient Surgery, in Addition to Any General Annual Deductible, 2024
Figure 7.31: Among Covered Workers With Separate Cost Sharing for Hospital Admissions or Outpatient Surgery, Average Cost Sharing, by Type, 2024
Figure 7.32: Among Covered Workers With a Charge Per Day for Hospital Admissions, Average Cost Sharing Features, 2024
Figure 7.33: Among Covered Workers With a Copayment for Hospital Admissions or Outpatient Surgery, Distribution of Copayments, 2024
Figure 7.34: Among Covered Workers With Coinsurance for Hospital Admissions or Outpatient Surgery, Distribution of Coinsurance Rates, 2024
COST-SHARING FOR PHYSICIAN OFFICE VISITS
The majority of covered workers are enrolled in health plans that require cost-sharing for an in-network physician office visit, in addition to any general annual deductible.15
The most common form of cost-sharing for an in-network physician office visit is a copayment. Seventy-four percent of covered workers have a copayment for a primary care physician office visit and 15% have coinsurance. For office visits with a specialty physician, 71% of covered workers have a copayment and 20% have coinsurance [Figure 7.35].
The share of covered workers with coinsurance for office visits with a specialty physician in 2024 is lower than the percentage five years ago (20% vs. 26%).
The form of cost-sharing for physician office visits varies by firm size. Covered workers at small firms are less likely to have coinsurance than workers at large firms for in-network primary care office visits (8% vs. 18%), and for in-network office visits with specialists (9% vs. 24%) [Figure 7.37].
Covered workers in HMOs, PPOs, and POS plans are much more likely to have copayments for both primary care and specialty care physician office visits than workers in HDHP/SOs. For primary care physician office visits, 27% of covered workers in HDHP/SOs have a copayment, 44% have coinsurance, and 17% have no cost-sharing after the general annual plan deductible is met [Figure 7.35].
Among covered workers with a copayment for in-network physician office visits, the average copayment for primary care physician office visits is $26, the same as average copayment last year ($26) [Figure 7.36].
Among covered workers with a copayment for in-network physician office visits, the average copayment for specialty physician office visits is $42, similar to the amount last year ($44) [Figure 7.36].
For covered workers with a copayment for physician office visits, average copayment amounts are higher for workers at small firms than those at large firms for both primary care physician office visits ($28 vs. $25) and specialty physician office visits ($48 vs. $40).
Among covered workers with coinsurance for in-network physician office visits, the average coinsurance rates are 20% for a visit with a primary care physician and 20% for a visit with a specialist, similar to the rates last year [Figure 7.36].
Figure 7.35: Percentage of Covered Workers With the Following Types of Cost Sharing for Physician Office Visits, by Plan Type, 2024
Figure 7.36: Among Covered Workers With Copayments And/Or Coinsurance for Physician Office Visits, Average Copayments and Coinsurance, by Plan Type, 2024
Figure 7.37: Percentage of Covered Workers With the Following Types of Cost Sharing for Physician Office Visits, by Firm Size, 2024
Figure 7.38: Among Covered Workers With a Copayment for a Primary Care Physician Office Visit, Distribution of Copayments, by Plan Type, 2024
Figure 7.39: Among Covered Workers With a Copayment for a Specialist Physician Office Visit, Distribution of Copayments, by Plan Type, 2024
Figure 7.40: Among Covered Workers With a Copayment for a Primary Care Physician Office Visit, Distribution of Copayments, 2006-2024
Figure 7.41: Among Covered Workers With a Copayment for a Specialist Physician Office Visit, Distribution of Copayments, 2007-2024
Figure 7.42: Among Covered Workers With a Copayment And/Or Coinsurance for Physician Office Visits, Average Copayment and Coinsurance, 2006-2024
OUT-OF-POCKET MAXIMUMS
Virtually all covered workers are in a plan that either partially or totally limits the cost-sharing that enrollees must pay in a year. This limit is generally referred to as an out-of-pocket maximum. The Affordable Care Act (ACA) requires that non-grandfathered health plans have an annual out-of-pocket maximum of no more than $9,450 for single coverage and $18,900 for family coverage in 2024. Out-of-pocket limits in HSA qualified HDHP/SOs are required to be somewhat lower.16 Many plans have complex out-of-pocket structures, which makes it difficult to accurately collect information on this element of plan design.
In 2024, more than 99% of covered workers are in a plan that has an out-of-pocket maximum for single coverage [Figure 7.43].
For covered workers in plans with an out-of-pocket maximum for single coverage, there is wide variation in spending limits [Figure 7.44].
Fourteen percent of covered workers in plans with an out-of-pocket maximum have an out-of-pocket maximum of $2,000 or less for single coverage, while 24% of these workers have an out-of-pocket maximum above $6,000 [Figure 7.44].
Figure 7.43: Percentage of Covered Workers in a Plan With an Out-Of-Pocket Maximum Above Certain Thresholds for Single Coverage, 2009-2024
Figure 7.44: Among Covered Workers With an Out-Of-Pocket Maximum for Single Coverage, Distribution of Out-Of-Pocket Maximums, by Plan Type, 2024
Figure 7.45: Average Out-Of-Pocket Maximum for Single Coverage, by Firm Size, 2024
Some workers with separate per-person deductibles or out-of-pocket maximums for family coverage do not have a specific number of family members that are required to meet the deductible amount and instead have another type of limit, such as a per-person amount with a total dollar amount limit. These responses are included in the averages and distributions for separate family deductibles and out-of-pocket maximums.↩︎
Starting in 2010, the survey asked about the prevalence and cost of physician office visits separately for primary care and specialty care. Prior to the 2010 survey, if the respondent indicated the plan had a copayment for office visits, we assumed the plan had a copayment for both primary and specialty care visits. The survey did not allow for a respondent to report that a plan had a copayment for primary care visits and coinsurance for visits with a specialist physician. The changes made in 2010 allow for variations in the type of cost-sharing for primary care and specialty care visits. The survey includes cost-sharing for in-network services only.↩︎
For those enrolled in an HDHP/HSA, the out-of-pocket maximum may be no more than $8,050 for an individual plan and $16,100 for a family plan in 2024.↩︎
Section 8: High-deductible Health Plans with Savings Option
To help cover out-of-pocket expenses not covered by a health plan, some firms offer high-deductible plans paired with an account that allows enrollees to use tax-preferred funds to pay cost sharing and other out-of-pocket medical expenses. The two most common types of accounts are health reimbursement arrangements (HRAs) and health savings accounts (HSAs). HRAs and HSAs are both financial accounts that workers or their family members can use to pay for health care services. These savings arrangements are often (or, in the case of HSAs, always) paired with health plans with high deductibles. This survey treats high-deductible plans paired with a savings option as a distinct plan type – High-Deductible Health Plan with Savings Option (HDHP/SO) – even if the plan would otherwise be considered a PPO, HMO, POS plan, or conventional health plan. Specifically for the survey, HDHP/SOs are defined as (1) health plans with a deductible of at least $1,000 for single coverage and $2,000 for family coverage17, offered with an HRA (referred to as HDHP/HRAs), or (2) high-deductible health plans that meet the federal legal requirements to permit an enrollee to establish and contribute to an HSA (referred to as HSA-qualified HDHPs).18
PERCENTAGE OF FIRMS OFFERING HDHP/HRAS AND HSA-QUALIFIED HDHPS
Twenty-five percent of firms offering health benefits offer an HDHP/HRA, an HSA-qualified HDHP, or both. Among firms offering health benefits, 4% offer an HDHP/HRA and 22% offer an HSA-qualified HDHP [Figure 8.1]. The percentage of firms offering an HDHP/SO is similar to last year.
Large firms (200 or more workers) are more much likely to offer an HDHP/SO to at least some workers than small firms (3-199 workers) (58% vs. 24%) [Figure 8.3].
Figure 8.1: Among Firms Offering Health Benefits, Percentage That Offer an HDHP/HRA And/Or an HSA-Qualified HDHP, 2005-2024
Figure 8.2: Among Firms Offering Health Benefits, Percentage That Offer an HDHP/SO, by Firm Size, 2005-2024
Figure 8.3: Among Firms Offering Health Benefits, Percentage That Offer an HDHP/HRA And/Or an HSA-Qualified HDHP, by Firm Size, 2024
ENROLLMENT IN HDHP/HRAS AND HSA-QUALIFIED HDHPS
Twenty-seven percent of covered workers are enrolled in an HDHP/SO in 2024, similar to the percentage last year (29%) [Figure 8.4].
The share of covered workers enrolled in HDHP/SOs is similar to the share five years ago (27% v. 30%) but is higher than the share ten years ago (27% v. 20%) [Figure 8.4].
Six percent of covered workers are enrolled in HDHP/HRAs and 21% of covered workers are enrolled in HSA-qualified HDHPs in 2024. These percentages are similar to those last year [Figure 8.4].
The percentage of covered workers enrolled in HDHP/SOs is similar in small firms and in large firms [Figure 8.5].
Figure 8.4: Percentage of Covered Workers Enrolled in an HDHP/HRA or HSA-Qualified HDHP, 2006-2024
Figure 8.5: Percentage of Covered Workers Enrolled in an HDHP/SO, by Firm Size, 2006-2024
PREMIUMS AND WORKER CONTRIBUTIONS
In 2024, average annual premiums for covered workers in HDHP/HRAs are $9,291 for single coverage and $26,813 for family coverage [Figure 8.6].
The average annual premiums for workers in HSA-qualified HDHPs are $7,982 for single coverage and $23,436 for family coverage [Figure 8.7]. These amounts are significantly less than the average single and family premium for covered workers in plans that are not HDHP/SOs.
The average annual worker premium contribution amounts for workers enrolled in HDHP/HRAs are $1,412 for single coverage and $5,824 for family coverage [Figure 8.6]. These amounts are similar to the average premium contribution amounts for covered workers in plans that are not HDHP/SOs [Figure 8.7].
The average annual worker premium contribution amounts for workers in HSA-qualified HDHPs are $1,206 for single coverage and $5,631 for family coverage. These amounts are lower than the average premium contribution amounts for covered workers in plans that are not HDHP/SOs [Figure 8.7].
Figure 8.6: HDHP/HRA and HSA-Qualified HDHP Features for Covered Workers, 2024
Figure 8.7: Average Annual Premiums and Contributions to Savings Accounts for Covered Workers in HDHP/HRAs or HSA-Qualified HDHPs, Compared to Non-HDHP/SOs, 2024
Figure 8.8: Average Annual Premiums and Contributions for Covered Workers in HDHP/SOs and Non-HDHP/SOs, for Family Coverage, 2024
Figure 8.9: Total Annual Costs (Premiums and Account Contributions) for Covered Workers in HDHP/SOs, for Family Coverage, by Firm Size, 2024
Figure 8.10: Average Annual Premiums for Covered Workers With Family Coverage, by Plan Type, 2007-2024
Figure 8.11: Average Annual Premiums for Covered Workers With Single Coverage, by Plan Type, 2007-2024
OUT-OF-POCKET MAXIMUMS AND PLAN DEDUCTIBLES
HSA-qualified HDHPs are legally required to have an annual out-of-pocket maximum of no more than $8,050 for single coverage and $16,100 for family coverage in 2024. Non-grandfathered HDHP/HRA plans are required to have out-of-pocket maximums of no more than $9,450 for single coverage and $18,900 for family coverage. Virtually all HDHP/HRA plans have an out-of-pocket maximum for single coverage in 2024.
The average annual out-of-pocket maximum for single coverage is $5,279 for HDHP/HRAs and $4,444 for HSA-qualified HDHPs [Figure 8.6].
As expected, workers enrolled in HDHP/SOs have higher deductibles than workers enrolled in HMOs, PPOs, or POS plans [Figure 8.14].
The average general annual deductible for single coverage is $2,700 for HDHP/HRAs and $2,658 for HSA-qualified HDHPs [Figure 8.6]. There is wide variation around these averages: 33% of covered workers enrolled in an HDHP/SO are in a plan with a deductible between $1,000 and $1,999 for single coverage while 36% have a deductible of $3,000 or more [Figure 8.12].
The survey asks firms whether the family deductible amount is (1) an aggregate amount (i.e., the out-of-pocket expenses of all family members are counted until the deductible is satisfied), or (2) a per-person amount that applies to each family member (typically with a limit on the number of family members that would be required to meet the deductible amount) (see Section 7 for more information).
The average aggregate deductibles for workers with family coverage are $5,343 for HDHP/HRAs and $4,952 for HSA-qualified HDHPs [Figure 8.6]. As with single coverage, there is wide variation around these averages for family coverage: 6% of covered workers enrolled in HDHP/SOs with an aggregate family deductible have a deductible between $2,000 and $2,999 while 30% have a deductible of $6,000 dollars or more [Figure 8.15].
Figure 8.12: Distribution of Covered Workers in HDHP/SOs With the Following General Annual Deductibles for Single Coverage, by Firm Size, 2024
Figure 8.13: General Annual Deductible for Workers in HDHP/SOs After Any Employer Account Contributions for Single Coverage, by Firm Size, 2024
Figure 8.14: Among Covered Workers With a General Annual Deductible, Average Deductibles for Workers in Non-HDHP/SOs Compared to HDHP/SOs Before and After Any Employer Account Contributions, for Single Coverage, 2007-2024
Figure 8.15: Distribution of Covered Workers in HDHP/SOs With the Following Aggregate Family Deductibles, 2024
EMPLOYER CONTRIBUTIONS
Employers contribute to HDHP/SOs in two ways: through their contributions toward the premium for the health plan, and through their contributions (if any, in the case of HSAs) to the savings account option (the HRAs or HSAs themselves).
The average annual employer contribution to premiums for workers in HDHP/HRAs is $7,879 for single coverage and $20,990 for family coverage. The average contribution for family coverage is higher than the amount last year ($20,990 vs. $16,547) [Figure 8.7].
The average annual employer contribution to premiums for workers in HSA-qualified HDHPs is $6,777 for single coverage and $17,804 for family coverage. The average employer contributions for single coverage and family coverage for workers in HSA-qualified HDHPs are lower than those for workers in plans that are not HDHP/SOs [Figure 8.7].
Covered workers enrolled in HDHP/HRAs on average receive an annual employer contribution to their HRA of $1,724 for single coverage and $3,274 for family coverage [Figure 8.7].
HRAs are generally structured in such a way that employers may not actually spend the whole amount that they make available to their employees’ HRAs.19 Amounts committed to an employee’s HRA that are not used by the employee generally roll over and can be used in future years, but any balance may revert back to the employer if the employee leaves his or her job. Thus, the employer contribution amounts to HRAs that we capture in the survey may exceed the amount that employers will actually spend.
Covered workers enrolled in HSA-qualified HDHPs receive an average annual employer HSA contribution of $705 for single coverage and $1,297 for family coverage [Figure 8.7].
In many cases, employers that sponsor HSA-qualified HDHP/SOs do not make contributions to HSAs established by their employees. Thirty-two percent of employers offering single coverage and 23% offering family coverage through HSA-qualified HDHPs do not make contributions toward the HSAs that their workers establish. Among covered workers enrolled in an HSA-qualified HDHP, 16% enrolled in single coverage and 16% enrolled in family coverage do not receive an account contribution from their employer [Figure 8.16] and [Figure 8.17].
The average HSA contributions reported above include the portion of covered workers whose employer contribution to the HSA is zero. When those firms that do not contribute to the HSA are excluded from the calculation, the average employer contribution for covered workers is $842 for single coverage and $1,539 for family coverage.
The percentages of covered workers enrolled in a plan where the employer makes no HSA contribution, (16% for single coverage and 16% for family coverage), are similar to the percentages in recent years [Figure 8.16] and [Figure 8.17].
The amount that employers contribute to savings accounts varies considerably.
Forty-six percent of covered workers in an HDHP/HRA receive an annual HRA contribution of less than $800 for single coverage, while 36% receive an annual HRA contribution of $1,600 or more [Figure 8.16].
Twenty-eight percent of covered workers in an HSA-qualified HDHP receive an annual HSA contribution of less than $400 for single coverage, including 16% who receive no HSA contribution from their employer [Figure 8.16]. In contrast, 15% of covered workers in an HSA-qualified HDHP receive an annual HSA contribution of $1,200 or more. One percent of covered workers have an employer that matches any HSA contribution for single coverage.
Employer contributions to savings account options (i.e., the HRAs and HSAs themselves) for their workers can be added to their health plan premium contributions to calculate total employer contributions toward HDHP/SOs. We note that HRAs are a promise by an employer to pay up to a specified amount and that many employees will not receive the full amount of their HRA in a year, so adding the employer premium contribution amount and the HRA contribution represents an upper bound for employer liability that overstates the amount that is actually expended. Since employer contributions to employee HSAs immediately transfer the full amount to the employee, adding employer premium and HSA contributions is an instructive way to look at their total liability under these plans.
For HDHP/HRAs, the average annual total employer contribution for covered workers is $9,603 for single coverage and $24,264 for family coverage. The average total employer contributions for covered workers for single coverage and family coverage in HDHP/HRAs are higher than the average employer contributions toward single and family coverage in plans that are not HDHP/SOs [Figure 8.7].
For HSA-qualified HDHPs, the average total annual employer contribution for covered workers is $7,488 for single coverage and $19,126 for workers with family coverage. These amounts are similar to the average employer contributions for single and family coverage in health plans that are not HDHP/SOs [Figure 8.7].
Figure 8.16: Distribution of Covered Workers With the Following Annual Employer Contributions to Their HRA or HSA, for Single Coverage, 2024
Figure 8.17: Distribution of Covered Workers With the Following Annual Employer Contributions to Their HRA or HSA, for Family Coverage, 2024
Figure 8.18: Average Annual Employer Contributions to HSA Accounts for Covered Workers Enrolled in an HSA-Qualified HDHP, 2009-2024
Figure 8.19: Among Covered Workers in HDHP/HRAs and HSA-Qualified HDHPs, Average Annual Employer HSA and HRA Contributions, 2024
COST SHARING FOR OFFICE VISITS
The cost-sharing pattern for primary care office visits varies for workers enrolled in HDHP/SOs. Seventy-one percent of covered workers in HDHP/HRAs have a copayment for primary care physician office visits, compared to 9% enrolled in HSA-qualified HDHPs [Figure 8.20]. Workers in other plan types are much more likely to face copayments than coinsurance for physician office visits (see Section 7 for more information).
Figure 8.20: Distribution of Covered Workers in HDHP/HRAs and HSA-Qualified HDHPs With the Following Types of Cost Sharing in Addition to the General Annual Deductible, 2024
Health Reimbursement Arrangements (HRAs) are medical care reimbursement plans established by employers that can be used by employees to pay for health care. HRAs are funded solely by employers. Employers may commit to make a specified amount of money available in the HRA for premiums and medical expenses incurred by employees or their dependents. HRAs are accounting devices, and employers are not required to expend funds until an employee incurs expenses that would be covered by the HRA. Unspent funds in the HRA usually can be carried over to the next year (sometimes with a limit). Employees cannot take their HRA balances with them if they leave their job, although an employer can choose to make the remaining balance available to former employees to pay for health care. HRAs often are offered along with a high-deductible health plan (HDHP). In such cases, the employee pays for health care first from his or her HRA and then out-of-pocket until the health plan deductible is met. Sometimes certain preventive services or other services such as prescription drugs are paid for by the plan before the employee meets the deductible.
Health Savings Accounts (HSAs) are savings accounts created by individuals to pay for health care. An individual may establish an HSA if he or she is covered by a “qualified health plan” – a plan with a high deductible (at least $1,500 for single coverage and $3,000 for family coverage in 2024 or $1,400 and $2,800, respectively, in 2023) that also meets other requirements. Employers can encourage their employees to create HSAs by offering an HDHP that meets the federal requirements. Employers in some cases also may assist their employees by identifying HSA options, facilitating applications, or negotiating favorable fees from HSA vendors.Both employers and employees can contribute to an HSA, up to the statutory cap of $4,150 for single coverage and $8,300 for family coverage in 2024. Employee contributions to the HSA are made on a pre-income tax basis, and some employers arrange for their employees to fund their HSAs through payroll deductions. Employers are not required to contribute to HSAs established by their employees but if they elect to do so, their contributions are not taxable to the employee. Interest and other earnings on amounts in an HSA are not taxable. Withdrawals from the HSA by the account owner to pay for qualified health care expenses are not taxed. The savings account is owned by the individual who creates the account, so employees retain their HSA balances if they leave their job. See https://www.federalregister.gov/d/2019-08017/p-850 For those enrolled in an HDHP/HSA, see https://www.irs.gov/pub/irs-pdf/p969.pdf
There is no legal requirement for the minimum deductible in a plan offered with an HRA. The survey defines a high-deductible HRA plan as a plan with a deductible of at least $1,000 for single coverage and $2,000 for family coverage. Federal law requires a deductible of at least $1,500 for single coverage and $3,000 for family coverage for HSA-qualified HDHPs in 2024 (or $1,400 and $2,800, respectively, for plans in their 2023 plan year). Not all firms’ plan years correspond with the calendar year, so some firms may report a plan with limits from the prior year. See definitions at the end of this Section for more information on HDHP/HRAs and HSA-qualified HDHPs.↩︎
The definitions of HDHP/SOs do not include other consumer-driven plan options, such as arrangements that combine an HRA with a lower-deductible health plan or arrangements in which an insurer (rather than the employer as in the case of HRAs or the enrollee as in the case of HSAs) establishes an account for each enrollee. Other arrangements may be included in future surveys as the market evolves.↩︎
The survey asks “Up to what dollar amount does your firm promise to contribute each year to an employee’s HRA or health reimbursement arrangement for single coverage?” We refer to the amount that the employer commits to make available to an HRA as a contribution for ease of discussion. As discussed, HRAs are notional accounts, and employers are not required to actually transfer funds until an employee incurs expenses. Thus, employers may not expend the entire amount that they commit to make available to their employees through an HRA. Some employers may make their HRA contribution contingent on other factors, such as completing wellness programs.↩︎
Section 9: Prescription Drug Benefits
Nearly all (99%) covered workers are at a firm which provides prescription drug coverage to enrollees in its largest health plan. Over time, employer plans have incorporated more complex benefit designs for prescription drugs as employers and insurers expand the use of formularies with multiple cost-sharing tiers, as well as other management approaches. To reduce the burden on respondents, we ask offering firms about the attributes of prescription drug coverage only for their largest health plan. This survey asks employers about the cost-sharing in up to four tiers, plus, if applicable, a tier exclusively for specialty drugs. Some plans may have more than one tier for specialty drugs or other variations that are not captured in the survey. There also may be other areas of variation in how plans structure their formularies that are not captured.
DISTRIBUTION OF COST SHARING
The large majority of covered workers (89%) are in a plan with tiered cost sharing for prescription drugs [Figure 9.1]. Cost-sharing tiers generally refer to a health plan placing a drug on a formulary or preferred drug list that classifies drugs into categories that are subject to different cost sharing or management. Commonly, there are different tiers for generic, preferred and non-preferred drugs. In recent years, plans have created additional tiers that may be used for specialty drugs or more expensive drugs such as biologics. Some plans may have multiple tiers for different categories.
Eighty-six percent of covered workers are in a plan with three, four, or even more tiers of cost sharing for prescription drugs [Figure 9.1]. These totals include tiers that cover only specialty drugs, although the cost-sharing information for the specialty tier is reported separately below.
Compared to covered workers in other plan types, those in HDHP/SOs are more likely to be in a plan that has no cost sharing for prescriptions once the plan deductible is met (11% vs. 2%) [Figure 9.2].
Small firms are more likely to have no cost sharing after the deductible is met compared to large firms (8% vs. 3%) [Figure 9.2].
Figure 9.1: Distribution of Covered Workers Facing Different Cost-Sharing Formulas for Prescription Drug Benefits, 2017-2024
Figure 9.2: Distribution of Covered Workers Facing Different Cost-Sharing Formulas for Prescription Drug Benefits, by Plan Type and Plan Size, 2024
TIERS NOT EXCLUSIVELY FOR SPECIALTY DRUGS
Even when formulary tiers covering only specialty drugs are not counted, a large share (83%) of covered workers are in a plan with three or more tiers of cost sharing for prescription drugs. The cost-sharing statistics presented in this section do not include information about tiers that cover only specialty drugs. In cases in which a plan covers specialty drugs on a tier with other drugs, they will be included in these averages. Cost-sharing statistics for tiers covering only specialty drugs are presented separately below.
For covered workers in a plan with three or more tiers of cost sharing for prescription drugs, copayments are the most common form of cost sharing in the first three tiers and coinsurance is the second-most common [Figure 9.3].
Among covered workers in plans with three or more tiers of cost sharing for prescription drugs, the average copayment is $12 for first-tier drugs, $36 second-tier drugs, $65 for third-tier drugs, and $128 for fourth-tier drugs [Figure 9.6].
Among covered workers in plans with three or more tiers of cost sharing for prescription drugs, the average coinsurance rate is 22% for first-tier drugs, 27% for second-tier drugs, 35% for third-tier drugs, and 33% for fourth-tier drugs [Figure 9.6].
Five percent of covered workers are in a plan with two tiers for prescription drug cost sharing (excluding tiers covering only specialty drugs).
For these workers, copayments are more common than coinsurance in both tiers [Figure 9.3]. The average copayment is $11 for the first tier and $39 for the second tier. [Figure 9.6].
Four percent of covered workers are in a plan with the same cost sharing for prescriptions regardless of the type of drug (excluding tiers covering only specialty drugs) [Figure 9.2].
Among these workers, 53% have copayments and 47% have a coinsurance rate [Figure 9.3].
Figure 9.3: Among Covered Workers With Prescription Drug Coverage, Distribution With the Following Types of Cost Sharing for Prescription Drugs, 2024
Figure 9.4: Among Covered Workers With Three or More Tiers of Prescription Drug Cost Sharing, Distribution With the Following Types of Cost Sharing, by Firm Size, 2024
Figure 9.5: Among Covered Workers With Three or More Tiers of Prescription Drug Cost Sharing, Distribution With the Following Types of Cost Sharing, by Plan Type, 2024
Figure 9.6: Among Covered Workers With Prescription Drug Coverage, Average Copayments and Coinsurance, 2024
COINSURANCE MAXIMUMS
Coinsurance rates for prescription drugs often include maximum and/or minimum dollar amounts. Depending on the plan design, coinsurance maximums can significantly limit the amount an enrollee must spend out-of-pocket for higher-cost drugs. Even in plans without explicit coinsurance maximum amounts, the overall plan out-of-pocket maximum limits enrollee cost sharing on covered services, including prescription drugs.
These coinsurance minimum and maximum amounts vary across tiers and plan designs.
For example, among covered workers in a plan with coinsurance for the third cost-sharing tier, 32% have only a maximum dollar amount attached to the coinsurance rate, 7% have only a minimum dollar amount, 30% have both a minimum and maximum dollar amount, and 30% have neither. For those in a plan with coinsurance for the fourth cost-sharing tier, 56% have only a maximum dollar amount attached to the coinsurance rate, 2% have only a minimum dollar amount, 11% have both a minimum and maximum dollar amount, and 30% have neither [Figure 9.7].
Figure 9.7: Distribution of Coinsurance Structures for Covered Workers Facing a Coinsurance for Prescription Drugs, 2024
SEPARATE TIERS FOR SPECIALTY DRUGS
Specialty drugs, such as biologics that may be used to treat chronic conditions or some cancer drugs, can be quite expensive and often require special handling and administration. In 2016, we revised our survey questions to obtain more information about formulary tiers that are exclusively for specialty drugs. We are reporting results only among large firms because small firm respondents had large shares of “don’t know” responses to some of these questions.
Ninety-seven percent of covered workers at large firms have coverage for specialty drugs, the same percentage as last year. Among these workers, 65% are in a plan with at least one cost-sharing tier just for specialty drugs [Figure 9.8].
Among covered workers at large firms in a plan with at least one separate tier for specialty drugs, 41% have a copayment for specialty drugs and 55% have coinsurance [Figure 9.10]. The average copayment is $118 and the average coinsurance rate is 25% [Figure 9.11]. Sixty-five percent of those with coinsurance have a maximum dollar limit on the amount of coinsurance they must pay.
Figure 9.8: Among Large Firms With Prescription Drug Coverage, Percentage of Workers With Coverage for Specialty Drugs, 2024
Figure 9.9: Among Large Firms Whose Prescription Drug Coverage Includes Specialty Drugs, Percentage of Covered Workers Enrolled in a Plan That Has a Separate Tier for Specialty Drugs, by Firm Size, 2024
Figure 9.10: Among Covered Workers at Large Firms Enrolled in a Plan With a Separate Tier for Specialty Drugs, Distribution of the Following Types of Cost Sharing, by Firm Size, 2024
Figure 9.11: Among Covered Workers at Large Firms Enrolled in a Plan With a Separate Tier for Specialty Drugs, Average Copayments and Coinsurance, by Firm Size, 2017 & 2024
PRESCRIPTION DRUG ADMINISTRATION
Firms with 50 or more workers that offer coverage for prescriptions were asked about several attributes of their prescription drug coverage. Among the covered workers in these firms:
Forty-four percent are enrolled in a plan that reduces or waives cost sharing for prescription drugs needed to maintain health for one or more chronic illnesses, such as insulin products for diabetics [Figure 9.12]. Firms with 5,000 or more workers are more likely to have this policy (51%) [Figure 9.13].
Fifty-eight percent are enrolled in a plan that has incentives such as lower cost sharing to encourage enrollees to fill prescriptions through a mail-order pharmacy. Firms with 5,000 or more workers are more likely to have this policy (65%) while firms with 50 to 199 workers are less likely to have this policy (44%) [Figure 9.15].
Eighteen percent are enrolled in a plan that limits coverage for some medications only to those received through a mail-order pharmacy [Figure 9.14].
Thirty-one percent are enrolled in a plan that offers coverage for lower cost, mail-order generics, either as part of the plan or through a third- party vendor, such as “Mark Cuban Cost Plus” or “GoodRx” [Figure 9.16].
Figure 9.12: Percentage of Covered Workers With Reduced or No Cost-Sharing for Maintenance Drugs, by Firm Size, 2024
Figure 9.13: Among Covered Workers With Prescription Drug Coverage at Large Firms, Percentage of Covered Workers With Reduced or No Cost-Sharing for Maintenance Drugs, Within Firm Size, 2019-2024
Figure 9.14: Percentage of Covered Workers Whose Plan Only Covers Some Drugs Through Mail Order Pharmacies, by Firm Size, 2024
Figure 9.15: Percentage of Covered Workers With Financial Incentives to Fill Prescriptions at Mail-Order Pharmacies, by Firm Size, 2024
Figure 9.16: Percentage of Covered Workers Whose Plan Offers Coverage for Lower Cost Mail Order Generics, by Firm Size, 2024
Generic drugs Drugs that are no longer covered by patent protection and thus may be produced and/or distributed by multiple drug companies.
Preferred drugs Drugs included on a formulary or preferred drug list; for example, a brand-name drug without a generic substitute.
Non-preferred drugs Drugs not included on a formulary or preferred drug list; for example, a brand-name drug with a generic substitute.
Fourth-tier drugs New types of cost-sharing arrangements that typically build additional layers of higher copayments or coinsurance for specifically identified types of drugs, such as lifestyle drugs or biologics.
Specialty drugs Specialty drugs such as biological drugs are high cost drugs that may be used to treat chronic conditions such as blood disorder, arthritis or cancer. Often times they require special handling and may be administered through injection or infusion.
Section 10: Plan Funding
Many firms, particularly larger firms, choose to pay for some or all of the health services of their workers directly from their own funds rather than by purchasing health insurance to cover them. This is called self-funding. Both public and private employers can use self-funding to provide health benefits. Federal law (the Employee Retirement Income Security Act of 1974, or ERISA) exempts self-funded plans established by private employers (but not public employers) from most state insurance laws, including reserve requirements, mandated benefits, premium taxes, and some consumer protection regulations. In 2024, 63% of covered workers are in a self-funded health plan. Some employers which sponsor self-funded plans purchase stoploss coverage to limit their liabilities.
In recent years, a complex funding option, often called level-funding, has become more widely available to small employers. Level-funded arrangements are nominally self-funded options that package together a self-funded plan with extensive stoploss coverage that significantly reduces the risk retained by the employer. Thirty-six percent of covered workers in small firms (3-199 workers) are in a level-funded plan in 2024.
SELF-FUNDED PLANS
Sixty-three percent of covered workers are in a plan that is self-funded, similar to the percentage (65%) last year [Figure 10.2].
The percentage of covered workers enrolled in self-funded plans is similar to the percentages five years ago (61%) and ten years ago (61%) [Figure 10.2].
As expected, covered workers in large firms are significantly more likely to be in a self-funded plan than covered workers in small firms (79% vs. 20%) [Figure 10.1] and [Figure 10.3].
Figure 10.1: Percentage of Covered Workers Enrolled in a Self-Funded Plan, by Firm Size, 2024
Figure 10.2: Percentage of Covered Workers Enrolled in a Self-Funded Plan, by Firm Size, 1999-2024
Figure 10.3: Percentage of Covered Workers Enrolled in a Self-Funded Plan, by Firm Size, Region, and Industry, 2024
Figure 10.4: Percentage of Covered Workers Enrolled in a Self-Funded Plan, by Plan Type and Firm Size, 2024
Figure 10.5: Percentage of Covered Workers Enrolled in a Self-Funded Plan by Firm Ownership Type, 2024
LEVEL-FUNDED PLANS
In recent years, insurers have been offering health plans that provide a nominally self-funded option for small and mid-sized employers that incorporates stoploss insurance with relatively low attachment points. In these arrangements, the insurer calculates an expected monthly expense for the employer, which includes a share of the estimated annual cost for benefits, premiums for the stoploss protection, and an administrative fee. The employer pays this “level premium” amount, with the potential for some reconciliation between the employer and the insurer at the end of the year, although small employers are often protected from any meaningful additional liability. These policies are sold as self-funded plans, so they generally are not subject to state requirements for insured plans and, for those sold to employers with fewer than 50 employees, are not subject to the rating and benefit standards in the ACA for small firms.
Due to the complexity of the funding (and regulatory status) of these plans, and because employers often pay a monthly amount that resembles a premium, respondents may be confused as to whether or not their health plan is self-funded or insured. There also may be confusion because different plan administrators (generally insurers) use different labels to refer to these arrangements. We asked employers with fewer than 200 workers whether they have a level-funded plan.
Forty-two percent of small firms that report offering health benefits offer a level-funded plan in 2024. This amount is not statistically different from the percentage (34%) last year.
The apparent instability in the small firm estimate results from responses of the relatively few firms with 3 to 9 workers that offer health coverage. Among firms with 10 to 199 workers that offer health benefits, 37% offer a level-funded plan in 2024, similar to the percentage 39% last year.
Thirty-six percent of covered workers in small firms are enrolled in a level-funded plan in 2024, similar to the percentage last year [Figure 10.6] and [Figure 10.8]. Forty-six percent of covered workers in small firms are enrolled in either a level-funded plan or a self-insured plan, the same as the percentage last year [Figure 10.7] and [Figure 10.8].
Figure 10.6: Among Covered Workers at Small Firms, Percentage Enrolled in a Level-Funded or Self-Funded Plan, by Firm Size, 2024
Figure 10.7: Among Covered Workers at Small Firms, Percentage Enrolled in a Level-Funded or Self-Insured Plan, by Firm Size, 2024
Figure 10.8: Among Covered Workers at Small Firms, Percentage Enrolled in a Level-Funded or Self-Funded Plan, 2018-2024
STOPLOSS COVERAGE
Employers purchase insurance, often referred to as “stoploss” coverage, to protect themselves from unexpected losses for claims incurred by a self-funded plan. There are different types of stoploss; for example a stoploss policy may cover any amount that the plan sponsor must pay over a specified amount for each worker or enrollee (referred to as specific stoploss coverage) or it may limit the total amount the plan sponsor must pay for all claims in the plan over the plan year (referred to as aggregate stoploss coverage). Stoploss coverage also may be focused on particular types of claims (e.g., transplants). A firm may have more than one type of stoploss coverage.
At large firms (200 or more workers), 75% of covered workers in self-funded health plans are in plans that have stoploss insurance, similar to the percentage last year (67%) [Figure 10.10]. Covered workers in firms with 5,000 or more workers are less likely than covered workers in smaller firms to be in a plan with stopless insurance [Figure 10.9].
Figure 10.9: Among Covered Workers Enrolled in a Self-Funded Plan, Percentage Covered by Stoploss Insurance, by Firm Size, 2024
Figure 10.10: Among Covered Workers Enrolled in a Self-Funded Plan, Percentage Covered by Stoploss Insurance (At Firms With 50 or More Workers), by Firm Size, 2011-2024
Section 11: Retiree Health Benefits
Retiree health benefits are an important consideration for older workers making decisions about retirement, and can be a crucial source of coverage for people retiring before Medicare eligibility. For retirees with Medicare coverage, retiree health benefits can provide an important supplement to Medicare, helping them pay for cost sharing and benefits not otherwise covered by Medicare.
Twenty-four percent of large firms offering health benefits offer retiree health benefits in 2024, similar to the percentage in 2023 (21%).
This survey asks retiree health benefits questions only of large firms (200 or more workers).
EMPLOYER RETIREE BENEFITS
In 2024, 24% of large firms that offer health benefits offer retiree health benefits for at least some current workers or retirees [Figure 11.1]. In 2019, we modified the question about retiree health benefits to instruct firms to respond “yes” if they were providing coverage for retirees but weren’t offering current employees these benefits, or if they were planning to give current employees retiree health coverage in the future. For this reason, estimates of retiree health benefits from 2019 and after are not comparable to prior survey estimates.
Retiree health benefits offer rates vary considerably by firm characteristics.
Among large firms offering health benefits, firms with 1,000 or more workers are more likely to offer retiree health benefits than those with 200 to 999 workers (36% v. 21%) [Figure 11.2].
The share of large firms offering retiree health benefits varies considerably by industry [Figure 11.2].
Among large firms offering health benefits, public employers are more likely (65%) and private for-profit employers are less likely (10%) to offer retiree health benefits than other firm types [Figure 11.3].
Large firms offering health benefits with at least some union workers are more likely to offer retiree health benefits than large firms without any union workers (47% vs. 17%) [Figure 11.3].
Large firms offering health benefits with a relatively large share of older workers (where at least 35% of the workers are age 50 or older) are more likely to offer retiree health benefits than large firms with a smaller share of older workers (29% vs. 20%) [Figure 11.3].
Figure 11.1: Among Large Firms Offering Health Benefits to Active Workers, Percentage of Firms Offering Retiree Health Benefits, 1988-2024
Figure 11.2: Among Large Firms Offering Health Benefits to Active Workers, Percentage of Firms Offering Retiree Health Benefits, by Firm Size, Region, and Industry, 2024
Figure 11.3: Among Large Firms Offering Health Benefits to Active Workers, Percentage of Firms Offering Retiree Health Benefits, by Firm Characteristics, 2024
COVERAGE FOR EARLY RETIREES AND MEDICARE-AGE RETIREES
Among large firms offering retiree health benefits to active workers and retirees, 91% offer benefits to early retirees under the age of 65 and 64% offer them to Medicare-age retirees [Figure 11.4].
Among large firms offering retiree health benefits, 59% offer benefits to both early and Medicare-age retirees.
Among all large firms offering health benefits, 15% offer retiree health benefits to Medicare-age retirees.
Figure 11.4: Among Large Firms Offering Health Benefits to Active Workers and Retirees, Percentage of Firms Offering Health Benefits to Early and Medicare-Age Retirees, 2000-2024
BENEFIT ELIGIBILITY
Among large firms offering retiree benefits, a large share (83%) report offering health benefits to the spouses of retirees [Figure 11.5].
Figure 11.5: Among Large Firms Offering Health Benefits to Active Workers and Retirees, Percentage of Firms Offering Retiree Health Benefits to Retirees’ Spouse, by Firm Size, 2024
MEDICARE ADVANTAGE
Fifty-six percent of large employers offering retiree health benefits to Medicare-age retirees offer coverage to at least some Medicare-age retirees through a contract with a Medicare Advantage plan, similar to last year (52%) [Figure 11.7]. This share has more than doubled since 2017 (26%).
Among large firms offering retiree health benefits through a Medicare Advantage plan, 53% offer retiree health benefits only through Medicare Advantage plans while 47% offer a choice of other types of plans for retiree for retiree health benefits [Figure 11.9]. Both of these shares are similar to last year.
Among large firms offering retiree health benefits through a Medicare Advantage plan, 56% said to the best of their knowledge that the shift to offering Medicare Advantage plans lowered their per retiree costs, 11% said the shift to Medicare Advantage plans did not lower their per retiree costs, while 33% did not know the answer [Figure 11.10].
Among large firms offering retiree health benefits that do not offer benefits through a Medicare Advantage plan in 2024, 6% are “Very Likely” or “Somewhat Likely” to do so in the next two years [Figure 11.8].
Figure 11.6: Among Large Firms That Offer Retiree Health Benefits to Medicare-Age Retirees, Percentage of Firms That Contract With a Medicare Advantage (MA) Plan, 2024
Figure 11.7: Among Large Firms That Offer Retiree Health Benefits to Medicare-Age Retirees, Percentage of Firms That Contract With a Medicare Advantage (MA) Plan, 2017-2024
Figure 11.8: Among Large Firms Offering Retiree Benefits But Not Currently Contracting With a Medicare Advantage (MA) Plan, Percentage of Firms Which Plan to Start Offering Medicare-Age Retirees Health Benefits Through a Medicare Advantage Plan in the Next Two Years, 2024
Figure 11.9: Among Large Firms Offering Retiree Benefits Through a Contract With a Medicare Advantage Plan, Percentage of Firms Which Offer Workers a Choice, 2024
Figure 11.10: Among Large Firms Offering Retiree Benefits Through a Contract With a Medicare Advantage Plan, Percentage of Firms Which Believe the Shift to Medicare Advantage Lowered the Cost Per Retiree, 2024
Section 12: Health Screening and Health Promotion and Wellness Programs
Most large firms offer some form of wellness program to help workers and their family members identify health issues and manage chronic conditions. Some employers believe that improving the health of workers and their family members can improve well-being and productivity, as well as reduce health care spending.
In addition to offering wellness programs, many large firms offer health screening programs. These include health risk assessments, which are questionnaires asking workers about lifestyle, stress, or physical health, and biometric screenings, which we define as in-person health examinations conducted by a medical professional. Firms and insurers may use the health information collected during screenings to target wellness offerings or other health services to workers with certain conditions or behaviors. Some firms have incentive programs that reward or penalize workers for different activities, including participating in wellness programs or completing health screenings.
Among large firms (more than 200 workers) offering health benefits in 2024, 56% offer workers the opportunity to complete a health risk assessment, 44% offer workers the opportunity to complete a biometric screening, and 79% offer workers one or more wellness programs, such as programs to help them stop smoking or lose weight, or lifestyle and behavioral coaching. Substantial shares of these firms provide incentives for workers to participate in or complete the programs.
Only firms offering health benefits were asked about their wellness and health promotion programs.
HEALTH RISK ASSESSMENTS
Many firms give their workers the option to complete a health risk assessment to identify potential health issues. Health risk assessments generally include questions about medical history, health status, and lifestyle. At small firms, health risk assessments are often administered by an insurer.
Among firms offering health benefits, 31% of small firms and 56% of large firms provide workers with the option to complete a health risk assessment, similar to the percentages last year. The percentage of large firms giving workers this opportunity remains lower than the pre-pandemic level for large firms in 2019 (56% vs. 65%) [Figure 12.1].
Among large firms giving workers the opportunity to complete a health risk assessment, firms with 5,000 or more workers are more likely to do so (72%) and firms with 200 to 999 workers are less likely to do so (55%) [Figure 12.1].
Some firms offer incentives to encourage workers to complete a health risk assessment.
Among large firms that offer a health risk assessment, 54% use incentives or penalties to encourage workers to complete the assessment, similar to the percentage (59%) last year [Figure 12.2].
Figure 12.1: Among Firms Offering Health Benefits, Percentage of Firms That Provide an Opportunity to Complete a Health Risk Assessment, by Firm Size, 2024
Figure 12.2: Among Firms Offering Health Benefits and Providing an Opportunity to Complete a Health Risk Assessment (HRA), Percentage of Firms That Offer Workers Incentives to Complete the HRA, by Firm Size, 2024
BIOMETRIC SCREENING
Biometric screening is a health examination that measures a person’s risk factors (such as cholesterol, body mass index (BMI), or blood pressure) for certain medical issues. A biometric screening involves assessing whether the person meets specified health targets (“biometric outcomes”) related to certain risk factors, such as meeting a target BMI or cholesterol level. As defined by this survey, goals related to smoking are not included in the biometric screening questions.
Among firms offering health benefits, 9% of small firms and 44% of large firms provide workers the opportunity to complete a biometric screening [Figure 12.3]. These percentages are similar to those last year, but the percentage of large employers with a biometric screening program remains lower than the pre-pandemic level in 2019 (52%) [Figure 12.5].
With increases in remote work, some firms developed options for workers to complete biometric screening remotely. Among firms providing workers the opportunity to complete a biometric screening, 62% allow employees to complete the screening remotely [Figure 12.4]
Some firms with biometric screening programs offer incentives to encourage workers to complete the screening.
Among large firms with a biometric screening program, 65% use incentives or penalties to encourage workers to complete the assessment, similar to the percentage year (67%) [Figure 12.6].
In addition to incentives for completing a biometric screening, some firms offer workers incentives to meet biometric outcomes, such as maintaining a certain cholesterol level or body weight.
Among large firms with a biometric screening program, 14% have incentives or penalties tied to whether workers meet specified biometric outcomes [Figure 12.6].
Figure 12.3: Among Firms Offering Health Benefits, Percentage of Firms That Provide an Opportunity to Complete a Biometric Screening, by Firm Size, 2024
Figure 12.4: Among Firms Offering Health Benefits and Providing an Opportunity to Complete a Biometric Screening, Percentage of Firms That Allow the Screening to Be Completed Remotely, by Firm Size, 2024
Figure 12.5: Among Large Firms Offering Health Benefits, Percentage of Firms That Provide an Opportunity to Complete Biometric Screening, 2012-2024
Figure 12.6: Among Large Firms Offering Health Benefits and Providing an Opportunity to Complete a Biometric Screening, Percentage of Firms With Incentives to Complete the Screening or Achieve Biometric Outcomes, by Firm Size, 2024
HEALTH SCREENING PROGRAMS
Among firms offering health benefits, 64% of large firms offer workers a health risk assessment, biometric screening, or both, similar to the percentage last year (63%) [Figure 12.9].
Figure 12.7: Among Large Firms Offering Health Benefits, Percentage of Firms That Provide an Opportunity to Complete a Biometric Screening or a Health Risk Assessment, by Region and Industry, 2024
Figure 12.8: Among Large Firms Offering Health Benefits, Percentage With Health Screening Programs, 2024
Figure 12.9: Among Large Firms Offering Health Benefits, Percentage With Either a Health Risk Assessment or a Biometric Screening, 2013-2024
WELLNESS AND HEALTH PROMOTION PROGRAMS
Large shares of employers offer wellness and health promotion programs to help workers engage in healthy lifestyles and reduce health risks. These may include exercise programs, health education classes, health coaching, and stress-management counseling. These programs may be offered directly by the firm, or by an insurer or third-party contractor.
Among firms offering health benefits, 40% of small firms and 69% of large firms offer programs to help workers stop smoking or using tobacco, 34% of small firms and 62% of large firms offer programs to help workers lose weight, and 33% of small firms and 70% of large firms offer some other lifestyle or behavioral coaching program. Overall, 54% of small firms and 79% of large firms offering health benefits offer at least one of these three programs [Figure 12.10] and [Figure 12.11].
Forty-six percent of large firms offering one of these wellness or health promotion programs offer an incentive for workers to participate in or complete the program, similar to the percentage 46% last year [Figure 12.13].
Figure 12.10: Among Firms Offering Health Benefits, Percentage of Firms Offering Specific Wellness Programs to Their Workers, by Firm Size and Region, 2024
Figure 12.11: Among Firms Offering Health Benefits, Percentage of Firms Offering Specific Wellness Programs to Their Workers, by Firm Size, 2024
Figure 12.12: Among Firms Offering Health Benefits, Percentage of Firms Offering Wellness Programs, by Firm Size, 2015-2024
Figure 12.13: Among Firms Offering Specific Wellness Programs, Percentage of Firms That Offer Incentives to Participate in or Complete Wellness Programs, by Firm Size, 2024
Figure 12.14: Among Large Firms Offering Health Benefits, Percentage of Firms Offering Various Wellness and Health Promotion Activities and Incentives, by Firm Size, 2024
Section 13: Employer Practices, Provider Networks, Coverage For Glp-1s, Abortion and Family Building Benefits
Employers frequently review and modify their health plans to incorporate new options or adapt to new circumstances. The topics this year include: questions about concierge services; centers of excellence; telemedicine; plan network adequacy; access to mental health services; prescription drug practices, including GLP-1 agonists; price information for plan enrollees; gender-affirming hormonal therapy; access to abortion and related services; benefits for family-building services; and programs to increase affordability for lower-wage workers.
CONCIERGE SERVICES
Some firms contract with a third-party vendors outside of their health plans to offer concierge services to their employees. These services can include helping enrollees navigate plan services, advocating for enrollees as patients and providing medical opinions or options. Twenty-nine percent of firms with 200 or more workers that offer health benefits contract with a vendor offering concierge services to their covered workers in 2024 [Figure 13.1]. Firms with 1,000 or more workers were more likely to contract with a concierge service vendor than smaller firms (37% v. 28%).
Figure 13.1: Percentage of Large Firms Which Contract With a Patient Advocacy Vendor, by Firm Size, 2024
CENTERS OF EXCELLENCE
“Centers of Excellence” are facilities or providers which health plans and employers identify as providers of exceptionally high-value specialty care for specific conditions. Plans and employers may encourage or require enrollees to use these designated providers to receive coverage for certain types of care. Centers of excellence may provide care that is particularly complex or specialized, such as organ transplants, or care that employers and health plans believe may be subject to abuse or poor care delivery, such as care for musculoskeletal injuries.
Among firms with 200 or more workers that offer health benefits, 19% said that they offered a center of excellence program in 2024 [Figure 13.2]. Firms with fewer than 1,000 workers are less likely to offer a centers of excellence program (16%) and firms with 1,000-4,999 and 5,000 or more workers are more likely to offer such a program (29% and 39%, respectively) [Figure 13.2].
Some firms with centers of excellence programs require enrollees to use a centers of excellence to receive benefits for defined services. Among firms with 200 or more workers with a centers of excellence program, 19% require enrollees to use to use a center of excellence to be covered for one or more specified services [Figure 13.3].
Among firms with 200 or more workers with a centers of excellence program, 26% reimburse travel costs for employees using services at a center of excellence. Firms with 5,000 or more workers are more likely to reimburse travel for enrollees using these services than all smaller firms (46% v. 24%) [Figure 13.3].
Figure 13.2: Percentage of Large Firms With a Center of Excellence Program, by Firm Size, 2024
Figure 13.3: Coverage and Policies for Firm’s Center of Excellence (Coe) Program, by Firm Size, 2024
TELEMEDICINE
We define telemedicine as the delivery of health care services through telecommunications from a provider to a patient who is at a remote location, including video chat and remote monitoring. This generally does not include the mere exchange of information via email, exclusively web-based resources, or online information that a plan may make available, unless a health professional provides information specific to the enrollee`s condition.
Among firms with 50 or more workers offering health benefits, 8% of smaller firms (50-199 workers) and 13% of larger firms (200 or more workers) contracted with a new telemedicine service provider within the last 12 months. Firms with 5,000 or more workers are more likely to have contracted with a new telemedicine service provider than smaller employers (18%) [Figure 13.4].
With the effects of the pandemic waning, medical services are generally available on an in-person basis. With this context, we asked employers how important they felt telemedicine would be in providing care to employees going forward.
Among firms with 50 or more workers offering health benefits, 28% believe that telemedicine services will be ‘very important’, 33% believe that they will be ‘important’, 26% believe that they will ‘somewhat important’, 8% believe that they will be ‘not important’, with 4% responding ‘don’t know’ [Figure 13.5].
Firms with 1,000 or more workers are more likely to believe that telemedicine will be ’very important” providing care to employees going forward (40% v. 27%) [Figure 13.5].
Figure 13.4: Among Firms Offering Health Benefits, Percentage of Firms Which Have Contracted With a New Telemedicine Service Provider in the Last 12 Months, by Firm Size, 2024
Figure 13.5: Among Firms Offering Health Benefits, How Important the Firm Believes Telehealth Will Be in Delivering Care Going Forward, by Firm Size, 2024
PROVIDER NETWORKS
Firms and health plans structure their networks of providers to ensure access to care, and to encourage enrollees to use providers who are lower cost, or who provide better care.
Some employers offer high-performance networks or tiered networks. These types of networks use cost-sharing or other incentives to encourage enrollees to use in-network providers that have better performance or quality or have lower costs.
Among firms with 50 or more workers that offer health benefits, 20% have a high-performance network or tiered network as part of their health plan with the largest enrollment in 2024 [Figure 13.6]. This is higher than the percentage five years ago (14%) [Figure 13.7].
Firms with 1,000 or more workers are more likely to include a high-performance or tiered network in their largest health plan than are smaller firms (27% v. 20%).
Some employers offer a health plan with a relatively small, or narrow, network of providers to their employees. Narrow network plans limit the number of providers that can participate in order to reduce costs, and are generally more restrictive than standard HMO networks.
Among firms that offer health benefits, 6% offer a health plan that can be considered a narrow network in 2024, similar to the percentage (9%) last year.
Firms with 1,000 or more workers are more likely to offer a narrow network plan than are smaller firms (13% v. 6%).
Employers that offer health benefits were asked to characterize the breadth of the provider network in their plan with the largest enrollment. Employers were also asked to characterize the network’s breadth for services for mental health and substance use conditions.
Fifty-four percent of firms characterize the network in their plan with the largest enrollment as ‘very broad’, 35% say it is ‘somewhat broad’, and 10% say it is ‘somewhat narrow’ or ‘very narrow’ [Figure 13.10].
Firms with 200 or more workers are more likely than smaller firms to characterize the provider network in their plan with the largest enrollment as “very broad” (68% v. 54%). The share of large firms characterizing the provider network in their plan with the largest enrollment as “very broad” is similar to percentage in 2022.
Employers that offer health benefits are less likely to characterize their network with the largest enrollment as ‘very broad’ for mental health and substance use condition services than for medical services overall.
Thirty percent of firms characterize the network in their plan with the largest enrollment as ‘very broad’ for mental health and substance use condition services, 45% say it is ‘somewhat broad’ for these services, and 24% say it is ‘somewhat narrow’ or ‘very narrow’ [Figure 13.10].
Firms with 200 or more workers are more likely than smaller firms to characterize the provider network in their plan with the largest enrollment as “very broad” for mental health and substance use condition services (46% v. 30%). The share of large firms characterizing the provider network in their plan with the largest enrollment as “very broad” is higher than the percentage in 2022 (46% v. 30%).
Figure 13.6: Percentage of Firms Whose Largest Plan Includes a High-Performance or Tiered Provider Network, by Firm Size, 2024
Figure 13.7: Percentage of Firms Whose Largest Plan Includes a High-Performance or Tiered Provider Network, by Firm Size, 2007-2024
Figure 13.8: Percentage of Firms That Offer a Narrow Network Plan, by Firm Size, 2024
Figure 13.9: Among Firms Offering Health Benefits, Percentage of Firms That Offer a Narrow Network Plan, by Firm Size, 2014-2024
Figure 13.10: How Broad the Firm Considers Their Largest Plan’s Provider Network, by Firm Size, 2024
ACCESS TO SERVICES FOR MENTAL HEALTH AND SUBSTANCE USE CONDITIONS
Firms with 50 or more workers that offer health benefits were asked whether they had taken steps within the last 12 months to add in-network providers to treating mental health and substance use conditions.
Fourteen percent of firms with 50 or more workers that offer health benefits took steps to add in-person care for these services. Small firms (50-199 workers) are less likely to have taken steps to add in-network, in-person care and large firms (200 or more workers) are more likely to have done so. A consistent share of respondents across firm sizes did not know the answer to this question [Figure 13.11].
Twenty-three percent of firms with 50 or more workers that offer health benefits took steps to add telehealth care for these services. Firms with 50 to 199 workers are less likely to have taken steps to add in-network telehealth care and larger firms (200 or more workers) are more likely to have done so. A consistent share of respondents did not know the answer to this question [Figure 13.11].
In addition to a health plan many employers sponsor Employee Assistance Programs (EAP). These programs help employees with personal or work-related problems, including mental health support, counseling, and stress management. Among firms with 200 or more workers that offer health benefits, 48% increased the number of mental health counseling resources available to employees through an employee assistance program or some other third-party vendor. Firms with 5,000 or more workers were more likely than smaller firms to have increased the number of mental health counseling resources (61%) [Figure 13.12].
Figure 13.11: Percentage of Firms Which Have Taken Any Steps to Increase the Number of Mental Health or Substance Use Providers, by Firm Size, 2024
Figure 13.12: Percentage of Firms Which Expanded the Number of Mental Health Counseling Resources Available Through an Eap or Third-Party Vendor, by Firm Size, 2024
PRESCRIPTION DRUGS
The cost of prescription drugs is a significant challenge for employers and families. Recent policy options have focused on the complexity involving the delivery and pricing of prescription drugs and the lack of transparency about the true price for individual prescriptions. We asked employers about two issues related to price transparency, prescription drug rebates and programs operated by drug manufacturers to assist patients with the cost of prescriptions.
Rebates are payments made by drug manufacturers to insurers, pharmacy benefit managers (PBMs), and employers that reduce the actual price of the drugs, usually in exchange for favorable placement on health plan formularies. Some payers are concerned that insurers and PBMs may not be passing all of the rebates they collect onto the ultimate payers. Some drug manufacturers operate or fund programs to reduce the costs of prescriptions for patients. Some of these programs are aimed at lower income or uninsured patients, while others assist people with coverage who still may face high out-of-pocket costs. Some drug manufacturers provide coupons to patients who are prescribed their drugs. Coupons are discounts that prescription users can present at the pharmacy that reduce their cost sharing liability. Some payers are concerned that coupons and other patient assistance programs affect the financial incentives employees otherwise may have to use lower cost drugs.
Among firms with 500 or more workers that offer health benefits in 2024, 19% say that they receive ‘most’ of the prescription drug rebate negotiated by their PBM or health plan, 27% say that they receive ‘some’ of the negotiated rebate, 16% say that they receive ‘very little’ of the negotiated rebate, and 37% do not know [Figure 13.13].
Only one-in-three of firms with 5,000 or more workers say that they receive ‘most’ of the prescription drug rebates negotiated by their PBM or health plan [Figure 13.13].
Firms with 1,000 or more workers are relatively more likely to say that they receive ‘most’ of the drug rebates negotiated by their PBM or health plan. Firms with less than 1,000 workers are less likely to say this.
Some firms have programs, sometimes referred to as “copay accumulator programs”, which do not count amounts paid by an enrollee with a manufacturer coupon when calculating whether the enrollee has met their deductible or out-of-pocket limit.
Among firms with 500 or more workers offering health benefits in 2024, 17% have copay accumulator or similar programs for their health plan with the largest enrollment, 55% reported that they did not and 27% did not know [Figure 13.14].
Firms with 5,000 or more workers are relatively more likely to have a copay accumulator or similar program while firms with 500 to 999 workers are relatively less likely to have such a program.
Figure 13.13: Firms View Over How Much of Prescription Drug Rebates Negotiated by Pbms Does the Firm Receive As Savings, by Firm Size, 2024
Figure 13.14: Percentage Large Firms With a Copay Accumlator Program for Prescription Drugs, by Firm Size, 2024
GLP-1 DRUG COVERAGE FOR WEIGHT LOSS
GLP-1 agonists, used to help control blood sugar levels in people with type 2 diabetes, have also been shown to be an effective drug to help people lose weight. Common brand names include Ozempic, Wegovy, Mounjaro, Saxenda, and Victoza. Health plans generally have covered these medications when prescribed for people with diabetes, but there has been a growing interest in the extent to which employer plans and other payers cover them for people who have a clinical need to lose weight. The high cost of these drugs, combined with potential for long-term usage, has raised questions about the potential costs to plans that cover them.
Firms with 200 or more workers that offer health benefits were asked about their coverage of GLP-1 agonists when used primarily for weight loss.
Among these firms, 18% cover GLP-1 agonists when used primarily for weight loss [Figure 13.15].
Firms with 200 to 999 workers are more likely not to know whether their firm provided this coverage compared to larger firms (35% v. 15%) [Figure 13.5].
Firms with 200 or more workers that provide coverage for GLP-1 agonists primarily for weight loss were asked if they had certain conditions or requirements associated with covering these medications.
Twenty-four percent of these firms require employees to meet with a professional, such as a dietitian, psychologist, case worker, or therapist (otherwise known as case management) before approving a GLP-1 drug prescription [Figure 13.16].
Eight percent of these firms require employees to enroll in a lifestyle or weight loss program for a period of time before approving a GLP-1 drug prescription [Figure 13.16].
Ten percent of these firms require employees to enroll in lifestyle or weight loss program while taking GLP-1 drugs [Figure 13.16].
Twenty-six percent of these firms have some other type of condition or requirement [Figure 13.16]. When asked to provide examples of other conditions on covering GLP-1 for weight-loss, many respondents indicated that they had prior authorization programs and may have more restrictive eligibility requirements such as a higher BMI threshold.
Twenty-eight percent of these firms did not know if there were any conditions or requirements [Figure 13.16].
Among these firms with 200 or more workers that provide coverage for GLP-1 agonists primarily for weight loss, 53% have some type of condition or requirement associated with covering these medications [Figure 13.16].
Among firms with 200 or more workers that cover GLP-1 agonists primarily for weight loss, 33% say that covering these medications for weight loss will have a “significant impact” on their prescription drug spending, 33% say that it will have a “moderate impact”, 20% say that it will have a “minor impact”, 3% say that it will have “no impact”, and 11% do not know what the impact will be [Figure 13.18].
Firms with 5,000 or more workers are more likely than smaller firms to say that covering these medications for weight loss will have a “significant” impact on their prescription drug spending (58% v. 31%). Firms with 200 to 999 workers were less likely to say that covering these medications for weight loss will have a “significant” impact on prescription drug spending [Figure 13.18].
Among firms with 200 or more workers offering health benefits, 16% say that covering these medications for weight loss will be “very important” for employees’ satisfaction with their health plan, 28% say that it will be “important”, 32% say that it will be “slightly important”, 10% say that it will be “not important”, and 13% say that they do not know how important it will be [Figure 13.19].
Among firms with 200 or more workers that do not provide coverage for GLP-1 agonists primarily for weight loss, 62% say that they are “not likely” to begin covering these medications for weight loss within the next twelve months, 23% say that they are “somewhat likely” to do so, 3% say that they are “very likely” to do so, and 11% do not know [Figure 13.20].
Figure 13.15: Percentage of Firms Whose Largest Plan Includes Coverage for Glp-1 Agonists When Used Primarily for Weight Loss, by Firm Size, 2024
Figure 13.16: Percentage of Firms Who Require Steps to Be Taken Before Glp-1 Agonist Coverage for Weight Loss Is Approved, 2024
Figure 13.17: Percentage of Larger Firms Who Require Steps to Be Taken Before Glp-1 Agonist Coverage for Weight Loss Is Approved, 2024
Figure 13.18: Firms View On How Much of an Impact Glp-1 Agonists Will Have On Prescription Drug Spending, by Firm Size, 2024
Figure 13.19: Firms View On the Importance of Glp-1 Agonist Coverage for Weight Loss On Enrollee Satisfaction With Plans, by Firm Size, 2024
Figure 13.20: Among Firms Not Covering Glp-1 Angonists for Weight Loss, Firm Views On How Likely It Is Add Coverage in the Next 12 Months, by Firm Size, 2024
COVERAGE FOR GENDER-AFFIRMING HORMONE THERAPY
Among firms with 200 or more workers that offer health benefits, 24% cover gender affirming hormone therapy in their health plan with the largest enrollment in 2024 [Figure 13.21].
Employers with 1,000 or more workers are more likely than smaller firms to cover gender affirming hormone therapy (35% v. 21%).
Substantial shares of firms did not know whether or not these services covered (45%) [Figure 13.21].
Figure 13.21: Percentage of Firms Whose Largest Plan Covers Gender Affirming Hormone Therapy, by Firm Size, 2024
ABORTION SERVICES
In June 2022, the Supreme Court of the United States issued the Dobbs v. Jackson decision, overturning Roe v. Wade, eliminating the federal constitutional right to abortion in the United States, and allowing states to set their own policies protecting or banning abortion 20. This ruling and subsequent state activity to limit access to abortion services has increased public interest in coverage for abortion services in employer plans.
Firms with 200 or more workers that offer health benefits were asked which of several statements best describes coverage of abortion in their health plan with the largest enrollment.
Twenty-nine percent of these firms said that legally provided abortions are covered in most or all circumstances (sometimes referred to as elective or voluntary abortion). Firms with 5,000 or more workers were more likely than smaller firms to give this reply while firms with 200 to 999 workers were less likely to do so [Figure 13.22].
Eighteen percent of these firms said that legally provided abortions are covered only under limited circumstances, such as rape, incest, or danger to the health or life of the pregnant enrollee. Firms with 5,000 or more workers were more likely than smaller firms to give this reply while firms with 200 to 999 workers were less likely to do so [Figure 13.22].
Eight percent of these firms said that legally provided abortions are not covered under any circumstance [Figure 13.22]. Firms reporting that legally provided abortions are not covered were asked to confirm that their largest plan would not cover abortion under any circumstance, even in states where abortion was legal. In total, 81% verified this was their policy.
Forty-five percent of these responding firms answered “don’t know” to this question. Firms with 200 to 999 workers were more likely than other firms to answer “don’t know” to this question and firms with 5,000 or more workers were less likely to do so [Figure 13.22].
Among firms with 200 or more workers that offer health benefits, 5% provide, or plan to provide, financial assistance for travel expenses for enrollees who travel out of state to obtain abortion care if they do not have access near their home. This share is similar to last year. Firms with 5,000 or more workers are more likely than smaller firms to say they provide or plan to provide travel benefits for enrollees who travel out of state to obtain an abortion (21% vs. 5%) [Figure 13.23].
Figure 13.22: Percentage of Firms Whose Largest Plan Covers Legally Provided Abortion, by Firm Size, 2024
Figure 13.23: Percentage of Firms That Provide, or Plan to Provide, Financial Assistance for Travel Expenses for Enrollees Who Travel Out of State to Obtain an Abortion, by Firm Size, 2024
COVERAGE FOR FAMILY BUILDING SERVICES
Employers were asked if they provide any coverage for certain family-building services in their plan with the largest enrollment or through a third-party vendor. Even if employers responded yes to these questions, we don’t know what percentage of these services they cover. Out-of-pocket costs for family building services, even with some amount of coverage, can still be very expensive.
Among firms with 200 or more workers that offer health benefits,
37% have coverage for fertility medications [Figure 13.24].
26% have coverage for intrauterine insemination [Figure 13.24].
27% have coverage for in-vitro fertilization [Figure 13.24].
12% have coverage for cryopreservation, sometimes called egg or sperm freezing [Figure 13.24].
13% have coverage for adoption services [Figure 13.24].
7% have coverage for other family-building services [Figure 13.24].
For each of these services, the share that did not know whether the service is covered decreased with firm size category, with firms with 200 to 999 workers having fairly high rates of “do not know”.
Figure 13.24: Percentage of Firms Which Cover Family Building Benefits, 2024
Figure 13.25: Percentage of Larger Firms Which Cover Family Building Benefits, 2024
PRICE AND COST SHARING INFORMATION FOR ENROLLEES
New federal rules will require health plans (including self-funded plans) to make information available to enrollees about the estimated cost of services and cost-sharing on a “real-time” basis. Large employers (200 or more workers) were asked about the potential effectiveness of these new requirements.
Among firms with 200 or more workers that offer health benefits, 41% say that providing employees with additional information about the cost of services will help their health care decision making “a great deal”, 38% say that it will help their decision making “somewhat”, 15% say that it will help their decision making “very little”, and 2% say that it will help their decision making “not at all” [Figure 13.26].
Among firms with 200 or more workers that offer health benefits, 13% say that the new requirements will reduce health spending “a great deal”, 50% say that the new requirements will reduce health spending “somewhat”, 24% say that the new requirements will reduce health spending “very little”, 7% say that the new requirements will reduce health spending “not at all”. [Figure 13.27].
Figure 13.26: Firms View On the Impact of Providing Employees With Additional Information About the Cost of Services Will Have On Health Care Decision Making, by Firm Size, 2024
Figure 13.27: Firms’ View of How Much Transparency Rules Will Reduce Healthcare Spending, by Firm Size, 2024
ASSISTANCE FOR LOWER-WAGE WORKERS
Some firms have programs to improve the affordability of premium contributions and cost-sharing for their lower-wage workers.
Among firms with 200 or more workers offering health benefits, 6% have a program that reduces cost sharing for lower-wage workers [Figure 13.28].
Among firms with 200 or more workers offering health benefits, 14% have a program that reduces premium contributions for lower-wage workers [Figure 13.28].
Employers with 5,000 or more workers are relatively more likely to have a program that reduces premium contributions for lower-wage workers while employers with 200 to 999 employees are relatively less likely to have such a program [Figure 13.28].
Among firms with 200 or more workers offering health benefits, 14% offer a plan with reduced benefits and a low premium contribution to make it affordable for lower-wage workers [Figure 13.28].
Figure 13.28: Percentage of Firms Which Have Programs to Help Lower Wage Workers Pay for Health Expenses, by Firm Size, 2024
KFF research has consistently found prescription drug costs to be an important health policy area of public interest and concern. Our polls find that most people take at least one prescription drug and most see their benefits to society, yet majorities see these drugs as too expensive and three in ten struggle to afford their medicines. The public has historically supported many different approaches to lowering prescription drug costs, including allowing Medicare to negotiate prices, a core component of the Inflation Reduction Act (IRA) passed in 2022. However, more than two years after passage of the IRA, majorities of the public remain unaware of the drug pricing provisions that were part of the law.
Below are some key findings on the public’s experience with and perceptions of prescription drugs and their prices.
Prescription drugs touch the lives of most people in the U.S. in some way. About six in ten adults say they are currently taking at least one prescription drug, and a quarter say they currently take four or more prescription medications.
In addition to taking prescription drugs themselves, the public generally sees the benefits of these medicines. About six in ten (63%) adults believe prescription drugs developed over the past 20 years have generally made the lives of people in the U.S. better while a much smaller share (21%) say they’ve made them worse.
Despite seeing their general benefits to society, about eight in ten adults (82%) say the cost of prescription drugs is unreasonable, and the public sees profits made by pharmaceutical companies as the largest factor contributing to these prices. About eight in ten adults or more across partisans say profits made by pharmaceutical companies are a “major factor” in the price of prescription drugs. This is followed by more than half who say the cost of research and development is a “major factor” contributing to the price, and about half saying the same about the cost of marketing and advertising.
Just over half (55%) of adults are worried about being able to afford their family’s prescription drug costs, including a quarter (26%) who are “very” worried. Larger shares of Black and Hispanic adults report being worried about affording prescription drug costs (61% and 69% respectively) compared with White adults, half of whom report being worried. A somewhat larger share of adults under the age of 65 without insurance (67%) report being worried about affording prescription drug costs, but still more than half (54%) of those who have insurance say they worry about these costs.
While about two-thirds (65%) of adults overall say it is very or somewhat easy to afford their prescription drug costs, affordability is a bigger issue for those who are currently taking four or more prescription medicines. Nearly four in ten (37%) of those taking four or more prescription drugs say they have difficulty affording their prescriptions, compared with one in five (18%) adults who currently take three or fewer prescription medications. Adults with an annual household income of less than $40,000 are also more likely than adults with higher incomes to report difficulty affording their prescription medications.
About three in ten adults report not taking their medicines as prescribed at some point in the past year because of the cost. This includes about one in five who say they have not filled a prescription (21%) or took an over-the counter drug instead (21%), and 12% who say they have cut pills in half or skipped a dose because of the cost.
The share who report not filling a prescription, taking an over-the-counter drug instead, or cutting pills in half or skipping doses increases to about four in ten among adult ages 18-29 (40%), Hispanic adults (39%), those taking four or more prescription drugs (37%), and those living in households with an annual income of less than $40,000 (37%).
The July 2023 KFF Tracking Poll finds three in four adults saying there is “not as much regulation as there should be” when it comes to limiting the price of prescription drugs. While partisans often disagree on how much government regulation there should be in other areas, majorities across partisans, including eight in ten Democrats (82%), and about two-thirds of Republicans (68%) and independents (67%) say there is “not as much regulation as there should be” when it comes to limiting the price of prescription drugs.
For decades, lawmakers have debated drug pricing legislation, with the Inflation Reduction Act, or IRA, marking the first major piece of recent legislation aimed at lowering prescription drug prices. Before the IRA was passed in 2022, majorities across partisans supported a wide range of proposals including allowing the federal government to negotiate with drug companies to get a lower price on medications for people with Medicare, a major feature of the IRA. Historically, majorities have also favored increasing taxes on drug companies that refuse to negotiate the price of their drugs with the government, limiting how much drug companies can increase the price of drugs based on annual inflation rates, allowing Americans to buy drugs imported from Canada, placing an annual limit on out-of-pocket drug costs for people with Medicare, and making it easier for generic drugs to come to market.
As of September 2024, most voters continue to be unaware of the Medicare drug pricing provisions in the IRA, that was passed by Congress and signed into law by President Biden in 2022, though awareness of some of the provisions is higher among older voters – the group most impacted by the provisions.
Four in ten voters are aware there is a federal law in place that caps the cost of insulin for people with Medicare at $35 per month, while about a third (35%) are aware of the law that requires the federal government to negotiate the price of some prescription drugs for people with Medicare. About a quarter of voters (27%) are aware of the federal law that places an annual limit on out-of-pocket prescription drug costs for people with Medicare, and one in eight (12%) are aware that there is a law in place that penalizes drug companies for increasing prices faster than the rate of inflation for people with Medicare. Compared to younger voters, larger shares of voters ages 65 and older are aware of some of these drug pricing provisions of the IRA, most notably the $35 out-of-pocket cap on insulin, which 61% of older voters are aware is part of current law.
Overall, almost nine in ten (85%) voters support authorizing the federal government to negotiate drug prices for people with Medicare as the IRA does, while one in seven (14%) oppose. This provision is supported by 92% of Democratic voters, 89% of independent voters, and 77% of Republican voters.
Majorities of voters, overall and across partisanship, support two proposals that would build on the IRA by extending some of its provisions beyond those covered by Medicare. About three-quarters (77%) of voters support a proposal to expand the $35 cap on out-of-pocket costs for insulin beyond those with Medicare, including majorities of Democratic voters (84%), independent voters (79%), and Republican voters (70%). About seven in ten (69%) voters support a proposal to expand the $2,000 annual limit on out-of-pocket prescription drug costs beyond those with Medicare, including 83% of Democrats, 70% of independents, and 58% of Republicans.
CMS has just released information about Medicare Part D plans for 2025, including plan availability and premiums for the coming year. While CMS’s headline emphasized stability in terms of average Part D premiums, a quick review of the data shows that many insurers are increasing premiums for their stand-alone drug plan offerings, but not across the board. Some major plan sponsors, including Aetna and UnitedHealthcare, are also reducing their stand-alone prescription drug plan offerings, and overall, there will be fewer PDPs in 2025 than in 2024 – 524 plans nationwide, down from 709 in 2024.
Normally the release of the Medicare plan “landscape file” is a somewhat sleepy late September occurrence, but there was greater anticipation of this year’s release due to uncertainty around the impact on premiums of changes to the Part D benefit under the Inflation Reduction Act that are taking effect in 2025. These changes include a new $2,000 cap on out-of-pocket drug spending for Part D enrollees and an increase in the share of high drug costs paid for by insurers. While Part D enrollees stand to benefit from enhanced financial protection for their drug costs, concerns were raised that the changes in the benefit design would lead insurers to significantly increase premiums for Part D coverage, especially for Medicare’s stand-alone prescription drug plans.
A comprehensive KFF analysis will follow in the future, but it appears that premium increases for 2025 were moderated due to a new Biden-Harris administration Part D premium stabilization demonstration for PDPs, which capped premium increases at $35 per month along with other measures. However, looking at premium changes for a few of the more popular plans shows a mixed picture across plans, with premium decreases in some cases (based on premiums in California; monthly premiums and premium changes vary by state) (Figure 1):
The monthly premium for the most popular PDP nationally, Wellcare Value Script, is increasing by $17 in California, from $0.40 to $17.40.
The second most popular PDP, Aetna’s SilverScript SmartSaver, will no longer be offered nationwide in 2025. Enrollees in that plan will be switched into Aetna’s sole PDP offering for 2025, SilverScript Choice, unless they choose a different plan, and their monthly premium will increase from $18.60 to $53.60, a $35 increase. But enrollees currently in SilverScript Choice will see their premium decrease by $1.60 between 2024 and 2025.
Enrollees in another popular PDP, Humana’s Value Rx Plan, will see their premiums increase by $35, from $59 to $94.
At most, stand-alone drug plan premiums are increasing by $35 per month over 2024 levels, due to the premium stabilization demonstration. According to CMS, virtually all PDP enrollees are in plans sponsored by insurers that opted to participate in the voluntary demonstration. In the absence of this demonstration, premium increases would certainly have been larger. In California, enrollees in 8 of the 16 national PDPs offered in 2024 will see their premiums increase by $35 if they do not switch to a different plan in 2025, while enrollees in 6 other national PDPs in 2024 will see a premium reduction.With 57% of all Part D enrollees in Medicare Advantage drug plans in 2024 and 43% in stand-alone PDPs, most Part D enrollees are not likely to face increases of this magnitude. This is because Medicare Advantage plans can use rebate dollars from the federal government to reduce premiums for prescription drug coverage. According to CMS, Medicare Advantage drug plan premiums for 2025 are holding steady at considerably lower levels than stand-alone drug plans, on average, with many plans charging zero premium as in previous years.
Changes in plan availability and premium increases for some of the more popular stand-alone drug plans are likely to bring about substantial enrollment shifts in the PDP market during this year’s open enrollment period, more so than in previous years when plan availability and premium changes overall were more modest. It’s also possible that premium increases for PDPs will lead to more enrollees switching from traditional Medicare to Medicare Advantage drug plans, accelerating the steady growth in the Medicare Advantage market.
Use of telehealth, which allows patients to see health care providers without being in the same location, has grown rapidly in recent years, among both privately-insured patients and Medicare beneficiaries. Prior to the COVID-19 pandemic, telehealth utilization in traditional Medicare was very low, but it rose dramatically in 2020 following temporary measures put in place at the start of the COVID-19 public health emergency that greatly expanded the scope of Medicare coverage of telehealth. Since early 2021 telehealth use has declined steadily, but it remains higher than pre-pandemic levels, with considerable variation by income level, race and ethnicity, and urban versus rural location, among other factors.
Congress has extended a number of pandemic-era flexibilities around Medicare coverage of telehealth beyond the COVID-19 public health emergency, which ended on May 11, 2023, but most of these flexibilities are due to expire in December 2024. There is bipartisan support for proposedlegislation to extend these provisions for another two years, and Congress is weighing the potential benefits, risks, and costs of permanently expanding Medicare coverage of telehealth services. Medicare beneficiaries are generally satisfied with their telehealth visits, and many health care providers are supportive of keeping these services accessible, but questions remain about the longer-term impact on patient care, Medicare spending, and program integrity.
These FAQs provide answers to key questions about the current scope of Medicare telehealth coverage, including both temporary and permanent changes adopted through legislation and regulation, and policy considerations that lie ahead.
What is the current scope of Medicare telehealth coverage and how did it change at the start of the COVID-19 pandemic?
Prior to the declaration of the COVID-19 public health emergency, Medicare coverage of telehealth was largely restricted to beneficiaries in rural areas and to certain types of providers, facilities, and services. At the time, beneficiaries were typically required to travel from their homes to approved clinical sites where they could receive care from providers at other locations. To make it easier and safer for beneficiaries to seek medical care during the pandemic, the Secretary of the Department of Health and Human Services (HHS) waived many of these restrictions in March 2020, enabling broader use of telehealth services for all Medicare beneficiaries. While the pandemic-related expansion of telehealth coverage under Medicare was initially due to expire at the end of the COVID-19 public health emergency, subsequent legislation extended many of these flexibilities through December 2024 and incorporated others into the program on a permanent basis (Figure 1).
The following list summarizes key provisions of current law related to coverage of telehealth in traditional Medicare, both temporary and permanent. (See section below for a discussion of telehealth coverage by Medicare Advantage plans.)
Temporary telehealth provisions (currently due to expire after December 31, 2024)
Waiver of geographic and “originating site” requirements: Telehealth is currently available to Medicare beneficiaries in both urban and rural areas, and patients can receive telehealth services from any location, including their home as the “originating site.” Prior to the expansion, telehealth coverage in traditional Medicare was limited to rural areas (with certain exceptions), and patients were required to travel to an approved originating site, such as a clinic or doctor’s office, when receiving telehealth services. (Providers participating in select accountable care organizations (ACOs) are permitted to waive these requirements under the Bipartisan Budget Act of 2018, and may continue to provide telehealth services without geographic restrictions, and to beneficiaries in their homes, should the current flexibilities expire.)
Expansion of covered telehealth services: Medicare currently offers coverage for an expanded set of telehealth services, including physical and occupational therapy, emergency department visits, and nursing facility care. Prior to the expansion, Medicare offered coverage for a more limited set of telehealth services, such as preventive health screenings, office visits, and psychotherapy. The Centers for Medicare & Medicaid Services (CMS) has the authority to expand the list of allowable telehealth services when there is a demonstrable clinical benefit and continues to evaluate select services for permanent inclusion on this list.
Coverage of audio-only services: Medicare currently allows a limited set of telehealth services to be provided to patients via audio-only platforms, such as a telephone or a smartphone without video. Prior to the expansion, Medicare required all telehealth services to be provided via a two-way audio/video connection, such as an interactive audio-video system or a smartphone with video enabled.
Expansion of eligible “distant site” telehealth providers: Currently, any health care provider who is eligible to bill for Medicare-covered services can provide and bill for telehealth as a “distant site” telehealth provider and may conduct an initial telehealth visit whether or not they have treated the beneficiary previously. Additionally, federally qualified health centers (FQHCs) and rural health clinics (RHCs) are now authorized to provide and bill for telehealth. Prior to the expansion, only physicians and certain other providers (e.g., physician assistants, clinical social workers, and clinical psychologists) were permitted to bill for telehealth services as the distant site provider and must have treated the beneficiary receiving those services within the last three years. FQHCs and RHCs were not authorized to serve as distant site providers but could serve as originating sites if located in a qualifying area.
Waiver of in-person visit requirement for behavioral health: Currently, Medicare beneficiaries receiving behavioral health services may opt to receive these services via telehealth with no in-person visit requirements. The Consolidated Appropriations Act of 2021 made numerous changes to Medicare coverage of behavioral telehealth (see below), including a provision that beneficiaries must have an in-person visit with their behavioral health provider no more than six months before their initial telehealth appointment and annually thereafter. Subsequent legislation delayed this requirement until January 2025.
Use of telehealth for hospice recertification: Patient recertification for the Medicare hospice benefit can currently be conducted via telehealth, provided there is a two-way audio/video connection that allows for real-time interaction between the patient and hospice provider. Prior to the expansion, only in-person encounters could be used for the purposes of hospice recertification.
Permanent telehealth provisions
Behavioral health: The Consolidated Appropriations Act of 2021 permanently removed geographic and originating site restrictions for any telehealth service used to diagnose, evaluate, or treat a mental health disorder. (These restrictions had already been lifted for treatment of substance use disorders and co-occurring mental health disorders in 2018). While many other provisions related to telehealth coverage expire at the end of 2024, Medicare beneficiaries may continue to receive behavioral health services from their homes, in both urban and rural areas, and may do so via audio-only platforms if they are unable to access a video connection or do not consent to video use. Additionally, FQHCs and RHCs are permanently allowed to serve as telehealth providers for behavioral health services.
What trends have emerged in Medicare beneficiaries’ use of telehealth services?
Telehealth use in traditional Medicare increased dramatically at the start of the COVID-19 public health emergency, with nearly half (46.7%) of all eligible beneficiaries receiving at least one telehealth service in the second quarter of 2020, compared to just 6.9% in the first quarter (Figure 2). While use has declined since that time, it remains nearly two times higher than pre-pandemic levels, with more than one in ten (12.7%) eligible beneficiaries receiving a telehealth service in the final quarter of 2023.
Use of telehealth services varies by geography, race and ethnicity, reason for Medicare eligibility, and dual enrollment in Medicare and Medicaid (Figure 3).
Geography: Rates of telehealth use in 2023 were higher among beneficiaries living in urban areas than those in rural areas (27% vs. 19%), which may be due in part to disparities in access to broadband and other communication technologies. Beneficiaries in rural or underserved areas may lack the infrastructure to support reliable video telehealth visits or the means to afford internet access, which may further impede access to telehealth if coverage of audio-only services is reduced or eliminated.
Race and ethnicity: Rates of telehealth use in 2023 were highest among Asian and Pacific Islander (31%) and Hispanic (30%) beneficiaries, and somewhat lower among Black (26%), American Indian or Alaska Native (25%), and non-Hispanic White beneficiaries (24%). Given that beneficiaries of color are more likely than non-Hispanic White beneficiaries to report difficulty accessing needed health services, telehealth use may help to improve access to care for certain groups.
Reason for Medicare eligibility: Rates of telehealth use in 2023 were higher among beneficiaries who qualify for Medicare based on having end-stage renal disease (ESRD) (37%) or a long-term disability (37%), relative to those who qualify based on age (23%). This may be due in part to higher overall rates of service use among people with ESRD and disabilities (whether in-person or via telehealth) but may also reflect a preference for telehealth services among these populations, or a greater ease of accessing care via telehealth relative to in-person care. Beneficiaries under age 65 who qualify for Medicare based on having long-term disabilities are more likely than older beneficiaries to report having three or more limitations in activities of daily living, and may be more likely to benefit from the increased flexibility of receiving health care services from their home via telehealth.
Dual-eligible individuals: Rates of telehealth use in 2023 were higher among beneficiaries dually eligible for both Medicare and Medicaid compared to Medicare beneficiaries who were not Medicaid-eligible (34% vs. 23%). Dual-eligible individuals are four times more likely than other Medicare beneficiaries to live on incomes of less than $20,000. Prior studies have found that having lower income or living in a socioeconomically deprived neighborhood is associated with higher rates of telehealth use, suggesting that telehealth may have the potential to improve health care access for beneficiaries with limited access to in-person services.
How does Medicare pay providers for telehealth services?
Medicare currently pays providers for telehealth services, both video and audio-only, at the same rate that would be paid if the service were delivered in person. As with most services paid under the Medicare physician fee schedule, payment rates for telehealth services currently vary based on the location of the provider, with services furnished by providers based in a non-facility setting, such as a doctor’s office, reimbursed at a higher rate than services furnished by providers based in a facility setting, such as a hospital outpatient department.
Prior to the COVID-related temporary expansion, Medicare paid for all covered telehealth services at the lower facility rate, regardless of provider location. This means that providers in non-facility settings currently receive higher payment for telehealth services than they did before the temporary expansion. However, assuming no change to current law, Medicare will resume paying for most telehealth services (with the exception of behavioral health services) at the lower facility rate beginning in January 2025. The Consolidated Appropriations Act of 2021 permanently established payment parity between in-person and telehealth services in the context of behavioral health. Should the current flexibilities expire, Medicare will continue to pay providers for behavioral telehealth services at the same rate they would receive if the service were delivered in person.
CMS permanently authorized FQHCs and RHCs to provide and bill for behavioral telehealth services in 2022. As with other types of providers, clinicians in these settings are paid the same rate for behavioral telehealth services as they would receive if the service were delivered in person on a permanent basis. However, for all other types of telehealth services, FQHCs and RHCs are only eligible for reimbursement through December 2024. Medicare currently pays FQHCs and RHCs at rates comparable to those set under the physician fee schedule, which are lower than what they would receive for comparable in-person care, since Medicare typically pays more for clinician services provided by FQHCs and RHCs than those provided in other types of settings.
How do Medicare Advantage plans cover telehealth?
Medicare Advantage plans are required to cover all Part A and Part B benefits covered under traditional Medicare, and have some flexibility to offer additional benefits as well, including telehealth benefits not routinely covered by traditional Medicare (outside of the current telehealth expansion), such as telehealth services provided to enrollees in their own homes, services provided outside of rural areas, and services provided through audio-only platforms.
Since 2020, Medicare Advantage plans have been permitted to include the costs associated with select telehealth services in their basic Medicare Part A and B benefit package, and may continue to do so after December 2024 regardless of the status of the temporary telehealth expansions in traditional Medicare. Telehealth services may be included in a plan’s basic benefits package if they meet certain requirements, such as coverage under Medicare Part B when the same service is provided in person. When these requirements are not met, plans may continue to offer supplemental telehealth benefits via remote access technologies and/or telemonitoring services, but must cover the cost of these benefits using rebates or supplemental premiums.
What additional steps have been proposed to expand Medicare coverage of telehealth?
Options to extend or make permanent many of the current flexibilities around Medicare coverage of telehealth have been the subject of a number of hearings in both the U.S. Senate and the House of Representatives. Bipartisan bills such as the Preserving Telehealth, Hospital, and Ambulances Act and the Telehealth Modernization Act of 2024 include provisions that would temporarily extend the current flexibilities through December 2026. However, outside of select changes, such as permanently allowing FQHCs and RHCs to provide non-behavioral telehealth services, neither bill provides for a permanent expansion of Medicare telehealth coverage.
The Biden-Harris Administration has announced additional measures to preserve telehealth access for Medicare beneficiaries, such as a grant program to support the development of an interstate licensure compact that would make it easier for licensed social workers to practice across state lines, and provisions in a recent CMS proposed rule that would permanently extend certain telehealth flexibilities, such as coverage of audio-only services that meet all other conditions for Medicare telehealth coverage. However, in the absence of Congressional action, implementation of these provisions will be limited to the types of providers, services, and settings where telehealth was permitted before the current flexibilities were put in place (with the exception of behavioral health flexibilities, which have been made permanent).
Related to licensure, Medicare providers are generally required to be licensed in any state where they are practicing, and this requirement extends to telehealth. In most cases, a distant site telehealth provider must be licensed in the state where the beneficiary receiving services is located when the telehealth visit takes place. However, certain states have taken action to develop multi-state licensure compacts, which has allowed for additional flexibility related to licensure in participating states. These compacts are formed when states agree upon a uniform standard of care and enact state laws which allow qualified providers to practice across state lines while maintaining a single license or to maintain multiple licenses or which expedite the process of gaining additional licensure across member states. These compacts may be continued beyond December 2024, though other restrictions may limit their use if the current flexibilities are allowed to expire.
What are the implications of telehealth for Medicare program integrity?
As policymakers weigh whether to extend or make permanent current flexibilities around Medicare coverage of telehealth, several questions have been raised about the impact of telehealth services on patient care quality and program spending, as well as the potential for fraud and overuse.
Since the current flexibilities were introduced, state and federal agencies have filed several lawsuits regarding the submission of fraudulent claims by telehealth companies to Medicare and other insurers. However, investigations by the HHS Office of the Inspector General (OIG) into provider billing patterns during the first year of the COVID-19 pandemic found that just 0.2% of providers who billed for a telehealth service during the period engaged in excessive billing patterns that posed a high risk to the Medicare program, and clinicians generally complied with Medicare requirements when providing Evaluation and Management services through telehealth, suggesting little evidence of widespread misuse to date. MedPAC has recommended that CMS take certain precautions if the current telehealth flexibilities are extended, such as applying additional scrutiny to “outlier” clinicians who deliver more telehealth services than others and requiring in-person visits before high-cost tests and medical equipment are paid for.
What is the expected impact of telehealth use on Medicare spending and the estimated cost of expanding coverage?
Expanding telehealth coverage is expected to lead to an increase in Medicare spending, but the overall magnitude in the long term is uncertain. Some telehealth services may replace in-person care, as in the case of behavioral health visits, but easier access to telehealth may also lead to an overall increase in use of services and higher costs. Prior research has found modest increases in clinical encounters and spending per person among Medicare beneficiaries in geographic areas and health systems with higher rates of telehealth use. At the same time, there is evidence to suggest that beneficiaries with greater access to telehealth services may have fewer emergency department visits and improved adherence to certain medications. Additional research would help policymakers and other interested parties determine whether any increases in Medicare spending as a result of expanded telehealth coverage are offset by improvements in quality of care or decreases in other costs, such as spending on preventable hospital admissions and other types of acute care services.
As policymakers weigh the implications of legislation to maintain or broaden Medicare coverage of telehealth, a key consideration is how to set payment rates for telehealth services across different care settings and provider types. Payment parity between in-person and telehealth services may encourage providers to invest more time and resources into telehealth, but some have raised questions about how to ensure that this investment does not come at the expense of patient care quality or access to in-person services for beneficiaries who prefer them. MedPAC has recommended that CMS return to paying the lower facility rate for most telehealth services, including those furnished by FQHCs and RHCs, and collect data on practice costs in order to adjust telehealth payment rates in the future. Where policymakers end up on these issues would likely affect the overall cost of extending or making permanent Medicare coverage of telehealth beyond 2024.


 Irving Washington
  Hagere Yilma


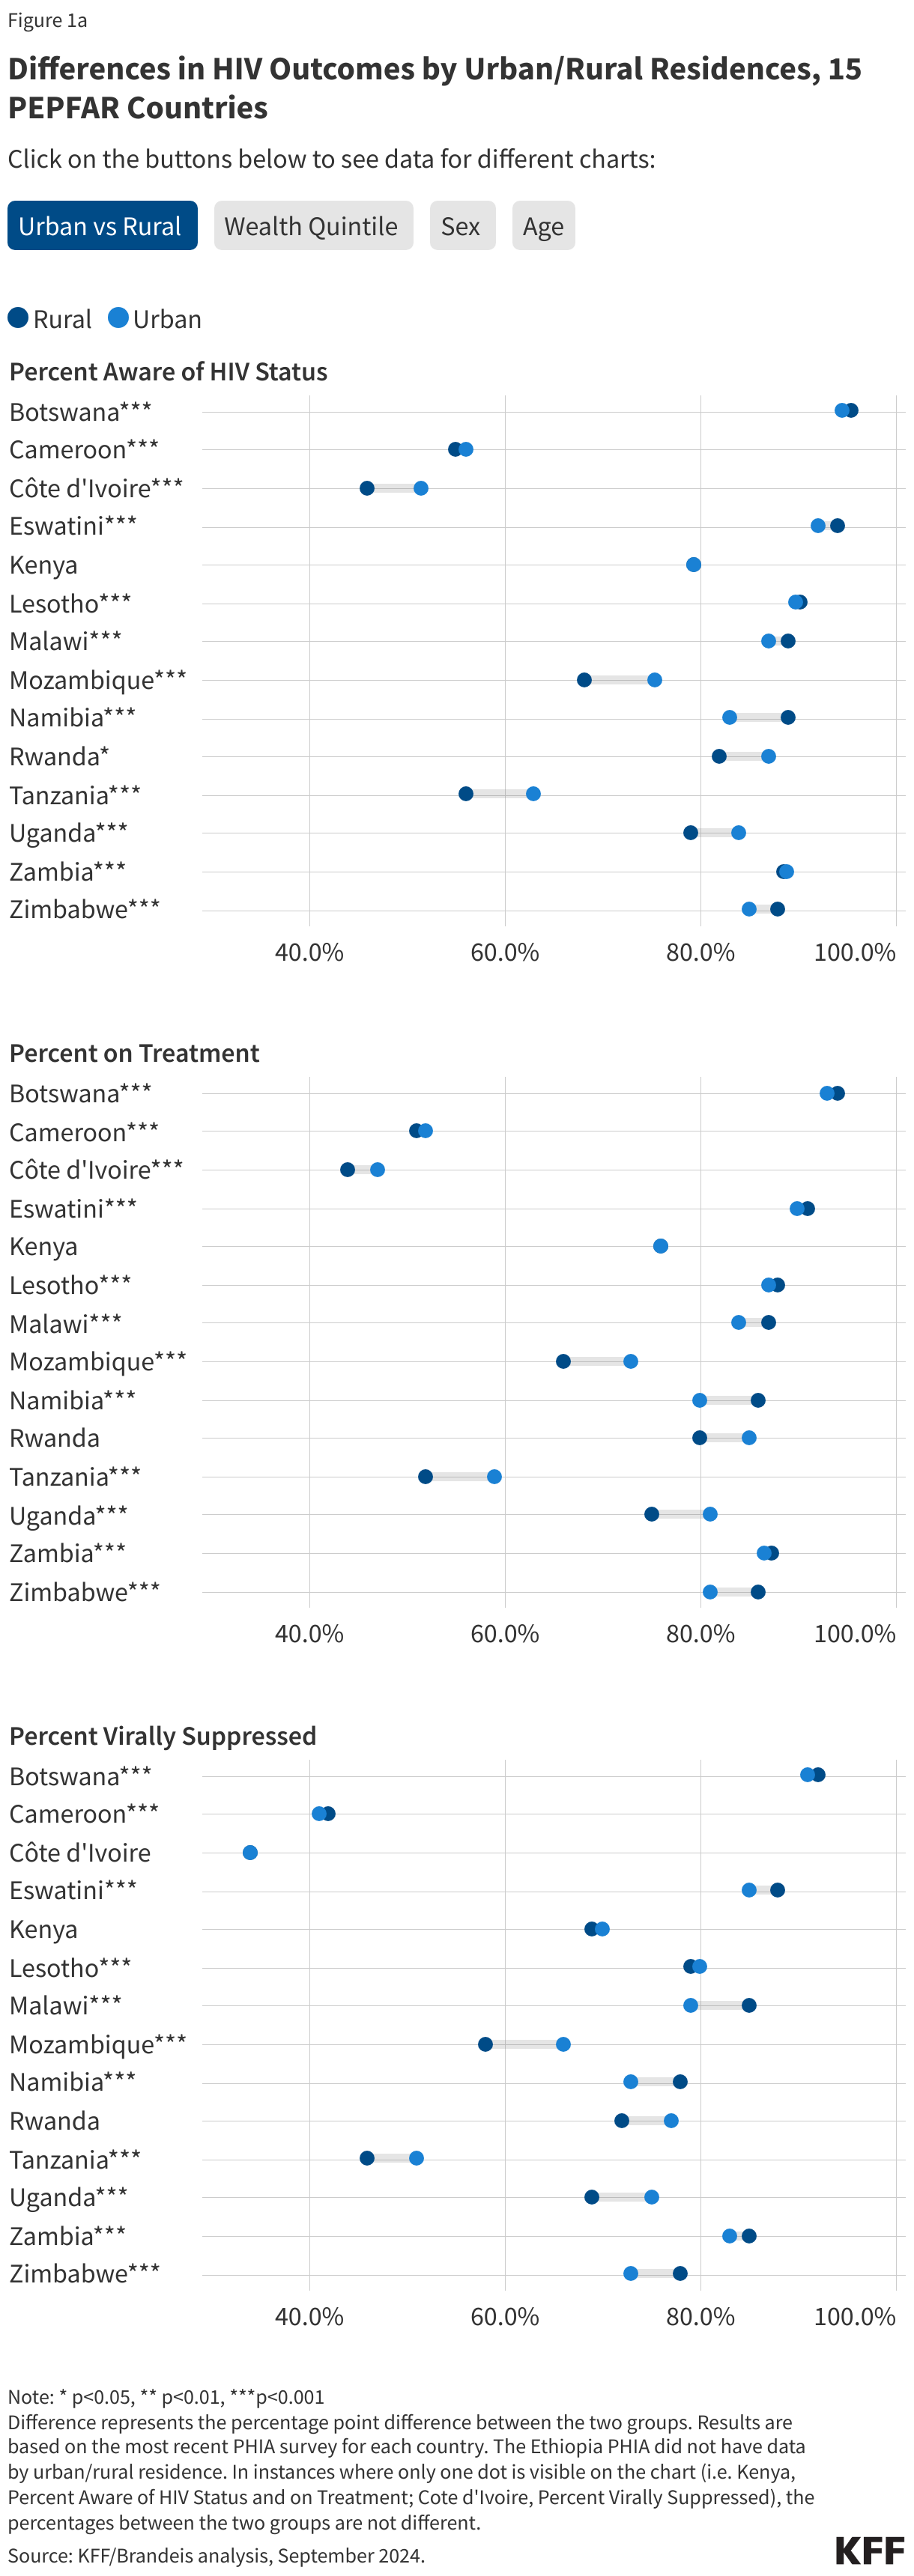
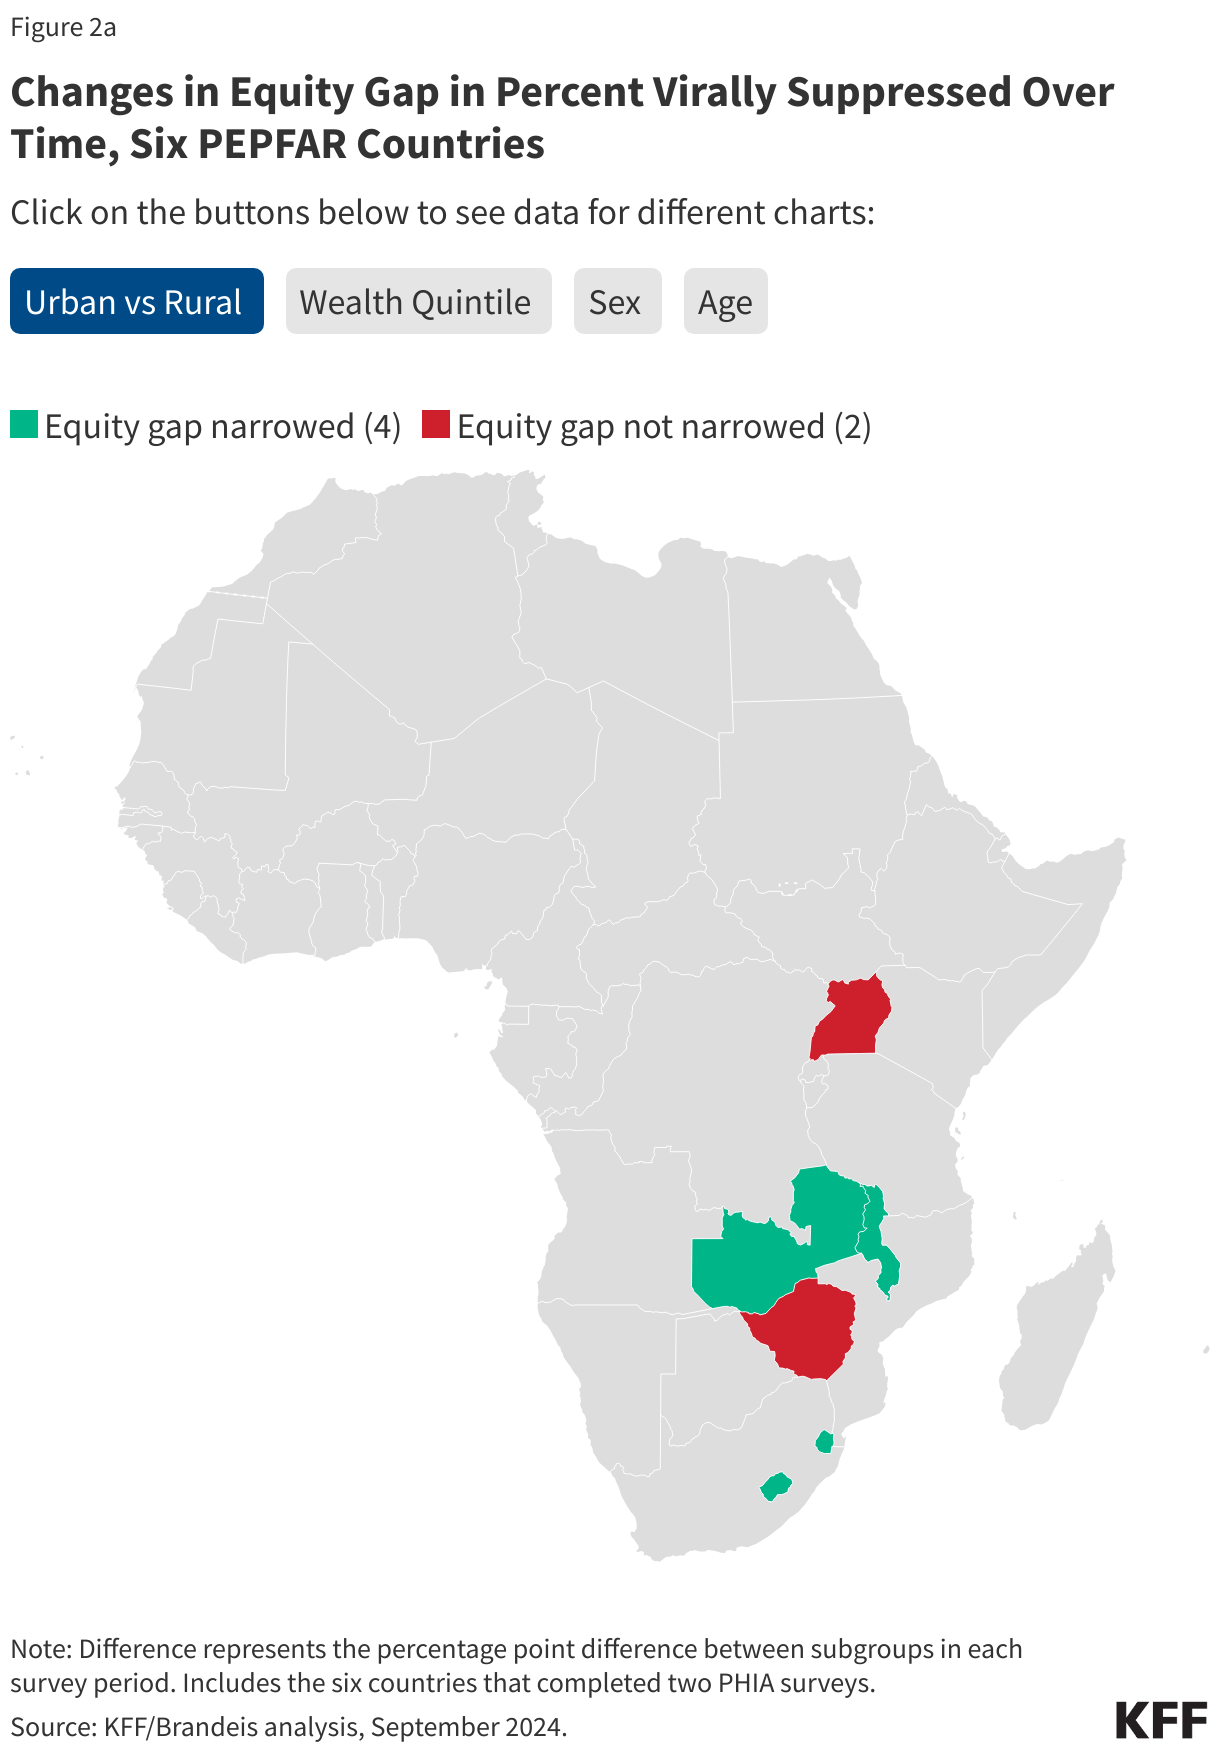
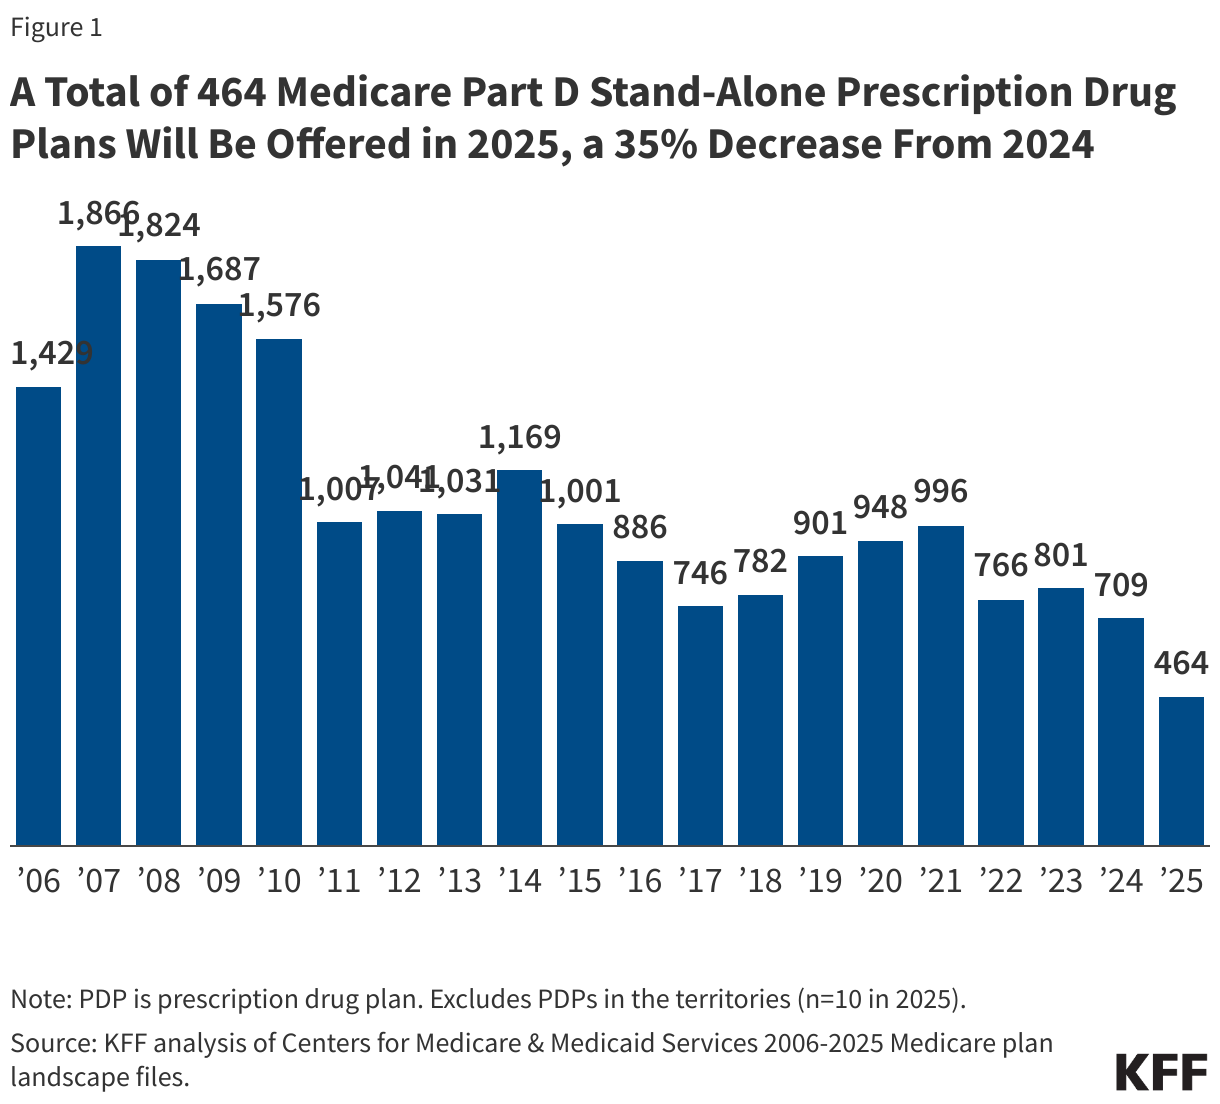
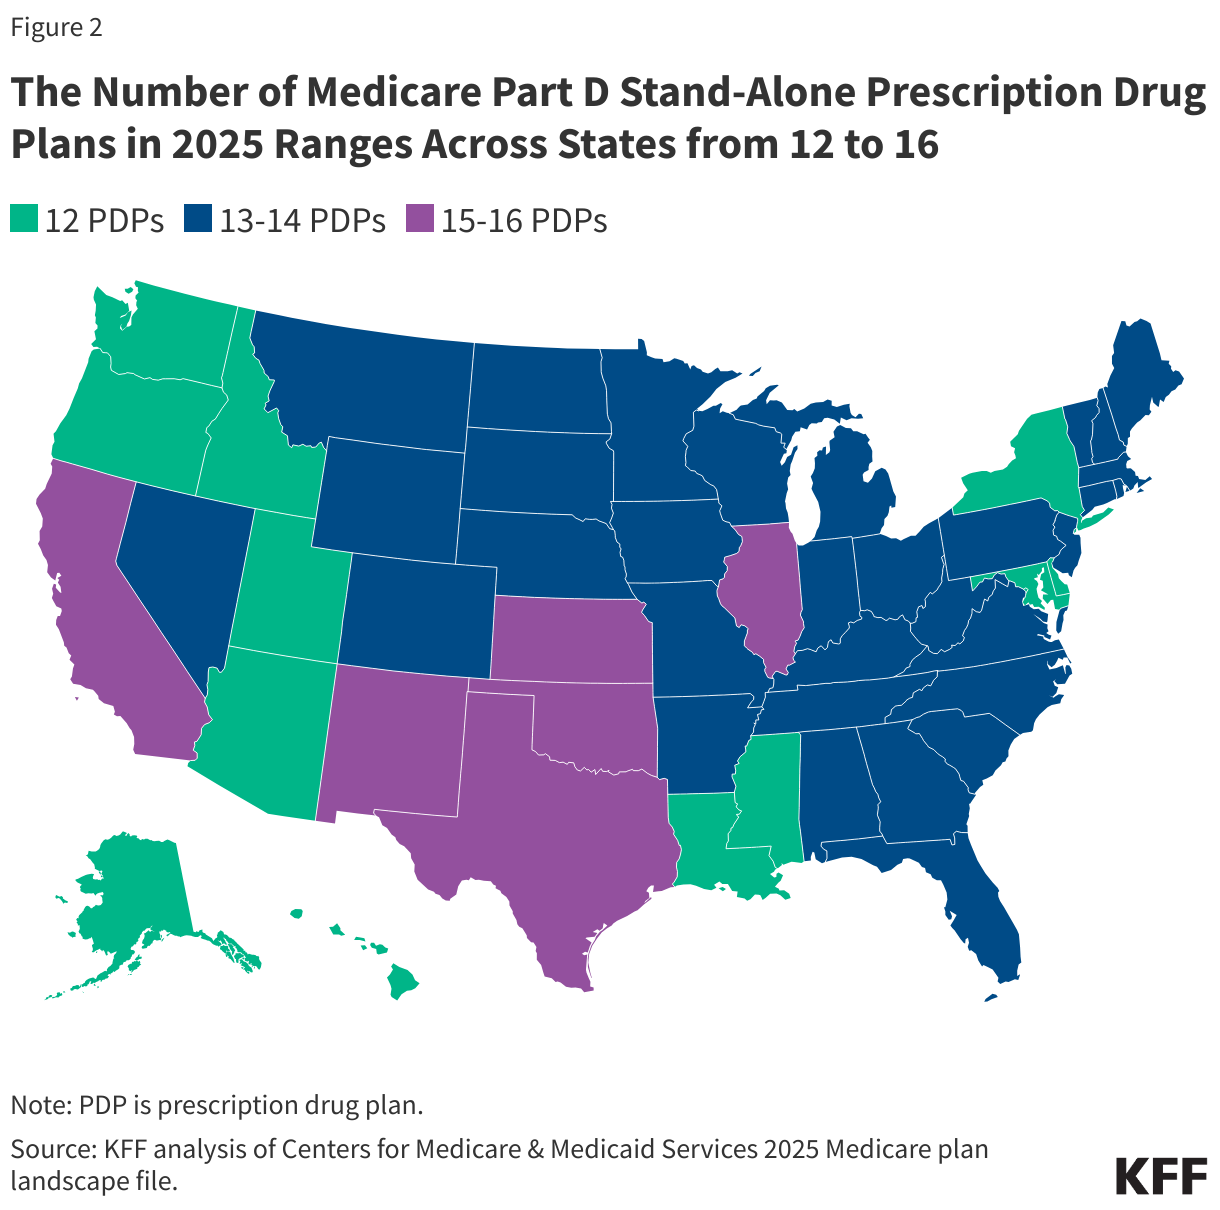
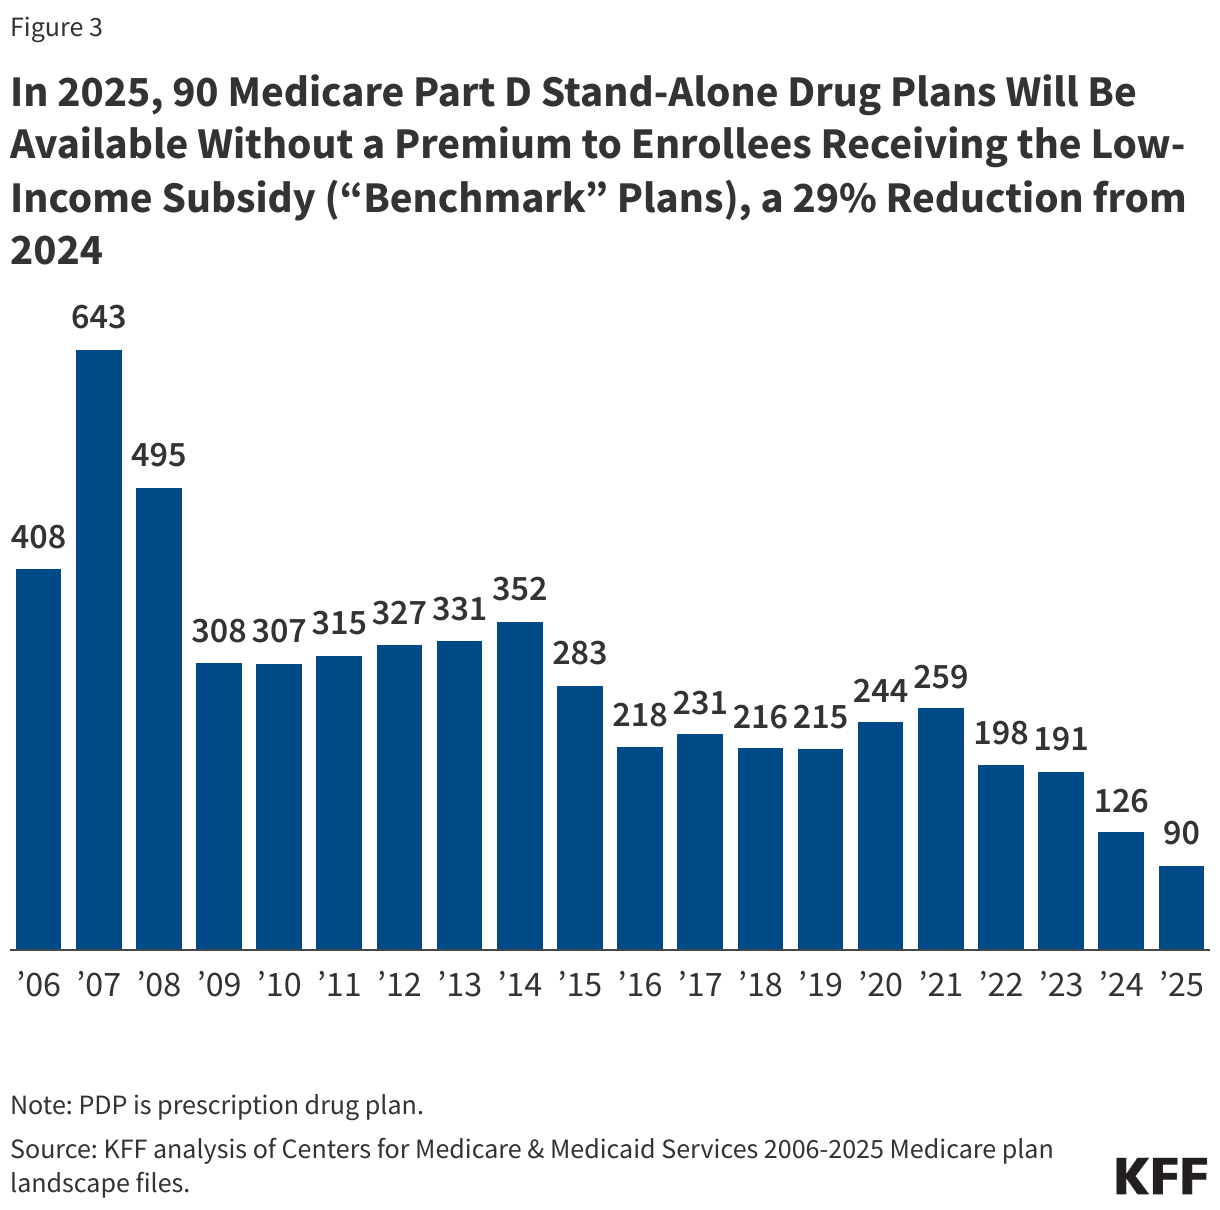
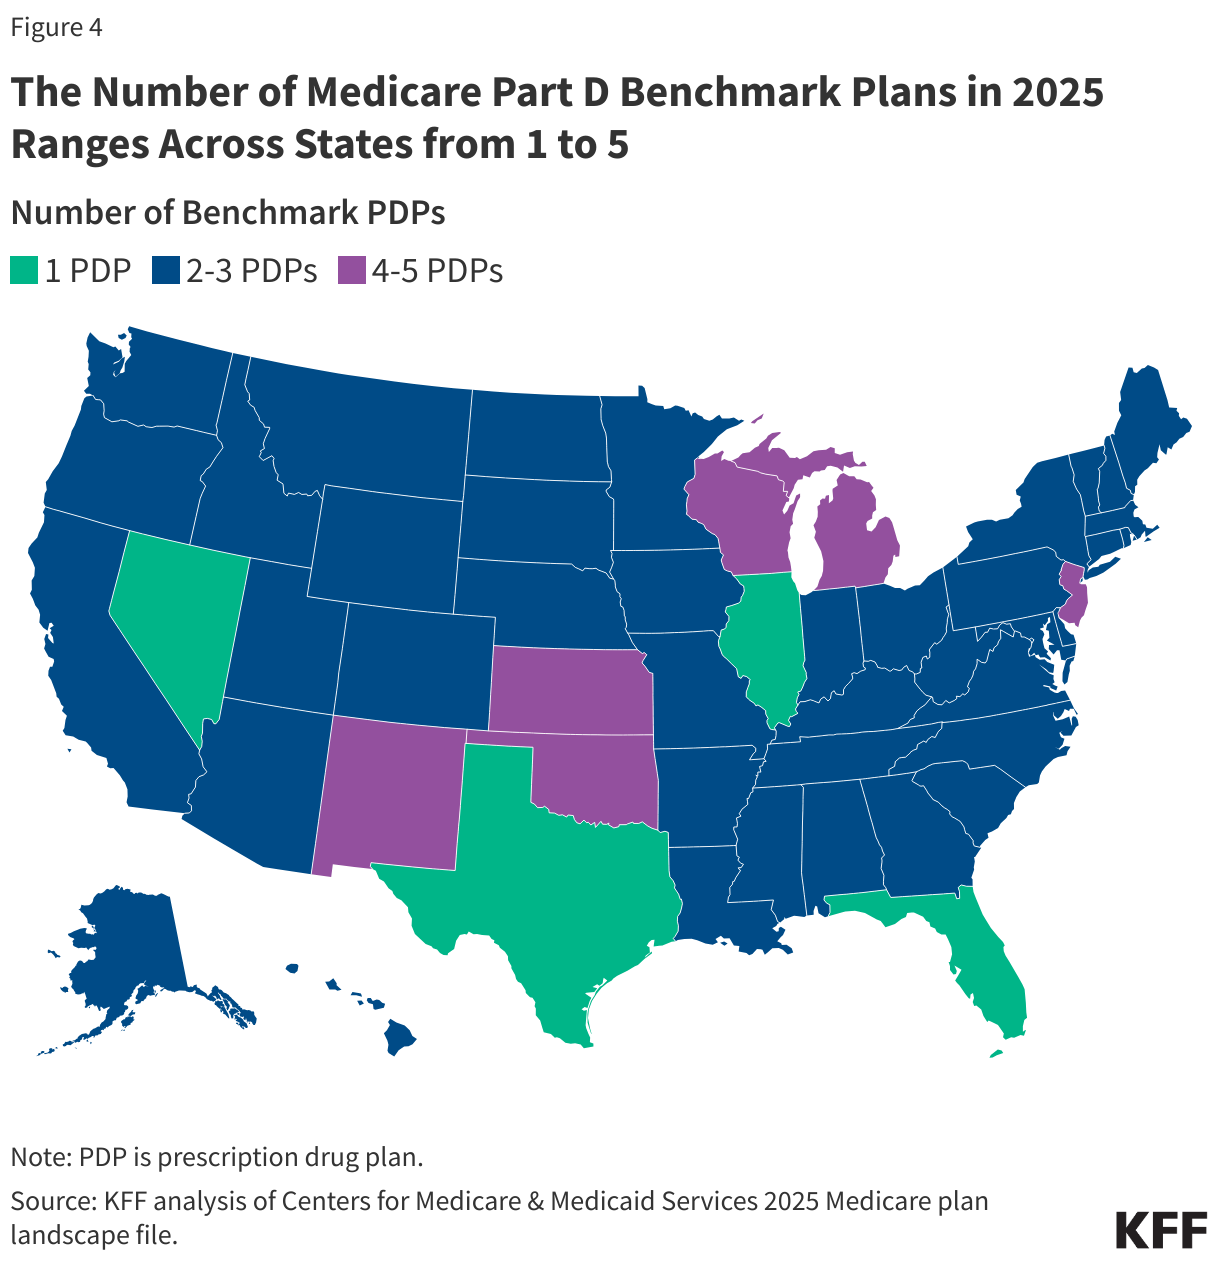
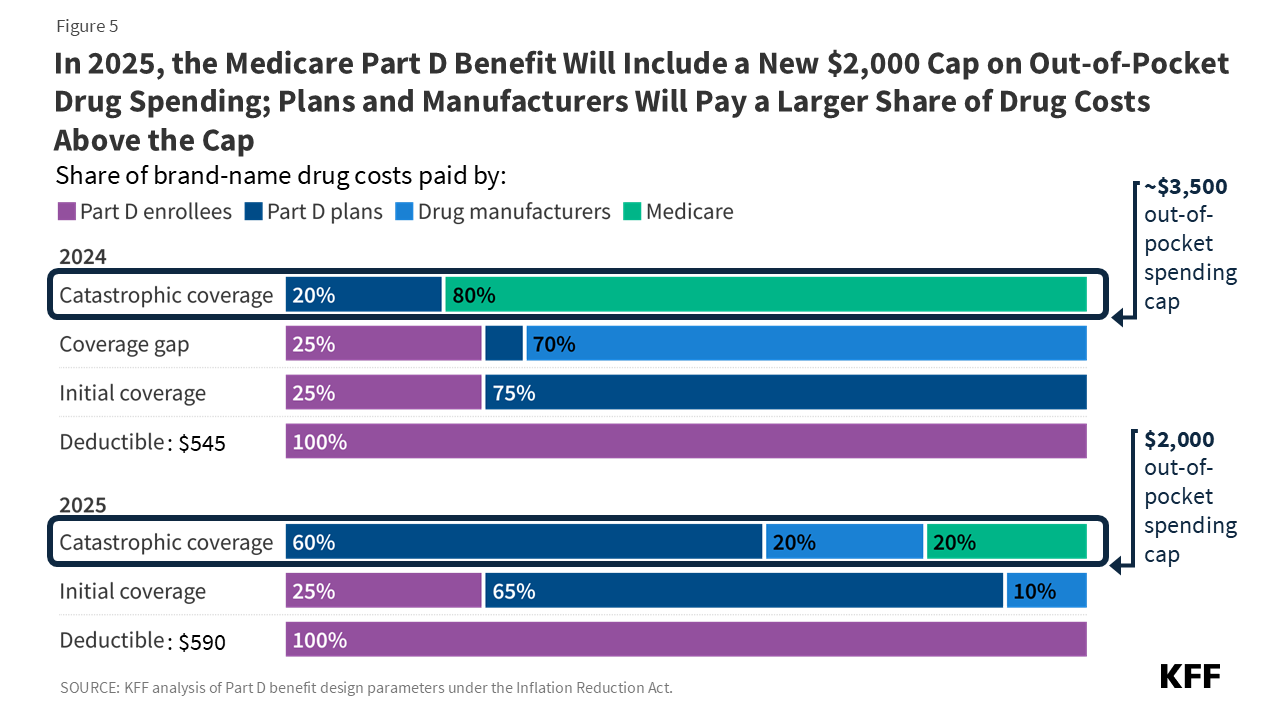
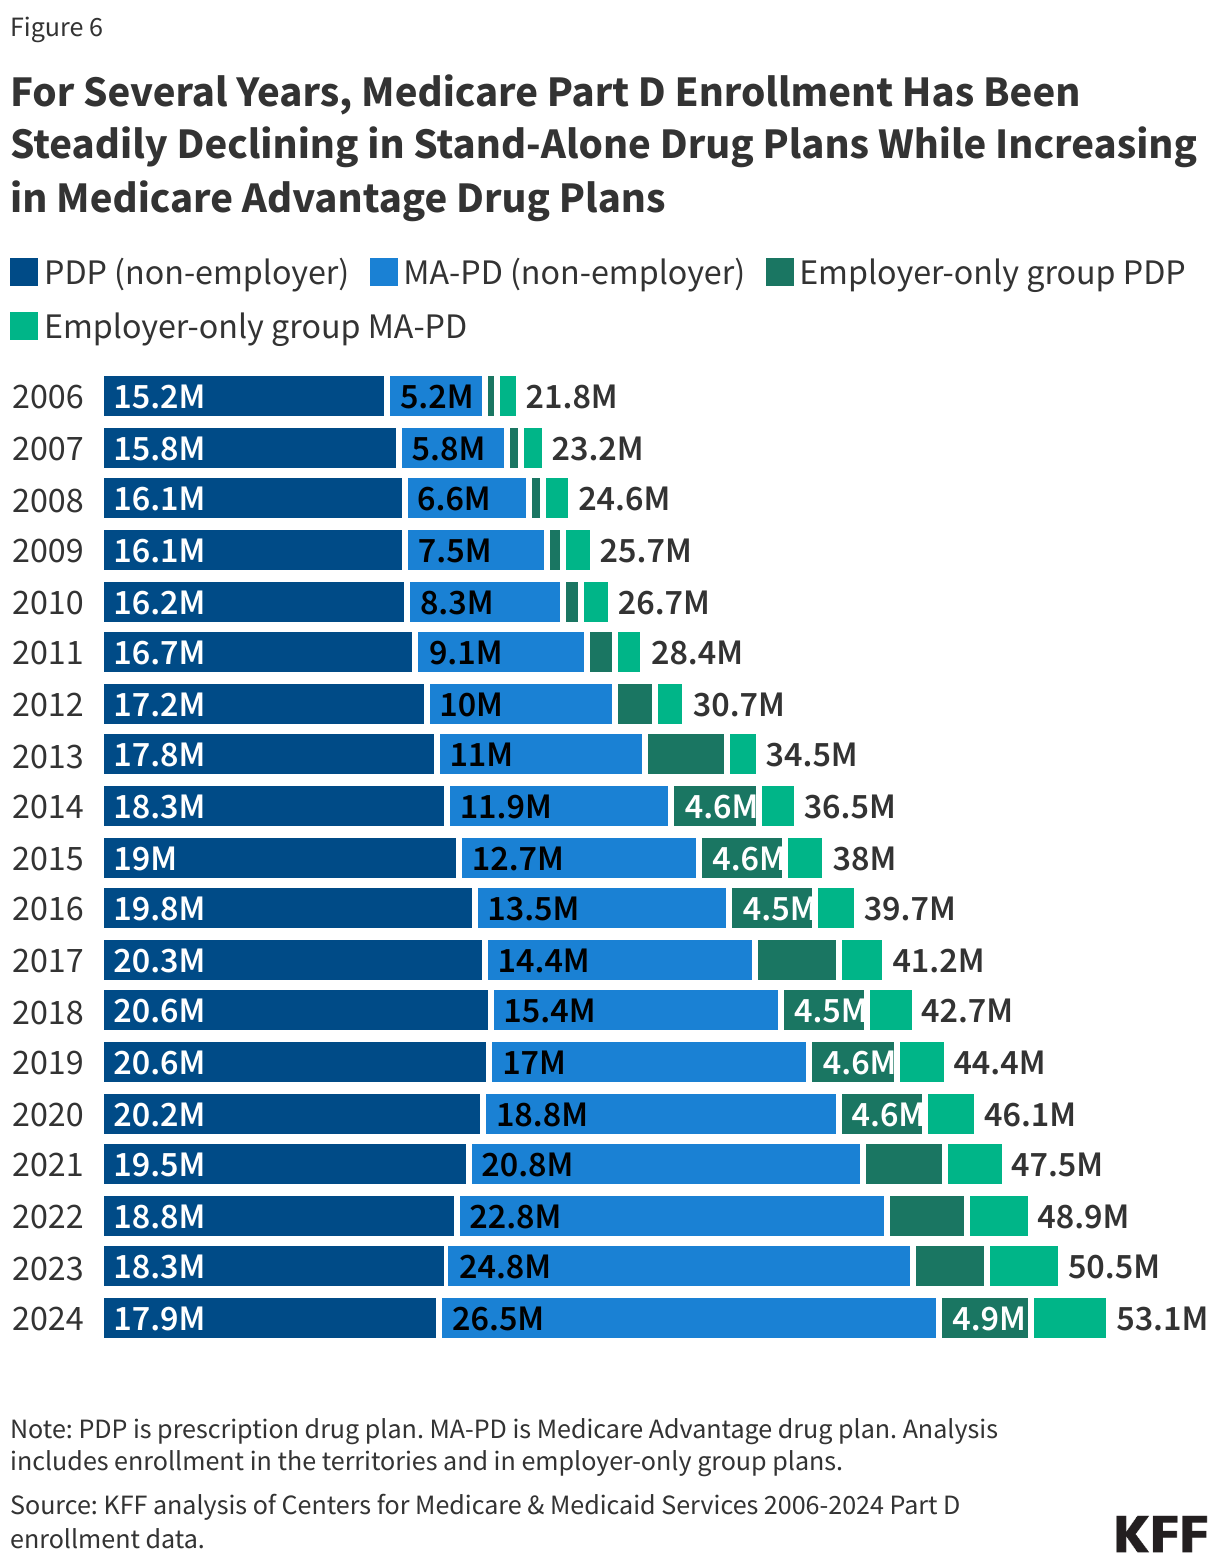
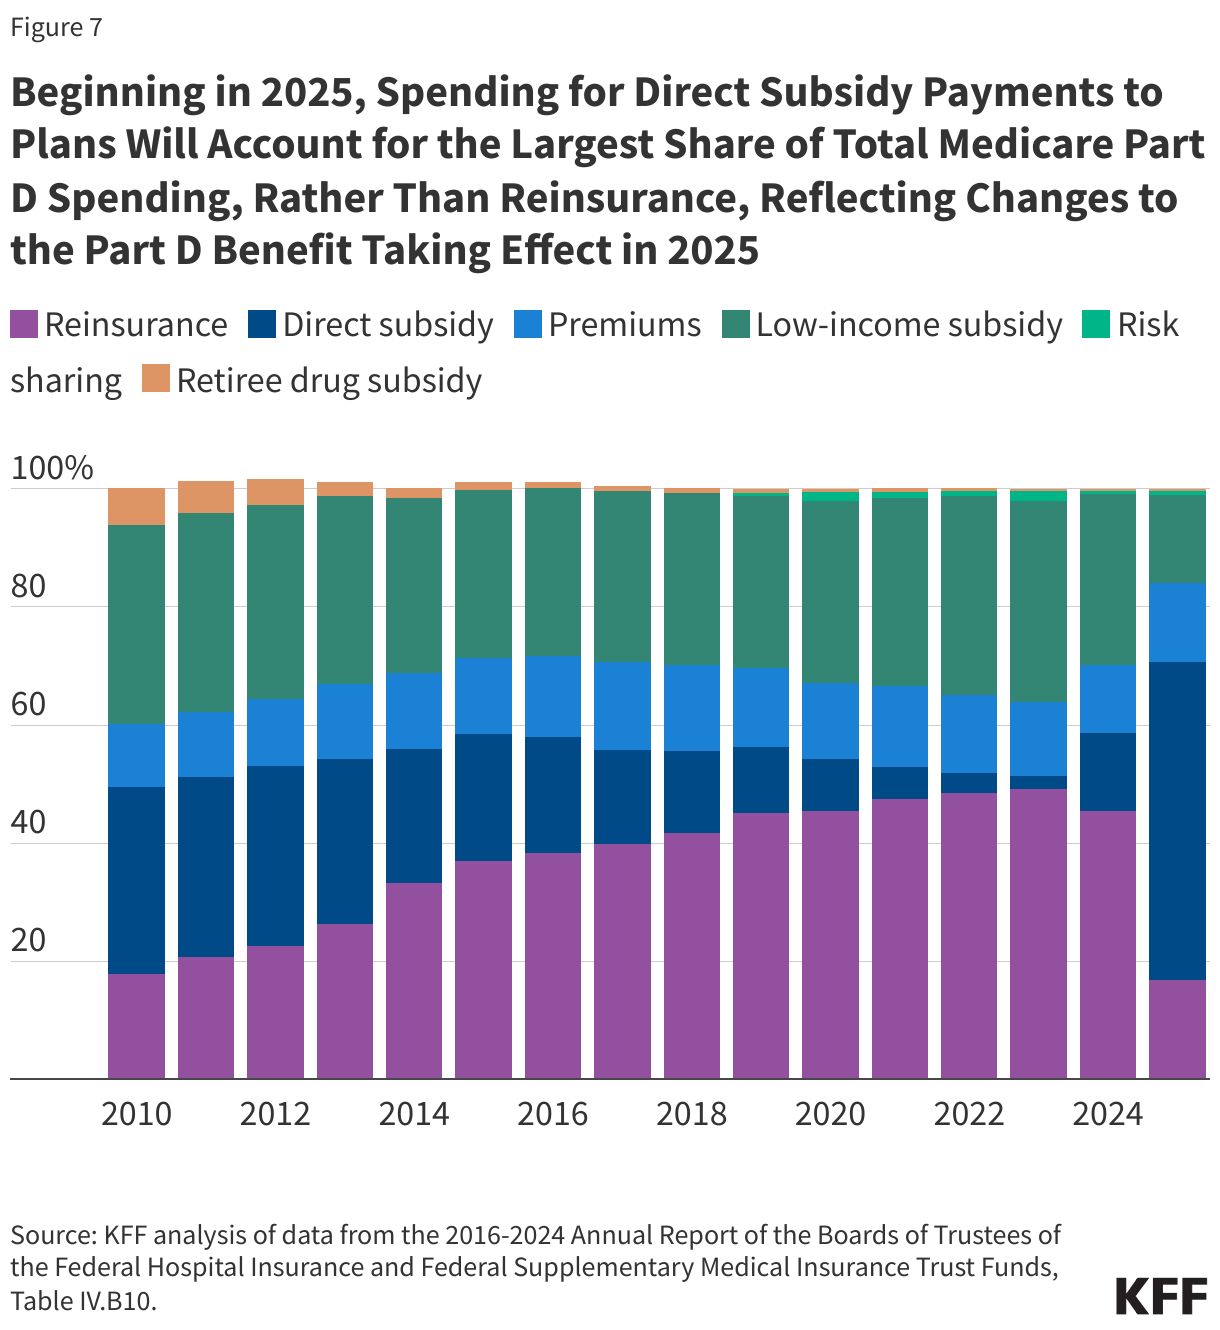


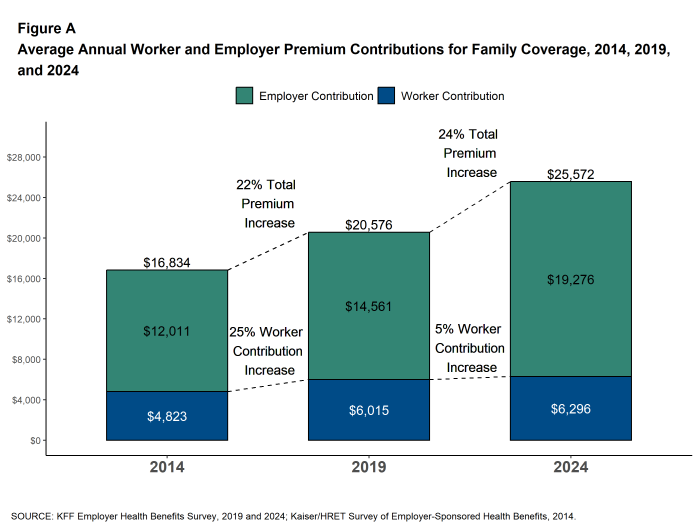
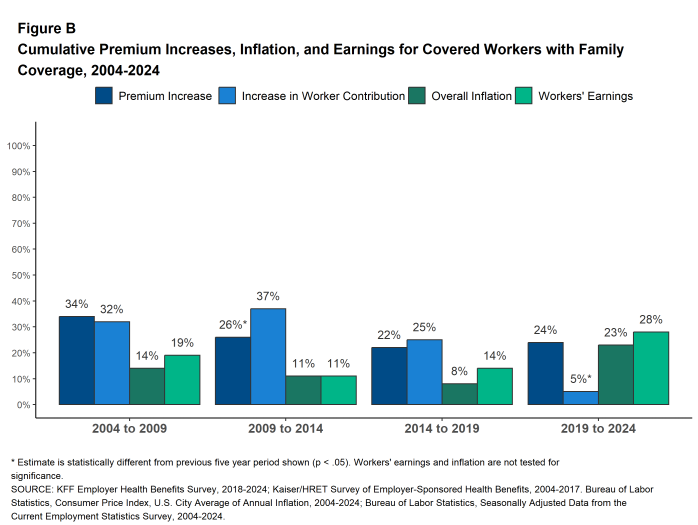
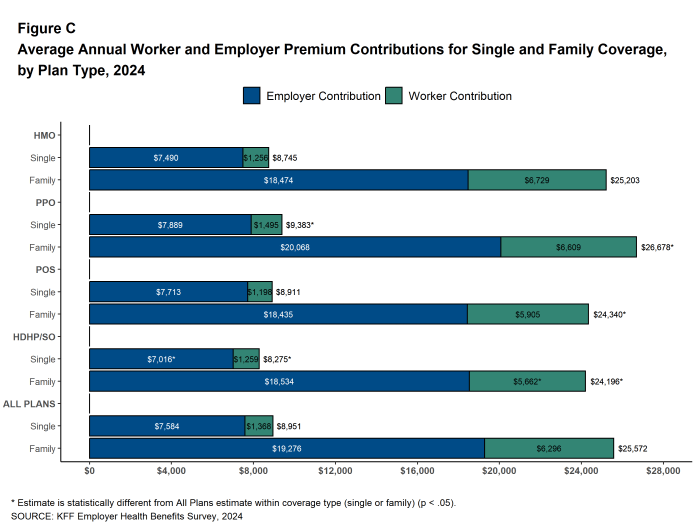
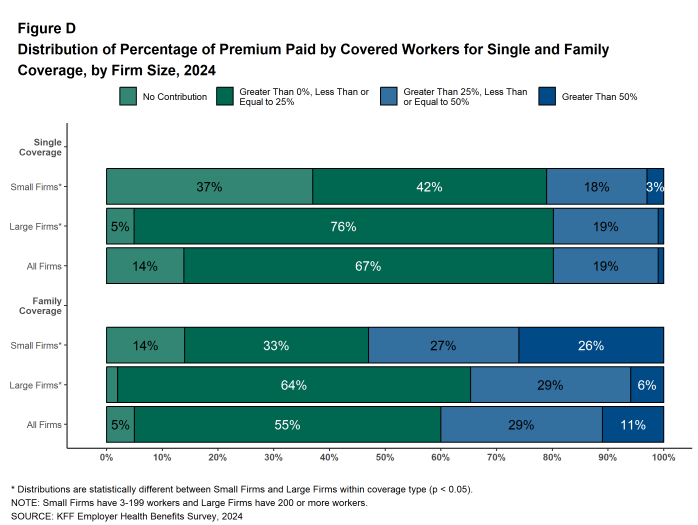
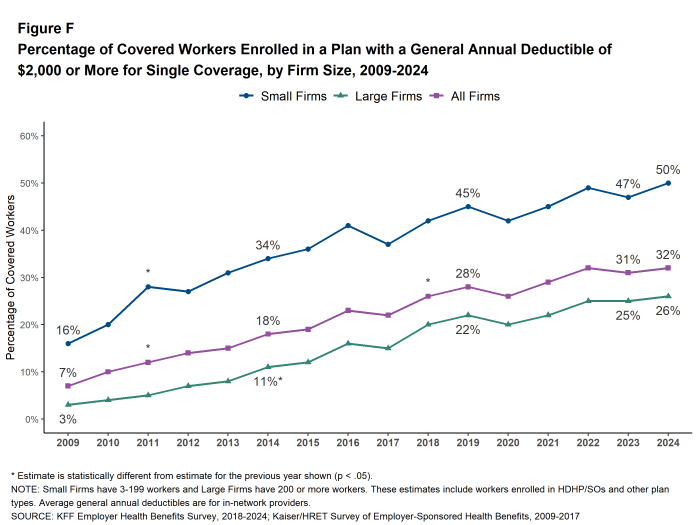
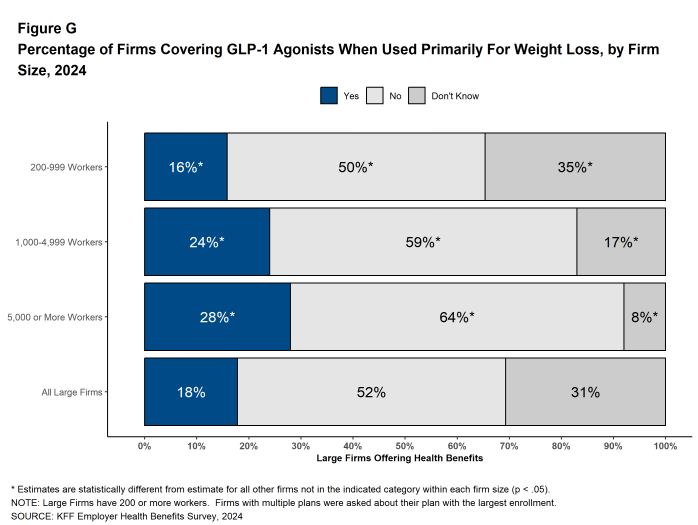
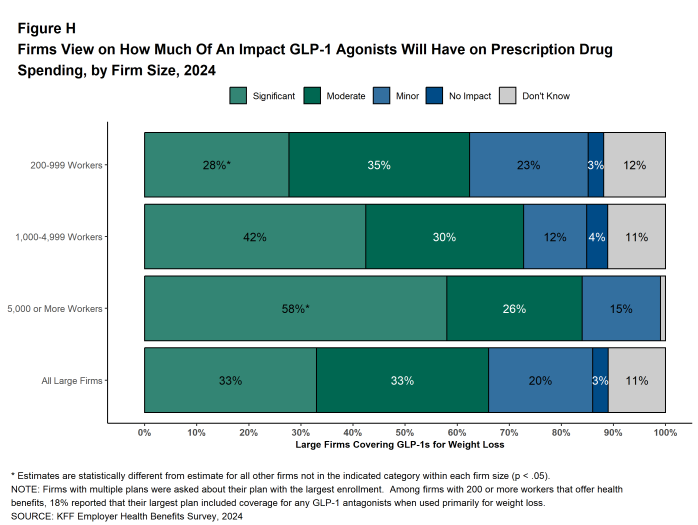
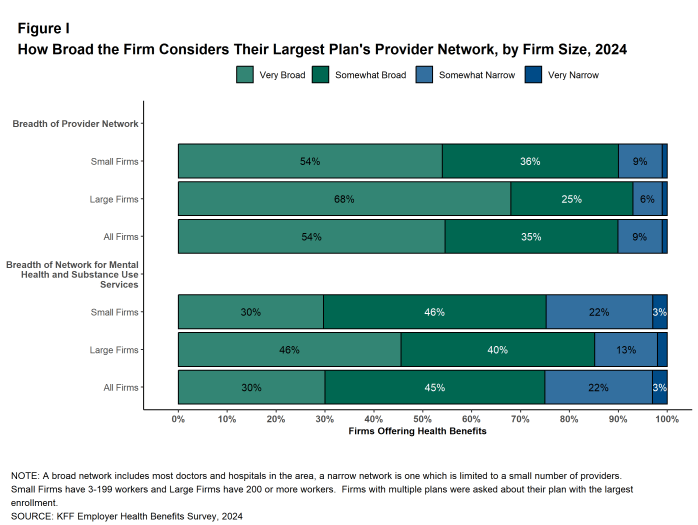

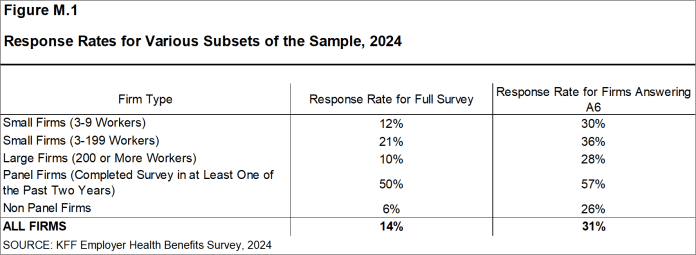
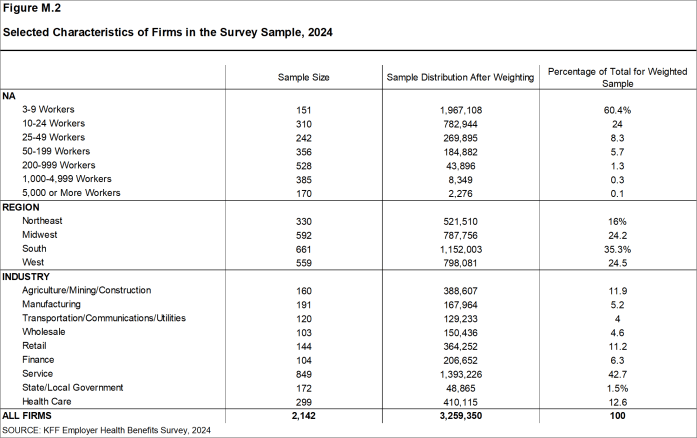
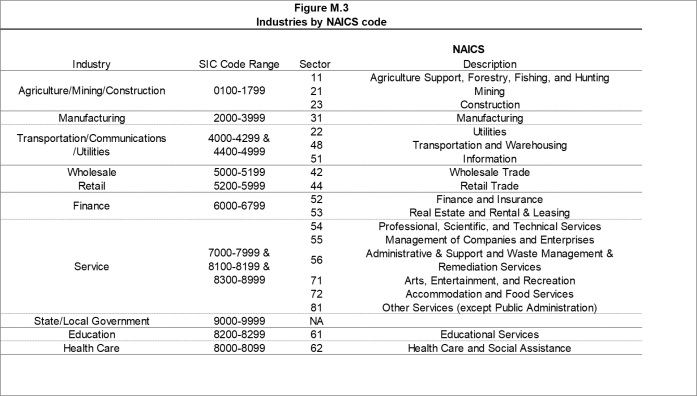
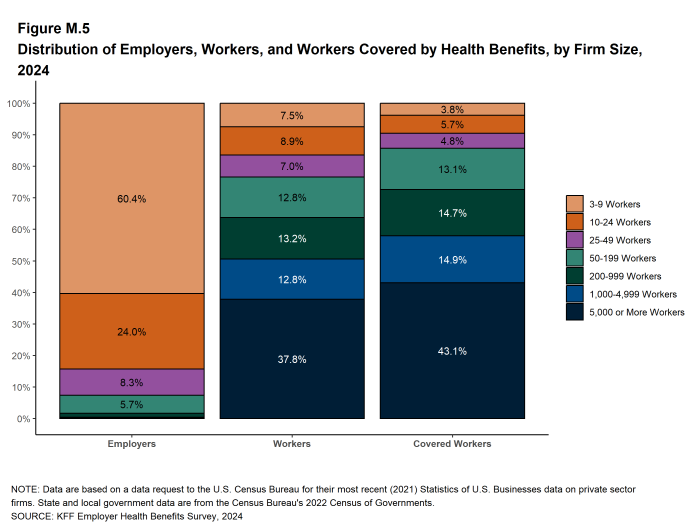
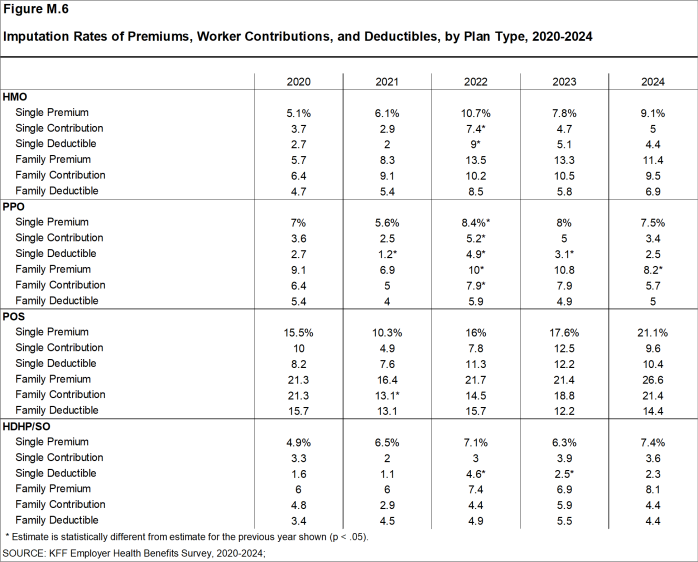
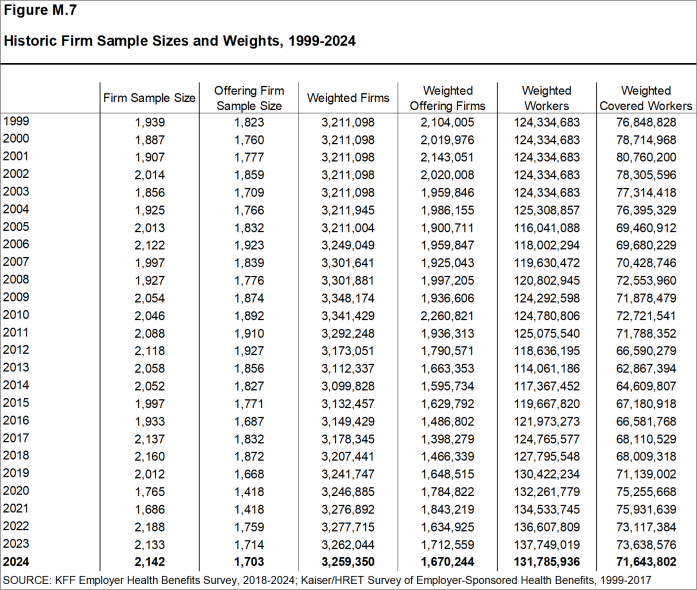

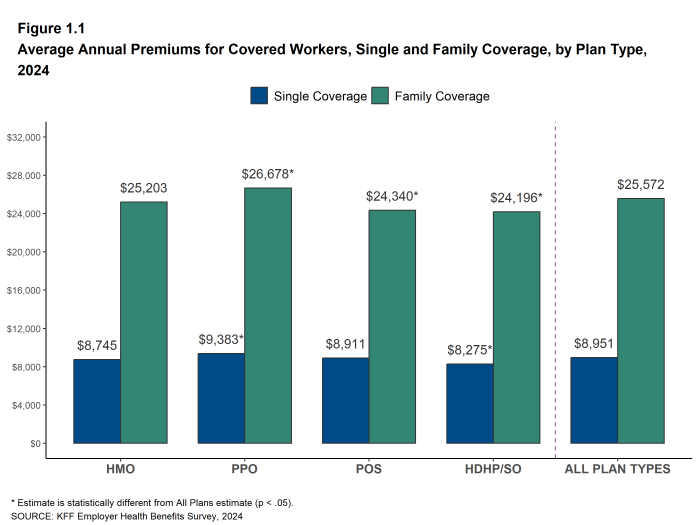
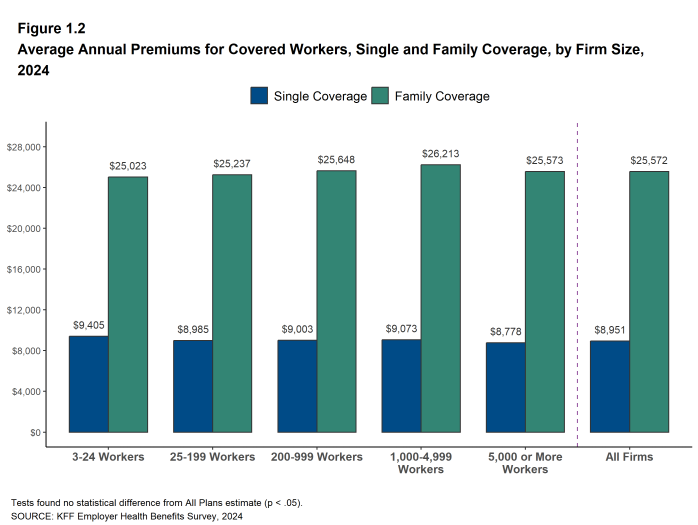
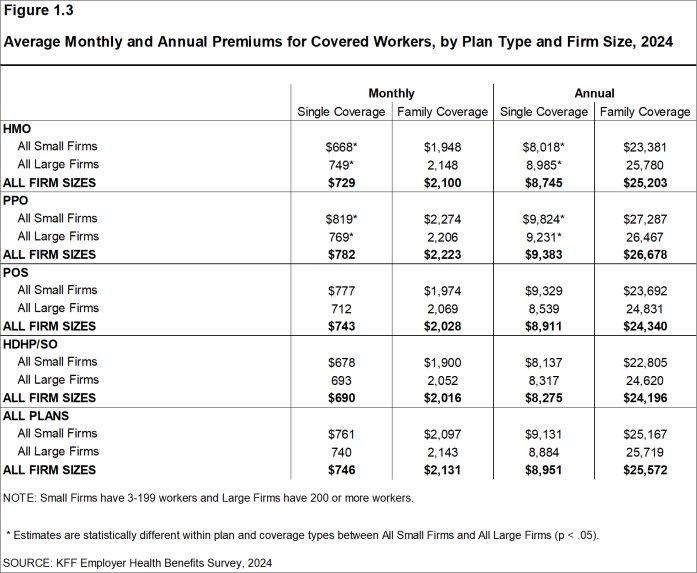
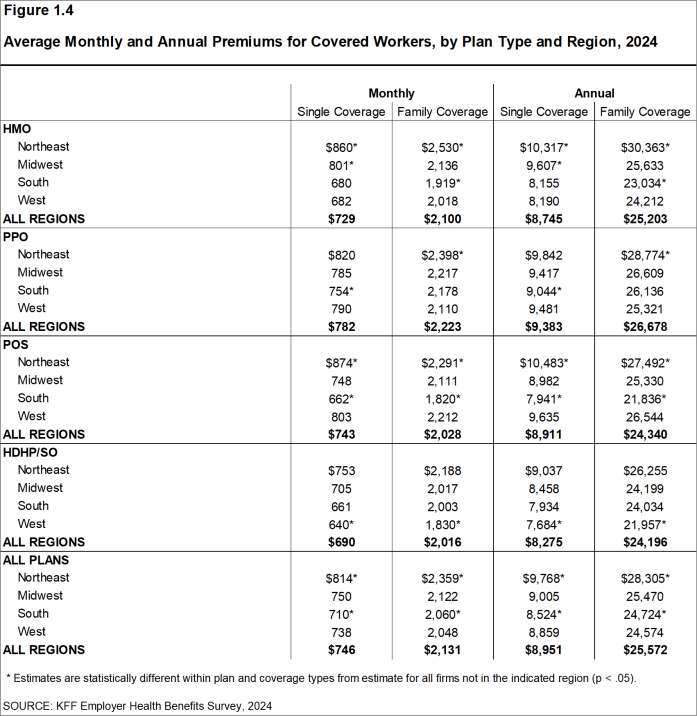
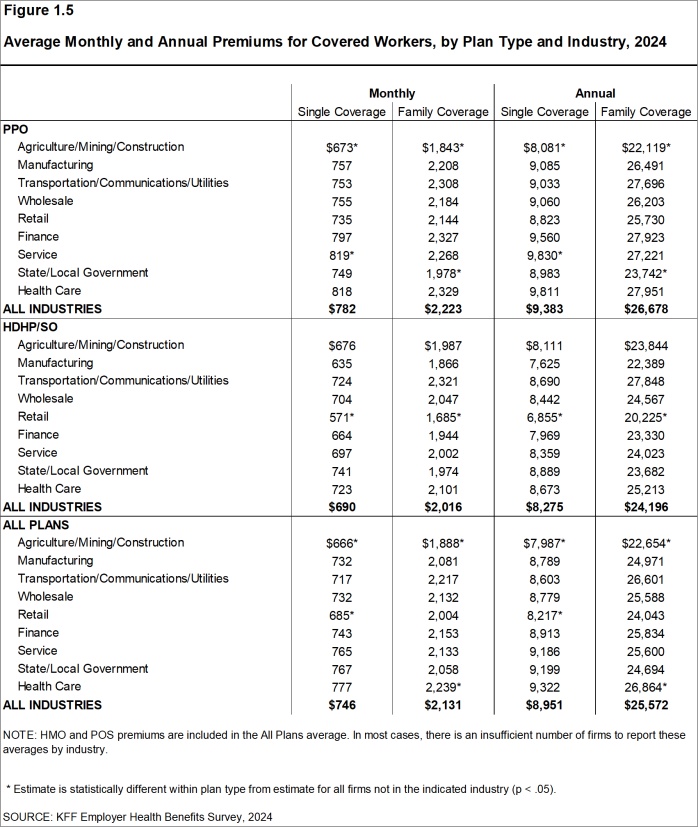
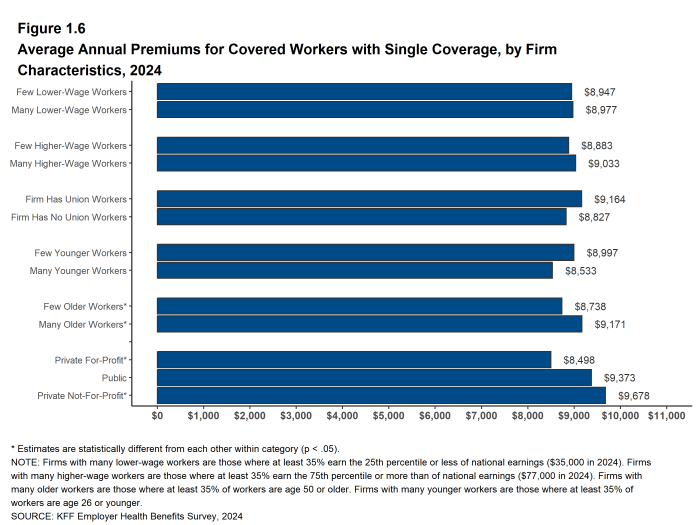
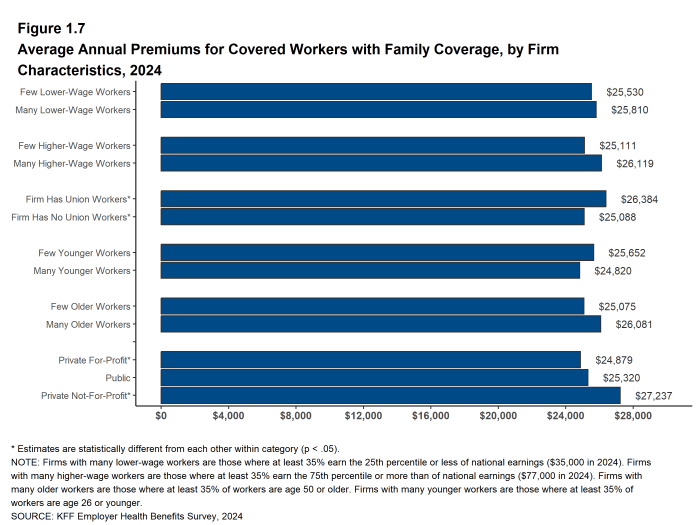
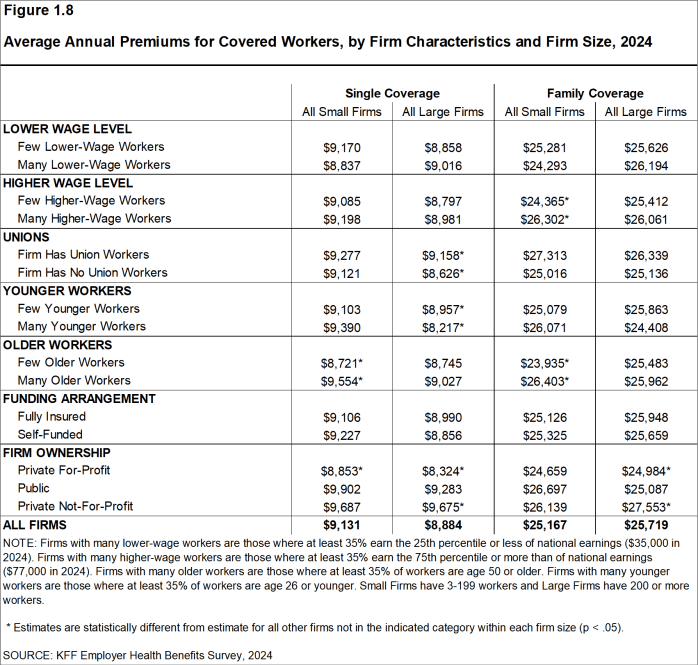
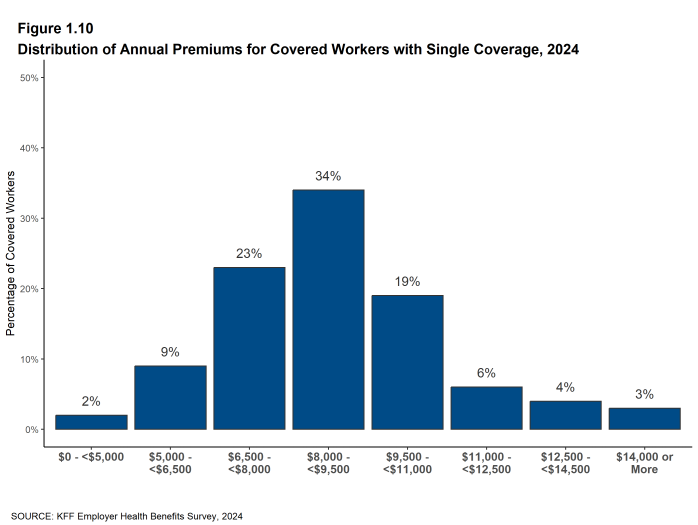
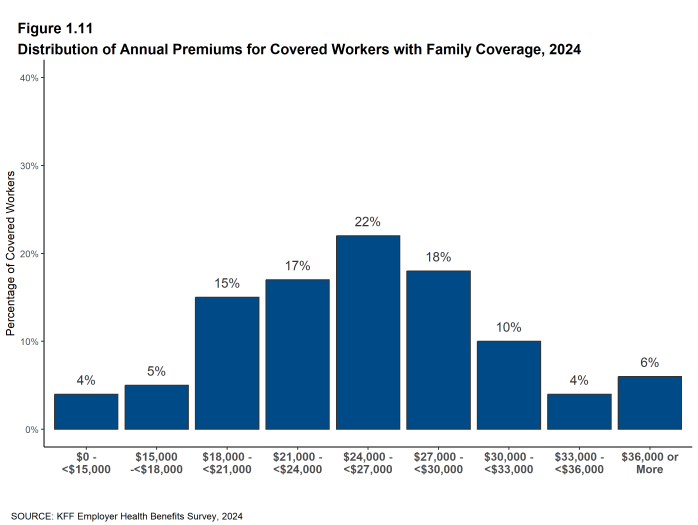
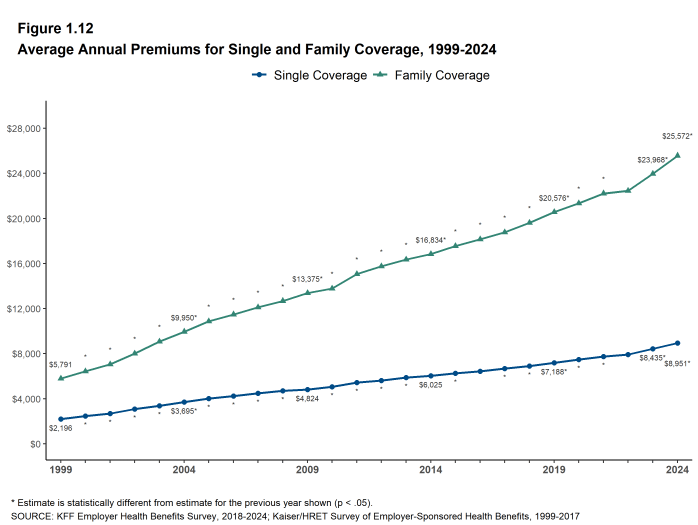
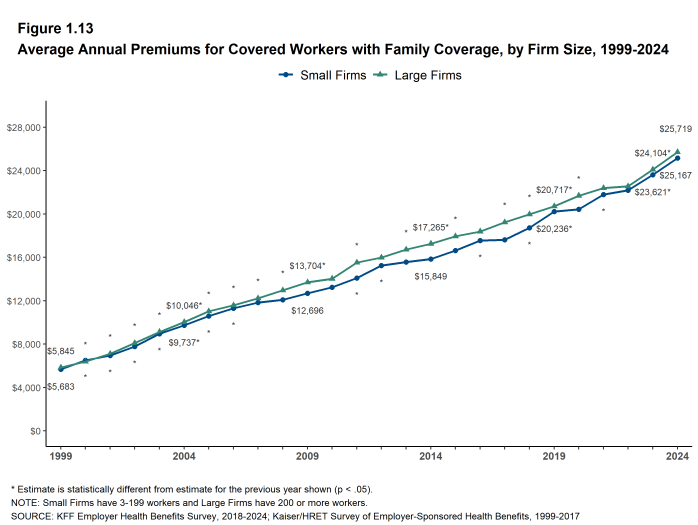
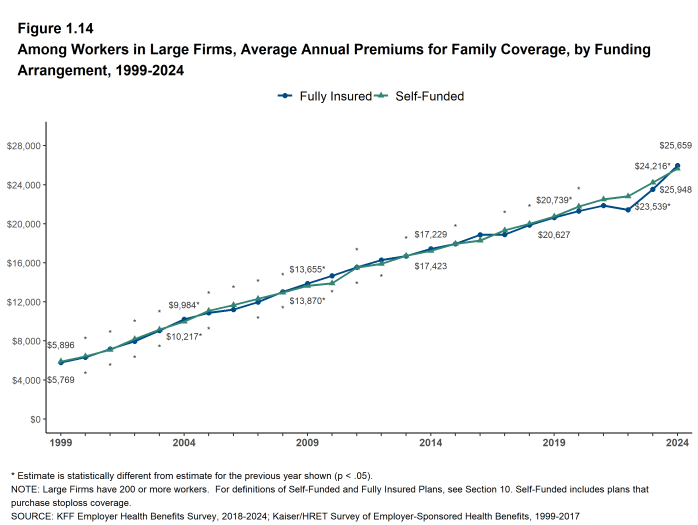
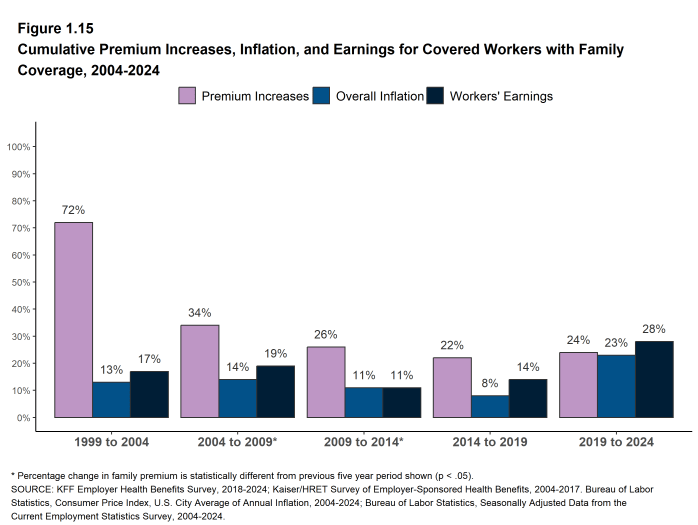
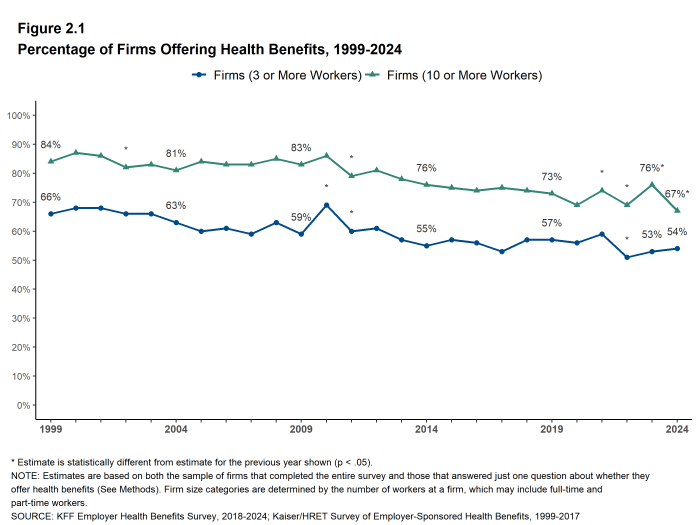
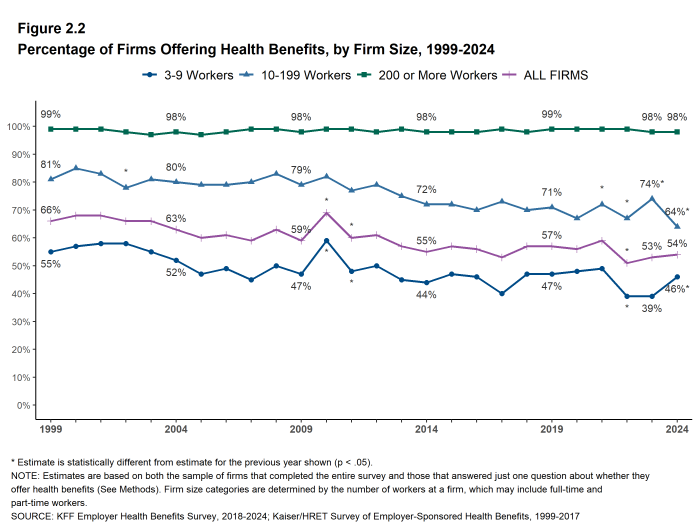
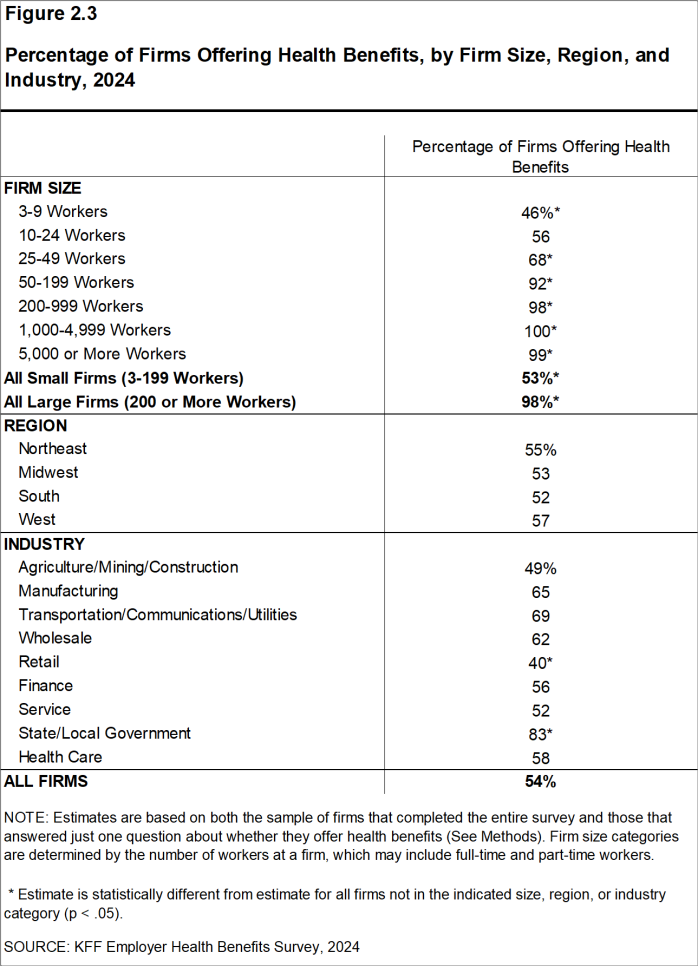
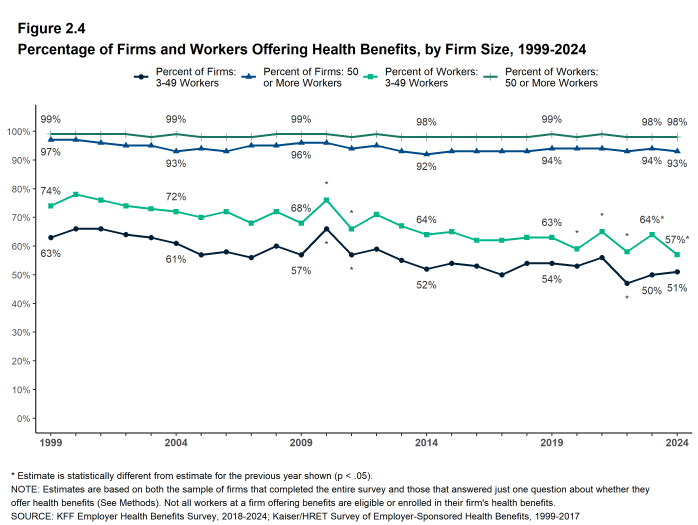
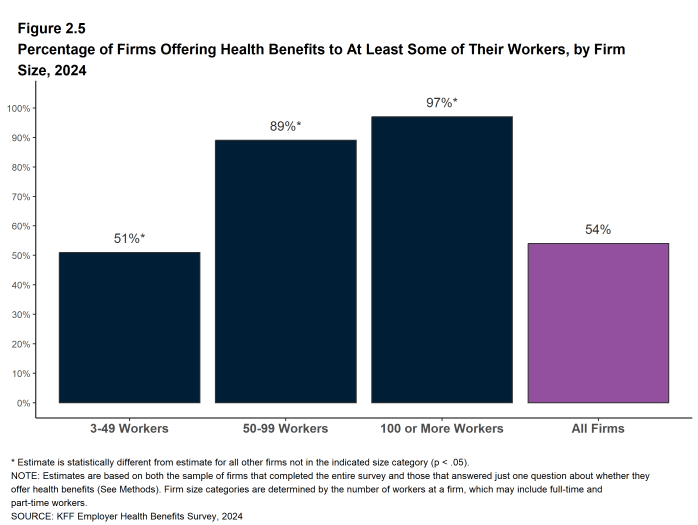

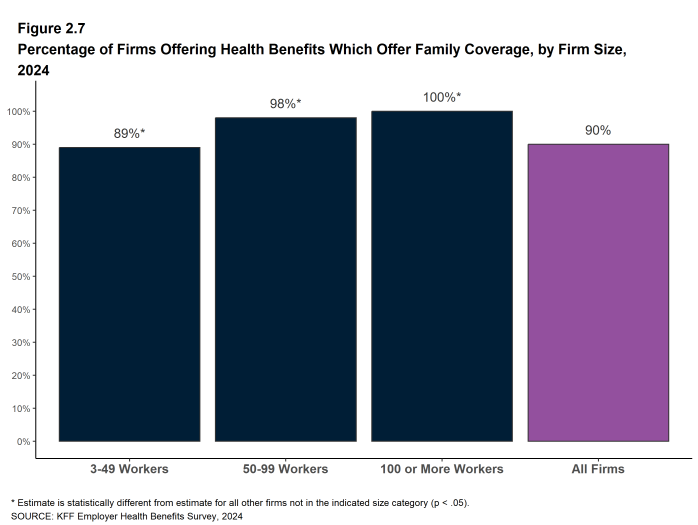
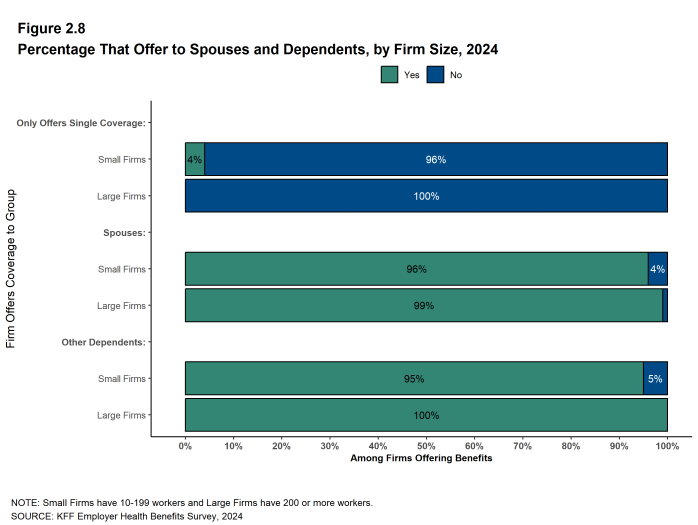
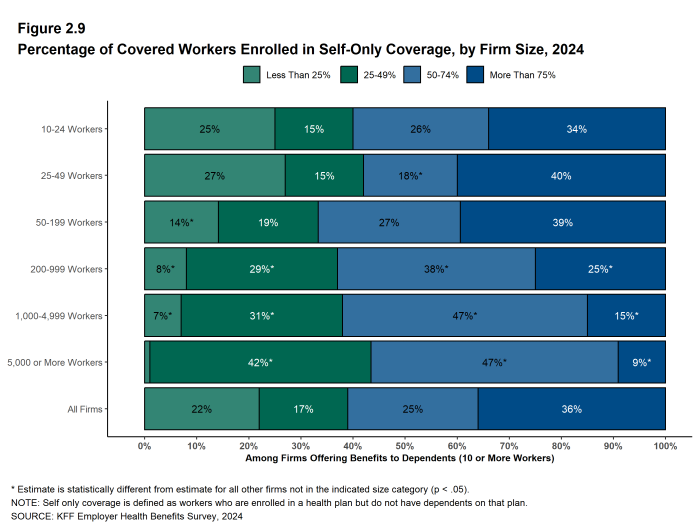
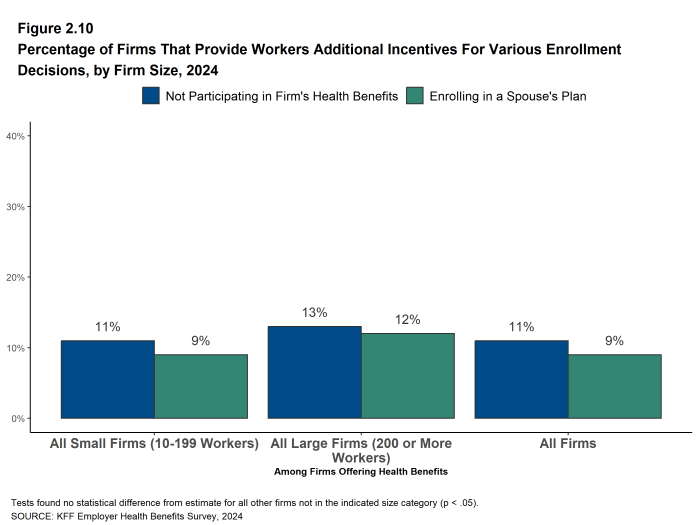
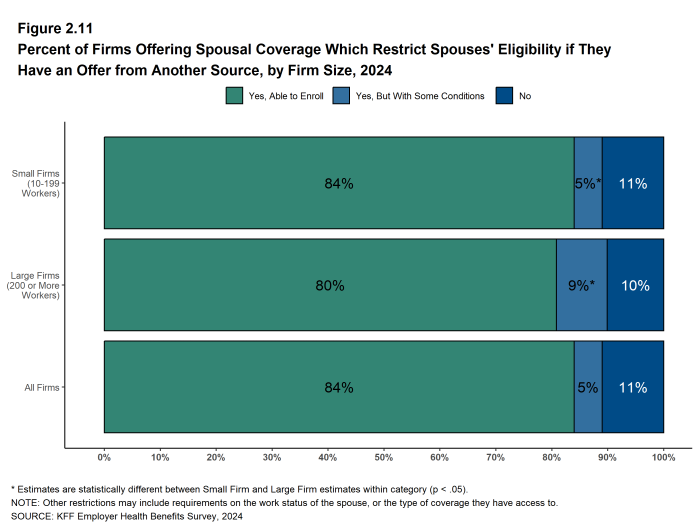
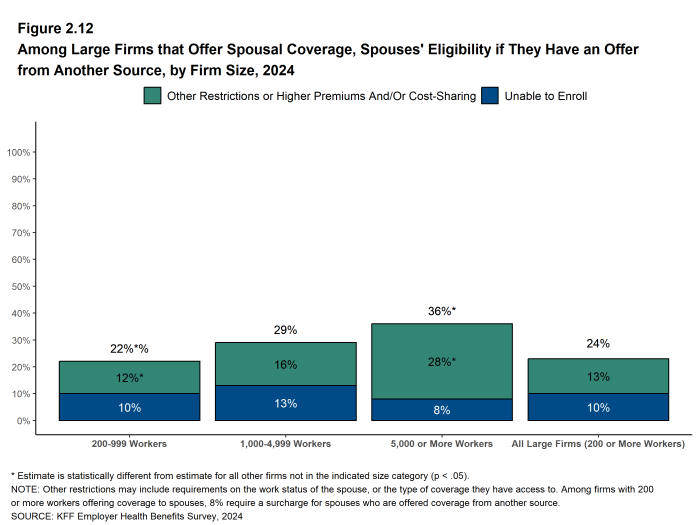
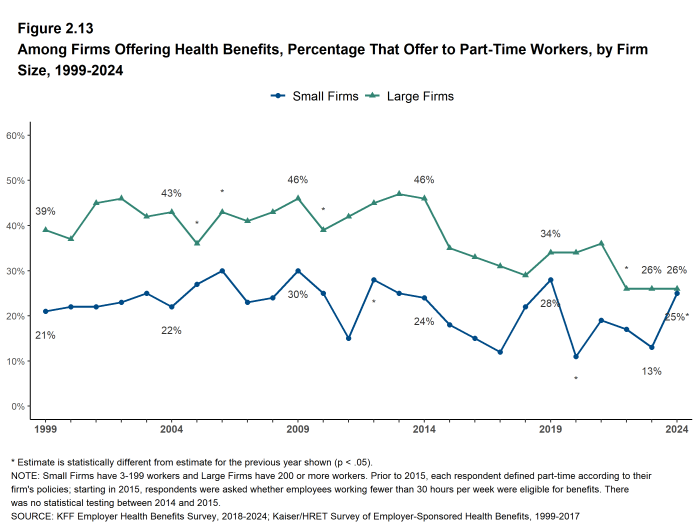
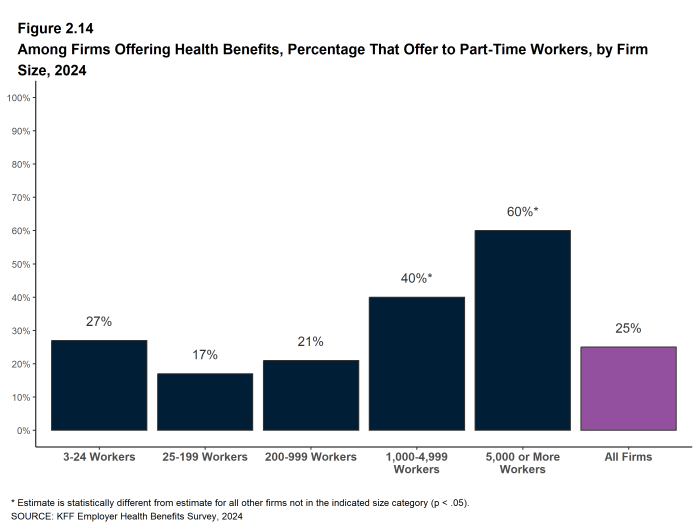
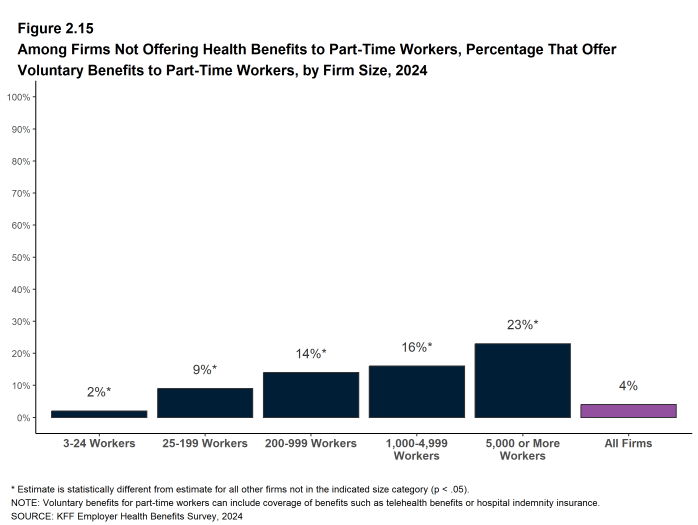
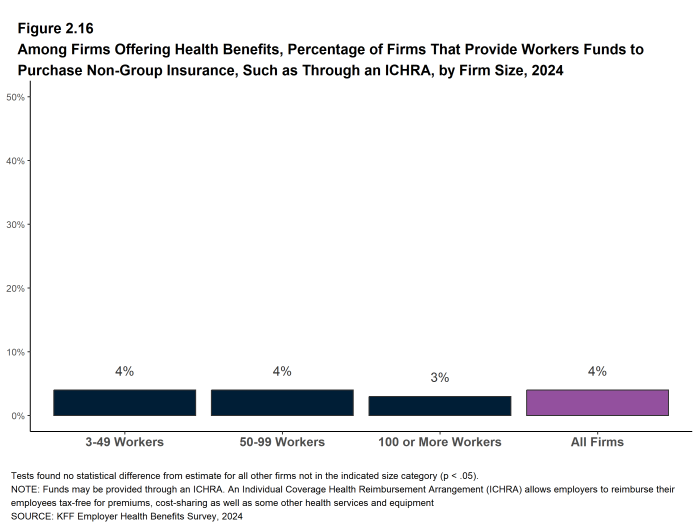
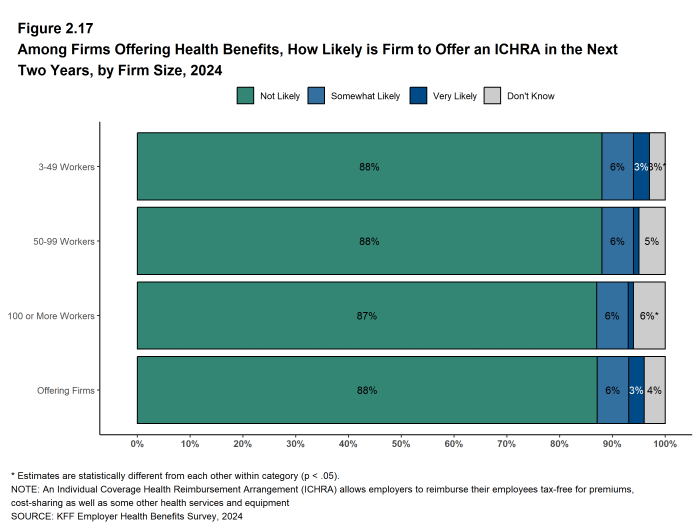
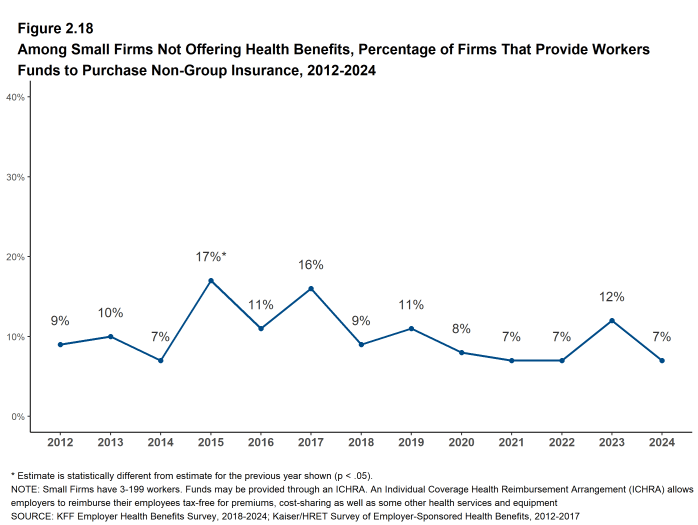
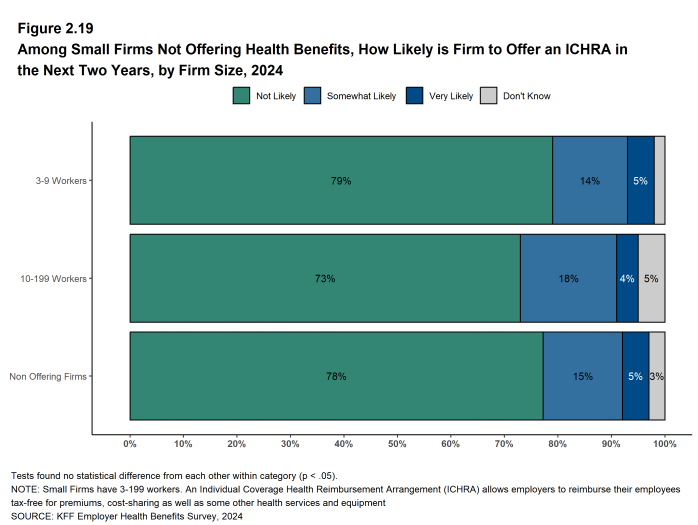
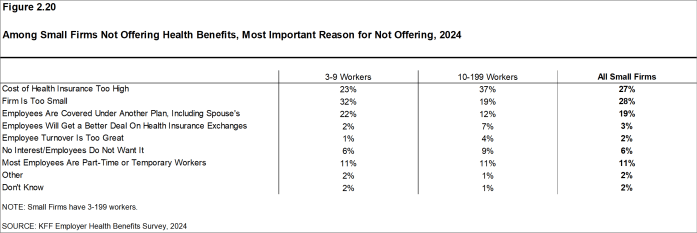
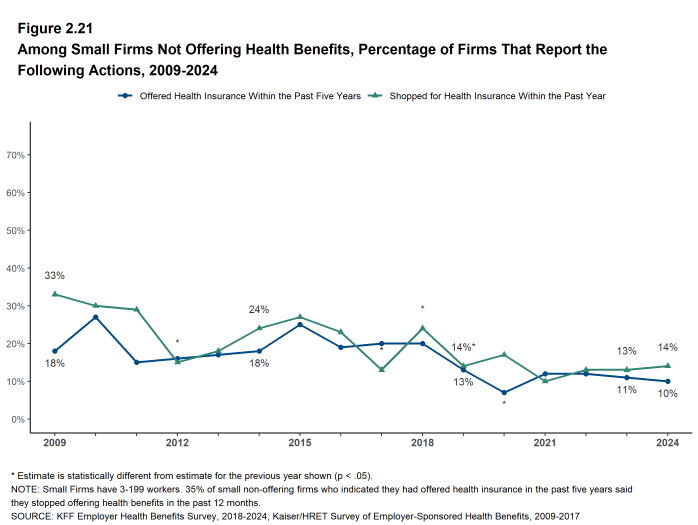
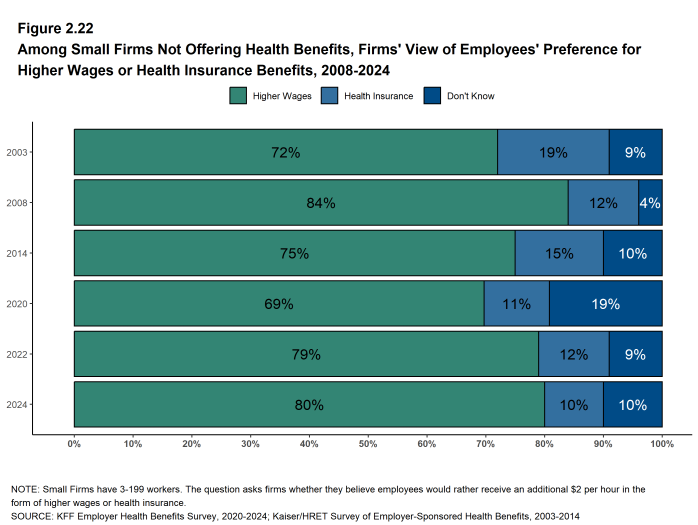
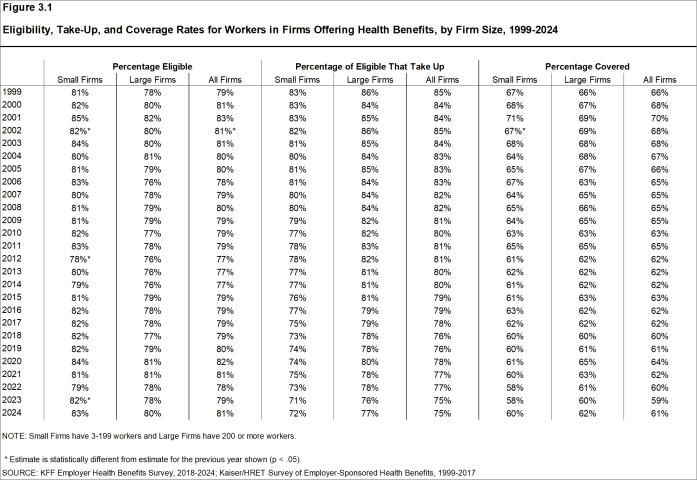
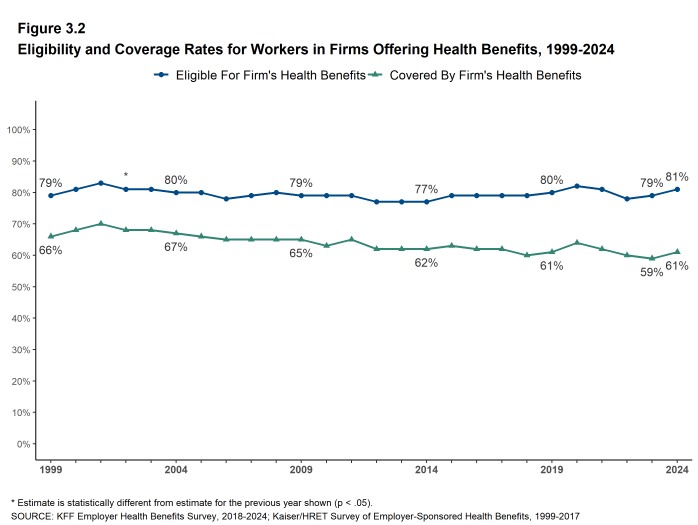
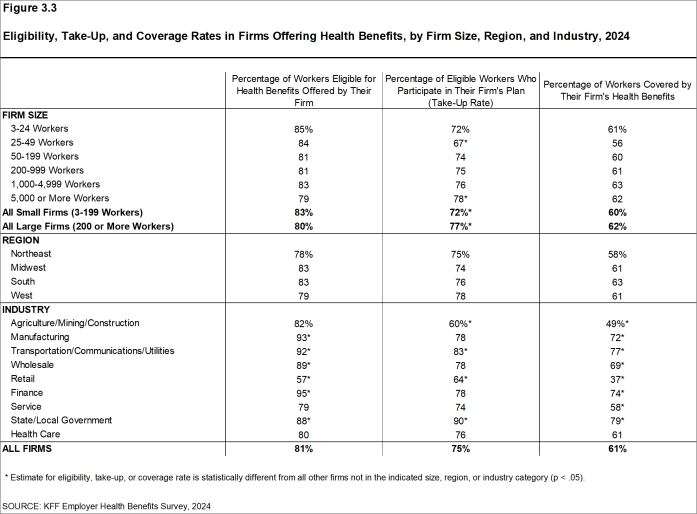
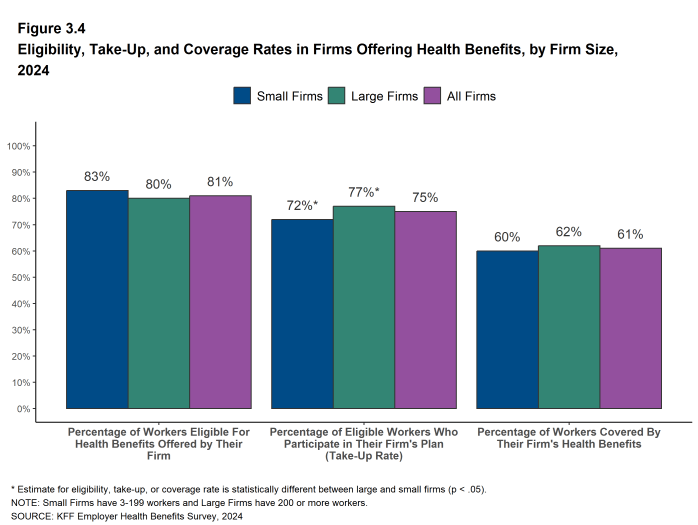
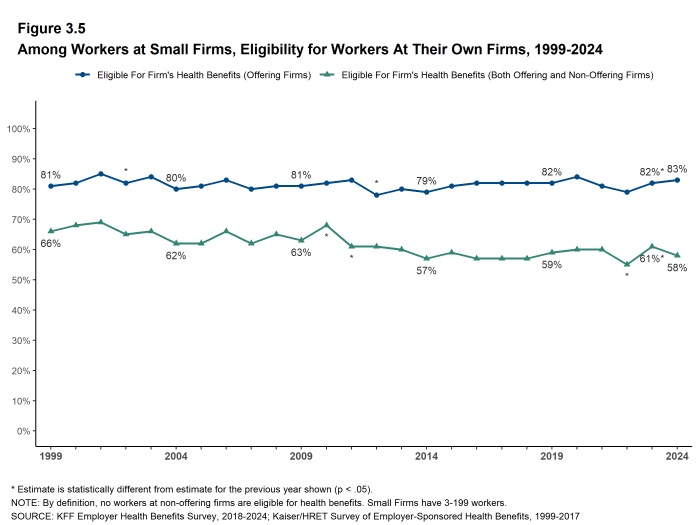
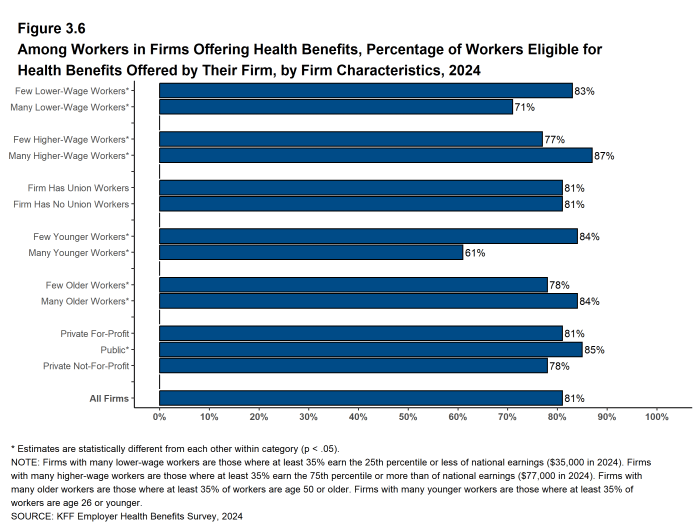
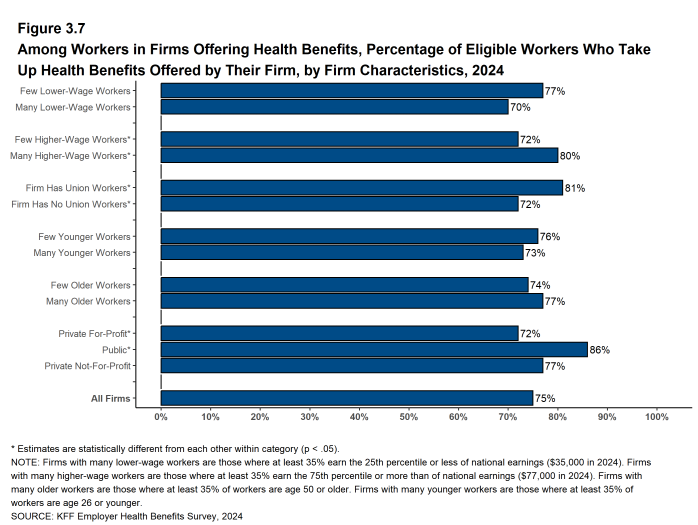
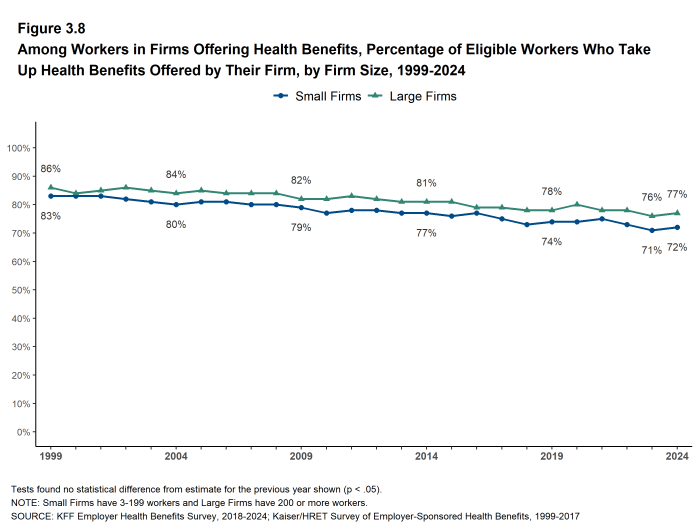

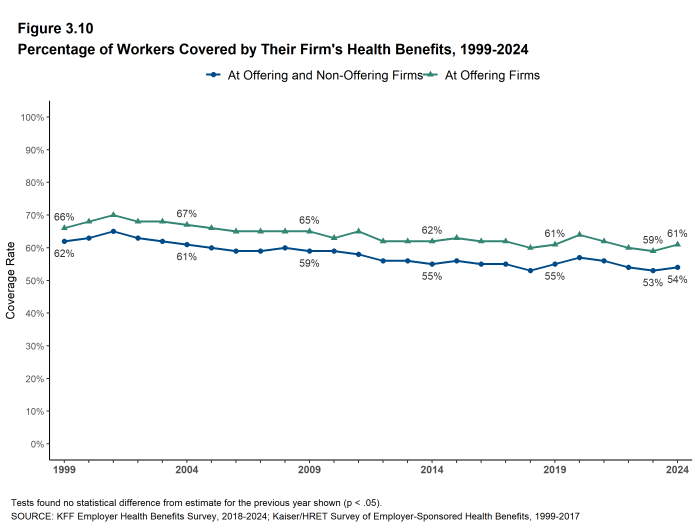
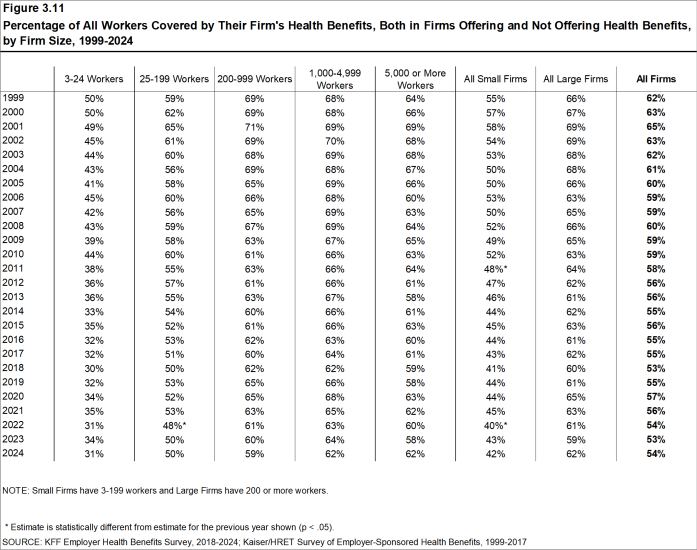
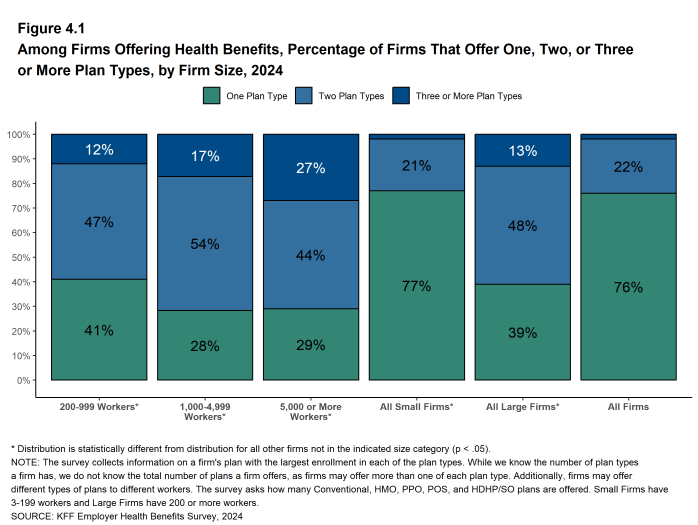
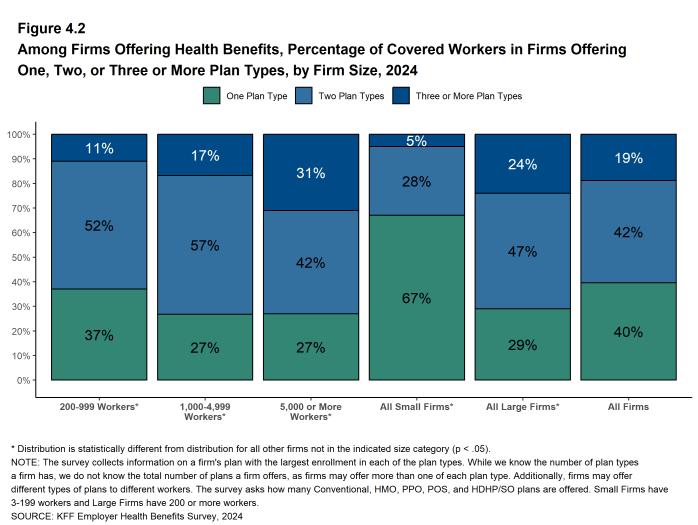
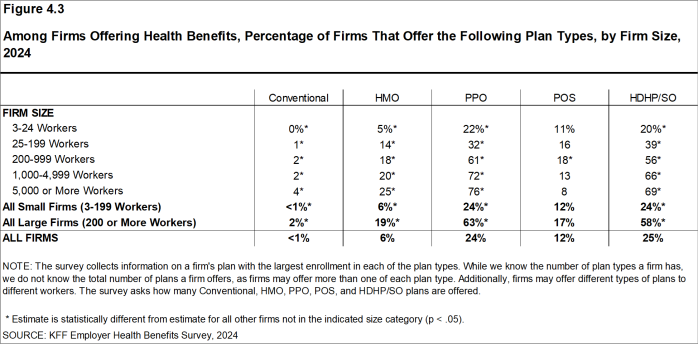
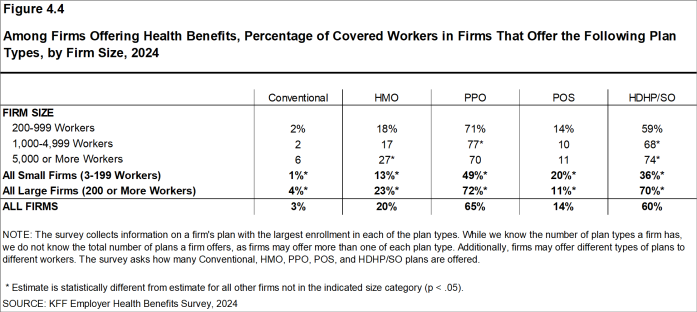
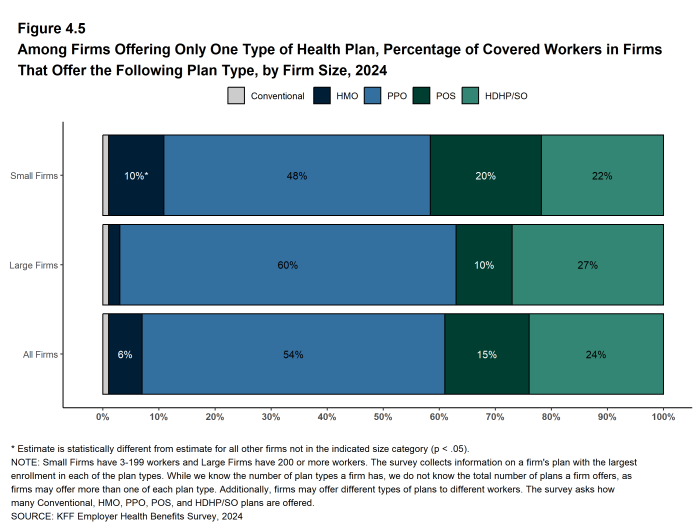
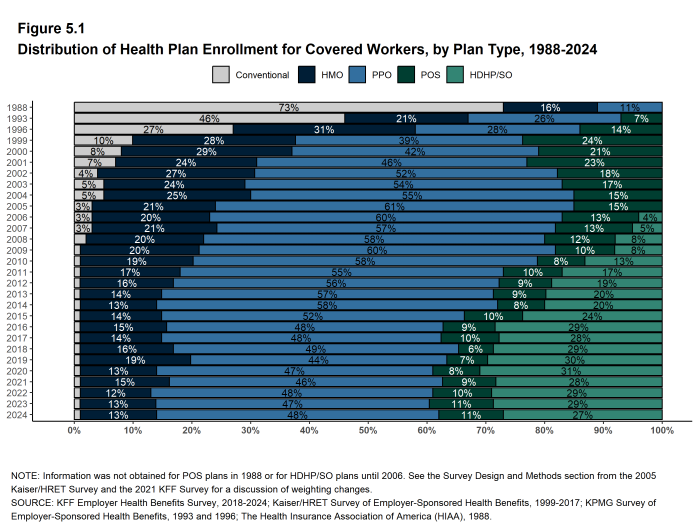
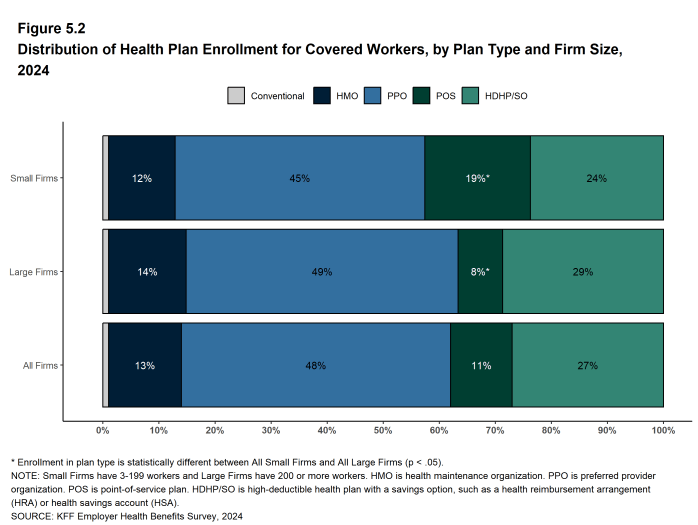
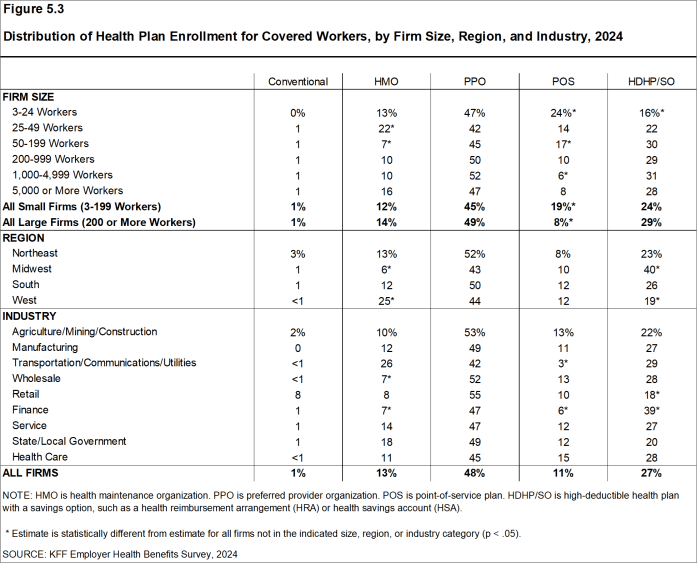
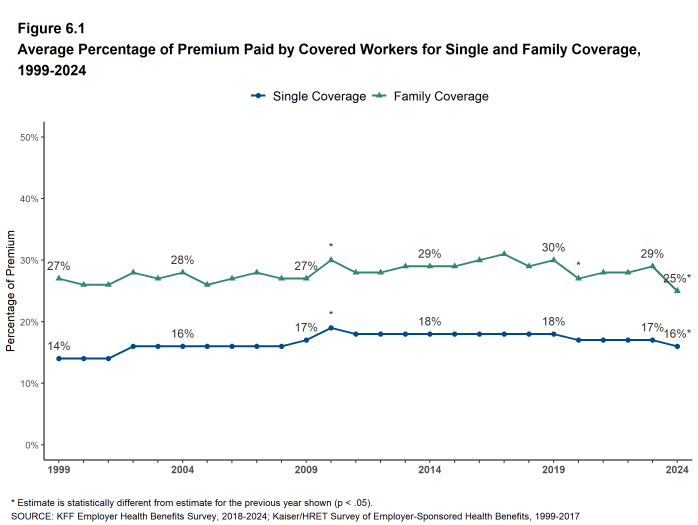

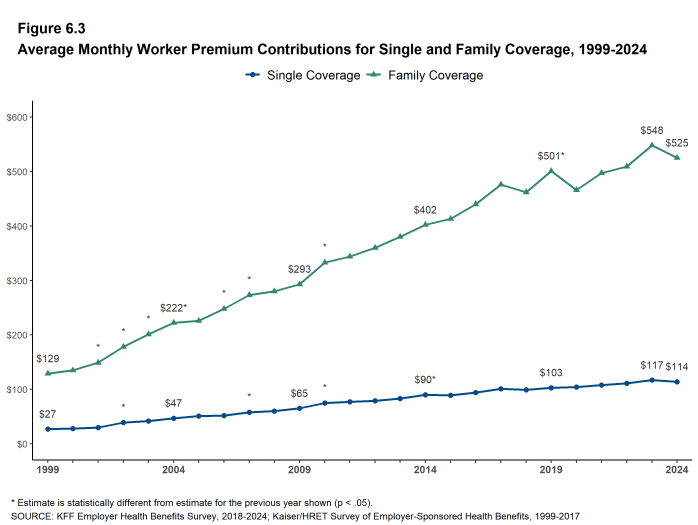
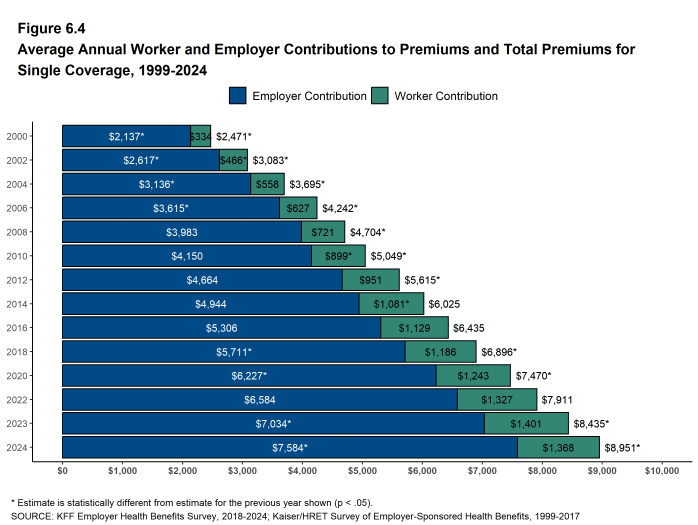
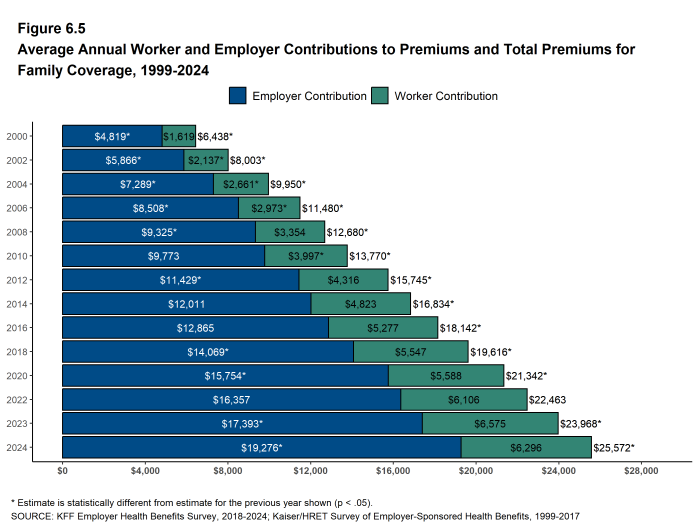
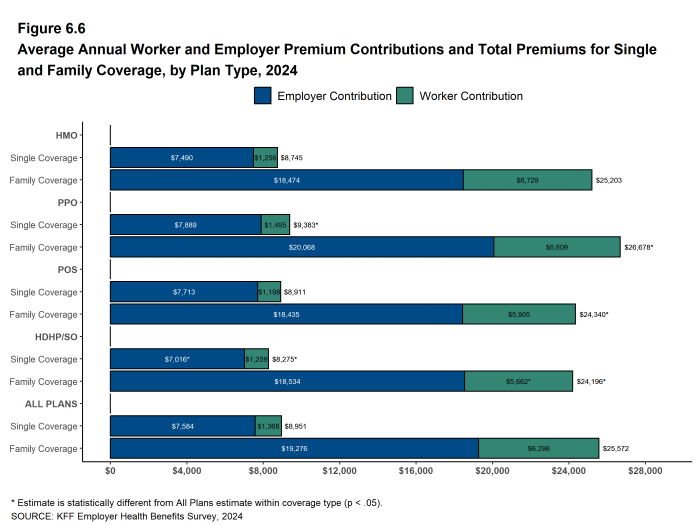
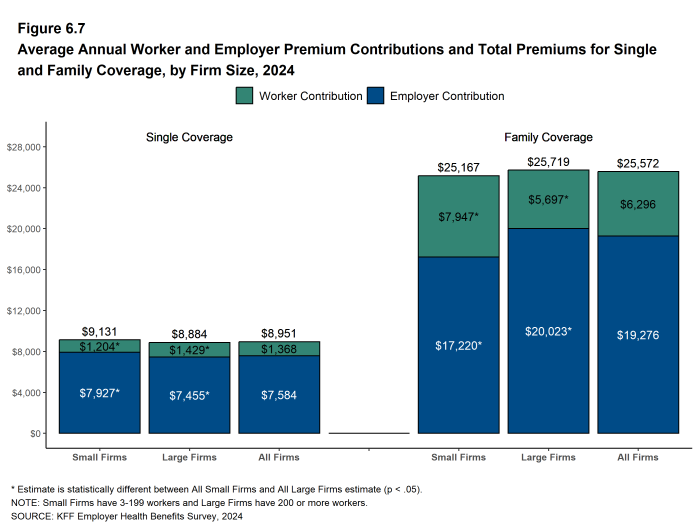
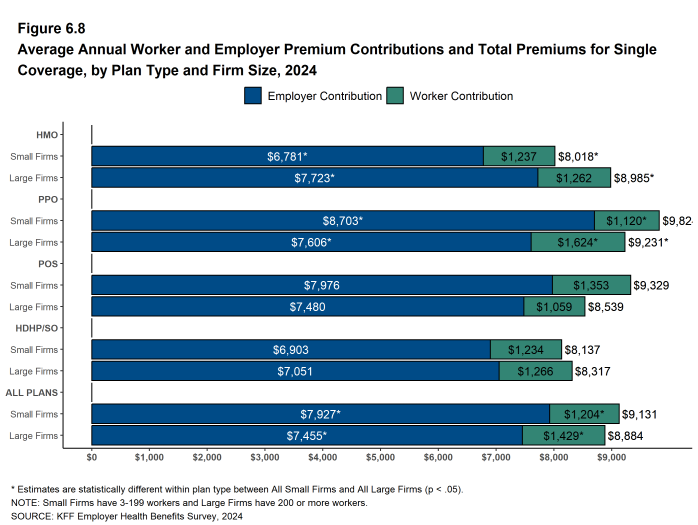
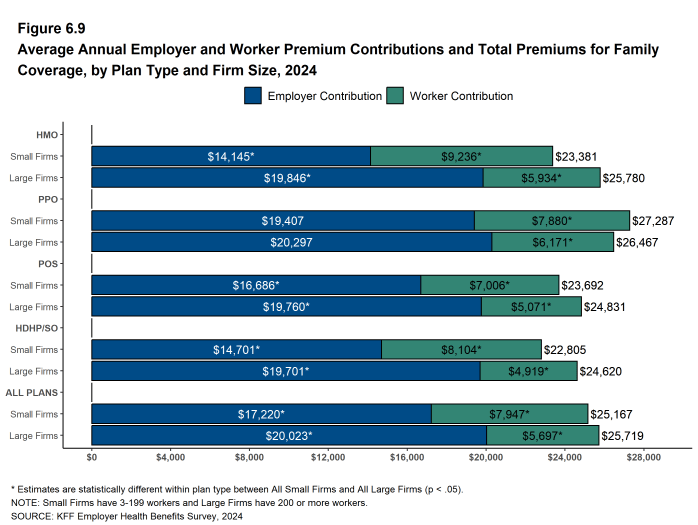
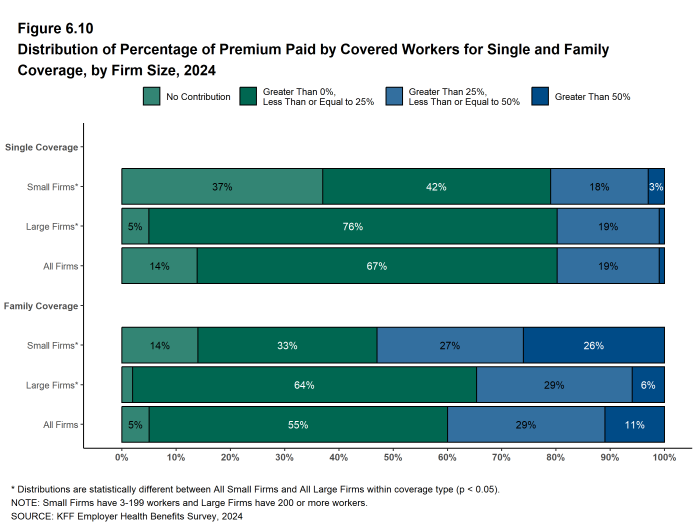
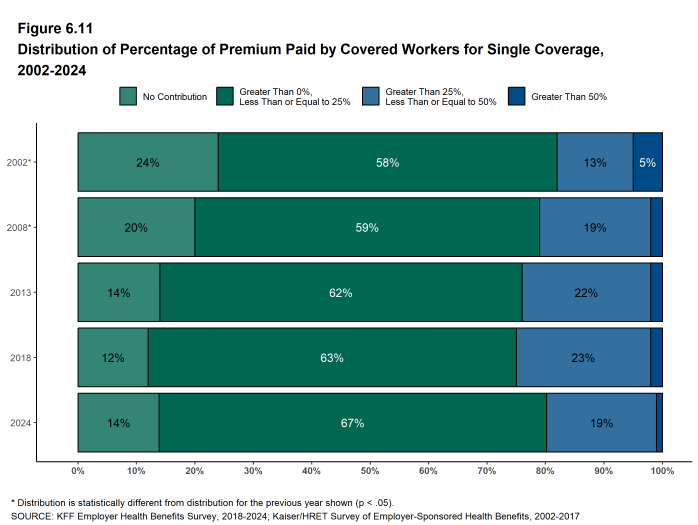
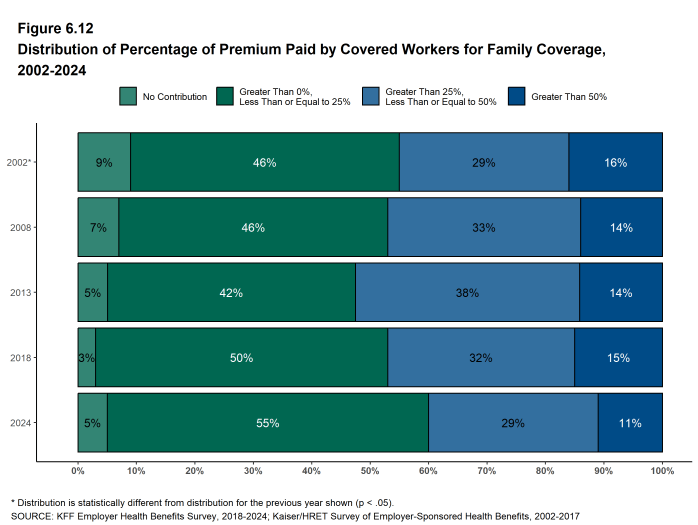
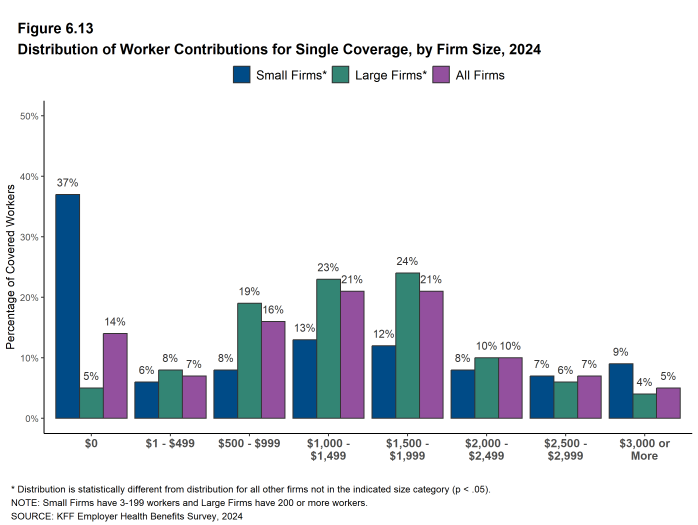
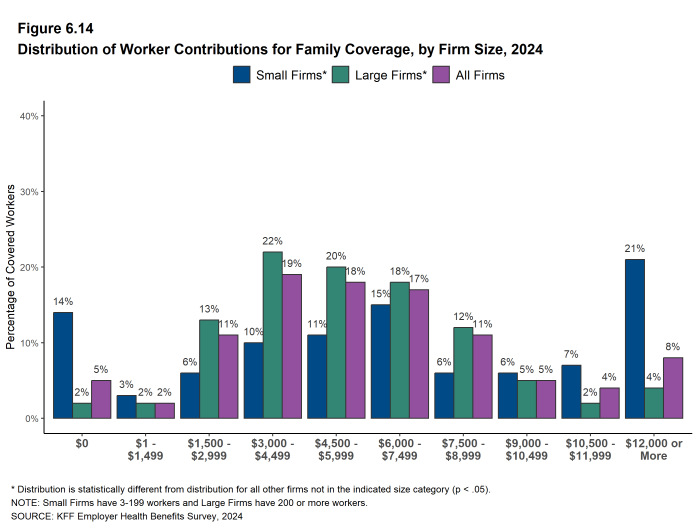
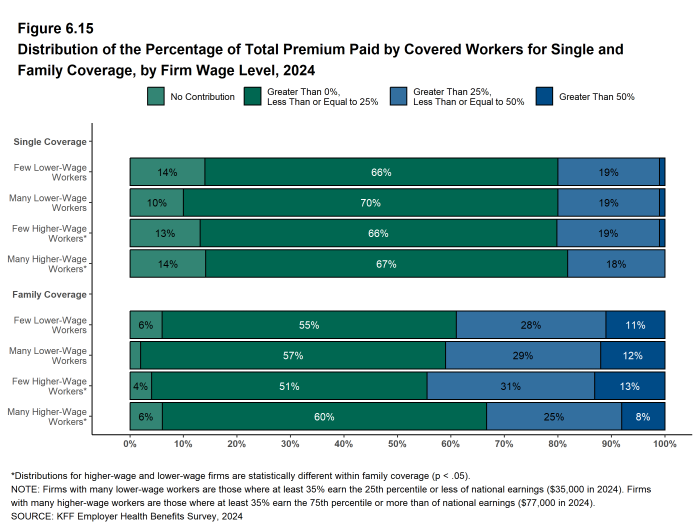
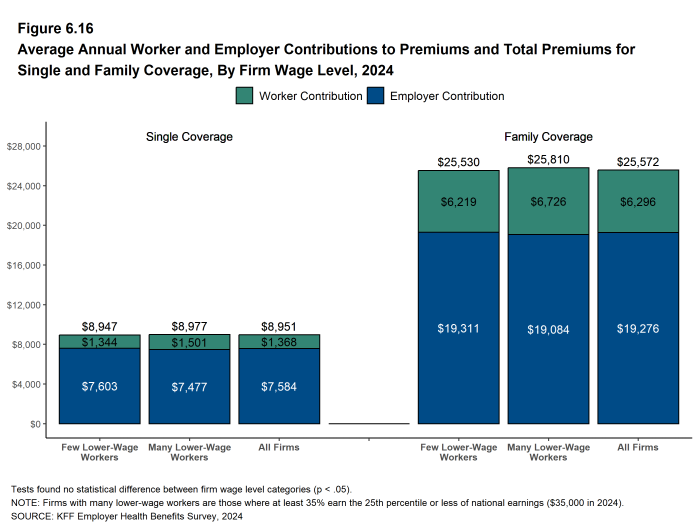
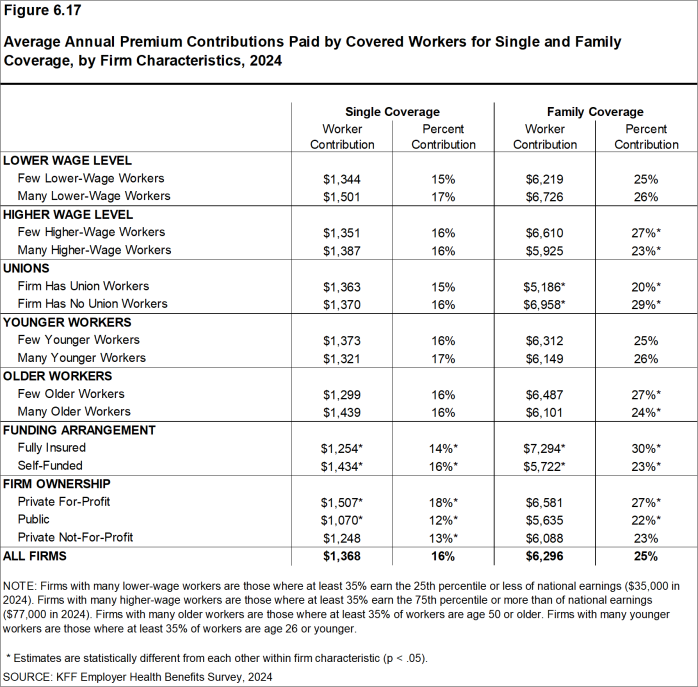
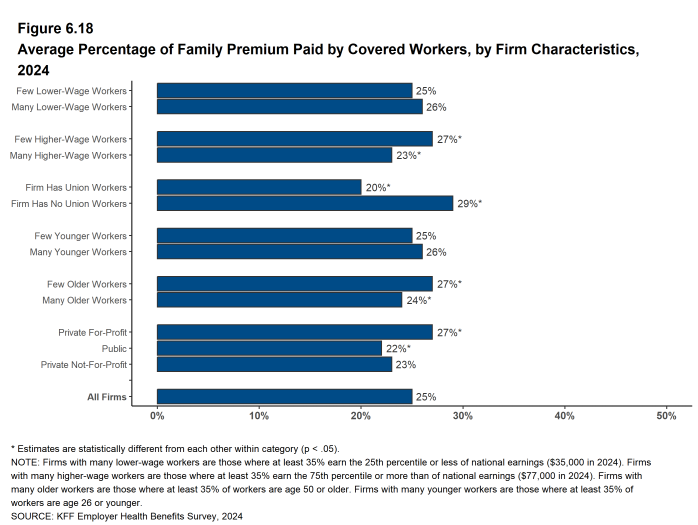
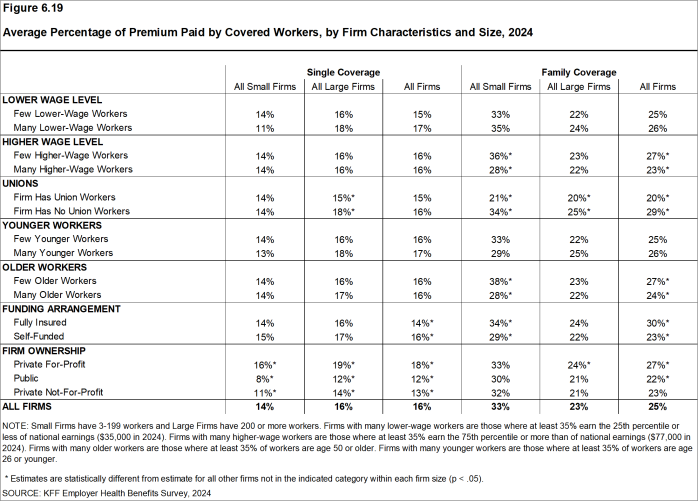
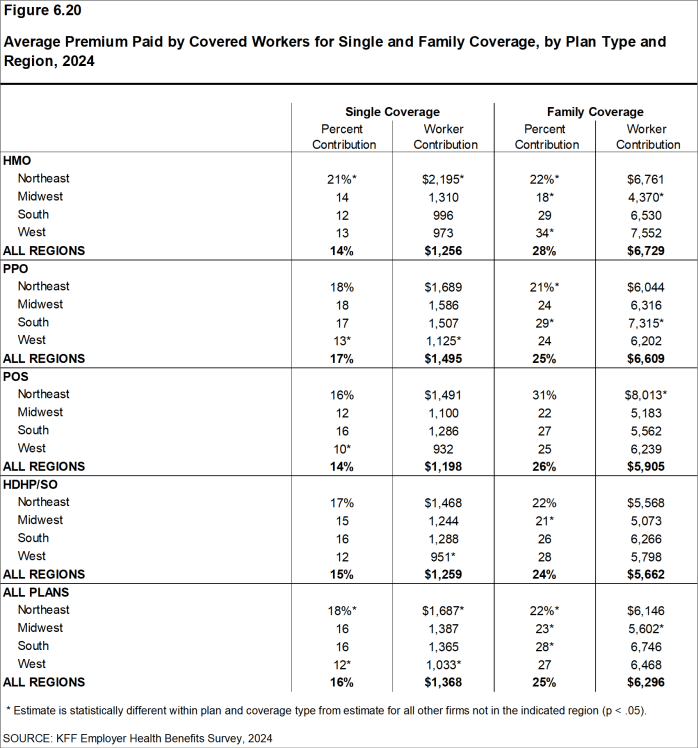
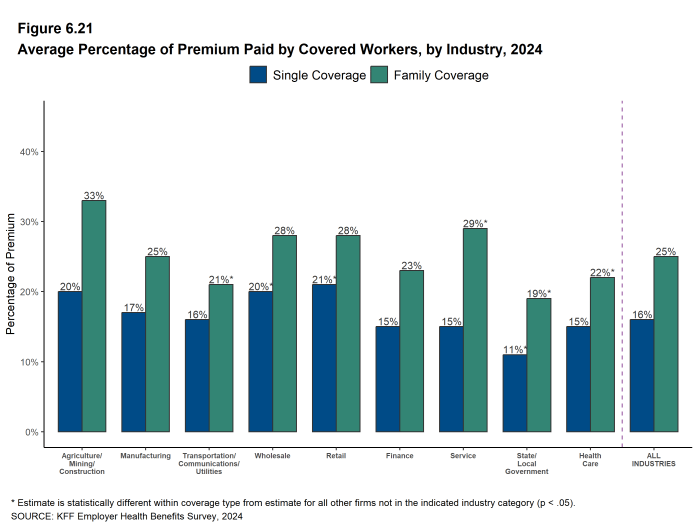
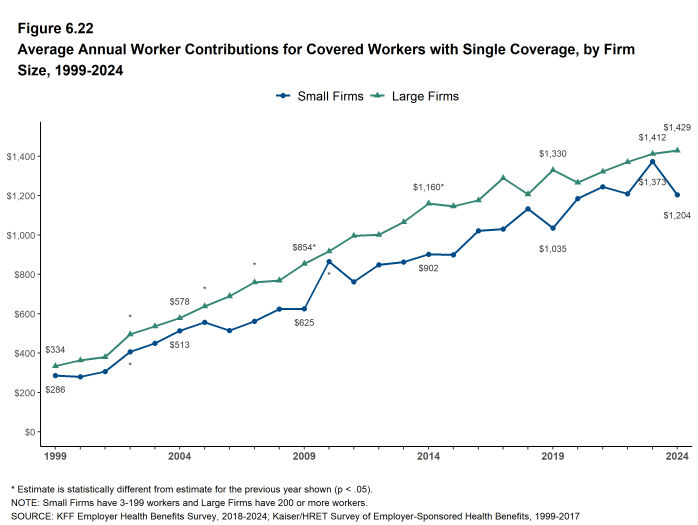
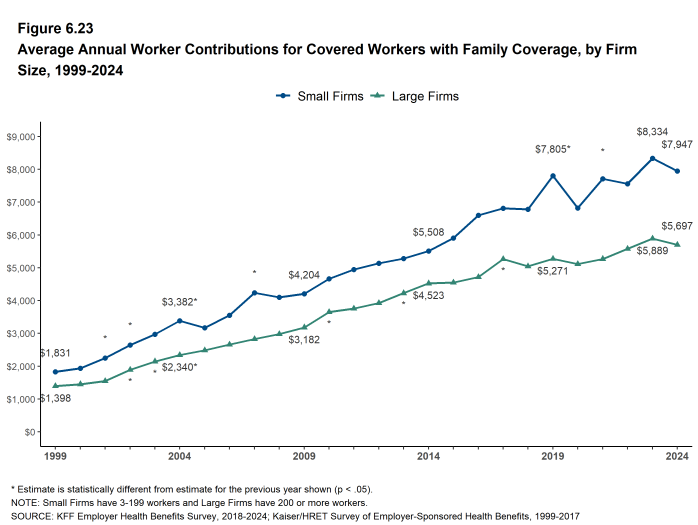
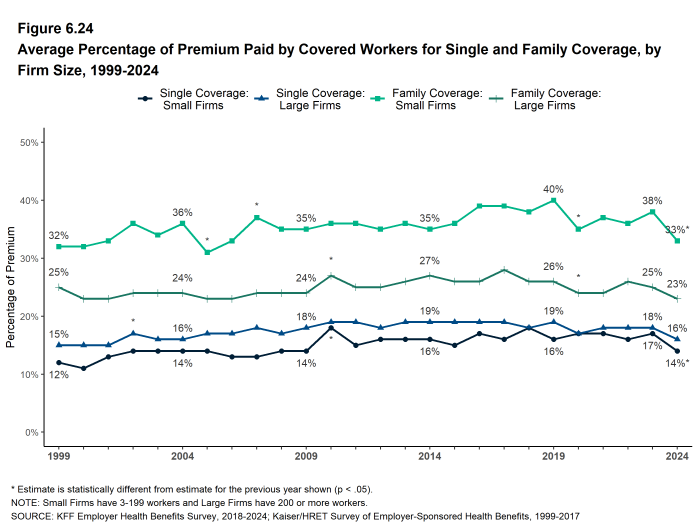
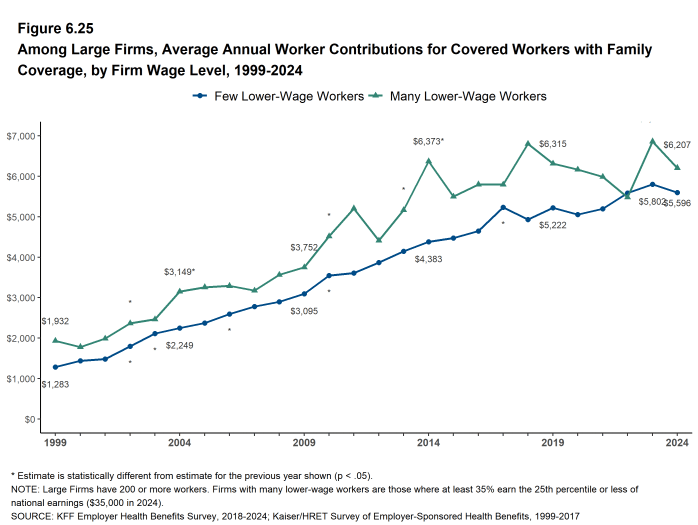
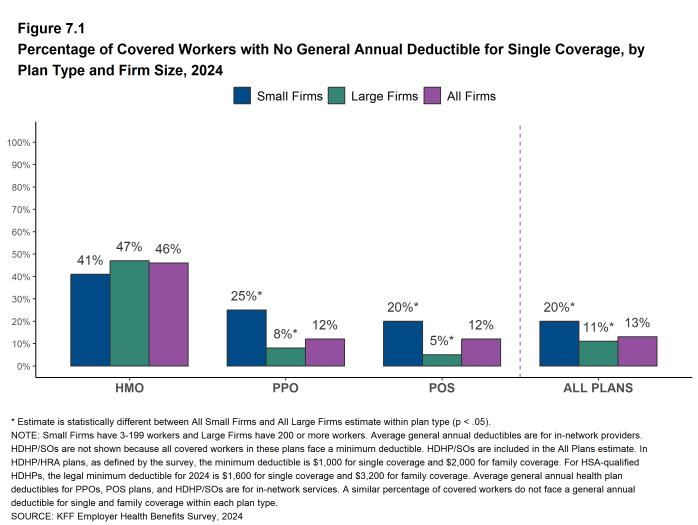
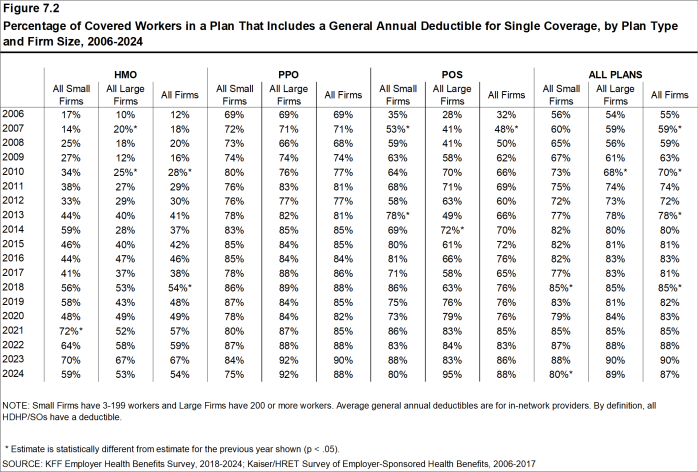
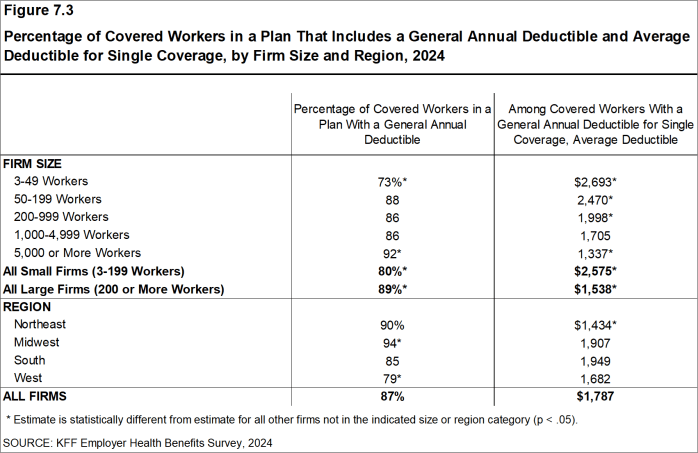
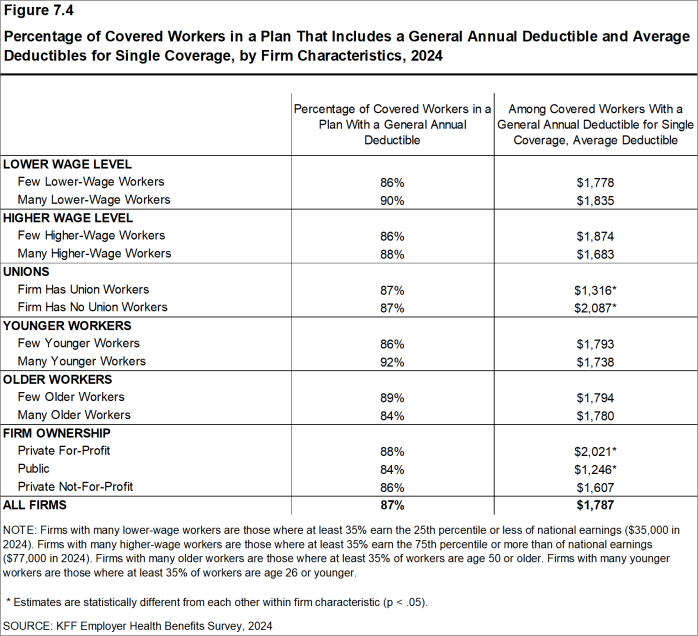
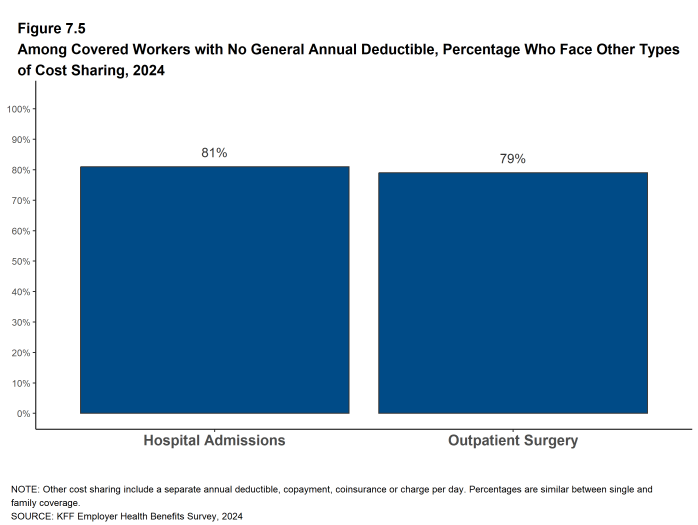
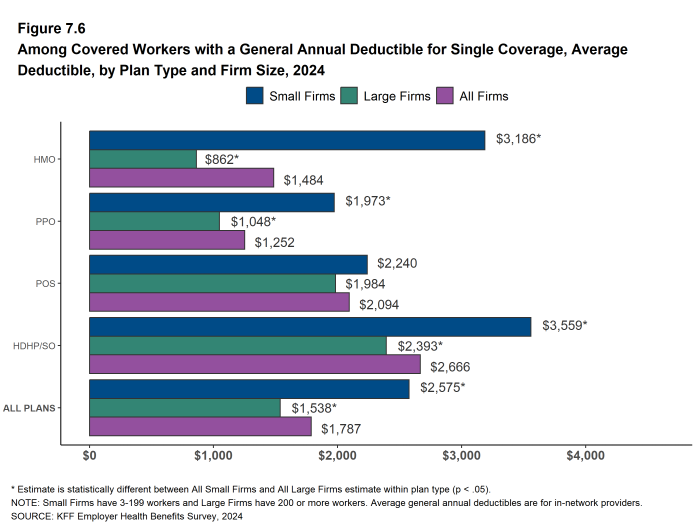
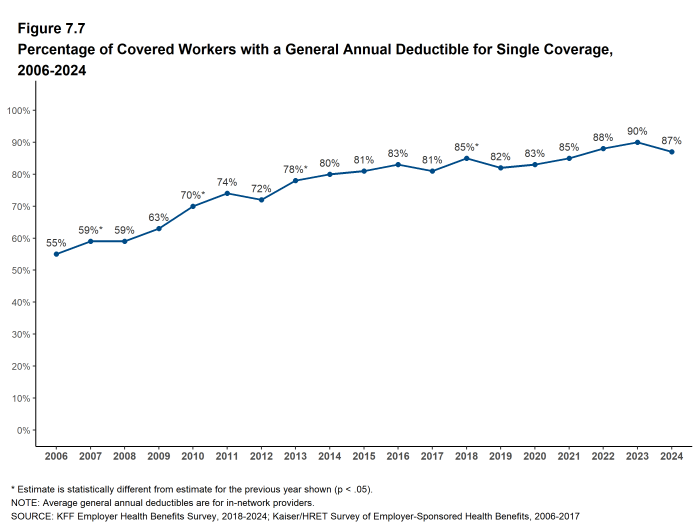
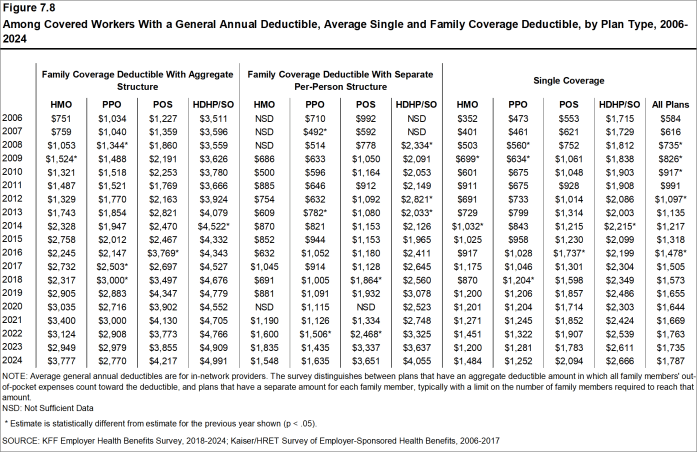

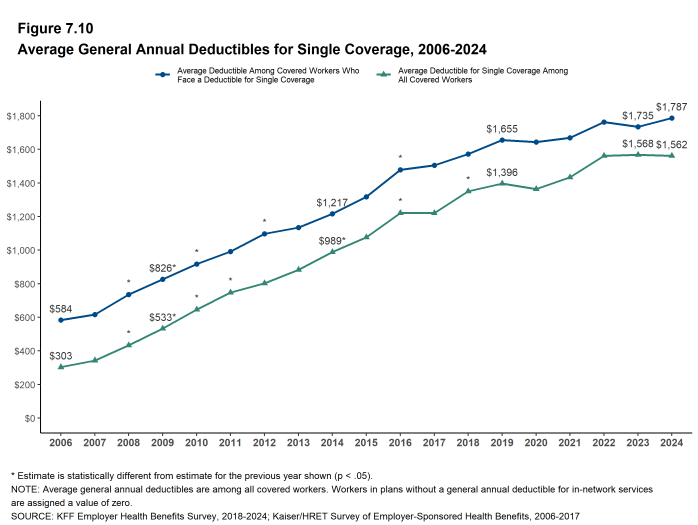
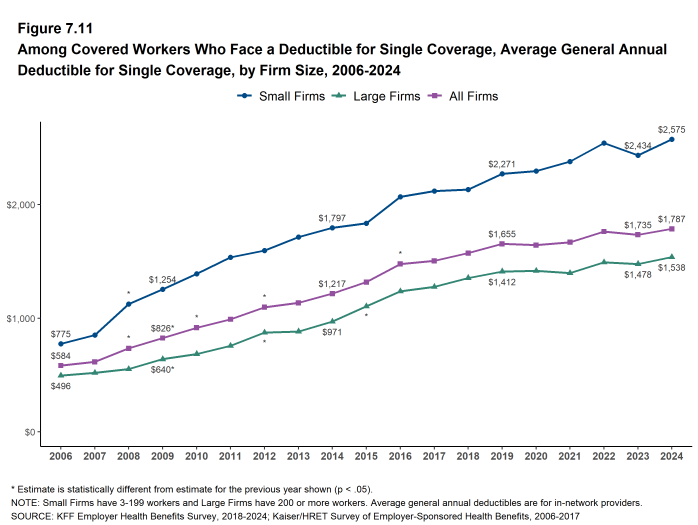
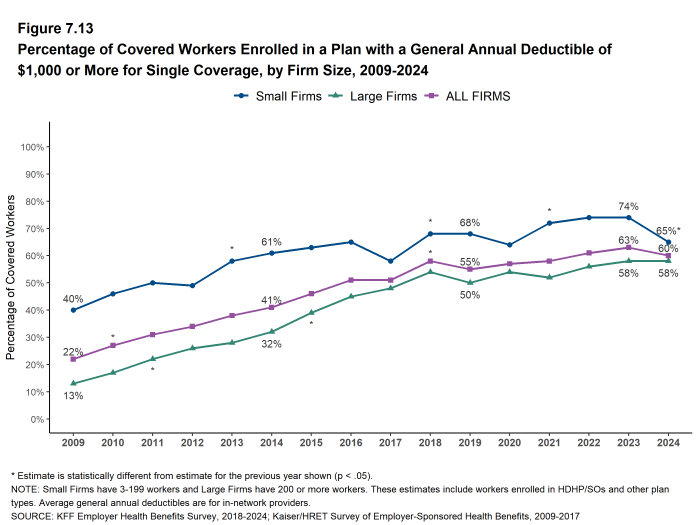
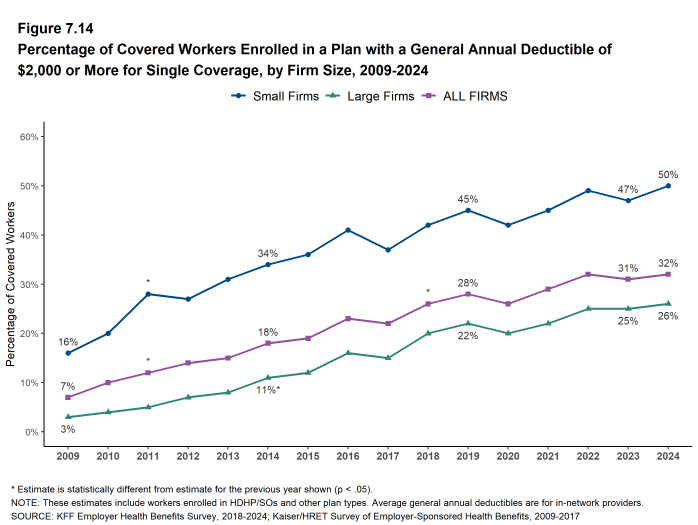
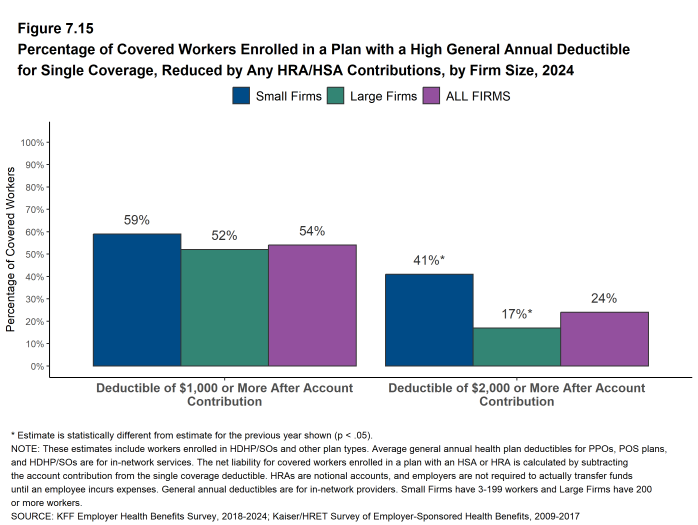
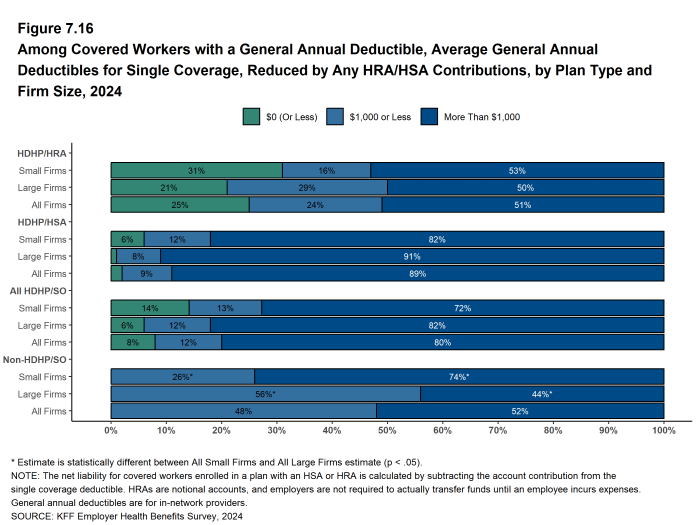
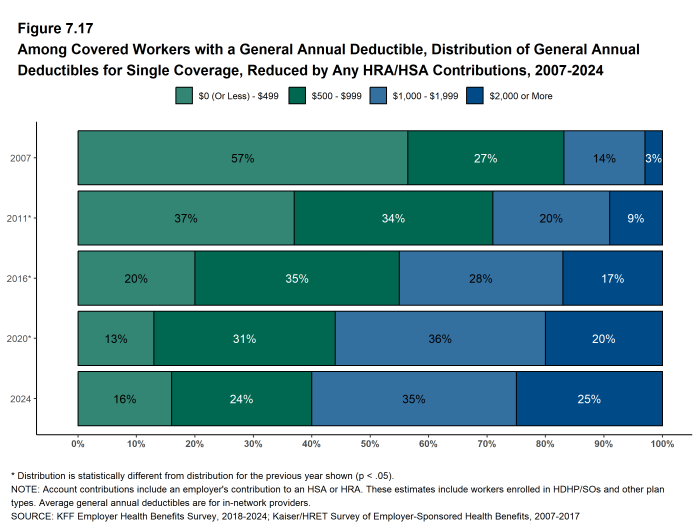
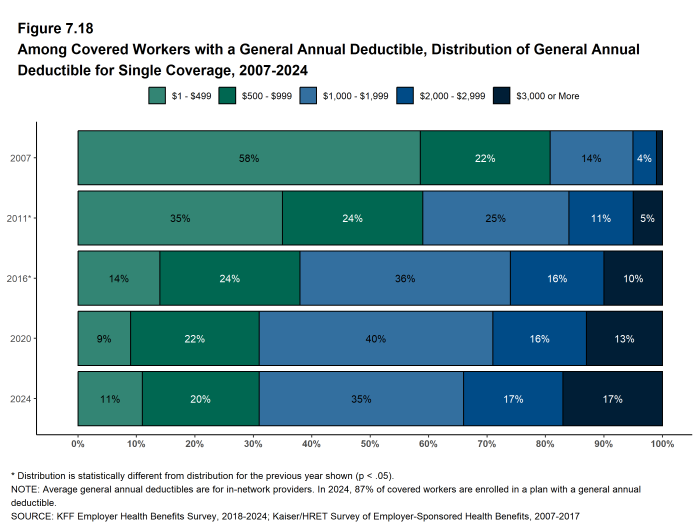
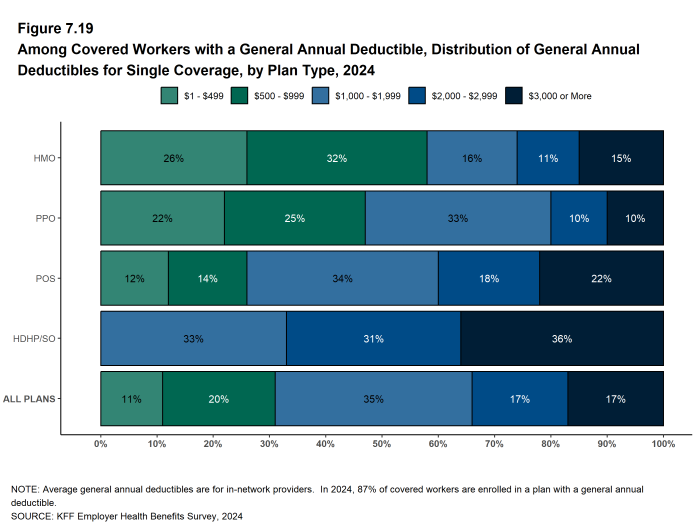
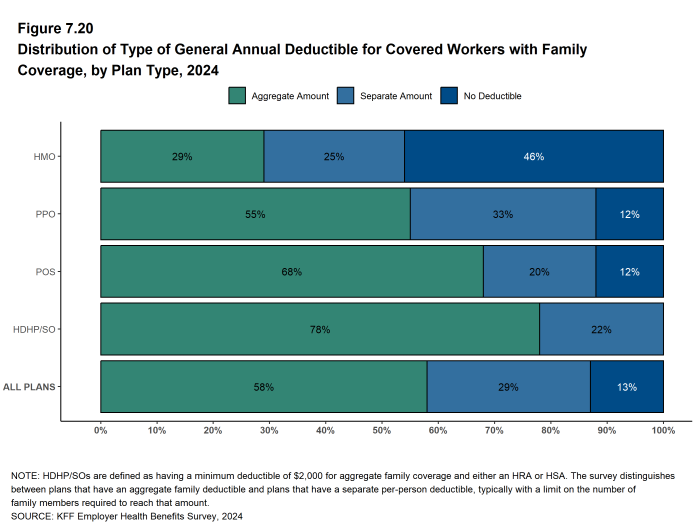

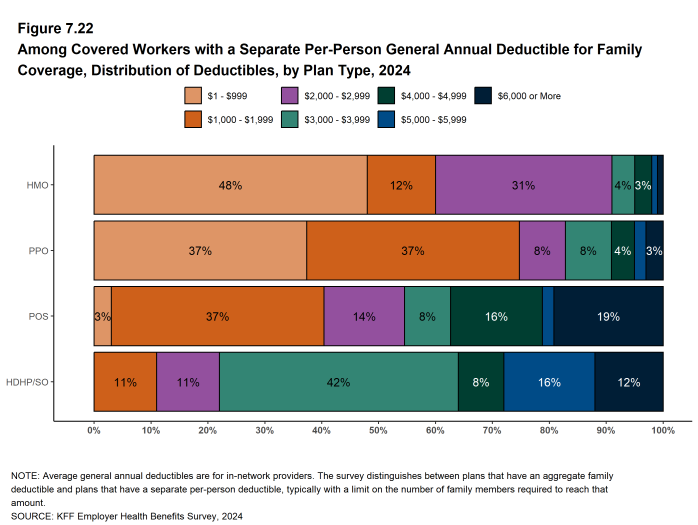
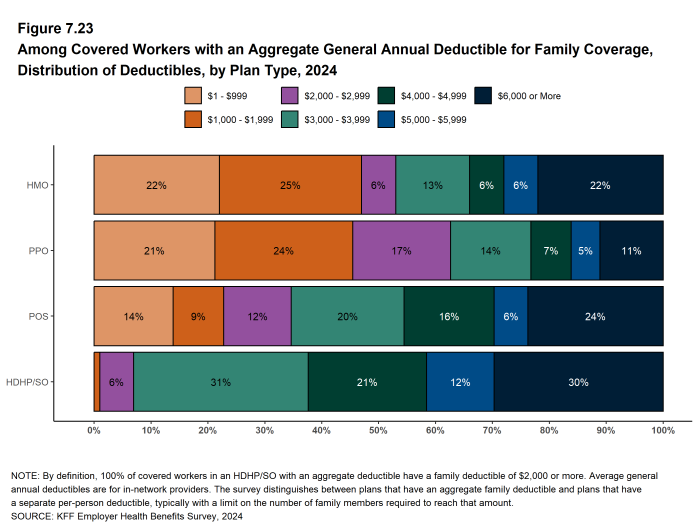
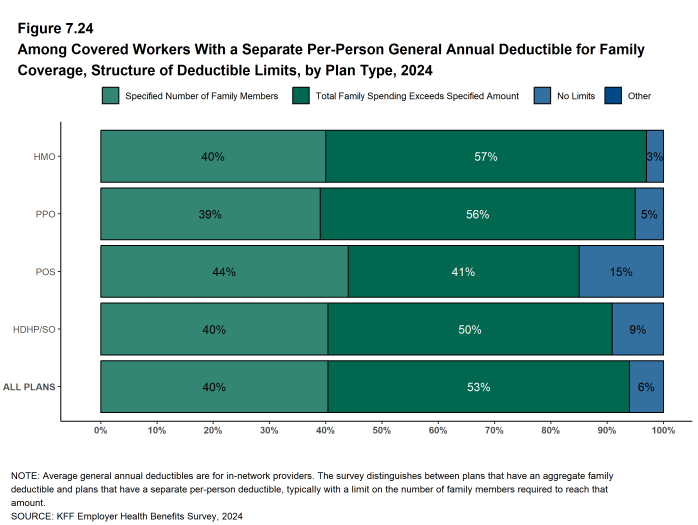
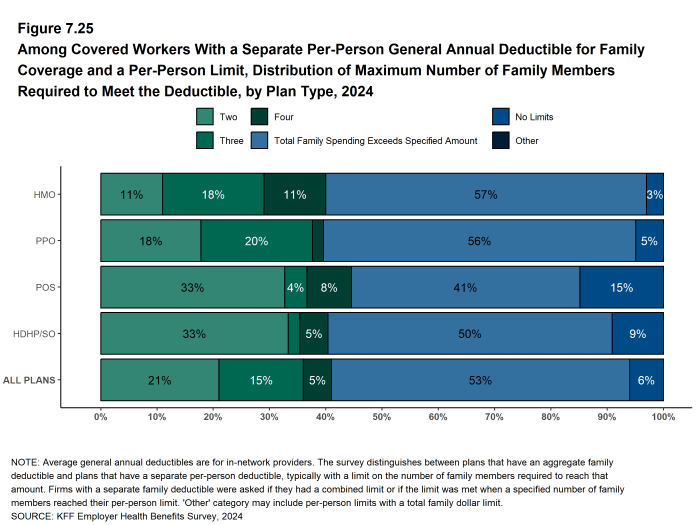
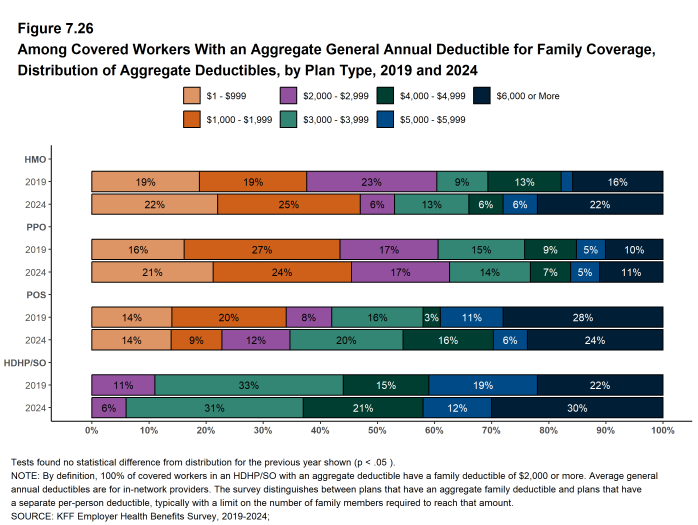
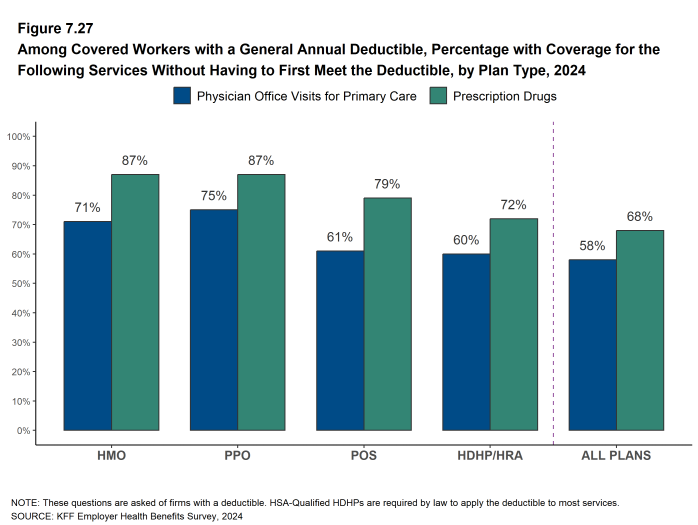
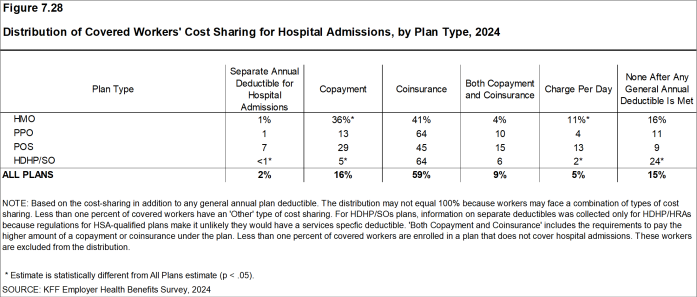
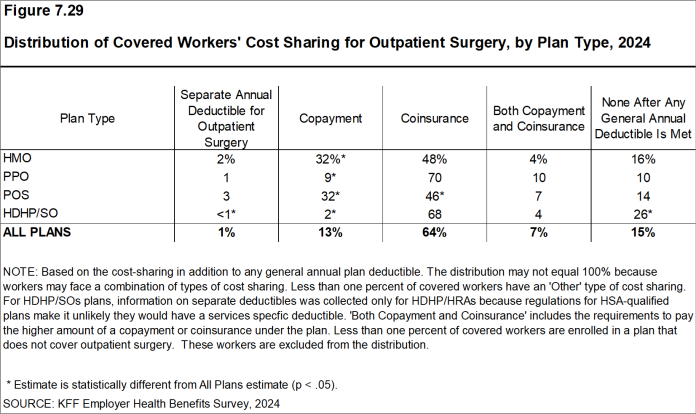
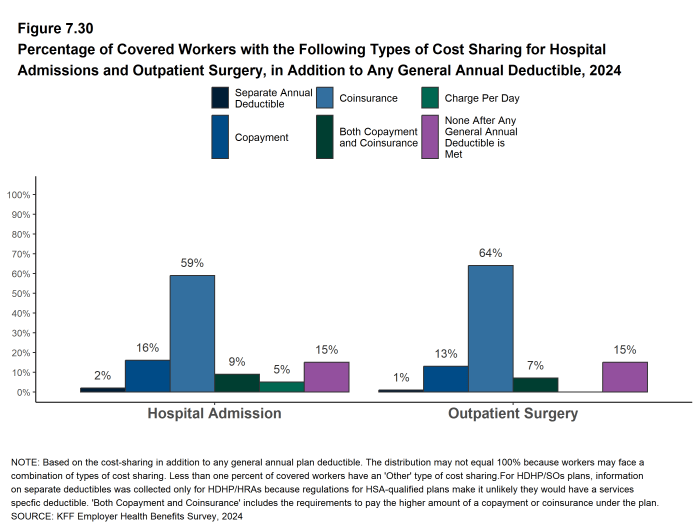


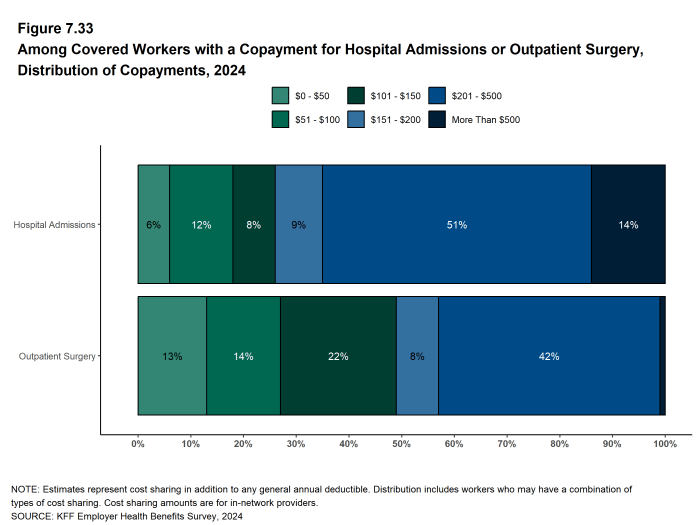
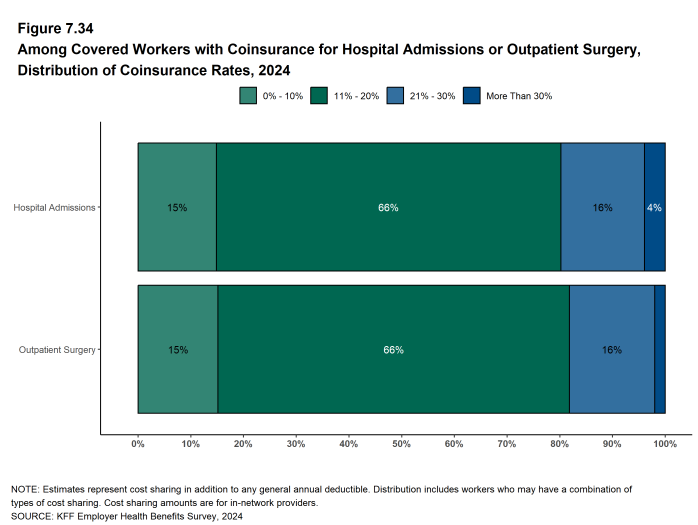
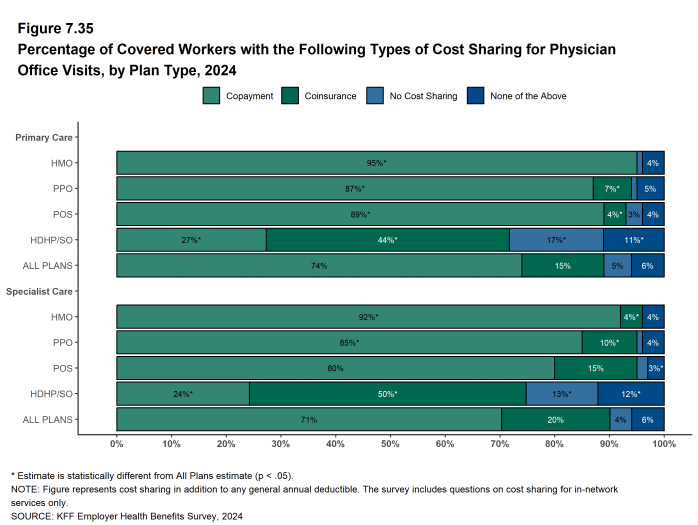
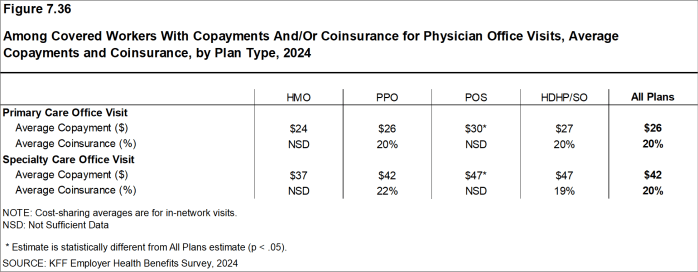
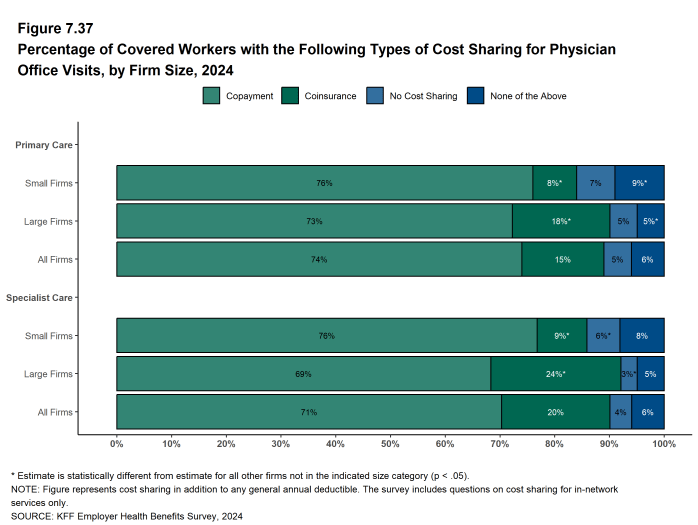
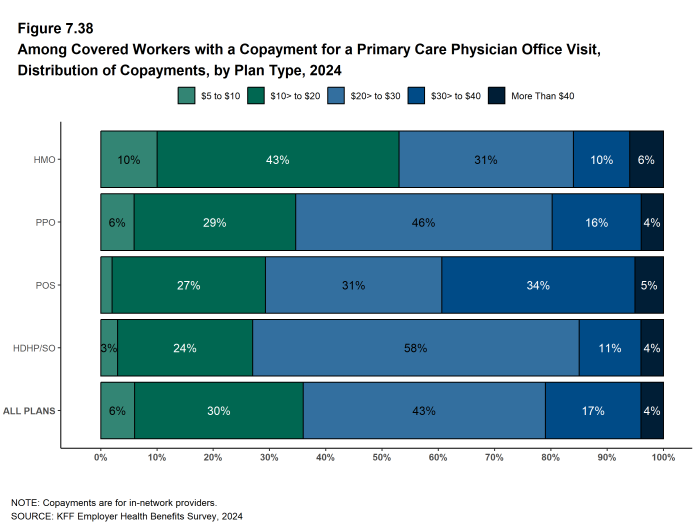
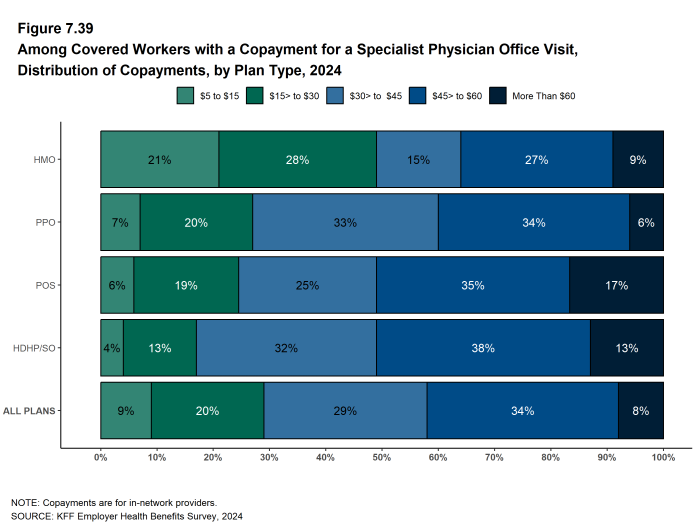
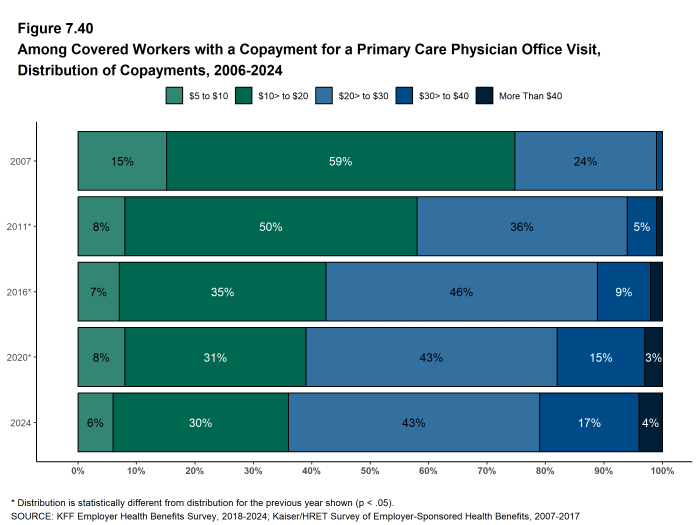
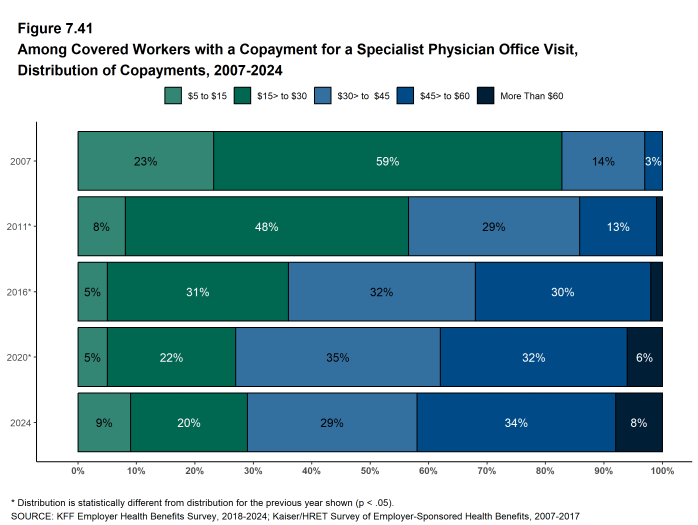

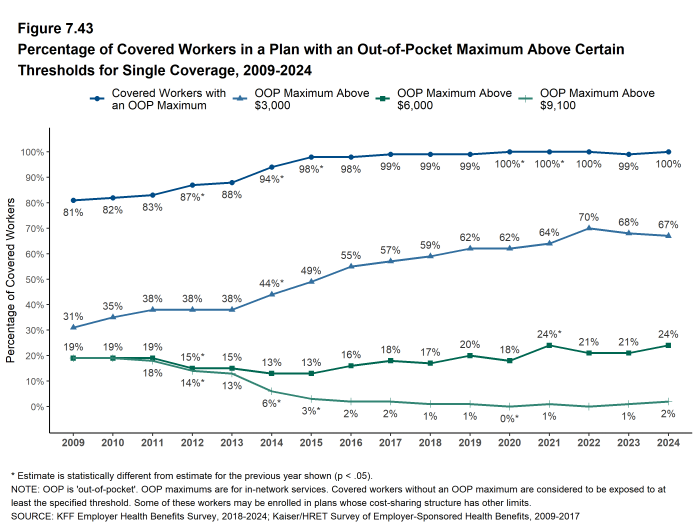
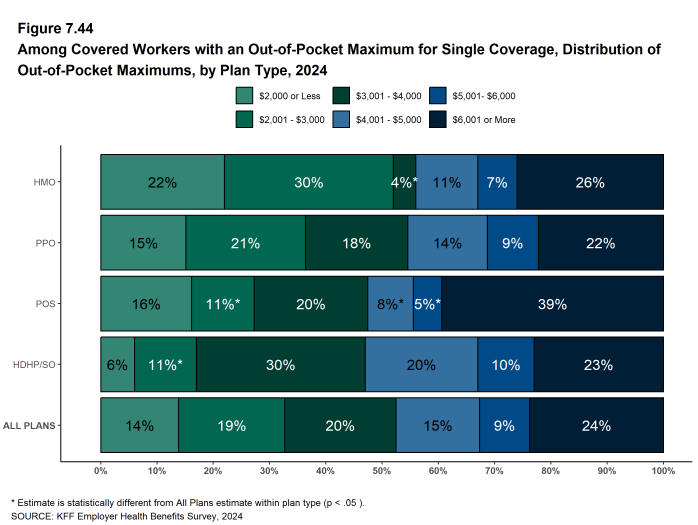
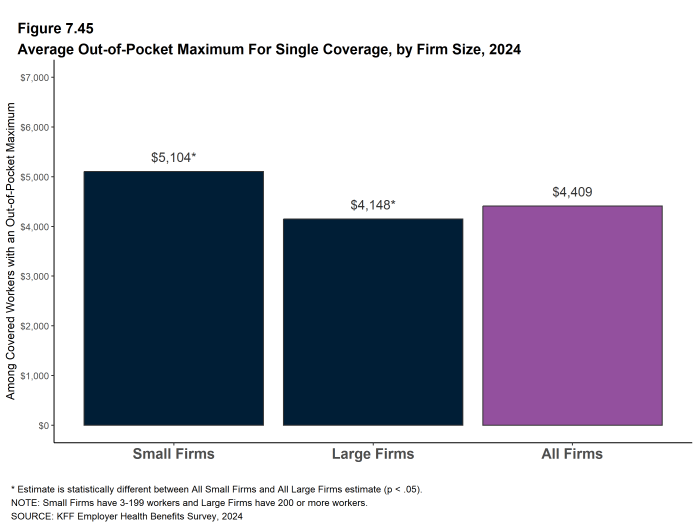
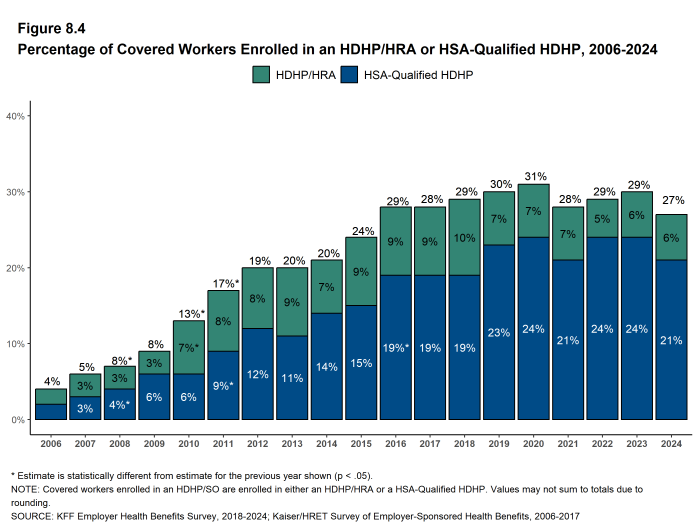
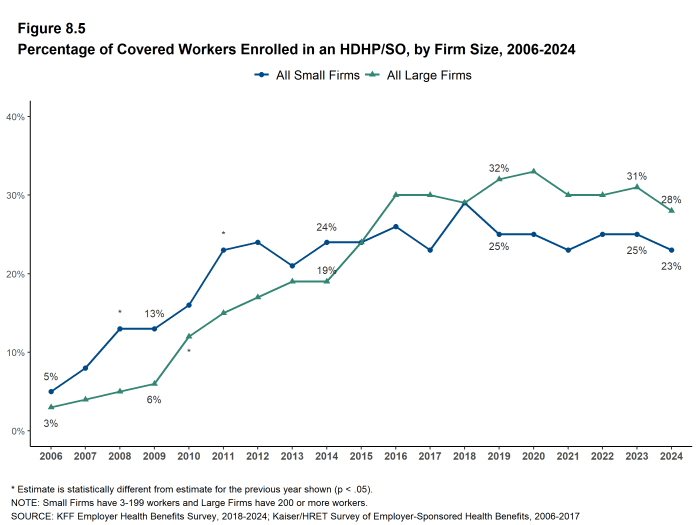
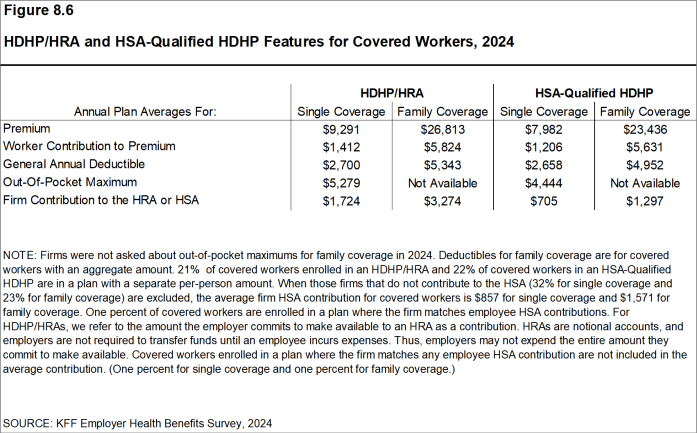

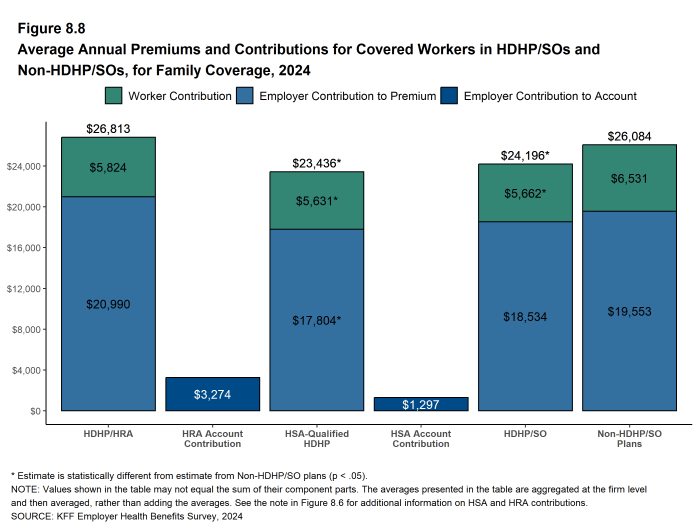
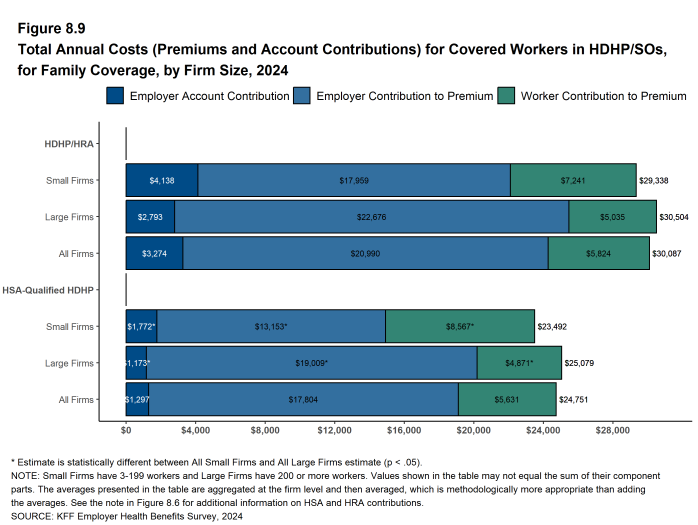
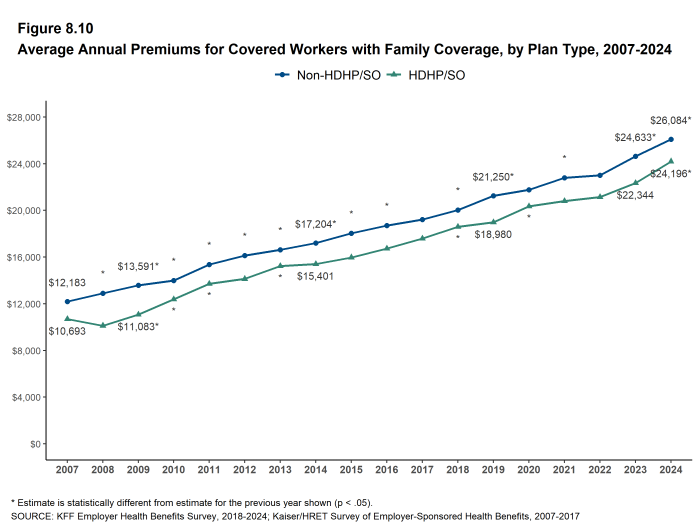
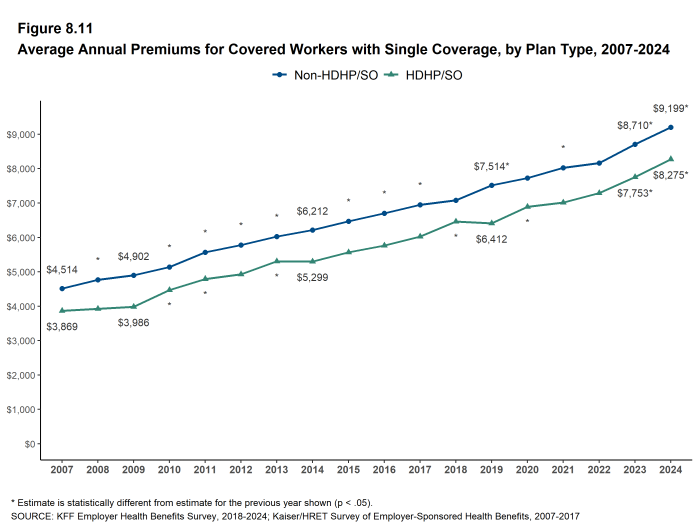
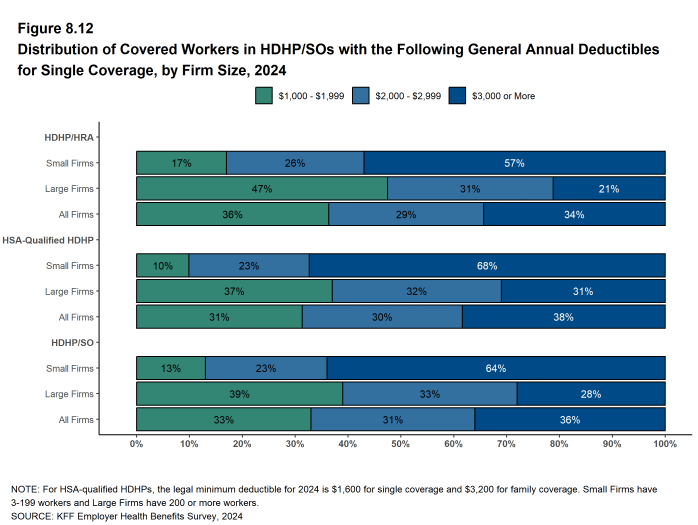
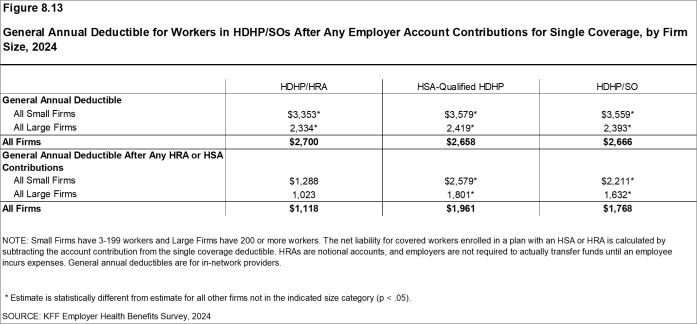
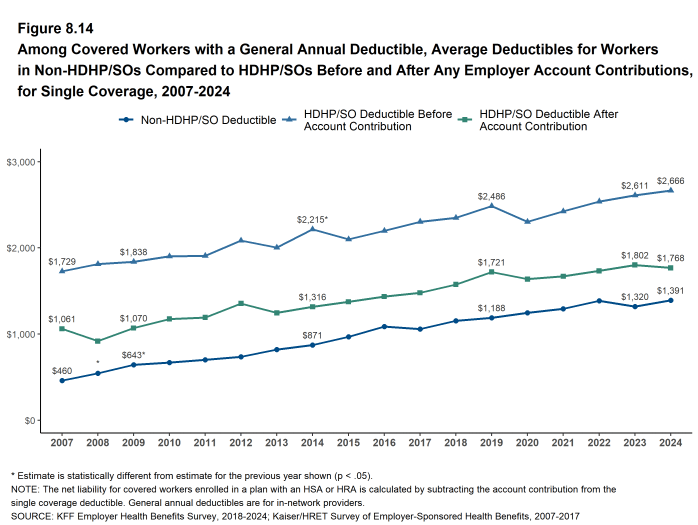
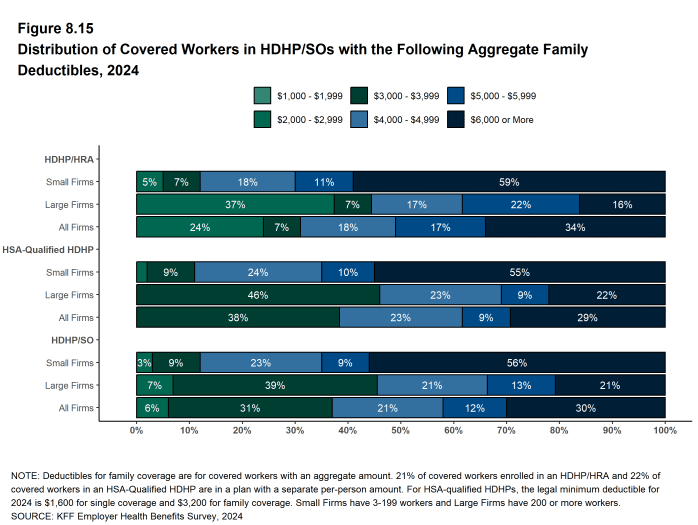
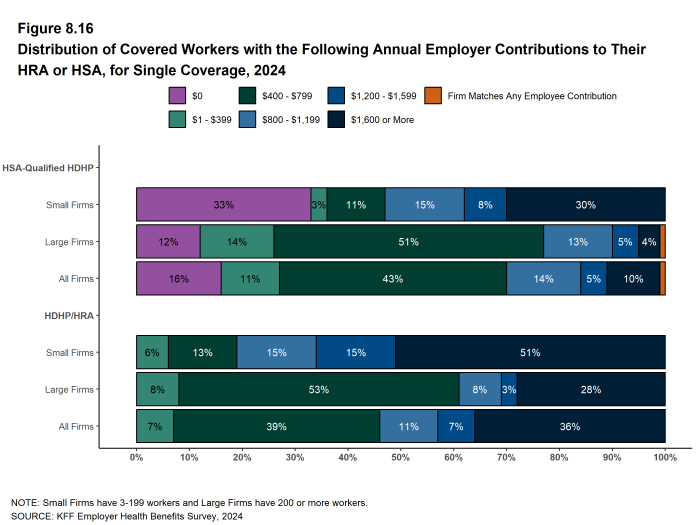
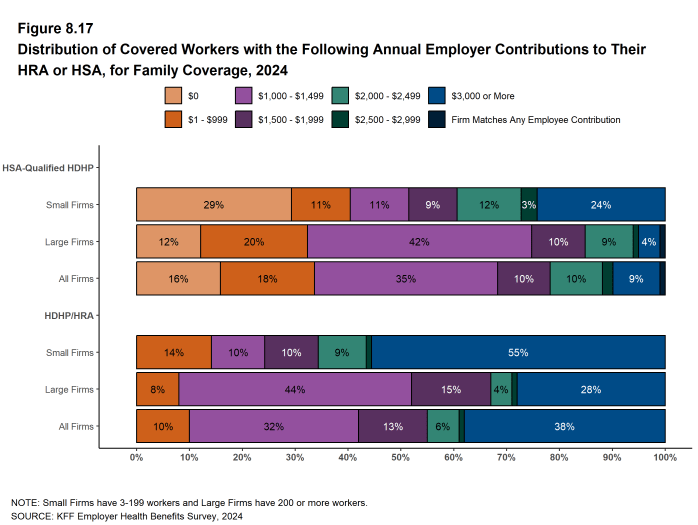
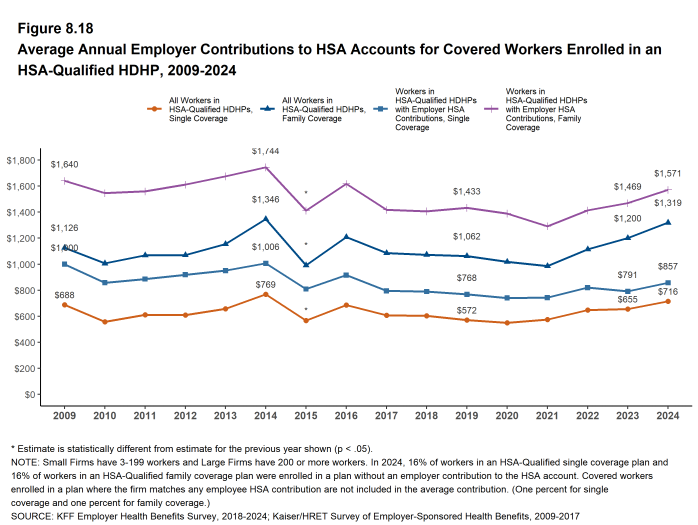
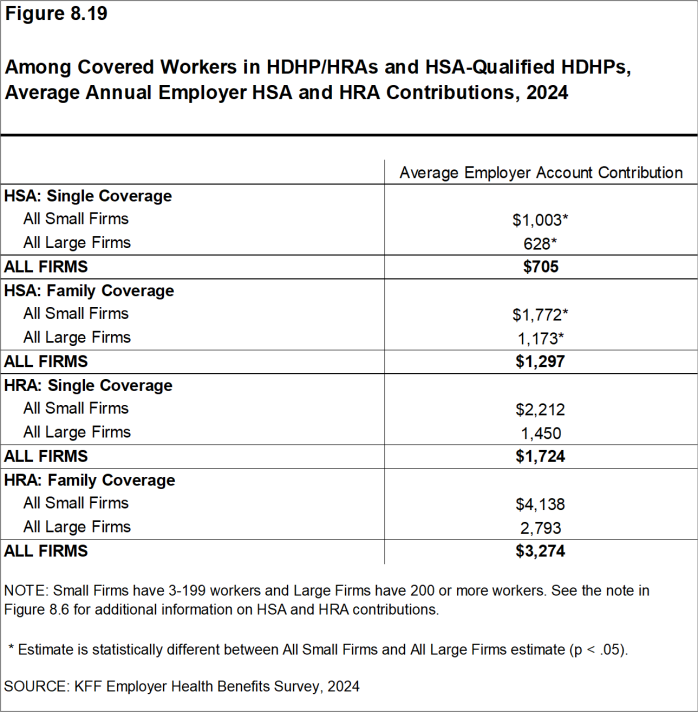
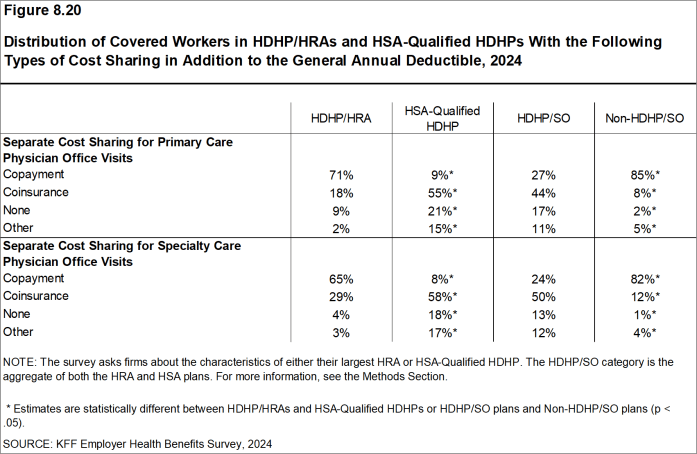
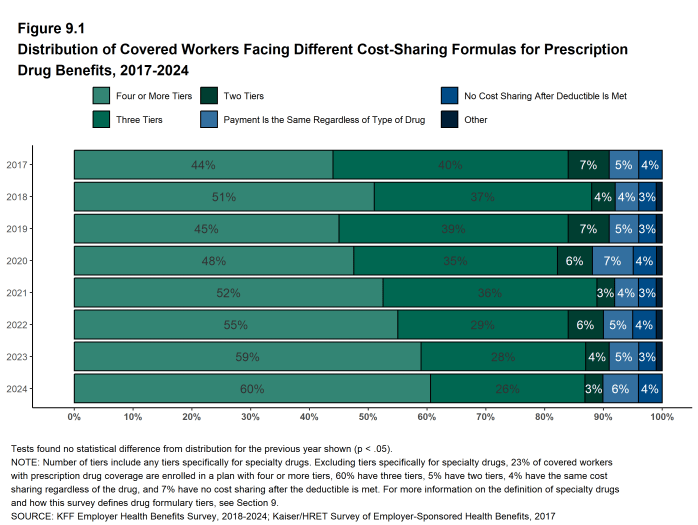
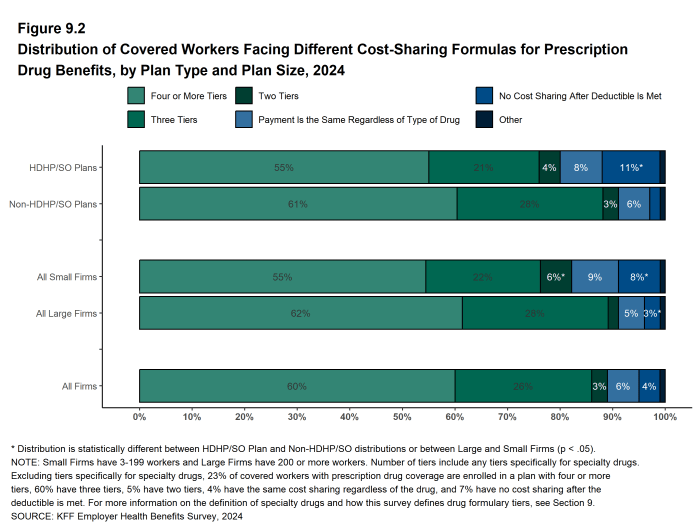
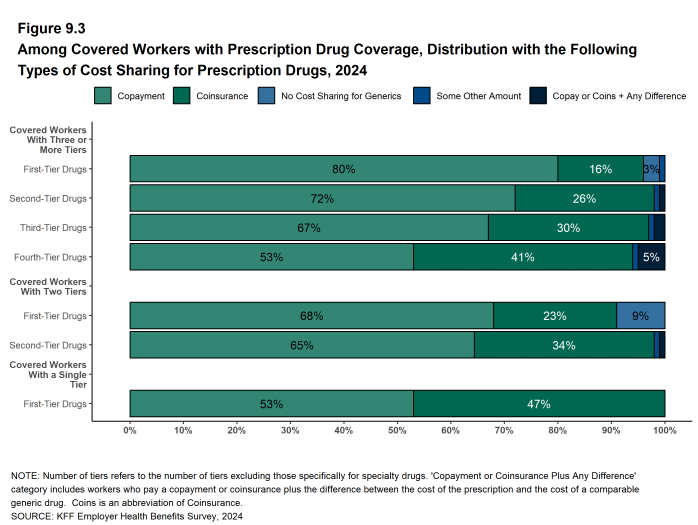
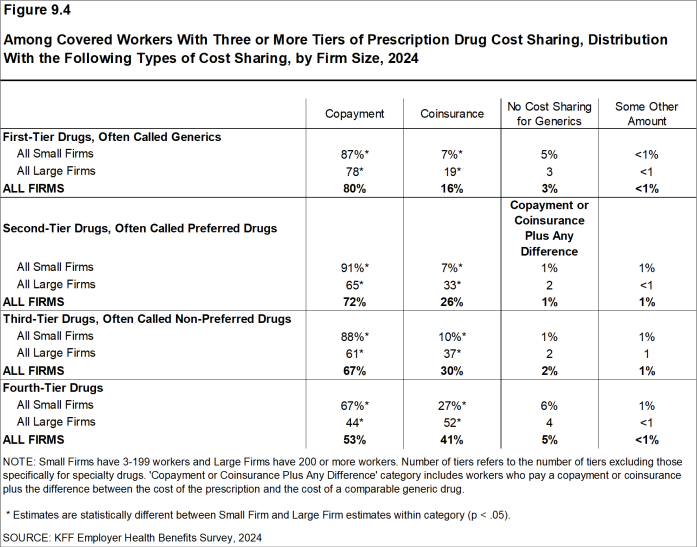
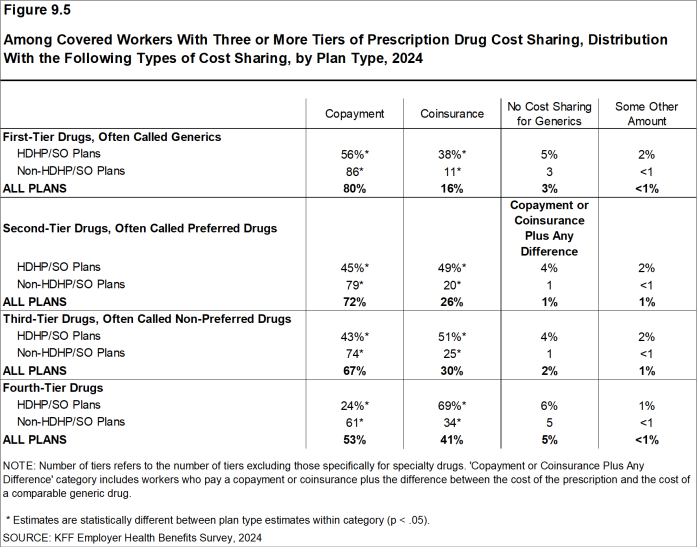
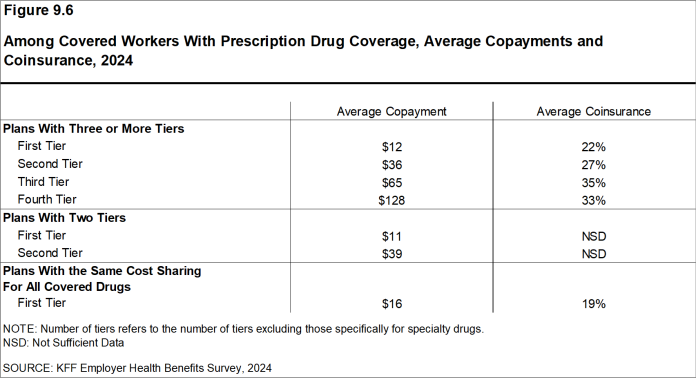
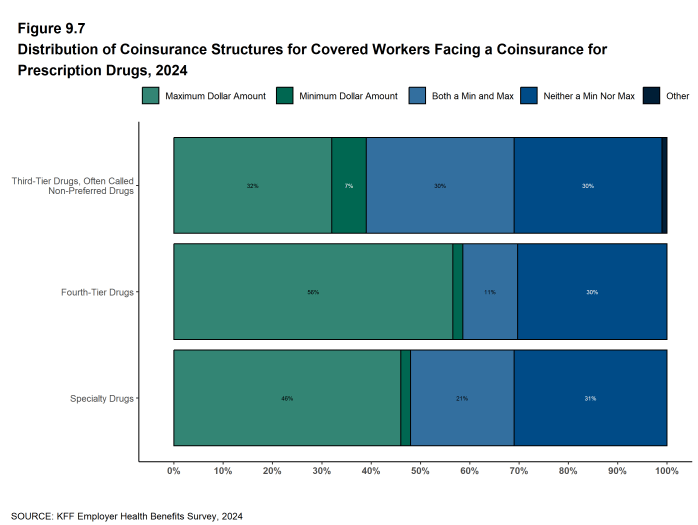
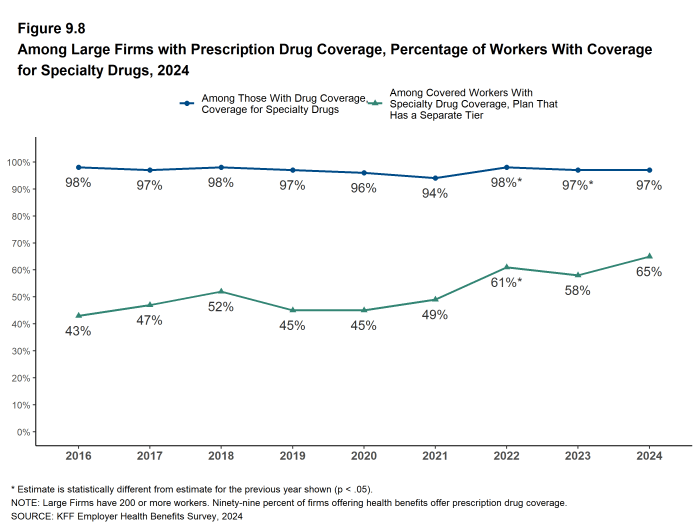
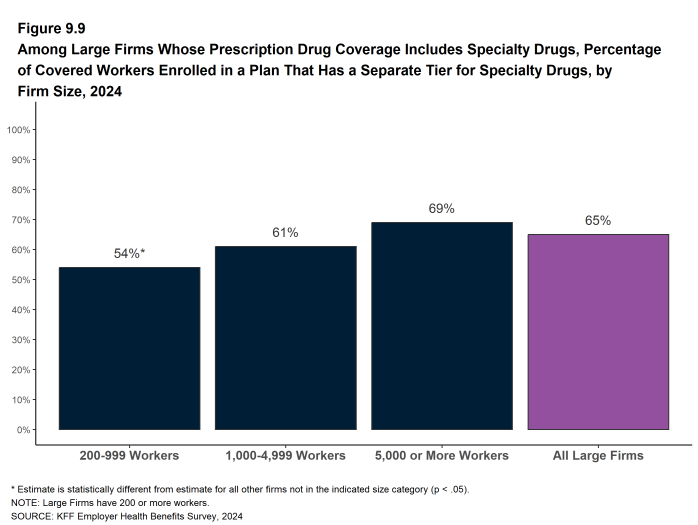
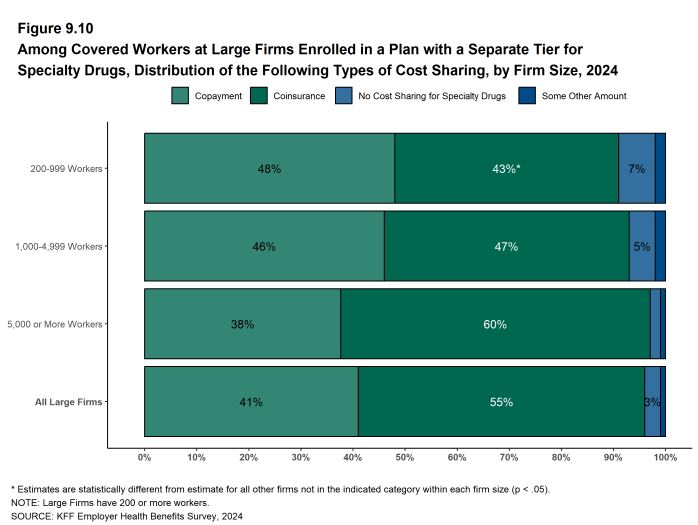
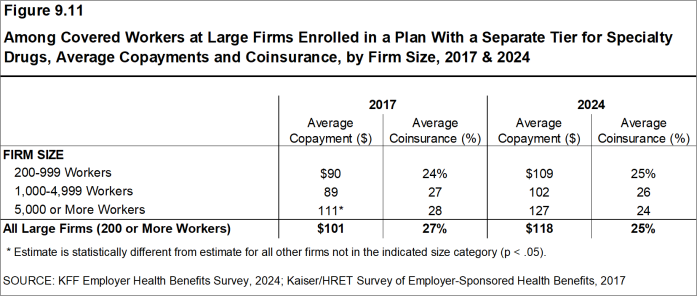
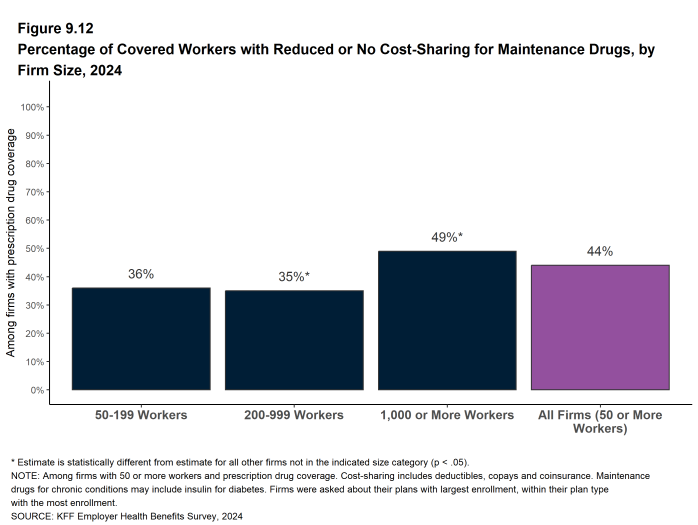
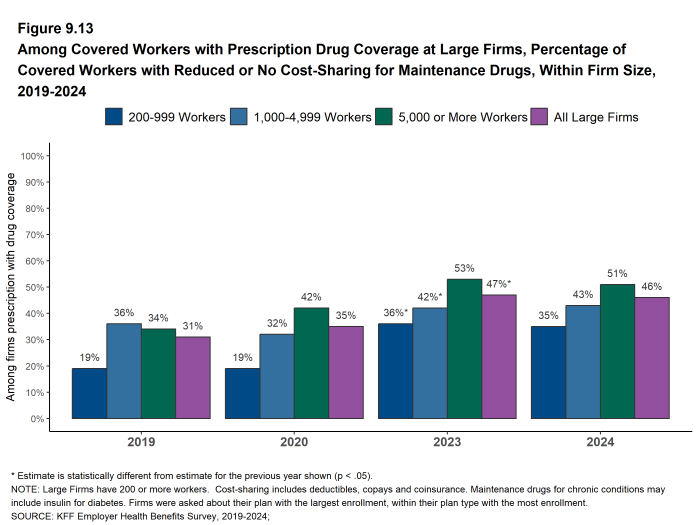
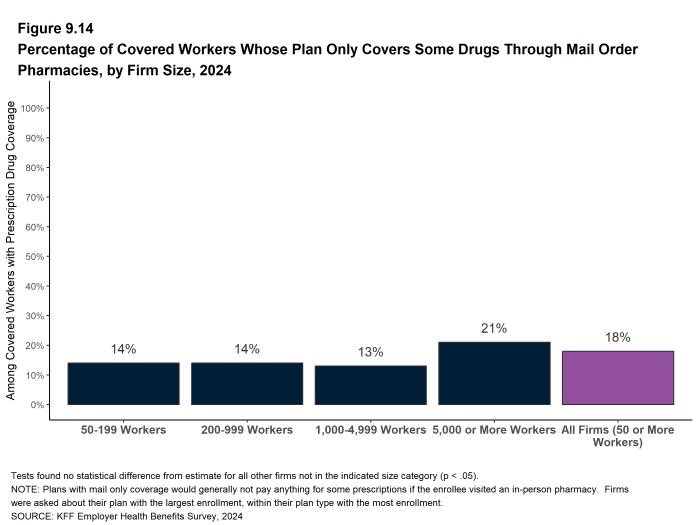
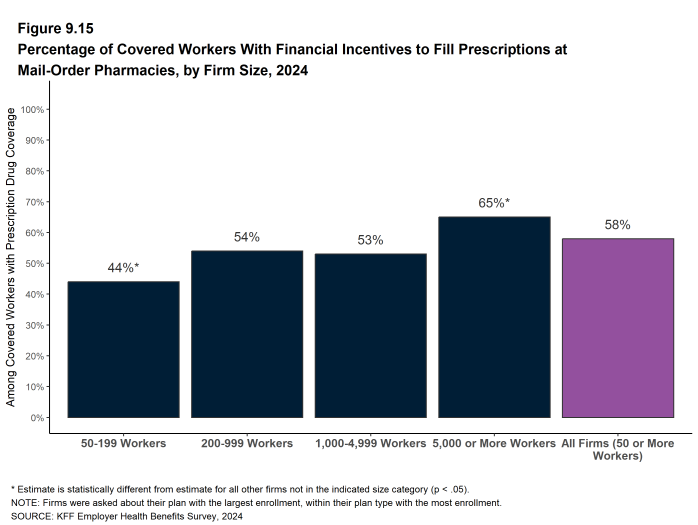
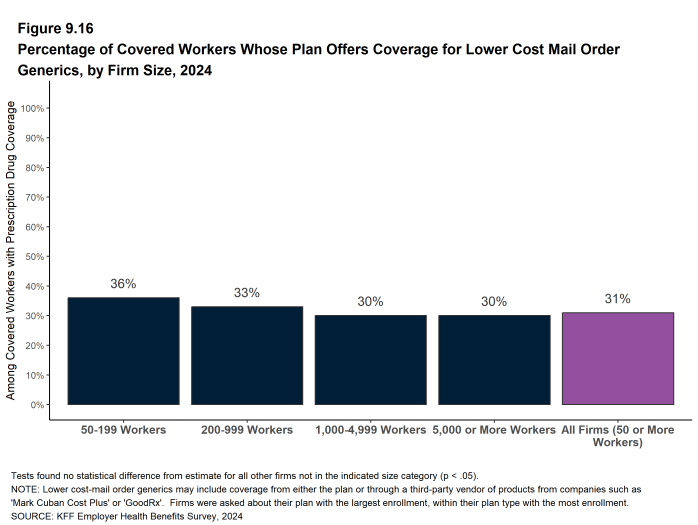
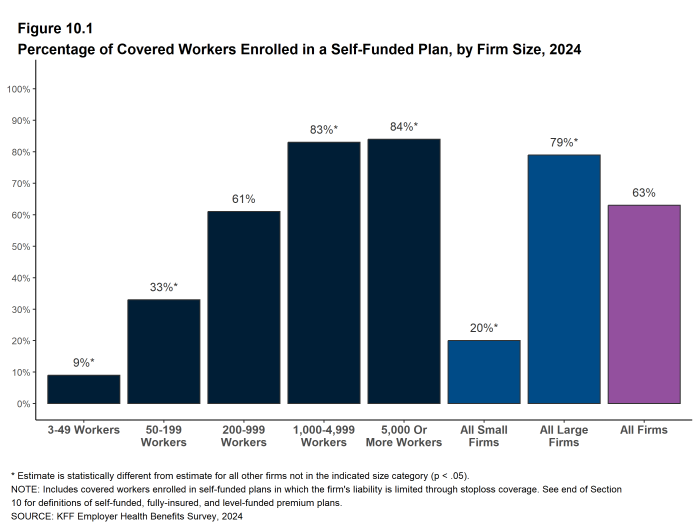
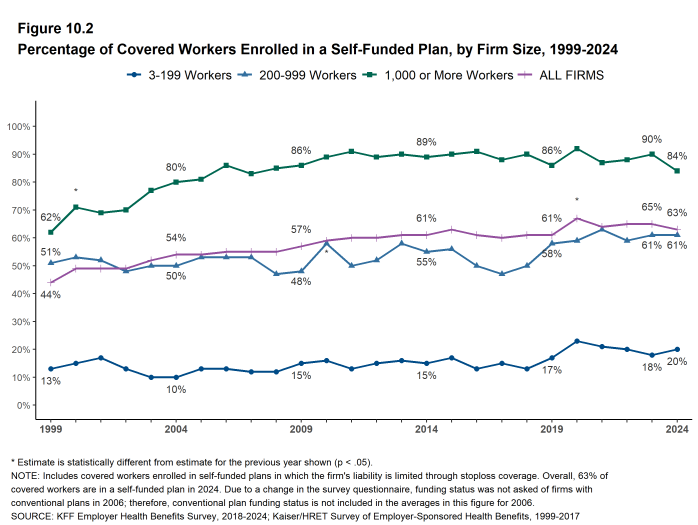
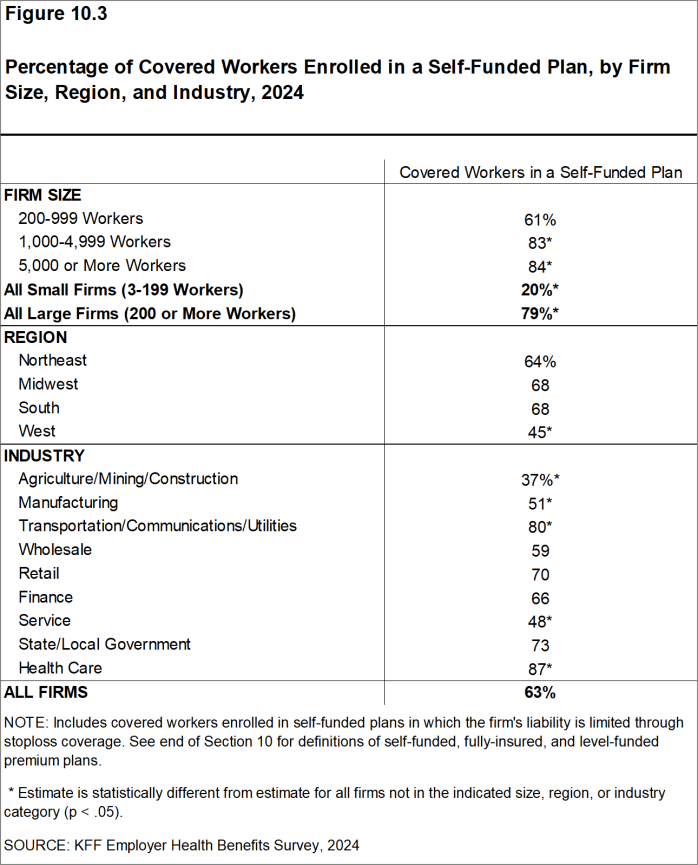
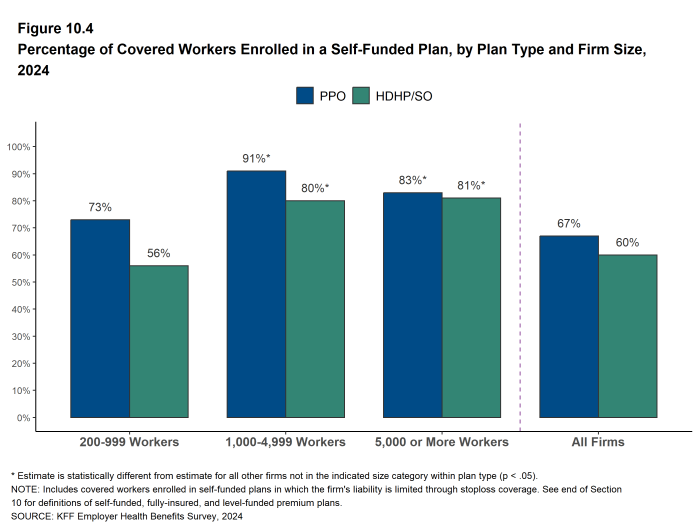
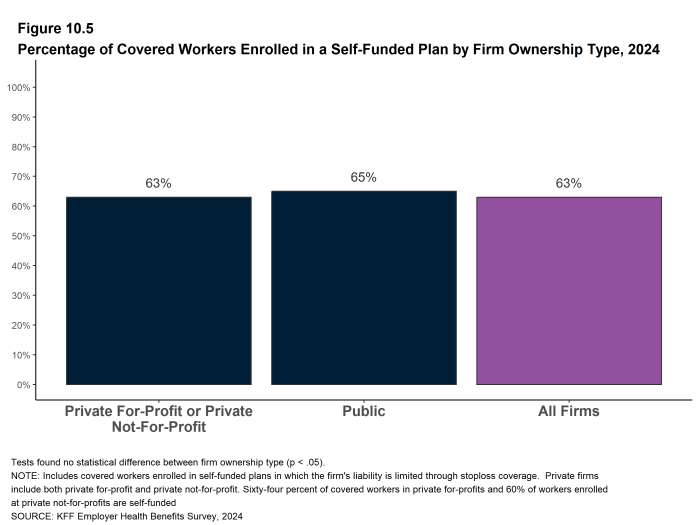
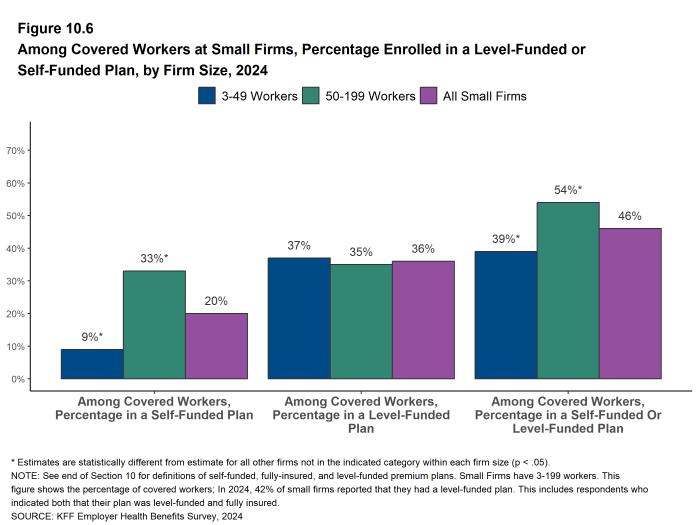
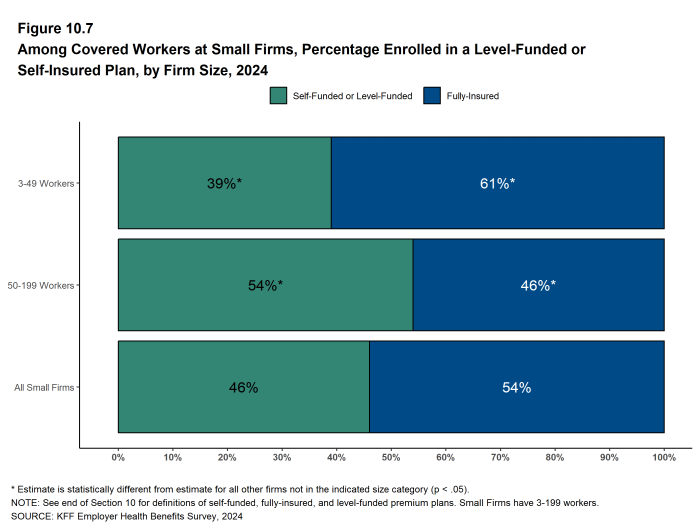
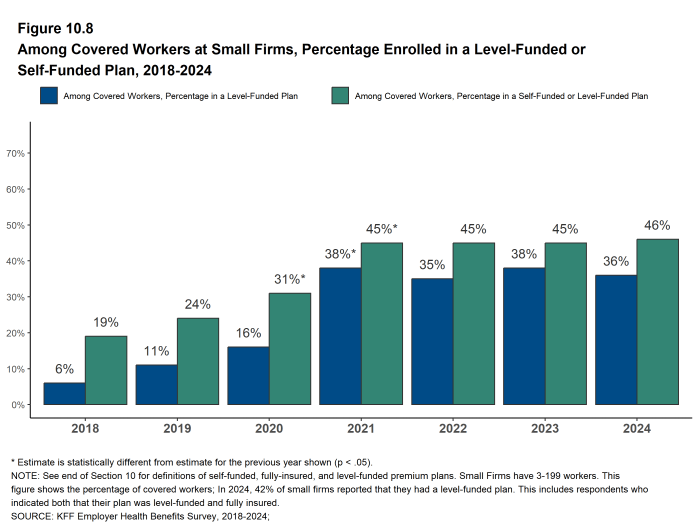
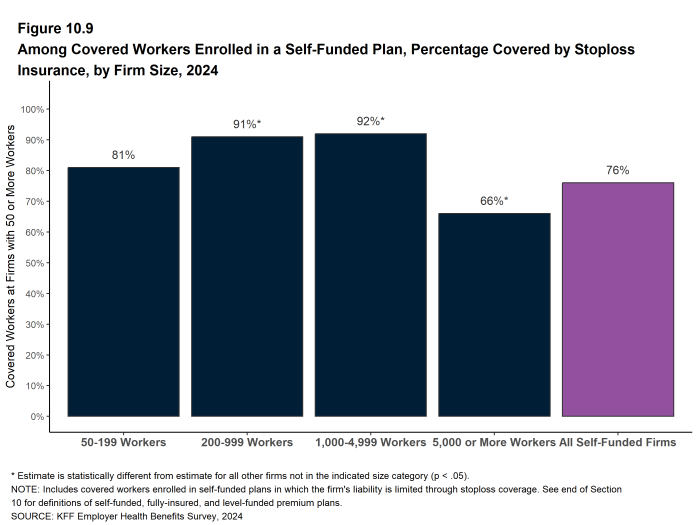
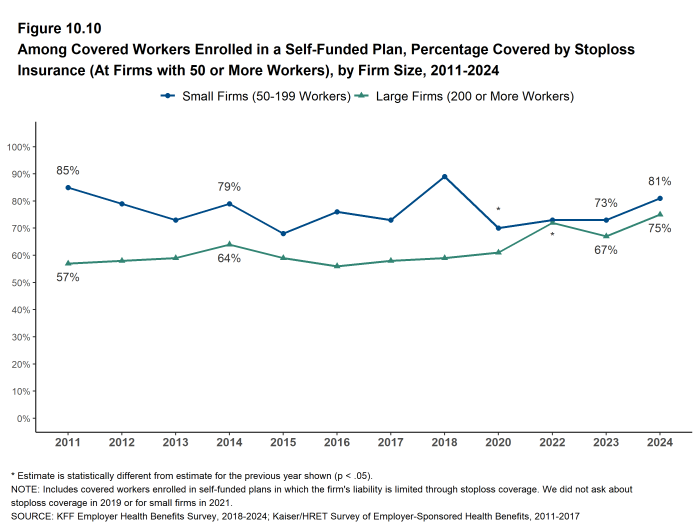
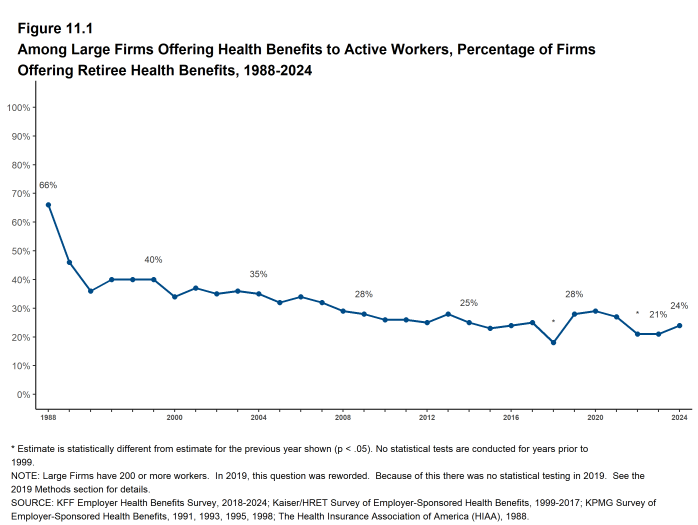
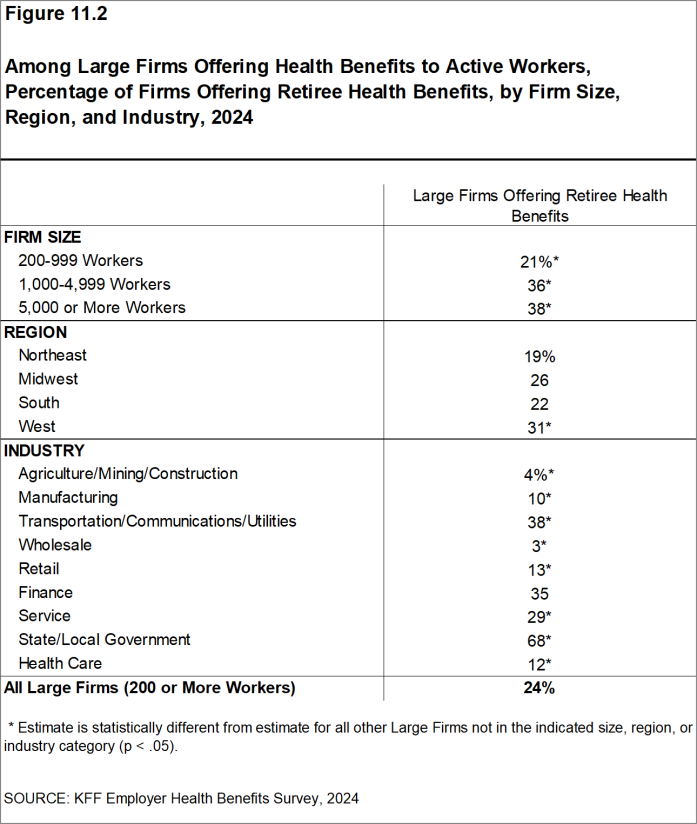
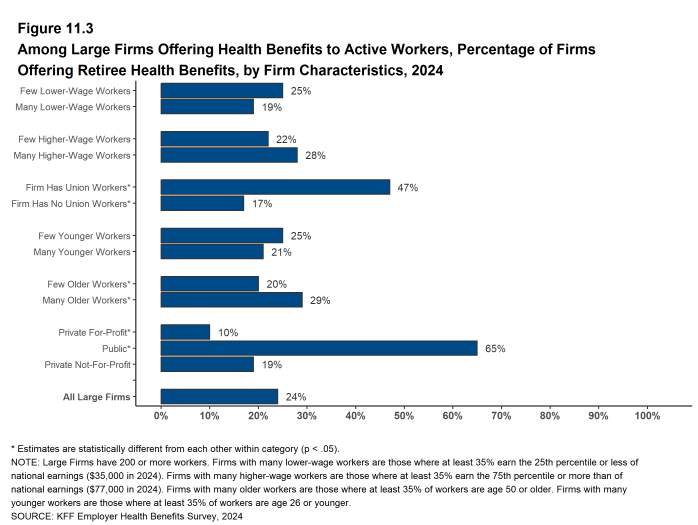
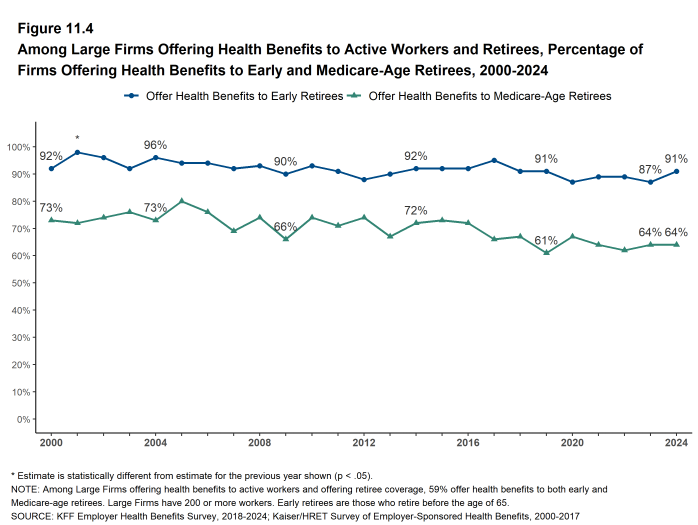
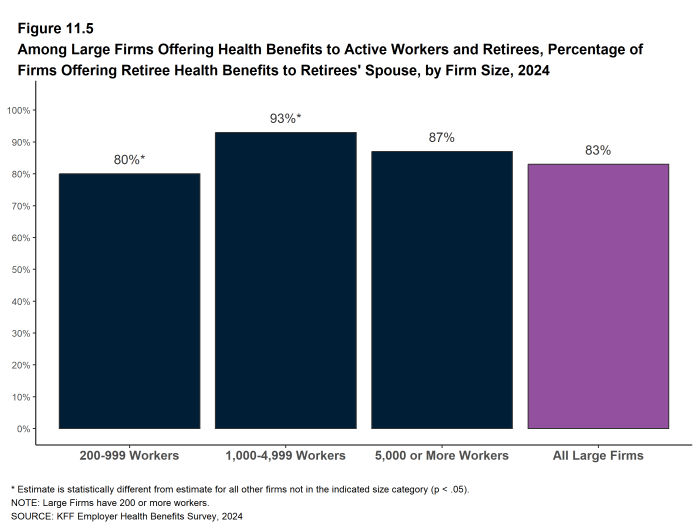
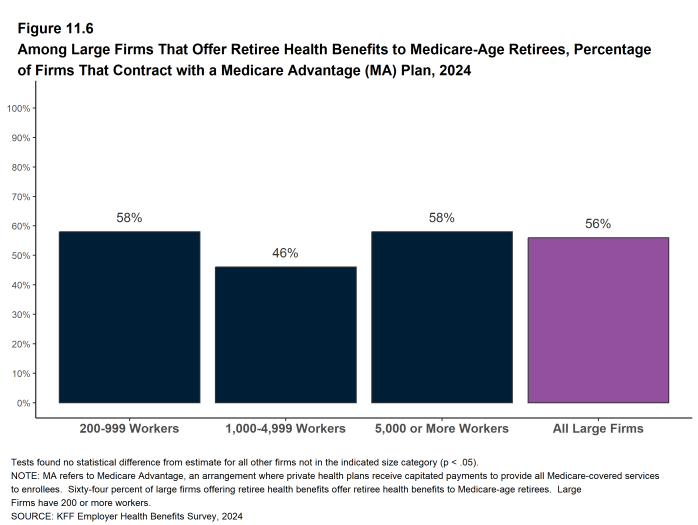
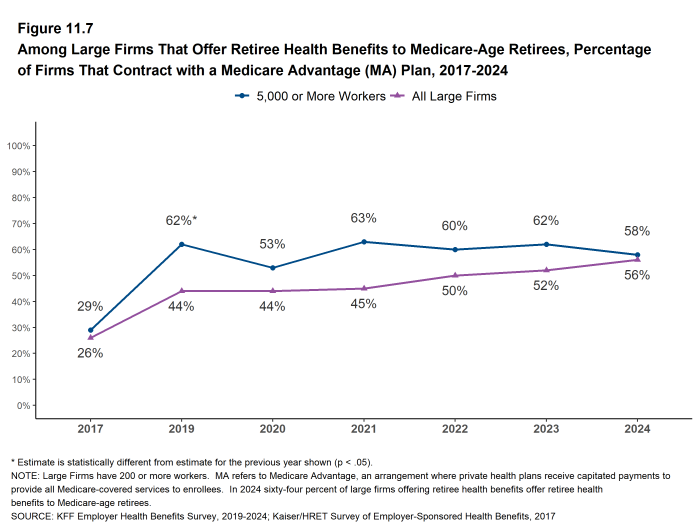
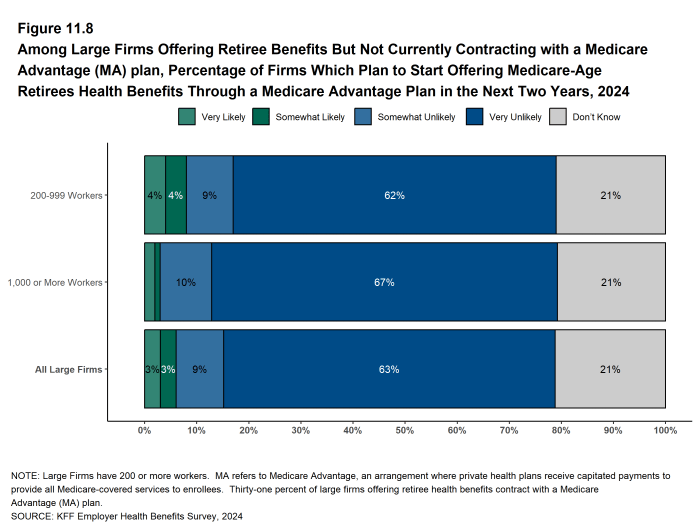
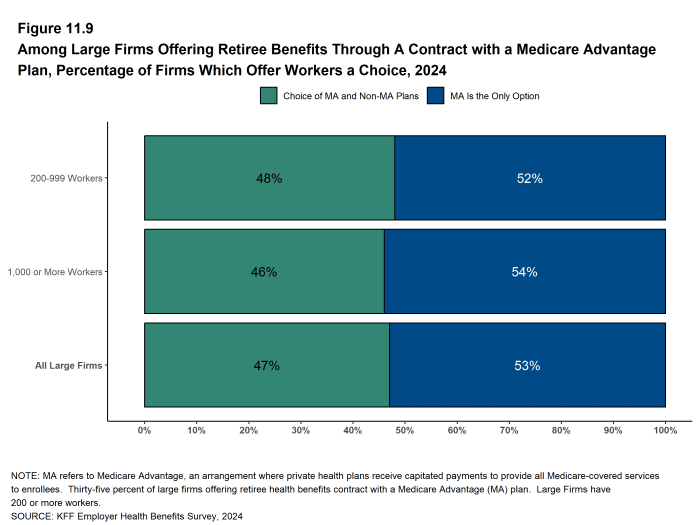
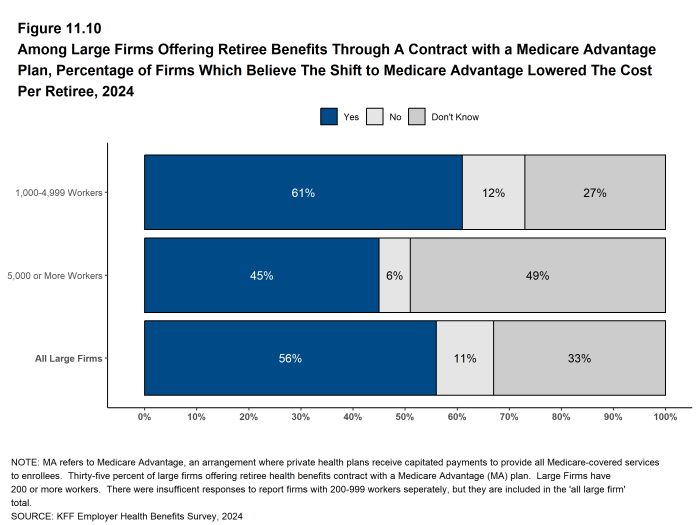
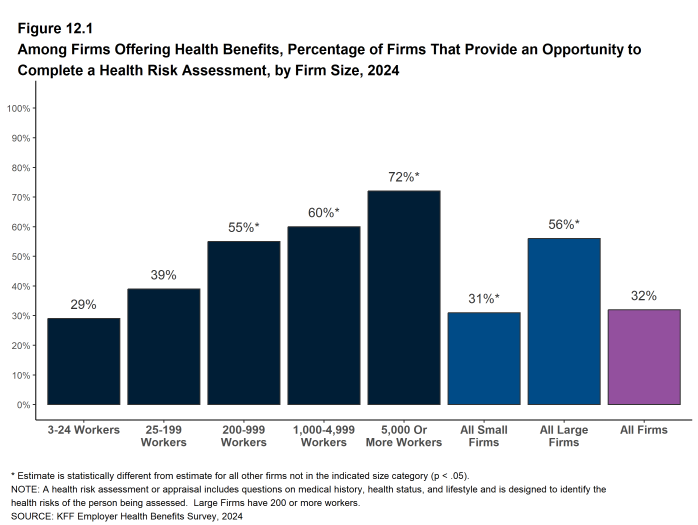
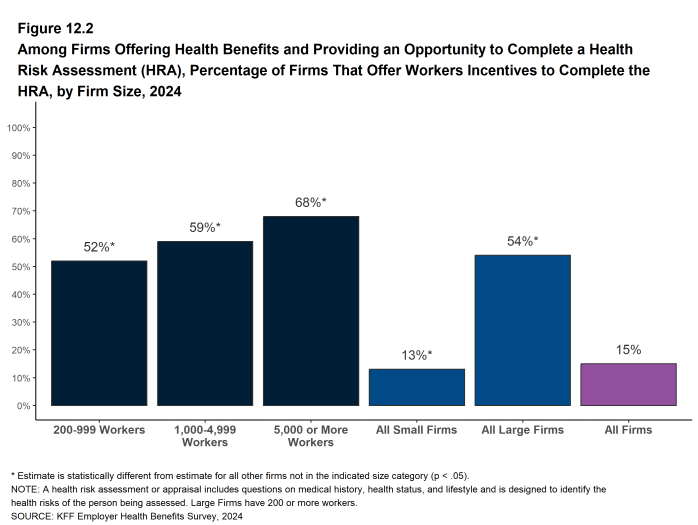
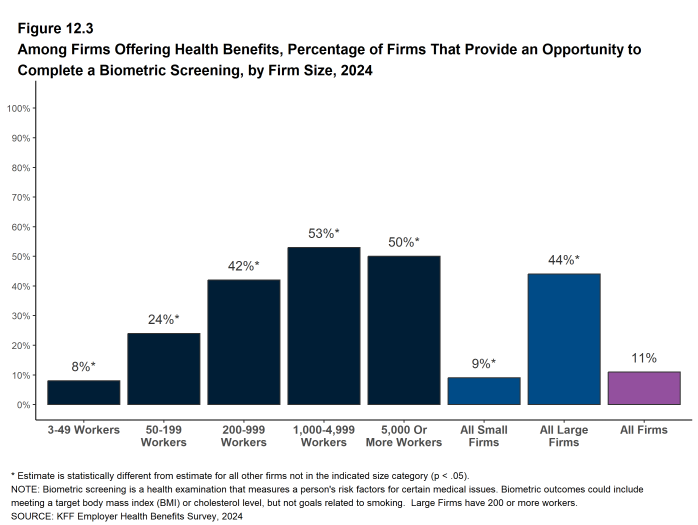
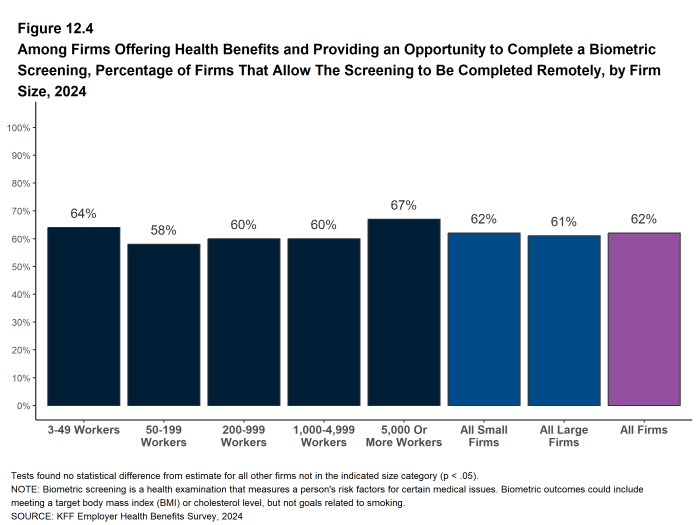
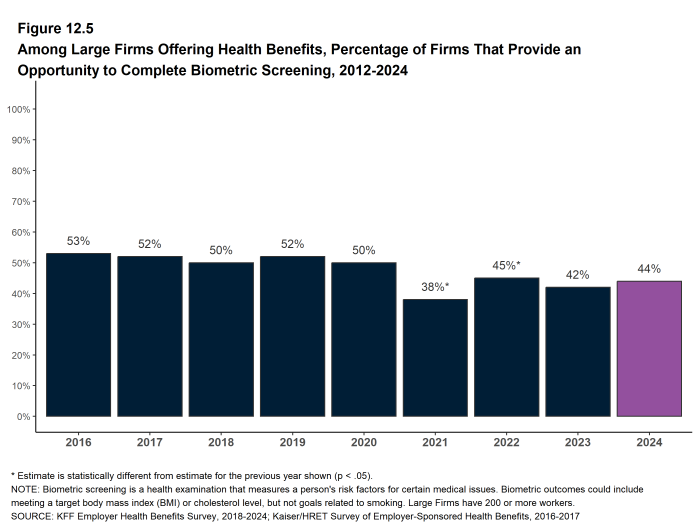
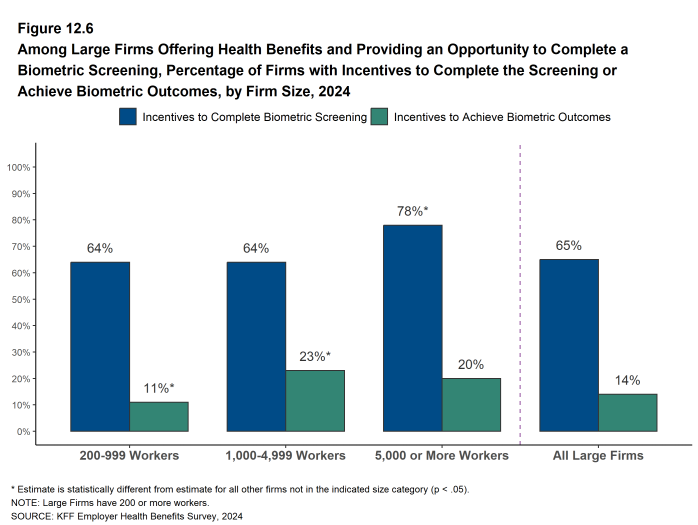
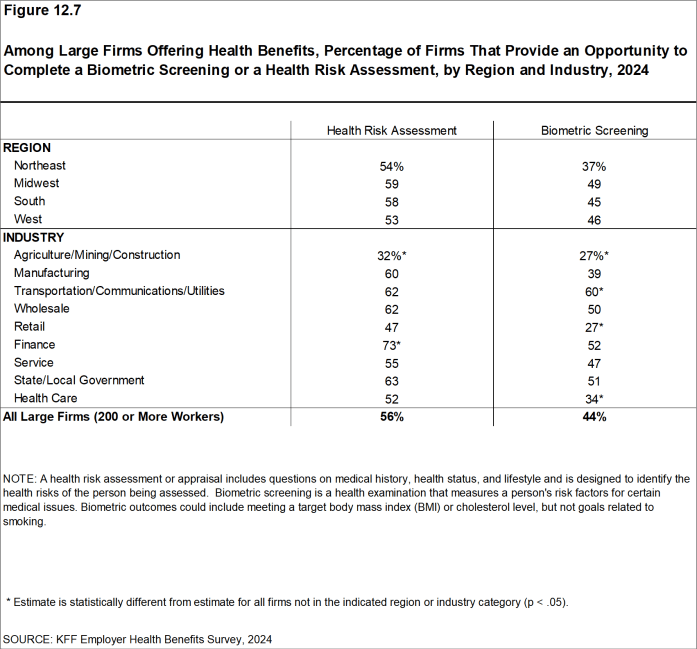
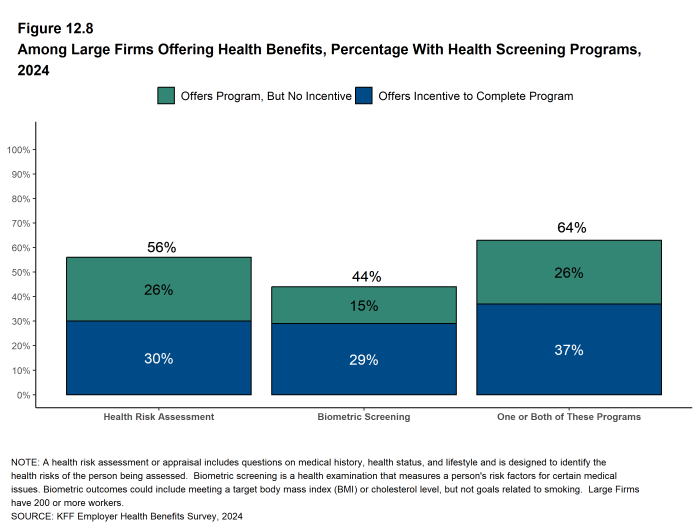
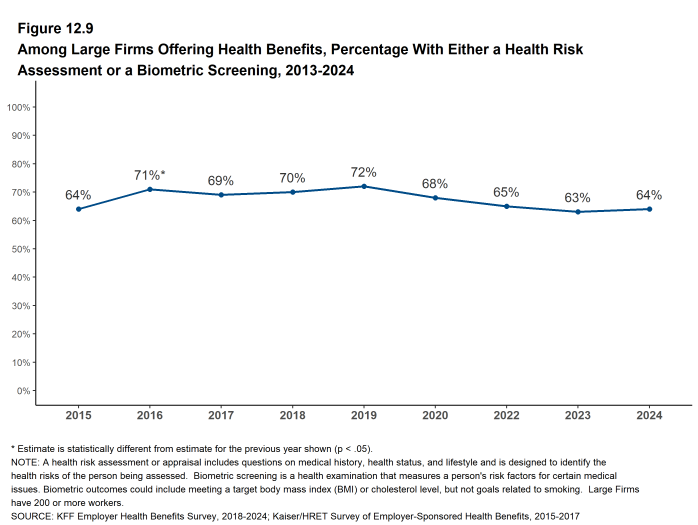

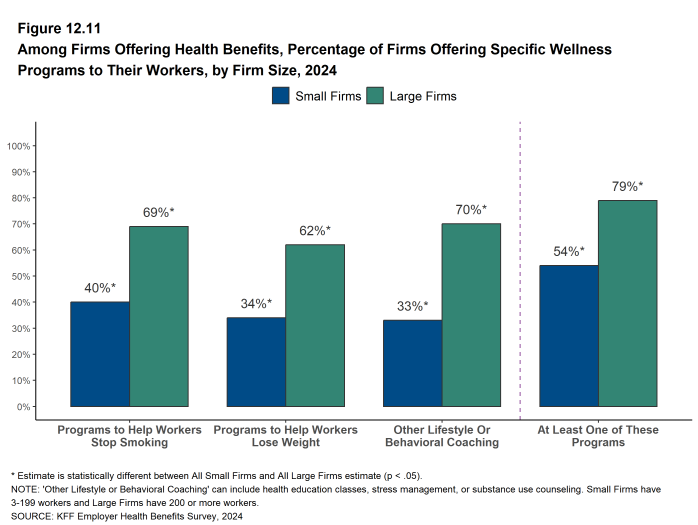
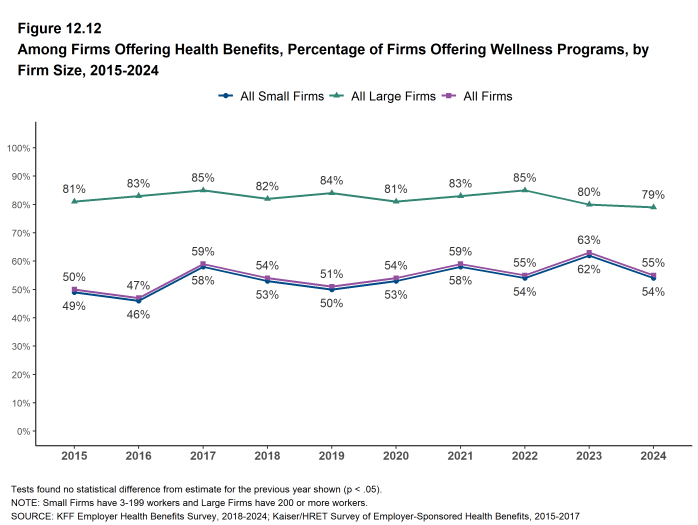
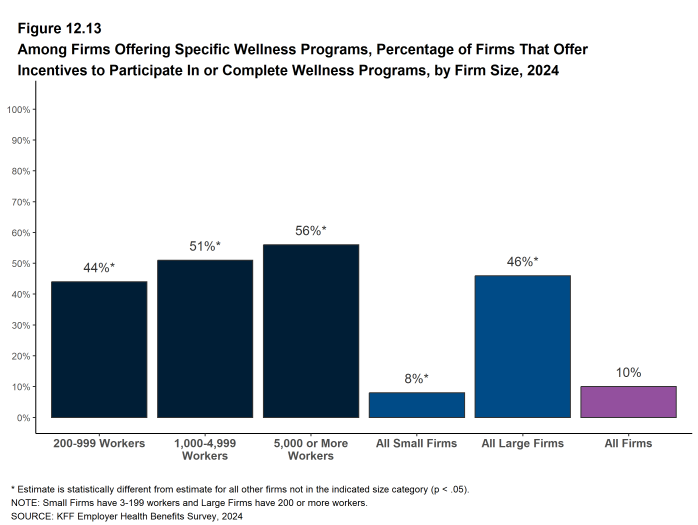
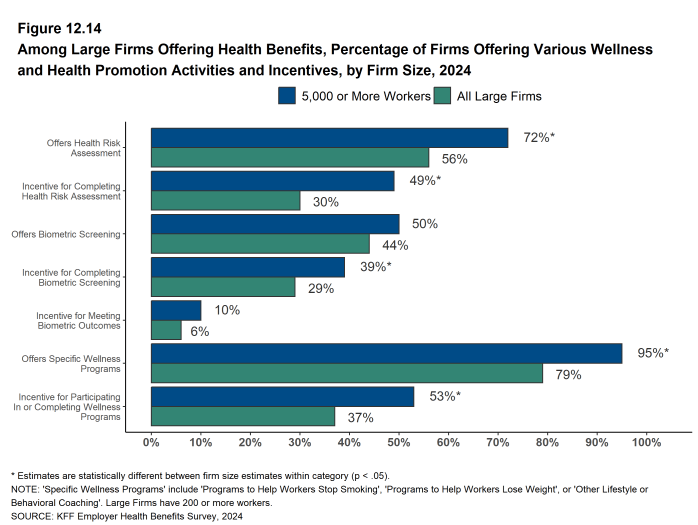
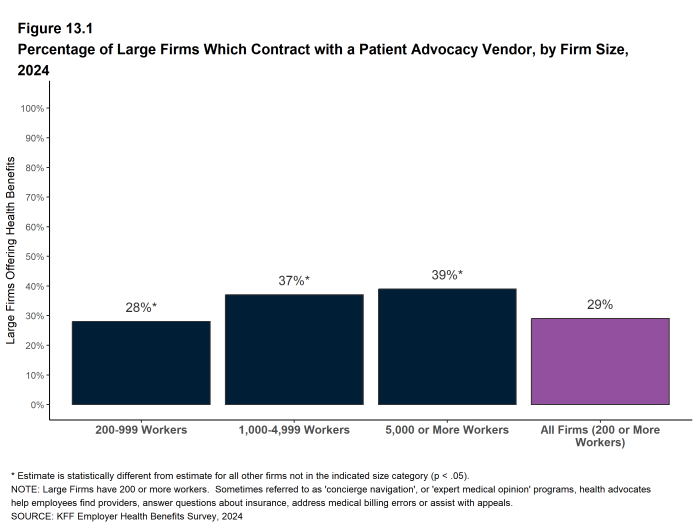
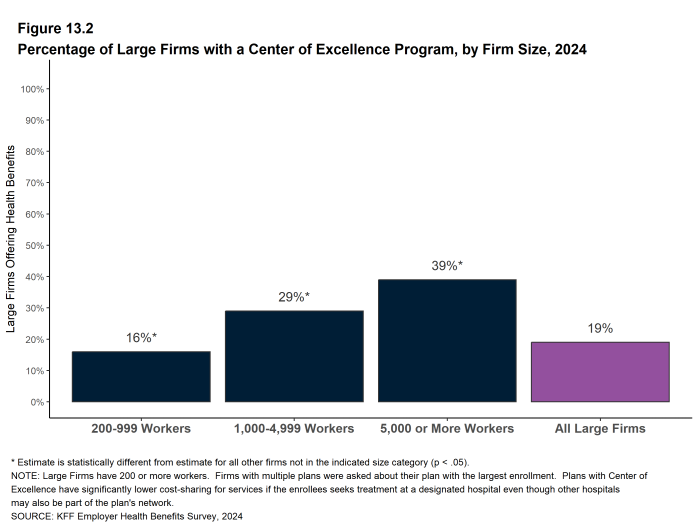
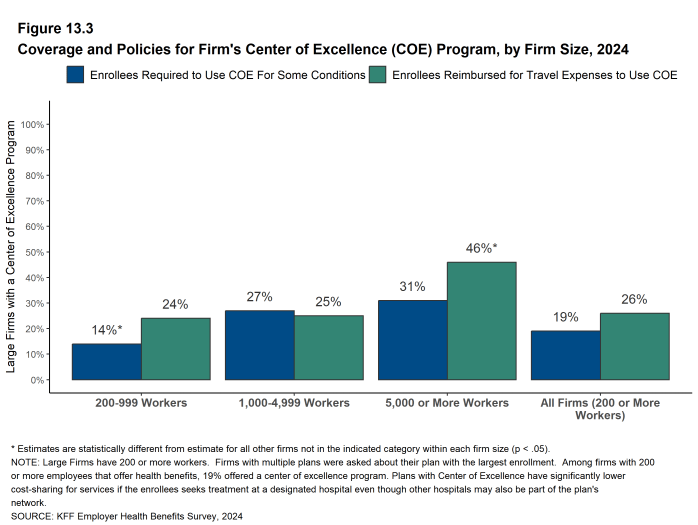
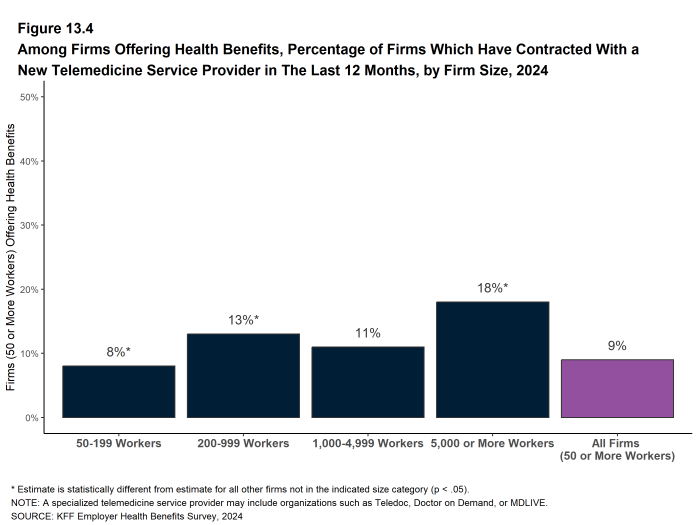
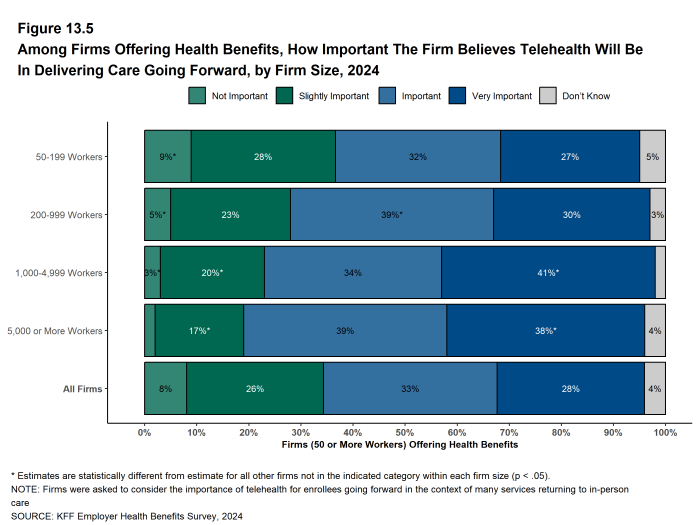
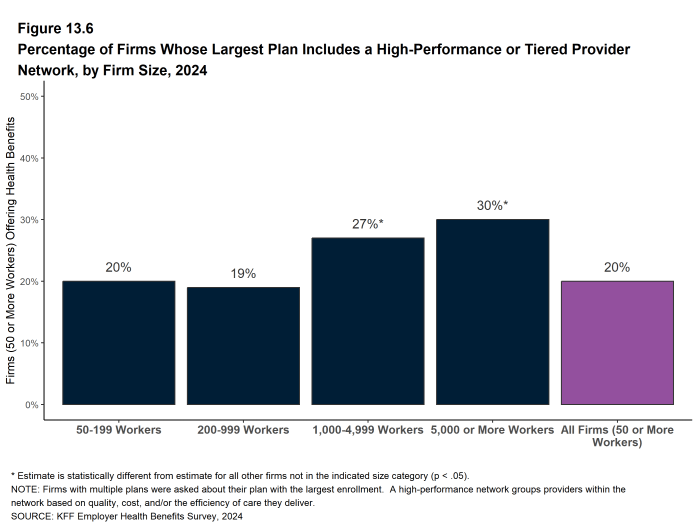
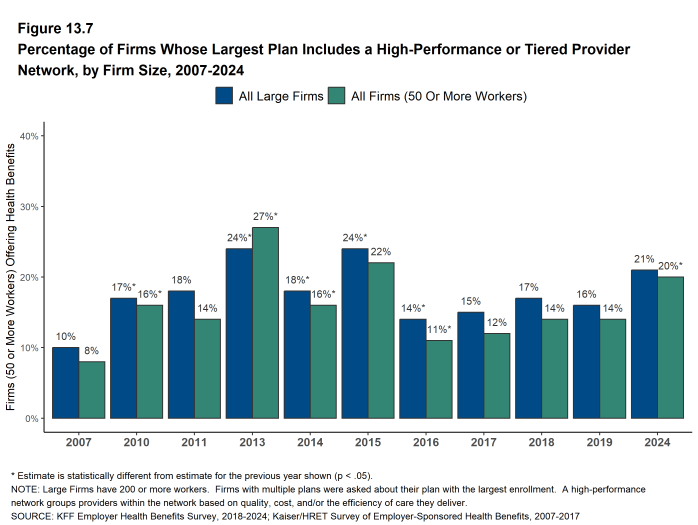
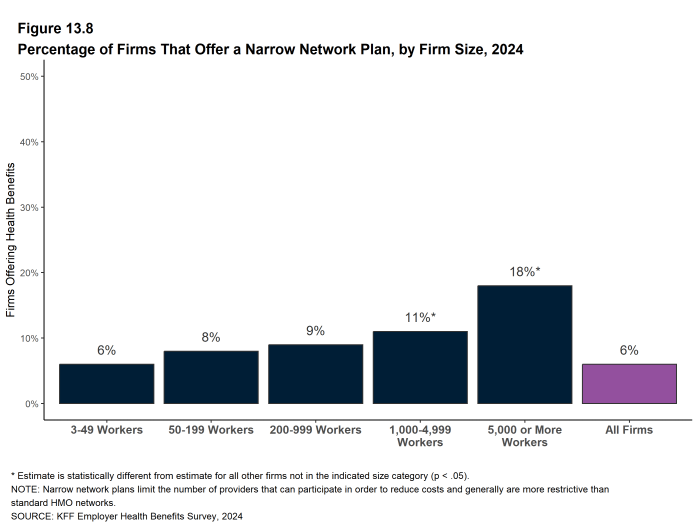
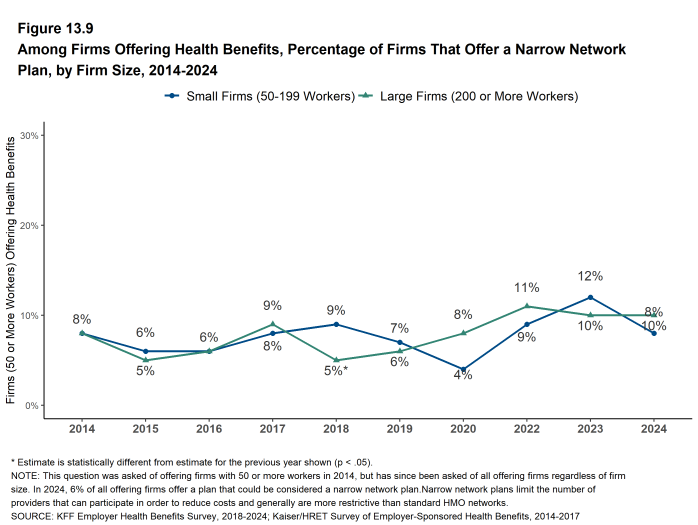
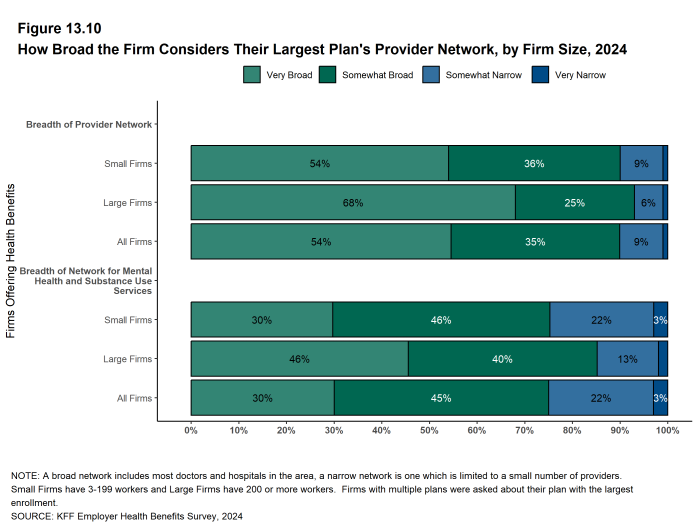
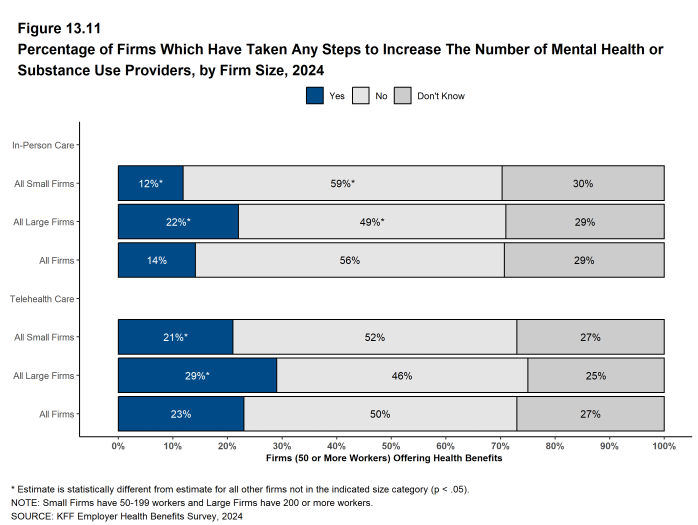
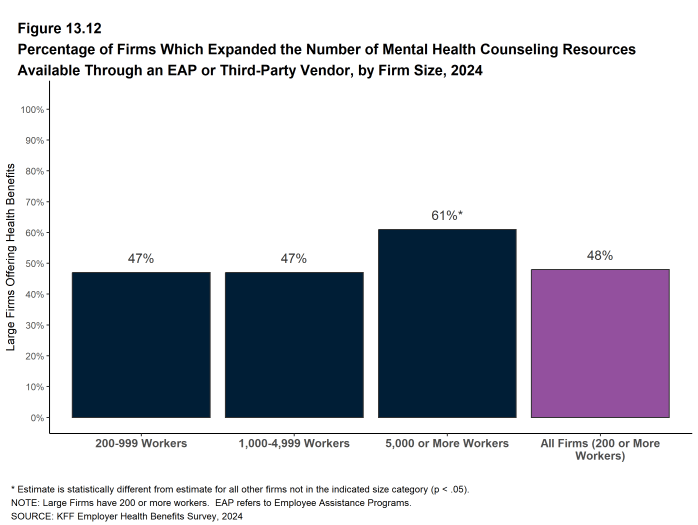
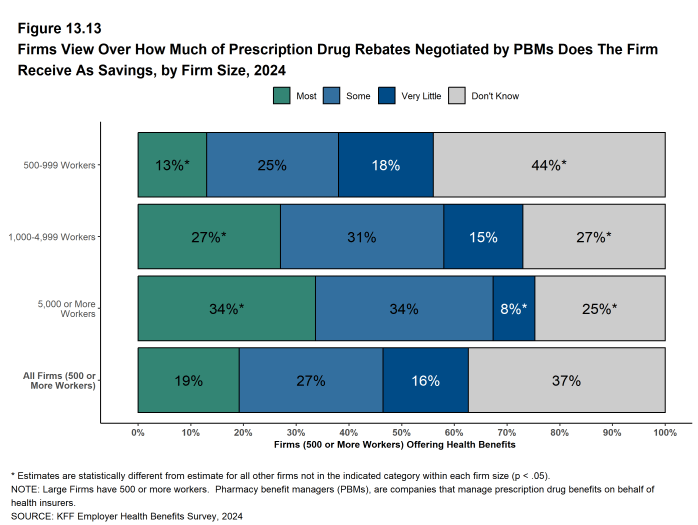
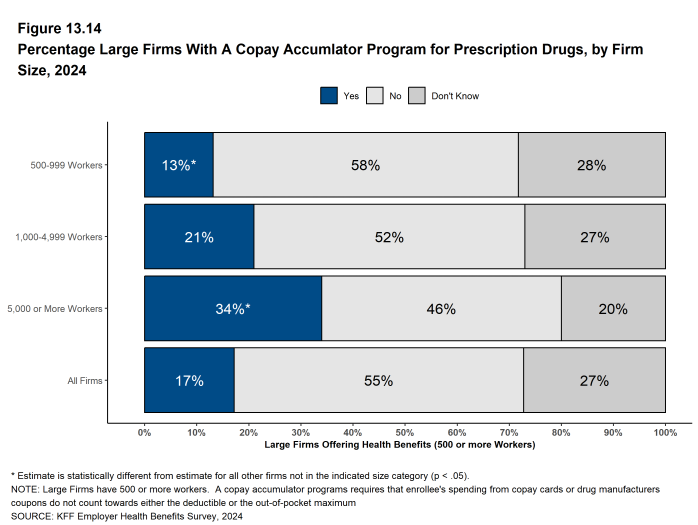
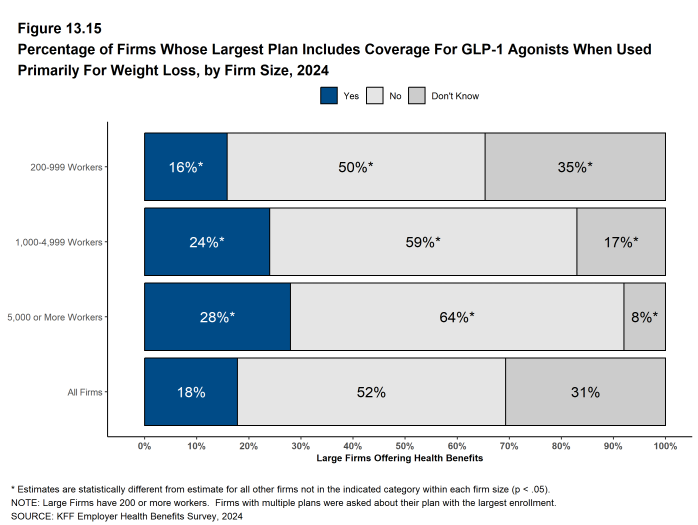
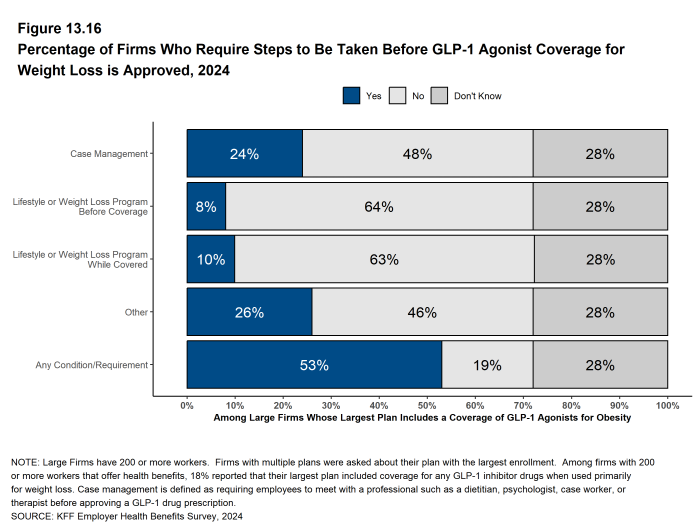
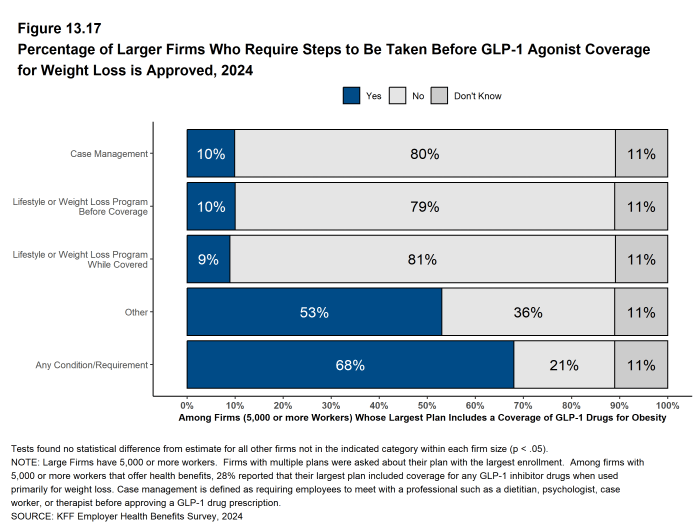
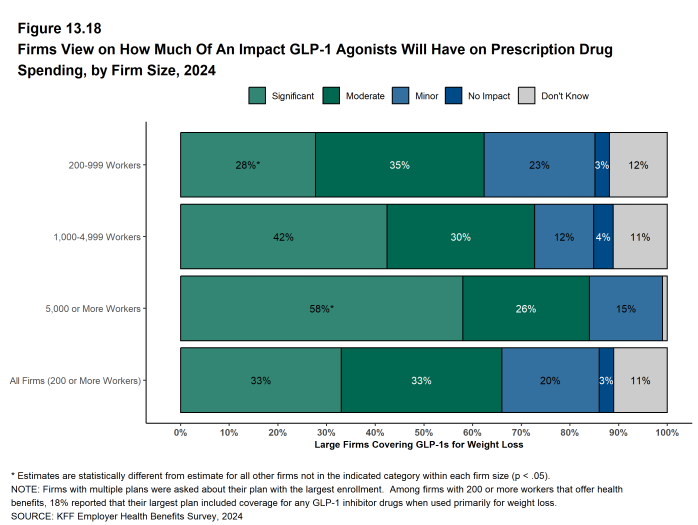
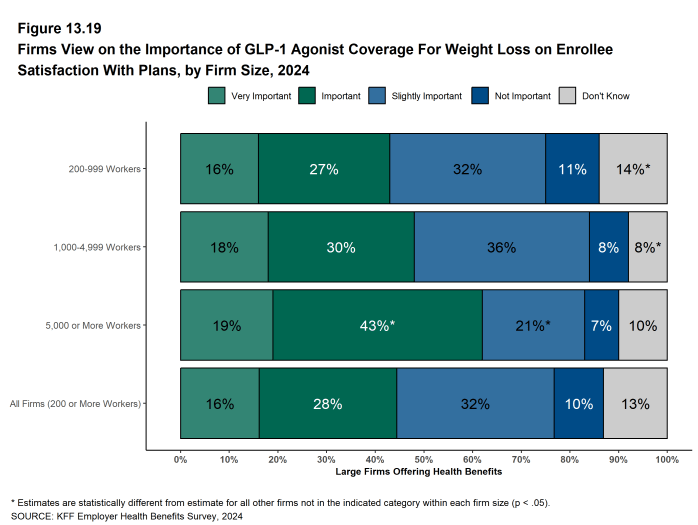
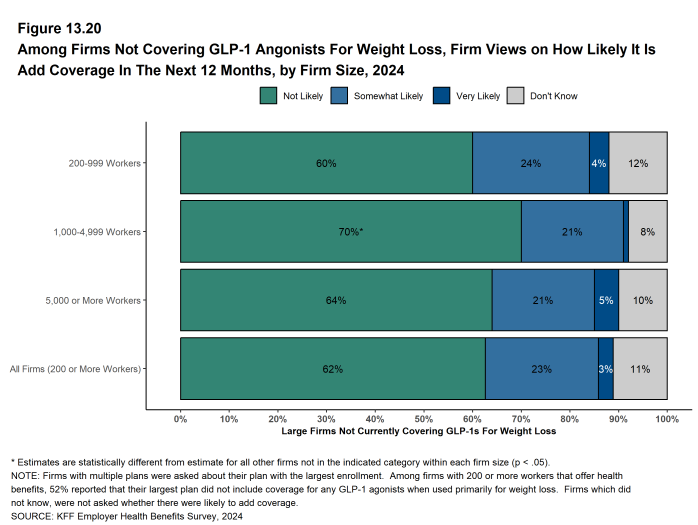
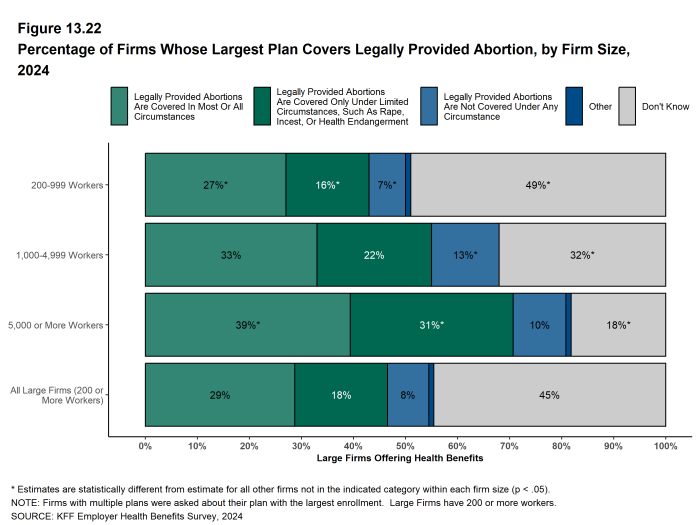
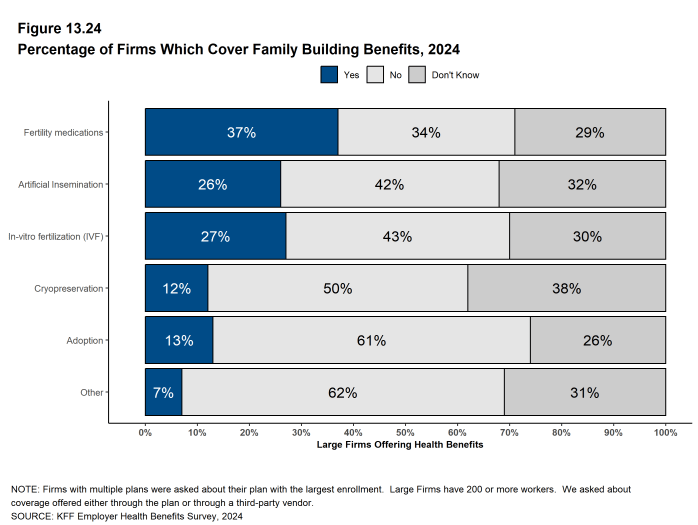
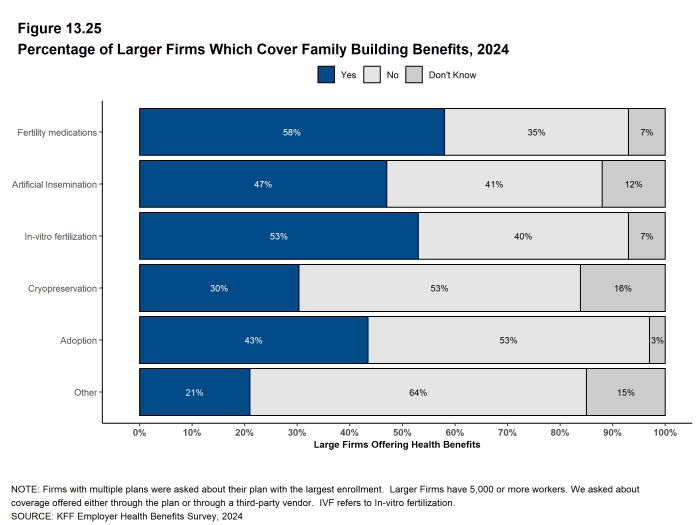
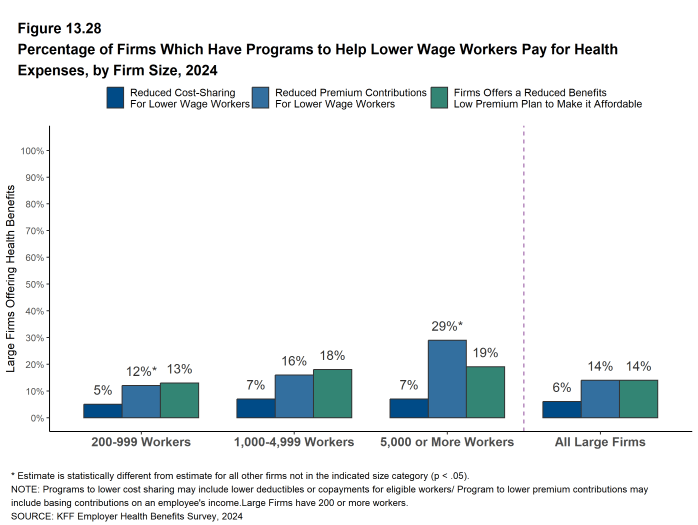
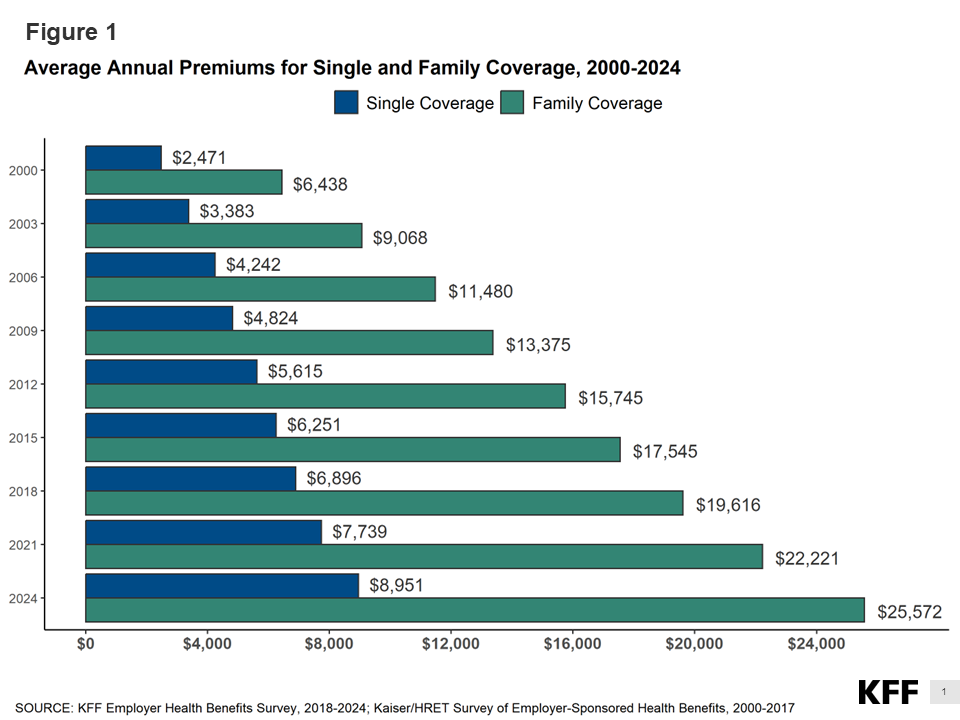
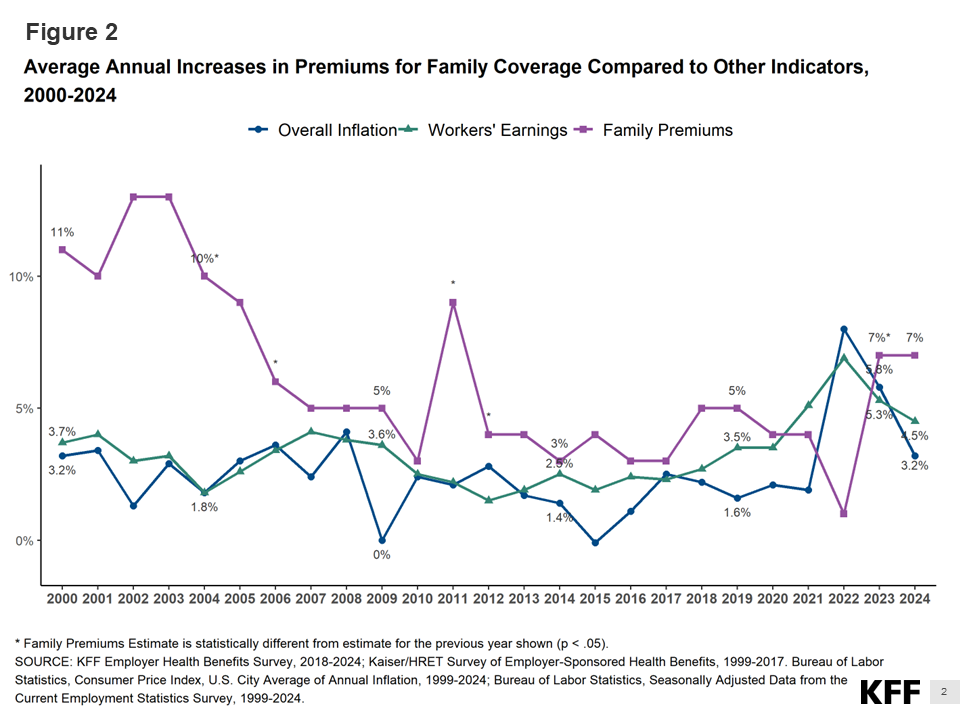
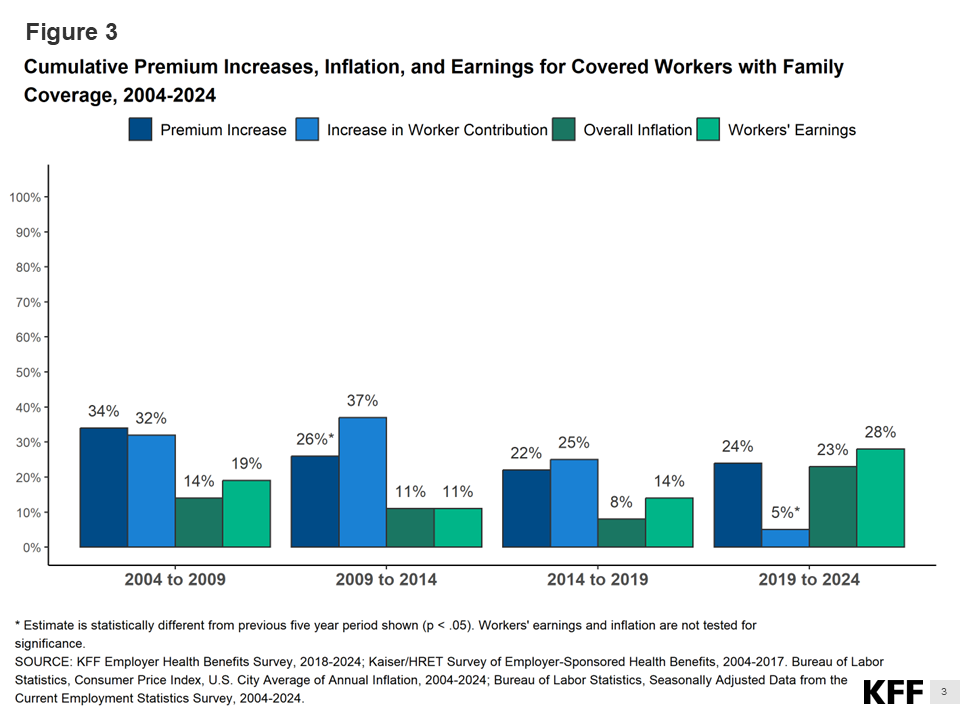
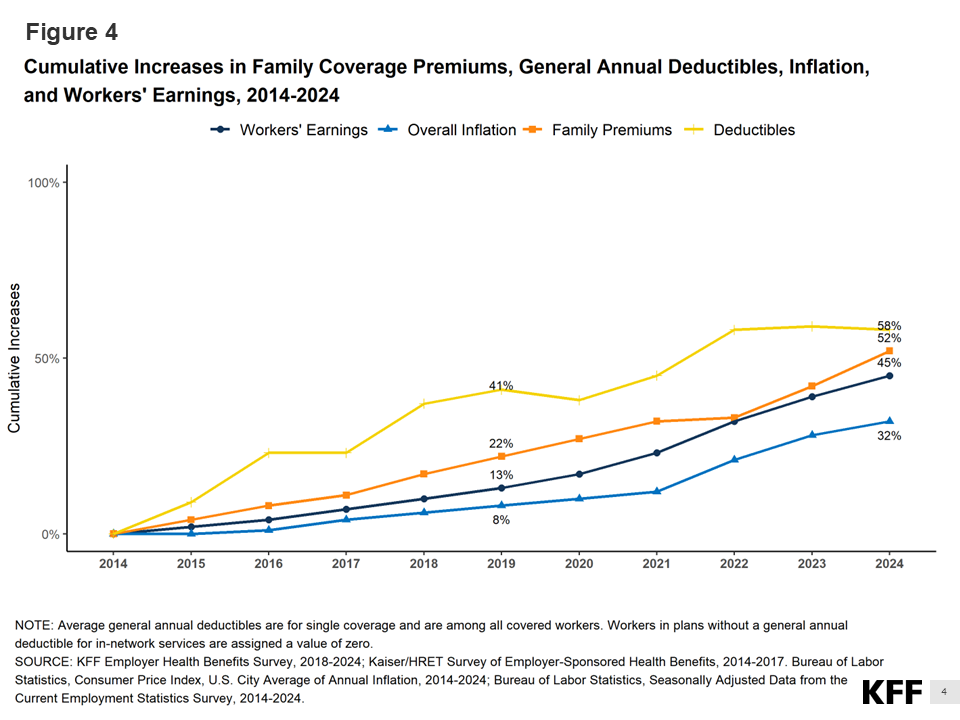
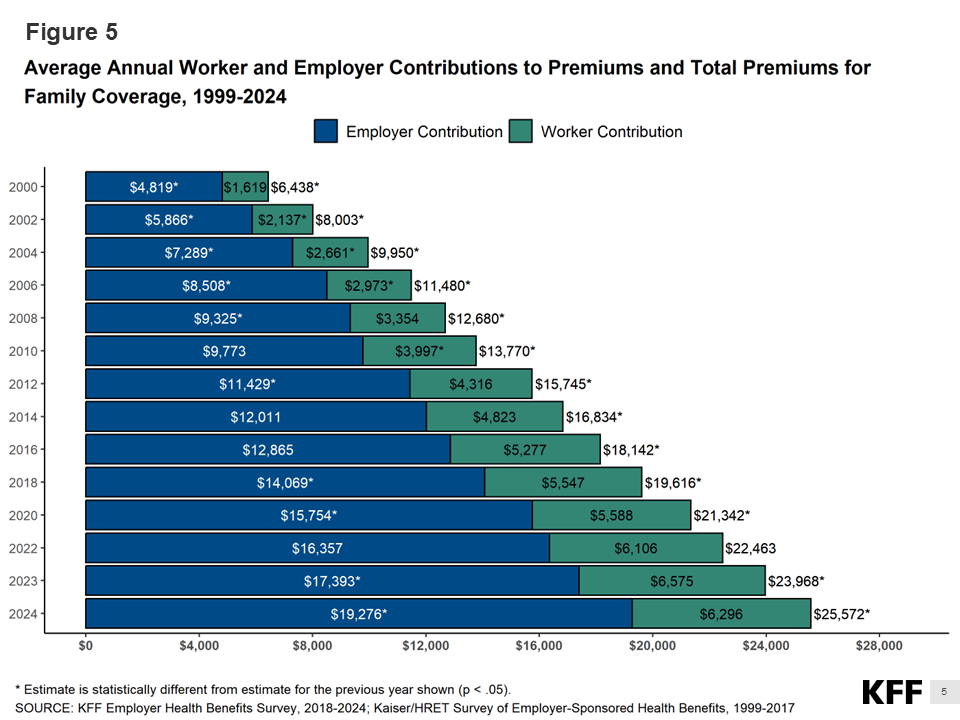
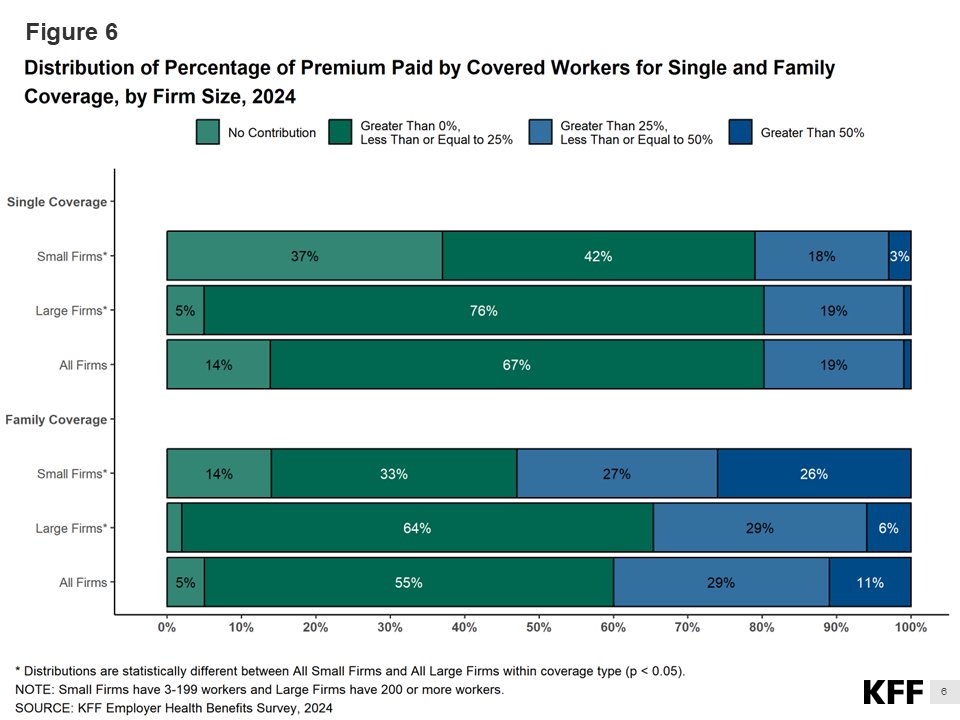

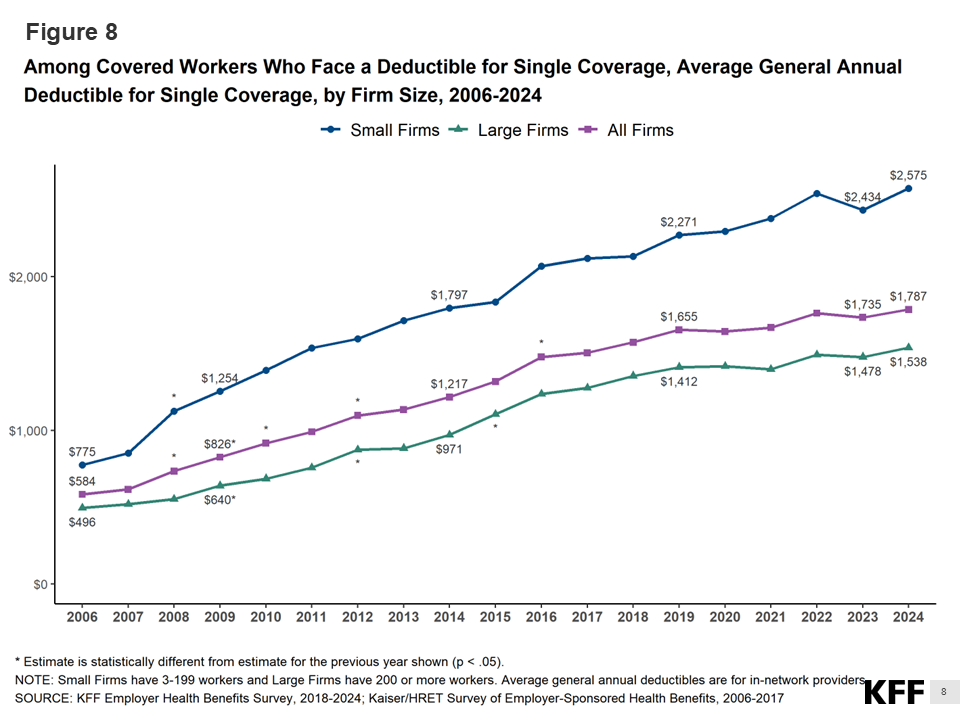
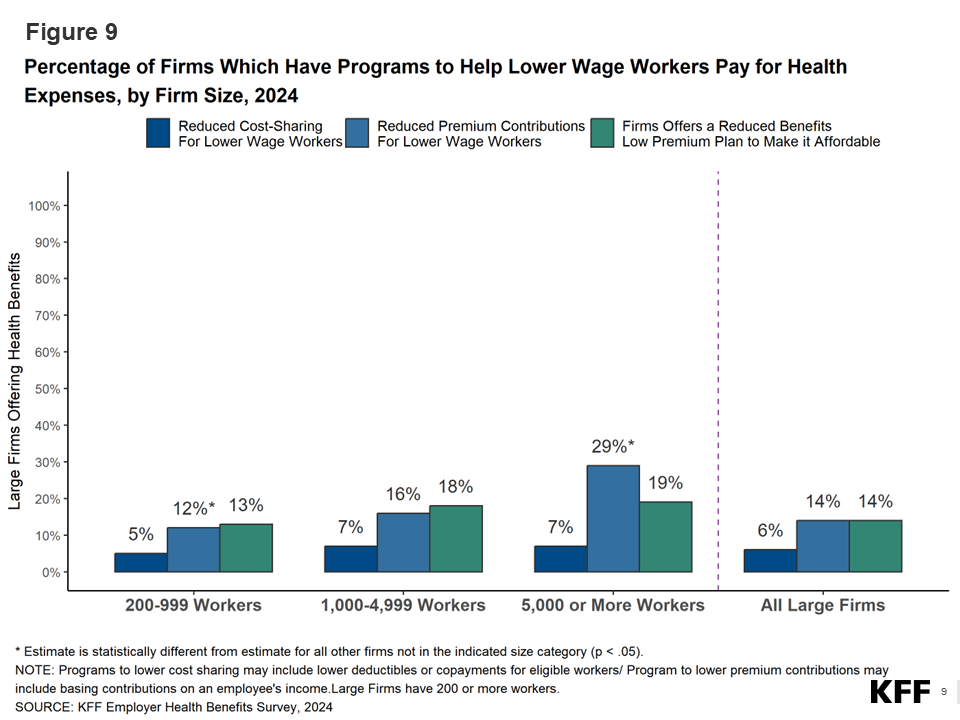
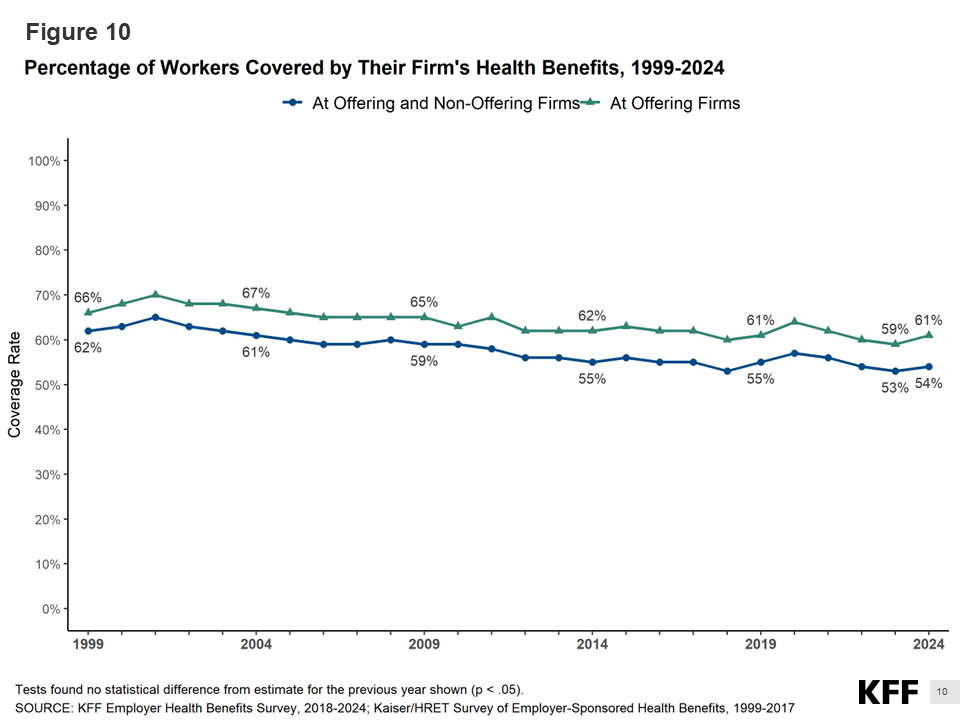
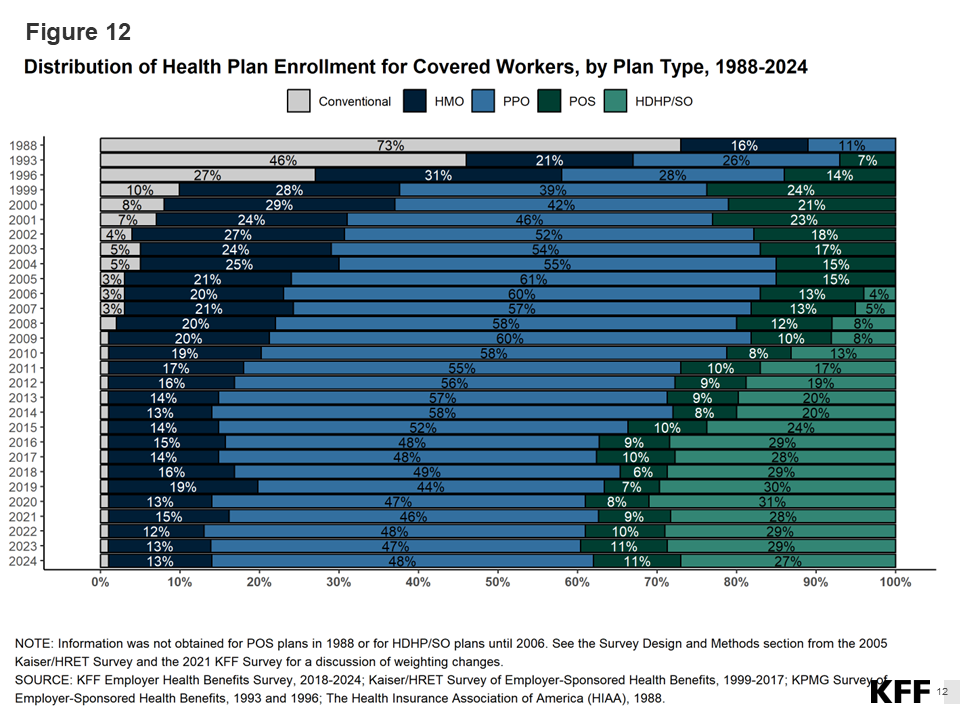
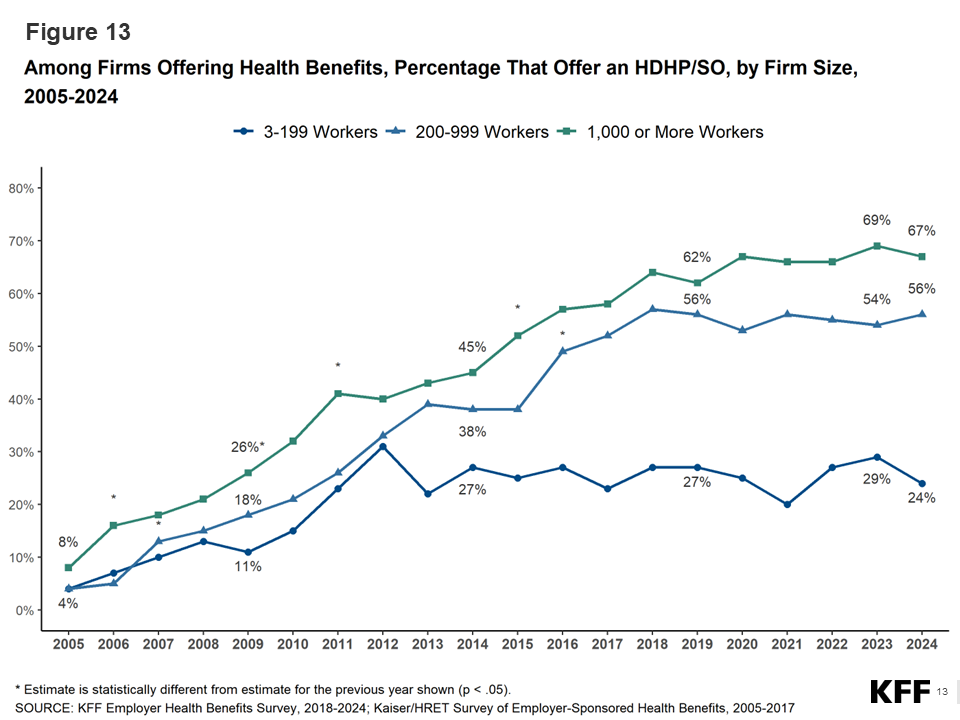
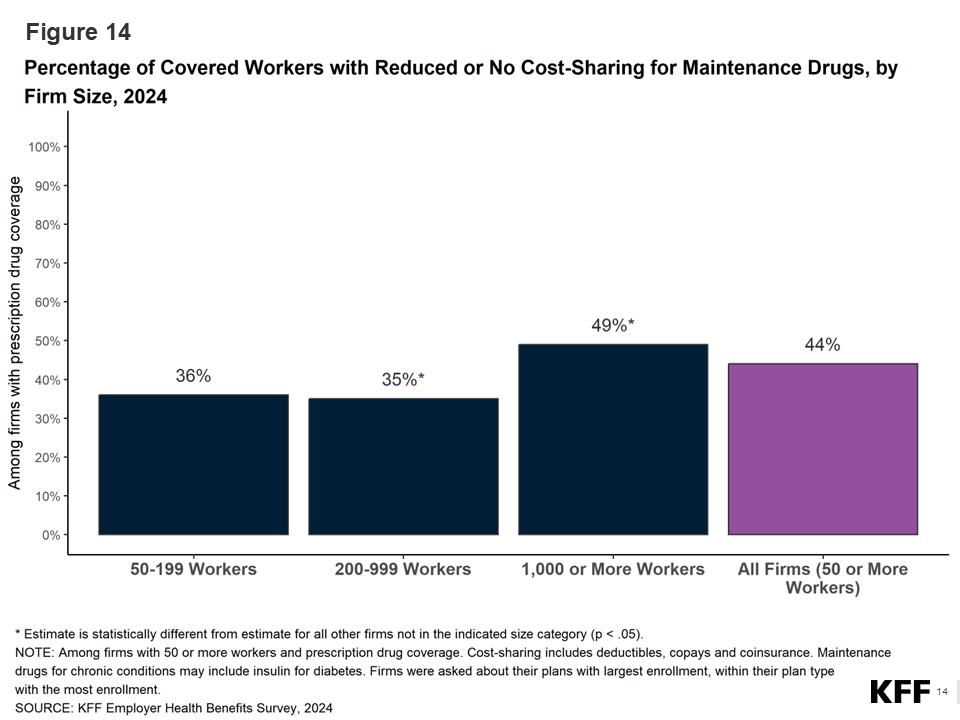
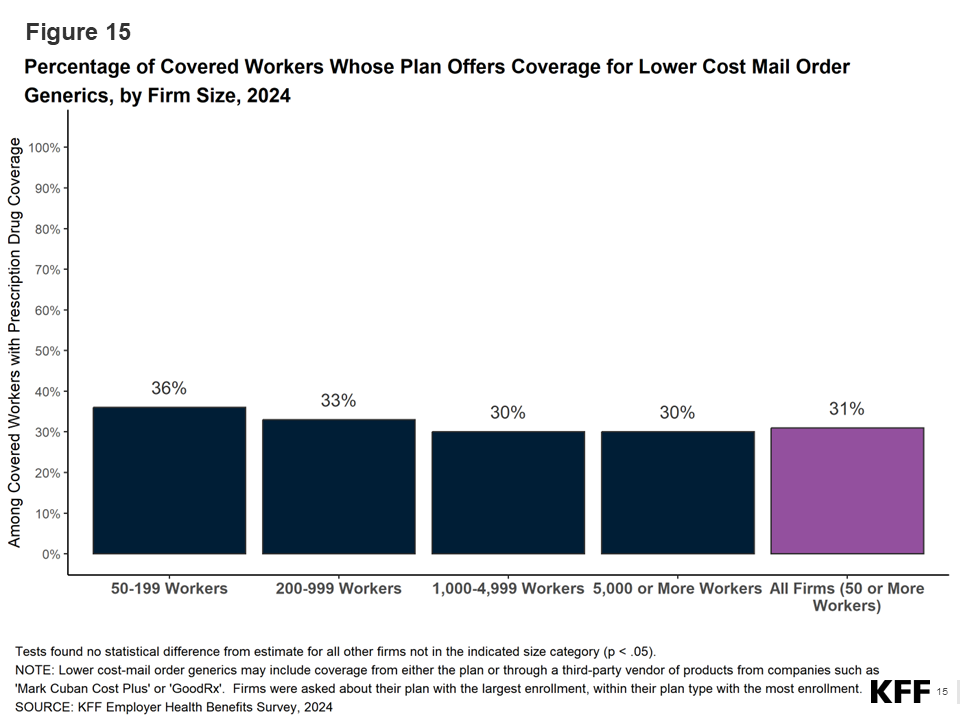
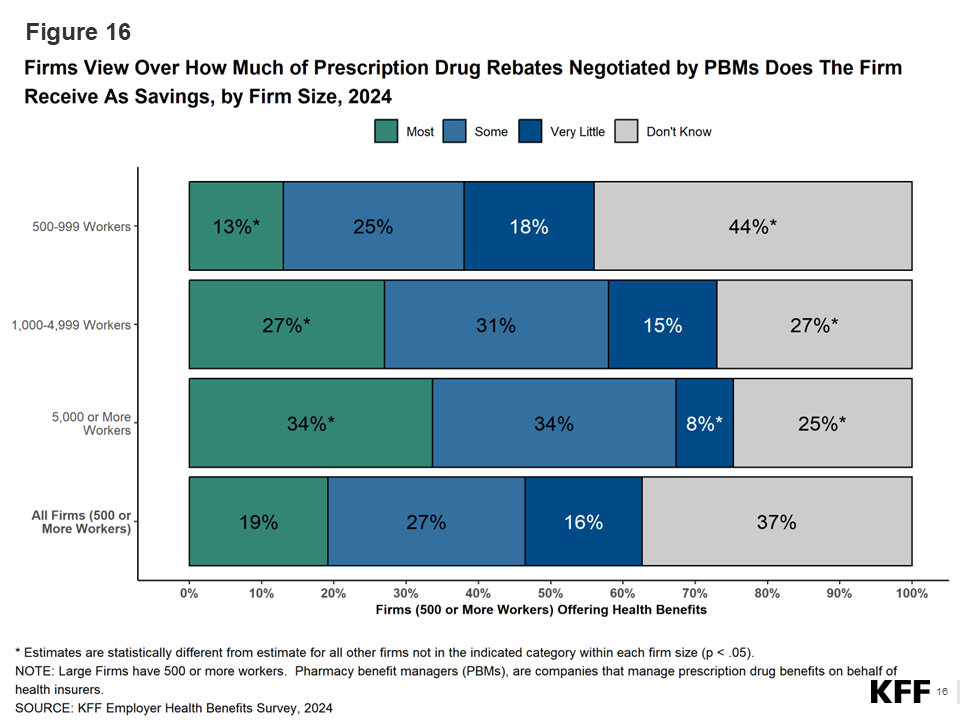
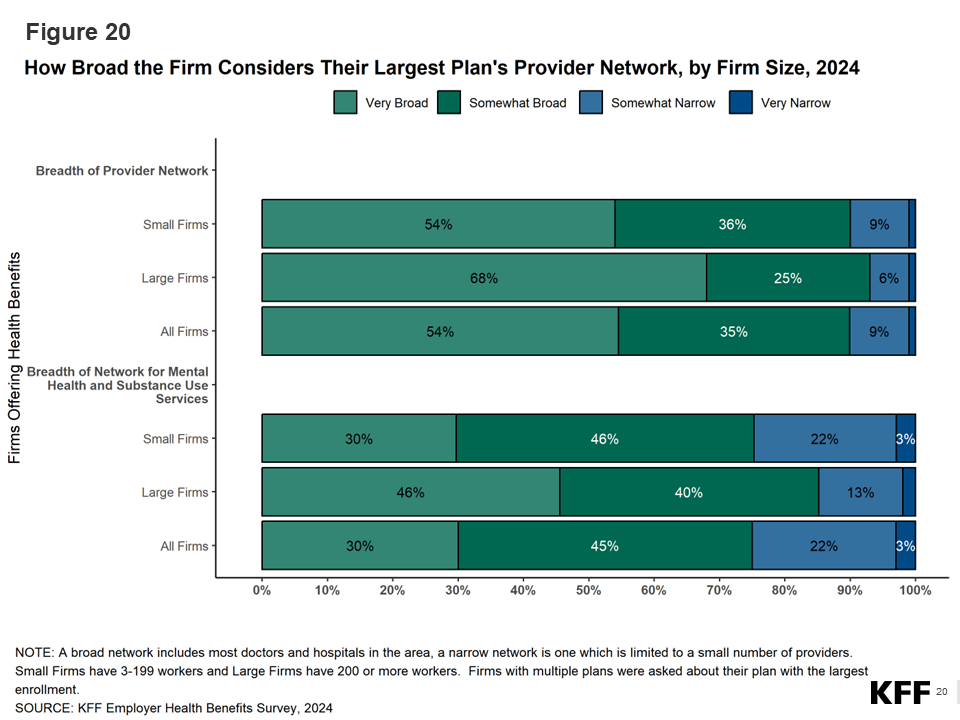

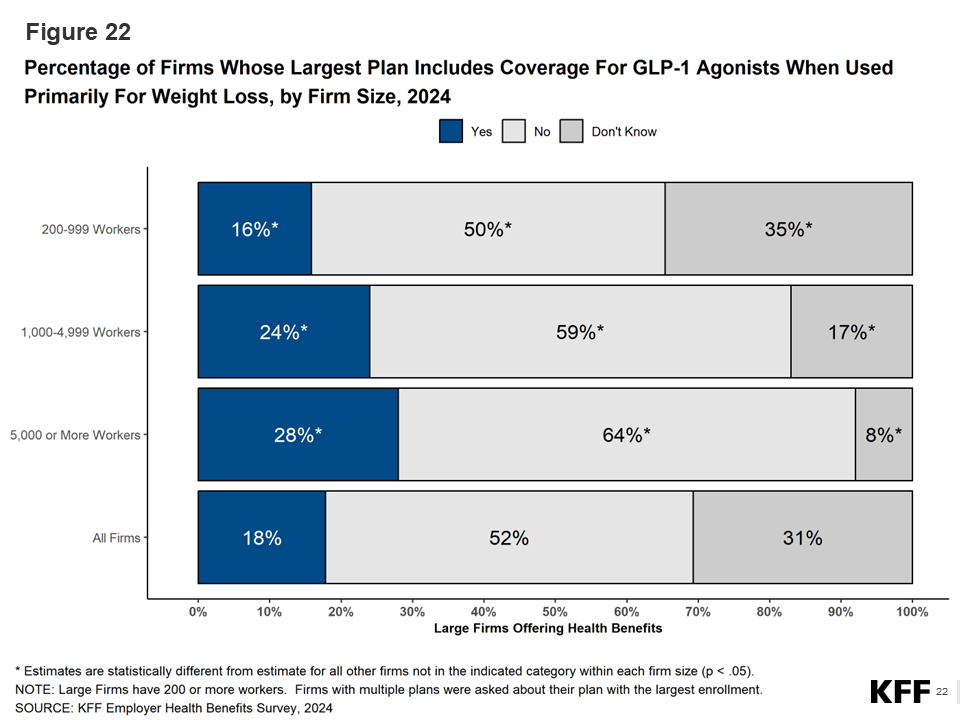
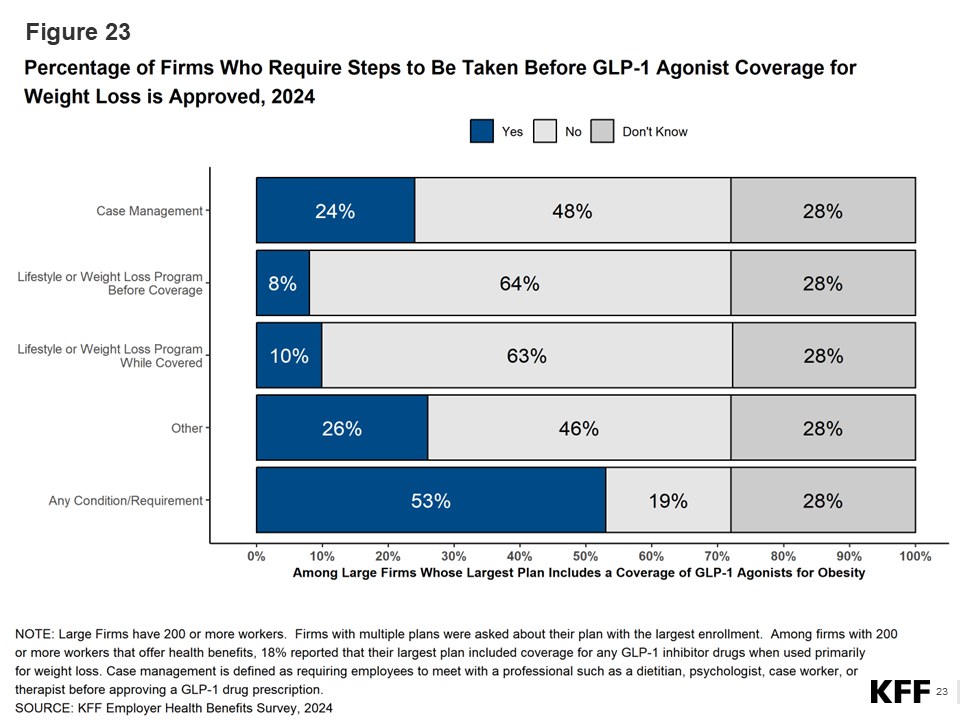
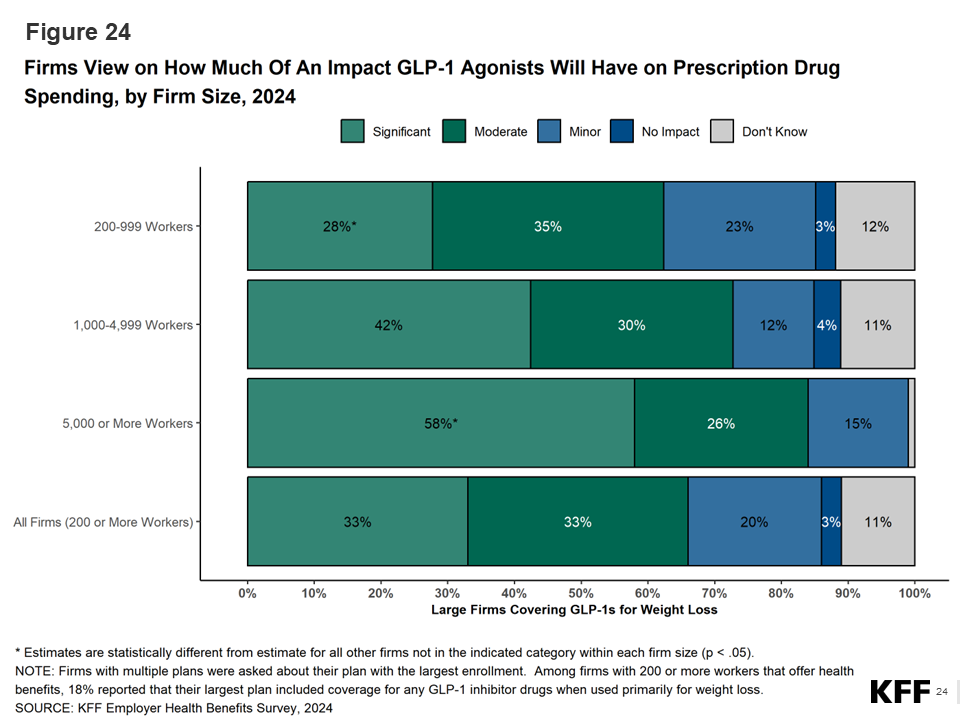
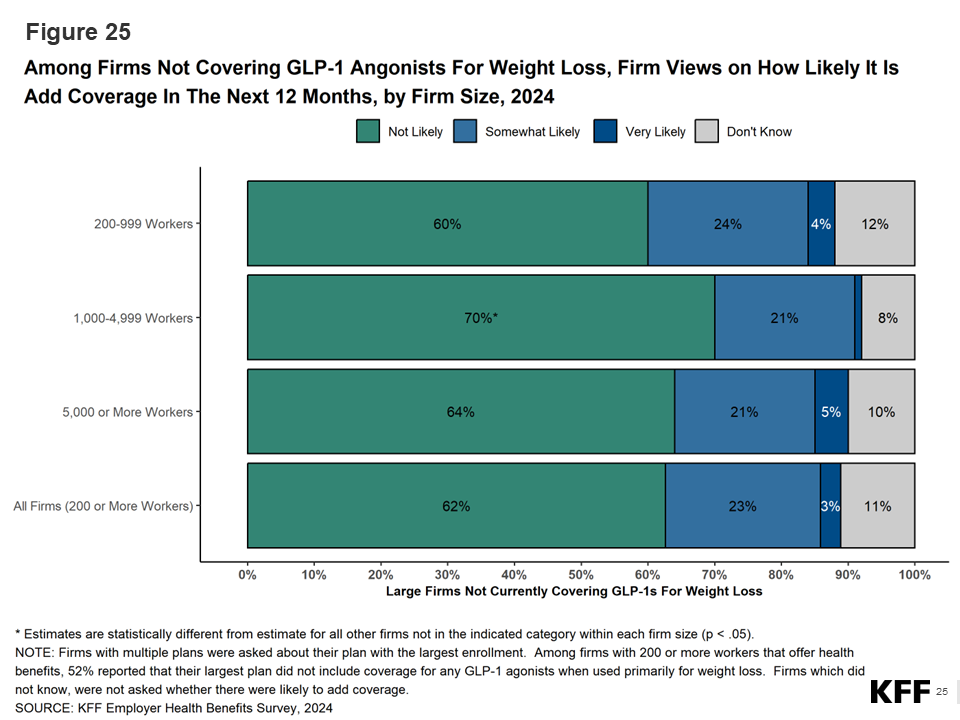
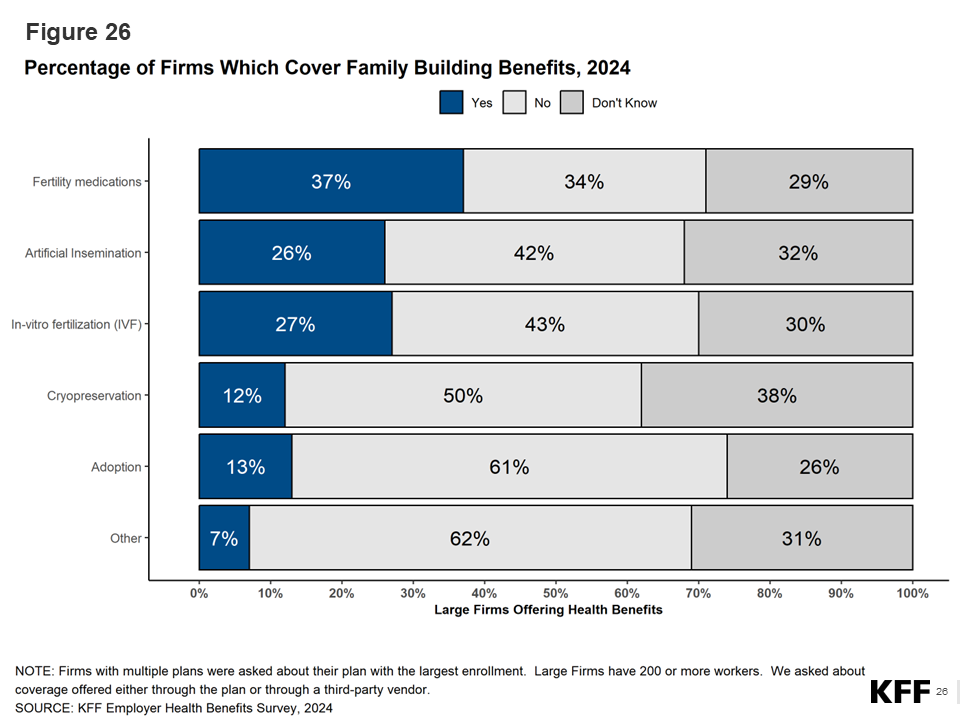
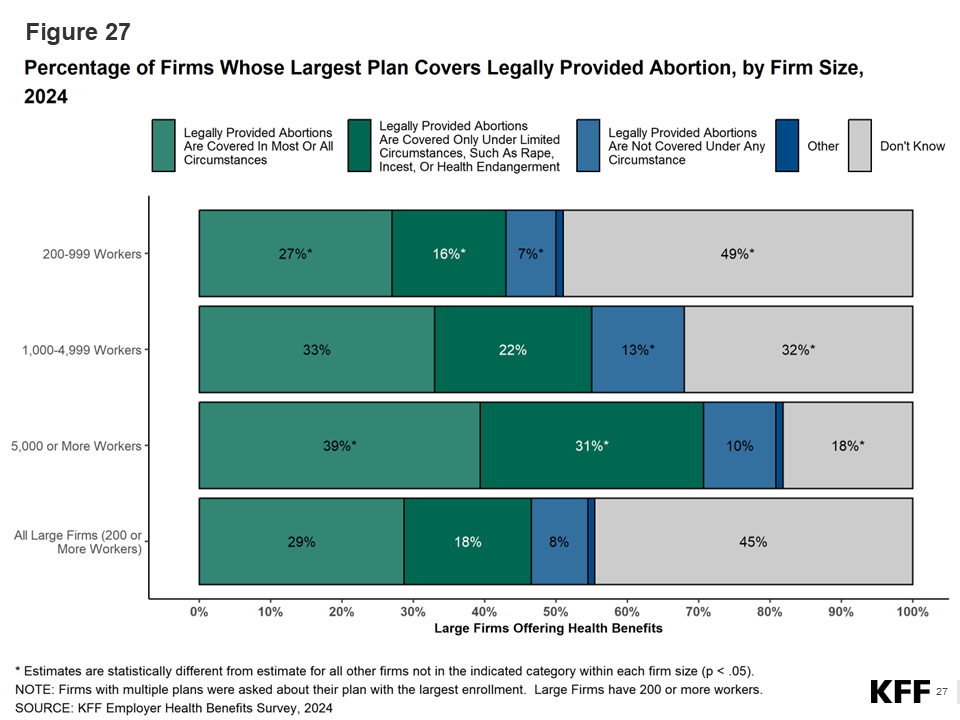

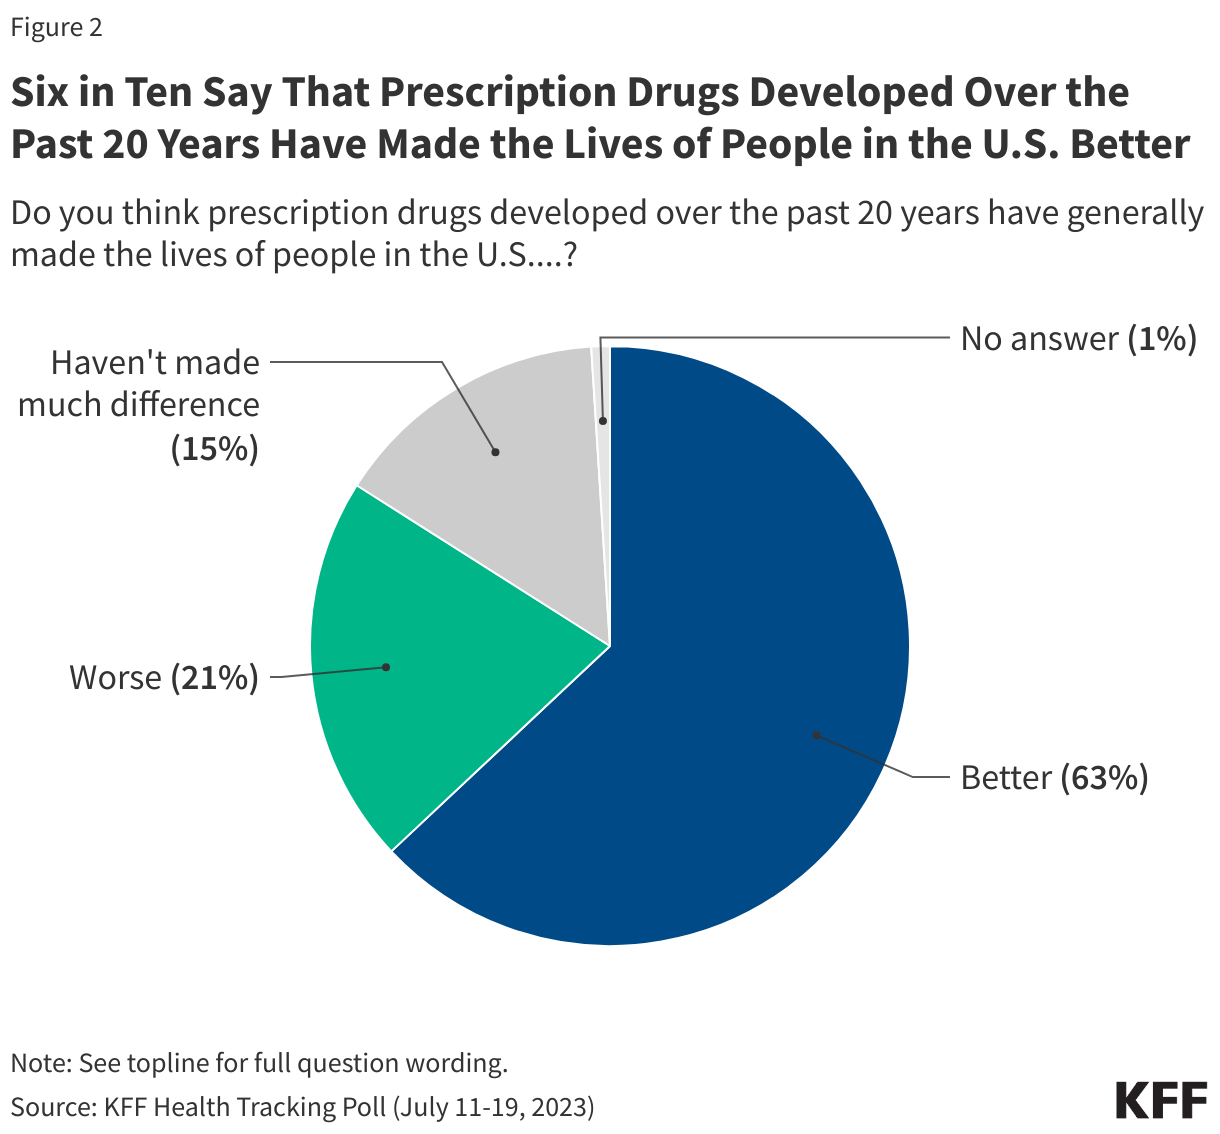
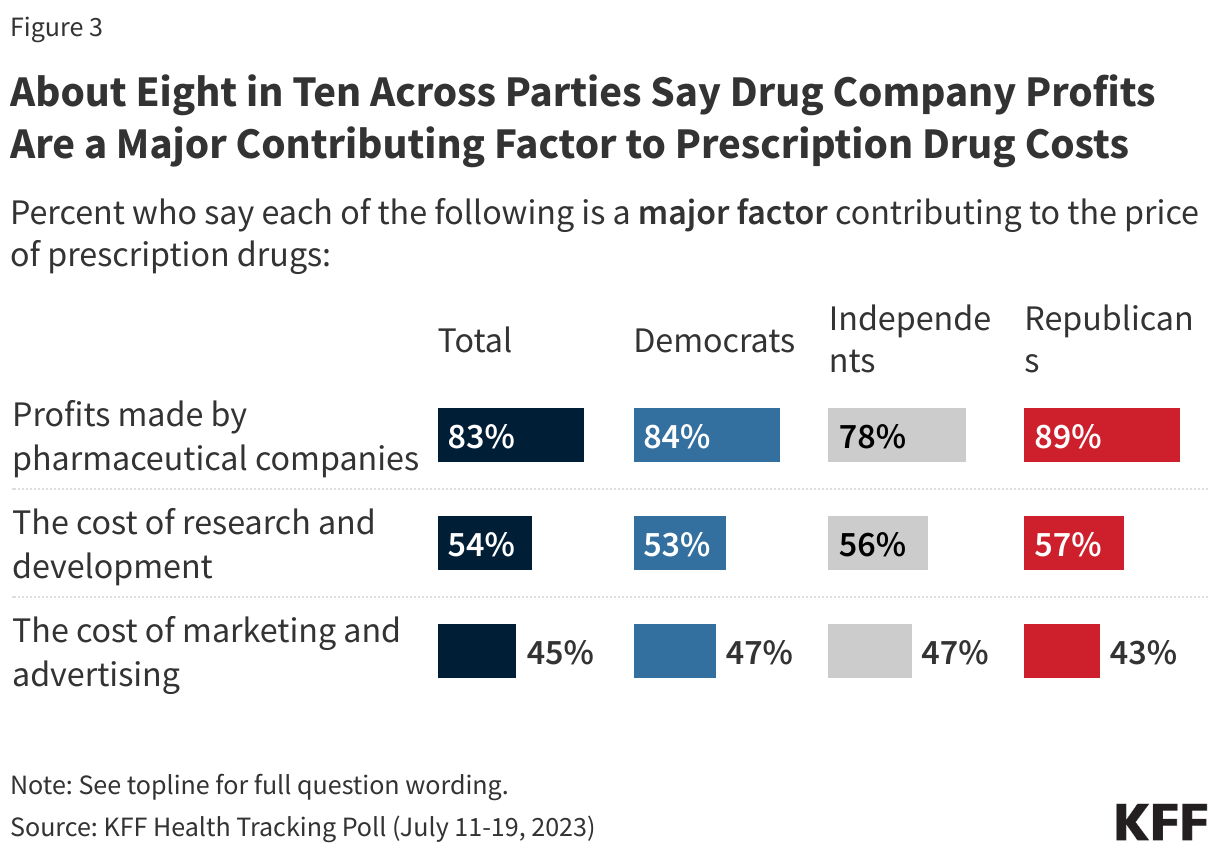
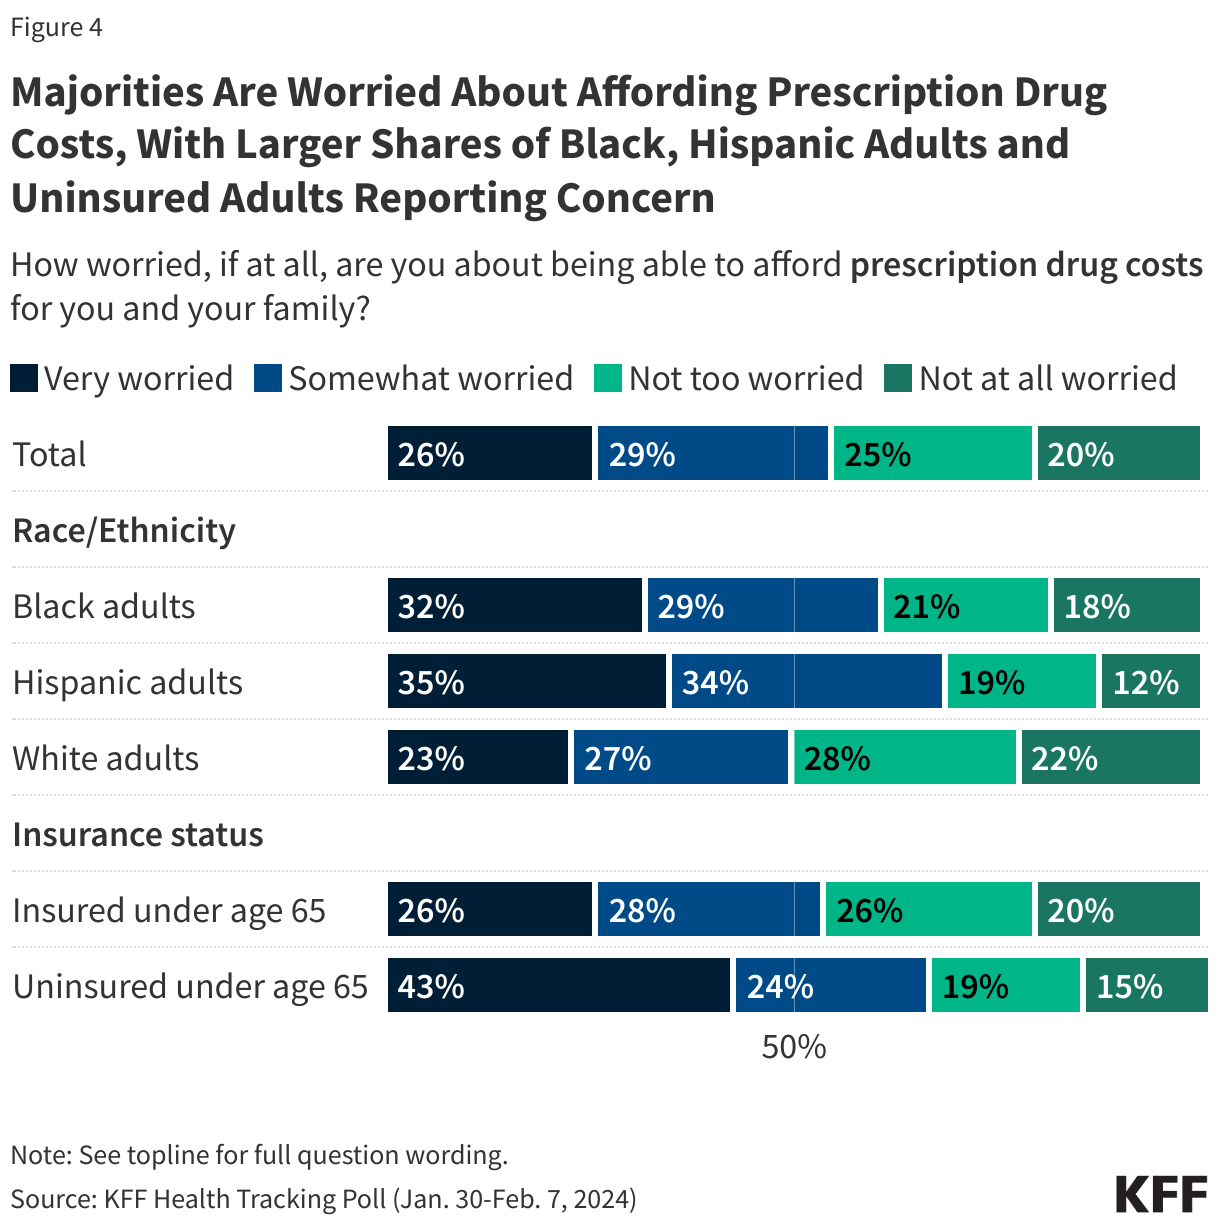
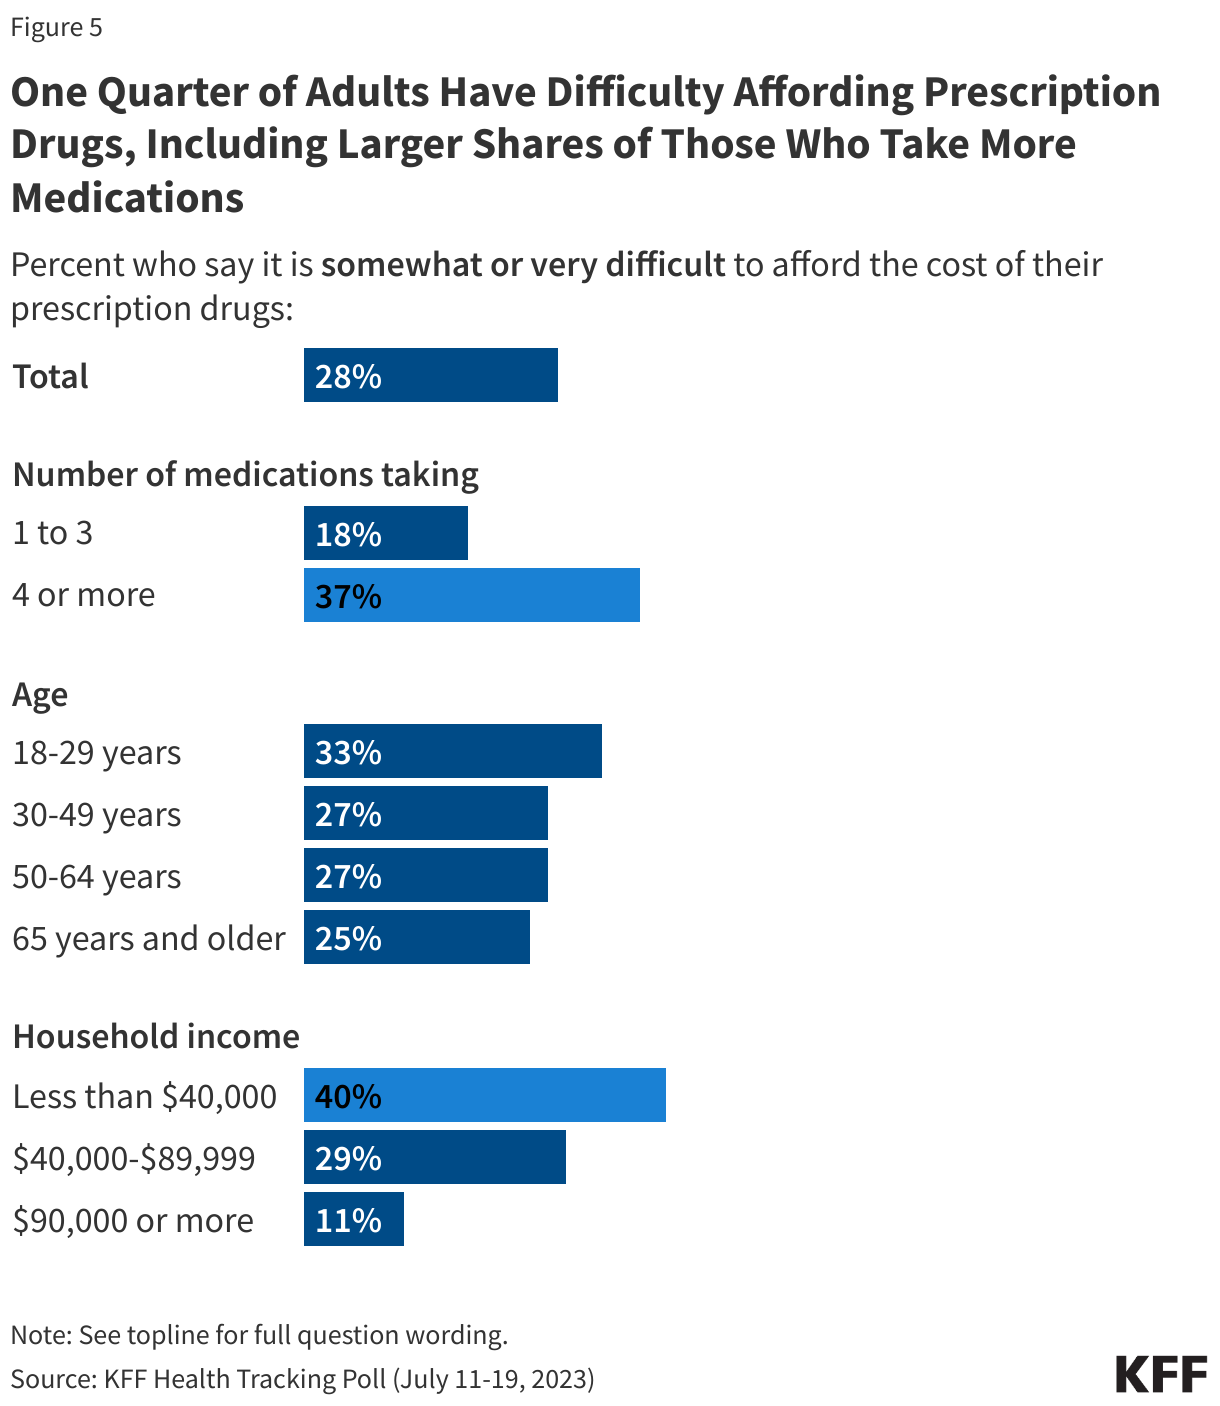
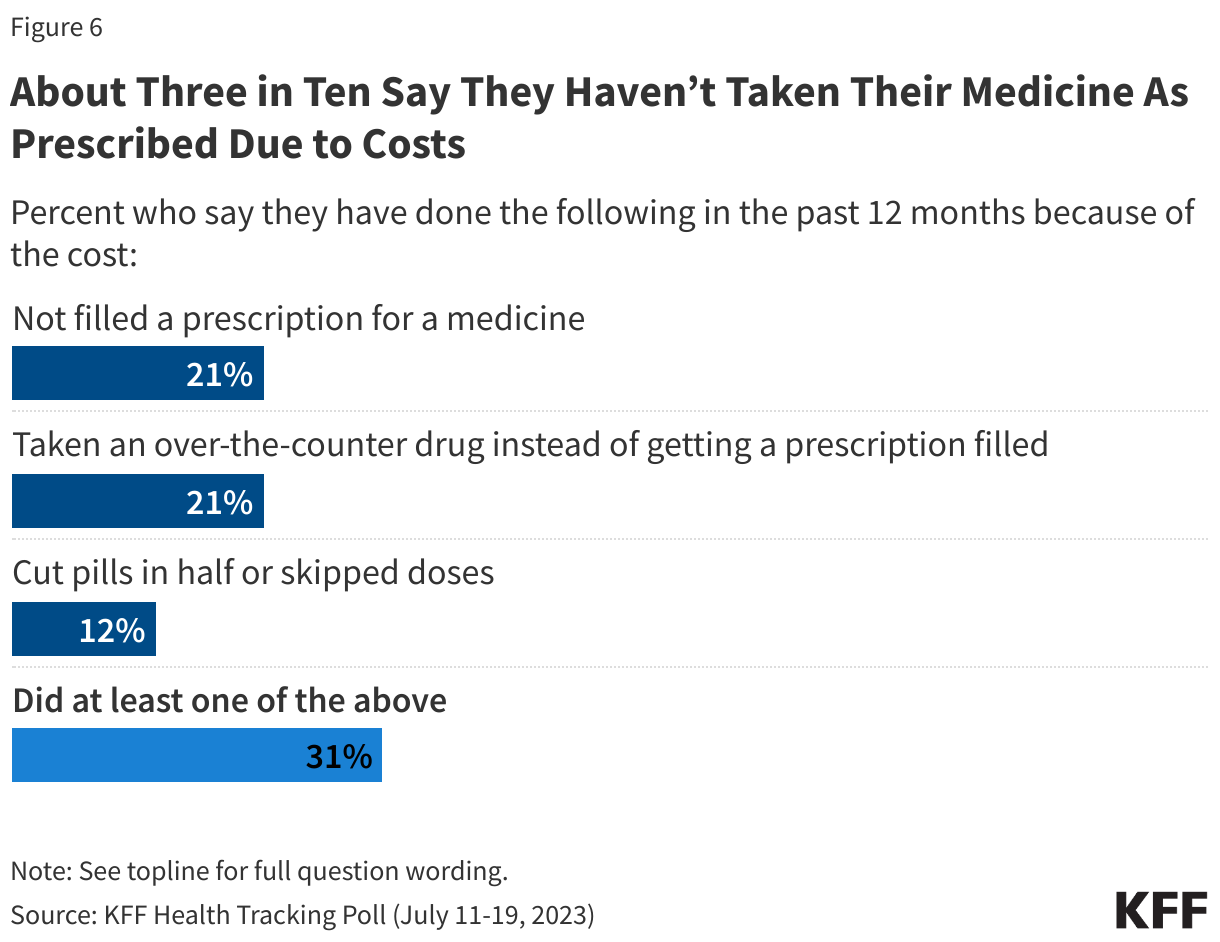
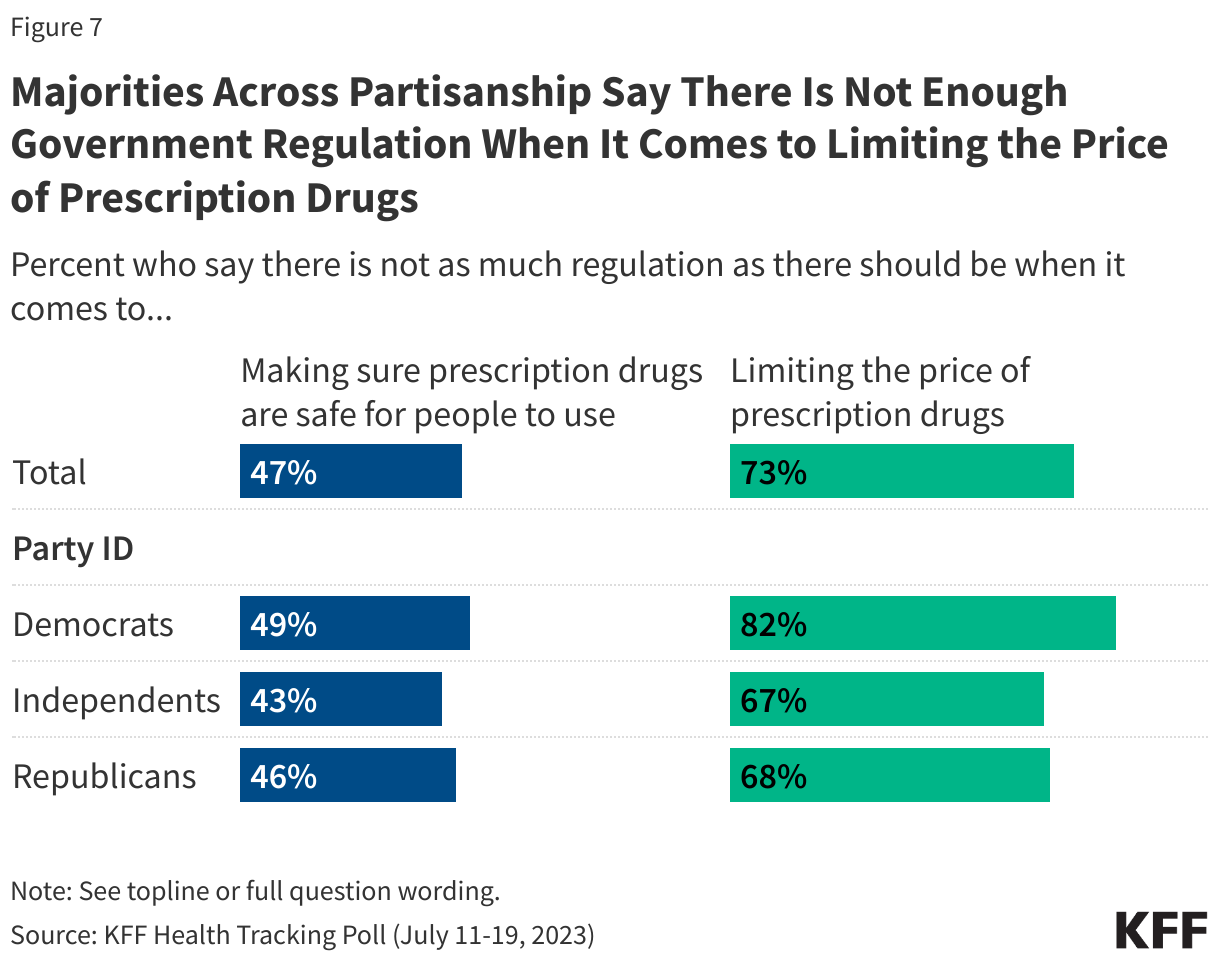
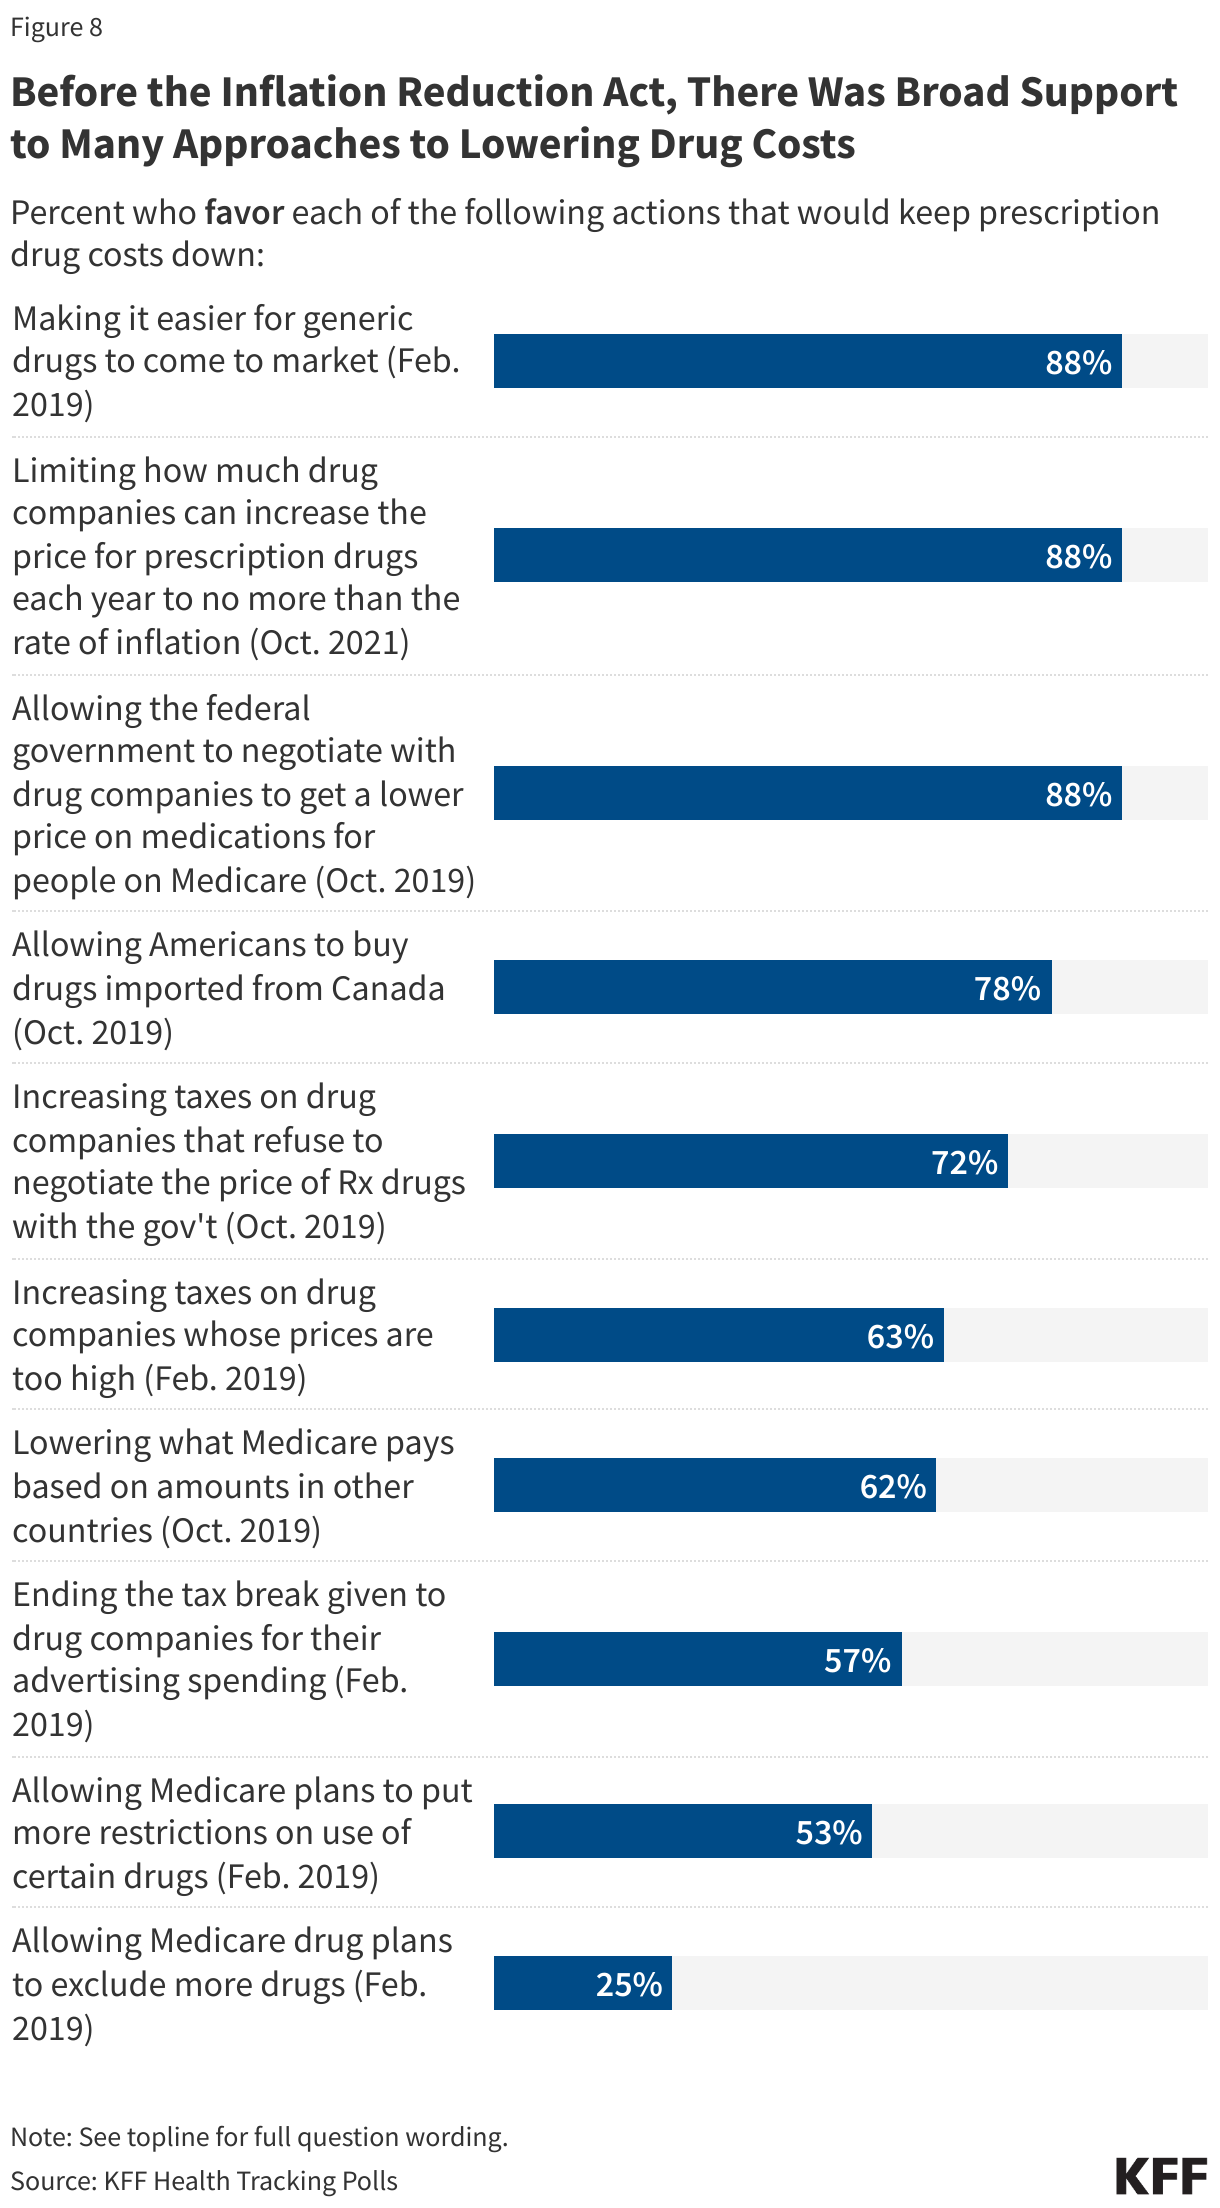
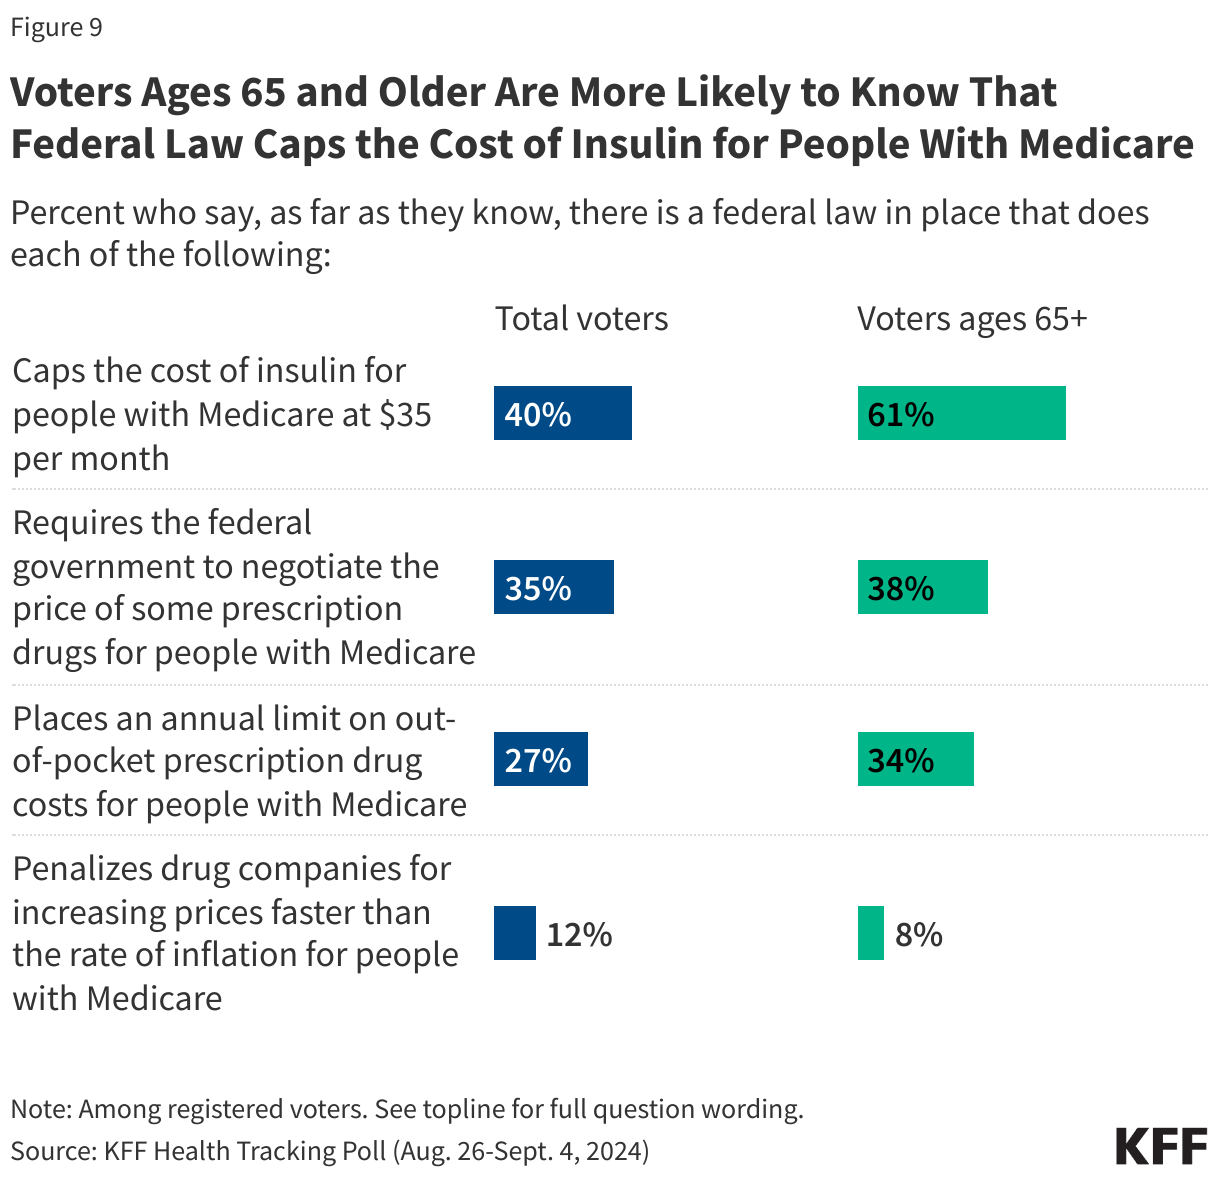
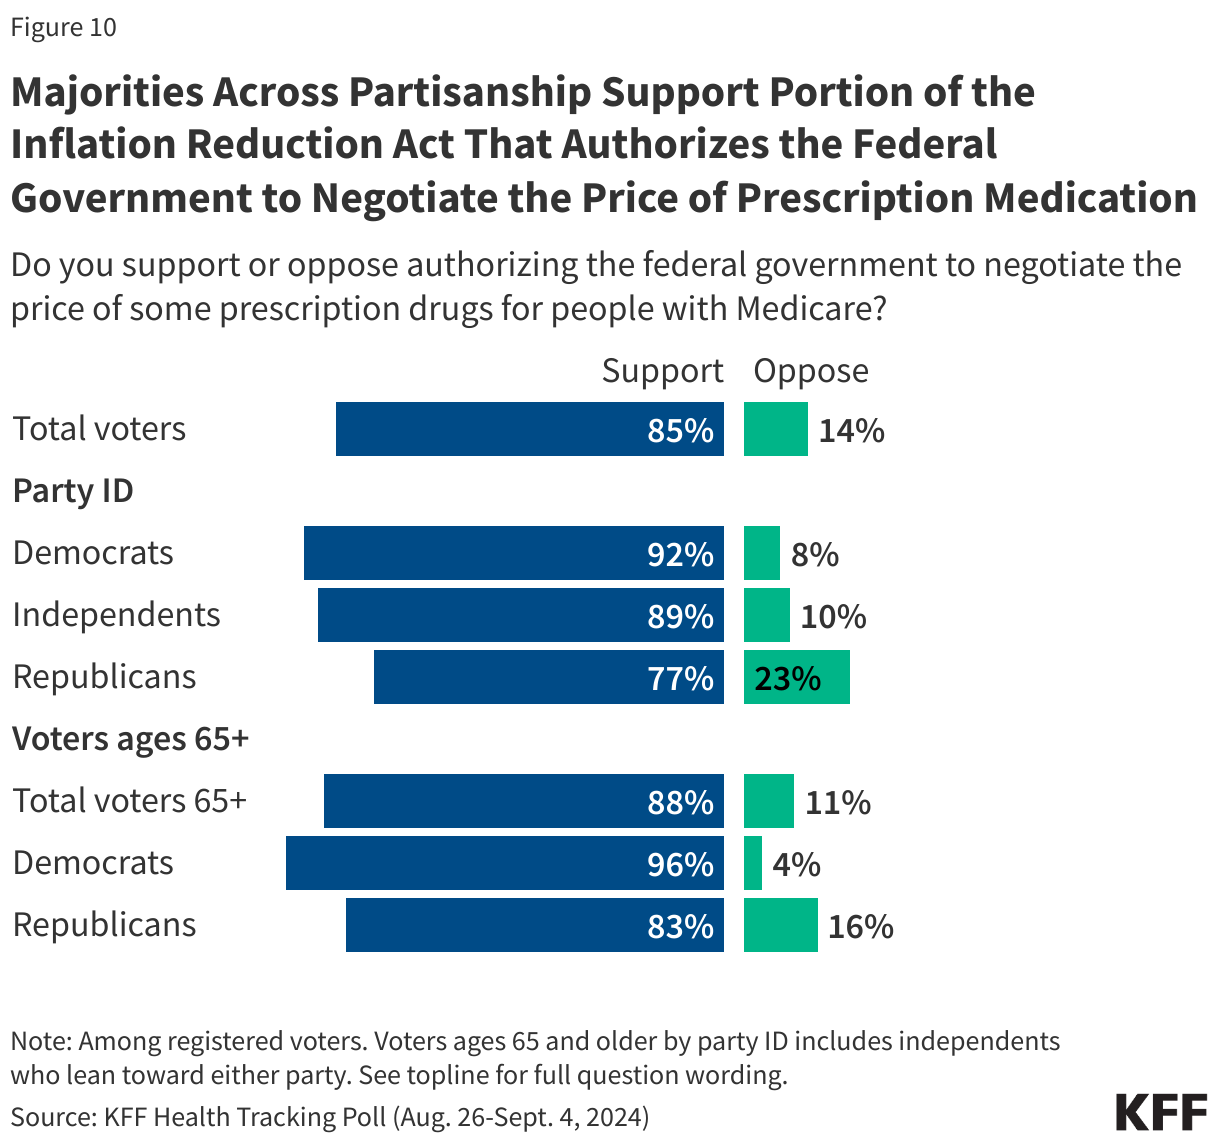
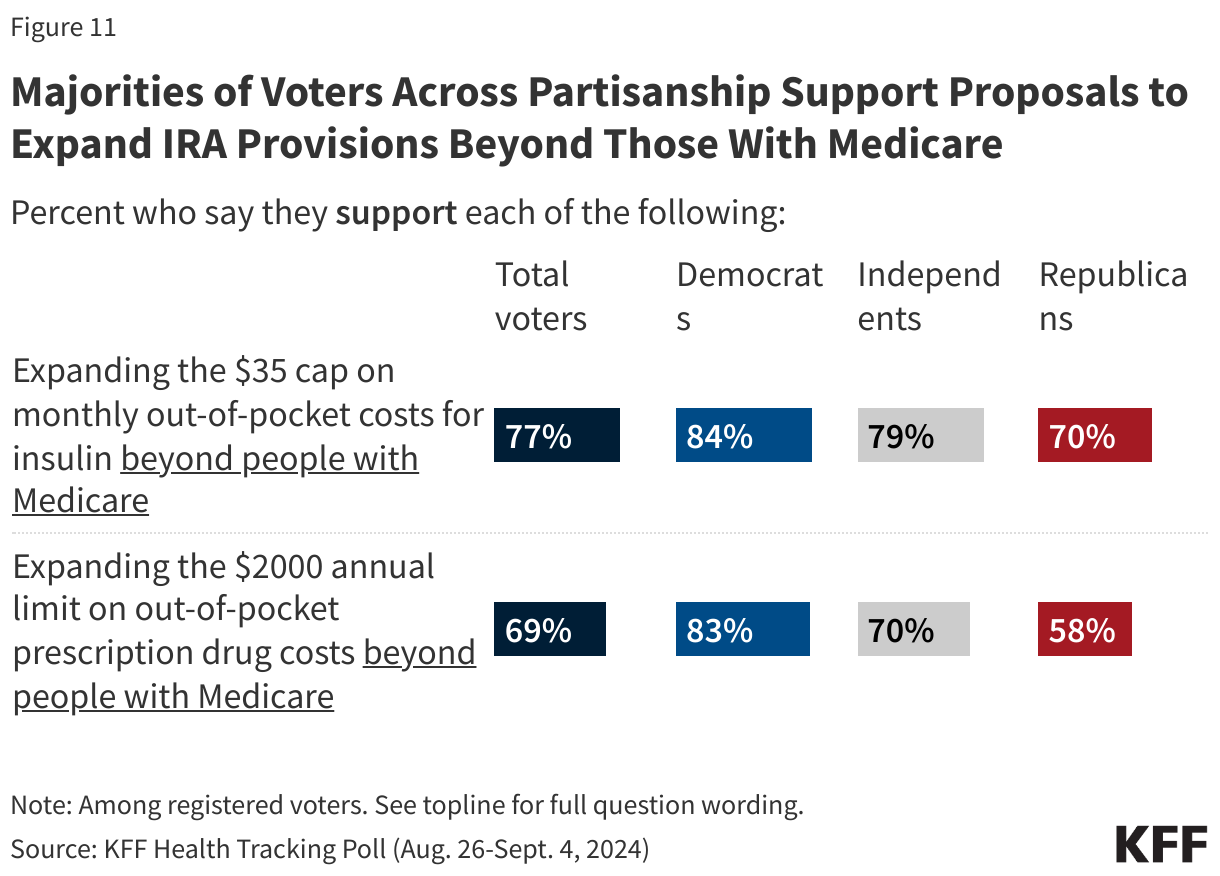
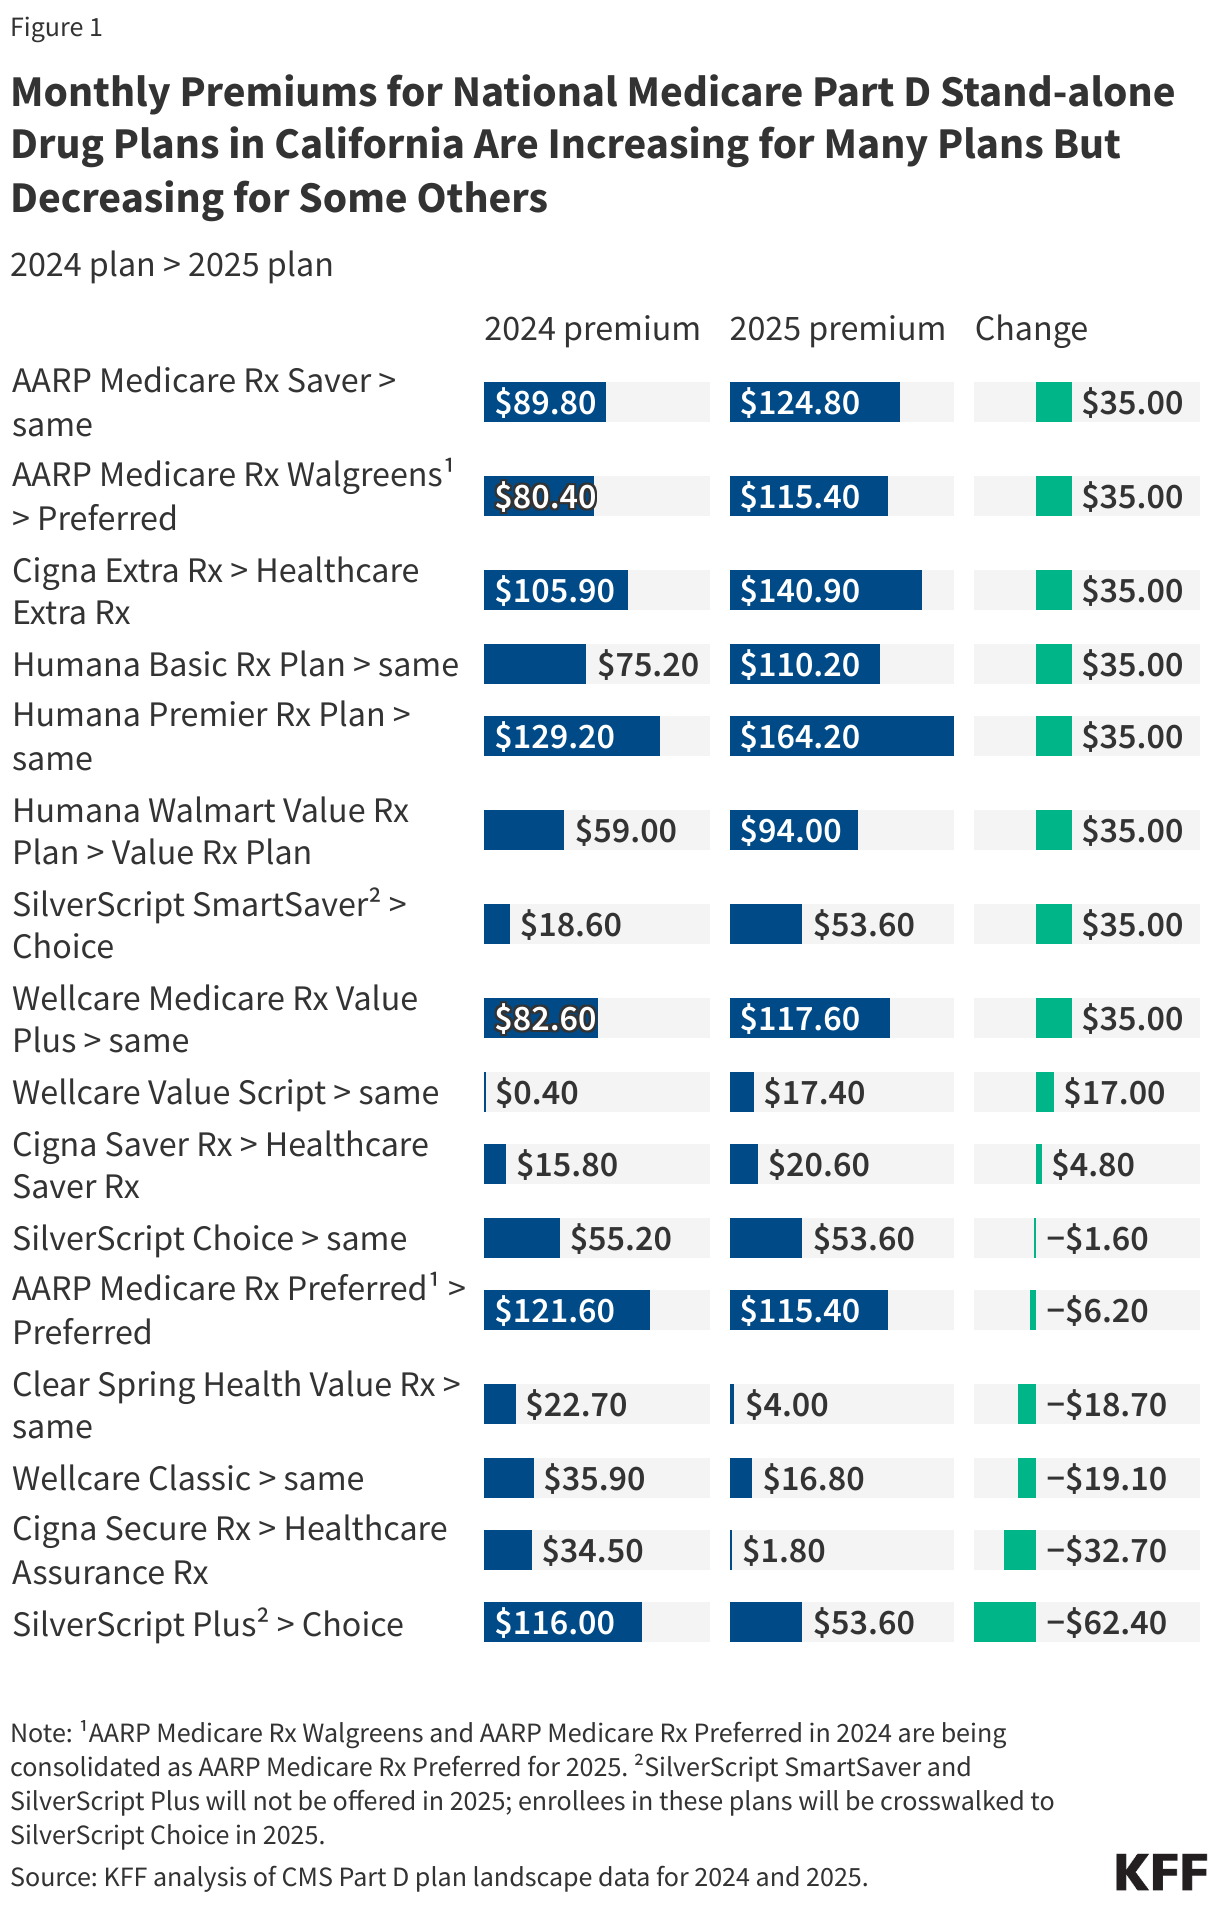
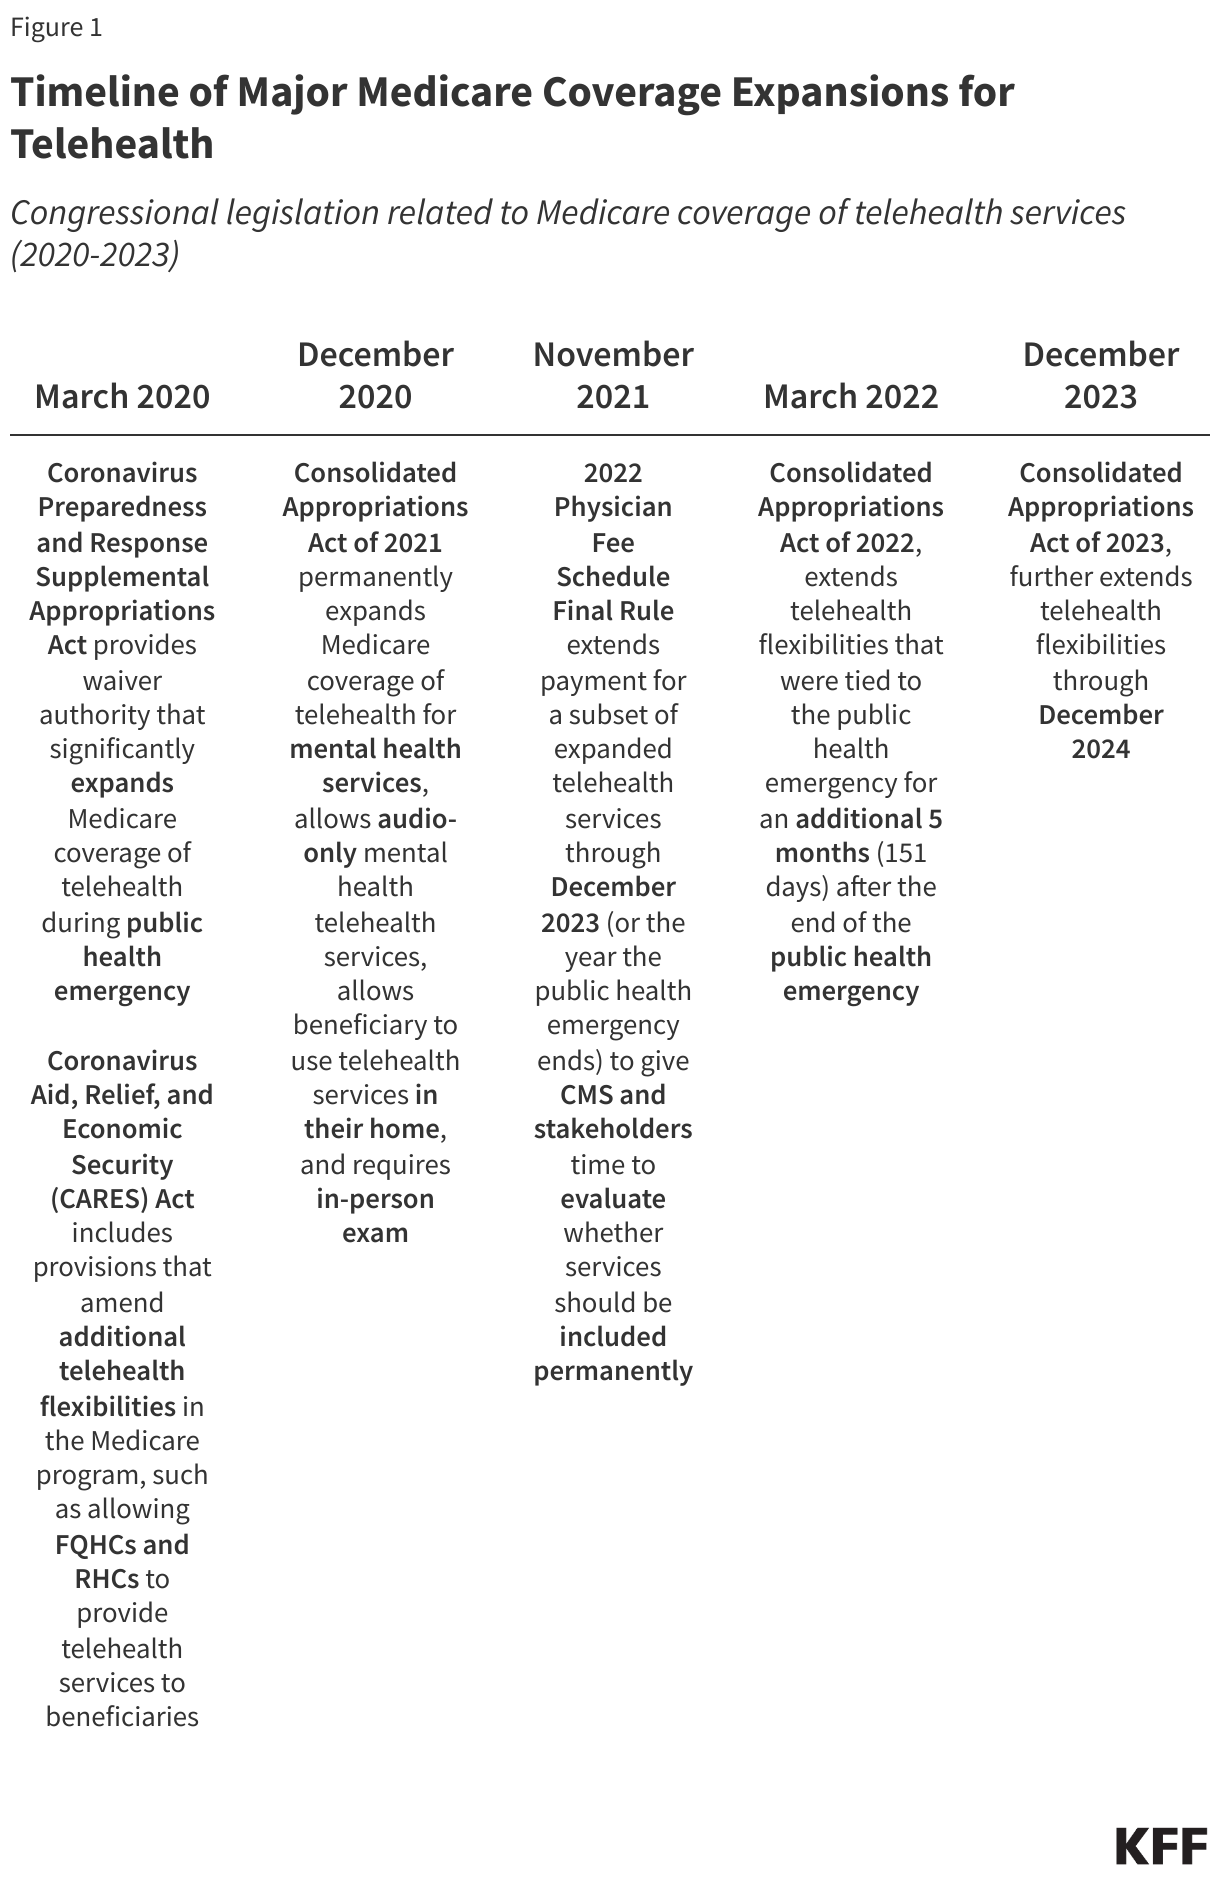
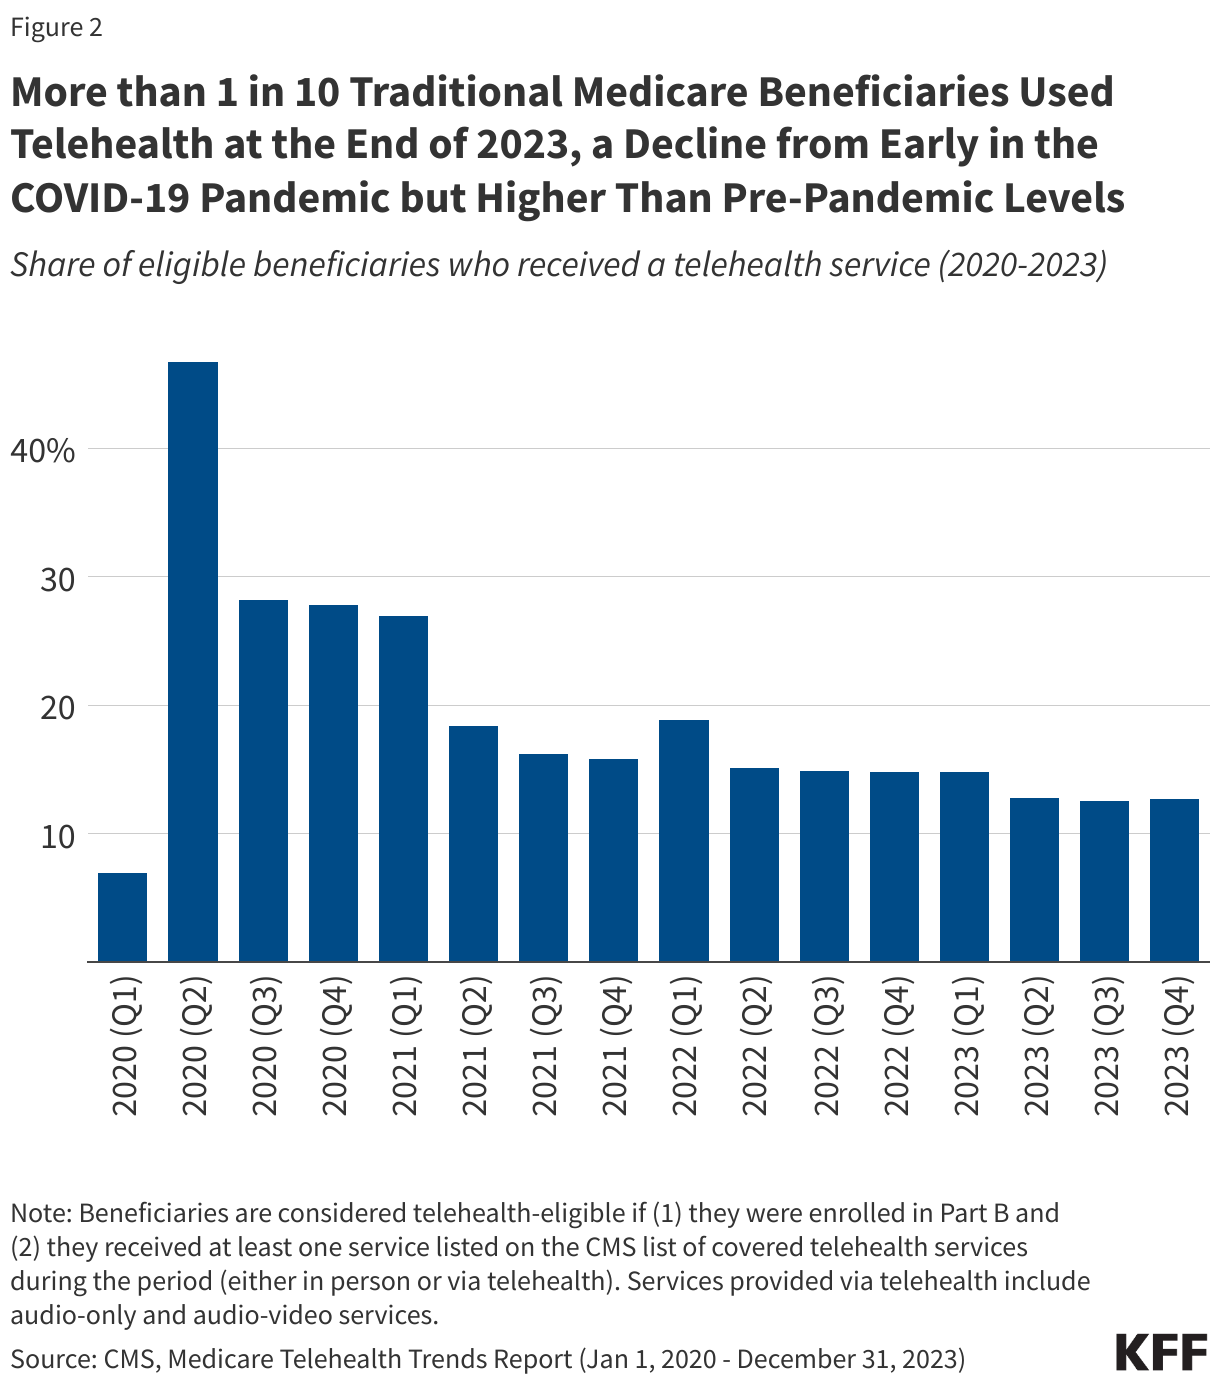
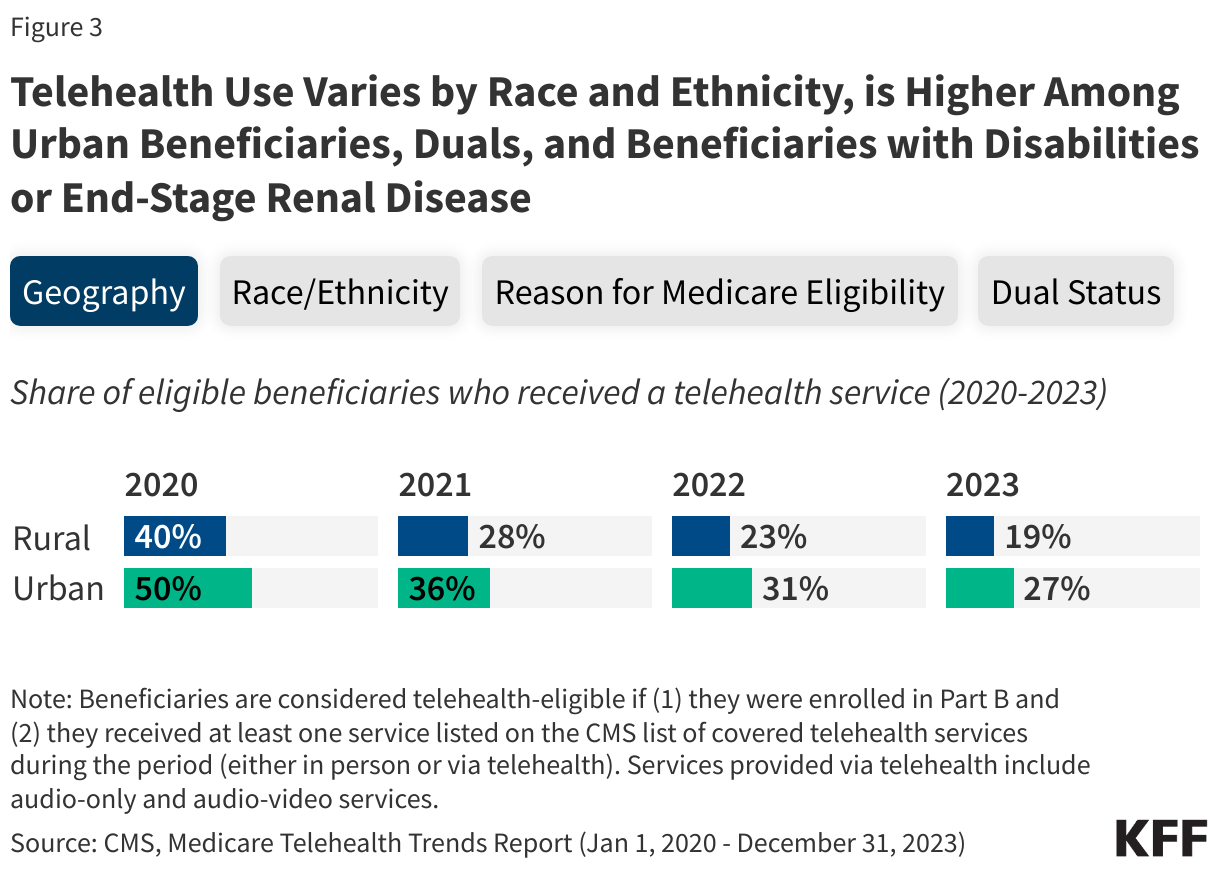