A Primer on Medicare: Key Facts About the Medicare Program and the People it Covers

Authors: Juliette Cubanski, Christina Swoope, Cristina Boccuti, Gretchen Jacobson, Giselle Casillas, Shannon Griffin, and Tricia Neuman
Published: Mar 20, 2015
Section:
0 / 0

Introduction

July 30, 2015 marks the 50th anniversary of the date in 1965 that President Lyndon Johnson signed the law establishing the Medicare program. Medicare is a social insurance program that helps to provide health and financial security for people ages 65 and older and younger people with permanent disabilities. Prior to 1965, roughly half of all seniors lacked medical insurance; today, virtually all seniors have health insurance under Medicare. Since Medicare’s beginning, a number of changes have been made to expand benefits, revise the way Medicare pays providers, modify beneficiary out-of-pocket costs for Medicare-covered services, improve access and coverage for low-income individuals, expand the role of private plans in providing Medicare-covered benefits, strengthen quality, and address the growth in program spending.

Today, Medicare provides health insurance coverage to more than 55 million people: 46.3 million people ages 65 and older and 9 million people with permanent disabilities under age 65.1  The program helps to pay for many vital health care services, including hospitalizations, physician visits, and prescription drugs, along with post-acute care, skilled nursing facility, home health care, hospice, and preventive services. People who are working contribute payroll taxes to Medicare and most people become eligible for Medicare when they reach age 65, regardless of income or health status.

Comprising 14 percent of the federal budget in 2014 and just over one-fifth of total personal health expenditures in 2013, Medicare spending has slowed in recent years and is expected to grow at a slower rate than private insurance on a per person basis over the next decade. At the same time, Medicare is often part of discussions about how to moderate the growth of both federal spending and health care spending in the U.S. With the challenges of providing increasingly expensive medical care to an aging population and sustaining the program for the future, Medicare is likely to remain prominent on the federal policymaking agenda in the years ahead. As policymakers consider potential changes to Medicare, the effects of such changes on total health care expenditures, Medicare spending, and beneficiaries’ access to quality care and their out-of-pocket costs will be important considerations.

Report: What Is Medicare?

Medicare was established in 1965 under Title XVIII of the Social Security Act to provide health insurance to people age 65 and older, regardless of income or medical history.

The program was expanded in 1972 to include people under age 65 with permanent disabilities receiving Social Security Disability Insurance (SSDI) payments and people with end-stage renal disease (ESRD). In 2001, Medicare eligibility expanded further to cover people with amyotrophic lateral sclerosis (ALS, or Lou Gehrig’s disease).

Medicare benefits are divided into four parts:

  • Part A, also known as the Hospital Insurance (HI) program, covers inpatient hospital, skilled nursing facility, some home health visits, and hospice care. Part A is funded by a tax of 2.9 percent of earnings paid by employers and workers (1.45 percent each), along with an additional 0.9 percent paid by higher-income taxpayers (wages above $200,000/individual and $250,000/couple). An estimated 55 million people are enrolled in Part A in 2015.2 
  • Part B, the Supplementary Medical Insurance (SMI) program, helps pay for physician, outpatient, some home health, and preventive services. Part B is funded by general revenues and beneficiary premiums. Beneficiaries who have higher annual incomes (more than $85,000/single person, $170,000/married couple) pay a higher, income-related monthly Part B premium; the Affordable Care Act (ACA) froze the income thresholds at 2010 levels from 2011 through 2019. An estimated 51 million people are enrolled in Part B in 2015.3 
  • Part C, also known as the Medicare Advantage program, allows beneficiaries to enroll in a private plan, such as a health maintenance organization (HMO) or preferred provider organization (PPO), as an alternative to traditional Medicare. These plans receive payments from Medicare to provide all Medicare-covered benefits, including hospital and physician services, and in most cases, prescription drug benefits. In 2014, 15.7 million beneficiaries were enrolled in Medicare Advantage plans.4 
  • Part D, the outpatient prescription drug benefit, was established by the Medicare Modernization Act of 2003 (MMA) and launched in 2006. The voluntary benefit is delivered through private plans that contract with Medicare: either stand-alone prescription drug plans (PDPs) or Medicare Advantage prescription drug (MA-PD) plans. Part D plan enrollees generally pay a monthly premium and cost sharing for prescriptions (varying by plan). In 2015, an estimated 42 million beneficiaries are enrolled in Part D.5 

Report: Who Is Eligible For Medicare?

In 2015, Medicare provides health insurance coverage to 55 million people: 46 million people ages 65 and older and 9 million people with permanent disabilities who are under age 65.6 

The four different parts of Medicare have varying eligibility requirements, as described below. In general, coverage under Medicare Part A and Part B is automatic when a Medicare-eligible individual applies for Social Security or Railroad Retirement benefits. Individuals can decline enrollment in Medicare Part B if they have other qualifying group coverage. If an individual qualifies for Medicare at age 65 but is not yet receiving Social Security or Railroad Retirement benefits, an application for Medicare is required to initiate Medicare coverage.

Most people age 65 and older are eligible for Part A, as are some people under age 65 with permanent disabilities and those with ESRD or ALS.

  • Age 65 and older: People age 65 and older qualify for Medicare if they are U.S. citizens or permanent legal residents with at least five years of continuous residence. Individuals qualify without regard to their medical history or preexisting conditions, and do not need to meet an income or asset test.
  • Under age 65: Adults under age 65 with permanent disabilities are eligible for Medicare after receiving Social Security Disability Income (SSDI) payments for 24 months.
  • ESRD/ALS: People with end-stage renal disease (ESRD) or amyotrophic lateral sclerosis (ALS) are eligible for Medicare benefits as soon as they begin receiving SSDI payments, without having to wait an additional 24 months.

Since most people make payroll tax contributions during their working years, most people who are eligible for Part A do not need to pay premiums for covered services. However, people age 65 and older are required to pay a monthly premium to receive Part A benefits if neither they nor their spouse made payroll contributions for 40 or more quarters. Adults under age 65 who are eligible for Medicare do not need to pay premiums for Part A benefits.

People eligible for Part A are also eligible for Part B.

Medicare Part B is voluntary, but more than 90 percent of beneficiaries with Part A are also enrolled in Part B.7  For most individuals who become entitled to Part A, enrollment in Part B is automatic unless the individual declines enrollment. Individuals age 65 and older who are not entitled to premium-free Part A may enroll in Part B. With the exception of Medicare-eligible individuals who are working (or those with working spouses), who may delay enrollment in Part B if they receive employment-based coverage, those who do not sign up for Part B when they are first eligible typically pay a penalty for late enrollment in addition to the regular monthly premium for the duration of their enrollment in Part B.

People may choose to enroll in Part C, also known as Medicare Advantage, if they are entitled to Part A and enrolled in Part B.

Outside of their initial enrollment period for Medicare, beneficiaries can elect to enroll in a Medicare Advantage plan (or switch from one plan to another) on an annual basis between October 15 and December 7 of each year during the annual election period. Changes made during this period take effect on January 1 of the following year. Beneficiaries enrolled in a Medicare Advantage plan on January 1 who wish to disenroll and return to traditional Medicare have 45 days to do so (between January 1 and February 14 each year); they are not allowed to switch from one Medicare Advantage plan to another during this period.

People are eligible for Part D prescription drug coverage if they are enrolled in Part A, Part B, or both.

To get Part D benefits, beneficiaries must enroll in a stand-alone prescription drug plan (PDP) or Medicare Advantage prescription drug (MA-PD) plan. The annual election period for Part D runs from October 15 to December 7 each year. People who delay enrollment in Part D beyond their initial enrollment period and who do not have “creditable” drug coverage (at least comparable to the Part D standard benefit) during this time pay a permanent premium penalty if they choose to enroll in a Part D plan at a later time.

Report: What Are The Characteristics Of People With Medicare?

Medicare covers a population with a diverse profile in terms of demographics and health status. A majority of beneficiaries are white, female, between the ages of 65 and 84, and report their health status as good or better. While many Medicare beneficiaries enjoy good health, others have significant health needs and limitations.

While most beneficiaries (71%) are between the ages of 65 and 84, 16 percent are under age 65 and permanently disabled, while another 13 percent are ages 85 and older (Figure 1). More than half of beneficiaries (55%) are female, but women account for an even larger share of beneficiaries at older ages. More than three-quarters (77%) of beneficiaries are white, while 10 percent are black and 9 percent are Hispanic.8 

Figure 1: Selected Demographic Characteristics of Medicare Beneficiaries, 2010

In terms of health status, a majority of beneficiaries report being in good or better health, but one in four Medicare beneficiaries report (26%) being in fair or poor health (Figure 2). Close to half (45%) of beneficiaries live with four or more chronic conditions and three out of ten beneficiaries (31%) have a cognitive or mental impairment. One-third of beneficiaries (34%) have one or more limitations in activities of daily living (ADLs), such as eating or bathing, that limit their ability to function independently.

Figure 2: Selected Measures of Health Status of the Medicare Population, 2010

Most Medicare beneficiaries live at home; however, five percent live in a long-term care setting, such as a nursing home or assisted living facility. Women account for nearly two-thirds of beneficiaries living in long-term care settings along with a disproportionate share of beneficiaries ages 85 and older (67%) and beneficiaries who are dually eligible for Medicare and Medicaid (60%).

A larger share of beneficiaries at both ends of the age spectrum report poorer health status and having more chronic conditions and functional limitations than beneficiaries between the ages of 65 and 74.

Compared to beneficiaries over age 65, a larger share of beneficiaries under age 65 are men (53% versus 44%), racial and ethnic minorities (36% versus 21%), and are dually eligible for Medicare and Medicaid (46% versus 14%). Because people under age 65 on Medicare qualified due to having a permanent disability, they typically have relatively high rates of chronic conditions, functional limitations, and cognitive impairments. A much larger share of beneficiaries under age 65 than those ages 65 and older report that they are in fair or poor health status (56% versus 21%).

Among beneficiaries at the older end of the age spectrum, a larger share of beneficiaries ages 85 and older than those between the ages of 65 and 74 are women (67% versus 54%), white (85% versus 78%), living in long term care facilities (17% versus 2%), and dually eligible for Medicare and Medicaid (20% versus 11%). Not surprisingly, there are also differences in health status between the two groups; compared to younger seniors, a larger share of the oldest old (age 85 and older) have four or more chronic conditions (61% versus 36%), cognitive impairments (44% versus 19%), and one or more functional limitations (60% versus 20%).

Most Medicare beneficiaries have limited financial resources, including incomes and assets. A disproportionate share of beneficiaries with low incomes and assets are women, racial and ethnic minorities, and under age 65.

In 2013, half of all Medicare beneficiaries had incomes below $23,500 per person (Figure 3).9  This equates to roughly 200 percent of the federal poverty level ($11,173 for a single person and $14,095 for a married couple age 65 and older in 2013).10  Income declines with age among seniors and is lower among women than men and among blacks and Hispanics compared to whites, and higher among married beneficiaries and those with higher education levels. A larger share of beneficiaries under age 65 have relatively low incomes compared to those ages 65 and older.

Figure 3: Distribution of Medicare Beneficiaries By Income, 2013

Along with having relatively low incomes, many Medicare beneficiaries have relatively low levels of savings. In 2013, half of all beneficiaries reported savings less than $61,400 per person. As with income, savings levels are lower among beneficiaries who are female, racial and ethnic minorities, and those under age 65.

Future growth in the Medicare population will affect the demographic profile of beneficiaries.

Driven by the aging “Baby Boom” generation, the U.S. population ages 80 and over will nearly triple between 2010 and 2050, increasing from 11 million to 31 million people, and the number of people ages 90 and over will quadruple (from 2 million to 8 million). As an increasing number of people become eligible for Medicare and as more people live into their 80s and beyond, the demographics of the Medicare population can be expected to change, not only in terms of the age distribution, but also beneficiaries’ physical and mental capabilities, financial resources, health status, and medical needs.

Report: What Does Medicare Cover?

Medicare provides coverage of a comprehensive set of vital medical services, including care in hospitals and other settings, physician services, diagnostic tests, preventive services, and an outpatient prescription drug benefit. (See Appendix 1: Medicare Benefits and Cost-Sharing Requirements, 2015)

  • Part A benefits include inpatient care provided in hospitals and short-term stays in skilled nursing facilities, hospice care, post-acute home health care, and pints of blood received at a hospital or skilled nursing facility. In 2010, 19 percent of beneficiaries in traditional Medicare had an inpatient hospital stay, while 9 percent used home health care services, 5 percent had a skilled nursing facility stay, and 3 percent used hospice care (Figure 4).
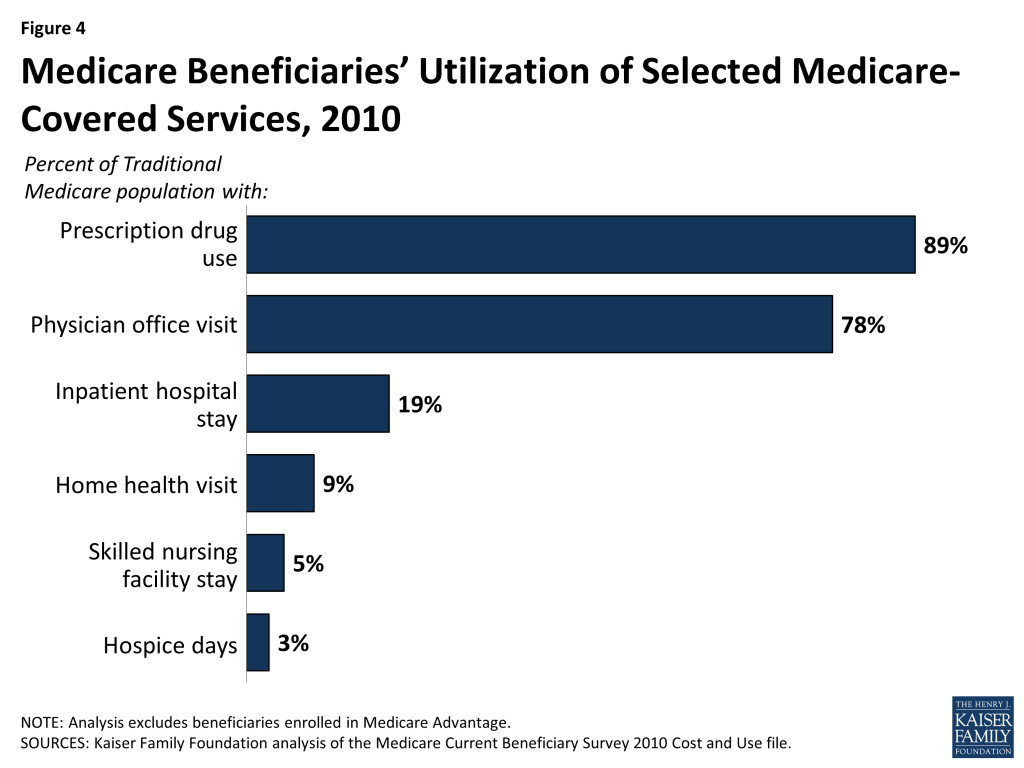
Figure 4: Medicare Beneficiaries’ Utilization of Selected Medicare-Covered Services, 2010
  • Part B benefits include outpatient services such as outpatient hospital care, physician visits, and preventive services (e.g., mammography and colorectal screening). Part B benefits also include ambulance services, clinical laboratory services, durable medical equipment (such as wheelchairs and oxygen), kidney supplies and services, outpatient mental health care, and diagnostic tests (such as x-rays and magnetic resonance imaging). The ACA added a free annual comprehensive wellness visit and personalized prevention plan to the list of Medicare-covered benefits. The law also gave the Secretary of Health and Human Services (HHS) the authority to modify coverage of Medicare-covered preventive services to conform to the recommendations of the U.S. Preventive Services Task Force (USPSTF). A larger share of beneficiaries use Part B services compared to Part A services. For example, in 2010, more than three quarters (78%) of traditional Medicare beneficiaries had a physician office visit.
  • Part C (Medicare Advantage) private health plans cover all benefits under Medicare Part A, Part B, and, in most cases, Part D. Medicare Advantage plans are required to provide all Medicare-covered benefits, but are permitted to vary the benefit design as long as the core benefit package (excluding the value of supplemental benefits) is actuarially equivalent to traditional Medicare. Some Medicare Advantage plans also include extra benefits, such as dental services, eyeglasses, or hearing exams. (See What is Medicare Advantage? for additional information.)
  • Part D covers an outpatient prescription drug benefit through private plans. Plans are required to provide a “standard” benefit or one that is actuarially equivalent, and may offer more generous benefits. In 2010, 89 percent of traditional Medicare beneficiaries used prescription drugs. (See What is the Medicare Part D prescription drug benefit? for additional information.)

Despite the important protections provided by Medicare, there are significant gaps in Medicare’s benefit package.

Medicare does not pay for some services and supplies that are often needed by older people and younger beneficiaries with disabilities. For instance, Medicare does not pay for custodial long-term services and supports, either at home or in an institution, such as a nursing home or assisted living facility. Medicare also does not pay for routine dental care and dentures, routine vision care or eyeglasses, or hearing exams and hearing aids.

Report: How Much Do Beneficiaries Pay For Medicare Benefits?

Medicare has varying premiums, deductibles, and coinsurance amounts that can change annually to reflect changes in program costs. Taken altogether, Medicare has relatively high cost-sharing requirements for covered benefits and, unlike typical large employer plans, traditional Medicare does not place a limit on beneficiaries’ annual out-of-pocket spending. (See Appendix 1: Medicare Benefits and Cost-Sharing Requirements, 2015)

Part A:

  • Most beneficiaries do not pay a monthly premium for Part A services, but are required to pay a deductible before Medicare coverage begins. In 2015, the Part A deductible for each “spell of illness” is $1,260 for an inpatient hospital stay.
  • Beneficiaries are generally subject to coinsurance for Part A benefits, including extended inpatient stays in a hospital ($315 per day for days 61-90 and $630 per day for days 91-150 in 2015) or skilled nursing facility ($157.50 per day for days 21-100 in 2015). There is no coinsurance for days 1-60 of an inpatient hospital stay or days 1-20 of a skilled nursing facility stay, and there is no cost sharing for home health visits.

Part B:

  • Beneficiaries enrolled in Part B are generally required to pay a monthly premium ($104.90 in 2015).
  • Beneficiaries with annual incomes greater than $85,000 for a single person or $170,000 for a married couple in 2015 pay a higher, income-related monthly Part B premium, ranging from $146.90 to $335.70. The income amounts that are used to determine who pays the income-related premium and how much they will pay are fixed at their current levels through 2019. Approximately 5 percent of all Medicare beneficiaries paid the income-related Part B premium in 2014.
  • Part B benefits are subject to an annual deductible ($147 in 2015), and most Part B services are subject to coinsurance of 20 percent. No coinsurance or deductible is charged for the annual wellness visit or for preventive services that are rated ‘A’ or ‘B’ by the USPSTF.

Part C (Medicare Advantage):

  • Medicare Advantage plan enrollees generally pay the monthly Part B premium and many also pay an additional premium directly to their plan.
  • Medicare Advantage plans are required to place a limit on beneficiaries’ out-of-pocket expenses for Medicare Part A and Part B covered services ($6,700 in 2015). This limit is not applied to beneficiaries in traditional Medicare, nor is it applied to out-of-pocket expenses for prescription drugs covered under Part D. (See What is Medicare Advantage? for additional information.)

Part D:

  • In general, Part D enrollees pay a monthly premium, along with cost-sharing amounts for each brand-name and generic drug prescription; premiums and cost sharing vary by plan.
  • Part D enrollees with higher incomes ($85,000 for a single person and $170,000 for a couple) pay an income-related monthly adjustment amount in addition to the monthly premium charged by their Part D plan. As with the Part B income-related premium, the income thresholds that determine who pays higher premiums for Part D coverage are fixed at current levels through 2019. (See What is the Medicare Part D prescription drug benefit? for additional information.)

Many people who are covered under traditional Medicare obtain some type of private supplemental insurance (such as Medigap or employer-sponsored retiree coverage) to help cover their Medicare cost-sharing requirements.

Supplemental insurance coverage can help beneficiaries pay their out-of-pocket costs for Medicare-covered services. Even with supplemental insurance, however, beneficiaries can face out-of-pocket expenses in the form of copayments for services including physician visits and prescription drugs as well as costs for services not covered by Medicare. Also, premiums for these policies can be costly: beneficiaries with Medigap supplemental policies generally pay higher premiums than those with employer-sponsored retiree health coverage. Moreover, while Medicaid, the Medicare Savings Programs (MSPs), and the Part D Low-Income Subsidy (LIS) program help to shield low-income beneficiaries from Medicare premiums and other out-of-pocket costs, not all low-income people on Medicare qualify for these programs. (See What types of supplemental insurance do beneficiaries have? for additional information.)

Many beneficiaries face significant out-of-pocket costs for both premiums and non-premium expenses to meet their medical and long-term care needs.

The burden of out-of-pocket spending for health care expenses is three times larger for Medicare households than non-Medicare households (Figure 5). In 2010, Medicare beneficiaries spent $4,745 out of their own pockets for health care spending, on average, including premiums for Medicare and other types of supplemental insurance and costs incurred for medical and long-term care services (Figure 6). Premiums for Medicare and supplemental insurance accounted for 42 percent of average total out-of-pocket spending among beneficiaries in traditional Medicare in 2010.

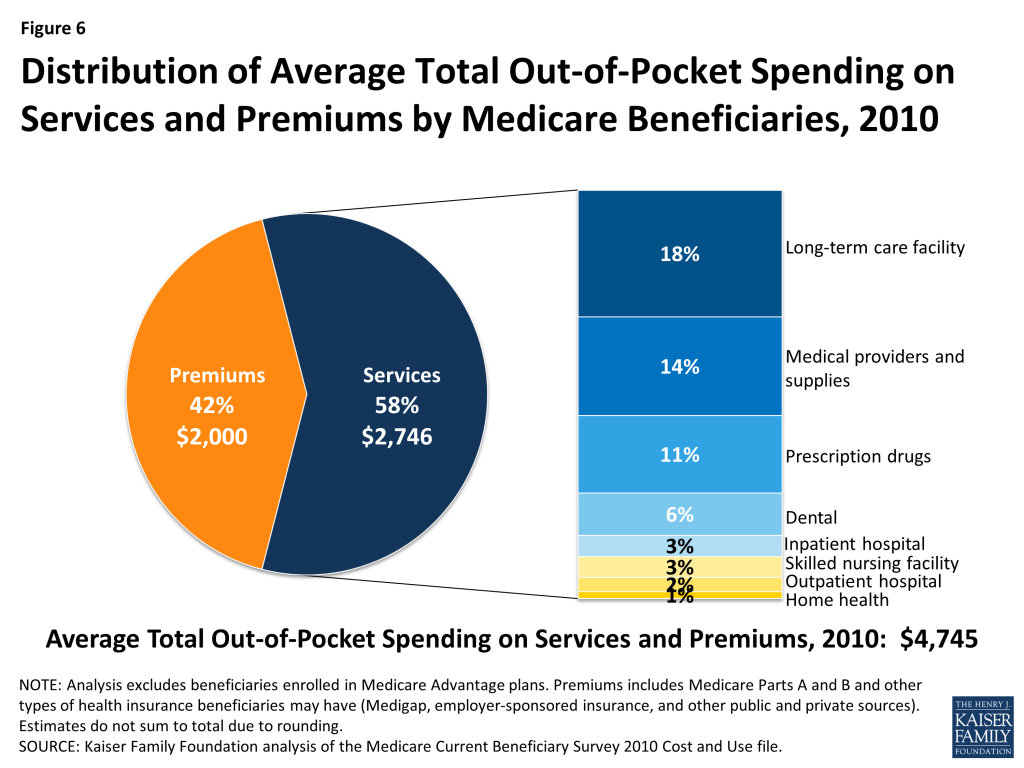
Figure 5: Distribution of Average Household Spending by Medicare and Non-Medicare Households, 2012
Figure 6: Distribution of Average Total Out-of-Pocket Spending on Services and Premiums by Medicare Beneficiaries, 2010

Of the remaining 58 percent of average total out-of-pocket spending on services, long-term facility costs are the largest component (accounting for 18 percent of total out-of-pocket spending), followed by medical providers/supplies (14%), prescription drugs (11%), and dental care (6%).

Out-of-pocket spending varies by beneficiary characteristics, including age, sex, and health status. Not surprisingly, more extensive use of services leads to higher out-of-pocket spending.

Spending on medical and long-term care rises with age among beneficiaries ages 65 and older and is higher for women than men, especially among those ages 85 and older (Figure 7). Beneficiaries’ health status and chronic conditions also are significant drivers of out-of-pocket spending, with average out-of-pocket spending on services rising as beneficiaries’ health status declines, and rising with the number of functional impairments and chronic conditions. Out-of-pocket spending is also higher among beneficiaries who have multiple hospitalizations and post-acute care use and those who live in long-term care facilities. These differences are driven primarily by variation in average spending on medical and long-term care services, rather than by variation in premium spending.11 

Figure 7: Medicare Beneficiaries’ Average Total Out-of-Pocket Spending on Services and Premiums, by Self-Reported Health Status and Age, 2010

Analysis of ‘high out-of-pocket spenders’ finds a disproportionate share of certain groups in the top quartile and top decile of total out-of-pocket spending (including both services and premiums).

In 2010, one in four beneficiaries spent at least $5,276 out of pocket on medical and long-term care services and premiums (the top quartile), and one in ten spent at least $8,292 (the top decile). Average total out-of-pocket spending among the top quartile—$11,501 in 2010—was more than twice as much as the average among all beneficiaries ($4,745), while among the top decile, it was four times as much ($19,103). Long-term care facility costs are a major component of spending for beneficiaries in the top quartile of total out-of-pocket spending. This group of ‘high out-of-pocket spenders’ includes a disproportionate share of older women, beneficiaries living in long-term care facilities, those with Alzheimer’s disease and ESRD, and beneficiaries who were hospitalized.12   

Report: What Is The Medicare Part D Prescription Drug Benefit?

Since 2006, Medicare beneficiaries have had access to an outpatient prescription drug benefit (Part D) offered through private plans: either stand-alone prescription drug plans (PDPs) or Medicare Advantage prescription drug (MA-PD) plans.

In 2015, 1,001 stand-alone prescription drug plans (PDPs) are available nationwide, fewer than in any year since the program began in 2006. Medicare beneficiaries in each region have a choice of 30 stand-alone PDPs, on average, in 2015.

Medicare Part D plans are required to offer either the standard benefit that is defined in law or an alternative benefit design that is equal in value (“actuarially equivalent”); plans can also offer enhanced benefits.

The standard benefit in 2015 has a $320 deductible and 25 percent coinsurance up to an initial coverage limit of $2,960 in total drug costs, followed by a coverage gap (Figure 8). During the gap, enrollees are responsible for a larger share of their total drug costs than in the initial coverage period. Enrollees in plans with no additional gap coverage in 2015 pay 45 percent of the total cost of brands and 65 percent of the total cost of generics in the gap until they reach the catastrophic coverage limit. Medicare will phase in additional subsidies for brands and generic drugs, ultimately reducing the beneficiary coinsurance rate in the gap to 25 percent by 2020.

Figure 8: Standard Medicare Prescription Drug Benefit, 2015

After total out-of-pocket spending reaches $4,700 in 2015 (excluding premiums)—an amount equivalent to $7,062 in estimated total drug costs—enrollees pay 5 percent of the drug cost or a copayment ($2.65/generic drugs or $6.60/brand-name drugs for each prescription) for the rest of the year. The standard benefit amounts are set to change annually by the rate of change in per capita Part D spending.

In 2015, no PDPs offer the standard benefit. Most charge copayments (flat dollar amounts) instead of 25 percent coinsurance; 58 percent of plans charge a deductible (44 percent of plans charge the full $320 deductible amount, and 14 percent charge a partial deductible).13  The majority (74%) of PDPs offer no gap coverage in 2015 beyond what the ACA requires plans to offer. With all Part D enrollees now getting coverage for a share of their drug costs in the gap, the value of additional gap coverage offered by plans will become lower each year until 2020, when the gap is fully closed.

Part D plans are required to maintain a medical loss ratio (MLR) of at least 85 percent; that is, 85 percent of revenue must be used on patient care, rather than on administrative expenses or profit. Plans vary widely, however, in terms of formularies (the list of covered drugs), the placement of drugs on formulary tiers, cost-sharing requirements, and utilization management tools (such as prior authorization requirements).

Monthly Part D premiums and cost-sharing amounts vary across plans and regions, and have increased significantly on average since 2006.

In 2015, the average monthly Part D premium for PDP plans is $38.83 (weighted by 2014 enrollment). Actual monthly PDP premiums vary across plans and regions, ranging from a low of $12.60 for a plan available in New Mexico, to a high of $171.90 for a plan available in Florida. Average monthly PDP premiums, weighted by 2014 enrollment, vary widely in 2015 across regions, ranging from $27.91 per month for PDPs in the New Mexico region (one of only five regions with an average under $35) to $44.56 per month for PDPs in New Jersey and $43.84 in the Idaho/Utah region.

People with modest incomes and assets are eligible for additional assistance with Part D premiums and cost-sharing requirements.

Beneficiaries with limited income (less than 150 percent of the federal poverty level, or $17,655 for a single person; $23,895 for a married couple in 2015) and limited assets ($13,640/single person; $27,250/married couple in 2015) are eligible for the Low-Income Subsidy (LIS) program, or “extra help,” which helps pay for some or all of the Part D monthly premium and cost-sharing amounts. Around 12 million beneficiaries are currently receiving full or partial benefits under the LIS program, depending on their income and asset levels.

Beneficiaries who are dually eligible, QMBs, SLMBs, QIs, and SSI-onlys automatically qualify for the additional assistance, and Medicare automatically enrolls them into PDPs with premiums at or below the regional average (the Low-Income Subsidy benchmark) if they do not choose a plan on their own. Other beneficiaries are subject to both an income and asset test and need to apply for the Low-Income Subsidy through either the Social Security Administration or Medicaid. People determined eligible for the Low-Income Subsidy are assigned to a PDP if they do not enroll on their own.

Approximately 90 percent of all Medicare beneficiaries have “creditable” prescription drug coverage, while approximately 10 percent lack a known source of creditable drug coverage.

Of the 38 million beneficiaries enrolled in Part D plans, about 61 percent (23.2 million) are in PDPs; the others are enrolled in Medicare Advantage drug plans. These enrollment counts from September 2014 include 6.6 million Part D enrollees in employer-only plans. Another 2.6 million Medicare beneficiaries are estimated to be receiving prescription drug coverage from an employer or union plan in which the employer receives subsidies through the Medicare Retiree Drug Subsidy (RDS) program (equal to 28 percent of drug expenses between $310 and $6,350 per retiree in 2014) (Figure 9).14 
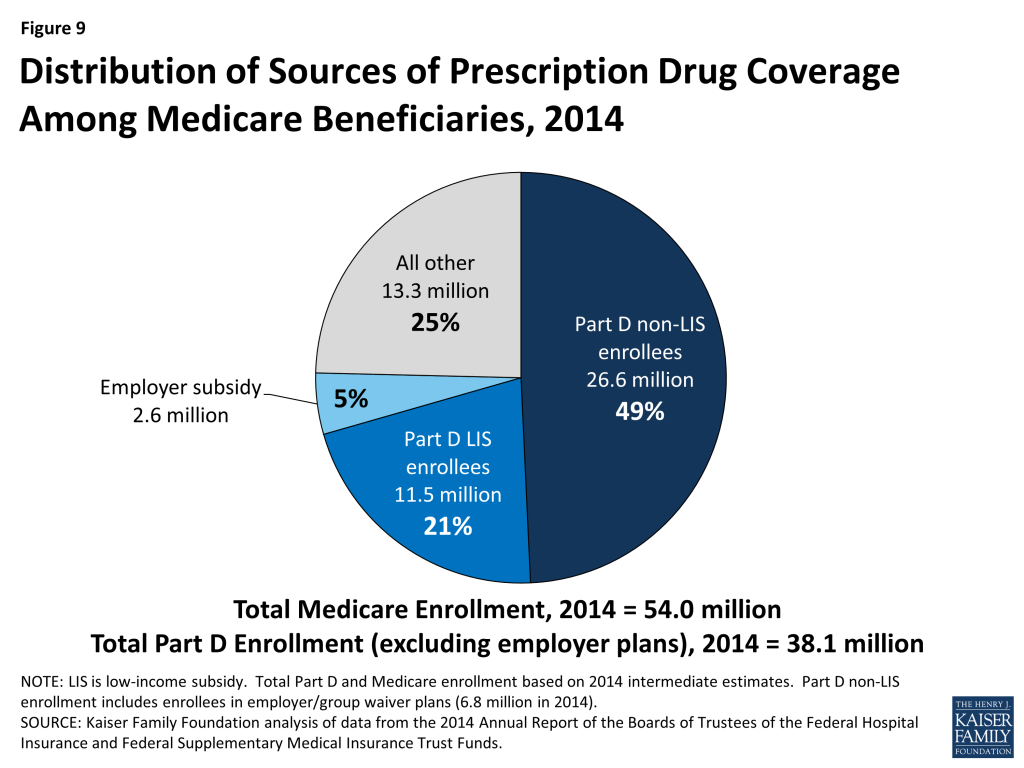
Figure 9: Distribution of Sources of Prescription Drug Coverage Among Medicare Beneficiaries, 2014 

The coverage gap, also known as the “doughnut hole,” is gradually closing by 2020 due to a provision of the ACA.

In 2015, Part D beneficiaries pay 45 percent of their brand-name drug costs, and 65 percent of their generic drug costs in the coverage gap. Medicare is gradually phasing in subsidies in the coverage gap for brand-name drugs and generic drugs, reducing the beneficiary coinsurance rate from 100 percent in 2010 to 25 percent in 2020. In addition, between 2014 and 2019, the out-of-pocket amount that qualifies an enrollee for catastrophic coverage will be reduced, further lowering out-of-pocket costs for those with relatively high prescription drug expenses. In 2020, the catastrophic coverage level will revert to what it would have been absent these reductions.

Medicare’s payments to Part D plans are determined through a competitive bidding process. Private plan sponsors bid each year to offer Part D coverage and are paid monthly capitation payments for each Medicare beneficiary who enrolls in their plan.

Medicare provides plans with a subsidy of 74.5 percent of the cost of standard coverage for all beneficiaries, which is based on annual bids submitted by plans for their expected benefit payments. Premium payments by beneficiaries cover the remaining 25.5 percent. In 2015, private plans are projected to receive average annual payments from Medicare of $548 per enrollee overall and $1,996 for Low-Income Subsidy enrollees; employers are expected to receive, on average, $604 for retirees in employer-subsidy plans.15  Plans also receive additional risk-adjusted payments for high-cost enrollees and reinsurance payments for a share of their enrollees’ costs above the catastrophic threshold. Part D plans’ potential losses or profits are limited by risk-sharing arrangements with the federal government (“risk corridors”).

Report: What Is Medicare Advantage?

Medicare Advantage, also known as Medicare Part C, is a program that allows beneficiaries to enroll in private health plans to receive Medicare-covered benefits.

Private plans, such as health maintenance organizations (HMOs), have been an option under Medicare since the 1970s. Medicare now contracts with other types of private plans, including local preferred provider organizations (PPOs), regional PPOs, private fee-for-service (PFFS) plans, and high deductible plans linked to medical savings accounts (MSAs). In 2015, Medicare beneficiaries are able to choose from an average of 18 Medicare Advantage plans offered in their area.16 

Medicare Advantage plans provide all benefits covered under traditional Medicare, and many plans offer additional benefits. The majority of plans also provide Part D prescription drug coverage.

Medicare Advantage plans receive payments from the federal government to provide all Medicare-covered benefits to enrollees. Plan sponsors are generally required to offer at least one plan with basic drug coverage. More than 8 in 10 Medicare Advantage plans (86 percent) offer drug coverage in 2015, and about four in ten plans (44 percent) offer some coverage beyond the standard benefit design in the coverage gap, mainly for generic drugs only. Plans are required to use any additional payments (known as rebates) to provide extra benefits to enrollees in the form of lower premiums, lower cost sharing, or benefits and services not covered by traditional Medicare. Examples of extra benefits include eyeglasses, hearing exams, preventive dental care, podiatry, chiropractic services, and gym memberships.

Medicare Advantage plan premiums and cost-sharing requirements vary widely, and have increased in recent years.

Medicare Advantage enrollees generally pay the monthly Part B premium and many also pay an additional premium directly to their plan. In 2015, the average premium for MA-PD plans (weighted by 2014 enrollment) is $41 per month, but varies by plan type and is lower for HMOs ($32) than for local PPOs ($70).17  Medicare Advantage plans are required to place a limit on beneficiaries’ out-of-pocket expenses for Medicare Part A and B covered services of $6,700 in 2015. In 2015, 9 percent of all Medicare Advantage plans have a limit of $3,400 or less, while almost half (48 percent) have a limit of more than $5,000.

Since 2004, the number of Medicare Advantage plan enrollees has increased.

After a decline in the number of Medicare Advantage enrollees between 1999 and 2003, the program has seen a rapid increase in enrollment in more recent years (Figure 10). The number of Medicare enrollees in private plans has almost tripled between 2003 and 2014, from 5.3 million to 15.7 million. In 2014, 64 percent of Medicare Advantage enrollees were in HMOs, 23 percent were in local PPOs, 2 percent were in PFFS plans, 8 percent were in regional PPOs, and the remainder were in other plan types.18 

Figure 10: Medicare Private Plan Enrollment, 1999-2014

Enrollment in Medicare Advantage plans varies widely across states.

In 2015, less than 5 percent of beneficiaries in 2 states (Alaska and Wyoming) were enrolled in Medicare Advantage plans, while more than 30 percent of beneficiaries in 18 states (Arizona, California, Colorado, Florida, Hawaii, Idaho, Michigan, Minnesota, Nevada, New Mexico, New York, Ohio, Oregon, Pennsylvania, Rhode Island, Tennessee, Utah, and Wisconsin) were in such plans (Figure 11).

Figure 11: Share of Medicare Beneficiaries Enrolled in Medicare Advantage Plans by State, 2014

The Affordable Care Act reduced Medicare payments to private plans and rewards plans with high-quality ratings.

Since 2006, Medicare has paid private plans under a bidding process: plans submit bids that estimate their costs per enrollee for services covered under Medicare Parts A and B. If plans bid higher than the county-level benchmark, enrollees pay the difference in the form of monthly premiums. If plans bid lower than the benchmark, the plan and Medicare split the difference between the bid and the benchmark; the plan’s share is known as a “rebate,” which must be used to provide supplemental benefits to enrollees. Medicare payments to plans are then adjusted based on enrollees’ risk profiles.

In the early-2000s, Medicare payment policy for plans changed from one that produced savings to one that focused more on expanding access to private plans and providing extra benefits to enrollees. Between 2006 and 2010, many advocates, policymakers, and researchers voiced concerns about rising “overpayments” to Medicare Advantage plans – estimated to be as much as 14 percent higher than what it would have cost to cover similar people in traditional Medicare.19  In response, the ACA reduce federal payments to Medicare Advantage plans over time, bringing them closer to the average costs of care under the traditional Medicare program. Under this payment system, plans in counties with relatively high traditional Medicare costs will be paid 95 percent of fee-for-service (FFS) costs per enrollee, while plans in counties with relatively low traditional Medicare costs will be paid 115 percent of FFS costs per enrollee. The ACA also provided bonus payments to Medicare Advantage plans based on the plan quality ratings, beginning in 2012. In addition, the ACA required Medicare Advantage plans to maintain a medical loss ratio no lower than 85 percent, restricting the share of premiums and other revenues that could be used for profits and administrative expenses.

Many questions remain to be answered about the quality of care and access to care in Medicare Advantage compared to traditional Medicare.

While many studies have examined the quality and access to care in Medicare Advantage plans, shortcomings in the available research make it hard to draw broad conclusions about the relative performance of the two coverage options.20  A systematic review found that the data used in studies that compare traditional Medicare and Medicare Advantage tend to be old and provide limited information about the experience since the ACA was passed. Despite these limitations, at least through 2009, Medicare HMOs tend to perform better than traditional Medicare in providing preventive services and using resources more conservatively. Yet, beneficiaries rate traditional Medicare more favorably than Medicare Advantage plans in terms of quality and access, particularly sicker beneficiaries. Performance also has been found to vary widely across Medicare Advantage plans even within the same type.

Report: What Types Of Supplemental Insurance Do Beneficiaries Have?

Many Medicare beneficiaries have some type of supplemental insurance coverage to help fill the gaps in Medicare’s benefit package and help with Medicare’s cost-sharing requirements.

Medicare provides protection against the costs of many health care services, but traditional Medicare has relatively high deductibles and cost-sharing requirements and places no limit on beneficiaries’ out-of-pocket spending. Moreover, traditional Medicare does not pay for some services vital to older people and those with disabilities, including long-term services and supports, dental services, eyeglasses, and hearing aids.

In light of Medicare’s benefit gaps and cost-sharing requirements, most beneficiaries in traditional Medicare have some form of supplemental coverage to help cover cost-sharing expenses required for Medicare-covered services (Figure 12). Other beneficiaries—30 percent in 2014—are covered under Medicare Advantage plans. However, 14 percent of all Medicare beneficiaries had no supplemental coverage in 2010, including a disproportionate share of beneficiaries under age 65 with disabilities, the near poor (those with incomes between $10,000 and $20,000), and black beneficiaries.21 

Figure 12: Distribution of Sources of Supplemental Coverage Among Medicare Beneficiaries, 2010

Employer and union-sponsored plans are a leading source of supplemental coverage, providing coverage to about three in ten Medicare beneficiaries.

Employer-sponsored retiree coverage is a primary source of supplemental coverage for Medicare beneficiaries, but access to retiree health benefits is on the decline. In 2014, 25 percent of large firms (those with 200 or more workers) offered retiree health benefits to active workers, a sharp decline from the two-thirds offering health benefits for retirees in 1988 (Figure 13). Employer plans often provide additional benefits, such as additional prescription drug coverage and limits on retirees’ out-of-pocket health expenses. For some Medicare beneficiaries who are working (or have working spouses), employer plans are their primary source of health insurance coverage, and Medicare is the secondary payer.

Figure 13: Percent of Large Firms (200+ Workers) Offering Retiree Health Benefits to Active Workers, 1988-2014

Medicare Advantage plans are another source of supplemental coverage for people on Medicare.

Enrollment in private Medicare Advantage health plans has increased in recent years, and 30 percent of Medicare beneficiaries were enrolled in Medicare Advantage plans in 2014 (up from one-fourth in 2010). Medicare beneficiaries who enroll in private Medicare Advantage plans often receive supplemental benefits that are not covered under traditional Medicare, such as vision and dental benefits. Medicare Advantage plans are required to have a limit on beneficiaries’ out-of-pocket expenses for Medicare Part A and Part B covered services of $6,700 in 2014. (See What is Medicare Advantage? for additional information.)

Medigap policies, also called Medicare Supplement Insurance, are sold by private insurance companies and help cover Medicare’s cost-sharing requirements and fill gaps in the benefit package.

Medigap policies assist beneficiaries with their coinsurance, copayments, and deductibles for Medicare-covered services. Medigap policies help to shield beneficiaries from sudden, out-of-pocket costs resulting from an unpredictable medical event, allow beneficiaries to more accurately budget their health care expenses, and reduce the paperwork burden associated with medical claims. In 2010, about one in five Medicare beneficiaries had an individually-purchased Medicare supplement insurance policy. Currently, there are 10 standard Medigap plans (labeled Plan A-N; Plans E, H, I, and J are no longer available for sale); all Medigap policies of the same letter provide the same benefits (see Appendix 2: Standard Medigap Plan Benefits).22  Premiums vary by plan type, insurer, age of the enrollee, and state of residence.

Medicaid, the federal-state program that provides health and long-term care coverage to low-income people, is a source of supplemental coverage for nearly 10 million Medicare beneficiaries with low incomes and modest assets. These beneficiaries are known as dual eligible beneficiaries because they are eligible for both Medicare and Medicaid.

Medicaid helps to make Medicare affordable for low-income beneficiaries, given gaps in the Medicare benefit package, premiums, deductibles, and other cost-sharing requirements (see Appendix 3: Common Medicaid Eligibility Pathways and Benefits for Medicare Beneficiaries, 2014). In total, about one in five Medicare beneficiaries also had Medicaid coverage in 2010. Most dual-eligible beneficiaries qualify for full Medicaid benefits, including long-term care. These dual eligible beneficiaries also get help with Medicare’s premiums and cost-sharing requirements, and receive subsidies that help pay for drug coverage under Medicare Part D plans. (See What is the role of Medicare for dual-eligible beneficiaries? for additional information.)

In addition, some low-income Medicare beneficiaries do not qualify for full Medicaid benefits, but receive help with Medicare premiums and/or some cost-sharing requirements through the Medicare Savings Programs (MSPs).23  Eligibility for this assistance is based on a beneficiary’s income and resources (the latter generally must be less than $7,160 for a single person and $10,750 for a married couple in 2014).24 

Report: What Is The Role Of Medicare For Dual-eligible Beneficiaries?

Medicare and Medicaid play important but different roles for people who are eligible for both programs.

For the 10 million low-income elderly and disabled people who are covered under both the Medicare and Medicaid programs (often referred to as “dual-eligible” beneficiaries), Medicare is their primary source of health insurance (Figure 14). Medicare covers most medical services, including inpatient and outpatient care, physician services, diagnostic and preventive care and, since 2006, outpatient prescription drugs under Part D plans. Medicare does not cover routine outpatient dental care or non-skilled long-term services and supports, such as in home care or extended home and personal care in the community. Medicaid, a need-based program funded jointly by the federal and state governments, supplements Medicare by providing help with Medicare’s premiums and cost-sharing requirements, and by helping to pay for the services that are not covered by Medicare. Together, these two programs help to shield very low-income Medicare beneficiaries from potentially unaffordable out-of-pocket medical and long-term care costs.
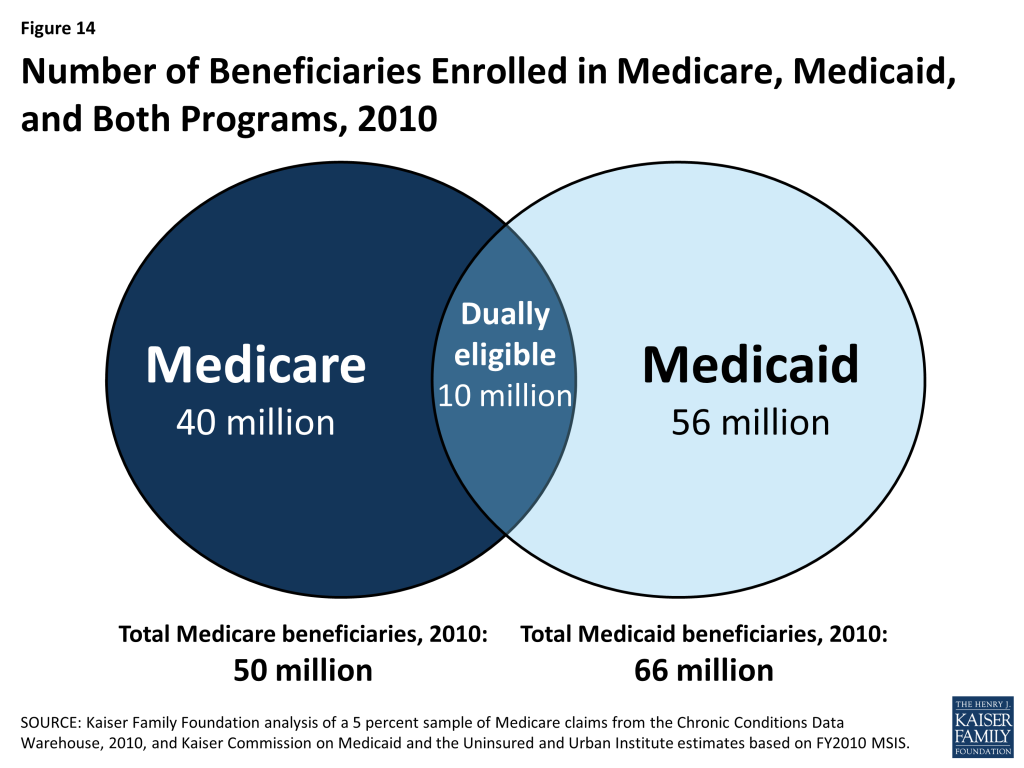
Figure 14: Number of Beneficiaries Enrolled in Medicare, Medicaid, and Both Programs, 2010

Dual-eligible beneficiaries are disproportionately counted among both Medicare and Medicaid’s high spenders. In 2010, dual-eligible beneficiaries comprised 20 percent of Medicare beneficiaries but 34 percent of Medicare spending, and, similarly, 14 percent of the Medicaid population but 34 percent of Medicaid spending (Figure 15).25 

Figure 15: Dual-Eligible Beneficiaries as a Share of Medicare and Medicaid Enrollment and Spending, 2010

Dual-eligible beneficiaries are poorer and have more medical needs than beneficiaries who are not dually eligible.

Dual-eligible Medicare beneficiaries are more likely than other Medicare beneficiaries to be frail, live with multiple chronic conditions, and have functional and cognitive impairments. Four in 10 dual-eligible beneficiaries (39%) are under age 65 and living with disabilities, compared to about one in 10 (11%) non-dual eligible beneficiaries. Nearly half (48%) of all dual-eligible beneficiaries rate their health status as fair or poor, more than double the share of non-dual eligible beneficiaries (22%). A larger share of dual-eligible beneficiaries than non-dual eligible beneficiaries have three or more chronic conditions (70% versus 63%); more than half (56%) of all dual-eligible beneficiaries have a cognitive or mental impairment, compared to one quarter (25%) of non-dual eligible beneficiaries; and more than half (55%) live with one or more functional impairments in activities of daily living (ADLs), compared to 29 percent of other Medicare beneficiaries. A substantially greater share of dual-eligible beneficiaries than other Medicare beneficiaries live in long-term care facility settings (17% versus 2%) (Figure 16).
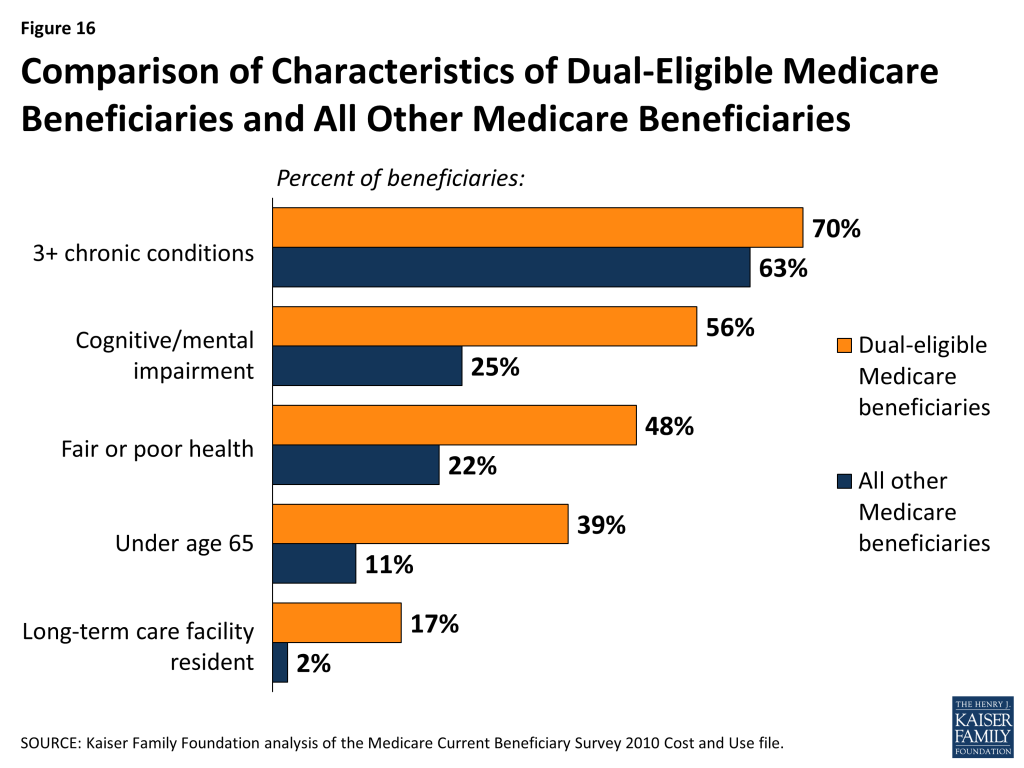
Figure 16: Comparison of Characteristics of Dual-Eligible Medicare Beneficiaries and All Other Medicare Beneficiaries

As a result of having greater medical needs, dual-eligible beneficiaries also use more Medicare services, particularly acute care services, than other Medicare beneficiaries. Among dual-eligible beneficiaries in traditional Medicare, one-quarter (25%) had at least one hospitalization in 2010 (versus 16% of other beneficiaries) and 11 percent had two or more hospitalizations (versus 6% of other beneficiaries). Dual-eligible beneficiaries were also more likely to use the emergency room in 2010: 44 percent had at least one emergency department visit versus 24 percent of other beneficiaries.

Many, but not all, dual-eligible beneficiaries are high-need, high-cost beneficiaries.

Some dual-eligible beneficiaries, often described as “high need” or “high cost,” have extensive need for acute, post-acute, and long-term care services and supports. One quarter (25%) had Medicare spending of $20,000 or more in 2010, and another 17 percent had Medicare spending between $10,000 and $20,000 (Figure 17). Other dual-eligible beneficiaries use relatively few services and incur relatively low Medicare spending, including more than one-quarter (26%) with Medicare spending below $2,500. Three-quarters (75%) of all dual-eligible beneficiaries had no inpatient hospitalization and more than half (56%) had no emergency department visit in 2010—two of the most expensive health care services on a per capita basis.

Figure 17: Distribution of Dual-Eligible Medicare Beneficiaries, by Amount of Medicare Spending, 2010

Dual-eligible beneficiaries who are under age 65 with disabilities have different needs and lower Medicare costs, on average, than those dual-eligible beneficiaries who are age 65 and older. Specifically, a smaller share of those under age 65 have 3 or more chronic conditions compared to those age 65 and older (61% versus 77%), but a larger share have cognitive or mental impairments (65% versus 51%).26  However, a similar share of dual-eligible beneficiaries in traditional Medicare who were under age 65 compared to those age 65 or older had an inpatient stay (21% versus 28%) and a similar share had one or more emergency department visits (47% versus 42%) in 2010.27 

Efforts are underway to improve the coordination of care for dual-eligible beneficiaries.

Policymakers at the federal and state levels are developing initiatives for dual-eligible beneficiaries to improve the coordination of their care and to reduce spending for both Medicare and Medicaid. Currently, the Centers for Medicare & Medicaid (CMS) has approved 13 federal-state demonstrations in 12 states (California, Colorado, Illinois, Massachusetts, Michigan, Minnesota, New York, Ohio, South Carolina, Virginia, and Washington) to improve care coordination and align financing for up to 1.5 million dual-eligible beneficiaries. Most states are pursuing capitated managed care options; two states (Colorado and Washington) are testing managed fee-for-service (FFS) models, and one state (Minnesota) will integrate administrative, but not financial, alignment. As of October 2014, 166,580 beneficiaries were enrolled in demonstrations in California, Illinois, Massachusetts, Ohio, and Virginia. CMS has also undertaken an initiative to prevent unnecessary hospitalizations of nursing home residents, two-thirds (67%) of whom are dual-eligible beneficiaries, by providing enhanced on-site services and supports.

Report: How Do Medicare Beneficiaries Fare With Respect To Access To Care?

The enactment of Medicare improved access to care for millions of elderly Americans.

Prior to the enactment of Medicare in 1965, less than half of all elderly people had insurance to help pay for hospital and other medical services.28  Many were unable to obtain health insurance either because they could not afford the premiums or because they were denied coverage based on their age or pre-existing health conditions. Medicare significantly improved access to care for elderly Americans and is now a vital source of financial and health security for nearly all Americans age 65 and older, as well as millions of people with permanent disabilities.

Beneficiaries generally enjoy broad access to physicians, hospitals, and other providers, and report relatively low rates of problems across a number of access measures. Yet, access problems are reported somewhat more frequently among certain subgroups, including younger adults with disabilities, low-income beneficiaries, and those in relatively poorer health.

  • Usual source of care: The vast majority of Medicare beneficiaries (96%) report that they have a usual source of care for when they are sick or seeking medical advice.29  This key indicator of access to care is particularly important for Medicare beneficiaries because they tend to have more chronic conditions and medical needs than others. In fact, Medicare beneficiaries are more likely than younger adults with private insurance to report having a usual source of care.30 
  • Access to care: A relatively small share of Medicare beneficiaries (6%) report that they had trouble accessing needed medical care (Figure 18). A somewhat larger share (11%) report delaying care due to cost burdens. Certain subgroups of Medicare beneficiaries report access problems more frequently than others, particularly those who often need more health care services. For instance, Medicare beneficiaries under age 65 (most of whom qualify for Medicare because of a long-term disability) report experiencing trouble accessing care at more than four times the rate of their older counterparts (17% versus 4%). The share of Medicare beneficiaries who report that they delayed care due to cost is three times as high for people with incomes below $20,000 compared to those with income of $40,000 or more. Also, Medicare beneficiaries who report that they are in fair or poor health are considerably more likely to encounter problems getting needed care or delaying care due to cost, relative to those reporting comparatively better health.
Figure 18: Measures of Access to Care Among Medicare Beneficiaries by Demographic Characteristics, 2012
  • Physician acceptance of new Medicare patients: The majority of office-based physicians (91%) report that they accept new Medicare patients into their practice (Figure 19).31  This acceptance rate for new Medicare patients is the same as the rate for new patients with private non-capitated insurance, such as a preferred provider organization, and is higher than for new patients with private capitated insurance (72%), Medicaid (71%), or no insurance (47%). Across the country, there is some variation in acceptance rates, but in each state, the majority of physicians accept new Medicare patients (Figure 20).
Figure 19: Percent of Office-Based Physicians Accepting New Patients with Medicare and Other Types of Insurance, 2012
Figure 20: Percent of Physicians Accepting New Medicare Patients by State, 2012
  • Finding a new physician: Medicare seniors are as likely to report problems finding a new physician as people aged 50 to 64 with private insurance.32  Nonetheless, for both groups of individuals, problems finding a new doctor are more frequently reported when looking for a primary care physician compared with a specialist. Among the small share of Medicare seniors (7%) who said that they looked for a new primary care physician in 2013, 28 percent reported a problem finding one—equating to about 2 percent of all seniors in Medicare.
  • High physician participation rates mean predictable expenses for most Medicare patients: The vast majority of physicians and other health professionals (96%) who bill Medicare are “participating providers,” which means that they agree to accept Medicare’s fee-schedule rates and will not “balance bill” their Medicare patients (charge higher fees for Medicare-covered services). As a result, most beneficiaries encounter predictable expenses when seeing their physician. A small share of physicians (less than 4%) who bill Medicare do not have these agreements and may balance bill up to a specified maximum for Medicare covered services.
  • A very small share of physicians “opt out” of Medicare: Less than 1 percent of physicians has elected to “opt out” of Medicare and instead contract privately with all of their Medicare patients. These opt-out providers may charge Medicare patients any fee they choose. Psychiatrists represent a disproportionate share (42%) of these physicians, which raises concerns about access to psychiatrists for beneficiaries who cannot afford high out-of-pocket costs.

Report: How Does Medicare Pay Providers In Traditional Medicare?

Medicare relies on a number of different approaches when calculating payments to each provider for services they deliver to beneficiaries in traditional Medicare.

Current payment systems in traditional Medicare have evolved over the last several decades, but have maintained a fee-for-service payment structure for most types of providers. In many cases, private insurers have modeled their payment systems on traditional Medicare, including those used for hospitals and physicians. Building on Medicare payment reforms included in the Affordable Care Act and new approaches being tested and launched by the CMS Innovation Center, the Secretary of Health and Human Services recently announced a set of explicit targets to be met in the coming years that would tie an increasing share of traditional Medicare payments to provider performance on quality and spending.33 

About two-thirds of Medicare’s benefit spending is on services delivered by providers in traditional Medicare.

Out of $597 billion in total benefit spending in 2014, Medicare paid $376 billion (63%) for benefits delivered by health care providers in traditional Medicare.34  These providers include hospitals (for both inpatient and outpatient services), physicians, skilled nursing facilities, home health agencies, inpatient rehabilitation facilities, hospice agencies, long-term care hospitals, outpatient dialysis facilities, ambulatory surgical centers, inpatient psychiatric facilities, durable medical equipment suppliers, ambulance providers, and laboratories. In general, Medicare pays each of these providers separately, using payment rates and systems that are specific to each type of provider. The remaining share of Medicare benefit payments (37%) went to private plans under Part C (the Medicare Advantage program; 26%) and Part D (the Medicare drug benefit; 11%). These private plans are responsible for paying providers or pharmacies on behalf of their Medicare enrollees. (See What is Medicare Advantage? and What is the Medicare Part D prescription drug benefit? for additional information on how Medicare pays Medicare Advantage and Part D plans.) The Budget Control Act of 2011 put in place a 2 percent across-the-board cut (known as “sequestration”) in Medicare payment to plans and providers beginning in 2013.

For most payment systems in traditional Medicare, Medicare determines a base rate for a specified unit of service, and then makes adjustments based on patients’ clinical severity, selected policies, and geographic market area differences.

Medicare uses prospective payment systems for most of its providers in traditional Medicare. In general, these systems require that Medicare pre-determine a base payment rate for a given unit of service (e.g., a hospital stay, an episode of care, a particular service). Then, based on certain variables, such as the provider’s geographic location and the complexity of the patient receiving the service, Medicare adjusts its payment for each unit of service provided (see Appendix 4: Medicare Payments to Providers). For most payment systems, Medicare updates payment rates annually to account for inflation adjustments. The main features of hospital, physician, outpatient, and skilled nursing facility payment systems (altogether accounting for almost three-quarters of spending in traditional Medicare) are described below:

  • Inpatient hospitals (acute care): Medicare pays hospitals per beneficiary discharge, using the Inpatient Prospective Payment System. The base rate for each discharge corresponds to one of over 700 different categories of diagnoses—called Diagnosis Related Groups (DRGs)—that are further adjusted for patient severity. DRGs that are likely to incur more intense levels of care and/or longer lengths of stay are assigned higher payments. Medicare’s payments to hospitals also account for a portion of hospitals’ capital and operating expenses. Some hospitals receive added payments, such as teaching hospitals and hospitals with higher shares of low-income beneficiaries. Recent Medicare policies also reduce payments to some hospitals, including hospitals that have relatively higher Medicare readmission rates following previous hospitalizations for certain conditions.
  • Physicians and other health professionals: Medicare reimburses physicians and other health professionals (e.g., nurse practitioners) based on a fee-schedule for over 7,000 services. Payment rates for these services are determined based on the relative, average costs of providing each to a Medicare patient, and then adjusted to account for other provider expenses, including malpractice insurance and office-based practice costs. This system, known as the Resource-Based Relative Value Update Scale (RBRVS), has been in place since 1992. Increases to Medicare’s payments include bonuses to those practicing in designated shortage areas. In general, health professionals who are not physicians but bill Medicare independently (e.g., nurse practitioners) receive a 15 percent reduction in payment.

Under current law, Medicare’s physician fee-schedule payments are subject to a formula, called the Sustainable Growth Rate (SGR) system, enacted in 1987 as a tool to control spending. For more than a decade this formula has called for cuts in physician payments, reaching as high as 24 percent. To prevent these cuts in physician payments from occurring, policymakers have overridden the SGR 17 times, as of 2014. Policymakers in both the House and the Senate agreed on a bipartisan proposal to repeal the SGR and replace it with a long-term approach for setting physician fees (H.R. 4015/S.2000), but disagreement on how the federal government would cover the cost of this proposal has so far prevented its enactment.

  • Hospital outpatient departments: Medicare pays hospitals for ambulatory services provided in outpatient departments, based on the classification of each service into more than 750 categories with similar expected costs. Final determination of Medicare payments for outpatient department services is complex and incorporates both individual service payments and payments “packaged” with other services, partial hospitalization payments, as well as numerous exceptions. Hospitals may receive additional payments for certain outpatient department services, such as specified drugs and devices; unusually costly (outlier) services; and adjustments for some rural hospitals and cancer hospitals.
  • Skilled Nursing Facilities (SNFs): SNFs are freestanding or hospital-based facilities that provide post-acute inpatient nursing or rehabilitation services. Medicare pays SNFs one of 66 pre-determined daily rates (categorized as Resource Utilization Groups (RUGs) for each patient, based on patients’ expected level of nursing and therapy needs. SNF payments incorporate operating and capital costs for providing care to Medicare patients, and an added daily payment from Medicare for care provided to beneficiaries with AIDS.

Report: What Is Medicare's Role In Delivery System Reform?

Delivery system reforms are new payment approaches for health care designed to change the way providers organize and deliver care.

The overarching goals of delivery system reforms in Medicare are to lower per capita spending while simultaneously fostering improved patient care. The Affordable Care Act directed CMS, primarily through a new Innovation Center, to launch a number of Medicare-wide programs and pilot projects to test new payment models across various types of providers. Evaluations of these programs are in their early stages and showing mixed results. While the overarching goals for most of these models are similar—improving care quality and lowering costs—the more specific aims within each model vary and represent a range of potential opportunities and challenges.

Current delivery system reform efforts differ from traditional Medicare’s status quo in terms of provider organization and payment approaches.

For the most part, traditional Medicare currently reimburses individual providers separately for the services they deliver to beneficiaries. This “siloed” payment approach carries inherent incentives for providers to furnish more care (or more expensive care) than may be necessary while also lacking incentives to coordinate patient care across health care settings. In contrast, new payment models that incorporate delivery system reforms typically include financial incentives that are designed to encourage collaboration and care coordination among different providers, reduce unnecessary service use, and reward providers for furnishing higher quality patient care.

The ACA included a number of delivery system reforms in Medicare.

In addition to large-scale programs implemented within Medicare, many new models are being tested as pilots and demonstration projects through the Innovation Center. Below are some examples of the types of delivery system reforms currently underway.

  • Accountable Care Organizations (ACOs): ACOs are groups of providers (such as physician practices and hospitals) that collectively accept responsibility for the overall care of Medicare beneficiaries assigned to them, and share in financial savings if they meet aggregate spending and quality targets. In general, the ACO concept is designed to reward providers financially for working together, sharing information, and coordinating care, especially for high-risk and high-cost chronically ill patients.Medicare has two main ACO programs: the Pioneer ACO program and the Medicare Shared Savings Program (MSSP) (Figure 21). Pioneer ACOs are generally larger entities that serve more beneficiaries and have experience with accepting financial risk for care, compared with ACOs in the MSSP. In addition to sharing in any savings, Pioneer ACOs are also required to repay Medicare a portion of any shared losses, if spending exceeds their target. In contrast, most ACOs in the MSSP do not currently take on this double-sided financial risk, but will be required to do so in future years.
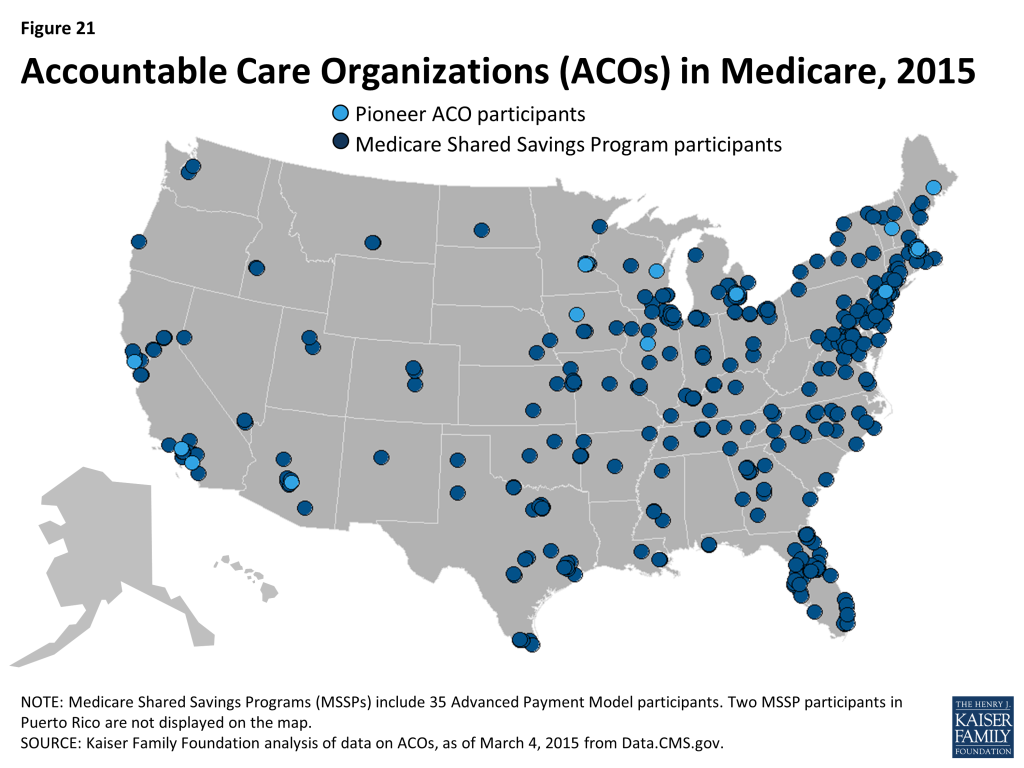
Figure 21: Accountable Care Organizations (ACOs) in Medicare, 2015
  • Bundled payments: Also known as episode-of-care payments, bundled payments reimburse for all services provided to a patient for a defined course of treatment, rather than paying each provider and site separately. For example, a single bundled payment for a patient undergoing knee replacement could encompass: the surgeon’s fee, the anesthesiologist charges, the hospital’s charges and those of hospital based physicians, post-surgical rehabilitation, such as physical therapy, and any medical complications that occur within a specified period of time in the episode of care. Under the bundled payment approach, the participating providers share in any savings that they generate or losses if total spending exceeds payment. The CMS Innovation center is currently managing a large-scale demonstration called the Bundled Payment for Care Improvement pilot, which is testing four bundled payment approaches for 48 different clinical conditions that started with a hospitalization.
  • Medical homes: The medical home, also called an “advanced primary care practice,” is a team-based approach to care that focuses on providing and coordinating all of a patient’s ongoing care from within a primary care medical practice. Medical home models commonly receive a monthly payment for each patient, which is intended to offset the costs of activities that occur outside of face-to-face physician visits (e.g., phone call or email follow-up with other specialists, electronic health record activities, after-hours access to clinical staff). The CMS Innovation Center is currently testing medical home models within Medicare through several programs, including the Comprehensive Primary Care Initiative, the Multi-Payer Advance Primary Care Practice program, and a medical home model within over 400 Federally Qualified Health Centers.
  • Hospital readmission reduction initiatives: Efforts to decrease the number of patient readmissions to hospitals carries benefits to both Medicare patients as well as the Medicare program. Reducing preventable readmissions could indicate that Medicare beneficiaries are receiving better care both during and after the initial hospitalization, and may translate to lower spending in Medicare. Incentives to decrease the number of preventable hospital readmissions among Medicare patients is part of many delivery system reforms in Medicare. For example, the Hospital Readmission Reduction Program financially penalizes hospitals that have relatively higher rates of Medicare readmissions following initial hospitalizations for certain conditions (heart attack, pneumonia, hip replacement). On the whole, CMS has reported declines in national readmission rates among Medicare beneficiaries, starting in 2012 and continuing into 2013 (Figure 22).
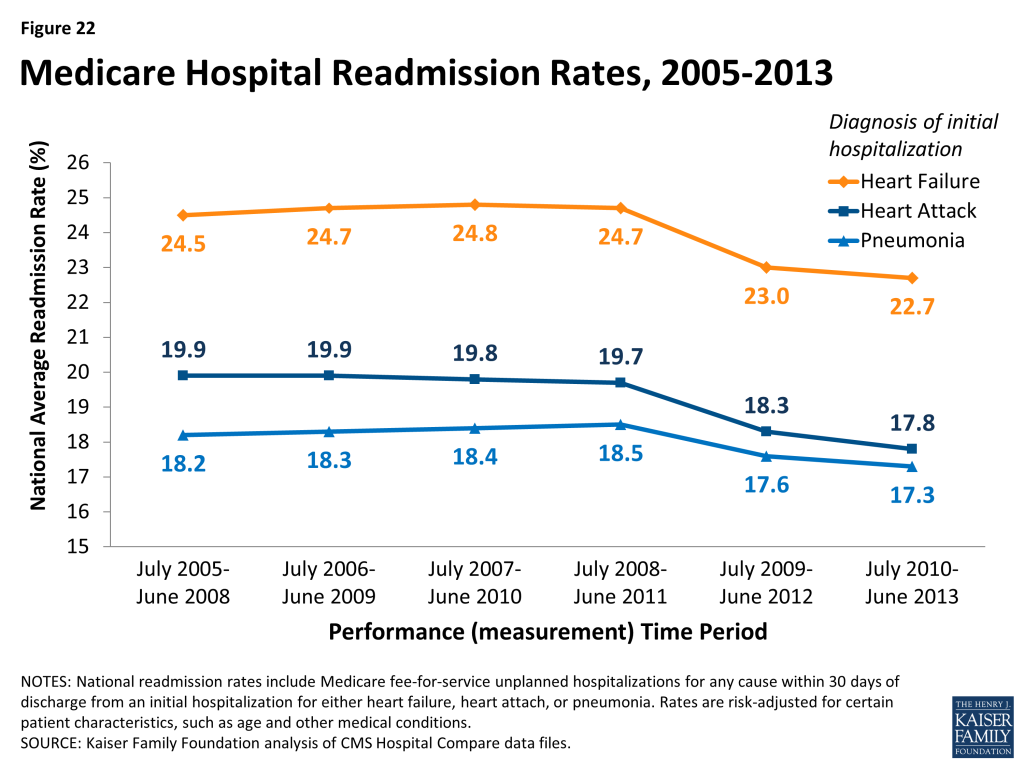
Figure 22: Medicare Hospital Readmission Rates, 2005-2013

Report: How Much Does Medicare Spend, And How Does Current Spending Compare To Past Trends And The Future Outlook?

Spending on Medicare accounted for 14 percent of total federal spending in 2014.

Federal spending for fiscal year 2014 totaled $3.5 trillion, with net spending on Medicare (that is, Medicare spending minus income from premiums and other offsetting receipts) comprising 14 percent of the total (Figure 23). Of the three main entitlement programs—Social Security, Medicare, and Medicaid—Medicare is second largest in terms of the share of federal spending on each program. Social Security is largest, at 24 percent of federal spending in 2014. Spending on Medicaid (along with spending on the Children’s Health Insurance Program and Exchange subsidies) represented 9 percent of federal spending in 2014.

Figure 23: Distribution of Federal Outlays, 2014

Medicare benefit payments totaled $597 billion in 2014.

Medicare benefit payments totaled $597 billion in 2014; roughly one-fourth was for hospital inpatient services, 12 percent for physician services, and 11 percent for the Part D drug benefit (Figure 24). Just over one-fourth of benefit spending (26%) was for Medicare Advantage private health plans covering all Part A and B benefits; in 2014, 30 percent of Medicare beneficiaries were enrolled in Medicare Advantage plans.

Figure 24: Distribution of Medicare Benefit Payments, 2014

Medicare spending is concentrated among a small share of beneficiaries.

A small share of Medicare beneficiaries accounts for a majority of Medicare spending. Ten percent of beneficiaries in traditional Medicare accounted for nearly 60 percent of Medicare spending in 2010 (Figure 25). At the other end of the spectrum, 30 percent of beneficiaries in traditional Medicare had total spending of less than $1,000, accounting for just 1 percent of total expenditures. Twelve percent of beneficiaries incurred no Medicare expenditures at all.

Figure 25: Distribution of Traditional Medicare Beneficiaries and Medicare Spending, 2010

Medicare spending accounted for one-fifth of the $2.5 trillion in personal health care expenditures in the U.S in 2013.

Medicare’s share of national personal health care expenditures varies by type of service, reflecting benefits covered and services used by the Medicare population. For example, in 2013, Medicare accounted for 43 percent of home health care spending and 26 percent of all hospital spending, but less than 1 percent of dental care spending (because traditional Medicare does not cover dental services) (Figure 26). Medicare accounted for 28 percent of total national prescription drug spending in 2013—a significant increase from 2 percent in 2005, the year before the Part D drug benefit went into effect.
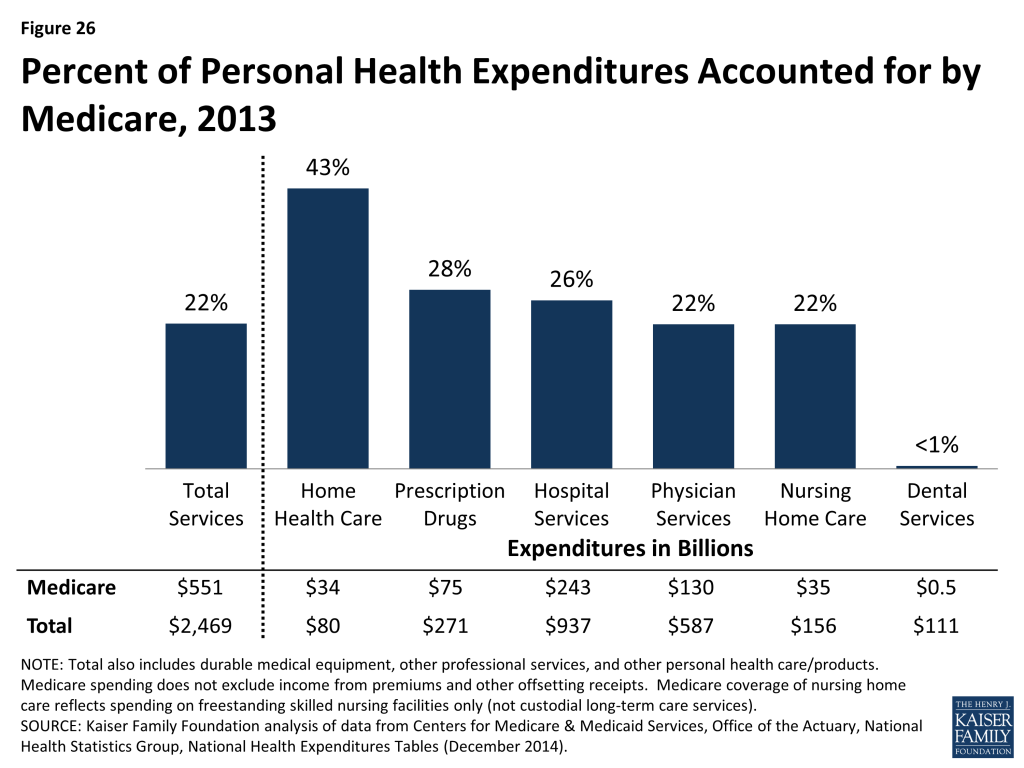
Figure 26: Percent of Personal Health Expenditures Accounted for by Medicare, 2013

Medicare spending is projected to nearly double from $527 billion in 2015 to $981 billion in 2025, according to CBO.

Looking ahead, net Medicare outlays (that is, Medicare spending minus income from premiums and other offsetting receipts) are projected to increase nearly two-fold from $527 billion in 2015 to $981 billion in 2025—an average annual growth rate of 6.4 percent in the aggregate—due to growth in the Medicare population and increases in health care costs (Figure 27). These estimates do not take into account additional spending that is likely to occur to avoid reductions in physician fees scheduled under current law. The growth in health spending, which affects all payers, is influenced by increasing volume and use of services, new technologies, and higher prices.
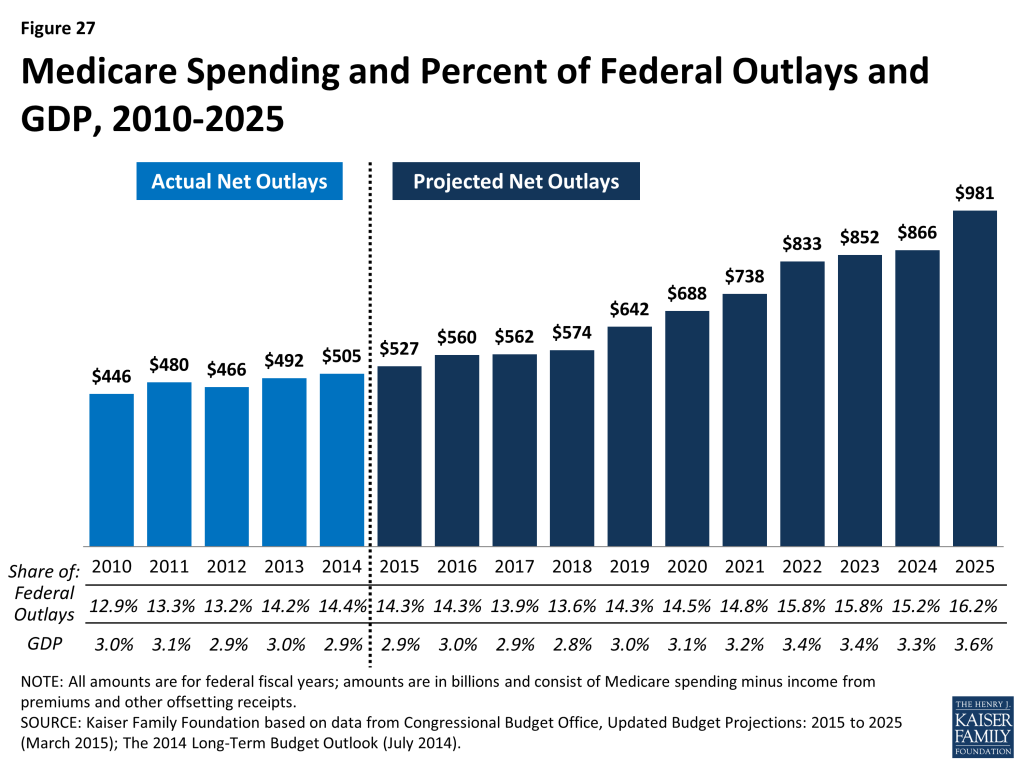
Figure 27: Medicare Spending and Percent of Federal Outlays and GDP, 2010-2025

Despite annual growth in outlays, net Medicare spending is projected to be a modestly larger share of the federal budget and the nation’s economy in the coming decade. Medicare’s share of the federal budget is projected to rise from 14.3 percent in 2015 to 16.2 percent in 2025, while Medicare spending as a share of GDP is projected to be 2.9 percent in 2015 and 3.6 percent in 2025.

In the short term, Medicare spending per person is expected to grow more slowly than it has in the past, more slowly compared to private health insurance spending growth, and in line with growth in the economy.

On a per capita basis, Medicare spending is projected to grow at a slower rate between 2014 and 2023 than it did between 2000 and 2013 (3.7 percent vs. 5.5 percent) (Figure 28). Medicare spending also is projected to grow more slowly than private health insurance spending on a per capita basis in the coming years (4.7 percent), and roughly in line with growth in GDP per capita (3.5 percent). The Congressional Budget Office has attributed Medicare’s slow per person growth rate in the short term to a larger share of younger beneficiaries as the baby boom generation ages onto Medicare; constraints on Medicare payment rates to plans, physicians, and other types of providers; and the overall slowdown in Medicare spending across different types of services, beneficiaries, and geographic areas.

Figure 28: Historical and Projected Average Annual Growth Rate in Medicare Per Capita Spending and Other Measures

Over the longer term, both CBO and the Medicare Actuaries expect Medicare spending to begin to rise more rapidly due to a number of factors.

Medicare’s long-term spending trends are driven by the aging of the population, an increase in service use associated with greater severity of illness, and faster growth in health care costs than growth in the economy on a per capita basis. According to CBO’s most recent long-term projections, net Medicare spending will grow from 3.0 percent of GDP in 2014 to 3.8 percent of GDP in 2030, 4.7 percent in 2040, and 5.5 percent in 2050.35  Through 2039, CBO projects that the aging of the population will account for a larger share of spending growth on the nation’s major health care programs (Medicare, Medicaid, and subsidies for ACA Marketplace coverage) than either “excess” health care spending growth or expansion of Medicaid and Marketplace subsidies.

Report: How Is Medicare Financed And What Are Medicare's Future Financing Challenges?

Funding for Medicare comes primarily from general revenues, payroll tax revenues, and premiums paid by beneficiaries. Other sources include taxes on Social Security benefits, payments from states, and interest.

Medicare is funded as follows (Figure 29):
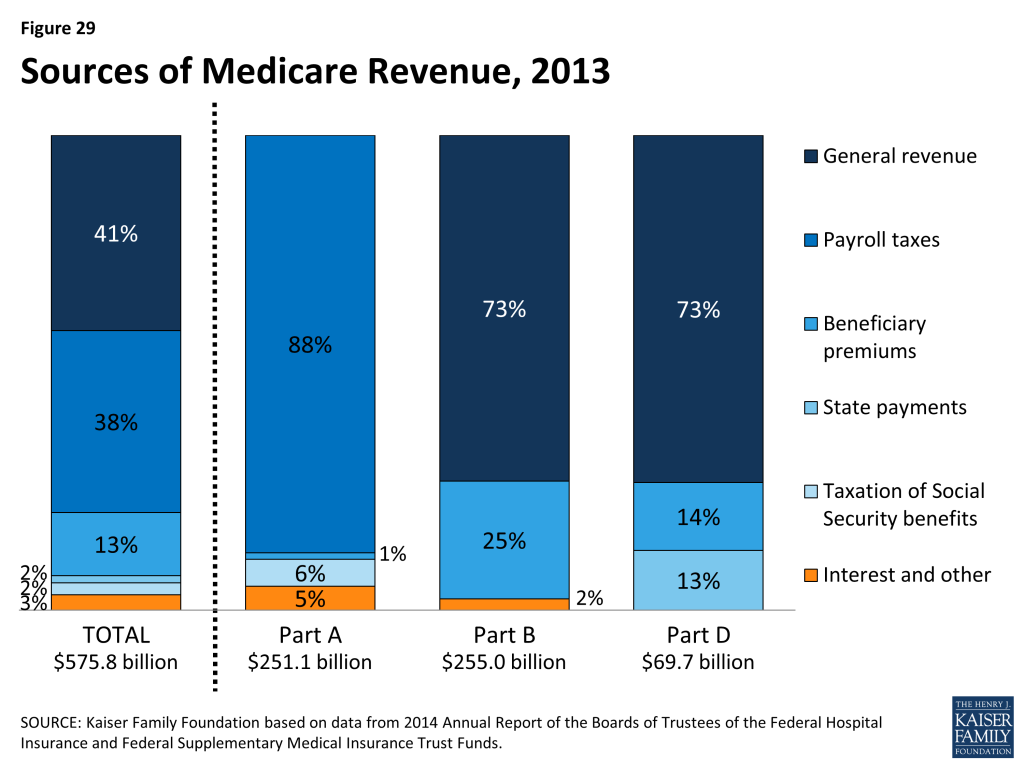
Figure 29: Sources of Medicare Revenue, 2013
  • Part A, the Hospital Insurance (HI) trust fund, is financed primarily through a dedicated payroll tax of 2.9 percent of earnings paid by employers and their employees (1.45 percent each). In 2013 (the most recent year for which actual data are available), these taxes accounted for 88 percent of the $251 billion in revenue to the Part A Trust Fund. In 2013, the Medicare HI payroll tax increased by 0.9 percentage points (from 1.45 percent to 2.35 percent) for higher-income taxpayers (more than $200,000/single person and $250,000/married couple), with additional revenues deposited into the HI trust fund.
  • Part B, the Supplementary Medical Insurance (SMI) trust fund, is financed through a combination of general revenues, premiums paid by beneficiaries, and interest and other sources. Premiums are automatically set to cover 25 percent of spending in the aggregate, while general revenues subsidize 73 percent. Higher-income beneficiaries pay a larger share of spending, ranging from 35 percent to 80 percent of Part B costs. Part B revenues totaled $255 billion in 2013.
  • Part D is financed through general revenues, beneficiary premiums, and state payments for dual-eligible beneficiaries (who received drug coverage under Medicaid prior to 2006). The monthly premium paid by enrollees is set to cover 25.5 percent of the cost of standard drug coverage, and Medicare subsidizes the remaining 74.5 percent. Similar to Part B, higher-income beneficiaries pay a larger share of the cost of standard drug coverage. In 2013, Part D revenue totaled $70 billion, 73 percent of which was from general revenues, 14 percent from premiums, and 13 percent from state payments.
  • The Medicare Advantage program (Part C) is not separately financed. Medicare Advantage plans such as HMOs and PPOs cover all Part A, Part B, and (typically) Part D benefits. Beneficiaries enrolled in Medicare Advantage plans typically pay monthly premiums for additional benefits covered by their plan in addition to the Part B premium. 

The solvency of the Medicare Hospital Insurance trust fund, out of which Part A benefits are paid, is a common way of measuring Medicare’s financial status. In 2014, the Medicare Trustees projected that the Part A trust fund will be depleted in 2030.

Medicare solvency is measured by the level of assets in the Part A trust fund. In years when annual income to the trust fund exceeds benefits spending, the asset level increases, and when annual spending exceeds income, the asset level decreases. When spending exceeds income and the assets are fully depleted, Medicare will not have sufficient funds to pay all Part A benefits.

Each year, the Medicare Trustees provide an estimate of the year when the asset level is projected to be fully depleted. Because of slower growth in Medicare spending in recent years, the solvency of the trust fund has been extended. In 2014, the Trustees projected that the Part A trust fund will be depleted in 2030, four years later than was projected in the 2013 report and six years later than was projected in the 2012 report (Figure 30).
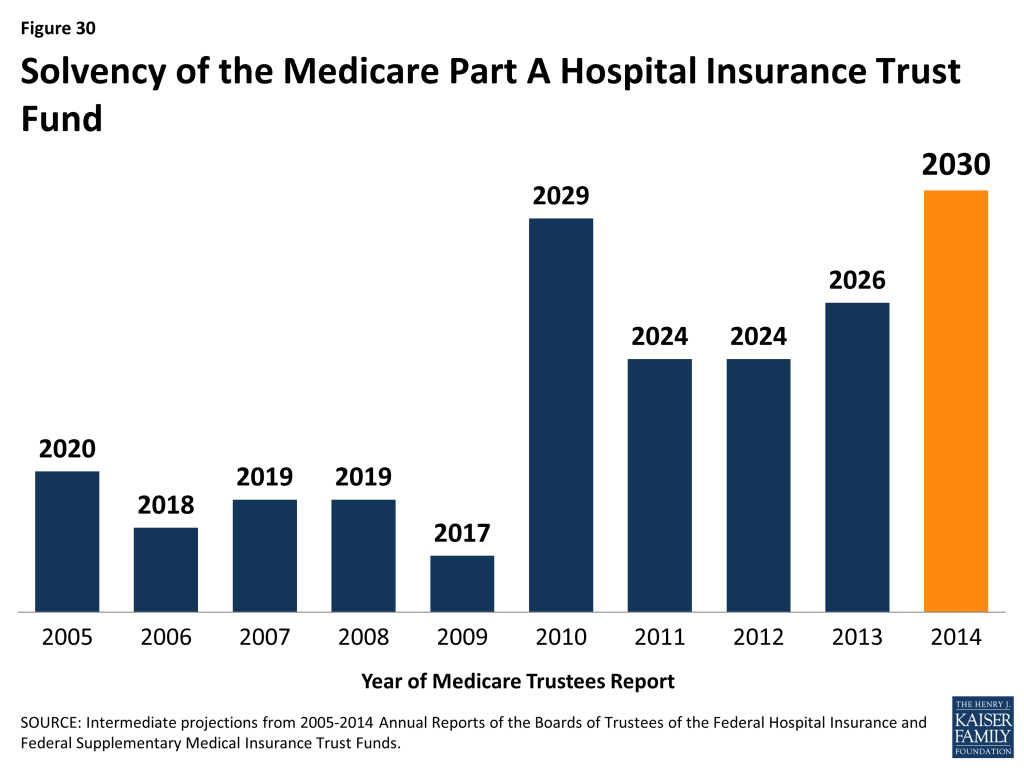
Figure 30: Solvency of the Medicare Part A Hospital Insurance Trust Fund

Part A Trust Fund solvency is affected by growth in the economy, which affects revenue from payroll tax contributions, health care spending trends, and demographic trends: an increasing number of beneficiaries, especially between 2010 and 2030 when the baby boom generation reaches Medicare eligibility age, and a declining ratio of workers per beneficiary making payroll tax contributions.

Part B and Part D do not have financing challenges similar to Part A, because both are funded by beneficiary premiums and general revenues that are set annually to match expected outlays. However, future increases in spending under Part B and Part D will require increases in general revenue funding and higher premiums paid by beneficiaries.

In addition to the solvency of the Part A trust fund, Medicare’s financial condition can be measured in other ways.

For example, the Independent Payment Advisory Board (IPAB), a 15-member board which was authorized by the ACA, is required to recommend Medicare spending reductions to Congress if projected spending growth exceeds specified target levels. IPAB is required to propose spending reductions if the 5-year average growth rate in Medicare per capita spending is projected to exceed the per capita target growth rate, based on inflation (2015-2019) or growth in the economy (2020 and beyond). The ACA required the IPAB process to begin in 2013, but CBO has estimated that spending reductions will not be triggered for several years because Medicare spending growth is expected to be below the target growth rate during the next decade. As yet, no members of the board have been nominated or appointed.

Looking to the future, Medicare is expected to face financing challenges due to the aging of the U.S. population, increasing health care costs, and the declining ratio of workers to beneficiaries.

While Medicare spending is on a slower upward trajectory now than in the past, Medicare is likely to be a focus of future policy discussions about reducing the federal budget debt, given the health care financing challenges posed by the aging of the population. From 2014 to 2050, the number of people on Medicare is projected to rise from 54 million to 93 million, while the ratio of workers per beneficiary is expected to decline from 3.2 to 2.3 (Figure 31).36 

Figure 31: Number of Medicare Beneficiaries and Number of Workers Per Beneficiary, 2000-2050


Appendices

Appendix 1: Medicare Benefits and Cost-Sharing Requirements, 2015

PART A
Deductible$1,260 per benefit period
Inpatient hospital
Days 1-60No coinsurance
Days 61-90$315 per day
Days 91-150$630 per day (for up to 60 lifetime reserve days)
After 150 DaysNot covered
Skilled nursing facility
Days 1-20No coinsurance
Days 21-100$157.50 per day
After 100 DaysNot covered
Home HealthNo coinsurance; no limit on number of visits
HospiceNo coinsurance for hospice care; copayment of up to $5 for outpatient drugs and 5% coinsurance for inpatient respite care
Inpatient psychiatric hospitalUp to 190 days in a lifetime
PART B
Deductible$147
PremiumStandard = $104.90/month; income-related monthly premiums:
$85,000-$107,000/single or $170,000-$214,000/couple: $146.90
$107,000-$160,000/single or $214,000-$320,000/couple: $209.80
$160,000-$214,000/single or $320,000-$428,000/couple: $272.70
Greater than $214,000/single or $428,000/couple: $335.70
Physician and other medical services
MD accepts assignment20% coinsurance
MD does not accept assignment20% coinsurance, plus up to 15% above the Medicare-approved fee
Outpatient hospital care20% coinsurance
Ambulatory surgical services20% coinsurance
Diagnostic tests, X-rays, and lab services20% coinsurance
Durable medical equipment20% coinsurance
Outpatient mental health services20% coinsurance
Physical, occupational, and speech therapy20% coinsurance; certain limits may apply
Clinical laboratory servicesNo coinsurance
Home health careNo coinsurance; no limit on number of visits
One-time “Welcome to Medicare” physical examNo coinsurance; covered within first 12 months of Part B enrollment; Part B deductible does not apply
Preventive services*
Annual “wellness exam”, flu shot, pneumococcal shot, Hepatitis B shot, colorectal and prostate cancer screening, pap smear, mammogram, cardiovascular screening, abdominal aortic aneurysm screening, bone mass measurement, diabetes screening/monitoring, glaucoma screening, smoking cessation, HIV screeningNo coinsurance for most preventive services if received from a provider who accepts assignment; however, a coinsurance may apply to an office visit when these services are received
PART D
Information below applies to the standard Part D benefit; benefits and cost-sharing requirements typically vary across plans. Beneficiaries receiving low-income subsidies pay reduced cost-sharing amounts.
Deductible$320
Premium$33.13 national average monthly premium (unweighted PDP and MA-PD plan average)
Income-related monthly premium amounts (plus plan premium):
$85,001-$107,000/single or $170,001-$214,000/couple: $12.30
$107,001-$160,000/single or $214,001-$320,000/couple: $31.80
$160,001-$214,000/single or $320,001-$480,000/couple: $51.30
Greater than $214,000/single or $480,000/couple: $70.80
Initial coverage (up to $2,960 in total drug costs)25% coinsurance
Coverage gap (between $2,960 and $7,062 in total drug costs)45% coinsurance for brand-name drugs, 65% coinsurance for generic drugs; phasing down to 25% in 2020
Catastrophic coverage (above $4,700 in out-of-pocket costs)Minimum of $2.65/generic, $6.60/brand; or 5% coinsurance
NOTES: *This table does not include all Medicare-covered benefits or preventive services; for a complete listing, see http://www.medicare.gov/Coverage/Home.asp and http://www.medicare.gov/Health/Overview.asp.
SOURCE: Centers for Medicare & Medicaid Services, www.medicare.gov, Medicare & You 2015.

Appendix 2: Standard Medigap Plan Benefits

Standard Medigap Plan Benefits
MEDIGAP POLICY
BENEFITSABCDE1FG2H1I1J1K3L3M4N4,5
Medicare Part A Coinsurance and all costs after hospital benefits are exhaustedxxxxxxxxxxxxxx
Medicare Part B Coinsurance or Copayment for other than preventive servicesxxxxxxxxxx50%75%xx
Blood (first 3 pints)xxxxxxxxxx50%75%xx
Hospice Coinsurance or Copayment6xxxxxx50%75%xx
Skilled Nursing Facility Coinsurancexxxxxxxx50%75%xx
Medicare Part A Deductiblexxxxxxxxx50%75%50%x
Medicare Part B Deductiblexxx
Medicare Part B Excess Chargesxxxx
Foreign Travel Emergency(up to plan limits)80%80%x80%80%xxx80%80%
Out-of-Pocket Limit$4,940$2,470
NOTE: Check marks indicate 100 percent benefit coverage. Shaded columns indicate Medigap policies no longer available for sale to new policyholders. Amount in table is the plan’s coinsurance amount for each covered benefit after beneficiary pays deductibles or cost-sharing amounts, where applicable. The Affordable Care Act eliminated cost-sharing for preventive benefits rated A or B by the U.S. Preventive Services Task Force, effective 2011.As of June 1, 2010, Medigap Plans E, H, I, and J are no longer available for purchase by new policyholders; existing policyholders may remain in these plans.Benefits for Plan G reflect the standard benefit after June 1, 2010 (Part B excess charges changed from 80% to 100%).Medigap Plans K and L became available for purchase in 2005.Medigap Plans M and N became available for purchase after June 1, 2010.Plan N pays 100% of the Part B coinsurance except up to $20 copayment for some office visits and up to $50 for emergency department visits that don’t result in an inpatient admission.Hospice Coinsurance or Copayment coverage added to Plans A, B, C, D, F, and G in June 2010.SOURCE: Centers for Medicare & Medicaid Services, 2015 Guide to Health Insurance.

Appendix 3: Common Medicaid Eligibility Pathways and Benefits for Medicare Beneficiaries, 2014

Common Medicaid Eligibility Pathways and Benefits for Medicare Beneficiaries, 2014
Pathway to EligibilityIncome Eligibility Level (individual/couple)Asset Limit(individual/couple)Covered Costs and Benefits
SSI Related (mandatory)<75% of poverty$2,000/$3,000(varies by state)  Medicaid benefits,Medicare Part A and Part B premiums and cost sharing
Poverty Level (optional)(SSI income eligibility)
Medically Needy (optional)≤100% of poverty
Special Income Rule for Nursing Home Residents (optional)Must spend income down to a specified level to qualify, varies by state
HCBS Waiver(optional)Institutionalized individuals with income <300% of the SSI level
Medicare Savings Programs
Qualified Medicare Beneficiary (QMB) (mandatory)<100% of poverty$7,160/$10,750Medicare Part A and Part B premiums and cost sharing
Specified Low-Income Medicare Beneficiary (SLMB) (mandatory)100%-120% of poverty$7,160/$10,750Medicare Part B premiums
Qualified Individual (QI) (mandatory)120%-135% of poverty$7,160/$10,750Medicare Part B premiums
Qualified Disabled and Working Individual (QDWI) (mandatory)<200% of poverty$4,000/$6,000Medicare Part A premiums
NOTE: SSI is Supplemental Security Income. HCBS is home and community based services.   Medicaid benefits for dual-eligible beneficiaries are jointly financed by the federal government and states.   Although certain categories of dual-eligible beneficiaries are eligible for Medicaid coverage of their Medicare cost sharing, the Balanced Budget Act of 1997 permitted states to pay less than the full amount of cost sharing if the Medicare rates minus the cost-sharing amount is higher than the Medicaid rate for these services. Resource limits for QMB, SLMB, QI, and LIS are adjusted annually for inflation. Not all income and resources (e.g., the value of a house, vehicle, etc.) are counted towards limits. In addition, states may use less restrictive methodologies for counting income and resources, enabling them to expand eligibility above limits shown here. Eleven 209(b) states may use more restrictive limits and methodologies when determining eligibility for full Medicaid benefits.

Appendix 4: Medicare Payments to Providers

Medicare Payments to Providers
Type of care/ Provider settingUnit and basis of paymentExamples of Payment Adjustments1Total Medicare Payments (2013)
Acute Inpatient Care
Acute care hospitalsPer case (discharge) based on 751 diagnosis categories(+) Added payments for: teaching hospitals; high share of low-income patients; outlier costs(-) Penalties based on: readmission rates; hospital acquired condition rates; no qualified EHR$136.8 billion
Inpatient psychiatric facilitiesPer day, based on one national average rate(+) Added payments for: teaching hospitals, facilities with EDs; electroconvulsive therapy treatment; selected patient characteristics(-) Daily rate declines as length of stay increases$4.4 billion
Critical access hospitalsPer service, based on hospital’s reported costsPayments are calculated from submitted accounting data to equal 101% of allowable Medicare costs$9 billion
Ambulatory Care
Physicians and other health professionalsPer service, based on 7,000+ items/services(+) Added payments for services provided in health professional shortage areas;(-) Reductions for non-physician practitioners; penalty for no qualified EHR; SGR formula calls for fee cuts$68.6 billion
Hospital outpatient departmentsPer service, based on ~750 categories(+) Added payments for: certain drugs and devices; outlier costs; some cancer and pediatric hospitals(-) Multiple procedures reduction in same encounter$37.2 billion
Ambulatory surgical centersPer surgical procedure, based on 300+ categories(+) Added payments for certain implantable devises(-) Multiple procedures reduction in same encounter$3.7 billion
Outpatient dialysisPer dialysis treatment, at 3x/week; bundled services, drugs, labs, equipment(+) Increased payments for: certain tests/drugs; patient and facility characteristics; outlier costs(-) Reductions for not achieving quality targets$10.7 billion
Post-Acute Care
Skilled nursing facilitiesPer day, based on 66 service needs categories(+) Added payments for patients with AIDS$28.4 billion
Home health carePer 60-day episode, based on 153 categories/ 5 subgroups(+) Added payment for: services in rural areas; outlier costs; use of non-routine medical supplies$18.4 billion
Inpatient rehabilitation facilitiesPer discharge, based on 385 diagnosis categories(+) Added payments for: services in rural areas; outlier costs; teaching facilities(-) Reduced payment for short stays$6.7 billion
Long-term care hospitalsPer discharge, based on ~1,000 diagnosis categories(+) Added payments for outlier costs(-) Reduced payment for: short stays; referrals from same hospital exceeding specified thresholds$5.5 billion
Other
HospicePer day, based on 4 categories of care(-) Agency-specific payment caps may limit payments$15.9 billion
Durable medical equipmentPer item, based on 5 categories of ~2,000 product groups OR competitive bids in some areas(+) Added payments for: customized items; drugs used with equipment; oxygen$7.1 billion
Outpatient laboratoriesPer test, based on ~1,250 fee- schedule codesPayment rates are not adjusted for geographic differences in input costs, unlike most other Medicare payment systems$9.7 billion
Ambulance servicesPer trip, based on 9 categories of transport(+) Additional payments for transports in rural areas(-) Reduction for non-emergent transport of ESRD patient for dialysis services$5.3 billion
Other2$5.6 billion
Total $373 billion
NOTE: EHR is electronic health record. SGR is sustainable growth rate. ED is emergency department. ESRD is end stage renal disease.Most payment systems are also adjusted for geographic and market area differences (e.g., wage index adjustments). Other applicable payment adjustments may not be listed due to lack of space in table.Other includes community mental health centers; federally qualified health centers (FQHCs); hospital outpatient department services not paid for using the outpatient prospective payment system; in-office labs; and rural health clinics.SOURCE: Kaiser Family Foundation analysis of 2014 Medicare Trustees Report and MedPAC Payment Basics (October 2014).

Endnotes

  1. Department of Health and Human Services, “Fiscal Year 2016 Budget in Brief: Strengthening Health and Opportunity for All Americans,” 2015. Available at http://www.hhs.gov/budget/fy2016/fy-2016-budget-in-brief.pdf. ↩︎
  2. Congressional Budget Office (CBO), Medicare Baseline, March 2015. Available at http://www.cbo.gov/sites/default/files/cbofiles/attachments/44205-2015-03-Medicare.pdf. ↩︎
  3. Congressional Budget Office (CBO), Medicare Baseline, March 2015. Available at http://www.cbo.gov/sites/default/files/cbofiles/attachments/44205-2015-03-Medicare.pdf. ↩︎
  4. Kaiser Family Foundation, Medicare Advantage Fact Sheet, May 2014. Available at: https://modern.kff.org/medicare/fact-sheet/medicare-advantage-fact-sheet/. ↩︎
  5. Congressional Budget Office (CBO), Medicare Baseline, March 2015. Available at http://www.cbo.gov/sites/default/files/cbofiles/attachments/44205-2015-03-Medicare.pdf. ↩︎
  6. Department of Health and Human Services, Fiscal Year 2016 Budget in Brief: Strengthening Health and Opportunity for All Americans, 2015. Available at http://www.hhs.gov/budget/fy2016/fy-2016-budget-in-brief.pdf. ↩︎
  7. Congressional Budget Office (CBO), Medicare Baseline, March 2015. Available at http://www.cbo.gov/sites/default/files/cbofiles/attachments/44205-2015-03-Medicare.pdf. ↩︎
  8. Kaiser Family Foundation analysis of the Medicare Current Beneficiary Survey 2010 Cost and Use file. ↩︎
  9. Jacobson G, Huang J, Neuman T, Smith K, Income and Assets of Medicare Beneficiaries, 2013–2030, Kaiser Family Foundation, January 2014. Available at https://modern.kff.org/medicare/issue-brief/income-and-assets-of-medicare-beneficiaries-2013-2030/. ↩︎
  10. U.S. Census Bureau poverty thresholds for 2013 by size of family and number of children under age 18. ↩︎
  11. Cubanski J, Swoope C, Damico A, Neuman T, How Much Is Enough? Out-of-Pocket Spending Among Medicare Beneficiaries: A Chartbook, Kaiser Family Foundation, Kaiser Family Foundation, July 2014. Available at https://modern.kff.org/health-costs/report/how-much-is-enough-out-of-pocket-spending-among-medicare-beneficiaries-a-chartbook/. ↩︎
  12. Cubanski J, Swoope C, Damico A, Neuman T, How Much Is Enough? Out-of-Pocket Spending Among Medicare Beneficiaries: A Chartbook, Kaiser Family Foundation, Kaiser Family Foundation, July 2014. Available at https://modern.kff.org/health-costs/report/how-much-is-enough-out-of-pocket-spending-among-medicare-beneficiaries-a-chartbook/ ↩︎
  13. Hoadley J, Cubanski J, Hargrave E, and Summer L, Medicare Part D: A First Look at Part D Plan Offerings in 2015, Kaiser Family Foundation, October 2014. Available at https://modern.kff.org/medicare/issue-brief/medicare-part-d-a-first-look-at-plan-offerings-in-2015/. ↩︎
  14. The ACA eliminated the tax deductibility of the 28 percent federal subsidy payment that employers who accept the retiree drug subsidy (RDS) had been able to claim prior to 2013. RDS claims are also not eligible for the 50 percent brand-name drug discount. ↩︎
  15. 2014 Annual Report of the Boards of Trustees of the Federal Hospital Insurance and Federal Supplementary Medical Insurance Trust Funds. ↩︎
  16. Jacobson G, Damico A, Neuman T, and Gold M, Medicare Advantage 2015 Data Spotlight: Overview of Plan Changes, Kaiser Family Foundation, December 2014. Available at https://modern.kff.org/medicare/issue-brief/medicare-advantage-2015-data-spotlight-overview-of-plan-changes/. ↩︎
  17. Jacobson G, Damico A, Neuman T, and Gold M, Medicare Advantage 2015 Data Spotlight: Overview of Plan Changes, Kaiser Family Foundation, December 2014. Available at https://modern.kff.org/medicare/issue-brief/medicare-advantage-2015-data-spotlight-overview-of-plan-changes/. ↩︎
  18. Gold M, Jacobson G, Damico A, and Neuman T, Medicare Advantage 2014 Spotlight: Enrollment Market Update, Kaiser Family Foundation, May 2014. Available at https://modern.kff.org/medicare/issue-brief/medicare-advantage-2014-spotlight-enrollment-market-update/. ↩︎
  19. Medicare Payment Advisory Commission, Report to the Congress: Medicare Payment Policy, March 2009. ↩︎
  20. Gold M and Casillas G. What Do We Know About Access and Quality in Medicare Advantage Versus The Traditional Medicare Program? Kaiser Family Foundation, November 2014. Available at https://modern.kff.org/medicare/report/what-do-we-know-about-health-care-access-and-quality-in-medicare-advantage-versus-the-traditional-medicare-program/. ↩︎
  21. Kaiser Family Foundation analysis of the Medicare Current Beneficiary Survey 2010 Cost and Use file. ↩︎
  22. Jacobson G, Huang J, Neuman T, Medigap Reform: Setting the Context for Understanding Recent Proposals, Kaiser Family Foundation, January 2014. Available at https://modern.kff.org/medicare/issue-brief/medigap-reform-setting-the-context/. ↩︎
  23. Young K, Garfield R, Musumeci M, Clemans-Cope L, and Lawton E, Medicaid’s Role for Dual Eligible Beneficiaries, Kaiser Family Foundation, August 2013. Available at: https://modern.kff.org/medicaid/issue-brief/medicaids-role-for-dual-eligible-beneficiaries/. ↩︎
  24. Centers for Medicare and Medicaid Services, Medicare Savings Program, Available at http://www.medicare.gov/your-medicare-costs/help-paying-costs/medicare-savings-program/medicare-savings-programs.html ↩︎
  25. Medicare Payment Advisory Commission and the Medicaid and CHIP Payment and Access Commission, Data Book: Beneficiaries Dually Eligible for Medicare and Medicaid, January 2015. Available at http://www.medpac.gov/documents/data-book/january-2015-medpac-and-macpac-data-book-beneficiaries-dually-eligible-for-medicare-and-medicaid.pdf?sfvrsn=2. ↩︎
  26. Kaiser Family Foundation analysis of the Medicare Current Beneficiary Survey 2010 Cost and Use file. ↩︎
  27. Kaiser Family Foundation analysis of a 5 percent sample of Medicare claims from the Chronic Conditions Data Warehouse, 2010. ↩︎
  28. Gornick M, et al, Twenty Years of Medicare and Medicaid: Covered Populations, Use of Benefits, and Program Expenditures, Health Care Financing Review, 1985 Annual Supplement. ↩︎
  29. Kaiser Family Foundation analysis of the Medicare Current Beneficiary Survey 2012 Access to Care file. ↩︎
  30. Medical Expenditure Panel Survey, 2010. “Usual Source of Health Care and Selected Population Characteristics, United States”; Schiller JS, Lucas JW, Peregoy JA. Summary health statistics for U.S. adults: National Health Interview Survey, 2011. National Center for Health Statistics, Vital Health Stat 10, No 256 (December 2012). ↩︎
  31. Kaiser Family Foundation analysis of 2012 National Ambulatory Medical Care Survey (NAMCS)-National Electronic Health Records Survey. ↩︎
  32. Medicare Payment Advisory Commission, Report to the Congress: Medicare Payment Policy, March 2014. ↩︎
  33. Centers for Medicare and Medicaid Services, “Fact sheets: Better Care, Smarter Spending, Healthier People: Improving Our Health Care Delivery System,” January 26, 2015. Available at: http://www.cms.gov/Newsroom/MediaReleaseDatabase/Fact-sheets/2015-Fact-sheets-items/2015-01-26.html. ↩︎
  34. Congressional Budget Office, Medicare Baseline, March 2015. Available at http://www.cbo.gov/sites/default/files/cbofiles/attachments/44205-2015-03-Medicare.pdf. ↩︎
  35. Congressional Budget Office, The 2014 Long-Term Budget Outlook, July 2014. Available at http://www.cbo.gov/publication/45471. ↩︎
  36. 2014 Annual Report of the Boards of Trustees of the Federal Hospital Insurance and Federal Supplementary Medical Insurance Trust Funds, July 2014. ↩︎
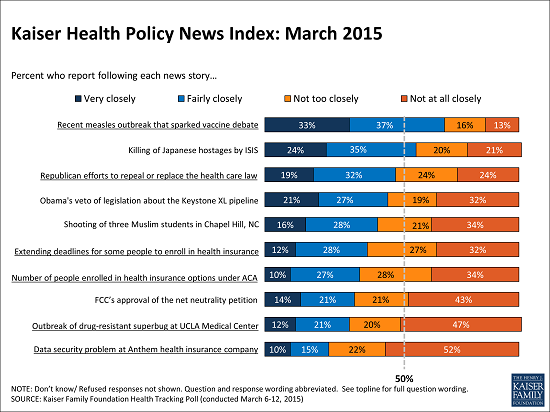
News Release

Measles Outbreak and Vaccination Debate Capture Public’s Attention

Published: Mar 20, 2015

Those Following Measles Story More Likely To Say They Worry About the DiseaseThe public paid more attention to news coverage of the measles outbreak in the U.S. and the resulting debate on whether vaccinations should be required for all kids than any other news story included in this month’s Kaiser Health Policy News Index.

A total of 70 percent of Americans say they closely followed the measles story, more than say the same about the killing of Japanese hostages by ISIS (59%), ongoing Republican efforts to repeal or replace the Affordable Care Act (51%), President Obama’s veto of the Keystone XL pipeline legislation (48%) and other stories.

3-20-15chartsforHNIalert-FINAL

When asked how worried they are about the measles outbreak, more than half (56%) say they are not too or not at all worried. A somewhat smaller share (43%) say they are very or somewhat worried. Those who report closely following the story are much more likely to say they are worried about measles as those who did not follow the story closely (49%, compared to 29%).

The Kaiser Health Policy News Index is designed to help journalists and policymakers understand which health policy-related news stories Americans are paying attention to, and what the public understands about health policy issues covered in the news. The questions are part of March Kaiser Health Tracking Poll, conducted from March 6-12 among a nationally representative random digit dial telephone sample of 1,503 adults. Interviews were conducted in English and Spanish by landline (600) and cell phone (903). The margin of sampling error is plus or minus 3 percentage points. For results based on subgroups, the margin of sampling error may be higher.

Poll Finding

Kaiser Health Policy News Index: March 2015

Authors: Jamie Firth, Bianca DiJulio, and Mollyann Brodie
Published: Mar 20, 2015

The Kaiser Health Policy News Index is designed to help journalists and policymakers understand which health policy-related news stories Americans are paying attention to, and what the public understands about health policy issues covered in the news.

The standout news story this month, health policy or otherwise, was the measles outbreak in the U.S. that sparked debate on whether vaccinations should be required for all kids, followed closely by 7 in 10 Americans (70 percent). About half of the public says they followed ongoing Republican efforts to repeal or replace the health care law (51 percent), and about 4 in 10 say they followed news about extending the deadlines for some people to enroll in health insurance marketplaces (40 percent) and coverage of how many people have enrolled in health insurance under the ACA (37 percent). Fewer Americans report closely following the outbreak of a drug-resistant superbug at UCLA Medical Center (33 percent), and a data security problem at Anthem health insurance company (25 percent). For comparison, 6 in 10 also report closely following non-health news stories, such as the killing of Japanese hostages by ISIS (59 percent). And, just under half of the public report following a handful of other national stories, such as President Obama’s veto of legislation that would have approved construction of the Keystone XL pipeline (48 percent), and the shooting of three Muslim students in Chapel Hill (44 percent), while about a third (35 percent) say they closely followed news about the FCC’s approval of the new neutrality petition in an effort to maintain an open internet. This month, many health policy stories appear to have captured the public’s attention to the same degree as coverage of other policy decisions and national events asked about in the survey.

Figure 1

A large majority (70 percent) report closely following the measles outbreak, and subsequently, nearly half (46 percent) correctly identified that the number of confirmed measles cases in the United States since the outbreak began late last year is closer to 100, as opposed to closer to 1,000 (31 percent), closer to 100,000 (8 percent) or closer to a million (2 percent) (the official estimate was about 140 when the survey went into the field, and has since risen to about 170). Those who say they followed the news coverage of this story closely are more likely to know the total number of confirmed measles cases than those who say they did not follow the story closely (50 percent compared to 35 percent, respectively).

When asked how worried they are about the measles outbreak, over half (56 percent) say they are not too or not at all worried while a slightly smaller share (43 percent) say they are very or somewhat worried. Those who report closely following the story are much more likely to say they are worried about measles as those who did not follow the story (49 percent compared to 29 percent).

Figure 2

Comparison of Consumer Protections in Three Health Insurance Markets: Medicare Advantage, Qualified Health Plans and Medicaid Managed Care Organizations

Authors: David Lipschutz, Andrea Callow, Karen Pollitz, MaryBeth Musumeci, and Gretchen Jacobson
Published: Mar 19, 2015

Executive Summary

Private plans that provide health coverage to people with Medicare or Medicaid, and in the new Marketplaces collectively serve more than 70 million Americans as of January 2015 – and the numbers are on the rise.1  These plans – Medicare Advantage plans, Qualified Health Plans (QHPs) and Medicaid Managed Care Organizations (MCOs) – operate under rules established by the federal government, many of which are designed to ensure that enrollees have access to coverage and the full scope of benefits and providers to which they are entitled. The rules for plans in each of the three markets differ, even though each market is overseen and regulated, to some degree, by the same federal agency, the Centers for Medicare and Medicaid Services (CMS). In addition, Medicaid MCOs and QHPs may be subject to more stringent consumer protection standards established and enforceable by the state in which they operate.   This report examines similarities and differences in federal consumer protection standards for Medicare Advantage plans, QHPs, and Medicaid MCOs. It focuses on rules established at the federal level, though some states have chosen to go above the federal minimums and impose additional requirements for QHPs and Medicaid MCOs.

These three insurance markets were created at different times, for different purposes and for different populations, and to some extent, the different set of rules in which plans operate reflect this diversity. While Medicare is a purely federal program, Medicaid is a joint federal/state program, and the Marketplaces are subject to minimum federal standards but can be administered by either states or the federal government, or the two in partnership. Medicare was designed to serve people ages 65 and older, and younger people with disabilities, without regard to income. Medicaid is a program for individuals with low-incomes and also is a major source of coverage for people with disabilities. The Marketplaces were created to provide insurance to non-elderly people without access to other sources of coverage. The consumer protections now in place for both Medicare Advantage and Medicaid MCOs have evolved over time, and in response to issues that have emerged over many years. The rules for Marketplace plans are relatively new, developed and implemented following enactment of the Affordable Care Act.

Our comparison of the federal consumer protections requirements for Medicare Advantage, QHPs and Medicaid MCOs finds some similarities across the three markets, as well as several notable differences that could have important implications for consumers (See Table ES-1). In some instances, the different set of rules across the three markets can be easily explained; for example, differences in allowable cost-sharing reflect different statutory requirements. However, the rationale for other differences – such as minimum coverage standards for prescription drugs, network adequacy standards, appeal rights when claims are denied, and the circumstances under which an enrollee may change plans mid-year – is less clear.

While beyond the scope of this paper, further work is needed to explore whether the different set of rules for plans that provide coverage to Medicare, Marketplace and Medicaid enrollees are in the best interest of consumers, plans, and the federal government. Many insurers operate in all three markets – so inconsistencies in applicable standards can add to administrative burden. In addition, individuals can and do move between these different sources of coverage, sometimes within the same calendar year, and may also be confused, if their rights and protections shift abruptly following an enrollment change. At the same time, it is important to not dilute existing consumer protections simply for the sake of achieving uniformity, particularly provisions needed to safeguard vulnerable populations. Analysis of the reasons for and impact of some of these differences could inform whether more consistency across programs would be helpful.

Table ES-1. Key Differences in Medicare Advantage, QHPs and Medicaid MCOs
Medicare Advantage (MA)QHPsMedicaid MCOs
Benefits:General approachMust cover same benefits as traditional Medicare; no flexibility to substitute benefits, but can add additional benefitsMust cover benefits in 10 essential benefit categories with the flexibility to define benefit categories and substitute one benefit for another within categoriesAll federally required Medicaid benefits and others at state option
Prescription drugsMust cover substantially all drugs in six protected classes (e.g., cancer medications); must also cover 2 or more drugs in each category; must have Pharmacy & Therapeutics (P&T) Committee for coverage decisionsNo protected classes; must cover the greater of the number of drugs in a class covered by the “benchmark plan”, or 1 drug in each class; like MA, must have P&T Committee, starting in 2017Must cover all FDA approved drugs with rebate agreements (if state opts to cover prescription drugs and deliver through MCOs)
Cost-sharing:General approachSome limits on variations in cost-sharing from traditional MedicareDiscretion to vary cost-sharing within metal categoriesLimited cost-sharing at state option; certain populations and services exempt
Out-of-pocket limit$6,700 for A & B plus a soft cap of $4,700 for Part D in 2015, with 5% coinsurance above cap$6,600 per individual for all benefits, including prescription drugs, in 2015, rising to $6,850 in 20165% of monthly or quarterly income
Balance billing and cost-sharing limitsOut-of-network providers cannot balance bill for services rendered and covered by the plan;Cost-sharing for covered services in HMOs generally limited to in-network amountsNo balance billing restrictions on non-contract providers, including emergency services;Cost-sharing limited to in-network amounts for emergency services provided out-of-networkBalance billing limits similar to MA;Cost-sharing limits similar to MA, with additional protections for individuals with incomes below 100%FPL
Cost-sharing and premium subsidies for low-income enrolleesSubject to an asset test, cost-sharing subsidies available for people with incomes up to 100% FPL for Part A & B benefits and up to 150% FPL for Part D benefits and premiums, and Part B premium subsidies for incomes up to 135%FPLNot subject to an asset test, cost-sharing reduced for individuals up to 250% FPL; premium subsidies available for people with incomes up to 400% FPLNot applicable
Enrollment: Enrollment defaultsDefault is traditional MedicareDefault is no coverageDepends on state rules; can mandate MCO enrollment
Rules to switch plans due to provider network changesLimited allowance to change plans if plan makes “significant” mid-year provider network terminationsNo allowance to change plans mid-year if plan terminates providers from networksSome allowances for mid-year changes in managed long-term services and supports providers
Minimum medical loss ratios (MLRs)At least 85% of revenues must be spent on healthcareAt least 80% of revenues must be spent on healthcareNo similar federal requirement
Provider network requirementsMust meet time and distance minimums. Plans not required to report claims from out-of-network providersNo time and distance minimums required. Plans required to report claims from out-of-network providers; rule not implementedSimilar to MA
Notices, appeals and grievances:Denial notice content and external appealsRequired to provide standardized notices created by CMSCMS selects the independent review organization (IRO) for external appealsNotice requirements mirror those for ERISA/self-insured group health plans (less robust)In 8 states, insurer can select IRO for external appeals; parallel to ERISA for self-insured group plansNotice requirements are detailedExternal appeals through state fair hearing system with impartial hearing officer
Consumer information and assistanceMedicare.gov (plan finder), 1-800 Medicare and State Health Insurance Assistance Programs (SHIPS). Funded by annual appropriationNavigator programs and Consumer Assistance Programs (CAP) to help with information, enrollment, subsidy applications, and appeals. Navigators funded by Marketplace operating revenue; CAPs funded by appropriation (last in 2010)May provide ombudsman and/or enrollment counselor at state option. If MCO enrollment is mandatory, the state must provide beneficiaries with a plan comparison chart

Introduction

Delivering health insurance benefits through private plans, particularly capitated arrangements, can make costs more predictable for state and federal governments and increase care coordination for consumers. However, delivery of insurance benefits through private plans also can add complexity for consumers because each plan and market is unique, and can provide different benefits, require different cost-sharing for services, and often include and exclude different providers. Navigating health coverage delivered through private plans can be especially challenging for consumers with low incomes, low health literacy, cognitive impairments, expensive or chronic health conditions, and those who have a history of being uninsured. Building consumer protections into private health plans can help to ensure enrollees have access to coverage and the full scope of benefits to which they are entitled.

This issue brief examines the similarities and differences in consumer protections in three major sources of insurance coverage delivered through private plans: Medicare Advantage (MA), Qualified Health Plans (QHPs) offered through the Marketplaces, and Medicaid Managed Care Organizations (MCOs). These three insurance markets, to different extents, are overseen by the same agency within the federal government, the Centers for Medicare and Medicaid Services (CMS). Although there are similarities in the consumer protections provided by these various coverage schemes, there are also notable differences, and these differences may raise issues for consumers – particularly those who are enrolled in plans in two or more of the markets either consecutively or concurrently. For example, someone may be covered by a QHP offered through a Marketplace followed by a Medicare Advantage plan when they turn 65. It is likewise possible that individuals with low incomes may be in a QHP, Medicaid MCO, and Medicare Advantage plan within the span of several years due to age, fluctuations in income and/or disability status.

The three insurance markets on which this paper focuses were created for different purposes and for different populations, and their varied structures reflect this diversity. Medicare is a purely federal program, Medicaid is a joint federal/state program, and the Marketplaces are federal, state, or federal-state partnership. Medicare was designed to serve older adults and younger people with disabilities, without regard to income. The Marketplaces were created to provide insurance to people without access to other sources of coverage, and include premium tax credits and subsidies to make coverage more affordable for those with limited incomes. In contrast, Medicaid is a program for individuals with low-incomes and cost-sharing is correspondingly more restricted than in the other two programs. For purposes of this report, Medicaid is included when the comparison to the other two programs is relevant; in other words, when the difference is more than a reflection of the different program target populations or program design intent.

This paper reviews the federal rules that apply for Medicare Advantage plans, QHPs and Medicaid MCOs but assesses neither the degree to which these rules are enforced by state and federal governments, nor whether states apply more stringent requirements than the federal minimum standards for QHPs and Medicaid MCOs. It should be noted that some states have chosen to go above that federal minimum and have imposed additional requirements through their state-based Marketplaces as some states have similarly imposed additional requirements beyond the federal minimum for Medicaid MCOs. Further, a number of consumer protections for QHPs are currently either unimplemented or partially implemented.

Background on Medicare Advantage, Qualified Health Plans and Medicaid Managed Care Organizations

Medicare Advantage (MA) is built on the foundation of Medicare, a federal entitlement health coverage program with federal rules and oversight for people ages 65 and older and younger people with disabilities. The Medicare Advantage program, also known as Medicare Part C, is a voluntary coverage option available to Medicare beneficiaries as an alternative to the traditional fee-for-service Medicare program. Medicare Advantage plans must cover all services that are covered by Medicare Parts A and B, (and, if applicable, the Part D prescription drug benefit). Medicare Advantage plans can, and are often required to, provide benefits in addition to those covered by traditional Medicare.

The Affordable Care Act (ACA) expands access to individual health insurance coverage largely through private, non-employer based, individual health insurance offered through Marketplaces. Under the ACA all private insurance, including Qualified Health Plans (QHPs) offered through the Marketplaces, is subject to minimum federal standards, with flexibility reserved for states to apply stronger standards to plans they regulate. Income-based premium and cost-sharing subsidies are available through the Marketplaces to ensure coverage is affordable for those who have no other source of affordable coverage. Health insurance plans must be certified as QHPs by a Marketplace before they may be sold to consumers on that Marketplace. To be certified, QHPs must provide coverage for certain essential health benefits (EHB), follow established limits on cost-sharing (like deductibles, copayments, and out-of-pocket maximum amounts), and meet other requirements. QHPs are divided into four different categories based on the percentage of health costs a plan is expected to pay (actuarial value): Bronze, Silver, Gold, and Platinum, all of which must cover EHB.2 

Medicaid is a major source of coverage for people with low incomes and people with disabilities. Medicaid is jointly financed by the federal government and the states and administered by the states with federal oversight.   Federal law requires states participating in Medicaid to cover certain mandatory benefits, and states can choose to cover additional optional benefits. States can choose to provide Medicaid benefits through managed care delivery systems, including managed fee-for-service (FFS) models, such as primary care case management, and capitated models, such as managed care organizations (MCOs), private health plans that contract with the state on a risk basis to deliver Medicaid services.3  An increasing number of Medicaid beneficiaries – now more than half – receive Medicaid coverage through managed care plans. (For more information about these three programs, see Appendix A.)

Report: Comparison Of Specific Areas Of Consumer Protections

In Medicare, Medicaid, and now, Marketplace QHPs, consumers are guaranteed a base level of access to coverage and financial protection. They are likewise afforded other procedural safeguards. Across the range of consumer protections, including those pertaining to eligibility, enrollment, renewability, benefits, cost-sharing and other categories of consumer protections, there are many similarities between Medicare Advantage plans, QHPs and Medicaid MCOs, as well as some notable differences in such protections, which are highlighted below. While the comparison chart in Appendix C contains a more detailed comparison across a broader range of consumer protections, highlights are summarized below.

Covered Benefits

Medicare Advantage (MA) plans QHPs Medicaid MCOs
Scope of Benefits MA plans must cover what traditional Medicare covers (set out in statute). Actual scope of benefits provided will vary slightly from plan to plan.QHPs must cover 10 essential health benefit (EHB) categories; details are determined based on the state benchmark. Generally, benefits are not defined in federal statute or regulation.Plans may substitute actuarially equivalent services within categories; as a result coverage for some services could vary significantly from plan to plan.State Medicaid programs must cover certain mandatory and any optional benefits that the state elects (set out in statute), and states opt whether to deliver those benefits through MCOs, as specified in the MCO’s contract with the state. If the enrollee is entitled to benefits not provided by the MCO, the beneficiary must be provided the service by either FFS Medicaid or another specialized Medicaid managed care plan.
Prescription DrugsDrugs required to be coveredSubstantially all drugs in 6 “protected” classes must be covered.None.All FDA approved drugs with rebate agreements.*
Other coverage rulesMA plans must follow Part D rules that require coverage of at least two drugs in each US pharmacopeia category or class. Must establish Pharmacy & Therapeutics (P&T) committees to make drug coverage decisions based on scientific evidence.QHPs must cover at least one drug per US pharmacopeia category or class OR the same number of drugs in each category and class as the state benchmark, whichever is greater.Starting in 2017, QHPs must establish Pharmacy & Therapeutics (P&T) committees (similar to those required for Part D plans) to make drug coverage decisions based on scientific evidence.Not applicable.
Utilization management restrictionsUtilization management allowed, but limited with respect to 6 “protected” classes of drugs.Utilization management allowed.Utilization management allowed.
* Note: This statement is true for all states that elect to cover prescription drugs, which all presently do, and if the state opts to provide prescription drugs through managed care.Source: Authors’ analysis, 2015.

Medicare Advantage plans, QHPs and Medicaid MCOs are all required to provide a certain core set of benefits. All three markets require plans to cover a range of similar services, and have similar exclusions from coverage, but state Medicaid programs generally provide greater coverage of long-term services and supports than Medicare Advantage plans or QHPs.4  Medicare Advantage plans must provide all services covered under Parts A and B of Medicare except for hospice services (and in certain circumstances, must provide Part D prescription drug coverage). The Medicare Advantage plan benefit package is based on traditional Medicare Parts A, B and D (if applicable) which can have limitations in scope and duration of coverage in certain care settings (for example, Medicare limits coverage in a skilled nursing facility to up to 100 days in a benefit period).   Medicare Advantage plans do, however, have some flexibility to loosen, but not tighten, benefit restrictions relative to traditional Medicare’s structure (e.g., Medicare Advantage plans can choose to waive coverage limits that apply under traditional Medicare; for example, MA plans can waive the 3-day prior hospital stay requirement for skilled nursing facility coverage, or extend such coverage beyond 100 days per benefit period).

QHPs are required to cover 10 categories of essential health benefits (EHBs) enumerated in statute. Detail defining EHBs is based on a benchmark plan. The default state benchmark package is based on the most popular small group plan, though states can designate other benchmark options. Federal regulation provides limited detail defining benefits within categories, and states may provide more detailed regulation. Otherwise, insurers have flexibility to determine which EHB category applies to specific services covered under the benchmark plan; further, absent state limitations, insurers then have flexibility to substitute actuarially equivalent services within EHB categories. Under federal rules, insurers are not required to report to the Marketplace or to consumers when they adopt such substitutions.   As a result, coverage for some services under QHPs could vary significantly plan to plan. Examples of variations in current QHP offerings include limits on the number of home health visits, imaging services, speech therapy and organ transplantation. QHPs are also subject to a ‘nondiscrimination’ standard; benefit design and cost-sharing design cannot discriminate based on health status and other factors. To date, regulations to define the nondiscrimination standard in further detail have not been issued. For the 2016 plan year, CMS will require QHP insurers to attest that their plan design complies with the nondiscrimination standard. CMS guidance indicates it will monitor complaints data for 2016 QHP plans. Other oversight seems to be evolving; for example, CMS guidance indicates it will “consider” outlier analysis of QHP cost-sharing designs, such as whether drug treatments for given health conditions are assigned to the highest cost-sharing tier. No other compliance standards have been issued to date.

Unlike Medicare Advantage plans and Medicaid MCOs, the actual services in the ten EHB categories that QHPs must cover are not enumerated in statute or regulation. The statute requires the Secretary of Health and Human Services (HHS) to periodically review EHB standards, and HHS has indicated that it will monitor the benchmark/EHB system and may revisit the coverage requirements in 2016.

Federal law requires states participating in Medicaid to cover certain mandatory benefits, and states can choose to cover additional optional benefits. The underlying Medicaid program provides the primary public coverage of long-term services and supports, while only limited coverage for such benefits is provided through Medicare or Marketplace QHPs. States choose whether to deliver long-term care benefits through Medicaid MCOs.

Medicaid has the most comprehensive drug coverage requirements of plans in the three markets, and requires coverage of all FDA approved drugs (provided that the state opts to cover prescription drugs and to deliver that benefit through MCOs, which all currently do). Medicare drug plans are required to cover at least two drugs in each pharmacopeia class while QHPs need only cover one. Medicare plans are also required to provide enrollees with substantially all drugs in six protected classes of drugs while QHPs are not. Plans in all three markets may employ utilization management tools.   Medicare Advantage plans that offer drug coverage can develop their own formularies as long as protected classes and non-discrimination requirements are honored. Protected classes include cancer medications, anti-psychotics, anti-convulsants, anti-depressants, immunosuppressants, and anti-retroviral drugs. There are no similarly protected classes of drugs within QHPs but, similar to Medicare Advantage rules, benefit and cost-sharing design cannot be discriminatory. Medicare Advantage plans must also cover at least two drugs in each US pharmacopeia class, whereas QHPs must cover at least one drug per US pharmacopeia class or the same number of drugs in each class as the benchmark, whichever is greater. The protected classes are not relevant for Medicaid since Medicaid must cover all FDA approved prescription drugs for which the manufacturer has a rebate agreement, which in practice means virtually all FDA approved drugs are covered, although states can use utilization management tools, such as preferred drug lists. Starting in 2017, QHPs will be required to establish pharmacy and therapeutics (P&T) committees, similar to those required for Part D plans, to make drug coverage decisions based on scientific evidence. P&T committees will be required to review newly approved drugs and new uses for existing drugs within 90 days of market release and make coverage decisions within 180 days of market release.

Like Medicare Advantage plans, QHPs may use tiering and other utilization management tools. As noted above, benefit and cost-sharing design cannot be applied in a discriminatory manner for QHPs, though regulatory standards have not yet been issued. Recently a complaint to the HHS Office of Civil Rights was filed by patient advocates alleging that the assignment of HIV drugs to higher cost-sharing tiers under certain QHPs violates the nondiscrimination standard.5  Unlike Medicare Advantage plans, though, QHPs are not required to limit the application of utilization management to any classes of “protected” drugs for which plans must cover all or substantially all drugs in such classes.

For Medicaid, states elect whether to deliver prescription drugs through managed care. Medicaid programs may use utilization management and clinical effectiveness guidelines in drug coverage decisions. States may use a preferred drug list and impose quantity limits although there must be a prior authorization process for exceptions. This is a feature of state Medicaid programs rather than individual Medicaid MCOs just as protected classes in Medicare Advantage plans are a feature of the Medicare program rather than Medicare Advantage.

Cost-Sharing

Medicare Advantage (MA) plansQHPsMedicaid MCOs
Cost-Sharing in Benefit DesignMust be generally actuarially equivalent to benefits covered under traditional Medicare, including equivalence in certain specific service categories, such as inpatient and skilled nursing facility care, which limits a plan’s ability to vary deductibles, co-pays and co-insurance.QHPs must meet actuarial value based on metal level (60%, 70%, 80%, 90%) applied over the entire benefit package. Within and across metal tiers, substantial variation in structure of cost-sharing is observed.Not applicable; see “out-of-pocket” maximum below.
Out-of-Pocket MaximumMaximum out-of-pocket limit (MOOP) for medical services (Part A and Part B) is $6,700 for individual enrollees in 2015, with a separate Part D catastrophic coverage maximum of $4,700 out-of-pocket in 2015, after which beneficiaries pay 5% coinsurance, making this a soft rather than “hard cap” with respect to prescription drug costs covered by MA-PDs. Because of the separate caps, total out-of-pocket costs (for A, B and D) could be up to $11,400 beyond which enrollees may still have prescription drug costs.Maximum out-of-pocket limit of $6,600 for individuals and $13,200 for a family in 2015, including cost-sharing for medical services and prescription drugs. For 2016, the out-of-pocket limit is $6,850 for individuals and $13,700 for a family.Medicaid has strict limits on out-of-pocket cost-sharing set out in statute. In general, out-of-pocket costs may not exceed 5% of monthly or quarterly income.
Balance BillingEnrollees are protected from balance billing by non-contract providers and are limited to in-plan cost-sharing amounts for services that are ultimately covered by the plan, including out-of-network emergency services.Enrollees may pay in-network cost-sharing rates for out-of-network emergency services, but no balance billing protections are required for any out-of-network care in QHPs, including for emergency services.Comprehensive cost-sharing protections for enrollees, including billing protections that prevent a participating provider from refusing to provide a service due to non-payment of cost-sharing by beneficiaries with incomes at or below 100% FPL.
Low-Income Assistance Part B premium assistance available through traditional Medicare for individuals with income up to 135% FPL; asset test applies (those at or below 100% FPL are eligible for additional Part A and B cost-sharing assistance). For Part D expenses, individuals with incomes below 150% FPL and limited assets are eligible for Part D premium and cost-sharing assistance.Enrollees with incomes between 100% and 400% FPL eligible for sliding scale premium tax credits. Enrollees with incomes from 100-250% FPL are also eligible to receive cost-sharing subsides. No asset tests apply.In states that have expanded Medicaid under the ACA, adults with income up to 138% FPL eligible for Medicaid. No asset test applies.
Source: Authors’ analysis, 2015.

Cost-sharing charged by Medicare Advantage plans is bound by actuarial equivalence with traditional Medicare – in other words, Medicare Advantage plans may impose cost-sharing that is different from that under Parts A and B, as long as total Medicare Advantage cost-sharing for Part A and B services does not exceed cost-sharing for those services in traditional Medicare.   Medicare Advantage plans must also apply actuarial equivalence to certain service categories; for example, in 2015 Medicare Advantage plans must apply actuarial equivalence to inpatient care, skilled nursing facility, home health, durable medical equipment and Part B drugs. In addition, plans’ cost-sharing for some services cannot exceed cost-sharing under Parts A and B: renal dialysis, chemotherapy and skilled nursing facility care.

QHPs must conform to actuarial value (AV) based upon the plan’s “metal level” but QHPs generally have significant leeway in how they structure deductibles and other cost-sharing (except in a few states, like California and New York, which require standardized cost-sharing designs). This leads to significant variation in cost-sharing across QHPs.   For example, for silver level QHPs in the federal Marketplace in 2015, just over half apply a comprehensive deductible for all services while 45 percent of silver plans have separate medical and drug deductibles. Among plans with separate deductibles, the average medical deductible is about $3,500, though some plans have medical deductibles as low as $0 or as high as $5,000.6 

Medicare Advantage plans and Medicaid MCOs limit enrollees’ financial liability for out-of-network balancing billing, while QHPs are not required to include such protections. QHP cost-sharing protections are generally only applicable for in-network services. While QHPs are required to charge in-network cost-sharing for out-of-network emergency services, no balance billing protections are required for any out-of-network care in QHPs, including for emergency services. This means a provider may collect above and beyond the out-of-network cost-sharing amounts from enrollees if they so choose. By contrast, Medicare Advantage plans and Medicaid MCOs protect enrollees against balance billing by providers for emergency services used outside of the provider network.7   In general, a Medicare Advantage enrollee is protected from balance billing by non-contract providers and is limited to in-plan cost-sharing amounts for services that are covered by the plan. QHPs do not have comparable protections. Medicaid, including services offered through MCOs, offers comprehensive cost-sharing protections to enrollees, including billing protections that prevent a participating provider from refusing to provide a service due to non-payment of cost-sharing by beneficiaries with incomes at or below 100 percent of the Federal Poverty Level (FPL).

All three types of plans provide for caps on enrollees’ in-network out-of-pocket expenses. As noted above, since it is a program designed to serve individuals with low-incomes, Medicaid cost-sharing is more limited than the other two programs.   Medicare Advantage plans must establish a maximum out-of-pocket liability amount (MOOP) for all Part A and B services, established annually by CMS. In 2015, the mandatory MOOP is $6,700.8  There is a separate maximum out-of-pocket or “catastrophic” threshold limit for prescription drugs of $4,700 (for 2015), after which point cost-sharing is the greater of 5 percent or $2.55 for generic or preferred drugs and the greater of 5 percent or $6.35 for all other drugs. The Medicare Advantage MOOP is not indexed to inflation and has not changed in five years, while the cost-sharing threshold under Part D plans is declining annually as the “donut hole” is gradually phased out.

For QHPs, the out-of-pocket limit for 2015 is $6,600 for an individual plan and $13,200 for a family plan. This amount includes prescription drugs.   The maximum out-of-pocket limit under QHPs is adjusted each year and started at $6,350 for individuals and $12,700 for a family plan in 2014. For 2016, the maximum limit is $6,800 for individuals and $13,600 for families.

While both Medicare and QHPs provide low-income subsidies, subsidy eligibility for QHPs has higher income limits and does not impose an asset test. QHPs provide enrollees with incomes between 100 percent and 400 percent FPL ($11,770 – 47,080 in 2015) sliding scale premium tax credits which limit the amount they will pay in premiums to a set percentage of income. QHP enrollees with incomes from 100-250 percent FPL ($11,770 – 29,425 in 2015) are also eligible to receive cost-sharing subsides that lower out-of-pocket caps and deductibles.

In states that have expanded Medicaid under the ACA, adults with income up to 138% FPL ($16,242 per year for an individual in 2015) are eligible for Medicaid. Under federal law, Medicaid premiums and cost-sharing for covered services apply only to certain groups of beneficiaries and are limited in amount. Neither Marketplace financial assistance programs nor Medicaid in poverty-related (MAGI) categories, including newly eligible adults, impose an asset test.

Medicare Advantage enrollees may qualify for the same Medicare low-income programs as traditional Medicare beneficiaries. For people living below 135 percent FPL ($15,889 in 2015) with limited assets, the Medicare Savings Programs pay the Part B premium ($104.90 per month in 2015). For individuals with incomes below 150 percent FPL ($17,655 in 2015) and limited assets, the Part D low income subsidy (LIS) pays the monthly Part D prescription drug premium and lowers co-pays at the pharmacy.

Individuals who attain Medicare eligibility are no longer eligible for either Marketplace subsidies or expansion Medicaid and may face an increase in out-of-pocket costs as their insurance status, and therefore subsidy eligibility, changes. For example, a 64-year old individual with income at 200 percent FPL ($29,425 in 2015) and significant assets can access tax credits and cost-sharing subsidies to help defray the costs of QHP coverage in the Marketplace; however, no premium or cost-sharing assistance is available for the same individual through Medicare once they turn 65. Individuals with Medicaid and some with low incomes receiving Marketplace premium tax credit and cost-sharing subsides may encounter what is referred to as the Medicare “cliff” – meaning that depending upon their income and resources, they may see their out-of-pocket costs increase when they become eligible for Medicare because Medicaid for people over 65 and Medicare have more stringent eligibility requirements for cost-sharing assistance. (For more information, see Appendix B.)

Enrollment

Medicare Advantage (MA) plansQHPsMedicaid MCOs
General EnrollmentOpen enrollment is October 15 through December 7. Similar to Medicaid, MA has a lock-in period for one year (with some exceptions).Open enrollment for the 2015 plan year was November 15, 2014 to February 15, 2015. Enrollment periods for the 2016 plan year (and thereafter) will align with the MA enrollment period.No similar enrollment period; Medicaid enrollment is always open. However, if Medicaid MCO enrollment is mandatory, beneficiaries must have the choice of two plans and have 90 days after enrollment to change plans after which time they generally are “locked-in” to their plan. Enrollees must have the option to change plans after the initial 90 days at least once every 12 months.
Special Enrollment Periods (SEPs)Low-income beneficiariesLow-income individuals (receiving Medicaid, Medicare Savings Program (MSP) and/or Part D Low Income Subsidy (LIS)) have a monthly SEP to enroll in, change or dis-enroll from MA plans.No similar requirement.Not applicable.
Changes in incomeNo SEP, unless found newly eligible or ineligible for certain low-income benefits (e.g., Medicaid, MSP, Part D LIS).SEP only for those already enrolled in QHP who become newly eligible for the advance premium tax credit (APTC) or cost-sharing subsidies (CSR), or for a different level of CSR. Can change plans once per qualifying event.Not applicable.
Changes in life circumstancesSEP following a move or loss of certain types of other coverage.SEP for “life circumstance” changes, such as a change in family status (e.g., marriage, having a child), a move, or other changes that trigger a loss of other minimum essential coverage.No similar requirement.
Exceptional circumstancesNo similar requirement (except by designation by CMS, e.g., following certain natural disasters).SEP allowances for exceptional circumstances preventing plan selection or enrollment.If MCO enrollment is mandatory, may dis-enroll for “good cause” at any time.
Changes in plan provider networksStarting in 2015, limited SEP for “significant” network provider terminations.No similar requirement.MCO disenrollment allowed if termination of a residential or employment supports provider from enrollee’s MLTSS network would result in a disruption in their residence or employment.9 
Note: MLTSS is Medicaid Managed Long-Term Services and SupportsSource: Authors’ analysis, 2015.

The rules for Medicare Advantage plans, QHP, and Medicaid MCO enrollment and disenrollment partly reflect whether enrollment in managed care is mandatory, and whether an alternative source of coverage is available. Medicare Advantage enrollment, as an option for receiving Medicare services guaranteed through federal entitlement, is voluntary for Medicare beneficiaries.   Correspondingly, if a person chooses to dis-enroll from a Medicare Advantage plan, or is involuntarily dis-enrolled, the default is traditional Medicare coverage.   Since QHPs are not built on the foundation of a federal entitlement, if an individual is dis-enrolled from a QHP there is no default – they are left without coverage unless and until they can exercise enrollment rights and opportunities to gain new coverage. Medicaid also is a federal entitlement for those who meet eligibility requirements. States can choose to deliver Medicaid benefits through managed care and whether to make MCO enrollment voluntary or mandatory, except that CMS must approve the mandatory enrollment of certain populations.

Medicare Advantage and Marketplace rules generally restrict when during the year beneficiaries can enroll and dis-enroll from plans. Both markets provide for special enrollment periods (SEPs) triggered by certain events, while mandatory Medicaid managed care enrollees are allowed to change MCOs at least once per year after their initial enrollment and for “good cause” at any time. Special Enrollment Periods for QHPs emphasize the ability to enroll in coverage when someone loses other coverage, whereas Medicare Advantage SEPs work to allow individuals in to Medicare Advantage plans, out of Medicare Advantage and into traditional Medicare, or into another Medicare Advantage plan. As expected, differences in SEP rights between Medicare Advantage plans and QHPs partly reflect the fact that the “default” from a Medicare Advantage plan is traditional Medicare whereas there is no default for QHP enrollees. CMS sought to protect QHP plan sponsors against adverse risk selection and structured QHP SEPs accordingly. QHP SEPs are more broad than Medicare Advantage SEPs for life-changing events (e.g., marriage, since single v. family enrollment is a factor in QHP eligibility and enrollment, unlike Medicare Advantage) and exceptional circumstances preventing timely plan selection (e.g., serious medical condition and natural disaster; for more information about SEPs, see Appendix D).

One notable difference in SEPs between Medicare Advantage plans and QHPs concerns individuals enrolled in certain low-income programs.  Medicare Advantage plans allow an ongoing SEP right to change plans on a monthly basis for individuals enrolled in low-income programs: Medicaid, a Medicare Savings Program and/or the Part D low-income subsidy (LIS).   For Medicaid MCO enrollees, who by definition have low incomes, if states require MCO enrollment, there is an on-going SEP for the first 90 days after which time individuals are generally locked-in to their plan (for no more than 12 months). In the Marketplaces, in order to access an SEP based on a change in advance premium tax credit (APTC) or cost-sharing subsidy (CSR) eligibility, an individual must already be enrolled in a QHP. This SEP is for switching QHPs rather than enrolling in coverage for the first time.

Another notable difference in SEPs relates to changes in a managed care plan’s provider network. Starting in 2015, Medicare Advantage enrollees have a limited right to change plans based upon CMS’ finding of “significant” network provider terminations by their Medicare Advantage plans, but there is no corresponding requirement for QHPs (also see network adequacy section below). According to 2013 guidance, enrollees in Medicaid managed long-term services and supports waivers may dis-enroll from their MCO when the termination of a provider from their MLTSS network would result in disruption in their residential or employment support services.

Efficiency Standards

Medical Loss Ratio (MLR)

Medicare Advantage (MA) plansQHPsMedicaid MCOs
Medical Loss Ratio (MLR) RequirementsPlans must maintain at least 85/15 ratio.Plans must maintain at least 80/20 ratio.No federal requirement.
Source: Authors’ analysis, 2015.

Medical loss ratio (MLR) refers to rules that limit the percentage of plan revenue that can be spent on administrative costs (claims administration, profit, etc.). Medicare Advantage plans must maintain an MLR of at least 85 percent/15 percent. Sanctions for failure to meet this standard can include rebates owed by the plan going back to the Medicare program, a prohibition on enrolling new members, and ultimately, termination of the plan’s contract with Medicare. Individual QHPs must maintain an MLR of at least 80 percent/20 percent with any rebates going back to the individual.   There is no federal MLR requirement in Medicaid, although states are permitted to include such a requirement in an MCO contract.

Provider Network Requirements: Adequacy, Enforcement, and Information

Medicare Advantage (MA) plansQHPsMedicaid MCOs
General RequirementsFederal law establishes MA network adequacy requirements which broadly require adequate” provider networks that take into account: (1) number of providers per population size; and (2) time/distance travel requirements so enrollees are not “unduly burdened.”Federal law requires QHPs to have “adequate provider networks. To date, more specific federal standards, including time/distance standards, have not been required. States may apply additional requirements.Federal law establishes general network adequacy criteria that all MCOs maintain a network of providers that is “sufficient to provide adequate access to Medicaid services. MCOs must take into account factors like (1) projected enrollment, (2) geographic location and (3) timely access to care for enrollees.
Consumer InformationEnrollment informationMA plans must disclose provider network when beneficiary enrolls or renews enrollment. Plans must make provider directories available upon request and ensure that websites contain current directories at all times. Medicare.gov is not required to link to provider directories.Links to QHP provider directories must be posted on the Marketplace website. Directories must be updated at least monthly.State or MCO must provide enrollees with names, locations, and phone numbers of providers.
Termination of providersMA plans are required to make a “good-faith effort” to notify enrollees of provider terminations. MA plans can change their provider networks at any time during the year as long as they continue to meet network adequacy standards and keep their provider directory up-to-date.QHPs are not required to inform enrollees of provider terminations. QHPs can change their provider networks at any time during the year as long as they continue to meet network adequacy standards and keep their provider directory up-to-date.MCOs are required to notify enrollees of provider terminations. MCOs can terminate providers at any time but must maintain continuity of care.
Providers speaking non-English languagesNo similar requirement.No similar requirement.Must identify providers who speak non-English languages.
Providers accepting new patientsNo similar requirement.Must identify providers that are accepting new patients, effective for 2016.Must identify providers that are not accepting new patients.
Compliance and OversightCMS uses geo-mapping software to evaluate network adequacy for new contracts; MA plans renewing annual contracts are required to attest that their network meets requirements, with no further review by CMS.Plans are required to attest to meeting network adequacy requirements; starting in 2015, plans must submit provider network prior to certification; additional oversight by CMS is evolving.State must ensure through contracts that each MCO gives assurances and provides supporting documentation that demonstrates that MCO has the capacity to serve expected enrollment in service area in accordance with state’s access to care standards; state must review plan documentation and certify to CMS that plan complies with state’s standards.
Reporting RequirementsNot required by statute to report claims from out-of-network providers.Required by statute to report claims from out-of-network providers; this provision not yet implemented.No similar requirement.
Out-of-Network Coverage for Emergency CarePlans must cover out-of-network emergency services at in-network cost-sharing rates or a standard co-pay set by CMS ($65 in 2015), whichever is lower.   Balance billing by providers is limited.QHPs must cover out-of-network emergency services at in-network cost-sharing rates. However, balancing billing by the provider is not limited.Medicaid MCOs must adequately and timely cover services out-of-network at no more than in-network costs to enrollee, if service cannot be provided in-network, including emergency care.
Source: Authors’ analysis, 2015.

In the Medicare Advantage program, federal network adequacy standards and oversight are more developed than those for QHPs, while QHPs and Medicaid MCOs may be subject to more stringent state specific network adequacy requirements. Network adequacy generally refers to a plan’s ability to provide timely and adequate care to enrollees through a sufficient “network” of health care providers. Adequate plan provider networks are crucial to ensuring consumers have timely access to needed health care services. For Medicare Advantage plans, CMS has a mechanism for review of provider networks in all Medicare Advantage plans against minimum time/distance access standards and distribution of specialists. Actual review of such Medicare Advantage networks, however, occurs only when a plan is new to a service area, is expanding its service area, significantly changes its network, or if CMS receives many complaints about the network; in other words, there is no required annual review for plans renewing existing contracts with CMS. In the financial alignment demonstrations for dually eligible individuals, CMS will review the adequacy of plans’ networks annually beginning in 2015.

For QHPs, CMS implementation of network adequacy standards is evolving. In the first year, CMS required insurers to submit the “name” of the provider network (not the names of providers in the network) and attest to its adequacy. Since then, CMS has required QHPs to submit network directories, but agency review is ad hoc, focusing mainly on five provider types, and does not involve analysis against time/distance standards. CMS has suggested such review may take place in future years. CMS guidance also indicates the agency will analyze plan network data for the coming year with a focus on certain providers, which may include hospitals and primary care, mental health, oncology and dental providers. The ACA also requires QHPs and other private health plans to submit data to the Secretary on out-of-network claims and out-of-pocket expenses. These data could be used to develop measures of network adequacy; to-date, however, this provision of the ACA has not been implemented. Medicaid MCO network adequacy is left up to the states, within broad federal guidelines and with federal oversight, however plans must implement procedures to ensure that each enrollee has an ongoing source of primary care appropriate to individual needs, as well as identify people with special health care needs and ensure that they have direct access to specialists as appropriate.

Although Medicare Advantage network adequacy standards and oversight are more developed than that for QHPs, including a specified ratio of certain types of providers, Medicare Advantage plans are not bound by the QHP requirement to contract with a threshold number of essential community providers serving predominantly low-income and medically underserved individuals. 

Notice, Appeals and Grievances

Medicare Advantage (MA) plansQHPsMedicaid MCOs
Notice of DenialNotice of non-coverage is a standard document developed by CMS. Must provide timely description of service denied, the action taken/to be taken, reason for action/service denial, information on rights to expedited and standard appeal, and how to seek an appeal.Notice must use approved language in a readable and understandable format (however requirements that notices be provided in languages other than English are limited).Notice must be timely and include description of service denied, the action taken/to be taken, reason for action/service denial, and information about appeal rights. This mirrors ERISA guidelines.Under federal law, all denial notices must include brief statement that translation assistance by phone is available. Consumers who want written translation must request it for each notice. State law may apply additional notice requirements.Notice must be timely and written in accessible language and format that explains the action taken/to be taken, the reason(s) for the action/service denial or termination, enrollee’s right to file an appeal, enrollee’s right to request state fair hearing (if state does not require exhaustion of plan appeal first) and how to exercise expedited and standard appeal processes, including the right to and process for requesting aid pending, and circumstances under which enrollee may be required to repay.
Appeals ProcessAdverse decisions may be appealed to five-level Medicare administrative appeals process, which includes an internal plan review, an external review by an independent contracted reviewer, an Administrative Law Judge hearing, a hearing by the Medicare Appeals Council in HHS, and federal district court. There are expedited appeal rights for cases of urgent medical necessity.Any plan decision is internally appealable. The opportunity to seek external review is reserved only for adverse determinations that involve clinical judgment. There are expedited appeal rights for cases of urgent medical necessity.Generally, for QHPs the appeals process provides for up to one mandatory internal review with other “voluntary” levels of internal review permitted, an external review, and in some states appeal to state court.Adverse decisions may be appealed to the plan where enrollees have rights to present evidence and allegations of fact and law at plan hearing and to access documents and records considered at the hearing. They also may access the state fair hearing system which terminates in state court. There are expedited appeal rights for cases of urgent medical necessity.
Independent External ReviewRequired at consumer’s request after internal appeal completed.CMS selects the independent review organization.Required at consumer’s request after internal appeal completed.In most states, state regulator selects the independent review organization; in 8 states where weaker state laws preempted, insurers have choice of using two federal external review systems – one run by HHS where federal government hires review organization, and one established by DOL for all self-funded employer plans where plan hires review organizations.Required at consumer’s request. States vary as to whether exhaustion of internal plan appeal process is mandatory before accessing state fair hearing.
Aid Paid PendingNot required (other than limited continued coverage when appealing discharges from hospital, skilled nursing facilities and home health coverage).Not required.Required for service terminations if timely requested by beneficiary.10 
Grievances Prescribed grievance process to express dissatisfaction about matters that are not subject to appeals, such as quality of care or failure to respect enrollee rights.Complaints and grievance process through the Marketplace.Similar requirement to MA.
Reporting requirementsFederal requirements for reporting complaints and grievances with the plans.No federal reporting requirements or data collected, though potential for Secretary to collect data under ACA transparency authority, not yet implemented.Similar requirement to MA.
Assistance with Appeals No requirements for MA plan assistance with appeals, although State Health Insurance Assistance Programs (SHIPs) often serve this purpose.Consumer Assistance Programs (CAPs) established in most states with federal funding to assist QHP enrollees (and other state residents) with appeals.Medicaid MCOs must assist enrollees with appeals and provide interpreters.
Source: Authors’ analysis, 2015.

All three markets require appeals processes for plan enrollees when coverage of a service is denied or terminated. However, the protection afforded to the consumer for a service denial varies widely between the three markets, with the Medicaid program offering the strongest protections for beneficiaries as a result of the property interest beneficiaries have in Medicaid benefits and the due process rights conferred on them by the Constitution.

Medicaid MCOs have very detailed notice requirements and Medicare Advantage is required to provide standardized notices created by CMS while QHPs standards mirror those for plans governed by ERISA which are less robust. Medicaid MCOs must provide written notices in accessible language and format. The notice must include detailed information, including an explanation of the adverse action with reasoning, plan appeal and state fair hearing rights, circumstances under which expedited resolution is available and how to request it. The notice must also include detailed information on the right to have services continue pending the outcome of the appeal and the circumstances under which an enrollee may be required to pay for any care received while the appeal is pending. For QHPs, notices must include a description of the service denied, reason for the denial and information about appeal rights. For denials in states with a Consumer Assistance Program (CAP), the notice must also include contact information for the CAP. Rules concerning when notice must be provided follow the Employee Retirement Income Security Act (ERISA). Medicare Advantage plans are required to issue beneficiaries a standardized notice form for all denied services which includes information on why the service was denied and appeal rights, including expedited appeals and grievances.

Because Medicaid MCOs and Medicare Advantage are built on the foundation of federal entitlement programs, their appeals processes are more federally standardized than those in QHP. The Medicare five-step administrative appeals process is uniform across the country, whereas there is variation in levels/structures of QHP appeals between states. For example, most QHP enrollees will be bound by their states’ external review laws; that is, they will be subject to state law regarding when someone other than their plan must review a service denial. State law regarding external appeals and who may serve as an external appeal body varies somewhat, though state appeals laws must meet minimum standards under the ACA or they can be preempted. In particular, ACA minimum standards require that the external reviewer must be independent, not hired by the health plan. In 8 states where the external appeals law was preempted, however, health insurers can choose on a case by case basis to use one of two federal external appeals systems – one run by HHS, where the external reviewer is hired by the federal government, or one established by the Department of Labor (DOL) for all self-funded employer plans, where the plan hires its own external review organizations.11  Similar to Medicare, Medicaid MCO baseline appeal rights, including plan appeals and state fair hearings, are in federal law, although states are permitted to make some choices within the federal framework (such as the number of days to request a hearing, or whether a beneficiary must exhaust internal plan appeals before requesting a hearing).

When a timely request is made by a beneficiary, Medicaid law requires MCO services to continue pending appeal whereas Medicare Advantage plans and QHPs are not required to do so. Medicare Advantage plans provide limited continued coverage when appealing discharges from hospital, skilled nursing facilities and home health coverage, and QHPs provide limited continued coverage pending the outcome of an internal plan level appeal.

The Medicare Advantage program has a more standardized, centralized complaint tracking system compared to QHPs and Medicaid managed care complaint tracking, which differs across states. There is a federal complaint tracking system in place for Medicare Advantage plans while grievances against QHPs are filed with plans, state departments of insurance or the Marketplace and vary from state to state – there are no federal reporting requirements or data collected.  However, it should be noted that the Secretary of Health and Human Services has the authority to require reporting by plans on claims denials and appeals, but this provision of the Affordable Care Act has not yet been implemented. The basic plan grievance process for Medicaid managed care is set out in federal law and like Medicare Advantage plan’s requirements about reporting to CMS, MCOs are required to report to the state on grievances received and disposed of.

Consumer Information, Assistance and Marketing

Medicare Advantage (MA) plansQHPsMedicaid MCOs
General Consumer InformationA Plan Finder tool on the medicare.gov website allows users to perform a personalized or generalized search of Part D and MA plans available by zip code.The Plan Finder allows users to compare certain plan features, such as covered drugs, cost-sharing for certain services, estimated out-of-pocket costs and quality ratings.The tool does not, however, include other information, such as contracted provider networks.Medicare also offers a toll-free, 24/7 national hotline to provide information, compare plans and lodge complaints (1-800-MEDICARE).Marketplaces must make available plan rating tools reflecting differences in quality, claims payment practices, enrollee satisfaction, and other measures (not yet implemented).Other online plan comparison tools are not yet implemented in federal Marketplaces, but some states provide such tools.If MCO enrollment is mandatory, the state must provide beneficiaries with a plan comparison chart.
Disclosure of Plan InformationMA plans must disclose at the time of enrollment and at least annually thereafter certain information regarding the plan, including: benefits offered under the plan, information about contracted network providers, supplemental benefits, prior authorization rules or other review requirements that could result in nonpayment, and plan grievance and appeals procedures.Standardized description of covered benefits and cost-sharing (SBC) required of all QHPs.SBCs must include illustrations of cost-sharing that applies under standardized care scenarios to help consumers make plan comparisons (not yet fully implemented).Information on providers taking new patients and those who speak non-English languages.
Consumer Assistance Federally funded (State Health Insurance Assistance Programs – SHIPs). Funded by annual appropriation.All Marketplaces must provide Navigators who assist with enrollment and application for Marketplace financial assistance.Navigators to be funded through marketplace operating revenue.   In addition, all states may establish Consumer Assistance Programs (CAPs). CAPs serve all state residents, including QHP enrollees. CAPs provide enrollment assistance and post-enrollment assistance, including help filing external appeals. CAPs funded by federal grants, authorized at such sums necessary but not currently appropriated.Medicaid programs may provide ombudsman programs at state option (CMS guidance requires independent advocacy or ombudsman services in MLTSS waiver programs).
MarketingOversightFederal oversight of plans, state oversight of agents/brokers.Some federal oversight with most delegated to states.Oversight up to states.
 Standards for Marketing MaterialsWell-developed federal standards.Loose federal standards; primarily state standards.Federal standards with discretion to states to develop enhanced standards.
 Approval of Marketing Materials File and use (materials must be submitted to regulators but can be used after a designated time period if the regulator fails to respond).File and use.State approval required before distribution.
Source: Authors’ analysis, 2015.

Consumer Information

Medicare Advantage plans, QHPs and Medicaid MCOs are all required to disclose certain information to enrollees; however, Medicare Advantage plans must generally provide a broader range of information. Medicare offers a uniform plan comparison tool that provides certain information about all plans allowing for an easier side-by-side comparison (Plan Finder), including premiums, cost-sharing, supplemental benefits and quality ratings. Notably, the comparison tool does not include all information individuals may want for comparing plans, such as provider networks. While there is no comparable electronic side-by-side comparison tool for QHPs at the federal level, some state Marketplaces offer them and the standardized Summary of Benefits and Coverage (SBC) that each individual QHP is required to publish does offer consumers a uniform vehicle for plan comparison. The SBC is required of all plans (including group health plans). Each SBC must present standardized information about covered benefits and cost-sharing, as well as benefit limits and exclusions. The documents are required by law to be consumer friendly and easy to use. The SBCs also must provide consumers with standardized coverage illustrations so consumers can compare coverage under different plans for like treatment scenarios (such as an uncomplicated pregnancy).   Such a standardized comparison document does not exist for Medicare Advantage; if Medicaid MCO enrollment is mandatory, the state must provide beneficiaries with a plan comparison chart.

Consumer Assistance

QHPs have dedicated consumer assistance entities, including those to assist with enrollment and appeals, written into law, although limited funding has kept the programs from fully developing. Under the ACA, statewide Consumer Assistance Programs (CAPs) are established to provide comprehensive assistance to all state residents in answering questions about their health plans, determining eligibility for coverage and subsidies, enrollment, and help filing appeals of denied claims. The CAPs are required to be advocates for consumers. In addition, by law, CAPs must collect and report data to the Secretary on the types of help consumers need and the problems they encounter, and the Secretary and other state and federal regulators are to use data to enhance oversight. Funding for CAPs is subject to an appropriation and Congress has not appropriated new funds since the ACA was enacted. In addition, the ACA requires that Marketplaces provide for other consumer assistance with enrollment and eligibility through Navigator programs. Navigators must be funded on an ongoing basis through Marketplace operational funds. Navigators are not required to help non-Marketplace consumers, nor are they required to help consumers with appeals or other post-enrollment problems and questions. Rather, the ACA requires Navigators to refer consumers to CAPs in these circumstances.

The State Health Insurance Assistance Program (SHIP) provides a health insurance advisory service to assist Medicare beneficiaries with the receipt of services under Medicare, Medicaid and other health insurance programs. This includes help with enrollment and appeals. The SHIP program exists in all fifty states and is administered at the county level. Often, community non-profits, Offices for the Aging or long-term care ombudsmen serve as SHIPs although staff is primarily volunteer based. CMS is legislatively required to assess SHIP performance, and CMS uses data gathered by the SHIP National Performance Reporting (NPR) system.

Marketing

The Medicare Advantage program has well-developed marketing rules that plans and their contractors must follow. For example, Medicare marketing rules articulate when CMS must approve marketing materials, outline prohibited marketing practices (including marketing through unsolicited contacts), and provide for coordination with state regulators to address inappropriate marketing practices by plans and agents/brokers. While QHP marketing standards and oversight are left largely to individual states, the creation of designated Marketplaces as centralized, regulated forums to shop for and purchase insurance can serve to reduce the potential for marketing abuses sometimes seen in the individual, non-group market. To be offered on a Marketplace website, plans must submit to uniform rules about the content and display of information. Federal Marketplace regulations sets minimum standards for all Marketplaces (and are the sole standard in the Federally Facilitated Marketplace), while state-administered Marketplaces may require additional standards. Plans must also abide by federal non-discrimination rules in their marketing practices. Medicaid MCOs must get state approval of all marketing materials to ensure they do not mislead, confuse or defraud consumers and are accurate, whereas both Medicare Advantage and QHPs in most states are subject to “file and use” rules, meaning materials must be submitted to regulators but can be used after a designated time period if the regulator fails to respond.


Report: Discussion

Medicare Advantage plans, QHPs and Medicaid MCOs provide coverage for an increasing number of people and increasing shares of the insured population in the United States. Over the course of a lifetime, an individual may be covered in one, two, or all three of these insurance markets. Further, many of the same insurance companies or plan sponsors offer products in two or all three of these markets. While many consumer protections between the markets are similar, differences could both cloud consumers’ understanding of their rights in the different programs and fragment oversight by government entities and administration by plan sponsors.   Transitioning between types of coverage that have significantly different consumer protections raises issues of not only equity, but ease of administration, oversight and consumer understanding of how to use their insurance and exercise their rights. Whether these differences should be maintained warrants further review by policy makers, within the parameters of baseline protections, such as due process, that are constitutionally required for Medicaid.

There may be opportunities to both enhance and streamline oversight of plans across insurance type without sacrificing beneficiary protections since federal oversight can vary significantly across the programs. For example, as plans with oversight from both the federal government and the states, the federal government has set some standards for Medicaid managed care plans but has provided states considerable discretion – and often more discretion than it has provided to the Medicare Advantage plans. With Medicare Advantage plans, the federal government has gained considerable experience over the course of recent decades in regulating private Medicare plans, and has increased oversight and expanded consumer protections in reaction to plan behavior and market changes.

The Marketplaces are increasingly populated by the same plan sponsors offering private Medicare and Medicaid products. As a consequence, alignment of consumer protections might also ease administration by the plans offering products in two or all three markets. Likewise, closer alignment of consumer protections between these programs could potentially ease the transition of individuals from one program to another and enhance coordination when someone has more than one type of coverage. Additionally, aligned protections could foster better, more consistent understanding of program rules by consumers.

In addition to aforementioned positive aspects, there may be tradeoffs in strengthening consumer protections. For many of the consumer protections discussed, further enhancement and alignment would be low or no-cost. For example, more uniformity around enrollment periods and consumer information could be low-cost to plans, state and federal governments. However some changes, for example surrounding appeals or benefit design, could cost private plans, public programs, and potentially consumers more resources and money.

Alignment could be achieved in multiple ways, with different effects on plans, enrollees, and federal and state governments. One possibility is that an effort to align protections could cause dilution of consumer protections in favor of uniformity. Another possibility is that alignment could be based on the strongest protection in one single program, and other programs brought up to match that higher standard rather than relying on a lower floor, or a “race to the bottom.” The CMS financial alignment demonstrations for dual eligible beneficiaries offer an example of this “higher standard” uniformity, in that where there is a discrepancy in a protection between Medicare and Medicaid, the stronger protection is adopted. It should be noted that certain protections, such as due process for Medicaid beneficiaries, cannot be diluted because they arise from constitutionally protected property rights. Ultimately, better coordination across markets with an emphasis on consumer protections will help to improve health care for all participants.

This report was prepared by attorneys from the Center for Medicare Advocacy and Kaiser Family Foundation staff.   We gratefully appreciate the significant contributions of David Lipschutz (Center for Medicare Advocacy, Inc.) and Andrea Callow (formerly with the Center for Medicare Advocacy, Inc.) who collaborated on this report with Karen Pollitz, MaryBeth Musumeci and Gretchen Jacobson of the Kaiser Family Foundation.

Appendices

Appendix A: Background on Medicare Advantage, Marketplace Qualified Health Plans and Medicaid Managed Care Organizations

Medicare Advantage (MA)

Medicare currently covers over 50 million individuals, almost a third of whom are enrolled in Medicare Advantage plans. The Medicare Advantage (MA) program, also known as Medicare Part C, is a voluntary coverage option available to Medicare beneficiaries as an alternative to the traditional fee-for-service Medicare program.12  Medicare Advantage coverage is offered through private insurance companies in the form of health plans, such HMOs and PPOs. An individual must affirmatively choose to enroll in a Medicare Advantage plan, and once enrolled they generally receive all their Medicare services through the plan. If a person chooses to dis-enroll from a Medicare Advantage plan, or is involuntarily dis-enrolled, they are by default enrolled into traditional Medicare coverage.

Medicare Advantage benefits, cost-sharing and other consumer protections are grounded in the federal rules governing traditional Medicare. Medicare Advantage plans must provide enrollees with coverage of all services that are covered by Medicare Parts A and B except hospice, (and, if applicable, the Part D prescription drug benefit). Medicare Advantage plans can, and are often required to, provide benefits in addition to those covered by traditional Medicare, such as vision and dental services or reduced cost-sharing.   The scope of benefits covered by Medicare Advantage generally has the same limitations as traditional Medicare (e.g., number of days covered in a skilled nursing facility); however, plans have leeway to loosen such restrictions. Medicare Advantage plans can also charge varying cost-sharing amounts, including deductibles and co-pays and, unlike traditional Medicare, provide caps on beneficiary out-of-pocket expenses. Cost-sharing in Medicare Advantage is limited by actuarial equivalency rules; in others words, in general, Medicare Advantage enrollees will not pay significantly more out-of-pocket than they would under traditional Medicare.

Medicare Advantage plans are regulated by the federal Centers for Medicare and Medicaid Services (CMS), which also administers other parts of the Medicare program. States are largely preempted from regulating Medicare Advantage plans. The Medicare Advantage program, and its predecessor Medicare+Choice, has had decades of experience operating within the Medicare program. Similarly, CMS has an established track-record of regulatory oversight of Medicare Advantage plans which continues to evolve in response to changes in the market and plan behavior.

Marketplace Qualified Health Plans (QHPs)

In an effort to expand access to health insurance coverage, the Affordable Care Act (ACA) created exchanges, or Marketplaces, through which individuals can shop for insurance coverage effective January 2014.13  States have the option to build and administer a fully state-based Marketplace, enter into a state-federal partnership Marketplace, or default to a federally-facilitated Marketplace (FFM) administered solely by the federal government. This brief focuses on rules governing the federally facilitated Marketplace. As of January 2015, 11.4 million people had enrolled in private insurance through the Marketplaces.14 

Health insurance plans must be certified as Qualified Health Plans (QHPs) by a Marketplace before they may be sold to consumers. To be certified, QHPs must cover certain essential health benefits (EHB), follow established limits on cost-sharing (like deductibles, copayments, and out-of-pocket maximum amounts), and meet other requirements.   QHPs are divided into 4 different categories based on actuarial value: Bronze, Silver, Gold, and Platinum, all of which must cover essential health benefits (EHBs).

Oversight of QHPs is shared by the federal and state governments.   States perform primary enforcement of federally mandated insurance market reforms that govern QHPs.   If a state cannot or will not perform such functions, however, CMS may step in. Currently, oversight and enforcement capacity at the federal level is limited – both for group health plans (DOL and Internal Revenue Service (IRS); HHS for public employer plans) – and for QHPs in federally operated Marketplaces. Note that most private coverage continues to be provided outside the Marketplace, through employer-sponsored group health plans, which are subject to federal regulation and for which most state regulation is preempted by ERISA.

Medicaid Managed Care Organizations (MCOs)

As the nation’s primary public health insurance program for people with low incomes, as of January 2015 Medicaid covers over 68 million Americans over the course of a calendar year.   It is a major source of coverage for people with low incomes and people with disabilities. Medicaid is jointly financed by the federal government and the states and administered by the states with federal oversight.15  Federal law requires states participating in Medicaid to cover certain mandatory benefits, and states can choose to cover additional optional benefits.16 

Before passage of the ACA, federal Medicaid matching funds were available only for specified categories of people with low-incomes: children, pregnant women, parents, people with disabilities, and seniors.17  States that choose to participate in the Medicaid program must cover people in these groups with income up to federal minimum thresholds, and states have the option to expand coverage to individuals at higher incomes.

The ACA expanded Medicaid to nearly all adults under age 65 with income at or below 138 percent FPL or $16,242 per year (2015) for a single person, with no asset test, effective January 1, 2014.18  However, the 2012 Supreme Court ruling in NFIB v. Sebelius effectively made implementation of the Medicaid expansion a state choice.19  To date, 29 states, including DC, have implemented the ACA’s Medicaid expansion.20 

States can choose to provide Medicaid benefits through managed care, including managed FFS models, such as primary care case management, and private capitated managed care organizations (MCOs) that contract with the state on a risk basis to deliver Medicaid services. This brief focuses on consumer protections specific to enrollees in Medicaid MCOs. States have the option to make Medicaid managed care enrollment voluntary or mandatory for beneficiaries. However, states are required to seek CMS approval to require managed care enrollment for children with special needs, beneficiaries dually eligible for Medicare and Medicaid, and certain Native Americans. As of July 2014, 39 states including DC had comprehensive risk-based contracts with Medicaid MCOs.21  Among these states, 16 reported that over 75 percent of their Medicaid beneficiaries were enrolled in MCOs, and 34 states indicated that they made specific policy changes to increase their number of MCO enrollees, such as expanding voluntary or mandatory enrollment to additional coverage groups, in FY 2014 or planned to do so in FY 2015.22  Over half of Medicaid beneficiaries nationally – mostly, children and parents – are enrolled in comprehensive MCOs; this share is growing as states expand managed care to include higher-need Medicaid populations, such as people with disabilities23  and dual eligible beneficiaries, as well as newly eligible Medicaid expansion adults.

Appendix B: Low-Income Assistance and the Medicare “Cliff”

There are substantial differences in income and asset thresholds at which low-income assistance is available to Medicare beneficiaries and those seeking QHP coverage in the Marketplaces. For Medicare beneficiaries, including Medicare Advantage enrollees, assistance with Part A and B deductibles, coinsurance and copayments is available only to individuals with incomes up to 100 percent of the Federal Poverty Level (FPL) ($11,770 in 2015) and who meet certain asset tests. Assistance with paying the Part B premium is available to individuals with incomes up to 135 percent of FPL ($15,889 in 2015), with limited assets, and Part D premium and cost-sharing assistance is available, on a sliding scale, for individuals up to 150 percent of FPL ($17,655 in 2015) and limited assets. Assistance with Medicare Advantage premiums is limited to individuals dually eligible for Medicare and Medicaid, and only at state discretion.24 

By contrast, in Marketplaces, people with incomes between 100 percent and 400 percent FPL who have no other offer of affordable minimum essential coverage, including Medicaid, can access tax credits to defray premium costs for QHPs; there is no asset test for Marketplace tax credits. Additionally, cost-sharing subsidies are available for individuals between 100 percent and 250 percent of FPL. However, for individuals over 200 percent FPL these subsides lower the out-of-pocket cap on expenses (from $6,600 to $5,200 in 2014) but typically make only modest adjustments to other cost-sharing features, such as annual deductibles.  The Affordable Care Act made Medicaid available to more people. Now, in states that implement the Medicaid expansion, individuals with incomes up to 138 percent FPL may qualify. There is no asset test under the new financial methodology that applies to the newly eligible population as well as to other poverty-related coverage groups. Medicaid provides comprehensive coverage with very low out-of-pocket costs.

Individuals who attain Medicare eligibility are no longer eligible for Marketplace subsidies, and they may see their eligibility for Medicaid change. Individuals transitioning to Medicare from Medicaid, and to a lesser extent those under 200 percent FPL enrolled in a QHP with subsides may encounter what is referred to as the Medicare “cliff” – meaning that depending upon their income and resources, they may see their out-of-pocket costs increase when they become eligible for Medicare because of more stringent eligibility requirements for cost-sharing assistance imposed by Medicare low-income programs and Medicaid. For example, Medicaid for seniors (over 65) has a federal income eligibility limit of 100 percent FPL and imposes an asset test in most states (unless states cover seniors at higher incomes or without regard to assets through a waiver). Likewise, Medicare has more stringent eligibility requirements for cost-sharing assistance.25 

Appendix C: Detailed Table Comparing Consumer Protections for Medicare Advantage, Marketplace Qualified Health Plans, and Medicaid Managed Care Organizations

Appendix C (.pdf)

Appendix D: Comparison of Special Enrollment Period (SEP) Rights

Appendix D (.pdf)

Endnotes

  1. See Kaiser Family Foundation Medicare Health and Prescription Drug Plan Tracker for Medicare Advantage Enrollment, available at https://modern.kff.org/data-collection/medicare-health-and-prescription-drug-plans/ Kaiser Family Foundation State Health Facts for Marketplace Enrollment, available at https://modern.kff.org/other/state-indicator/state-marketplace-statistics-2015/ Kaiser Family Foundation Medicaid Managed Care Tracker for Medicaid Managed Care Enrollment, available at https://modern.kff.org/medicaid/state-indicator/total-medicaid-mc-enrollment/ ↩︎
  2. A fifth category of “Catastrophic” plans is only available to certain consumers. These plans have somewhat higher cost-sharing, and premium subsidies are not available for Catastrophic QHPs. ↩︎
  3. The statute also permits other capitated models (Prepaid Inpatient Healthcare Plans (PIHPs) and Pre-paid Ambulatory Health Care Plans (PAHPs)), which have less than a comprehensive risk contract than is required for MCOs. PIHPs include inpatient services, while PAHPs do not. ↩︎
  4. See, e.g., Kaiser Commission on Medicaid and the Uninsured, Benefits and Cost-Sharing for Working People with Disabilities in Medicaid and the Marketplace (Oct. 2014), available at https://modern.kff.org/medicaid/issue-brief/benefits-and-cost-sharing-for-working-people-with-disabilities-in-medicaid-and-the-marketplace/. ↩︎
  5. “NHeLP and The AIDS Institute Complaint to HHS Re HIV/AIDS Discrimination by Florida Insurers,” National Health Law Program and The AIDS Institute, May 29, 2014, available at http://www.healthlaw.org/publications/browse-all-publications/HHS-HIV-Complaint#.VE-BRhZHWkJ. For more information, see Florida Insurance Commissioner Reaches Agreement with Insurer to Protect People with HIV/AIDS available at http://www.hivdent.org/_USPublicPolicy_/2014/USPP_FICR112014.html. ↩︎
  6. See e.g., “Medical and Prescription Drug Deductibles for Plans Offered in Federally Facilitated and Partnership Marketplaces for 2015”, Kaiser Family Foundation https://modern.kff.org/health-reform/fact-sheet/medical-and-prescription-drug-deductibles-for-plans-offered-in-federally-facilitated-and-partnership-marketplaces-for-2015/. ↩︎
  7. For example, for MA enrollee protections concerning balance billing and emergency services, see 42 C.F.R. §422.113(b).   See 42 C.F.R. §422.214 concerning what non-contract providers can collect in payment; also see Medicare Managed Care Manual, Ch. 4, §§180 – 190.2, and Ch. 6, §100. ↩︎
  8. This maximum out-of-pocket amount is for in-network services covered by Medicare Advantage preferred provider plans (PPOs); such plans have higher limits for out-of-network care. ↩︎
  9. Per CMS guidance, not statute or regulation. CMS, Guidance to States Using 1115 Demonstrations or 1915(b) Waivers for Managed Long-Term Services and Supports Programs at 10 (May 2013), available at http://www.medicaid.gov/Medicaid-CHIP-Program-Information/By-Topics/Delivery-Systems/Downloads/1115-and-1915b-MLTSS-guidance.pdf. At this time, it has not been fully incorporated in state home and community based services waivers. See, e.g., https://modern.kff.org/medicaid/issue-brief/key-themes-in-capitated-medicaid-managed-long-term-services-and-supports-waivers/. ↩︎
  10. Current regulations can be read to allow MCOs to provide aid pending appeal only to the end of the current authorization period, rather than during the entire pendency of the appeal, which is problematic for individuals with on-going care needs receiving long-term services and supports. ↩︎
  11. 45 C.F.R. § 147.136. Also see “Guidance on External Review for Group Health Plans and Health Insurance Issuers Offering Group and Individual Health Coverage, and Guidance for States on State External Review Processes,” DOL, June 22, 2011, available at http://www.dol.gov/ebsa/newsroom/tr11-02.html. ↩︎
  12. See, e.g., “Medicare Advantage Fact Sheet,” Kaiser Family Foundation, May 1, 2014, available at https://modern.kff.org/medicare/fact-sheet/medicare-advantage-fact-sheet/. ↩︎
  13. See, e.g., “Summary of the Affordable Care Act,” Kaiser Family Foundation, April 25, 2013, available at https://modern.kff.org/health-reform/fact-sheet/summary-of-the-affordable-care-act/. ↩︎
  14. See http://aspe.hhs.gov/health/reports/2014/Targets/ib_Targets.pdf. ↩︎
  15. See, generally, “Medicaid Moving Forward,” Kaiser Commission on Medicaid and the Uninsured, June 17, 2014, available at https://modern.kff.org/medicaid/fact-sheet/the-medicaid-program-at-a-glance-update/. ↩︎
  16. “Medicaid Enrollment and Expenditures by Federal Core Requirements and State Options,” Kaiser Commission on Medicaid and the Uninsured, January 1, 2012, available at https://modern.kff.org/medicaid/issue-brief/medicaid-enrollment-and-expenditures-by-federal-core/. ↩︎
  17. Unless states were granted a waiver by HHS to cover those not otherwise (categorically) eligible. ↩︎
  18. The ACA expanded Medicaid to 133% FPL. However, in calculating eligibility based on the new Modified Adjusted Gross Income financial methodology, an income disregard of 5% FPL is added, making the expansion effectively up to 138% FPL. ↩︎
  19. “The Federal Courts’ Role in Implementing the Affordable Care Act,” Kaiser Family Foundation, September 12, 2014, available at https://modern.kff.org/health-reform/issue-brief/the-federal-courts-role-in-implementing-the-affordable-care-act/. ↩︎
  20. “Status of State Action on the Medicaid Expansion Decision,” Kaiser Commission on Medicaid and the Uninsured, as of Jan. 27, 2015, available at https://modern.kff.org/health-reform/state-indicator/state-activity-around-expanding-medicaid-under-the-affordable-care-act/. ↩︎
  21. “Medicaid in an Era of Health & Delivery System Reform: Results from a 50-State Medicaid Budget Survey for State Fiscal Years 2014 and 2015,” Kaiser Commission on Medicaid and the Uninsured, October 14, 2014, available at https://modern.kff.org/medicaid/report/medicaid-in-an-era-of-health-delivery-system-reform-results-from-a-50-state-medicaid-budget-survey-for-state-fiscal-years-2014-and-2015/. ↩︎
  22. Id. ↩︎
  23. See, generally, “People with Disabilities and Medicaid Managed Care: Key Issues to Consider,” Kaiser Commission on Medicaid and the Uninsured, February 1, 2012, available at https://modern.kff.org/medicaid/issue-brief/people-with-disabilities-and-medicaid-managed-care/. ↩︎
  24. See, e.g., CMS’ MMCO – CMCS Informational Bulletin entitled “Billing for Services Provided to Qualified Medicare Beneficiaries (QMBs),” January 6, 2012, available at: www.medicaid.gov/Federal-Policy-Guidance/downloads/CIB-01-06-12.pdf. ↩︎
  25. See, e.g., Leo Cuello, “Health Advocate: Understanding the Medicare Coverage Cliff,” National Health Law Program, June 17, 2014, available at http://www.healthlaw.org/publications/browse-all-publications/Health-Advocate-June-2014#.VAukQ2Nl-XQ. ↩︎
News Release

At Five Year Anniversary of the ACA, Gap Between Favorable and Unfavorable Views Among The Public Narrows to Smallest Spread in More Than Two Years

Published: Mar 19, 2015

Most Expect Negative Consequences if Supreme Court Prohibits Subsidies in States Without Their Own Insurance Exchanges; Two Thirds of the Public and Those in Affected States Want Congress or Their State to Close Any Gaps

As April 15 Tax Deadline Nears, Nearly Half Unaware Insurance Reporting Requirement Starts This Year

Five years after President Obama signed the Affordable Care Act, this month’s Kaiser Health Tracking Poll finds the closest split between favorable and unfavorable views of the law since Fall 2012 and a significant uptick in favorable views from the low in November 2013 during the law’s troubled rollout. The poll finds 43 percent of the public view the law unfavorably and 41 percent view it favorably.

While most Americans continue to say the law has not had a direct impact on their families, the March poll finds a narrower gap than in recent polls between the shares with positive and negative perceptions of the impact on them: 19 percent of the public says the law has helped their families and 22 percent say it has hurt them. Republicans are more likely to report being hurt and Democrats are more likely to report being helped, consistent with previous tracking polls.

KFFMarchTrackingPoll-Chart1

The Foundation’s interactive graphic allows users to explore changes in the public’s views of the ACA over the past five years, including breakouts by party identification, race/ethnicity, age, gender, insurance status and income.

On March 4, the Supreme Court heard oral arguments in the King v. Burwell case about whether or not the health care law bars financial assistance to low-and moderate-income people in states that chose to rely on the federal health insurance marketplace rather than establish a state-run marketplace.

Even after the proceedings, the case is not on the public’s radar, as more than half (53%) say they have heard nothing about the case and another quarter (25%) say they have heard only a little. About one in five (22%) say they have heard at least something about the case, up somewhat since January (14%).

When asked for their views on the potential impact of the case, majorities of the public say that a Supreme Court ruling in favor of the plaintiffs to restrict subsidies would have a negative impact on the country (62%) and the uninsured (57%).  This includes majorities of Democrats, Republicans and independents. In addition, about half of the public (51%) say such a ruling would negatively impact people receiving government assistance to buy insurance, and just under half (45%) say it would negatively impact their state, including 46% of those in states potentially affected by such a ruling.

If the Supreme Court does limit financial help to people in states with state-run marketplaces, about two-thirds of the public (65%) say that Congress should pass a law so that people in all states can be eligible for health insurance subsidies. Majorities of Democrats (81%) and independents (67%) favor Congressional action, while Republicans (56%) prefer Congress not act on the issue (with 39% favoring action). Arguments for and against Congressional action do little to move public opinion on this question.

At the same time, more than half of the public (56%) say they are “not at all” confident that Democrats and Republicans in Congress can work together on any issues raised by the ruling and 51 percent are “not at all” confident that Republicans in Congress and President Obama can work together.

When people in potentially affected states were asked how policymakers should respond at the state level, 69 percent say their states should act to create their own marketplace if necessary so residents could continue to access financial help.  This includes majorities of Democrats (82%), Republicans (58%) and independents (70%) in these states.

KFFMarchTrackingPoll-Chart2

This April also marks the first tax season when Americans are required to report their health insurance status on their tax return and potentially pay a penalty if they did not have coverage in 2014.

The poll finds majority of the public (53%) and the uninsured (57%) are aware that this is the first year they are required to report their health insurance status on their taxes; 32 percent of the public incorrectly names a different year, while 16 percent says they don’t know when it starts.  Similarly, a majority of the public (55%) is aware that people who got financial help from the government to pay for health insurance could owe money if their income or family size changed during the year, while smaller shares answer incorrectly (23%) or say they don’t know (22%).

In recent weeks, the federal government announced a special enrollment period during tax season, which allows people who owe the penalty because they were uninsured last year to buy coverage for this year. When asked their opinion on such a policy for the future, most (58%) say that uninsured people should be able to enroll in health insurance to avoid paying the fine again next year, while three in 10 (29%) oppose it, saying it would be unfair to those who signed up for coverage during the regular enrollment period.

The latest tracking poll was designed and analyzed by public opinion researchers at the Kaiser Family Foundation and was conducted from March 6-12 among a nationally representative random digit dial telephone sample of 1,503 adults. Interviews were conducted in English and Spanish by landline (600) and cell phone (903). The margin of sampling error is plus or minus 3 percentage points for the full sample. For results based on other subgroups, the margin of sampling error may be higher.

Poll Finding

Kaiser Health Tracking Poll: March 2015

Authors: Bianca DiJulio, Jamie Firth, and Mollyann Brodie
Published: Mar 19, 2015

Kaiser Health Tracking Poll: March 2015

As the Affordable Care Act (ACA) marks its fifth anniversary, this month’s poll finds the gap between favorable and unfavorable opinions of the law has narrowed to the closest margin in over two years. A majority continue to say their family has not been personally impacted by the law, but for those who report an impact, roughly equal shares report being helped as report being hurt – also a closer margin than previously measured.  

Although the Supreme Court heard oral arguments for the King v. Burwell case in early March, this month’s Kaiser Health Tracking Poll finds that the majority of the public continues to say they have heard only a little or nothing at all about the case. When presented with the hypothetical scenario that the Supreme Court rules in favor of the plaintiffs, many believe the decision would have a negative impact on the country as a whole, the uninsured, people receiving financial help from the government to buy insurance, and their own state. In response to such a decision, nearly two-thirds, including those in potentially impacted states, 1  say that Congress should pass a law so that people in all states can be eligible for health insurance subsidies – an opinion which holds true even when presented with arguments for or against Congressional action. In addition, 7 in 10 of those in the potentially affected states say states should act to create their own marketplace so that people could continue to access financial help.

The survey also includes a look at Americans’ experiences reporting their insurance status on their taxes for the first time, and finds that nearly half are unaware that the requirement to report health insurance status on their taxes takes effect this year. In addition, over 4 in 10 of the uninsured say they would remain without coverage even if they found out they had to pay a fine for not having coverage last year.


Opinion Of ACA Five Years After Passage

The health care law has been politically divisive since its passage in March 2010. However, the gap between favorable and unfavorable opinions of the law has narrowed to the closest margin in over two years, with 43 percent saying they have an unfavorable view and 41 percent saying they have a favorable one.  Just after the law was passed, the April 2010 Kaiser Health Tracking Poll found that opinion tilted positively, with 46 percent of the public reporting a favorable view and 40 percent reporting an unfavorable view.

Figure 1

This month, the gap in opinion narrowed somewhat among Democrats, independents and Republicans. Regardless, partisan division in opinion of the law remains. Most Republicans voice an unfavorable opinion (74 percent), most Democrats voice a favorable opinion (65 percent), and independents are more divided (37 favorable, 47 unfavorable).

Figure 2

When those who view the law favorably are asked to say in their own words why they like the law, the most commonly mentioned reason is that it will expand access to health care and health insurance (61 percent), that it will make health care more affordable (10 percent), and that Americans and the country will be better off in general (7 percent). When those with an unfavorable view are asked the reasoning behind their opinion, the most common mention is financial considerations, including concerns that health insurance and health care costs are increasing and that the law costs too much (26 percent), opposition to the individual mandate (18 percent), and concerns about government overreach (10 percent).

Figure 3

Personal Impact Of The Law

Consistent with previous Kaiser polls, the majority of the public (57 percent) says that the health care law has had no direct impact on their family. Although, this month, almost equal shares report that the law has helped them (19 percent) than report it has hurt them (22 percent). Republicans are more likely to say they have been hurt by the law (40 percent) than helped by it (8 percent), while Democrats are more likely to say the opposite, 27 percent who say they have been helped by the law compared to 8 percent say they’ve been hurt by it.

Figure 4

Those who report being helped by the law say that it allowed someone in their family to get or keep health coverage (9 percent), that it made it easier to get the health care they need (5 percent), or that it lowered their health care or insurance costs (4 percent).

The main reason named by those who report being hurt by the law is that it increased their health care or health insurance costs (14 percent). Smaller shares say that it made it more difficult to get the health care they need (4 percent) or caused someone in their family to lose their insurance (2 percent).

After Supreme Court Hearing, Views On King v. Burwell

The first week of March, the Supreme Court heard oral arguments in the King v. Burwell case about whether the health care law says that financial assistance to low and moderate income people is available in states that chose to use the federal health insurance marketplace rather than develop their own state-run marketplace. Even after these hearings, the case is not on the public’s radar. Just over half (53 percent) say they have heard nothing about the case and 25 percent say they have heard only a little, while about 2 in 10 (22 percent) say they have heard at least something about the case, a share that is somewhat higher than the 14 percent who said the same in January.

Figure 5

While most report not hearing much about the case, their impression is that if the Court sides with the challengers and limits subsidies to only those in states running their own marketplaces, the overall impact would be negative. A majority of the public, including majorities of Democrats, Republicans, and independents, says that if the Supreme Court rules in favor of the plaintiffs, the result would have a negative impact on the country (62 percent) and the uninsured (57 percent). In addition, across party lines, about half say the impact on people receiving financial help from the government to buy insurance would be negative.

Figure 6

Just under half (45 percent) say a ruling in favor of the plaintiffs would have a negative impact on their state, including 46 percent of those in potentially affected states. Views among those in states using the federal marketplace are similar across parties with nearly half of Democrats (46 percent), Republicans (46 percent), and independents (47 percent) saying the impact would be negative.

Figure 7

If the Supreme Court rules that financial help to buy health insurance is only available to low and moderate income people in states with state-run marketplaces, nearly two-thirds (65 percent) say that Congress should pass a law so that people in all states can be eligible for health insurance subsidies. Majorities of Democrats (81 percent) and independents (67 percent) favor Congressional action, while Republicans prefer Congress not act on the issue (56 percent, while 39 percent favor action). These findings are similar for those in potentially affected states.

After hearing arguments for or against Congressional action, majorities of the public continue to favor action.  When those who said they think Congress should pass a law heard that it “would make it harder for Republicans in Congress to make some major changes to the health care law,” 8 percent changed their view and say they now think Congress shouldn’t act on the issue, while over half (54 percent) continue to say that Congress should act.

Figure 8

On the other side, when those who said they didn’t think Congress should act on the issue heard “that if financial help is only available in states with state-run marketplaces, more than 7 million people in states that don’t run their own marketplace would lose their financial help to pay for health insurance” 12 percent changed their view to say that Congress should act.

Similarly, after hearing “if financial help is only available in states with state-run marketplaces, the cost of health insurance premiums would go up substantially for everyone buying their own insurance in states that don’t run their own marketplace” an additional 11 percent now say Congress should act.

Figure 9

But, the public has little faith that lawmakers could work together to resolve the issues created by a ruling in favor of the plaintiffs. Over half (56 percent) say they are not at all confident that Democrats and Republicans in Congress can work together on any issues raised by the ruling and a similar share (51 percent) are not at all confident that Republicans in Congress and President Obama can work together.

Figure 10

Those in states using the federal marketplace largely feel that if the Supreme Court ruling limits access to subsidies in states using the federal marketplace, states should act to create their own marketplaces so that people could continue to access financial help. Majorities of Democrats, Republicans and independents in the potentially affected states agree that states should act if needed, including about 6 in 10 Republicans (58 percent).

Figure 11

Tax Season and The ACA

This April marks the first tax season when Americans are required to report their health insurance status on their tax return. Over half of the public (53 percent) are aware that the requirement takes effect this year, for filing 2014 taxes, and a similar share (55 percent) know that when someone gets financial help from the government to pay their health insurance premium, it is possible that they would end up owing money to the government if their income or family size changes during the year. Three in 10 incorrectly say that the requirement does not take effect this year, either saying next year (20 percent), last year (11 percent) or some other year (1 percent), and 16 percent say they do not know. Nearly a quarter (23 percent) incorrectly say that it is not possible that someone would end up owing money if their income or family size change, and about 2 in 10 (22 percent) say they do not know. On these questions, the uninsured respond similarly to the public at large. For example, 57 percent of the uninsured are aware that this is the first year insurance status must be reported on taxes, and 28 percent of the uninsured say the reporting requirement starts a different year and 16 percent say they don’t know.

Figure 12

About 1 in 5 (18 percent) say they have already filed their taxes on their own, and another 26 percent say they have filed their taxes with a professional tax preparer. Three-quarters of those who report filing their taxes themselves (76 percent) say that they saw a place to indicate whether they had health insurance, while 24 percent say they didn’t see such a place (14 percent) or are unsure (10 percent). For the nearly half of Americans who report already filing their taxes on their own or with a tax preparer, 8 in 10 (79 percent) say they indicated that they had health insurance in 2014 while 10 percent say they had to pay a fine (or 5 percent overall), 4 percent say they were exempt and 7 percent say they didn’t know what they reported on their tax return.

Figure 13

Leading up to this tax season the Department of Health and Human Services and some states running their own exchanges announced that they would reopen the marketplaces for the uninsured who find out they have to pay a fine while filing their 2014 taxes.  This special enrollment opportunity would allow them to purchase insurance for 2015 even though the normal open enrollment deadline has already passed and enable them to avoid paying the penalty next year. When asked their opinion on such a policy, nearly 6 in 10 (58 percent) say that uninsured people should be given a special opportunity to enroll in health insurance to avoid paying the fine again the following year, while 3 in 10 (29 percent) believe providing such a special opportunity is unfair to those who signed up for coverage when they were supposed to during the regular enrollment period.

Congressional Next Steps

Although overall opinions of the law are more closely divided than they have been in the last couple of years, the public’s thoughts on what Congress should do next remain unchanged. About a quarter want Congress to expand what the law does (23 percent) or move forward with implementing it as is (23 percent), while 1 in 10 (10 percent) want Congress to scale back what the law does and 3 in 10 (30 percent) want them to repeal the law entirely. The public’s views on what Congress should do with the health care law vary greatly by party.

Figure 14

Knowledge Of ACA Provisions

Five years after the ACA’s passage and over one full year since the implementation of most of the law’s major provisions, the public is largely aware of many key elements of the law, but significant gaps in knowledge remain. Eighty-one percent say they know about the individual mandate, the law’s requirement that nearly all Americans have health insurance or else pay a fine. Somewhat smaller, although still large shares are aware that the law creates health insurance exchanges or marketplaces (66 percent), that it provides subsidies to low and moderate income Americans who don’t get insurance through their jobs (65 percent), and that it gives states the option of expanding Medicaid (60 percent). Still, other than the individual mandate, about a third are unaware that these provisions are part of the health care law.

Compared to when the law was first a passed in the spring of 2010, similar shares are currently aware that states can expand Medicaid under the law or that it creates marketplaces where people can shop for insurance. Awareness of financial assistance available under the law is somewhat lower now than it was after passage (65 percent in March 2015, compared to 75 percent in April 2010). Knowledge of the individual mandate, on the other hand, has increased in the past five years from 71 percent in April 2010 to 81 percent in March 2015).

Figure 15

The Uninsured

After the 2nd open enrollment period under the health care law comes to a close, nearly half of the uninsured (46 percent) say they don’t feel they have enough information to understand how the health care law will impact them or their family. About 6 in 10 of the uninsured (62 percent) say they have been without coverage for at least two years. Many uninsured (59 percent) expect to have to pay a fine for not having coverage in 2014.

Half of the uninsured (51 percent) expect to get health insurance in the coming months, but when asked specifically if they think they would enroll in health insurance if they found out they had to pay a fine for not having health insurance in 2014, over 4 in 10 of the uninsured (44 percent) say they would remain uninsured.

Figure 16

Kaiser Health Tracking Poll: March 2015 Methodology

This Kaiser Health Tracking Poll was designed and analyzed by public opinion researchers at the Kaiser Family Foundation (KFF). The survey was conducted March 6-12[1], 2015, among a nationally representative random digit dial telephone sample of 1,503 adults ages 18 and older, living in the United States, including Alaska and Hawaii (note: persons without a telephone could not be included in the random selection process). Computer-assisted telephone interviews conducted by landline (600) and cell phone (903, including 498 who had no landline telephone) were carried out in English and Spanish by Princeton Data Source under the direction of Princeton Survey Research Associates International (PSRAI). Both the random digit dial landline and cell phone samples were provided by Survey Sampling International, LLC. For the landline sample, respondents were selected by asking for the youngest adult male or female currently at home based on a random rotation. If no one of that gender was available, interviewers asked to speak with the youngest adult of the opposite gender. For the cell phone sample, interviews were conducted with the adult who answered the phone. KFF paid for all costs associated with the survey.

The combined landline and cell phone sample was weighted to balance the sample demographics to match estimates for the national population using data from the Census Bureau’s 2013 American Community Survey (ACS) on sex, age, education, race, Hispanic origin, nativity (for Hispanics only), and region along with data from the 2010 Census on population density. The sample was also weighted to match current patterns of telephone use using data from the January-June 2014 National Health Interview Survey. The weight takes into account the fact that respondents with both a landline and cell phone have a higher probability of selection in the combined sample and also adjusts for the household size for the landline sample. All statistical tests of significance account for the effect of weighting.

The margin of sampling error including the design effect for the full sample is plus or minus 3 percentage points. Numbers of respondents and margins of sampling error for key subgroups are shown in the table below. For results based on other subgroups, the margin of sampling error may be higher. Sample sizes and margins of sampling error for other subgroups are available by request. Note that sampling error is only one of many potential sources of error in this or any other public opinion poll. Kaiser Family Foundation public opinion and survey research is a charter member of the Transparency Initiative of the American Association for Public Opinion Research.

GroupN (unweighted)M.O.S.E.
Total1,503±3 percentage points
Party Identification
   Democrats438±6 percentage points
   Republicans344±6 percentage points
   Independents521±5 percentage points
Insurance Status
   Uninsured, ages 18-64133±9 percentage points
   Insured, ages 18-64992±4 percentage points
Federal/Partnership Marketplaces
  Total living in states with Federal/ Partnership marketplaces986±4 percentage points
  Democrats in Fed/Partnership marketplace states267±7 percentage points
  Republicans in Fed/Partnership marketplace states243±7 percentage points
  Independents in Fed/Partnership marketplace states346±6 percentage points
Followed News- Measles
  Followed story closely1116±3 percentage points
  Did not follow story closely377±6 percentage points
Half Samples
  Half Sample A742±4 percentage points
  Half Sample B761±4 percentage points


[1]       A small number of interviews were conducted on March 13.


Endnotes

  1. States with Federal/ Partnership marketplaces: AL, AK, AR, AZ, DE, FL, GA, IA, IL, IN, KS, LA, ME, MI, MO, MS, MT, NE, NC, ND, NH, NJ, OH, OK, PA, SC, SD, TN, TX, UT, VA, WI, WV, and WY. ↩︎

Community Health Centers: A 2013 Profile and Prospects as ACA Implementation Proceeds

Authors: Peter Shin, Jessica Sharac, Zoe Barber, Sara Rosenbaum, and Julia Paradise
Published: Mar 17, 2015

Executive Summary

In 2013, more than 1,200 federally funded community health centers provided access to care for low-income populations living in medically underserved communities throughout the country. The Affordable Care Act made expansion of health centers a key part of its strategy for ensuring that these communities would realize the benefits of increased health insurance coverage for their residents. As health insurance coverage expands under the Affordable Care Act (ACA) and the demand for primary care increases, the role of health centers is likely to increase. A key question going forward is whether health centers’ expanded capacity, developed over the past five years, will be sustained going forward.

2013 profile

  • Health centers’ safety-net role. In 2013, 1,202 federally funded health centers operating in 9,170 sites provided 61 million medical care visits, 11 million dental visits, 6.6 million visits for behavioral health needs, and 5.1 million visits for enabling services such as case management. In all, health centers provided more than 85 million visits. Another 100 “look-alike” health centers funded by states and localities served an additional 1 million patients. More than 70% of health center patients have income below 100% of the federal poverty level (FPL), which is $11,770 for an individual and $20,090 for a family of three in 2015. Nearly 60% are women; almost all (93%) are children and working-age adults. A majority of health center patients are people of color.
  • Health center patients. Over one-third (35%) of health center patients were uninsured in 2013, and 41% were covered by Medicaid. As the ACA is implemented, early evidence suggests that the proportion of insured patients in the health care system will grow substantially. At the same time, however, the uninsured rate among health center patients is expected to remain high, because millions of people who will remain uninsured lack other sources of care. In 11 states and the District of Columbia, health centers serve over 30% of the low-income population.
  • Scope of services. Health centers provide primary care spanning physical, dental, and behavioral health care. They also provide enabling services, such as translation and transportation, which help patients to access care. Between 2000 and 2013, the number of health centers offering dental and mental health services grew, by 22% and 81%, respectively, reflecting both increased federal resources and widespread need for such care. Although the percentage of health centers offering substance abuse services has declined slightly, dramatic growth in the number of health centers between 2000 and 2013 means also that the total number of health centers offering these services has increased.

Health centers and Medicaid

  • Medicaid support. In 2013, Medicaid provided 40% of health center operating revenues, making the program the single largest source of health center financing. Medicaid’s large financing role reflects the large share of health center patients covered by Medicaid, as well as Medicaid’s prospectively set, cost-based payment system, which is also used by Medicare, CHIP, and Qualified Health Plans sold in the ACA Marketplaces. Operating grants that health centers receive through the federal annual appropriations process provide crucial support for care for uninsured patients and for services not covered by insurance. The ACA augmented regular appropriations for health centers with a dedicated five-year, $11 billion Health Center Trust Fund that has supported the establishment of new health centers and sites and initiatives to build service capacity in key areas.
  • Health centers in Medicaid expansion versus non-expansion states before the ACA. Even before the ACA, health center patients in states that later expanded Medicaid were significantly more likely to be covered by Medicaid and less likely to be uninsured, compared to those in states that have not expanded Medicaid, reflecting broader Medicaid eligibility for adults in the pre-ACA period. By extension, health centers in expansion states also had higher revenues per patient and derived a larger share of their total revenues from Medicaid. Overall, leading up to 2014, they were in a stronger revenue position to expand patient capacity and the scope of their services, and their states’ decisions to expand Medicaid enhanced their position. About half of the 22 states that have not expanded Medicaid are southern states that have among the highest poverty rates in the nation as well as high uninsured rates. These states’ decisions not to expand Medicaid have a disproportionate effect on African-Americans, who reside in high numbers in the southern states and are more likely to be low-income and uninsured than the general population. One in four health center patients in the non-expansion states is African-American.
  • Health center opportunities and challenges under the ACA. The share of health center patients who are uninsured is expected to decline significantly because of expanded coverage under the ACA. However, especially in non-expansion states, health centers will continue to treat high numbers and shares of uninsured people. In addition, health centers can expect to face significant uncompensated care costs even for patients who are insured, attributable to cost-sharing for covered services that low-income patients may be unable to pay, treatments and services not covered by insurance, such as vision and dental care for adults, and care provided to insured patients in plans whose provider networks do not include their health center.

Looking ahead

The ACA made significant investments in health coverage and care for disadvantaged communities. As implementation of the health reform law continues, the experience of health centers serves as one bellwether of its impact on these communities. Measures of health centers’ scope and activity, and of rates of coverage and access among their patients, are important gauges of how the ACA goals are translating into improvements for the populations and communities most at risk of disparities in health and health care. Moving forward, analyses that investigate the implications of state Medicaid expansion decisions for health centers and their patients can illuminate the relationship among Medicaid expansion, health center capacity, and access to care.

Issue Brief

Introduction

Community health centers are an integral component of the health care safety-net in the U.S., providing access to care for over 21 million mostly low-income patients in medically underserved areas across the country. The Affordable Care Act (ACA) made a major investment in the health center program to help ensure access to care as coverage expands, establishing a five-year, $11 billion trust fund to support health center growth and new construction over five years, and providing $1.5 billion to expand the National Health Service Corps (NHSC), from which health centers recruit many of their clinical staff.

This brief is the latest in an annual series of updates on community health centers produced by the Kaiser Commission on Medicaid and the Uninsured in partnership with the George Washington University’s Geiger Gibson Program in Community Health Policy. It provides a current overview of community health centers, the patients they serve, the services they furnish, and the sources of their revenues. Finally, this report considers the prospects for sustaining and building on the gains in primary care access that have been achieved for medically underserved communities as a result of the Medicaid expansion and the Health Center Fund established under the ACA.

An Overview of Health Centers

Health Centers’ Safety-net Role

The community health centers program was established in 1965 by the Office of Economic Opportunity as a small demonstration program. Under Section 330 of the Public Health Service Act, which authorized the health centers program and is now a permanent authority under the ACA, health centers must satisfy five key requirements to receive federal grant funding. They must be located in or serve medically underserved communities and populations. Their doors must be open all patients, regardless of their ability to pay. They must furnish comprehensive primary health care, defined in both federal statute and regulations. They must prospectively adjust their charges in accordance with patients’ ability to pay (i.e., sliding scale fees). And they must be governed by community boards, at least 51% of whose members are health center patients.

Over the nearly five decades since the program was established, both the number of health centers and health center patient volume have grown substantially. In 2013, 1,202 federally funded health centers located in all 50 states, the District of Columbia (DC), and six U.S. Territories, and distributed about evenly between urban and rural areas, served 21.7 million patients in 9,170 different service delivery sites (Figure 1). In addition, 100 “look-alike” health centers, which meet all federal requirements but are supported with state and local funds rather than federal grants, served 1 million patients.

Figure 1: Community Health Centers: A National Snapshot, 2013

Two main factors have fueled health center growth. The first is the investment of federal grant funding to build and support health centers. The second is increased revenues from the Medicaid program due to both expansions of Medicaid coverage for low-income pregnant women, children, and parents over time, and Medicaid’s prospective, cost-based “Federally Qualified Health Center” (FQHC) payment methodology, which  also applies to payments made by Medicare, CHIP, and qualified health plans (QHPs) operating in the new health insurance Marketplaces. The FQHC rate enhances health centers’ capacity by covering much of the cost of care furnished to insured patients, which means that health centers do not have to use their grant funds to subsidize those patients, and can instead use their grants, as intended, to finance care for their uninsured patients and to expand both the scope of services they provide and the number of community locations in which they operate. Indeed, while health centers are serving increasing numbers of patients with Medicaid coverage, they are also serving more uninsured patients – 7.6 million in 2013, up from 4.9 million in 2003.1 

Health Center Patients

Reflecting the statutory mission of the health center program, almost three-quarters of health center patients have family incomes at or below 100% FPL (Figure 2). About six in ten patients are female. Working-age adults make up the largest share of health center patients – about 60% – while children account for roughly one-third, and about 7% are seniors. More than half (57%) of health center patients who report their race and ethnicity are people of color.

Figure 2: Profile of Health Center Patients, 2013

Consistent with their low income, a large share of health center patients are uninsured, and a large share have Medicaid coverage. In 2013, 35% of health center patients were uninsured (Figure 3), more than double the uninsured rate of 13% for the population overall.2  Similarly, 41% of health center patients were covered by Medicaid, compared to 16% of all Americans.

Figure 3: Health Center Patients, by Health Insurance, 2013

Health centers play a major role nationally in providing care for low-income populations and an even larger role in many states. In 22 states and DC, health centers serve at least one in five people with income below 200% FPL; in 11 of these states and DC, health centers provide care to more than 30% of the population with income at this level (Figure 4).

Figure 4: Share of Low-Income Population Receiving Care at Community Health Centers, by State, 2013

Health Center Volume, Services, and Staffing

In 2013, patients made 85.6 million visits to health centers (Figure 5). The vast majority of visits (71%) were for primary medical care. Visits for dental care (13%) accounted for the next largest share of the total, highlighting health centers’ important role of as a source of oral health care in underserved communities. Another 8% of all visits were for mental health or substance abuse treatment services. In addition to clinical services, health centers offer enabling services, such as case management, transportation, and interpretation services, which help address language, cultural, and other barriers facing low-income individuals and communities. Enabling services, such as case management, transportation, and interpretation services, accounted for 6% of all health center visits in 2013.

Figure 5: Health Center Visits, by Type of Service, 2013

Between 2000 and 2013, the number of health centers rose by two-thirds, from 730 to 1,202. Over this time period, both the number of patients served by health centers and the number of visits provided more than doubled (Table 1).

Table 1: Total health centers, patients, and visits,2000-2013
YearHealth centersPatients(millions)Visits(millions)
20007309.638.3
200284311.344.8
200491413.152.3
20061,00215.059.2
20081,08017.166.9
20101,12419.577.1
20121,19821.183.8
20131,20221.785.6

In addition, the scope of services available at many health centers expanded over this 13-year time period (as measured by the share of health centers reporting specified types of clinical staff). In particular, more than three-quarters of health centers offered dental services in 2013, compared to less than two-thirds in 2000 (Figure 6). The share offering mental health services grew even more dramatically, from 42% of health centers in 2000 to 76% in 2013. The fraction of health centers providing substance abuse treatment remained flat at about one-fifth over the period. Still, because of major growth in the number and patient capacity of health centers during this time, many more people using health centers now have access to these services.

Figure 6: Share of Health Centers Providing Dental, Mental Health, and Substance Abuse Treatment Services, 2000 and 2013

Health centers are major employers in their communities, bringing economic benefits as well as health care to the urban and rural areas they serve. In 2013, nearly 157,000 full-time equivalent (FTE) staff, including over 10,700 physicians and more than 5,100 nurse practitioners, worked in health centers; health centers employed an average of 130 FTEs.3 

Health Center Revenues

Health center revenues in 2013 totaled $15.9 billion. The single largest source of revenue was Medicaid, which accounted for 40%. Health center grants from the Bureau of Primary Health Care (BPHC), made up the second-largest share, accounting for 18%, and other federal grants provided 3%, while state, local, and private grants and contracts provided 14%. Private insurance, Medicare, and amounts paid directly by patients provided 8%, 6%, and 6% of health center revenues, respectively (Figure 7).

Figure 7: Health Center Revenues, by Source, 2013

Health Center Quality

The quality of care provided by health centers has been extensively researched, and studies dating back to the 1970s have documented positive outcomes associated with health centers. For example, one early study found evidence that health centers contributed to the decline in infant mortality between 1970 and 1978, particularly among African-American babies.4  More recent studies show that racial and ethnic disparities in rates of low birth weight babies are small in magnitude in health centers, and narrower compared to disparities in the total population.5  6  Other research also shows that health centers are associated with reduced disparities in health care based on race and ethnicity and insured status, and with reduced disparities in health.7 8  9 

Two studies point to improvements in selected outcomes associated with access to health center services in combination with health insurance coverage. One study, looking at the first 10 years in which the Medicare program was in effect, examined the impact of the earliest health centers, also established in that period, on mortality rates. The study findings suggest that health centers were associated with reductions in older adult mortality rates, and that increased use of primary care and access to lower-cost medication provided by health centers were likely important mechanisms.10  The other study, using more recent data, examined the association between health center use (a proxy for primary care access) by low-income Medicare beneficiaries and Medicare spending and clinical quality. The researchers found that, in regions where a relatively higher proportion of low-income residents were served by health centers, Medicare spending per beneficiary was significantly lower with no apparent compromise of clinical quality of care.11 

Despite serving some of the nation’s highest-risk, medically vulnerable populations, health centers provide effective care. Responding to needs in underserved communities, health centers focus on primary and preventive services, team-based care, and enabling services such as translation and transportation services and case management, which help populations who face significant barriers to access to obtain needed care. There is evidence that health centers provide better access to timely preventive services for vulnerable populations compared to typical primary care settings.12  For example, one study showed that uninsured patients who received care from health centers were 22% more likely to receive Pap tests than uninsured patients receiving care in other primary care settings.13  Health centers also perform at least as well as Medicaid MCOs on important measures of chronic care management (Figure 8).

Figure 8: Health Center Quality Performance Benchmarked to Medicaid MCOs, 2013

At the same time, health centers struggle to furnish adequate health care, especially for uninsured patients, for whom referrals to specialty care outside the health center are extremely difficult to arrange. Securing referrals for Medicaid patients can be difficult as well, but as health centers increasingly develop formal affiliations with integrated health care delivery systems that provide a full range of primary and specialty care, these problems may diminish. Virtually all health centers are included in Medicaid managed care plan networks, and many are part of provider networks offered by qualified health plans (QHPs) sold in the Marketplaces.

Health Centers and State Decisions about the ACA Medicaid Expansion

Under the ACA, federal grant funds continue to flow to health centers through the regular annual Congressional appropriations process. In addition, federal allocations from the ACA Health Center Trust Fund will continue through 2015. These two sources of federal grant funding have enabled health centers to grow in recent years to more fully meet the health care needs of their communities, including the uninsured. Increased awareness of health coverage options due to ACA-related outreach efforts, and modernized and streamlined Medicaid eligibility and enrollment systems required of all states under the ACA, have also contributed to higher participation in Medicaid among uninsured people who were previously eligible but not enrolled, potentially generating increased patient revenues for health centers.

State Medicaid expansion decisions have a separate, additional impact on health centers. States that expand Medicaid provide comprehensive benefits for low-income nonelderly adults, ensuring payment for health centers that serve these patients and enhancing their ability to furnish or arrange for a broader range of services. As outlined earlier, in 2013, a majority of health center patients were working-age adults (61%). Over 70% had income at or below 100% FPL and 35% were uninsured. This profile closely matches the target population for the ACA expansion of Medicaid. Thus, state decisions to expand Medicaid could have a large positive impact on access to coverage for adult health center patients. In the 29 states (including DC) that have expanded Medicaid to date, many poor, previously uninsured health center patients have now gained access to Medicaid coverage (Figure 9). Soon, federal data on health centers will provide official figures on growth in the number and share of health center patients with Medicaid or other coverage during 2014, the first year of full ACA implementation.

Figure 9: Current Status of Medicaid Expansion Decisions

In the 22 states that have so far not adopted the Medicaid expansion, close to 4 million nonelderly adults with income below 100% FPL fall into a coverage gap.14  This is so because they cannot qualify for tax subsidies to purchase QHPs sold in the Marketplace, which begin at 100%FPL. In 2013, 2.5 million uninsured adults in the 22 non-expansion states received health center services. Assuming that uninsured adult health center patients are equally as likely (72%) as uninsured adults overall to have income below 100% FPL, most of these health center patients could qualify for Medicaid if their state adopted the expansion. About half the 22 states that have not expanded Medicaid are southern states that have among the highest poverty rates in the nation as well as high uninsured rates. These states’ decisions not to expand Medicaid have a disproportionate effect on African-Americans, who reside in high numbers in the southern states and are more likely to be low-income and uninsured than the general population.15  African-Americans account for approximately one in four health center patients in the non-expansion states.16 

Data reported by the Centers for Medicare and Medicaid Services (CMS)17  indicate that Medicaid enrollment in the Medicaid expansion states grew by 27% between the summer of  2013 leading up to the first ACA open enrollment period, and December 2014. Even in the non-expansion states, Medicaid enrollment grew by 7%, meaning that  health centers in these states, too, can be expected to receive additional Medicaid patient revenues that may help support expanded clinical care capacity, although on a far more modest scale.

A comparison between health centers in the 29 Medicaid expansion states and the 22 non-expansion states back in 2013 reveals important differences between health centers in the two groups of states prior to full implementation of the ACA (Table 3).

Table 3: A comparison of health centers in Medicaid expansion and non-expansion states: patients, staffing, and revenues, 2013
Health centers in expansion states (n=690)Health centers in non-expansion states (n=483)
Total patients***21,09114,035
Location***
 Rural39%60%
 Urban61%40%
Health insurance profile of patients
Uninsured***33%44%
Medicaid***40%27%
Medicare**9%10%
Private insurance16%17%
Revenues
Total revenue per patient***$795$723
Medicaid share of revenues***36%23%
Medicaid revenue per Medicaid patient***$716$585
Medicare share of revenues**6%7%
Other public insurance share of revenues***2%1%
Private insurance share of revenues8%8%
Self-pay share of revenues***6%9%
Section 330 grants as share of revenues***23%35%
Total grants as share of revenues***43%52%
Staffing (per 10,000 patients)
Physicians***5.24.1
Mid-level professionals***4.55.3
Dental FTEs6.26.1
Mental health FTEs3.53.1
Substance abuse treatment FTEs**1.20.5
Enabling services***8.67.1
SOURCE: GWU analysis of 2013 UDS data on federally funded health centers. ***p<.01; ** p<.05Notes: Data do not include health centers in U.S. Territories.


  • Coverage. In 2013, before the ACA Medicaid expansion took effect, health center patients in the states now moving ahead with the expansion were already significantly more likely to be covered by Medicaid (40% vs. 27%), and significantly less likely to be uninsured (33% vs. 44%). Privately insured patients accounted for similar proportions of health center patients in both group of states. The differences in Medicaid and uninsured rates between health center patients in the two groups of states largely reflect much broader Medicaid eligibility for adults in the expansion states even before 2014 – as of January 2013, the median income eligibility threshold for working parents in the expansion states was 106%, compared to 48% FPL in the non-expansion states.18 
  • Revenues. Mirroring differences in the pre-ACA coverage status of their patients, health centers in expansion and non-expansion states also had distinctly different revenue profiles prior to the ACA. In 2013, average Medicaid revenue per Medicaid patient was significantly higher in health centers in the states that later expanded Medicaid, and Medicaid accounted for 36% of their operating revenues, compared to 23% in health centers in states that have not adopted the expansion. Heading into 2014, health centers in the non-expansion states were already significantly more dependent than those in Medicaid expansion states on federal section 330 grants (35% vs. 23% of operating revenues) and grant funding overall (52% vs. 43%), as well as on self-pay patient revenues (9% vs. 6% of total operating revenues).
  • Staffing. In 2013, health centers in the Medicaid expansion states had significantly higher ratios of physicians to patients but significantly lower ratios of mid-level professionals (such as nurse practitioners and physician assistants) to patients, relative to health centers in the non-expansion states. In part, this difference may reflect the fact that health centers in the non-expansion states are more likely to be located in rural areas, where physician supply is more limited. Health centers in expansion states also had significantly more staff capacity to provide enabling services and substance abuse treatment. Notably, however, dental and mental health staff capacity did not differ between health centers in the two groups of states.

Financial Challenges Facing Health Centers

The ACA investments in health centers and the NHSC are supporting substantial expansion of preventive and primary care capacity in underserved communities as coverage and the demand for care increase, and helping to ensure and improve access for those who remain uninsured. However, both the Health Center Trust Fund and the increase in NHSC funding are set to expire in 2015. Thus, health centers face increased financial challenges going forward.

The uninsured rate among health center patients is expected to decline significantly due to expanded coverage under the ACA – from 36% in 2012, to an estimated 20% by 2020 if the Medicaid expansion is fully implemented and 29% if it is not.19  Even so, health centers, even in Medicaid expansion states, are likely to continue to treat high numbers and shares of low-income patients without insurance. The health center experience in Massachusetts following the state’s 2006 expansion of coverage to adults with income up to 300% FPL may presage the situation of health centers under the ACA.20  Although the share of Massachusetts health center patients without insurance declined sharply due to the coverage expansion, health centers continue to a serve a population with a disproportionately high uninsured rate – about 19% compared to 4% statewide.21  In states not expanding Medicaid, nonelderly adults with income between 100% and 138% FPL are generally eligible for subsidies to purchase Marketplace health plans. However, many health center patients with income at this level may be unable to afford remaining cost-sharing obligations under these plans, as discussed below.

In addition to the costs of providing caring for those who remain uninsured, health centers may also face uncompensated care costs for patients who are insured, due to under-insurance and QHP provider network limitations:

  • Under-insurance. Under the ACA, people with income up to 250% FPL who purchase Silver plans can qualify for cost-sharing reductions. The reductions are substantial but do not eliminate cost-sharing, which can be considerable for individuals and families with low income. To illustrate, enrollees with income between 100% and 150% FPL have out-of-pocket obligations equivalent to 6% of covered costs in a Silver plan. Out-of-pocket exposure rises to 13% of covered costs for those with income between 150% and 200% FPL, and 27% of covered costs for families with income between 200% and 250% FPL.22  Cost-sharing reductions do not apply in the more affordable Bronze and catastrophic plans. When patients cannot afford their cost-sharing amounts, their providers must absorb the uncompensated costs.

    Although the cost-sharing reduction assistance has the potential to greatly increase the affordability of health care, even nominal cost-sharing can burden low-income health center patients. In communities where a sizeable proportion of health center patients have subsidized QHP coverage rather than Medicaid, health centers could still face uncompensated costs, depending on how health plans structure cost-sharing reductions – for example, if a plan requires relatively high cost-sharing for chronic care management, or for prenatal care that extends beyond routine screenings and encompasses treatment for conditions that could complicate pregnancy.23  Health centers may also incur uncompensated costs for services that are not covered by their patients’ QHPs, such as vision and dental services for adults. Grant funding for health centers continues to play a critical role in subsidizing these costs for insured patients as well as the costs of care for uninsured patients.

  • Medicaid and QHP provider network limitations. Federal standards do not require that either Medicaid plans or QHPs sold in the Marketplace include all health centers (or other “essential community providers,” the term used in the ACA to identify providers that specialize in the treatment of higher-risk and medically underserved populations) in their provider networks. Although health centers are expected to be available to all community residents, health plans in both markets maintain significant discretion in establishing their networks. To the extent that patients covered by Medicaid plans or health plans seek services at health centers that are out-of-network, health centers may be exposed financially as payment for the services may be denied or reduced. Research on the Massachusetts experience cited earlier highlighted the importance of network counseling as part of assistance with selecting a health plan, to protect established health center patients from inadvertently selecting a QHP that does not include their regular source of health care.24 

Looking Ahead

The ACA makes significant investments in health coverage and care for communities that are disadvantaged from an economic and health perspective. The law’s principal investment, of course, was the creation of pathways to affordable health coverage for low- and middle-income people, through Medicaid and tax subsidies. However, the Supreme Court’s decision on the Medicaid expansion has resulted in a coverage gap in the non-expansion states for millions of the poorest people in the nation, who are among those most likely to rely on community health centers for primary care. Should the Supreme Court decide in King v. Burwell that subsidies for Marketplace coverage are available only through state-based Marketplaces, health centers in the Medicaid non-expansion states, all but one of which defaulted to the federal Marketplace, will be exposed not only to the impact of the coverage gap on their poorest patients, but also to the impact of reduced access to private coverage for their patients with income at or above the federal poverty level. The other major ACA investment from the standpoint of health centers, the $11 billion dedicated trust fund, sunsets at the end of 2015. Whether the fund will be continued has become an increasingly important question, as the number of patients health centers serve is projected to fall by one-third – 7 million people – if it is not extended.25 

As ACA implementation continues, health centers serve as a bellwether of the impact of health reform on the nation’s most vulnerable communities. Several important questions offer a framework for ongoing analysis and evaluation:

  • What is the relationship between state Medicaid expansion decisions and health centers’ staffing and capacity?
  • How do health centers’ outreach and enrollment practices affect the rate at which their patients are able to gain and maintain coverage? What are health centers’ experiences in maintaining coverage for patients who move between Medicaid, CHIP, and Marketplace plans due to changes in eligibility?
  • What patterns emerge in Medicaid expansion states where uninsured populations and services are concerned? How do health centers with relatively larger proportions of uninsured patients compare with other health centers that may rely less on federal grants, in terms of growth in patient volume, patient-staffing ratios, range of services, and quality? To what extent do health centers leverage the increase in Medicaid revenue to expand access to care for the remaining uninsured?
  • Are health centers incurring uncompensated costs for patients enrolled in qualified health plans? To what extent are they able to negotiate inclusion in health plan networks?
  • How are health centers participating in or leading efforts to improve quality? How are they participating in health system transformation efforts? Can health centers, like other providers, move toward a payment system that is less encounter-based and more tied to performance measures?

Measures of health centers’ scope and activity, and of rates of coverage and access among their patients, are important gauges of how the ACA’s goals are translating into improvements for the populations and communities most at risk of disparities in health and health care. Moving forward, analyses that investigate the implications of state Medicaid expansion decisions for health centers and their patients can illuminate the relationship among Medicaid expansion, health center capacity, and access to care in underserved communities.

Funding support for this paper was provided to The George Washington University by the RCHN Community Health Foundation.

Endnotes

  1. Uniform Data System (UDS) Report, 2003. Bureau of Primary Health Care, Health Resources and Services Administration, U.S. Department of Health and Human Services. ↩︎
  2. Health Insurance Coverage of the Total Population, 2013,  State Health Facts, Kaiser Family Foundation, https://modern.kff.org/other/state-indicator/total-population/ ↩︎
  3. Bureau of Primary Health Care, Health Resources and Services Administration (2014), National 2013 Health Center Data. http://bphc.hrsa.gov/uds/datacenter.aspx?q=tall&year=2013&state= ↩︎
  4. Goldman F and Grossman M, The Impact of Public Health Policy: The Case of Community Health Centers, November 1982, National Bureau of Economic Research (NBER) Working Paper Series, http://www.nber.org/papers/w1020.pdf ↩︎
  5. Lebrun L et al., “Racial/Ethnic Differences in Clinical Quality Performance Among Health Centers,” Journal of Ambulatory Care Management, 2013, 36(1),  http://bphc.hrsa.gov/publications/racialdifferences.pdf ↩︎
  6. Shi L et al., “America’s Health Centers: Reducing Racial and Ethnic Disparities in Perinatal Care and Birth Outcomes,” Health Services Research, 2004, 39(6, Part 1), http://eds.b.ebscohost.com.proxygw.wrlc.org/eds/pdfviewer/pdfviewer?vid=1&sid=9557d0d8-e63e-4cc5-8d44-b10e851312de%40sessionmgr111&hid=111 ↩︎
  7. O’Malley A et al., “Health Center Trends, 1994-2001: What Do They Portend For the Federal Growth Initiative,” Health Affairs, March-April 2005: 24(2),  http://content.healthaffairs.org/content/24/2/465.full.pdf+html ↩︎
  8. Shi L et al., “Community Health Centers and Racial/Ethnic Disparities in Healthy Life,” International Journal of Health Services, 2001, 31(3), http://www.jhsph.edu/research/centers-and-institutes/johns-hopkins-primary-care-policy-center/Publications_PDFs/2001%20IJHS.pdf ↩︎
  9. Shi L et al., “Reducing Disparities in Access to Primary Care and Patient Satisfaction with Care: The Role of Health Centers,” 2013, Journal of Health Care for the Poor and Underserved, 21(1), http://www.ncfh.org/pdfs/2k12/9628.pdf ↩︎
  10. Bailey M and Goodman-Bacon A, The War on Poverty’s Experiment in Public Medicine: Community Health Centers and the Mortality of Older Americans (October 2014), NBER Working Paper Series, http://www.nber.org/papers/w20653.pdf ↩︎
  11. Sharma R et al., “Costs and Clinical Quality Among Medicare Beneficiaries: Associations with Health Center Penetration of Low-income Residents,” Medicare and Medicaid Research Review, 2014, 4(3),  https://www.cms.gov/mmrr/Downloads/MMRR2014_004_03_a05.pdf ↩︎
  12. Roby D et al., Exploring Healthcare Quality and Effectiveness at Federally-Funded Community Health Centers: Results from the Patient Experience Evaluation Report System (1993-2001), National Association of Community Health Centers, March 2003, http://www.nachc.com/client/PEERSreportfinal0226.pdf ↩︎
  13. Dor A et al., Uninsured and Medicaid Patients’ Access to Preventive Care: Comparison of Health Centers and Other Primary Care Providers, 2008, Policy Brief #4, Geiger Gibson Program/RCHN Community Health Foundation Research Collaborative, George Washington University, https://publichealth.gwu.edu/departments/healthpolicy/DHP_Publications/pub_uploads/dhpPublication_A5EFC6C5-5056-9D20-3DBB2F5E5B966398.pdf ↩︎
  14. Garfield R et al., The Coverage Gap: Uninsured Poor Adults in States that Do Not Expand Medicaid: An Update, Kaiser Family Foundation, 2014,  https://modern.kff.org/health-reform/issue-brief/the-coverage-gap-uninsured-poor-adults-in-states-that-do-not-expand-medicaid-an-update/ ↩︎
  15. Artiga S et al., The Impact of the Coverage Gap in the States not Expanding Medicaid by Race and Ethnicity, 2013, Kaiser Family Foundation, https://modern.kff.org/disparities-policy/issue-brief/the-impact-of-the-coverage-gap-in-states-not-expanding-medicaid-by-race-and-ethnicity/ ↩︎
  16. GWU analysis of 2013 HRSA UDS reports, http://bphc.hrsa.gov/healthcenterdatastatistics/statedata/index.html ↩︎
  17. Centers for Medicare and Medicaid Services, Medicaid and CHIP: December 2014 Monthly Applications, Eligibility Determinations and Enrollment Report, February 23, 2015, http://medicaid.gov/medicaid-chip-program-information/program-information/downloads/december-2014-enrollment-report.pdf ↩︎
  18. Heberlein M et al., Getting into Gear for 2014: Shifting New Medicaid Eligibility and Enrollment Policies into Drive, Appendix Table 2, 2013, Kaiser Commission on Medicaid and the Uninsured, Kaiser Family Foundation, https://modern.kff.org/report-section/getting-into-gear-for-2014-shifting-new-medicaid-eligibility-and-enrollment-policies-into-drive-section-2-medicaid-and-chip-eligibility-as-of-january-1-2014/ ↩︎
  19. Ku L et al., How Medicaid Expansions and Future Community Health Center Funding Will Shape Capacity to Meet the Nation’s Primary Care Needs: A 2014 Update, 2014, Policy Research Brief #37, Geiger Gibson/RCHN Community Health Foundation Research Collaborative, George Washington University, http://www.rchnfoundation.org/wp-content/uploads/2014/06/GG-caseload-impact-brief-6-19-14.pdf ↩︎
  20. Massachusetts Health Care Reform: Six Years Later, 2012, Kaiser Family Foundation,  https://modern.kff.org/health-costs/issue-brief/massachusetts-health-care-reform-six-years-later/ ↩︎
  21. GWU analysis based on 2013 Health Center Data: Massachusetts Program Grantee Data, http://bphc.hrsa.gov/uds/datacenter.aspx?q=tall&year=2013&state=MA,  and Current Population Survey, Annual Social and Economic Supplement, 2013, US Census Bureau (2014), http://www.census.gov/cps/data/cpstablecreator.html ↩︎
  22. Health Insurance Marketplace Calculator, Kaiser Family Foundation, https://modern.kff.org/interactive/subsidy-calculator/ ↩︎
  23. The list of preventive services for women that must be furnished free of charge, which can be found at https://www.healthcare.gov/preventive-care-benefits/women/, includes a variety of screening services including routine screenings and screening for conditions such as domestic violence.  However, conditions requiring treatment during pregnancy because of the risk of complications (e.g., gestational diabetes, high blood pressure) would not be considered part of the preventive services benefit for women and could be subject to cost sharing. See HRSA preventives guidelines at http://www.hrsa.gov/womensguidelines/ ↩︎
  24. Paradise J et al., Providing Outreach and Enrollment Assistance: Lessons Learned from Community Health Centers in Massachusetts, 2013, Kaiser Commission on Medicaid and the Uninsured, Kaiser Family Foundation, https://modern.kff.org/report-section/providing-outreach-and-enrollment-assistance-chcs-in-ma-introduction/ ↩︎
  25. Ku et al., op. cit.       ↩︎

How Much (More) Will Seniors Pay for a Doc Fix?

Authors: Cristina Boccuti and Tricia Neuman
Published: Mar 12, 2015

Unless Congress takes action prior to April 1, 2015, Medicare will be forced to cut the amount physicians are paid by 21 percent, the result of a payment formula known as the Sustainable Growth Rate (SGR) enacted as part of the Balanced Budget Act of 1997.  In all likelihood, the new Congress won’t let this cut happen.  Lawmakers have passed stop-gap legislation 17 times to override the SGR, both to prevent physicians from seeing a drop in their Medicare payments and to guard against potential physician access problems for beneficiaries.  None of these short-term “doc fixes” replaced the SGR outright.

Last year, Members of Congress in the House and Senate on both sides of the aisle came to consensus on a long-term alternative system for setting physician fees.  This proposal, now back on the table, would give physicians a choice of receiving performance-based payments from Medicare or added payments if they participate in delivery models that account for both spending and quality.  But, as in prior years, lawmakers have yet to come to agreement on the vexing issue of financing—and how to cover the federal cost of $175 billion over 10-years for this SGR replacement, as estimated by CBO. Among the more contentious issues is whether beneficiaries should pay more than they already would to help offset this cost to the federal government.

Medicare beneficiaries automatically contribute to the cost of repealing the SGR

Often overlooked in these discussions is the fact that, under current law, beneficiaries would automatically absorb their share of Part B costs associated with replacing the SGR.  Take the Part B premium, for example, which, by design, is set to cover 25 percent of Part B spending.  For every one dollar increase in Medicare Part B spending for physician and other Part B services, Medicare beneficiaries pay 25 cents in Part B premiums and Medicare pays the other 75 cents. In other words, both beneficiaries and Medicare would automatically incur costs that result from an SGR repeal—just as they have for previous SGR fixes.

We estimate that Medicare beneficiaries would automatically contribute $58 billion dollars over the next ten years in Part B premiums to replace the SGR along the lines of the leading bipartisan proposal (Figure 1).1   This $58 billion is likely a conservative estimate of beneficiary out-of-pocket spending associated with the proposed SGR repeal because it does not take into account the effects on Part B deductibles and coinsurance payments in traditional Medicare. These beneficiary out-of-pocket costs come on top of the $175 billion in new costs to the federal government, making the combined true cost of replacing the old payment formula at least $233 billion.

Figure 1: Medicare beneficiaries would automatically contribute nearly $60 billion in premiums over ten years to replace the SGR

How Will Congress Offset the Budgetary Cost of the ‘Doc Fix’:  Who Will Pay?

With strong interest in coming together to adopt the bipartisan alternative to the SGR, and finding a way to pay for it, one option under discussion would require beneficiaries to assume a portion of the $175 billion federal price tag, above what they will automatically pay in premiums and cost-sharing.  Examples of proposals with a direct cost to current or future beneficiaries include those that would raise the Part B deductible and home health copayments for people just coming on to Medicare, adopt more income-relating of Medicare Part B and D premiums, and prohibit first-dollar supplemental Medigap coverage.  Also on the table could be proposals to redesign Medicare’s deductibles and coinsurance (e.g., creating a single deductible and uniform coinsurance).  The effects of these proposals on beneficiaries would depend on their health needs and financial circumstances.

Proposals to raise out-of-pocket costs for people on Medicare are controversial not only because seniors vote, but also because half of all people on Medicare live on incomes of about $23,500 or less and seniors spend 3-times more than younger households on health care, as a share of their household budgets.

Other ways to pay for the SGR replacement have also been floated, including proposals that would achieve Medicare savings by reducing Medicare payments to health care providers or health plans or negotiating lower prescription drug costs.  In addition, some have proposed to look beyond Medicare for either savings or revenues, or strike a deal to fully or partially waive the pay-go budget requirements.  At the risk of understating the case, none of these financing proposals is a slam-dunk.

Is SGR patch #18 on the horizon, or will a deal finally be struck?

With the clock now ticking, it remains unclear how or if lawmakers will come to agreement on financing, despite the bipartisan, bicameral consensus on an alternative payment system for physicians.  This is the primary reason why Congress has been adopting short-term (cheaper) solutions, rather than a permanent fix.  If financing were not an issue, the SGR would likely have been replaced a long time ago. In the absence of consensus on offsets, SGR patch #18 could be fast approaching.  Or, just maybe, Congress will bypass the patch and produce the real deal.

  1. To derive these estimates, we divided $175 billion (CBO’s cost estimate of 10-year outlays for H.R.4015/S.2000) by 75 percent (Medicare’s share of Part B spending) to calculate total new Medicare spending for the alternative physician payment system—$233 billion. Under current law, beneficiary premiums would cover 25 percent of total costs, or $58 billion over ten years. In 2015, as in prior years, Part B premiums have taken into account increases in Part B spending due to the SGR overrides. Therefore, in 2016 and future years, the actual increase in the monthly Part B premium is likely to be incremental relative to 2015 levels (but not relative to current law which would result in an actual reduction in Part B premiums – and potentially serious physician access problems).  For example, according to the most recent Medicare Trustees report, the standard 2016 monthly Part B premiums are estimated to increase by $1.60,which assumes a fee-schedule update of 0.6 percent from 2015 (comparable to the 0.5 percent update in H.R. 4015/S.2000). ↩︎

The U.S. Global Health Budget: Analysis of the Fiscal Year 2016 Budget Request

Authors: Adam Wexler and Allison Valentine
Published: Mar 11, 2015

Overview

Figure 1: U.S. Global Health Funding, Request and Enacted, FY 2013‐FY 2016

The President’s Fiscal Year 2016 (FY16) budget request, which was released on February 2, 2015 and is a key step in the federal budget process, proposed $9.9 billion in specified funding for global health programs.1  If enacted by Congress, this would represent a decline from levels set in the FY15 Omnibus Appropriations bill (not including emergency funding for Ebola that was provided in the FY15 Omnibus bill[endnote 144628-13]).2  In each of the past three fiscal years (FY13-FY15), however, Congress has approved higher funding levels for global health than those proposed in the President’s budget request (see Figure 1).3 

In the FY16 request, the majority of U.S. global health funding is provided as a part of the international affairs budget, which includes programs at the U.S. Agency for International Development (USAID) and the Department of State.4  Despite the proposed decrease in in global health funding, the international affairs budget increased in the request.5  As a result, when measured as a share of the international affairs budget, global health would decline from 22% in FY15 to 18% in FY16 (see Table 1).

Figure 2: Global Health Programs (GHP) Account, FY 2001‐FY 2016 Request

Most of the global health budget ($8.2 billion) specified in the FY16 budget request is provided through the Global Health Programs (GHP) account at USAID and the State Department (see Figure 2). Within the GHP account, funding for tuberculosis (TB), neglected tropical diseases (NTDs), global health security (formerly pandemic influenza and emerging threats), nutrition, and vulnerable children would decline compared to FY15 enacted levels, while malaria, maternal and child health (MCH), and family planning and reproductive health (FP/RH) funding would increase (see Figure 3 and Table 2). Funding for bilateral HIV, through the President’s Emergency Plan for AIDS Relief (PEPFAR), would remain essentially flat. The base U.S. contribution to the Global Fund to Fight AIDS, Tuberculosis and Malaria (Global Fund) would decrease, although the State and Foreign Operations (SFOPs) Congressional Budget Justification (CBJ) states that this amount would fulfill the existing U.S. pledge to the Global Fund (see Global Fund section below). The proposed decrease for the Global Fund accounts for a significant share of the total decline in global health funding in the FY16 budget request.

Figure 3: Global Health Programs (GHP) Account, Funding Change by Sector, FY 2015–FY 2016 Request

When comparing the President’s budget requests over time, several trends emerge (see Table 3). For instance, looking at specific program areas, MCH is the only program with a proposed increase in each budget request over the period between FY13-FY16. During the same period, TB and the Global Fund are the only programs with a proposed decrease from the prior request; all other programs either increased or remained flat. More recently, proposed funding for all programs in the FY16 request matched the levels proposed in the FY15 request, with the exception of MCH, bilateral HIV, and the Global Fund (bilateral HIV and MCH increased, while the Global Fund decreased).

It is important to note that total discretionary funding in the FY16 budget request, which includes global health, exceeds the estimated budget cap instituted by the Budget Control Act of 2011.6  Therefore, if Congress were to enact the President’s budget request, it would need to adjust the existing cap for FY16, which is essentially equal to the FY15 level. Congress will begin drafting appropriations legislation in the coming months; whether or not Congress provides a higher level of global health funding than proposed in the President’s request, either under an adjusted cap or the existing cap, is unknown.

Analysis of Global Health Programs

This section provides an overview of global health funding levels by program area as proposed in the FY16 budget request (unless otherwise stated, all comparisons are to FY15 enacted levels).

PEPFAR/Bilateral HIV

Figure 4: Global Health Programs (GHP) Account, By Sector, FY 2016 Request

PEPFAR’s bilateral HIV funding through the GHP account totaled $4,649.5 million ($330 million at USAID and $4,319.5 million at the State Department), remaining essentially flat compared to the FY15 enacted level. Bilateral HIV accounts for the largest share (57%) of any program area within the global health portfolio under the GHP account (see Figure 4). Included within this amount is funding for microbicides research ($45 million) and the U.S. contribution to the Joint United Nations Programme on HIV/AIDS (UNAIDS) ($45 million). The FY16 request also included $300 million for a new “PEPFAR Impact Fund,” which would be provided to countries that work “to realign their national HIV/AIDS programs to focus on the highest-burden areas and sites, leveraging improved site-level data.”

The FY16 request also included $462.2 million for HIV research activities at the National Institutes of Health (NIH) and $128.4 million in HIV funding through the Centers for Disease Control and Prevention (CDC); NIH funding is a slight increase ($11 million), while the CDC amount matches the FY15 enacted levels. The FY16 request did not include any funding for HIV programs at the Department of Defense (DoD) (the FY15 enacted level was $8 million).

Global Fund to Fight AIDS, Tuberculosis and Malaria

The FY16 budget request included $1,106.5 million for the Global Fund to Fight AIDS, Tuberculosis and Malaria (Global Fund), a $243.5 million (-18%) decrease compared to the FY15 enacted level. The FY16 budget request states that the $1,106.5 million would fulfill “President Obama’s pledge to provide $1 for every $2 pledged by other donors to the Global Fund and completing the U.S. commitment to the 2014-2016 replenishment,” which was made at the Global Fund’s 4th Replenishment Conference held in December 2013.7 

Tuberculosis

Funding for tuberculosis (TB) programs through the GHP account totaled $191 million, which is $45 million(-19%) below the FY15 enacted level. Tuberculosis funding is also provided through the Economic Support Fund (ESF) account and totaled $4.0 million in the FY16 request (tuberculosis funding provided through the ESF account in FY15 is not yet known; in FY14, it was $6.5 million).8  Additional support for TB programs is provided through bilateral HIV programs (GHP account) at the State Department to address TB/HIV co-infection.9 

Malaria

Malaria funding totaled $674 million through the GHP account in the FY16 budget request and was one of only three program areas under the GHP account that increased above the FY15 enacted level (by $4.5 million or 1%). The budget request also included $173.0 million for malaria research activities at NIH and $10.7 million in malaria funding through the CDC; NIH funding is a slight increase ($4 million), while the CDC amount matched the FY15 enacted level ($10.7 million). Additional malaria funding through DoD is not yet known (in FY14, it was $17.2 million).

Family Planning & Reproductive Health

Family planning and reproductive health (FP/RH) funding through the GHP account totaled $538 million and was one of only three program areas under the GHP account that increased (by $14.1 million or 3%) from the FY15 enacted level. Additional FP/RH funding provided through the ESF account totaled $39.6 million, which is $11.4 million (-22%) below the FY15 enacted level. The FY16 budget request also included $35 million for the U.S. contribution to the United Nations Population Fund (UNFPA), matching the FY15 enacted level.

Maternal & Child Health

Funding for maternal and child health (MCH) through the GHP account totaled $770 and was one of only three program areas under the GHP account that increased (by $55 million or 8%) from the FY15 enacted level. This includes $535 million in funding for bilateral programs and a $235 million contribution to Gavi, the Vaccine Alliance (Gavi). Additional MCH funding provided through the ESF account totaled $87.5 million (MCH funding provided through the ESF account in FY15 is not yet known; in FY14, it was $114.2 million). Specific components of MCH funding include:

  • Gavi, the Vaccine Alliance: During the Gavi pledging conference held in January 2015, the U.S. government committed $1 billion for the FY15-FY18 period. The U.S. contribution to Gavi in the FY16 budget request, which is included under MCH funding in the GHP account, is $235 million, a $35 million (18%) increase above the FY15 enacted level.
  • Polio: U.S. funding for polio programs is provided through USAID (as part of MCH funding via the GHP and ESF accounts) and CDC. Polio funding through USAID totaled $50 million ($43.5 million through the GHP account and $6.5 million through the ESF account), a $9.0 million (-15%) decrease from the FY15 enacted level. Polio funding through the CDC totaled $168.8, a $10 million (6%) increase above the FY15 enacted level.
  • United Nations Children’s Fund (UNICEF): The U.S. contribution to UNICEF, which is provided through the International Organizations and Programs (IO&P) account, totaled $132 million in the FY16 budget request, matching the FY15 enacted level.10 

Nutrition

Nutrition funding in the request through the GHP account totaled $101 million, a $14 million (-12%) decrease below the FY15 enacted level. Additional nutrition funding in the FY16 request totaled $31.5 million through the ESF account and $8.5 million through the Development Assistance (DA) account (nutrition funding provided through these accounts in FY15 is not yet known; in FY14, there was no nutrition funding provided through the DA account, while $23.7 million was provided through the ESF account).11 

Vulnerable Children

Funding for vulnerable children, which is provided via the Displaced Children and Orphans Fund (DCOF), totaled $14.5 million in the GHP account, a $7.5 million (-34%) decrease below the FY15 enacted level. The decrease in funding for vulnerable children was the largest percentage decrease among all areas under the GHP account.

Global Health Security Agenda

The Global Health Security Agenda, an effort launched in February 2014 aimed at improving global capabilities to prevent, detect, and respond to epidemics and other emerging public health threats, includes funding from multiple agencies. At USAID, funding for global health security (formerly pandemic influenza and other emerging threats) is provided through the GHP account and totaled $50 million in the FY16 budget request, a decrease of $22.5 million (-31%) below the FY15 enacted level. Funding for Global Public Health Protection at CDC, which includes funding for Global Disease Detection and Emergency Response as well as Global Public Health Capacity Development, totaled $76.7 million in the FY16 budget request, a $21.6 million (39%) increase over the FY15 enacted level.

Other Global Health Funding

The U.S. provides additional global health funding in support of water, sanitation, and hygiene (WASH) activities, for international global health research efforts conducted through the Fogarty International Center (FIC) at NIH, and for multilateral organizations, such as the World Health Organization (WHO) and the Pan American Health Organization (PAHO), that play an important role in addressing global issues. The FY16 request included $228.0 million in funding for WASH activities provided through multiple accounts and programs (since WASH is considered a cross-cutting issue supported through direct funding as well as funding provided through other programs, such as HIV and MCH, it is not included within the overall global health total in order to prevent double-counting). The FY16 request also included $69.5 for FIC, a slight increase above the FY15 enacted level, as well as a $114.0 million contribution to WHO and a $66.1 million contribution to PAHO, both of which essentially match FY15 enacted levels.

Analysis of Other International Development Programs

The FY16 budget request also proposed funding for areas and agencies that are not directly focused on U.S. global health, but are related and may impact these efforts including: the Millennium Challenge Corporation (MCC), Feed the Future (FTF), which is the U.S. Government’s global hunger and food security initiative, broader food assistance through Food for Peace (FFP)12  and McGovern-Dole International Food for Education and Child Nutrition Program (McGovern-Dole), and other funding through the State & Foreign Operations Development Assistance (DA) and ESF accounts (see Table 4). Within the budget request, funding for the MCC ($1,250 million) increased by more than $350 million (39%) above the FY15 enacted level, while funding for McGovern-Dole remained flat and FFP declined (-$66 million or -4.5%). The FY16 budget request included $978.0 million for FTF ($900.3 million through the DA account and $77.7 million through the ESF account), which is $22.6 million (-2%) below the FY15 enacted level.

Table 1: Share of Global Health Funding in the International Affairs Budget (Base Funding), FY 2012 – FY 2016 Request
FY12(million)*FY13(million)**FY14(million)***FY15 Omnibus (millions)FY16 Request (millions)
Global Health****$9,792$9,562$10,130$10,085$9,853
of which International Affairs$8,793$8,607$9,019$8,972$8,700
International Affairs*****$54,368$51,906$50,885$50,886$54,814
of which Base (Enduring)$43,165$41,084$44,365$41,628$47,766
of which Overseas Contingency Operations (OCO)$11,203$10,822$6,520$9,258$7,047
Global Health share of International Affairs Budget (Base Funding)20.4%20.9%20.3%21.6%18.2%
NOTES:*FY12 totals are final funding amounts (see FY14 State and Foreign Operations Congressional Budget Justification).**FY13 totals are final funding amounts and include the effects of sequestration (see FY15 State and Foreign Operations Congressional Budget Justification).***FY14 totals are final funding amounts (see FY16 State and Foreign Operations Congressional Budget Justification).****Global Health represents total known funding provided through the State Department, USAID, CDC, NIH, and DoD. Malaria funding through the DoD is not yet known for FY15 and FY16; for comparison purposes, this funding has been removed from prior years. Some global health funding provided through the Economic Support Fund (ESF) and Development Assistance (DA) accounts is not yet known for FY15. For comparison purposes, the FY15 global health total assumes that the ESF and DA accounts are funded at levels equivalent to the FY16 request. (The FY16 request represents the lowest level of global health funding through the ESF and DA accounts since FY07. As such, using the FY16 request as an estimate for the ESF and DA accounts in FY15 is likely a conservative estimate.)*****International Affairs is Function 150 Account only and includes both base (enduring) and Overseas Contingency Operations (OCO) funding. OCO has historically included some funding for global health programs, but this amount is not yet known for the FY16 Budget Request. The majority of U.S. global health funding is provided as part of base (enduring) funding.
Table 2: U.S. Funding for Global Health Programs, FY 2015 Omnibus – FY 2016 Request
Department / Agency / AreaFY15 Omnibus(millions)FY16 Request(millions)Difference(millions, %)
USAID – Global Health Programs (GHP)
HIV/AIDS$330.0$330.0$0(0%)
Tuberculosis$236.0$191.0$-45(-19.1%)
Malaria$669.5$674.0$4.5(0.7%)
Neglected Tropical Diseases (NTDS)$100.0$86.5$-13.5(-13.5%)
Global Health Security*$72.5$50.0$-22.5(-31%)
Maternal & Child Health (MCH)$715.0$770.0$55(7.7%)
of which GAVI$200.0$235.0$35 (17.5%)
of which Polio$51.5$43.5$-8 (-15.5%)
Nutrition$115.0$101.0$-14(-12.2%)
Vulnerable Children$22.0$14.5$-7.5(-34.1%)
Family Planning & Reproductive Health (FP/RH)**$524.0$538.0$14.1(2.7%)
Total USAID:$2,784.0$2,755.0$-28.9 (-1%)
State – Global Health Programs (GHP)
HIV/AIDS Bilateral$4,320.0$4,319.5$-0.5(0%)
of which UNAIDS$45.0$45.0$0 (0%)
Global Fund***$1,350.0$1,106.5$-243.5(-18%)
Total State:$5,670.0$5,426.0$-244 (-4.3%)
Total GHP – State & USAID
Total USAID & State GHP:$8,454.0$8,181.0$-273 (-3.2%)
State & Foreign Operations – Economic Support Fund (ESF)****
TuberculosisNot Yet Known$4.0
Maternal & Child Health (MCH)Not Yet Known$87.5
of which Polio$7.5$6.5$-1 (-13.3%)
HIVNot Yet Known$0.2
NutritionNot Yet Known$31.5
Family Planning & Reproductive Health (FP/RH)**$51.1$39.6$-11.4(-22.4%)
State & Foreign Operations – Development Assistance (DA)****
NutritionNot Yet Known$8.9
State & Foreign Operations – International Organizations & Programs (IO&P)
United Nations Children’s Fund (UNICEF)$132.0$132.0$0(0%)
United Nations Population Fund (UNFPA)**$35.0$35.0$0(0%)
State & Foreign Operations – Contributions to International Organizations (CIO)
World Health Organization (WHO)$113.7$114.0$0.3(0.3%)
Pan American Health Organization (PAHO)$65.7$66.1$0.4(0.6%)
National Institutes of Health (NIH)
HIV Research$451.2$462.2$11(2.4%)
Malaria Research$169.3$173.0$3.7(2.2%)
Fogarty International Center (FIC)$67.8$69.5$1.7(2.5%)
Centers for Disease Control and Prevention (CDC)
Global HIV/AIDS$128.4$128.4$0(0%)
Global Immunization$208.6$218.6$10(4.8%)
Polio Eradication$158.8$168.8$10 (6.3%)
Other Global/Measles$49.8$49.8$0 (0%)
Parasitic Disease and Malaria$24.4$24.4$0(0%)
Global Public Health Protection$55.1$76.7$21.6(39.1%)
Total CDC:$416.5$448.1$31.6 (7.6%)
Department of Defense (DoD)*****
HIV/AIDS$8.0$0.0$-8(-100%)
Total Global Health Funding
Total Global Health Funding:$10,084.6$9,852.6$-232 (-2.3%)
NOTES:*Formerly Pandemic Influenza and Other Emerging Threats.**The FY15 Omnibus (P.L. 113-235) states that, of the funding appropriated for bilateral assistance, “not less than $575,000,000 should be made available for family planning/reproductive health.” The bill also provides an additional $35 million as the U.S. contribution to the United Nations Population Fund (UNFPA).***The FY16 Department of State, Foreign Operations, and Related Programs Congressional Budget Justification (CBJ) states that the $1,107 million for the Global Fund included in the FY16 Budget Request would fulfill “President Obama’s pledge to provide $1 for every $2 pledged by other donors to the Global Fund and completing the U.S. commitment to the 2014-2016 replenishment.”****Some global health funding provided through the Economic Support Fund (ESF) and Development Assistance (DA) accounts is not yet known for FY15. For comparison purposes, the FY15 global health total assumes that the ESF and DA accounts are funded at levels equivalent to the FY16 request. (The FY16 request represents the lowest level of global health funding through the ESF and DA accounts since FY07. As such, using the FY16 request as an estimate for the ESF and DA accounts in FY15 is likely a conservative estimate.)*****Malaria funding provided through the DoD is not yet known for FY15 and FY16.
Table 3: Comparison of U.S. Funding for Global Health Programs, FY 2013 Request – FY 2016 Request
Department / Agency / AreaFY13 Request (millions)FY14 Request (millions)FY15 Request (millions)FY16 Request (millions)
USAID – Global Health Programs (GHP)
HIV/AIDS$330.0$330.0$330.0$330.0
Tuberculosis$224.0$191.0$191.0$191.0
Malaria$619.0$670.0$674.0$674.0
Neglected Tropical Diseases (NTDS)$67.0$85.0$86.5$86.5
Global Health Security*$53.0$47.0$50.0$50.0
Maternal & Child Health (MCH)$578.0$680.0$695.0$770.0
of which GAVI$145.0$175.0$200.0$235.0
Nutrition$90.0$95.0$101.0$101.0
Vulnerable Children$13.0$13.0$14.5$14.5
Family Planning & Reproductive Health (FP/RH)$530.0$534.0$538.0$538.0
Total USAID:$2,504.0$2,645.0$2,680.0$2,755.0
State – Global Health Programs (GHP)
HIV/AIDS Bilateral$3,700.0$4,020.0$4,020.0$4,319.5
of which UNAIDS$45.0$45.0$45.0$45.0
Global Fund**$1,650.0$1,650.0$1,350.0$1,106.5
Total State:$5,350.0$5,670.0$5,370.0$5,426.0
Total GHP – State & USAID
Total USAID & State GHP:$7,854.0$8,315.0$8,050.0$8,181.0
NOTES:*Formerly Pandemic Influenza and Other Emerging Threats.**The FY16 Department of State, Foreign Operations, and Related Programs Congressional Budget Justification (CBJ) states that the $1,107 million for the Global Fund included in the FY16 Budget Request would fulfill “President Obama’s pledge to provide $1 for every $2 pledged by other donors to the Global Fund and completing the U.S. commitment to the 2014-2016 replenishment.”
Table 4: Other Related Non-Global Health Funding, FY 2015 Omnibus – FY 2016 Request
Department / Agency / AreaFY15 Omnibus (millions)FY16 Request (millions)Difference(millions, %)
Development Assistance (DA) account (SFOPs)$2,507.0$2,999.7$492.7(19.7%)
Economic Support Fund (ESF) account*$4,746.8$6,135.5$1388.7(29.3%)
of which Overseas Contingency Operations (OCO)$2,114.3$2,183.3$69.1 (3.3%)
Feed the Future (FtF) Initiative**$1,000.6$978.0$-22.6(-2.3%)
Global Agriculture and Food Security Program (GAFSP)***$43.0
McGovern-Dole International Food for Education and Child Nutrition Program$191.6$191.6$0(0%)
Food for Peace (FFP-Title II)$1,466.0$1,400.0$-66(-4.5%)
Millennium Challenge Corporation (MCC)$899.5$1,250.0$350.5(39%)
NOTES:*The FY16 Department of State, Foreign Operations, and Related Programs Congressional Budget Justification (CBJ) states that the FY15 funding level includes an estimated transfer of $29.9m in accordance with the FY15 Omnibus bill.**The FY15 Omnibus bill states that, of the funds appropriated for bilateral assistance, “not less than $1,000,600,000 should be made available for food security and agricultural development programs.”***The FY15 Omnibus bill states that, of the funding appropriated for bilateral assistance programs, a portion “may be made available as a contribution to the Global Agriculture and Food Security Program if such contribution will not cause the United States to exceed 33 percent of the total amount of funds contributed to such program.” The FY16 Department of State, Foreign Operations, and Related Programs Congressional Budget Justification (CBJ) states that the $43 million for GAFSP “is enough to match $86 million in new commitments from other donors, in line with the United States’ pledge to provide $1 for every $2 provided by other donors.”


  1. This total represents data obtained from the Department of State, Foreign Operations, and Related Programs FY 2015 Congressional Budget Justification, the National Institutes of Health FY 2015 Congressional Justification, the Centers for Disease Control and Prevention FY 2015 Congressional Justification, and through direct communication with the White House Office of Management and Budget. Some global health funding provided through the Department of Defense (DoD) is not yet known for FY16. Global health totals do not include MCH and nutrition funding provided through the Food for Peace (FFP-Title II) program; funding through the FFP-Title II program is provided in the form of food aid and is not included due to the unique design of the program. ↩︎
  2. The “Consolidated and Further Continuing Appropriations Act, 2015” (P.L. 113-235) specified global health funding through the State Department, USAID, CDC, and DoD. NIH research totals for HIV in FY15 was obtained from the NIH FY16 Congressional Justification and the malaria research amount was obtained from the NIH Research, Condition, and Disease Categorization (RCDC) database. Some global health funding provided through the Department of Defense (DoD) is not yet known for FY15 and FY16. Some global health funding provided through the Economic Support Fund (ESF) and Development Assistance (DA) accounts is not yet known for FY15. For comparison purposes, the FY15 global health total assumes that the ESF and DA accounts are funded at levels equivalent to the FY16 request. (The FY16 request represents the lowest level of global health funding through the ESF and DA accounts since FY07. As such, using the FY16 request as an estimate for the ESF and DA accounts in FY15 is likely a conservative estimate.) ↩︎
  3. Kaiser Family Foundation analysis of data from the Office of Management and Budget, Agency Congressional Budget Justifications, Congressional Appropriations Bills, and U.S. Foreign Assistance Dashboard [website], available at: http://www.foreignassistance.gov. Some global health funding provided through the Department of Defense (DoD) is not yet known for FY15 and FY16; for comparison purposes, funding provided through the DoD has been removed from prior years. Some global health funding provided through the Economic Support Fund (ESF) and Development Assistance (DA) accounts is not yet known for FY15. For comparison purposes, the FY15 global health total assumes that the ESF and DA accounts are funded at levels equivalent to the FY16 request. (The FY16 request represents the lowest level of global health funding through the ESF and DA accounts since FY07. As such, using the FY16 request as an estimate for the ESF and DA accounts in FY15 is likely a conservative estimate.) ↩︎
  4. The international affairs budget (also known as the Function 150 account) includes funding provided through multiple appropriations bills including: Department of State, Foreign Operations, and Related Programs; Agriculture; and Commerce, Justice, and Science (see Congressional Research Service, State, Foreign Operations, and Related Programs: FY2015 Budget and Appropriations, December 8, 2014). ↩︎
  5. The international affairs budget is comprised of base funding, which supports enduring programs, and funding for Overseas Contingency Operations (OCO), which has been defined by the Administration as “extraordinary, but temporary” funding supporting efforts in Iraq, Afghanistan, and Pakistan (see Congressional Research Service, State, Foreign Operations, and Related Programs: FY2015 Budget and Appropriations, December 8, 2014). The global health funding from USAID and the State Department detailed in this analysis is part of base funding in the international affairs budget. In the FY16 request, the total international affairs budget (base and OCO) was $54.8 billion, an increase of approximately $3.9 billion from FY15 enacted level. Base funding was $47.8 billion in the FY16 request, an increase of $6.1 billion from the FY15 enacted level, while OCO funding totaled $7.0 billion in the FY16 request, a $2.2 billion decrease from the FY15 enacted level. ↩︎
  6. The Budget Control Act (BCA) of 2011 (P.L. 112-25) implemented caps on total discretionary spending, which was divided into two categories – defense and non-defense – for FY13 through FY21. The BCA also established the Joint Select Committee on Deficit Reduction (Super Committee), which was tasked with creating a plan to achieve an additional $1.2 trillion in savings. The failure of the Super Committee to agree to a plan resulted in forced cuts to the existing budget caps (sequestration). The non-defense discretionary (NDD) spending total, including the effects of sequestration, is estimated to be $493 billion for FY16. See Congressional Budget Office (CBO), Final Sequestration Report for Fiscal Year 2015, January 2015, and Congressional Research Service (CRS), The Budget Control Act and Trends in Discretionary Spending, November 26, 2014. ↩︎
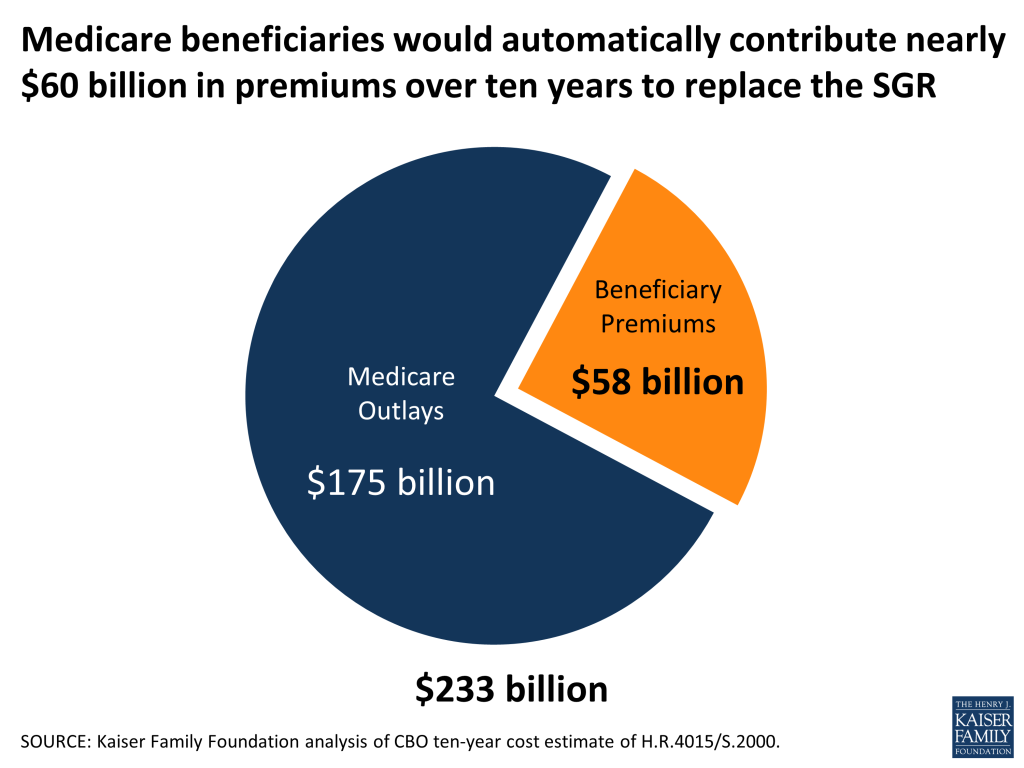
  7. Congress has stipulated that total U.S. contributions to the Global Fund may not exceed 33% of total contributions from all donors; a requirement that has been in place since the original authorization of PEPFAR in 2003. ↩︎
  8. The Economic Support Fund (ESF) account provides funding for both health and non-health programs as part of the overall U.S. foreign policy efforts (see Congressional Research Service, State, Foreign Operations Appropriations: A Guide to Component Accounts, January 13, 2015). ↩︎
  9. The FY16 request included $153.0 million in TB funding provided through bilateral HIV programs (GHP account) at the State Department (see U.S. Department of State, Congressional Budget Justification, Foreign Operations, Appendix 2, February 27, 2015). TB funding provided through bilateral HIV programs (GHP account) at the State Department is not known for prior years. ↩︎
  10. The International Organizations and Programs (IO&P) account “provides voluntary donations through the Department of State to support the programs of international agencies involved in a range of development, humanitarian, and scientific activities, including the U.N. Development Program (UNDP), U.N. Environment Program (UNEP), U.N. Children’s Fund (UNICEF), and U.N. Population Fund (UNFPA)” (see Congressional Research Service, State, Foreign Operations Appropriations: A Guide to Component Accounts, January 13, 2015). ↩︎
  11. The Development Assistance (DA) account provides funding for both health and non-health programs as part of the overall U.S. foreign policy efforts (see Congressional Research Service, State, Foreign Operations Appropriations: A Guide to Component Accounts, January 13, 2015). ↩︎
  12. Funding for Food for Peace (FFP-Title II) supports the provision of food aid to address both emergency and non-emergency needs. ↩︎

JAMA Forum: Of SCOTUS and Chicken

Author: Larry Levitt
Published: Mar 11, 2015

Larry Levitt’s March 2015 post explores what could happen if the U.S. Supreme Court rules for the plaintiffs in the King v. Burwell case, the lawsuit that challenges the federal government’s authority to provide financial assistance to people who buy insurance in federally-operated marketplaces created by the Affordable Care Act. The post is now available at The JAMA Forum.

Other contributions to The JAMA Forum are also available.