News Release

In 73 Percent of Counties, Healthcare.Gov Enrollees Could Lower Their Silver Plan Premiums by Comparison Shopping

Published: Nov 18, 2015

A new analysis from the Kaiser Family Foundation finds that in 73 percent of counties served by Healthcare.gov, people enrolled in the lowest-cost silver plan this year could save money on premiums by switching to a different silver plan in 2016. In these counties, the silver plan with the lowest premiums in 2015 is no longer the lowest-cost plan in 2016, according to the analysis.

If they stay in their current plan, Healthcare.gov enrollees who purchased the lowest-cost silver plan in 2015 would have an average premium increase of 15 percent, the analysis finds. The lowest-cost silver plan is the most popular selection in the Affordable Care Act marketplaces.

Over the course of a year, a 40-year-old switching to the lowest-cost silver plan in 2016 could save an average of $322 in premiums, the analysis finds. The average premium savings could be more than $500 per year in 16 percent of counties.

Potential Savings from Actively Shopping for Marketplace Coverage in 2016 is available at kff.org.

For more analysis of the 2016 Affordable Care Act marketplace, see:

Potential Savings from Actively Shopping for Marketplace Coverage in 2016

Published: Nov 18, 2015

When shopping for 2016 coverage on Healthcare.gov, the first question asked of the consumer is whether she is currently enrolled in coverage in 2015.  If she is renewing coverage, she can then compare her current plan to other options available through the Marketplace next year.  There are a number of important factors for her to consider in deciding whether to keep her current plan, including the monthly premium, as well as the deductible, the plans’ provider networks, and their drug formularies.

It is possible, however, is that this enrollee would never take that step to go back to Healthcare.gov and shop for 2016 coverage. Generally, enrollees who do not actively shop by December 15 will be automatically renewed into the same or a similar plan beginning January 1, 2016. Last year, continuing enrollees were roughly split between active and passive renewals. Of the 4.2 million people who reenrolled during the 2015 open enrollment period, 2.2 million (53%) were active shoppers and the remaining 2.0 million (47%) were renewed automatically. Because the market can change rapidly in the first few years of its existence – particularly with new insurer entrants or exits, and swings in premiums as plans vie for market share – there is concern that those who passively renew may no longer be in the plan that is best suited for them.

To demonstrate the importance of actively purchasing, we look at how the premiums for the lowest cost silver plans changed between 2015 and 2016. Using publicly available data on Healthcare.gov, we track premiums of the 2015 lowest cost silver plans (in states that used Healthcare.gov in both 2015 and 2016) for a single 40 year old adult, to see how much these premiums are increasing in 2016 before and after subsidies, and whether enrollees could obtain lower premiums by switching to a lower cost plan.

For the counties we analyzed, consumers enrolled in the lowest cost silver plan in 2015 would see an average premium increase of 15% if they automatically enroll (or chose to stay) in the same plan in 2016, before any tax credit. However, many of these enrollees would be able to find a lower cost silver plan in 2016; in 73% of counties, their plan would no longer the lowest cost option in 2016. Among those who switch to a different low-cost plan, their average premium saving would be $322 over the course of the year. As the lowest cost silver plan is the most popular type of plan on the Marketplace, this suggests that a substantial share of enrollees could save money on their monthly premium by shopping and switching into a different plan in 2016.

Premium Changes in 2015 Lowest Cost Silver Plans

The silver plan that was the lowest cost plan in 2015 is not guaranteed to be the lowest cost option in 2016. As an example, the lowest cost silver plan in Dallas, TX was offered by Blue Cross and Blue Shield of Texas at $279 per month for an unsubsidized 40 year old in 2015. If the person in Dallas continued in his plan, he would have to pay $353 per month in 2016, or an increase of 27%. If he was willing to switch to the new lowest cost silver plan in 2016 offered by Molina, he would pay $260 per month, a decrease of 7% compared to what he paid in 2015.

In the 2,365 counties we examined across 36 states, a 40-year-old paid an average of $264 per month for the lowest cost silver plan in 2015 before accounting for subsidies.  The average 40-year-old premium for the 2016 lowest cost silver is $283 before subsidies, meaning that the lowest cost option for a silver plan in 2016 is 7% higher than the lowest cost option in 2015. In most cases, however, these are not the same plans. If a consumer was enrolled in the lowest cost silver plan in 2015 and either passively renewed or wanted to stay in his current plan, he would pay an average of $304, an increase of 15%.

People receiving tax credits could see very different percent increases by staying in their current plan. The amount of the credit is based on the cost of the second-lowest silver (“benchmark”) plan in a given year and enrollees must pay a defined percentage of their income, plus the difference in premium between their plan and the benchmark plan. A 40-year-old making $30,000 a year, for example, would see a 10% average increase by renewing into the 2015’s lowest cost silver plan. A 40-year-old making $20,000 per year would see a 28% average increase by renewing into this year’s lowest cost silver plan. As most enrollees had incomes below 200% of poverty, this is likely more representative of the percent increase an enrollee would face by renewing into the same plan that had been the lowest silver plan in 2015.

Premium Savings from Switching Plans

In 1,721 (73%) of counties included in this analysis, the silver plan that was the lowest in 2015 is no longer the lowest in 2016. The following section is limited just to these counties where a consumer would have the option of staying in the 2015 lowest-cost silver plan or switching to the new lowest-cost silver plan.

In these counties, a single 40-year-old making $20,000 per year paid an average of $75 per month for the 2015 lowest cost silver plan. If he automatically renewed in coverage for 2016, his premium would increase to an average of $103 per month, which is 37% higher. If he was willing to switch to the new lowest-cost silver plan, however, he would pay an average of $76 for his monthly premium, or just 1% more than he paid in 2015.

Table 1: Changes in Lowest-Cost Silver Marketplace Premiums from 2015 – 2016, by Income

Among Consumers who have an Option to Stay or Switch to a New Low Cost Silver

For a single 40 year old with an income of:Average Monthly Premium IncreaseAverage Percent Increase

Stay in 2015 Lowest Silver

Switch to 2016 Lowest Silver

Stay in 2015 Lowest Silver

Switch to 2016 Lowest Silver

$20,000 / year

(170% of poverty; higher tax credit)

$28$137%1%
$30,000 / year

(255% of poverty; lower tax credit)

$28$114%0%
$50,000 /year

(425% of poverty; unsubsidized)

$44$1717%6%
Source: Kaiser Family Foundation analysis of 2015 and 2016 Marketplace Landscape Files.

In each of these examples, the enrollee would pay an average of about $27 per month less if they switch to the new lowest cost plan. Because even subsidized enrollees have to pay this difference, regardless of income, a 40-year-old could save $27 per month by switching plans. But for someone who is lower income, and receiving a larger tax credit, $27 per month is also a larger percentage increase relative to what they paid in 2015.As income rises people receive less financial assistance, and therefore would see lower average percent increases. A single 40-year-old making $30,000 per year paid an average of $199 per month for the 2015 lowest cost silver plan. If he automatically renewed in coverage for 2016, his premium would increase to an average of $227 per month, or 14 higher%. If he was willing to switch to the new lowest-cost silver plan, however, he would pay an average of $200 for his monthly premium, or essentially the same as what he paid in 2015.

Over the course of a year, a 40-year-old would save an average of $322 by switching from the 2015 lowest silver to the new lowest cost silver in 2016. This savings varies widely, though, from less $4 in several Michigan counties to as much as $1,589 in two counties south of Indianapolis. In 1,343 counties (57%), the average premium savings would be more than $100 per year, and in 372 counties (16%), the average premium savings would be more than $500 per year.

Although premium savings may be realized by switching plans, doing so can also come with tradeoffs. In 994 (58%) of the counties where consumers could realize savings from switching plans, they would have to switch insurance carriers in order to take advantage of a lower-cost silver plan. Doing so may mean having to change doctors or other providers. Consumers should also carefully review a new plan’s deductible, copayments, and drug coverage.

Conclusion

As a policy tool, auto-enrollment is beneficial in that it prevents many enrollees from becoming uninsured unintentionally, and enrolling them into the same or a comparable plan makes it likely they will have similar out-of-pocket expenses and also more likely they will be able to keep their same provider network. The potential downside of auto-enrollment, however, is that some consumers will face higher premium increases than they would if they actively shopped.

As roughly half of the renewals during the last open enrollment period were active, it appears that enrollees in this market are price-sensitive and willing to leave one plan for another if they perceive that it is a better value to them. Enrollees who switch plans to a new low-cost silver option, though, should not only consider their monthly premium, but also the plan’s cost sharing structure, its provider network, and drug coverage. Although both plans may be in the same metal level and therefore will have the same average value across the enrolled population, depending on personal health needs, one enrollee may fare better in one silver plan than another.

Methods

This analysis is based on Healthcare.gov 2015 and 2016 QHP Landscape files downloaded on November 5, 2015.  Premiums for the lowest cost silver plan in each county (where the state used Healthcare.gov as its enrollment platform in both years) were tracked from 2015 to 2016 using the plan crosswalk file provided by HHS. Counties where the lowest cost plan is no longer offered and where there is no crosswalk to a new plan in 2016, as well as all counties in New Mexico were removed (because an insurer is known to be missing from this state’s data). This resulted in 9% of counties being excluded from the analysis. The first section of the findings is based on the remaining 2,365 counties in 36 states. The second section of the analysis is based only on the 1,721 counties (73% of 2,365) where the lowest cost silver plan is still being offered but is no longer the lowest cost option in 2016.  All averages are weighted by county-level signups as of the end of 2015 open enrollment.

News Release

Visualizing Health Policy: Experiences and Attitudes of Primary Care Practitioners After the ACA

Published: Nov 17, 2015

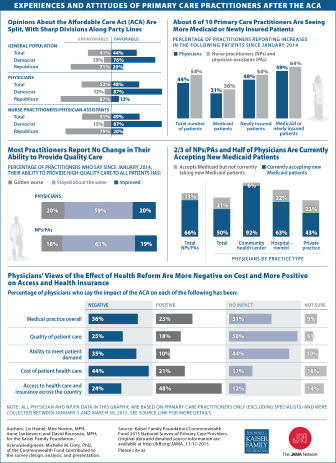
Based on a survey of primary care clinicians in early 2015, this Visualizing Health Policy infographic examines the experiences and attitudes of primary care practitioners (PCPs) after the Affordable Care Act’s (ACA’s) major coverage provisions took effect in January 2014. Although most report no change in their ability to provide quality care, their opinions about the health care law are sharply divided along political party lines. Generally, primary care physicians have a more negative view of health reform’s effect on the cost of patient care, but a more positive view of the law’s impact on patient access to health care and insurance. About 6 of 10 primary care clinicians say they’re seeing more newly insured patients or patients covered by Medicaid since the ACA’s major coverage provisions took effect in January 2014. Large shares—66% of nurse practitioners and physician assistants and 50% of physicians—report that they’re currently accepting new Medicaid patients.

Visualizing Health Policy is a monthly infographic series produced in partnership with the Journal of the American Medical Association (JAMA). The full-size infographic is freely available on JAMA’s website and is published in the print edition of the journal.

Visualizing Health Policy: Experiences and Attitudes of Primary Care Practitioners After the ACA

Published: Nov 17, 2015

Based on a survey of primary care clinicians in early 2015, this Visualizing Health Policy infographic examines the experiences and attitudes of primary care practitioners (PCPs) after the Affordable Care Act’s (ACA’s) major coverage provisions took effect in January 2014. Although most report no change in their ability to provide quality care, their opinions about the health care law are sharply divided along political party lines. Generally, primary care physicians have a more negative view of health reform’s effect on the cost of patient care, but a more positive view of the law’s impact on patient access to health care and insurance. About 6 of 10 primary care clinicians say they’re seeing more newly insured patients or patients covered by Medicaid since the ACA’s major coverage provisions took effect in January 2014. Large shares—66% of nurse practitioners and physician assistants and 50% of physicians—report that they’re currently accepting new Medicaid patients.

jama_2015nov_physiciansandACA

Visualizing Health Policy is a monthly infographic series produced in partnership with the Journal of the American Medical Association (JAMA). The full-size infographic is freely available on JAMA’s website and is published in the print edition of the journal.


View Source Slides

Patient Cost-Sharing in Marketplace Plans, 2016

Published: Nov 13, 2015

Private insurance plans typically require some form of cost sharing (also called out-of-pocket costs) when enrollees receive a health care service covered by their plan.  These expenses, which are in addition to the amount an enrollee spends on his or her monthly premium, come in a variety of forms:

  • Copayments: set dollar amounts for covered services (e.g. $20 per general physician visit);
  • Coinsurance: a percentage of the allowed cost for covered services (e.g. 20% of the allowed cost for a specialist visit);
  • Deductibles: set dollar amounts that enrollees must pay before their plan starts to cover the service or a group of services (e.g. $200 drug deductible before drug coverage begins);
  • And, often, some combination thereof.

Insurers use cost sharing to keep down monthly premiums in a couple of ways.  First, cost sharing can directly offset premiums by transferring some of the overall costs from monthly payments to payments at the time medical care is used.  A second way cost sharing has a downward effect on premiums is by decreasing the amount of health care enrollees use: when a charge is required at the point of care, people tend to utilize fewer services.

Cost sharing can also lead to unexpected costs for some enrollees and can be difficult to decipher when shopping for plans or reviewing medical bills.  Although the Affordable Care Act (ACA) requires significantly greater standardization and transparency for individual market coverage than existed before the law went into effect, the answer to the main question on many enrollees’ minds – ‘How much will I spend on health care?’ – is not always straightforward.

This brief shows the cost sharing in plans sold to individuals through Healthcare.gov for 2016, with a focus on the variation in the ways plans may set cost sharing for services, such as physician visits, prescription drugs, and hospital stays.

Changes to Cost Sharing under the Affordable Care Act

The ACA requires new private plans sold to individuals to standardize their coverage and the information they provide to enrollees in a variety of ways:

  • New plans (both on and off of the Marketplace) must cover at least a basic set of services called Essential Health Benefits (though cost sharing may apply to these services, this provision helps limit out-of-pocket costs by ensuring that a minimum set of services are covered).
  • Certain preventive services, such as flu shots and mammograms, must be covered without cost sharing.
  • The ACA also sets out-of-pocket limits (which are caps on the amount of annual cost sharing that enrollees may be charged for covered services that are received from in-network providers). In addition, the law does away with annual limits on coverage a plan may pay out.
  • New plans are now standardized into “metal” tiers – bronze, silver, gold, and platinum – ranging from most to least potential exposure to out-of-pocket costs. The metal tiers are based on a concept called actuarial value, which is the percent of total costs for all enrollees’ covered services that are paid for by the insurer, on average, as opposed to those costs paid for by enrollees.  For example, a bronze plan has an actuarial value of approximately 60%, meaning that the insurer expects to pay for 60% of total costs associated with covered medical services, and that – as a group – the enrollees would pay for the remaining 40% of total costs through their combined copayments, coinsurance, and deductibles.
  • Cost-sharing reductions are available to low-to-moderate income Marketplace enrollees. These cost-sharing subsidies, unlike the more widely known premium tax credit, are only available to people who have incomes between 100 and 250 percent of poverty, and who enroll in a silver plan through the Marketplace.  The subsidies work by increasing the actuarial value of a silver plan to be 73, 87, or 94 percent, depending on income. For the lower-income recipients of these subsidies, their out-of-pocket maximums for silver plans will resemble those of gold or platinum plans.  (Although the ACA originally called for out-of-pocket maximums to be lowered for enrollees with incomes between 250 and 400 percent of poverty, this was unable to be achieved in combination with the prescribed actuarial value requirements and was changed during the regulatory process.)

An important note is that each of these changes to cost sharing from the ACA, including the calculation of actuarial value, only applies to services offered by in-network providers.  Insurers may require enrollees to pay significantly more for out-of-network providers, and plans are not required to offer a cap on expenses enrollees may incur for out-of-network care.  Some plans offered on the marketplaces may have limited networks, which only include a limited number of hospitals or physicians in the network.

The ACA requires insurers to make publically available a consumer-friendly, standardized document called a Uniform Summary of Benefits and Coverage (SBC).  The SBC summarizes each product’s required cost sharing for in-network and out-of-network services, and is intended to be standardized in a way that allows people shopping for a plan to make “apples-to-apples” comparisons.

Cost Sharing in Marketplace Plans in 2016

Even with this move toward standardization, Marketplace plans still vary quite a bit.  Plans offered in the same state and within the same metal level may have very different cost-sharing structures.  This is in part because there are many ways plans can set cost sharing and still achieve a given actuarial value.

Example of Variation in Marketplace Cost Sharing:

A silver level plan in Texas has a $5,900 deductible, $0 copay for physician visits and no cost sharing for inpatient care after the deductible is met.

Another silver plan in Texas has no deductible, but a $30 copay for physician visits and a 40% coinsurance for inpatient care.

Both plans have an actuarial value of approximately 70%, but the same person may fare very differently in one plan than the other, depending on his or her health care needs in a given year.

This analysis looks at the variation in Marketplace products offered in 2016 within and across metal levels.  As the source of the data is Healthcare.gov, this analysis is limited to plans sold to individuals in the 38 states with a federally facilitated or partnership Marketplace (including New Mexico, Oregon, Hawaii and Nevada).  The data were de-duplicated so that each unique product was only counted once per state, and we excluded child-only and catastrophic plans. (Catastrophic plans are essentially identical in their cost-sharing structures).  We do not include cost-sharing reduction plans in this analysis; we will be looking at those plans in a separate brief.  For more details on analysis methods, see the Methods section at the end of the brief.

Deductibles

Aside from the premium, deductibles are one of the main features that consumers look to when shopping for a health plan. The majority of bronze plans and silver plans have what are called “combined” deductibles, meaning that there is a single deductible for both medical services and prescription drugs.  The plan typically will not begin covering most medical or prescription services until the deductible has been met (though many health plans do not apply the deductible toward certain services).  The average combined deductible for 2016 is $5,765 for bronze plans (up from $5,328 in 2015) and $3,064 for silver plans (up from $2,556 in 2015). Because plans have to meet the same actuarial value standards as last year, these increases in deductibles are likely offset by decreases in other forms of patient-cost-sharing.

Medical and Prescription Drug Deductibles

Most gold and platinum plans, and many silver plans, have separate medical and drug deductibles (or, in some cases, have no deductible for prescriptions).  Enrollees in plans with separate deductibles will begin to receive payment towards their prescriptions once they meet their prescription deductible (or immediately if there is no deductible) even if they have not yet met their medical deductible.  Conversely, if an enrollee in one of these plans meets their medical deductible, the plan would then start covering medical services even if the enrollee had not yet reached the drug deductible. In plans with separate medical deductibles, the average bronze deductible is $5,500 and the average platinum deductible is $409 (including many plans with $0 medical deductibles).

Many silver plans with separate deductibles (58 percent) and most gold and platinum plans with separate drug deductibles (65 percent and 93 percent, respectively) have $0 drug deductibles and therefore begin to pay toward prescriptions immediately.

Separate Drug Deductibles


Inpatient Facility Stays

Most plans have some form of cost sharing that applies when an enrollee enters the hospital as an inpatient. This can be one of the more confusing areas of cost sharing, primarily due to the interaction between the cost sharing for the hospitalization and any general medical deductible the plan may have.  Some plans are fairly clear: an enrollee must meet the general medical deductible before any costs for a hospitalization are covered, after which the enrollee may have no additional cost sharing or may have to pay a portion of any costs above the deductible amount.  In these arrangements, coinsurance is the most typical form of additional cost sharing.

Other plans are more complicated.  Some plans do not apply the general medical deductible to inpatient hospital stays, but have a separate deductible or sizeable copayment that applies to the hospital stay. A copayment may be per stay (i.e., on payment per admission) or it may be assessed for each day of the stay, typically up to a maximum number of days (e.g. $600 per day for up to three days). The patient then often must pay a portion of the additional costs above their separate deductible or copayment, typically in the form of coinsurance.  In addition, there are plans that only apply a coinsurance percentage to inpatient hospital stays.

Inpatient Facility Cost Sharing

In the charts, plans with coinsurance and copayment amounts include plans that apply a general medical deductible to inpatient hospital and those that do not because we are unable to separate the cases accurately.

Inpatient Physician Services

In many plans, enrollees are required to pay a percentage of the cost of physician services that they receive in a hospital through coinsurance.  In many of these cases the enrollee must first meet the general medical deductible and then pay a portion of the additional costs through coinsurance.

In a large share of plans, the cost sharing for inpatient physician services is the same as for inpatient facility services. For example, each may require the enrollee to pay a coinsurance rate after the general medical deductible has been met. In some cases, however, plans have a copayment for inpatient hospital services, and then no charge or coinsurance for inpatient physician services.

Inpatient Physicians Cost Sharing


Physician Office Visits

Most plans require enrollees to pay cost sharing when they visit a physician’s office, other than certain preventive care visits where cost sharing is prohibited.  Most plans require a copayment when enrollees have a primary care or specialist office visit.  Coinsurance is much more common among bronze plans (28%) than in the other metal levels.

Many plans require enrollees to first meet the general medical deductible before any payment is made toward office visits.  Some plans will pay toward a small number of office visits (e.g., 3) before an enrollee has met the general medical deductible, but then do not make payments towards additional office visits until after the general medical deductible has been met. Many of these plans require that the enrollee pay a copayment toward the cost of the limited number of covered visits before the deductible has been met, and to pay coinsurance towards the cost of visits that occur after the deductible has been met.

Specialist and Primary Care Physician Office Visits


Emergency Room Visits

There is a mix of cost-sharing approaches for emergency room visits, which in some ways resemble the cost sharing for inpatient hospital stays.  Many plans use either a copayment or coinsurance, and in some of these cases there is no coverage until after the general medical deductible has been met.  Other plans have both a copayment and coinsurance for an emergency room visit; in some of these plans the general medical deductible does not apply, but enrollees must pay a specified copayment and coinsurance for a portion of the costs above the copayment.

Emergency Room Cost Sharing


Prescription Drugs

As mentioned above, plans also vary in how deductibles apply to prescription drugs.  Some plans apply the general medical deductible to prescriptions, which means that no payments are made for prescriptions until an enrollee has met his or her medical deductible.  Other plans have a different (generally lower) deductible that applies specifically to prescriptions, while some have no deductible and begin paying toward prescriptions right away. Bronze plans are more likely to have a general medical deductible that includes prescriptions while plans in the other three metal levels are more likely to have separate prescription drug deductibles (or no deductible for prescriptions).

Most health plans classify drugs in three or four different groupings, or tiers.  The tiers reflect where the drug is on the health plan’s drug list, or formulary.  Most plans have at least three tiers: generic drugs, preferred brand-named drugs, and non-preferred brand-named drugs. Many plans also have a fourth tier for specialty drugs (e.g., injectable drugs).

Prescription Drug Cost Sharing

The amount and type of cost sharing within plans varies across these drug tiers.  Generally, enrollees face lower cost sharing for generic and preferred brand-named drugs and higher cost sharing for non-preferred brand-named drugs and specialty drugs.  Plans will have different cost-sharing requirements for drugs on different tiers either to encourage enrollees to use lower cost alternatives or to pass on more of the cost of some drugs.  There are plans with copayments and plans with coinsurance in each drug tier; copayments are more common for generic drugs. Some plans have no additional cost sharing once an enrollee meets the applicable deductible.

The level of cost sharing also varies across the metal tiers of plans:  for example, copays are likely to be higher in bronze plans than in more expensive plans for each of the drug tiers (in plans that require copayments, the average copayment amount for preferred brand-named drugs is $67 for bronze plans, $48 for silver plans, $39 for gold plans, and $30 for platinum plans).

Out-of-Pocket Maximums

An out-of-pocket maximum is the maximum dollar amount that an enrollee is required to spend on covered services received from network providers in a year.  After an enrollee meets the out-of-pocket maximum, the plans pays 100% of covered services.  Health plans sold in the Marketplace must have an out-pocket maximum for in-network services of no more than $6,850 for an individual plan and $13,700 for a family plan.  Almost all plans offered on the exchange have a combined out-of-pocket maximum for medical and prescription drugs.  Forty-seven percent of bronze plans and 35% of silver plans have an out-of-pocket maximum for single coverage at the $6,850 limit.

Out-of-Pocket Maxiumums


Discussion

Many provisions of the Affordable Care Act, including the requirement that plans cover essential health benefits and limits on out-of-pocket maximums, have increased standardization among health plans.  Plans also are now required to meet specific actuarial value targets known to consumers through the plan’s metal level.  Even with these provisions, there is still considerable variation in the design of plans being offered on the federal marketplace, and plans in the same metal level may have significantly different cost sharing for the same service in the same area.  Plans may take very different approaches and still reach the same actuarial value: for example, some plans have large deductibles with little cost sharing after the deductible has been met while others have no or small deductibles but require patients to pay a substantial percentage of the cost at the point of service through high coinsurance rates.  Other plans are in the middle, having both deductibles and meaningful copayment or coinsurance requirements.

Given the difference in plans, enrollees may prefer some plans’ designs over other designs, based on their health needs and the types of services they believe they may use.  Enrollees also need to think about how they would pay for the required cost sharing should they become seriously ill; in other words, can they afford to pay the maximum out-of-pocket amount required by their plan. It is important that enrollees consider the cost of using their plan as well as the premium when they are shopping for coverage.

Methods

Data were obtained from the Data.HealthCare.gov 2016 QHP Landscape files on November 3, 2015. Plans analyzed include those offered in 2016 in the 38 states using Healthcare.gov (which includes federally facilitated, supported, and partnership Marketplaces, including Oregon, New Mexico, Nevada and Hawaii).

Child-only and catastrophic plans were removed, and the remaining unique records (those with identical cost-sharing structures from the same issuer) were collapsed by state, thereby removing duplications where the same plans are offered in multiple counties within the state. The analysis does not include variations on cost sharing made available through cost-sharing reductions for lower income enrollees and Native Americans.  We removed information for three plans (Arches Mutual Insurance Company, Health Republic Insurance Company, and Meritus Health Partners) because they are not offering plans in 2016.

The analysis relies on data downloaded through Healthcare.gov. We did not attempt to verify each description and did not alter any of the information from the downloaded file, which means that some of the plans may be misclassified for certain cost-sharing provisions.

Averages are simple averages and not weighted by enrollment as plan-level enrollment data are not publicly available.

Matthew Rae, Larry Levitt, Gary Claxton, Cynthia Cox, and Michelle Long are with the Kaiser Family Foundation. Anthony Damico is an independent consultant to the Kaiser Family Foundation.
News Release

Donor Government International Funding for Family Planning Increased By 9 Percent In 2014

Published: Nov 12, 2015

A new Kaiser Family Foundation report finds that donor governments provided US$1.4 billion in bilateral funding for family planning programs in low- and middle-income countries in 2014 – a 9 percent increase from 2013 and a 32 percent increase from 2012.

The U.S. was the largest donor, providing US$637 million, nearly half of all bilateral funding for family planning programs in 2014. The U.K. (US$328 million) was the second largest bilateral donor, followed by the Netherlands (US$164 million), Sweden (US$70 million), and France (US$70 million).Among the ten donor countries profiled in the analysis, eight made commitments at the London Summit on Family Planning in 2012; all eight donors are on track towards fulfillment of these commitments.

This analysis is being released at the same time as Family Planning 2020’s (FP2020) annual report on progress toward goals agreed upon at the 2012 London Summit on Family Planning. The full report is available on the Kaiser Family Foundation’s website.

Donor Government Assistance for Family Planning in 2014

Authors: Adam Wexler, Jennifer Kates, and Eric Lief
Published: Nov 12, 2015

Executive Summary

Executive Summary

For the second consecutive year following the London Summit on Family Planning, held in 2012, donor governments increased funding for family planning efforts. In 2014, the most recent year for which data are available, donor governments provided US$1.4 billion to support bilateral family planning programs in low- and middle-income countries, an increase of more than $100 million (9%) above 2013 levels and 32% above 2012 levels. The growth in bilateral funding between 2013 and 2014 was largely due to increases from the U.S., France, the U.K., and Sweden. Of the ten donor governments profiled, eight made specific commitments during the London Summit and all eight are on track to meet these commitments. In addition to bilateral funding, which includes earmarked contributions to multilateral organizations, donor governments also contributed US$472 million in core contributions to the United Nations Population Fund (UNFPA) in 2014, a US$15 million (3%) increase above 2013 levels and 8% above 2012 levels.

The Kaiser Family Foundation initiated a family planning resource tracking project in 2013, adapting the methodology it has long used to track donor government spending on HIV.1   This year’s report is based on analysis of 2014 funding data from the 29 governments who were members of the Organisation for Economic Co-operation and Development (OECD), Development Assistance Committee (DAC) in 2014 and had reported Official Development Assistance (ODA) to the DAC.2   Data were collected directly from ten donors, who represent approximately 99% of bilateral family planning funding: Australia, Canada, Denmark, France, Germany, Netherlands, Norway, Sweden, the U.K., and the U.S. Data for the remaining DAC members were obtained from the OECD Creditor Reporting System (CRS).

Key findings include:

  • In 2014, donor governments provided US$1.4 billion for bilateral family planning programs, representing a 9% increase (+US$120.5 million) compared to 2013 (US$1.3 billion), and 32% (+US$349.1 million) above 2012 (US$1.1 billion) (see Table 1 and Appendix 1).
  • Seven donors (Canada, Denmark, France, Netherlands, Sweden, U.S., and U.K.) increased bilateral funding in 2014 (after exchange rate fluctuations are taken into account), while two (Australia and Norway)3  remained essentially flat and one decreased (Germany).[endnote 168588-4]
  • Most of the bilateral increase was driven by the U.S., followed by France, the U.K. and Sweden.
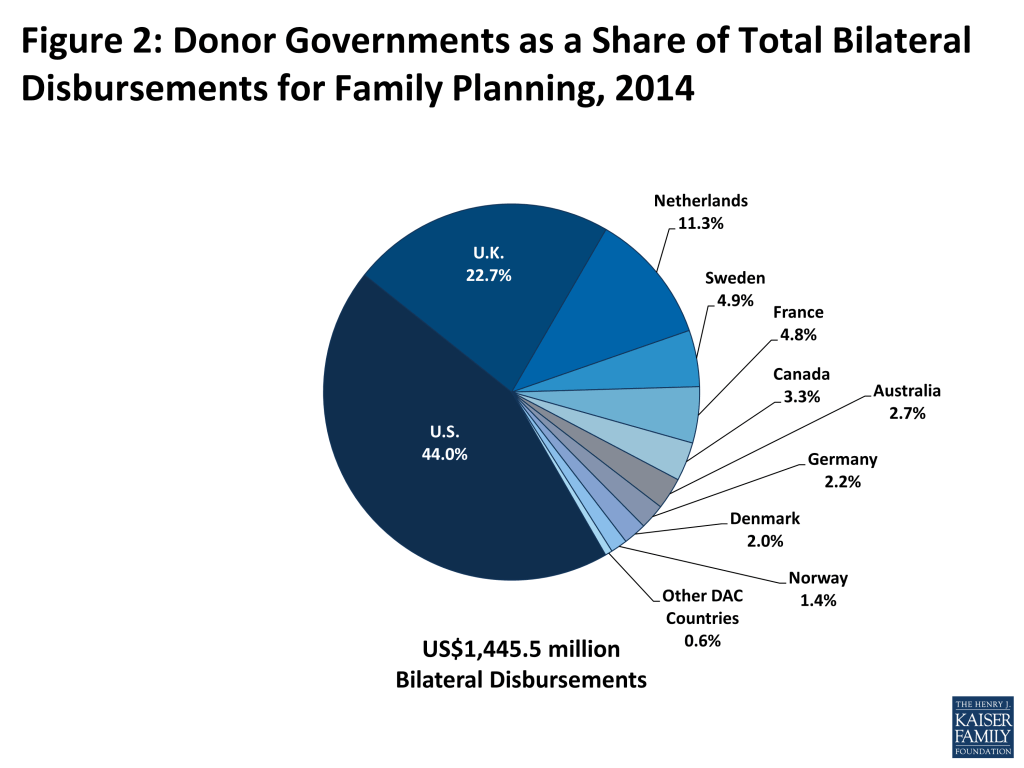
  • The U.S. was the single largest bilateral donor in 2014, providing US$636.6 million and accounting for almost half (44%) of total bilateral funding. The U.K. (US$327.6 million, 23%) was the second largest bilateral donor, accounting for nearly a quarter of all funding, followed by the Netherlands (US$163.6 million, 11%), Sweden (US$70.2 million, 5%), and France (US$69.8 million, 5%).
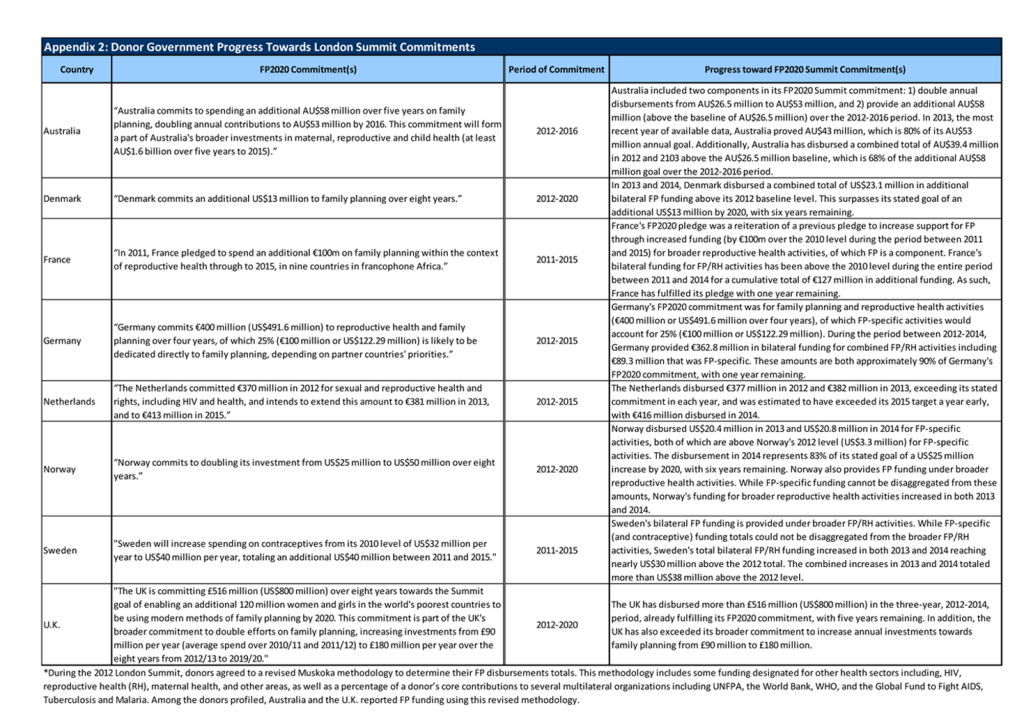
  • Eight of the ten donors profiled made specific commitments during the London Summit to increase their spending on family planning over a multi-year period: Australia, Denmark, France, Germany, the Netherlands, Norway, Sweden, and the U.K.4  Based on analysis of their expenditures between 2012-2014, all eight donors have made progress towards fulfillment of their stated commitments (see Appendix 2).
  • In addition to donor contributions to UNFPA that are earmarked for family planning, and are therefore counted as bilateral funding above, donors also provided US$472 million in core contributions to UNFPA, representing a US$15 million (3%) increase above 2013 levels (US$457 million) and 8% (+US$34.4 million) above 2012 levels (US$438 million). Among the donor governments profiled, Sweden provided the largest core contribution to UNFPA in 2014 (US$70.3 million), followed by Norway (US$69.1 million), the Netherlands (US$48.4 million), and Denmark (US$41.9).5 
Table 1: Donor Government Bilateral Disbursements for Family Planning, 2012-2014 (US$ millions)
Country201220132014Difference
2013 – 20142012 – 2014
Australia$43.2$39.5$39.5$0.0-$3.7
Canada$41.5$45.6$48.3$2.7$6.8
Denmark$13.0$20.3$28.8$8.5$15.8
France$49.6$37.2$69.8$32.6$20.2
Germany$47.6$38.2$31.3-$6.9-$16.3
Netherlands$105.4$153.7$163.6$9.9$58.2
Norway$3.3$20.4$20.8$0.4$17.5
Sweden$41.2$50.4$70.2$19.8$29.0
U.K.$252.8$305.2$327.6$22.4$74.8
U.S.$485.0$585.0$636.6$51.6$151.6
Other DAC Countries*$13.8$29.5$9.0-$20.5-$4.8
Total$1,096.4$1,325.0$1,445.5$120.5(9.1%)$349.1(31.8%)
*Austria, Belgium, Czech Republic, European Union, Finland, Greece, Iceland, Ireland, Italy, Japan, Korea, Luxembourg, New Zealand, Poland, Portugal, the Slovak Republic, Slovenia, Spain, and Switzerland.

Report

Introduction

2015 marks the third year since the London Summit on Family Planning where the civil society organizations, developing countries, donor governments, the private sector, and multilateral organizations met and established specific goals for family planning (see Box 1). The global community also made commitments totaling US$2.6 billion in additional funding by 2020 for family planning activities. As the timeframe to reach the goals of the London Summit approaches the halfway point, it is important to assess progress made and discuss plans moving forward, particularly in the area of funding. The status of global funding for family planning activities takes on added relevance following the conclusion of the Millennium Development Goal (MDG) era and adoption of the new Sustainable Development Goals (SDGs).

Box 1: London Summit on Family Planning

In July 2012, the U.K. Government and the Bill & Melinda Gates Foundation, in partnership with UNFPA, civil society organizations, developing countries, donor governments, the private sector, and multilateral organizations met at the London Summit on Family Planning (FP2020) and made commitments aimed at improving access to voluntary family planning services.

London Summit on Family Planning Goals & Outcomes: “By 2020, the goal is to deliver contraceptives, information, and services to a total of 380 million women and girls in developing countries so they can plan their families.”

  • Sustain coverage for the estimated 260 million women in the world’s poorest countries who are currently using contraceptives (as of June 2012); and
  • Provide family planning for an additional 120 million women in these countries.
  • The Summit resulted in stated commitments totaling $2.6 billion in additional funding for family planning activities from all sources (donor governments, non-governmental organizations, philanthropies, multilateral organizations, and domestic resources).

While funding from all sources – domestic public and private spending, donor government bilateral assistance, multilateral organizations and private philanthropy (see Box 2) – is needed to help fulfill international family planning goals and commitments, donor governments provide a significant share of global funding.6  Following the London Summit, the Kaiser Family Foundation conducted an analysis of donor government funding for family planning activities in 2012 to establish a FP funding baseline that could be used to track funding levels over time as well as specific donor government progress in meeting the Summit’s commitments.

Box 2: Other Sources of Funding for FP in Low- & Middle-Income Countries

In addition to donor governments, there are three other major funding sources for family planning assistance: multilateral organizations, the private sector, and domestic resources.

Multilateral Organizations: Multilateral organizations are international organizations made up of member governments (and in some cases private sector and civil society representatives), who provide both core contribution support and donor-directed funding for specific projects.  Core support from donors is pooled by the multilateral organization which in turn directs its use, such as for family planning.  Donor-directed or earmarked funding, even when provided through a multilateral organization, is considered part of a donor’s bilateral assistance.

The primary multilateral organization focused on family planning is the United Nations Population Fund (UNFPA), which estimates that it spent US$334 million (US$93 million from core resources and US$241 million from non-core resources), or 40.7% of its total resources, on family planning activities in 2014.7  Another important source of multilateral assistance for family planning is the World Bank which provides such funding under broader population and reproductive health activities. In 2014, the World Bank estimates that it spent US$251 million on population and reproductive health, an increase of US$30 million above the 2013 level (US$221 million).8  With the creation of the Global Financing Facility (GFF), the World Bank is expected to play an increasingly important role in supporting family planning activities.

Private Sector: Foundations (charitable and corporate philanthropic organizations), corporations, faith-based organizations, and international non-governmental organizations (NGOs) provide support for FP activities in low- and middle-income countries not only in terms of funding, but through in-kind support; commodity donations; and co-investment strategies with government and other sectors. For instance, the Bill & Melinda Gates Foundation has become a major funder of global health efforts, including family planning activities, and is a core partner of FP2020. In 2014, the Gates Foundation provided US$156 million for family planning, a US$22 million increase above 2013 levels.

Domestic Resources: Domestic resources include spending by country governments that also receive international assistance for FP and spending by households/individuals within these countries for FP services.  Such resources represent a significant and critical part of the response.  Since the London Summit, a total of 36 low- and middle-income countries have made specific commitments to increase their family planning spending.

This report provides donor government bilateral funding for family planning activities in 2014 compared to prior year levels. It includes an analysis of funding provided by the 29 governments who were members of the OECD DAC in 2014. Data were collected directly from ten donors, who represent approximately 99% of bilateral family planning funding, and are profiled in this report: Australia, Canada, Denmark, France, Germany, Netherlands, Norway, Sweden, the U.K., and the U.S. Data for the remaining DAC members was obtained from the OECD CRS. For purposes of this analysis, family planning services were defined to include the following activities as specified in the CRS: “counseling; information, education and communication (IEC) activities; delivery of contraceptives; capacity building and training.”9  Bilateral totals include actual funding amounts provided (e.g., cash transfers) as well as other types of transactions and activities (e.g., technical assistance), products (e.g., commodities), and donor government earmarked contributions to multilateral organizations (e.g. contributions to the Global Programme to Enhance Reproductive Health Commodity Security at UNFPA).

Where bilateral family planning funding was included as part of broader reproductive and maternal health activities or other non-health-sector activities, we worked directly with donor governments to identify family planning specific amounts to the extent possible (see Methodology for more information). Where it was not possible to disaggregate FP funding from broader reproductive and maternal health activities, the estimated level of family planning funding may be an overestimate. At the same time, some family planning funding provided under non-health-sectors remains largely unidentified, likely resulting in an underestimate of total family planning funding.

Findings

Bilateral Assistance

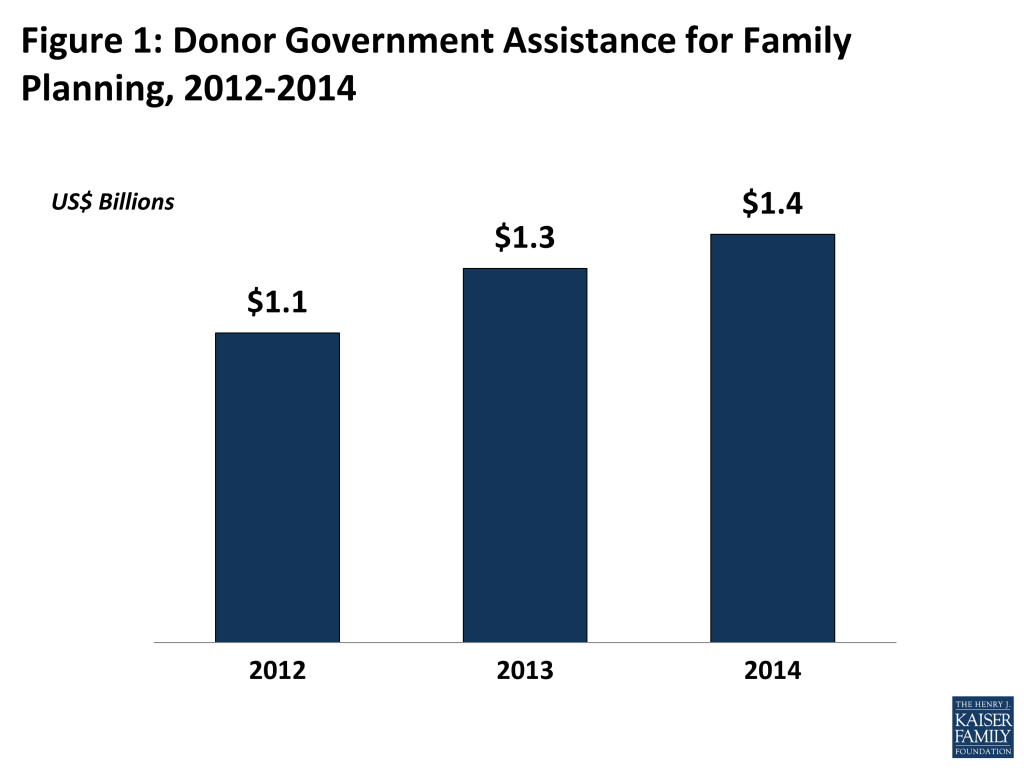
In 2014, donor governments disbursed10  US$1,445.5 million in bilateral funding for family planning activities (see Table 1, Figure 1 & Appendix 1), an increase of US$120.5 million (9%) above 2013 levels (US$1,325.0 million) and 32% (+US$349.1 million) above 2012 levels (US$1,096.4 million).

Figure 1: Donor Government Assistance for Family Planning, 2012-2014

Among the donor governments profiled, seven (Canada, Denmark, France, Netherlands, Sweden, U.S., and U.K.) increased bilateral funding in 2014 (after exchange rate fluctuations are taken into account); two donors (Australia and Norway) remained essentially flat and one donor (Germany) decreased funding for family planning in 2014 (although, Germany increased funding for broader reproductive health activities). Most of the overall increase was due to increases in funding by the U.S., France, the U.K., and Sweden.

The United States (US$636.6 million) was the largest bilateral donor in 2014 accounting for almost half (44%) of total bilateral assistance (see Figure 2). The U.K. (US$327.6 million, 23%) was the second largest bilateral donor, followed by the Netherlands (US$163.6 million, 11%), Sweden (US$70.2 million, 5%), and France (US$69.6 million, 3%).

Figure 2: Donor Governments as a Share of Total Bilateral Disbursements for Family Planning, 2014

Progress Towards FP2020 Commitments

Eight of the donor governments surveyed directly made multi-year commitments at the FP2020 Summit in 2012: Australia, Denmark, France, Germany, Netherlands, Norway, Sweden, and the U.K. (see Appendix 2). While it is not possible to know what funding amounts would have been provided by donors in the absence of the Summit, data collected for 2012-2014 indicate that funding has increased since the 2012 baseline level and all donors are currently on track to fulfill their stated commitments. While the goals of the FP2020 Summit have a 2020 deadline, commitments from four of the donors profiled (France, Germany, the Netherlands, and Sweden) will conclude in 2015 and one donor (Australia) will conclude in 2016. Future analyses will continue to monitor funding disbursed towards these commitments as well as the trends once commitments have concluded.

Donor Contributions to UNFPA

While the majority of donor government assistance for family planning is provided bilaterally, donors also provide support for family planning activities through contributions to the United Nations Population Fund (UNFPA) (see Box 3). Most of UNFPA’s funding is from donor governments, which provide funding in two ways: 1) donor directed or earmarked contributions for specific activities (e.g. donor contributions to the Global Programme to Enhance Reproductive Health Commodity Security at UNFPA), which are included as part of bilateral funding; and 2) general contributions to “core” activities that are untied and meant to be used for both programmatic activities (family planning, population and development, HIV-AIDS, Gender, and sexual and reproductive health and rights) and operational support as determined by UNFPA.

Box 3: United Nations Population Fund (UNFPA) Mission, Mandate, & London Summit onFamily Planning Commitment

Created in 1969, UNFPA supports sexual and reproductive health activities in many low- and middle-income countries and was a key partner in the London Summit on Family Planning. 

UNFPA Mission: Deliver a world where every pregnancy is wanted, every birth is safe, every young person’s potential is fulfilled.

UNFPA Mandate:

  • Build the knowledge and the capacity to respond to needs in population and family planning;
  • Promote awareness in both developed and developing countries of population problems and possible strategies to deal with these problems;
  • Assist their population problems in the forms and means best suited to the individual countries’ needs; and
  • Assume a leading role in the United Nations system in promoting population programmes, and to coordinate projects supported by the Fund.

UNFPA London Summit on Family Planning Commitment: “UNFPA will double the proportion of its resources focused on family planning from 25% to 40 % based on current funding levels, bringing new funding of at least US$174 million per year from core and noncore funds. This will include a minimum of US$54 million per year, from 2013-2019, in increased funding for family planning from UNFPA’s core resources.”

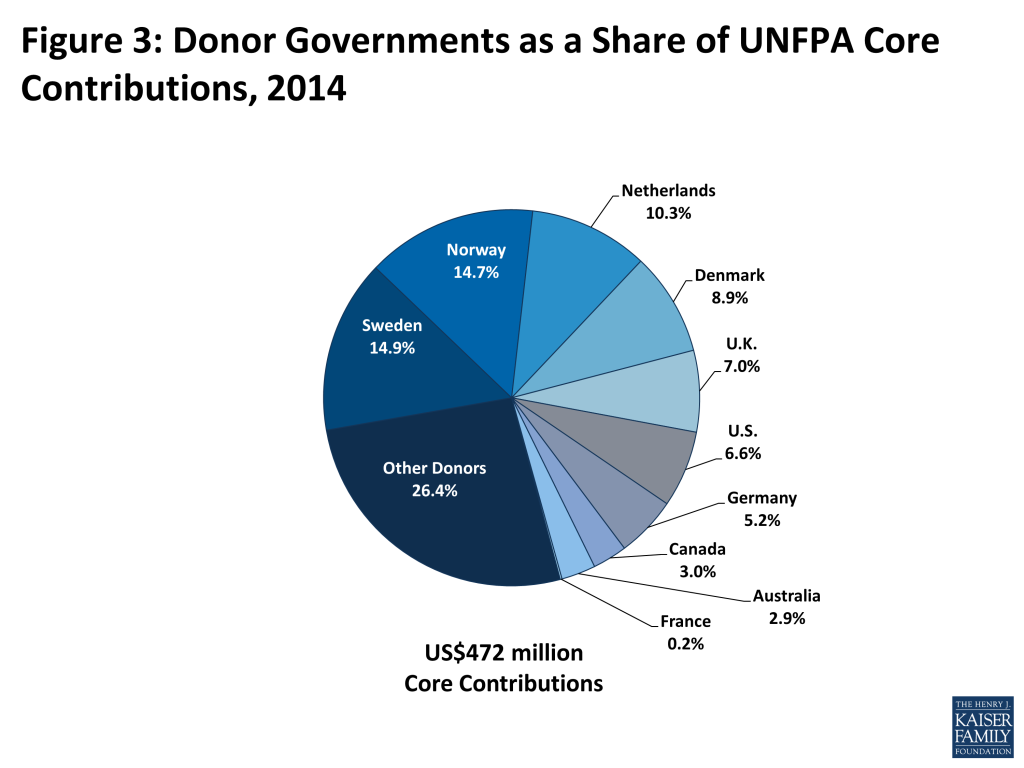
In 2014, donor governments provided US$472 million in core contributions to UNFPA, an increase of US$15 million (3%) above 2013 levels (US$457 million) and US$34 million (8%) above 2012 levels (US$438 million).  Sweden was the largest donor to UNFPA (US$70.3 million, 15%), followed by Norway (US$69.1 million, 15%), the Netherlands (US$48.4 million, 10%), Denmark (US$41.9 million, 9%), the U.K. (US$33.1 million, 7%), and the U.S. (US$31.1 million, 7%) (see Figure 3).11  Among the ten donors profiled, two provided a larger contribution to UNFPA’s core resources than their total bilateral disbursement for family planning: Denmark and Norway.

Table 2: Donor Government Contributions to UNFPA (Core Resources), 2012-2014 (US$ millions)
Country201220132014Difference*
2013 – 20142012 – 2014
Australia$14.9$15.6$13.9-$1.7-$0.9
Canada$17.4$16.0$14.0-$2.0-$3.3
Denmark$44.0$40.8$41.9$1.1-$2.1
France$0.5$0.5$0.7$0.2$0.2
Germany$20.7$24.0$24.7$0.7$3.9
Netherlands$49.0$52.4$48.4-$3.9-$0.6
Norway$59.4$70.6$69.1-$1.4$9.7
Sweden$66.3$65.8$70.3$4.5$4.0
U.K.$31.8$31.5$33.1$1.5$1.3
U.S.$30.2$28.5$31.1$2.7$0.9
Other Donors$103.3$111.4$124.6$13.2$21.4
Total$437.5$457.1$471.9$14.8(3.2%)$34.4(7.9%)
Figure 3: Donor Governments as a Share of UNFPA Core Contributions, 2014

Conclusion

Donor government funding for family planning increased in 2014 marking the second consecutive year of increases since donors made commitments to increase funding at the London Summit on Family Planning in 2012. Additionally, the eight donor governments profiled who made commitments at the London Summit are all on track towards fulfilling them. Looking ahead, however, it is not yet certain if these trends will continue, as several donors are nearing the end of their commitment period and overall bilateral development assistance is projected to be constrained among many of the donor governments.12  It will therefore be important to continue tracking funding for family planning activities to assess progress towards addressing ongoing family planning needs in low- and middle-income countries.

Methodology

Bilateral and multilateral data on donor government assistance for FP in low- and middle-income countries were collected from multiple sources. The research team collected the latest bilateral assistance data directly for ten governments: Australia, Canada, Denmark, Germany, France, the Netherlands, Norway, Sweden, the United Kingdom, and the United States during the first half of 2015. Unless otherwise specified, data represent the fiscal year 2014 period for all governments. Direct data collection from these donors was desirable because they represent the preponderance of donor government assistance for family planning and the latest official statistics – from the Organisation for Economic Co-operation and Development (OECD) Creditor Reporting System (CRS) (see: http://www.oecd.org/dac/stats/data) – are from 2013 and do not include all forms of international assistance (e.g., funding to countries such as Russia and the Baltic States that are no longer included in the CRS database).  In addition, the CRS data may not include certain funding streams provided by donors, such as FP components of mixed-purpose grants to non-governmental organizations. Data for all other OECD DAC member governments – Austria, Belgium, the European Commission, Finland, Greece, Ireland, Italy, Japan, Korea, Luxembourg, New Zealand, Portugal, Spain, and Switzerland – who collectively accounted for less than one percent of bilateral family planning disbursements, were obtained from the OECD CRS and are from calendar year 2013.

For purposes of this analysis, funding was counted as family planning if it met the OECD CRS purpose code definition: “Family planning services including counselling; information, education and communication (IEC) activities; delivery of contraceptives; capacity building and training.” Where it was possible to identify funding amounts, family-planning-related activities funded in the context of other official development assistance sectors (e.g. education, civil society) are included in this analysis. Project-level data were reviewed for Canada, Denmark, France, Germany, the Netherlands, Norway, and Sweden to determine whether all or a portion of the funding could be counted as family planning. Family-planning-specific funding totals for the United States were obtained through direct communications with government representatives. Funding attributed to Australia and the United Kingdom is based on a revised Muskoka methodology as agreed upon by donors at the London Summit on Family Planning in 2012. Funding totals presented in this analysis should be considered preliminary estimates based on data provided by representatives of the donor governments who were contacted directly.

It was difficult in some cases to disaggregate bilateral family planning funding from broader reproductive and maternal health totals, as the two are sometimes represented as integrated totals. In addition, family-planning-related activities funded in the context of other official development assistance sectors (e.g. education, civil society) have in the past remained largely unidentified.  For purposes of this analysis, we worked closely with the largest donors to family planning to identify such family-planning-specific funding where possible (see Appendix 1 for detailed data table).

Bilateral funding is defined as any earmarked (FP-designated) amount and includes family planning-specific contributions to multilateral organizations (e.g. non-core contributions to the Global Programme to Enhance Reproductive Health Commodity Security at UNFPA). UNFPA contributions from all governments correspond to amounts received during the 2014 calendar year, regardless of which contributor’s fiscal year such disbursements pertain to.

With some exceptions, bilateral assistance data were collected for disbursements. A disbursement is the actual release of funds to, or the purchase of goods or services for, a recipient. Disbursements in any given year may include disbursements of funds committed in prior years, and in some cases, not all funds committed during a government fiscal year are disbursed in that year. In addition, a disbursement by a government does not necessarily mean that the funds were provided to a country or other intended end-user. Enacted amounts represent budgetary decisions that funding will be provided, regardless of the time at which actual outlays, or disbursements, occur. In recent years, most governments have converted to cash accounting frameworks, and present budgets for legislative approval accordingly; in such cases, disbursements were used as a proxy for enacted amounts.  In the U.S. case, both enacted and disbursement data were available for analysis.

UNFPA core contributions were obtained from United Nations Executive Board documents. UNFPA estimates of total family planning funding provided from both core and non-core resources were obtained through direct communications with UNFPA representatives. Other than core contributions provided by governments to UNFPA, un-earmarked core contributions to United Nations entities, most of which are membership contributions set by treaty or other formal agreement (e.g., United Nations country membership assessments), are not identified as part of a donor government’s FP assistance even if the multilateral organization in turn directs some of these funds to FP. Rather, these would be considered as FP funding provided by the multilateral organization, and are not considered for purposes of this report.

The fiscal year period varies by country. The U.S. fiscal year runs from October 1-September 30. The Australian fiscal year runs from July 1-June 30. The fiscal years for Canada and the U.K. are April 1-March 31. Denmark, France, Germany, the Netherlands, Norway, and Sweden use the calendar year. The OECD uses the calendar year, so data collected from the CRS for other donor governments reflect January 1-December 31. Most UN agencies use the calendar year and their budgets are biennial.

All data are expressed in US dollars (USD). Where data were provided by governments in their currencies, they were adjusted by average daily exchange rates to obtain a USD equivalent, based on foreign exchange rate historical data available from the U.S. Federal Reserve (see: http://www.federalreserve.gov/) or in some cases from the OECD. Data obtained from UNFPA were already adjusted by UNFPA to represent a USD equivalent based on date of receipts.

Appendices

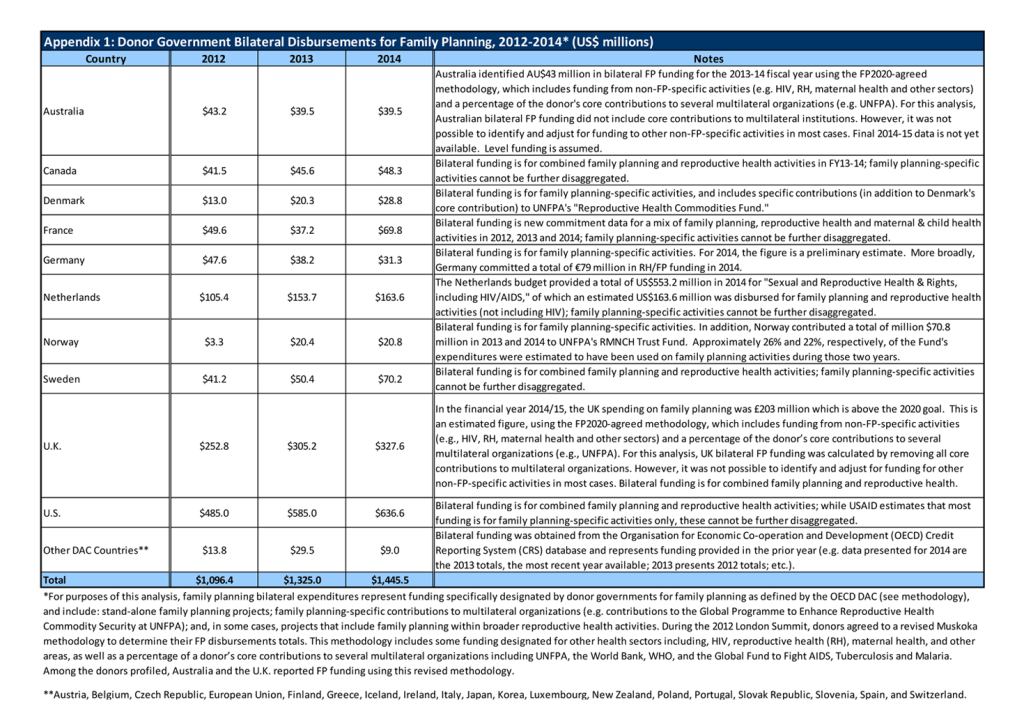
Appendix 1: Donor Government Bilateral Disbursements for Family Planning, 2012-2014* (US$ millions)

For an enlarged version of the table, access the report PDF.

Appendix 2: Donor Government Progress Towards London Summit Commitments

For an enlarged version of the table, access the report PDF.

Endnotes

  1. Since 2002, the Joint United Nations Programme on HIV/AIDS (UNAIDS) and the Kaiser Family Foundation have been tracking donor government assistance for HIV in low- and middle-income countries by the donor government members of the Organization for Economic Co-operation and Development’s (OECD) Development Assistance Committee (DAC). For the methodological approach used to monitor donor government spending on HIV see: https://modern.kff.org/global-health-policy/report/financing-the-response-to-aids-in-low/. ↩︎
  2. Includes funding from 28 DAC member countries and the European Commission (EC). ↩︎
  3. Australia’s FP funding is for the 2013-14 fiscal year. Final 2014-15 data is not yet available. Level funding is assumed. ↩︎
  4. The European Commission, Japan, and Korea also made commitments during the London Summit. For this analysis, family planning funding from these donor governments is based on family planning funding amounts reported to the OECD DAC and these donors are included as part of “Other DAC Countries”. ↩︎
  5. In 2014, Finland provided the third largest core contribution ($60.4 million) to UNFPA, followed by the Netherlands. ↩︎
  6. UNFPA, Financial Resource Flows for Population Activities Report 2011, 2013. ↩︎
  7. UNFPA, Direct communication, October, 2015. ↩︎
  8. World Bank, Direct communication, August, 2014. ↩︎
  9. OECD, The List of CRS Purpose Codes, 2013. ↩︎
  10. A disbursement is the actual release of funds to, or the purchase of goods or services for, a recipient. An enactment represents a budgetary decision that funding will be provided, regardless of the time at which an actual outlays, or disbursement, occurs. Therefore, disbursements in any given year may include funds committed (enacted) in prior years and in some cases, not all funds committed (enacted) during a government fiscal year are disbursed in that year. While most donor governments examined disburse enacted amounts within the same year, the U.S. government does not and may disburse enactments over multiple years. For instance, in FY 2013, U.S. bilateral enacted funding for family planning activities totaled $615.1 million, while disbursements totaled $585 million. ↩︎
  11. In 2014, Finland provided the third largest core contribution ($60.4 million) to UNFPA, followed by the Netherlands. ↩︎
  12. OECD, 2015 Global Outlook on Aid, 2015. ↩︎
News Release

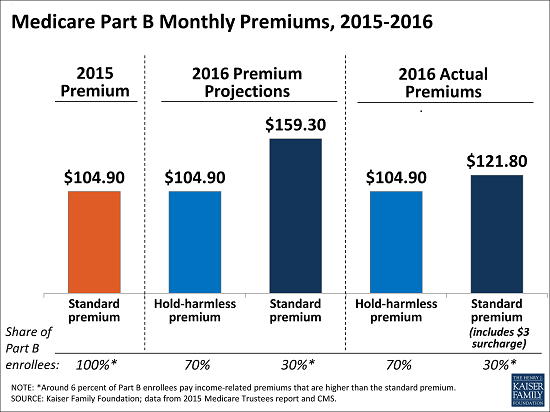
Brief Explains Why Medicare Part B Premiums Will Increase by 16 percent, not 52 percent, in 2016 for 3 in 10 Beneficiaries Due to the Recent Budget Deal

Published: Nov 11, 2015

As a result of the recently enacted budget deal in Congress, the 2016 Medicare Part B monthly premium will be $121.80, increasing by 16 percent over the 2015 amount—far lower than the increase initially projected by the Medicare actuaries, a new brief from the Kaiser Family Foundation explains. The Part B premium increase will affect 3 in 10 Medicare beneficiaries. The remaining 7 in 10 beneficiaries will pay the same $104.90 monthly premium in 2016 as they paid in 2015, thanks to protections in Social Security law that exempt them from the increase.

The brief describes how the Medicare Part B premium and deductible are affected for 2016 by the Bipartisan Budget Act of 2015, including a new $3 per month fee for some beneficiaries to offset federal spending. It also lays out the connection between the Medicare Part B premium, the Social Security COLA, and the so-called ‘hold-harmless’ provision, and why, without the change in law, Medicare premiums would have increased by 52 percent for the 30 percent of beneficiaries not protected by the hold-harmless provision.

The brief, What’s in Store for Medicare’s Part B Premiums and Deductible in 2016, and Why?, as well as other information and analysis about the Medicare program, is available at kff.org.