2016 Employer Health Benefits Survey

Published: Sep 14, 2016

Abstract

8905-ehbs-2016-cover-thumbnail

This annual survey of employers provides a detailed look at trends in employer-sponsored health coverage including premiums, employee contributions, cost-sharing provisions, and employer opinions. The 2016 survey included more than 1,900 interviews with non-federal public and private firms. Annual premiums for employer-sponsored family health coverage reached $18,142 this year, up 3 percent from last year, with workers on average paying $5,277 towards the cost of their coverage, according to the Kaiser Family Foundation/Health Research & Education Trust 2016 Employer Health Benefits Survey. The 2016 survey includes information on the use of incentives for employer wellness programs, plan cost-sharing as well as firm offer rate. Survey results are released here in a variety of ways, including a full report with downloadable tables on a variety of topics, summary of findings, and an article published in the journal Health Affairs.

NEWS RELEASE

  • A news release announcing the publication of the 2016 Employer Health Benefits Survey is available here.

SUMMARY OF FINDINGS

  • The Summary of Findings provides an overview of the 2016 survey results and is available under the Summary of Findings section.

FULL REPORT

  • The complete Employer Health Benefits Survey Report includes over 200 exhibits and is available under the Report section. The Report section contains 14 separate sections. Users can view each section separately or download the section exhibits from the bottom of the respective section page.

HEALTH AFFAIRS

WEB BRIEFING

  • On Wednesday, September 14, 2016, the Kaiser Family Foundation and the Health Research & Educational Trust (HRET) held a reporters-only web briefing to release the 2016 Employer Health Benefits Survey.

INTERACTIVE GRAPHIC

KEY EXHIBITS – CHARTPACK

  • Over twenty overview slides from the 2016 Employer Health Benefits Survey are available as a slideshow or PDF.

ADDITIONAL RESOURCES

  • Standard errors for selected estimates are available in the Technical Supplement here.
  • Employer Health Benefits Surveys from 1998-2015 are available here. Please note that historic survey reports have not been revised with methodological changes.
  • Researchers may request for a public use dataset by going to Contact Us and choosing “TOPIC: Health Costs.”

Researchers at the Kaiser Family Foundation, NORC at the University of Chicago, and Health Research & Educational Trust designed and analyzed the survey.

Summary Of Findings

Employer-sponsored insurance covers over half of the non-elderly population; approximately 150 million nonelderly people in total.1  To provide current information about employer-sponsored health benefits, the Kaiser Family Foundation (Kaiser) and the Health Research & Educational Trust (HRET) conduct an annual survey of private and nonfederal public employers with three or more workers. This is the eighteenth Kaiser/HRET survey and reflects employer-sponsored health benefits in 2016.

HEALTH INSURANCE PREMIUMS AND WORKER CONTRIBUTIONS

In 2016, the average annual premiums for employer-sponsored health insurance are $6,435 for single coverage and $18,142 for family coverage.  The average family premium rose 3% over the 2015 average premium while the increase in the premium for single coverage was not statistically significant.  The average premium for family coverage is lower for covered workers in small firms (3-199 workers) than for workers in large firms (200 or more workers) ($17,546 vs. $18,395). Workers’ wages increased 2.5% and inflation increased 1.1% over the period.2  Premiums for family coverage have increased 20% since 2011 and 58% since 2006. Average premiums for high-deductible health plans with a savings option (HDHP/SOs) are considerably lower than the overall average for all plan types for both single and family coverage, at $5,762 and $16,737 respectively (Exhibit A). These premiums do not include any employer contributions to workers’ health savings accounts or health reimbursement arrangements. As discussed below, the share of covered workers with HDHP/SOs has grown eight percentage points over the last two years; this change in enrollment has reduced the growth in single and family premiums by roughly a half percentage point each of the last two years.3 
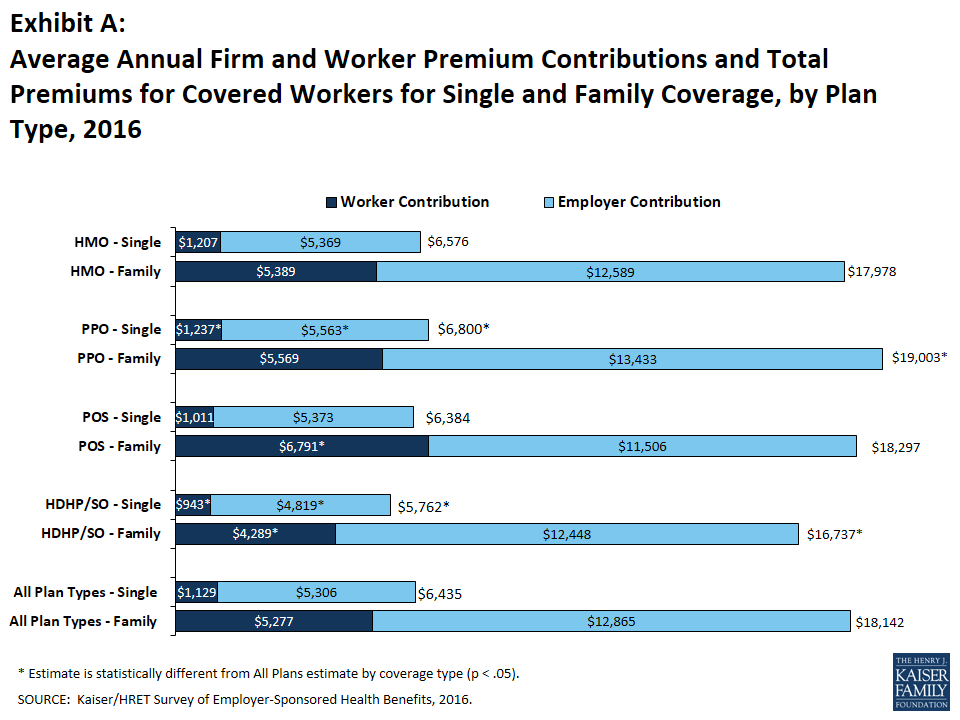
Exhibit A: Average Annual Firm and Worker Premium Contributions and Total Premiums for Covered Workers for Single and Family Coverage, by Plan Type, 2016

Premiums vary significantly around the averages for both single and family coverage, reflecting differences in health care costs and compensation decisions across regions and industries. Seventeen percent of covered workers are in plans with an annual total premium for family coverage of at least $21,771 (120% or more of the average family premium), and 19% of covered workers are in plans where the family premium is less than $14,514 (less than 80% of the average family premium) (Exhibit B).
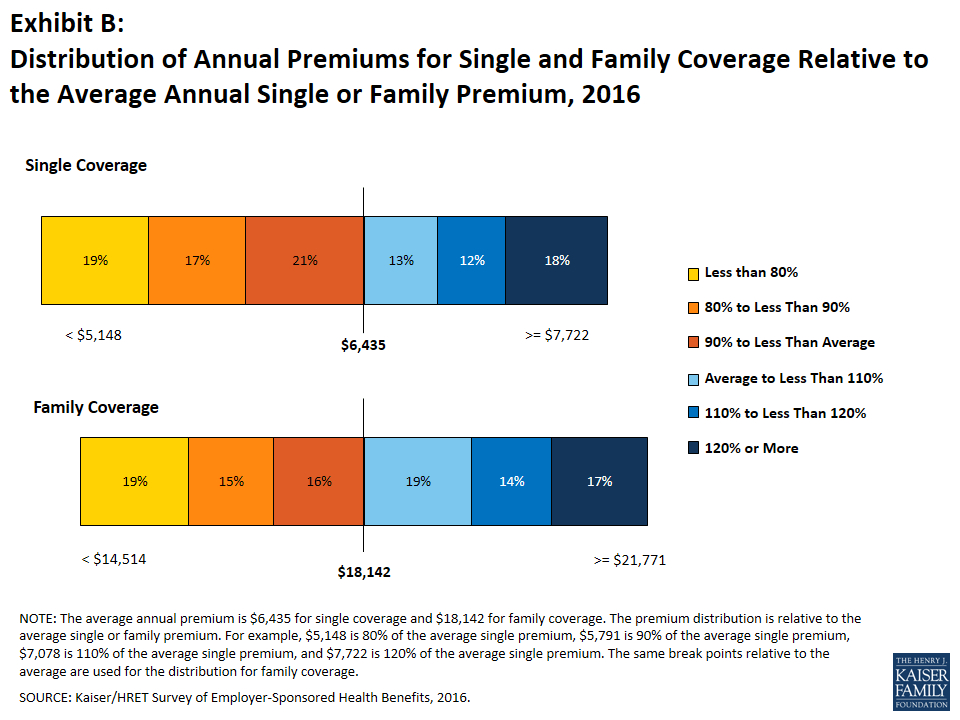
Exhibit B: Distribution of Annual Premiums for Single and Family Coverage Relative to the Average Annual Single or Family Premium, 2016

Most covered workers make a contribution towards the cost of the premium for their coverage. On average, covered workers contribute 18% of the premium for single coverage and 30% of the premium for family coverage, similar percentages to the recent past. Workers in small firms contribute a higher average percentage of the premium for family coverage (39% vs. 26%) than workers in large firms. Covered workers in firms with a relatively high percentage of lower-wage workers (at least 35% of workers earn $23,000 a year or less) contribute higher percentages of the premium for single (23% vs. 18%) and family (35% vs. 30%) coverage than workers in firms with a smaller share of lower-wage workers. As with total premiums, the share of the premium contributed by workers varies considerably. For single coverage, 12% of covered workers are in plans that do not require them to make a contribution, 62% are in plans which require a contribution of 25% or less of the total premium, and 2% are in plans that require a contribution of more than half of the premium. For family coverage, 3% of covered workers are in plans that do not require them to make a contribution, 45% are in a plan that requires a contribution of 25% or less of the total premium, and 15% are in plans that require more than half of the premium (Exhibit C). Covered workers in small firms are much more likely to be in a plan that requires the worker to contribute more than 50% of the total family premium than covered workers in larger firms (34% vs. 7%).
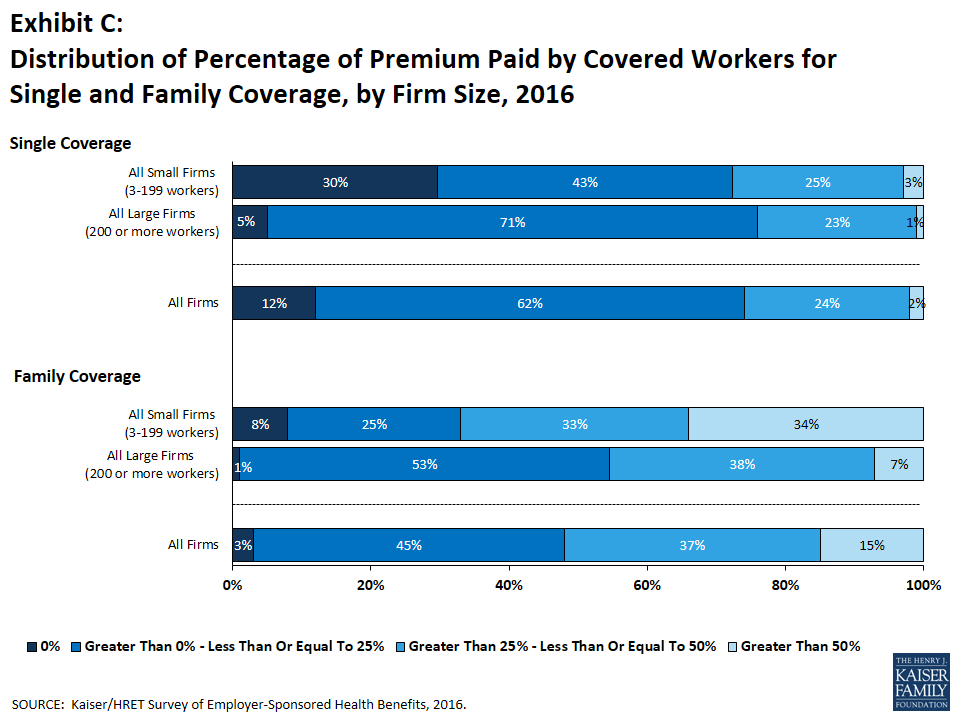
Exhibit C: Distribution of Percentage of Premium Paid by Covered Workers for Single and Family Coverage, by Firm Size, 2016

One reason for this variation is the different approaches that employers use to structure employee contributions, particularly for family coverage. Of firms that offer family coverage: 45% of small firms and 18% of large firms provide the same dollar contribution for single and family coverage, which means that employees must pay the full additional premium cost to enroll family members in their plan; 45% of small firms and 67% of large firms make a higher dollar contribution for family coverage than for single coverage, 3% of small firms and 6% of large firms vary their approach with the class of the employee; and the remaining 7% of small firms and 9% of large firms take some other approach. Fifteen percent of firms that offer health benefits require workers who use tobacco to contribute more towards the premium than those who do not use tobacco. Looking at the dollar amounts that workers contribute, the average annual premium contributions for 2016 are $1,129 for single coverage and $5,277 for family coverage. Covered workers’ average dollar contribution to family coverage has increased 78% since 2006 (Exhibit D) and 28% since 2011 (data not shown). Covered workers in small firms have lower average contributions for single coverage than workers in large firms ($1,021 vs. $1,176), but higher average contributions for family coverage ($6,597 vs. $4,719). Average contribution amounts for covered workers in HDHP/SOs are lower for single and family coverage than for covered workers in other plan types (Exhibit A).
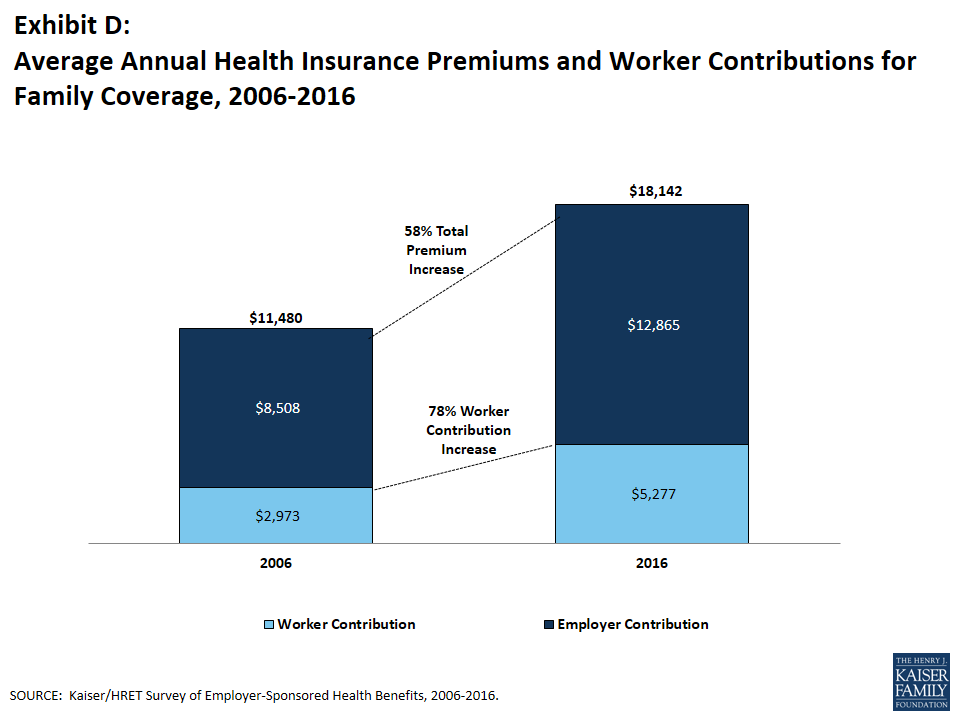
Exhibit D: Average Annual Health Insurance Premiums and Worker Contributions for Family Coverage, 2006-2016

PLAN ENROLLMENT

PPOs continue to be the most common plan type in 2016, enrolling 48% of covered workers. Twenty-nine percent of covered workers are enrolled in a high-deductible plan with a savings option (HDHP/SO), 15% in an HMO, 9% in a POS plan, and less than 1% in a conventional (also known as an indemnity) plan. Over the last two years, enrollment in PPOs has fallen 10 percentage points while enrollment in HDHP/SOs has increased 8 percentage points (Exhibit E).4 
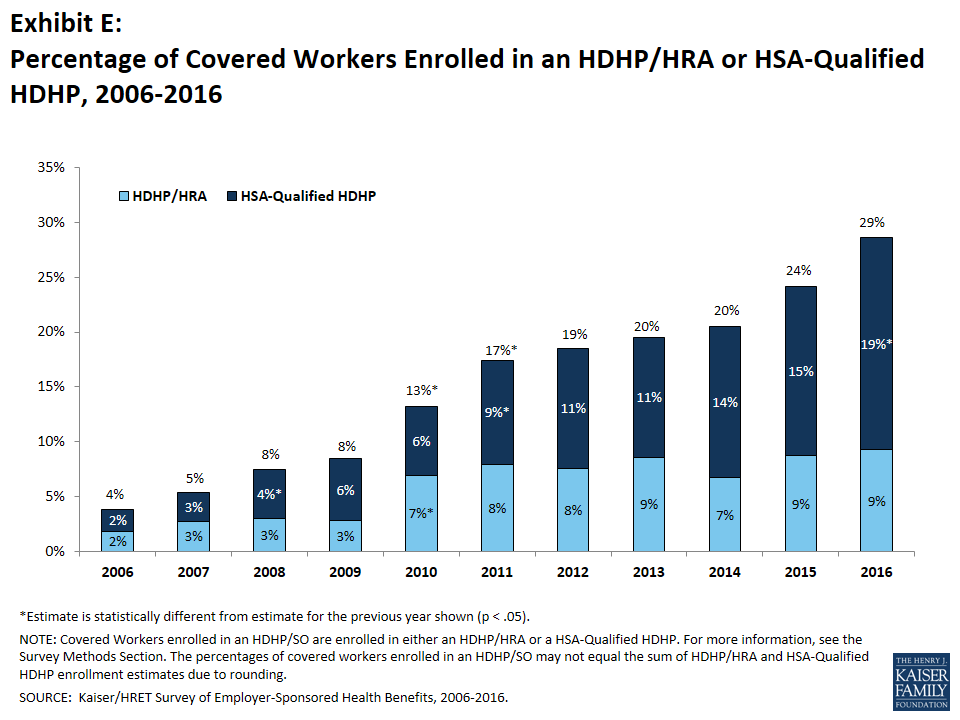
Exhibit E: Percentage of Covered Workers Enrolled in an HDHP/HRA or HSA-Qualified HDHP, 2006-2016

Plan enrollment differs with firm size: 52% of covered workers in large firms are enrolled in PPOs, compared to 39% percent in small firms; 18% percent of covered workers in small firms are enrolled in POS plans, compared to 4% in large firms. 

EMPLOYEE COST SHARING

Most covered workers must pay a share of the cost when they use health care services. Eighty-three percent of covered workers have a general annual deductible for single coverage that must be met before most services are paid for by the plan. Even workers without a general annual deductible often face other types of cost sharing when they use services, such as copayments or coinsurance for office visits and hospitalizations. Among covered workers with a general annual deductible, the average deductible amount for single coverage is $1,478, higher than the average deductible last year ($1,318). Among all covered workers, those enrolled at firms with a deductible and those without, the average deductible is $1,221, significantly more than $1,077 in 2015.   The average deductible for covered workers is higher in small firms than in large firms ($2,069 vs. $1,238). Sixty-five percent of covered workers in small firms and 45% of covered workers in large firms are in a plan with a deductible of at least $1,000 for single coverage, similar to the percentages last year (Exhibit F); a similar pattern exists for those in plans with a deductible of at least $2,000 (41% for small firms vs. 16% for large firms).
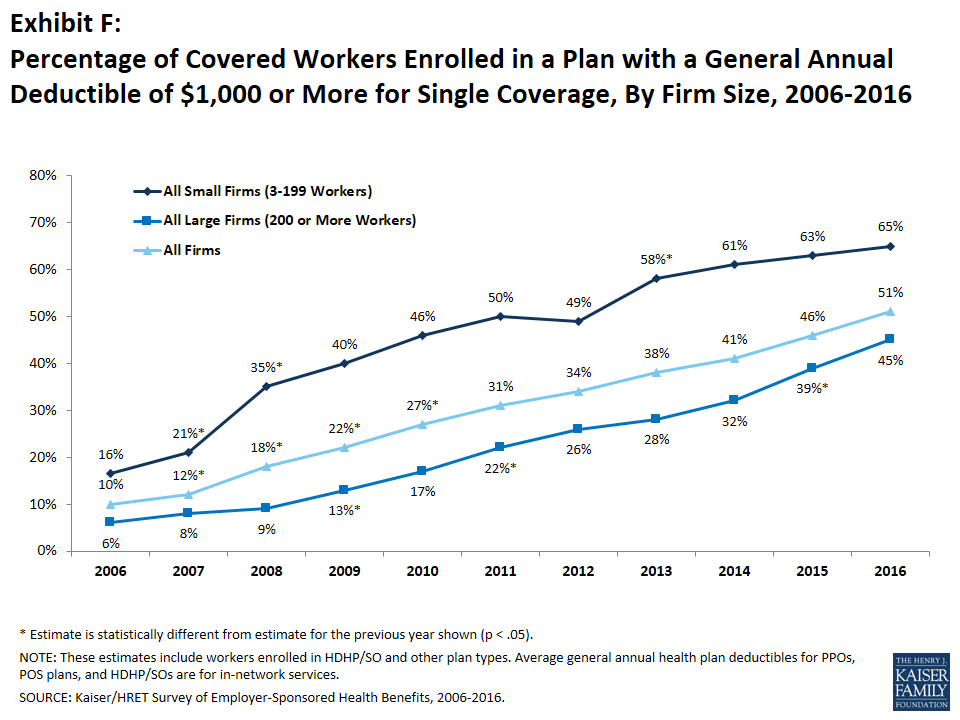
Exhibit F: Percentage of Covered Workers Enrolled in a Plan with a General Annual Deductible of $1,000 or More for Single Coverage, By Firm Size, 2006-2016

Deductibles have increased in recent years due to higher deductible amounts within plan types (particularly PPO plans) and to higher enrollment in HDHP/SOs. While growing deductibles in PPOs and other plan types generally increases enrollee out-of-pocket liability, the shift in enrollment to HDHP/SOs does not necessarily do so because most HDHP/SO enrollees receive an account contribution from their employers, which in essence reduces the high cost sharing in these plans. Fourteen percent of covered workers in an HDHP with a Health Reimbursement Arrangement (HRA) and 7% of covered workers in a Health Savings Account (HSA)-qualified HDHP receive an account contribution for single coverage at least equal to their deductible, while another 47% of covered workers in an HDHP with an HRA and 28% of covered workers in an HSA-qualified HDHP receive account contributions that, if applied to their deductible, would reduce their deductible to less than $1,000. If we reduce the deductibles that workers face by employer account contributions, the percentage of covered workers with a deductible liability of $1,000 or more would be reduced from 51% to 38% (Exhibit G).
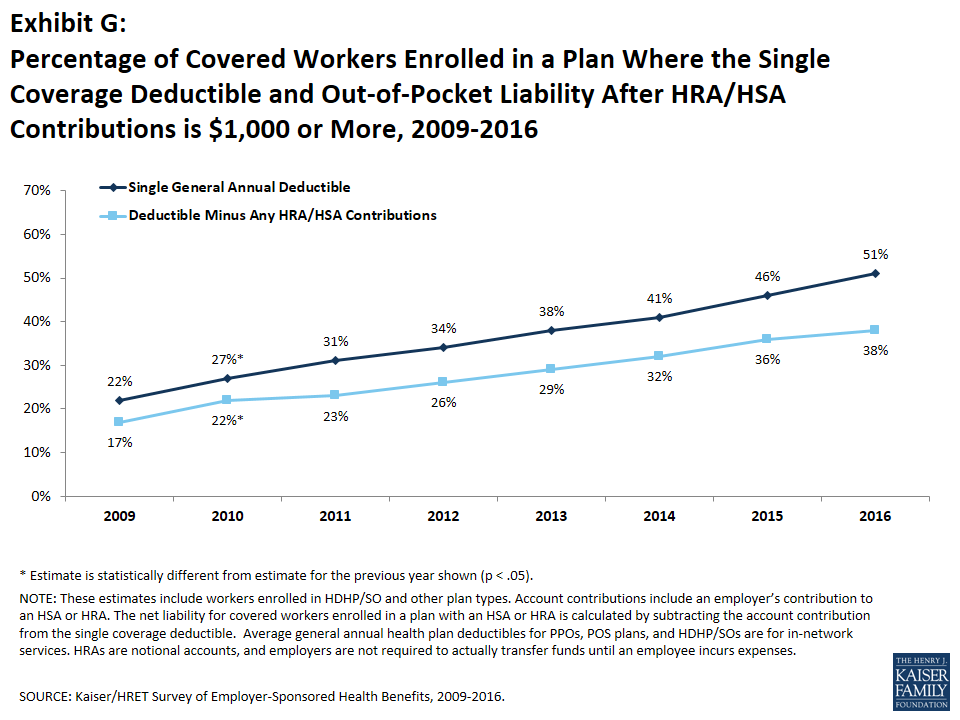
Exhibit G: Percentage of Covered Workers Enrolled in a Plan Where the Single Coverage Deductible and Out-of-Pocket Liability After HRA/HSA Contributions is $1,000 or More, 2009-2016

Whether they face a general annual deductible or not, a large share of covered workers also pay a portion of the cost when they visit a physician. For primary care, 67% of covered workers face a copayment (a fixed dollar amount) when they visit a doctor and 25% face coinsurance (a percentage of the covered amount). For specialty care, 66% face a copayment and 26% face coinsurance. The average in-network copayments are $24 for primary care and $38 for specialty care. The average in-network coinsurance is 18% for primary and 19% for specialty care. These amounts are similar to those in 2015. Most workers also face additional cost sharing for a hospital admission or an outpatient surgery episode. After any general annual deductible is met, 64% of covered workers have a coinsurance and 14% have a copayment for hospital admissions. Lower percentages have per day (per diem) payments (6%), a separate hospital deductible (1%), or both copayments and coinsurance (10%). The average coinsurance rate for hospital admissions is 19%. The average copayment is $282 per hospital admission, the average per diem charge is $281, and the average separate annual hospital deductible is $898. The cost sharing provisions for outpatient surgery follow a similar pattern to those for hospital admissions; most covered workers have either coinsurance (66%) or copayments (17%). For covered workers with cost sharing for outpatient surgery, the average coinsurance rate is 19% and the average copayment is $170. While almost all (98%) covered workers are in plans with a limit on in-network cost sharing (called an “out-of-pocket maximum”) for single coverage, there is considerable variation in the actual dollar limits. Fourteen percent of these workers are in a plan with an annual out-of-pocket maximum for single coverage of less than $2,000 while 18% are in a plan with an out-of-pocket maximum of $6,000 or more. 

AVAILABILITY OF EMPLOYER-SPONSORED COVERAGE

Fifty-six percent of firms offer health benefits to at least some of their workers, similar overall to percentages in recent years (Exhibit H). The percentages of smaller firms (10 to 49 workers) offering coverage, however, has fallen since 2011 and years before. This trend precedes the ACA coverage expansions and is consistent with longer-term trends reported elsewhere.
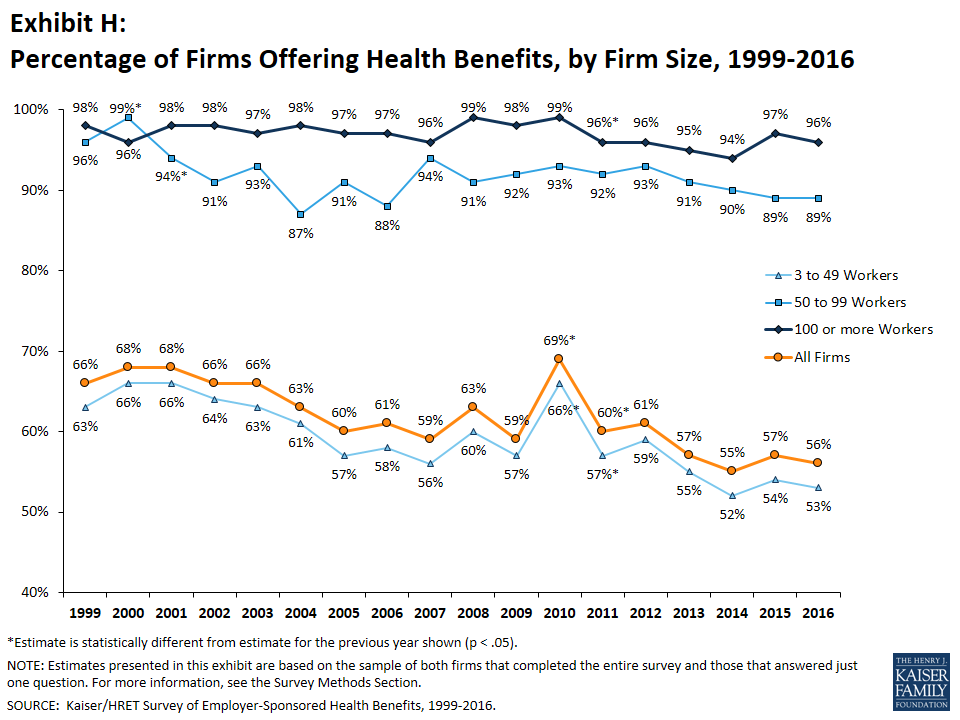
Exhibit H: Percentage of Firms Offering Health Benefits, by Firm Size, 1999-2016

The likelihood of offering health benefits differs significantly by firm size, with only 46% of employers with 3 to 9 workers offering coverage while virtually all employers with 1,000 or more workers offer coverage. Eighty-nine percent of workers are in a firm that offers health benefits to at least some of its employees, similar to recent years. Even when firms do offer health benefits, not all of their workers are covered there. Some workers are not eligible to enroll (e.g., waiting periods or part-time or temporary work status) and others who are eligible choose not to enroll (e.g., they feel the coverage is too expensive or they are covered through another source). In firms that offer coverage, an average of 79% of workers are eligible for the health benefits offered by the firm, and of those eligible, 79% take up the firm’s offer, resulting in 62% of workers in offering firms having coverage through their employer. If we look across workers both in firms that offer and those that do not offer health benefits, 55% of workers are covered by health plans offered by their employer. All of these percentages are similar to 2015. Over the longer term, however, the percentage of workers in all firms covered by a health plan from their employer has fallen from 59% in 2006 and 58% in 2011 to 55% in 2016 (Exhibit I).
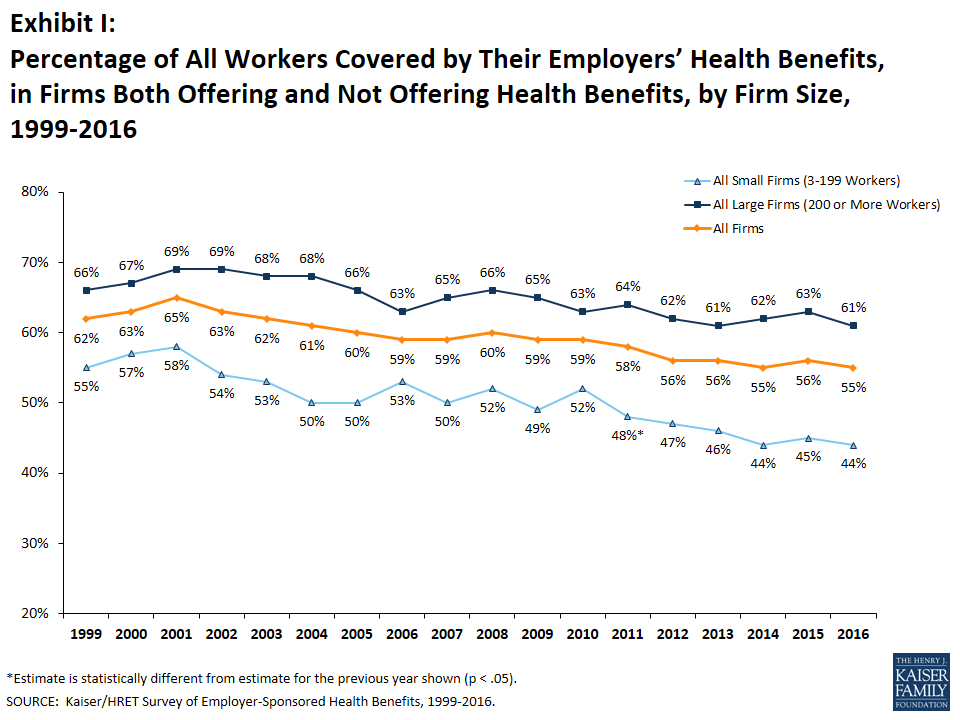
Exhibit I: Percentage of All Workers Covered by Their Employers’ Health Benefits, in Firms Both Offering and Not Offering Health Benefits, by Firm Size, 1999-2016

The Affordable Care Act (ACA) provision requiring employers with at least 50 full-time equivalent employees (FTEs) to offer health benefits that meet minimum standards for value and affordability to their full-time workers or pay a penalty took full effect in 2016. Ninety-seven percent of firms with at least 50 FTEs reported that they offer coverage to at least 95% of their employees who work on average 30 hours per week or more, and 96% responded that they offer at least one plan that met the ACA standards for affordability and minimum value. These firms were also asked about changes they planned to make or had made in the past year in response to the employer responsibility requirement. Two percent said they changed or planned to change the job classifications of some employees from full-time to part-time so that they would not be eligible for health benefits, while 7% said they changed or planned to change job classifications of some employees from part-time to full-time so that they would become eligible for health benefits. Other actions included 4% reducing or planning to reduce the number of full-time employees that they intended to hire because of the cost of providing health benefits to them, 2% increasing or planning to increase the waiting period before new employees become eligible for benefits, 12% extending or planning to extend eligibility for health benefits to workers who were not previously eligible, and 2% extending or planning to extend eligibility for more comprehensive benefits to employees previously eligible only for limited benefit plans. Coverage for Spouses and Unmarried Partners. Virtually all firms offering health benefits offer coverage for spouses, although 13% of small firms and 5% of large firms say that spouses are ineligible to enroll if a spouse is offered coverage from another source, and an additional 5% of small firms and 8% of large firms say that spouses offered coverage from other sources can enroll only under certain conditions. Twelve percent of firms offering coverage to spouses have a higher contribution or cost sharing for spouses who are eligible for coverage from another source, while 10% of firms offering coverage give additional compensation to employees who choose to enroll in their spouse’s plan.  Two percent of firms offering coverage to spouses report that they made a significant reduction in the amount that they contributed for covering employees’ spouses during the last year. All of these percentages are similar for small and large firms. Among firms offering family coverage, 32% offer coverage to same-sex unmarried partners, with an additional 33% saying they do not know or have not encountered the situation. Large firms are more likely to offer coverage to same-sex unmarried partners than small firms (49% vs. 32%); small firms are much more likely to say they do not know or have not encountered the situation (34% vs. 5%). Twenty-seven percent of firms offering family coverage offer to unmarried opposite-sex partners, with an additional 28% saying that do know or have not encountered the situation. Large firms are more likely to offer coverage to unmarried opposite-sex partners than smaller firms (42% vs. 26%); small firms are more likely to report they do not know or have not encountered the situation (28% vs. 2%). 

RETIREE COVERAGE

Of the large firms offering health benefits in 2016, 24% also offer health benefits to retirees, similar to the percentage in 2015 (23%). Among large firms that offer retiree health benefits, 92% offer health benefits to early retirees (workers retiring before age 65) and 72% offer health benefits to Medicare-age retirees. Six percent of large firms offering retiree benefits offer some retiree benefits through a corporate or private exchange, and 17% (down from 26% in 2015) report they are considering changing the way they offer retiree coverage because of the new health insurance exchanges established by the ACA. 

WELLNESS, HEALTH RISK ASSESSMENTS AND BIOMETRIC SCREENINGS

Employers continue to show interest in programs that encourage employees to identify health issues and to take steps to improve their health (Exhibit J). A large share now offer health screening programs including health risk assessments, which are questionnaires asking employees about lifestyle, stress or physical health, and in-person examinations such as biometric screenings. Many employers have incentive programs that reward or penalize employees for completing assessments, participating in wellness programs, or meeting biometric outcomes. These survey questions on these topics were revised for 2016 and are asked only of firms offering health benefits. Because there was considerable uncertainty among small firms on some questions, particularly those related to incentives, findings are reported only for large firms in some instances.
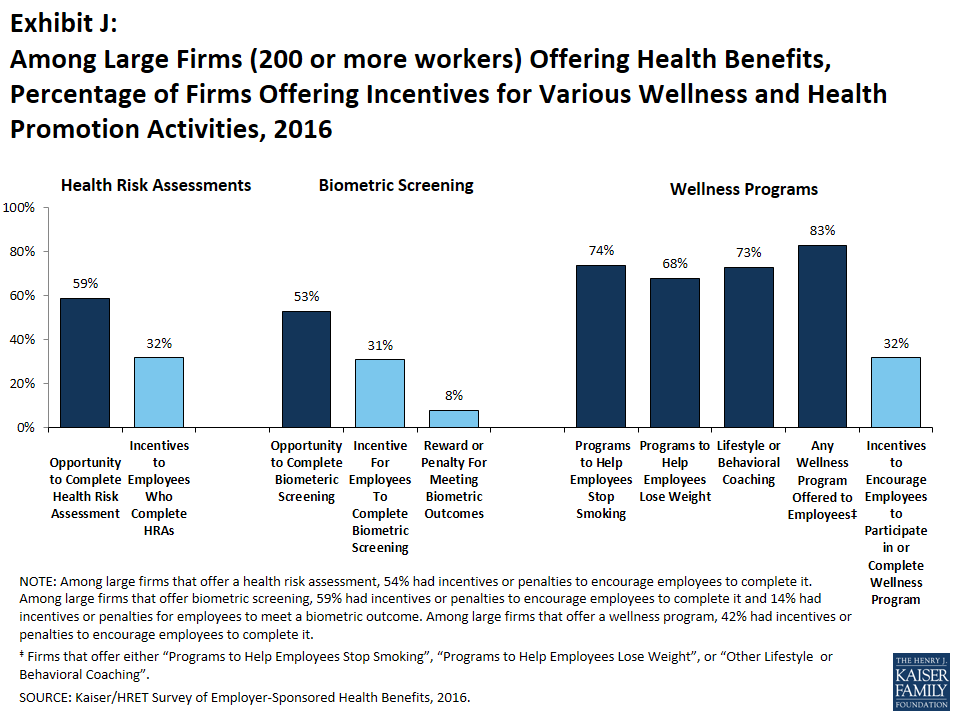
Exhibit J: Among Large Firms (200 or more workers) Offering Health Benefits, Percentage of Firms Offering Incentives for Various Wellness and Health Promotion Activities, 2016

Health Risk Assessments. Among firms offering health benefits, 32% of small firms and 59% of large firms provide employees with an opportunity to complete a health risk assessment. A health risk assessment includes questions about a person’s medical history, health status, and lifestyle. Fifty-four percent of large firms with a health risk assessment program offer a financial incentive to encourage employees to complete the assessment. Among large firms with an incentive, the incentives include: lower premium contributions or cost sharing (51% of firms); requiring a completed health risk assessment to be eligible for other wellness incentives (44% of firms); and cash, contributions to health-related savings accounts, or merchandise (60% of firms). Biometric Screening. Twenty percent of small firms and 53% of large firms offering health benefits offer employees the opportunity to complete biometric screening. Biometric screening is a health examination that measures an employee’s risk factors such as body weight, cholesterol, blood pressure, stress, and nutrition. Fifty-nine percent of large firms with biometric screening programs offer employees an incentive to complete the screening. Among large firms with an incentive, the incentives include: lower premium contributions or cost sharing (52% of firms); requiring a completed biometric screening to be eligible for other wellness incentives (32% of firms); and cash, contributions to health-related savings accounts, or merchandise (56% of firms). In addition, 14% of large employers with biometric screening programs have financial incentives tied to whether or not employees met or were able to meet specified biometric outcomes, such as a targeted body mass index (BMI) or cholesterol level. Health and Wellness Promotion Programs. Many employers offer wellness or health promotion programs to help employees improve their health and avoid unhealthy behaviors. Forty-six percent of small firms and 83% of large firms offer a program in at least one of these areas: smoking cessation; weight management; behavioral or lifestyle coaching. Three percent of small firms and 16% of large firms report collecting health information from employees through wearable devices such as a Fitbit or Apple Watch. Forty-two percent of large firms with one of these health and wellness programs offer employees a financial incentive to participate in or complete the program. Among large firms with an incentive for completing wellness programs, incentives include: lower premium contributions or cost sharing (34% of firms); cash, contributions to health-related savings accounts, or merchandise (76% of firms); some other type of incentive (14% of firms). Some firms separate financial incentives for different programs and some others have incentives that require participation in more than one type of program (e.g., completing an assessment and participating in a health promotion activity). We asked firms that had any incentives for health risk assessments, biometric screening or the specified health and wellness promotion programs what the maximum financial incentive was for a worker for all of their programs combined. Among large firms with any type of incentive, 26% have a maximum financial incentive of less than $150, 35% have a maximum incentive between $150 and $500, 23% have a maximum incentive between $500 and $1,000, 9% have a maximum incentive between $1,000 and $2,000, and 7% have a maximum incentive of $2000 or more. 

Sites of Care

Telemedicine. Thirty-nine percent of large firms that offer health benefits cover the provision of some health care services through telecommunication in their largest health plan. We revised our questions for 2016 to clarify that we were asking about payment for services and not just the electronic exchange of information. Among these firms, 33% reported that workers have a financial incentive to receive services through telemedicine as instead of visiting a physician’s office. Retail Health Clinics. Sixty percent of small firms and 73% of large firms cover services offering health benefits provided in retail health clinics, such as those found in pharmacies and supermarkets, in their largest health plan. Among large firms covering services in retail clinics, 10% reported that workers had a financial incentive to receive services in a retail clinic instead of visiting a traditional physician’s office. On-Site Health Clinics. Among firms with at least 50 employees offering health benefits, five percent provide health services to employees through an on-site health clinic in at least one of their major locations. Eighty-six percent of these firms provided some services for non-work-related illnesses through the on-site clinic. Firms with at least 1,000 workers were more likely to have an on-site health clinic than smaller firms (25% vs. 4%). 

PROVIDER NETWORKS

High Performance or Tiered Networks. Fourteen percent of large firms offering health benefits have high performance or tiered networks in their largest health plan, down from 24% last year. These programs identify providers that are more efficient or have higher quality care, and may provide financial or other incentives for enrollees to use the selected providers. Narrow Networks. Seven percent of firms offering health benefits offer a health plan that they consider to have a narrow network (i.e., a network they would consider more restrictive than a standard HMO network), similar to the percentage reported last year. There is no difference between small and large firms on this measure. Six percent of firms reported that they or their insurer had eliminated a hospital or health system from any of their plans’ networks in order or reduce costs. There is no difference between small and large firms on this measure. 

OTHER TOPICS

Self-Funding. Thirteen percent of covered workers in small firms and 82% in large firms are enrolled in plans that are either partially or completely self-funded, similar to last year. Overall, 61% of covered workers are enrolled in a plan that is either partially or completely self-funded. Private Exchanges. Four percent of firms offering health benefits with at least 50 employees offer health benefits through a private exchange. Private exchanges are arrangements, usually created by consultants, brokers or insurers, which allow employers to offer their employees a choice of different benefit options, often from different insurers. Among firms offering health benefits that do not currently offer through a private exchange, 18% with at least 50 workers, including 28% with at least 5,000 workers, say they have considered offering coverage through a private exchange. Professional Employment Organization. Some firms provide for health and other benefits by entering into a co-employment relationship with a Professional Employer Organization (PEO).  Under this arrangement, the firm manages the day-to-day responsibilities of employees, but the PEO hires the employees and acts as the employer for insurance, benefits, and other administrative purposes. Four percent of small firms offering health benefits offer coverage through a PEO, similar to last year. Grandfathered Health Plans. The ACA exempts “grandfathered” health plans from a number of its provisions, such as the requirement to cover preventive benefits without cost sharing or the new rules for small employers’ premiums ratings and benefits. An employer-sponsored health plan can be grandfathered if it covered a worker when the ACA became law (March 23, 2010) and if the plan has not made significant changes that reduce benefits or increase employee costs.5  Twenty-three percent of firms offering health benefits offer at least one grandfathered health plan in 2016, down from 35% last year. Twenty-three percent of covered workers are enrolled in a grandfathered health plan, similar to the percentage in 2015. 

EXCISE TAX ON HIGH-COST HEALTH PLANS

Under the ACA, employer health plans in 2020 will be subject to an excise tax of 40% on the amount by which their cost exceeds specified thresholds.6  The tax was scheduled to take effect in 2018, but its effective date was delayed two years. The tax is calculated with respect to each employee based on the combination of health benefits received by that employee, including the employer and employee share of health plan premiums and account contributions. Of firms offering health benefits, 15% of small firms and 64% of large firms say they have conducted an analysis to determine if they will exceed the thresholds, with 29% of the small firms and 27% of the large firms saying that their largest health plan would exceed the threshold in 2020. Some plans report planning or taking action in the last year in anticipation of the assessment: four percent of small firms and 15% of large firms increased cost sharing; three percent of small firms and nine percent of large firms switched to a lower cost plan or eliminated a plan option; three percent of small firms and eight percent of large firms moved benefit options to an account-based plan; and four percent of small firms and two percent of large firms selected a plan with a smaller network of providers. 

CONCLUSION

This is the fifth straight year of relatively low premium growth (family coverage growing between 3 and 4 percentage points each year), but the stability for premiums belies some other changes that have occurred during the period. Deductibles continued to grow in 2016; over the last five years, the percentage of covered workers facing a general annual deductible has grown from 74% to 83%, while the average single deductible amount (among those facing a deductible) increased from $991 to $1,478. These higher deductibles likely contributed to the moderating premium increases over this period. The higher deductibles have resulted, in part, by growing enrollment in HDHP/SOs, where enrollment has gone from 17% of covered workers in 2011 to 29% in 2016. Just in the last two years, enrollment in HDHP/SOs has grown by eight percentage points while PPO enrollment has declined by ten. More enrollment in HDHP/SOs has several implications for costs: they have higher deductibles than other plan types, but many enrollees also receive contributions to their HSA or HRAs that offset some or all of the cost sharing; they have lower total premiums and worker contribution amounts, although contributions by employers toward enrollee HRAs and HSAs offset some of the impact of the lower premiums for employers. There has been a reduction in offering for firms with 10 to 49 workers over the period, decreasing from 74% in 2011 (and 76% in 2012) to 66% in 2016. This change precedes the introduction of public marketplaces and premium tax credits, and other sources show a longer term reduction in offer rates among small private firms. Across all workers (both in firms that offer and do not offer coverage) during the period, the percentage of workers with coverage from their own employer has fallen from 58% in 2011 to 55% in 2016. Employers, particularly larger ones who employ most workers, continue to show interest in programs to improve health and in new delivery options. Significant shares of small and large employers offer employees the opportunity to complete health risk assessments or biometric screening or to participate in lifestyle coaching or other health promotion programs; many large employers provide employees with financial incentives to complete assessments or participate in programs. Employers also are covering services through new venues, such as retail health clinics and telemedicine, sometimes providing financial incentives for employees to use these new options. Finally, the continuing implementation of the ACA does not appear to be causing major disruptions in employer market. The employer responsibility provision was fully implemented in 2016, with virtually all employers with 50 or more FTEs saying that they offer coverage to full-time employees that meets affordability and minimum value standards. Relatively few employers made changes to working hours or hiring as a result of the provision, with more taking actions that increased coverage offers than reducing them, similar to the results last year. Most large employers, but few small employers, have analyzed how the high cost plan tax will affect them when it takes effect in 2020, with about 12% of offering firms saying they have taken some action in response to the tax. Looking forward, there are several emerging issues to watch. One is growth of HDHO/SOs, which after a lull, have seen significant enrollment growth in the last two years. These plans have relatively high cost sharing, but as discussed above, some workers receive significant account contributions to offset some of these costs. Another issue is whether the share of smaller firms offering coverage continues to fall. These firms are not required to offer coverage under the ACA, and in some cases, their workers might have more affordable options in public marketplaces than through work, which could encourage employers to stop offering. And, while the high-cost plan excise tax has been delayed until 2020, a meaningful share of employers estimates that they will be subject to the assessment. Only small shares of firms have reacted so far, but this may accelerate over the next couple of years if the 2020 date remains in place. 

METHODOLOGY

The Kaiser Family Foundation/Health Research & Educational Trust 2016 Annual Employer Health Benefits Survey (Kaiser/HRET) reports findings from a telephone survey of 1,933 randomly selected public and private employers with three or more workers. Researchers at the Health Research & Educational Trust, NORC at the University of Chicago, and the Kaiser Family Foundation designed and analyzed the survey. National Research, LLC conducted the fieldwork between January and June 2016. In 2016, the overall response rate is 40%, which includes firms that offer and do not offer health benefits. Among firms that offer health benefits, the survey’s response rate is also 40%. We asked all firms with which we made phone contact, even if the firm declined to participate in the survey: “Does your company offer a health insurance program as a benefit to any of your employees?” A total of 3,110 firms responded to this question (including the 1,933 who responded to the full survey and 1,177 who responded to this one question). Their responses are included in our estimates of the percentage of firms offering health benefits. The response rate for this question is 65%. Since firms are selected randomly, it is possible to extrapolate from the sample to national, regional, industry, and firm size estimates using statistical weights. In calculating weights, we first determine the basic weight, then apply a nonresponse adjustment, and finally apply a post-stratification adjustment. We use the U.S. Census Bureau’s Statistics of U.S. Businesses as the basis for the stratification and the post-stratification adjustment for firms in the private sector, and we use the Census of Governments as the basis for post-stratification for firms in the public sector. Some numbers in the report’s exhibits do not sum up to totals because of rounding effects, and, in a few cases, numbers from distribution exhibits referenced in the text may not add due to rounding effects. Unless otherwise noted, differences referred to in the text and exhibits use the 0.05 confidence level as the threshold for significance. For more information on the survey methodology, please visit the Methodology section at http://ehbs.kff.org/The Kaiser Family Foundation, a leader in health policy analysis, health journalism and communication, is dedicated to filling the need for trusted, independent information on the major health issues facing our nation and its people.  The Foundation is a non-profit private operating foundation based in Menlo Park, California. The Health Research & Educational Trust (HRET) Founded in 1944, the Health Research & Educational Trust (HRET) is the not-for-profit research and education affiliate of the American Hospital Association (AHA). HRET’s mission is to transform health care through research and education. HRET’s applied research seeks to create new knowledge, tools and assistance in improving the delivery of health care by providers and practitioners within the communities they serve.

Section One: Cost Of Health Insurance

The average annual premiums in 2016 are $6,435 for single coverage and $18,142 for family coverage. The average family premiums increased approximately 3% since 2015. The average family premium has increased 58% since 2006 and 20% since 2011. The average family premium for covered workers in small firms (3-199 workers) ($17,546) is significantly lower than average family premiums for workers in large firms (200 or more workers) ($18,395).

Premium Costs for Single and Family Coverage

  • The average premium for single coverage in 2016 is $536 per month, or $6,435 per year. The average premium for family coverage is $1,512 per month or $18,142 per year 1.
  • The average annual premiums for covered workers in HDHP/SOs are lower for single ($5,762) and family coverage ($16,737) than the overall average premiums for covered workers. The average premiums for covered workers enrolled in PPO plans are higher for single ($6,800) and family coverage ($19,003) than the overall plan average 1.
  • The average annual premium for family coverage for covered workers in small firms ($17,546) is lower than the average premium for covered workers in large firms ($18,395) 2.
  • The average family premium for covered workers is lower in the South ($17,429) than the average premium for covered workers in all other regions 3.
  • The average single premium for covered workers employed in the retail industry ($5,807) is lower than the average premium for covered workers in all other industries. The average single premium for covered workers employed in the state/local government industry ($7,218) is higher than the average premium for covered workers in all other industries 4.
  • The average family premium for covered workers employed in the retail industry ($16,321) is lower than the average premium for covered workers in all other industries 4.
  • The average single premium for covered workers in firms with a larger share of younger workers (where 35% or more of the workers are age 26 or younger) is lower than the average premium for covered workers in firms with a lower share of younger workers ($6,047 vs. $6,472) 5.
  • The average family premium for covered workers in firms with some union workers ($18,906) is higher than the average premium for covered workers in firms without union workers ($17,748) 6.

The Distribution of Premiums

  • There is considerable variation in premiums for both single and family coverage.
  • Eighteen percent of covered workers are employed in a firms with a single premium at least 20% higher than the average single premium, while 19% of covered workers are in firms with a single premium less than 80% of the average single premium 7 and 8.
  • For family coverage, 17% of covered workers are employed in a firm with a family premium at least 20% higher than the average family premium, while 19% of covered workers are in firms with a family premium less than 80% of the average family premium7 and 8.
  • Seven percent of covered workers are in a firm with a premium of $9,000 a year or more for single coverage 9. Nine percent of covered workers are in a firm with a premium of $24,000 a year or more for family coverage 10.

Premium Changes Over Time

  • The 2016 average family coverage premiums are three percent higher than the 2015 average premiums 11.
  • The $18,142 average family premium in 2016 is 20% higher than the average family premium in 2011 and 58% higher than the average family premium in 2006 11 and 16. The 20% family premium growth in the last five years is smaller than the 31% growth between 2006 and 2011, or the 63% premium growth between 2001 and 2006 16.
  • The average family premiums for both small and large firms have seen a similar increase since 2011 (24% for small and 19% for large). For small firms (3 to 199 workers), the average family premium rose from $14,098 in 2011 to $17,546 in 2016. For large firms (200 or more workers), the average family premium rose from $15,520 in 2011 to $18,395 in 2016 13.
  • The rates of growth for the average family premiums in small firms and large firms since 2006 also have been similar. Since 2006, the average family premium for small firms increased 55% ($17,546 in 2016 vs. $11,306 in 2006), and the average family premium for large firms increased 59% ($18,395 in 2016 vs. $11,575 in 2006) 13.
  • For covered workers in large firms, the average family premium in firms that are fully insured has grown between 2011 to 2016 at a similar rate to premiums for workers in fully or partially self-funded firms (21% for fully insured plans and 18% for self-funded firms) 17.

Section Two: Health Benefits Offer Rates

While nearly all large firms (200 or more workers) offer health benefits to at least some employees, small firms (3-199 workers) are significantly less likely to do so. The percentage of all firms offering health benefits in 2016 (56%) is similar to the percentages of firms offering health benefits in 2006 (61%) and 2011 (60%). The percentages of smaller firms (10 to 49 workers) offering coverage, however, has fallen since 2011 and years before. This trend precedes the ACA coverage expansions and is consistent with longer-term trends reported elsewhere.

Firms not offering health benefits continue to cite cost as the most important reason they do not do so. Almost all firms that offer coverage offer to dependents such as children and the spouses of eligible employees.

  • In 2016, 56% of firms offer health benefits, similar to the 57% who reported doing so in 2015 1.
  • Ninety-eight percent of large firms offer health benefits to at least some of their workers 3. In contrast, only 55% of small firms offer health benefits in 2016. The percentage of both small and large firms offering health benefits to at least some of their workers is similar to last year 2.
  • Since most firms in the country are small, variation in the overall offer rate is driven largely by changes in the percentages of the smallest firms (3-9 workers) offering health benefits. For more information on the distribution of firms in the country, see the Survey Design and Methods Section and Exhibit M1.7 
  • Ninety-six percent of firms with 100 or more workers offer health benefits to at least some of their employees in 2016. Eighty-nine percent of firms with 50 to 99 workers offer benefits to at least some workers 4.
  • The percentages of smaller firms (10 to 49 workers) offering coverage has fallen since 2011 and years before.
  • The overall percentage of firms offering coverage in 2016 is similar to the percentage offering coverage in 2011 (60%) and 2006 (61%).
  • Offer rates vary across different types of firms.
  • Small firms are less likely to offer health insurance: 46% of firms with 3 to 9 workers offer coverage, compared 80% of firms with 25 to 49 workers, and 91% of firms with 50 to 199 employees 3.
  • Offer rates throughout different firm size categories in 2016 remain similar to those reported in 2015 2.

Part-Time and Temporary Workers

  • Among firms offering health benefits, relatively few offer benefits to their part-time and temporary workers.
  • The Affordable Care Act (ACA) defines part-time workers as those who on average work fewer than 30 hours per week. The employer shared responsibility provision of the ACA requires that large firms offer full-time employees a minimum standard of coverage or be assessed a penalty.8  Beginning in 2015, we modified the survey to explicitly ask employers whether they offered benefits to employees working fewer than 30 hours. Our previous question did not include a definition of “part-time”. For this reason, historical data on part-time offer rates are shown, but we did not test whether the differences between 2014 and 2015 were significant. Many employers may work with multiple definitions of part-time; one for their compliance with legal requirements and another for internal policies and programs.
  • In 2016, 16% of all firms that offer health benefits offer them to part-time workers 7. Large firms are more likely to offer health benefits to part-time employees than small firms (33% vs. 15%) 9.
  • A small percentage (4%) of firms offering health benefits offer them to temporary workers 8. More large firms offering health benefits elect to offer temporary workers coverage than small firms (17% vs. 3%) 10. The percentage of large firms offering health benefits to temporary workers is higher than the 11% reported in 2015.

Spouses, Dependents and Domestic Partner Benefits

  • The majority of firms offering health benefits offer to spouses and dependents, such as children. In 2016, 89% of small firms and 99% of large firms offering health benefits offer coverage to spouses 11. Fewer small firms offer coverage to spouses in 2016 than did in 2015 (98%). Eighty-eight percent of small firms and 100% of large firms offering health benefits cover other dependents, such as children, similar to last year. Eleven percent of small firms offering health benefits offer only single coverage to employees, higher than the 2% of small firms last year.
  • Employers were also asked whether same-sex or opposite-sex domestic partners were allowed to enroll in the firm’s coverage. While definitions may vary, employers often define domestic partners as an unmarried couple who has lived together for a specified period of time. Firms may define domestic partners separately from any legal requirements a state may have, and also, employers may have a different policy in different parts of the country.
  • In 2016, 27% of firms offering health benefits offer coverage to opposite-sex domestic partners, similar to the 28% who did so in 2015. Thirty-two percent of firms offering health benefits offer coverage to same-sex domestic partners, similar to the 42% who did so last year 13.
  • When we ask employers if they offer health benefits to opposite or same-sex domestic partners, many firms report that they have not encountered this issue. At many small firms, the firm may not have formal human resource policies on domestic partners simply because none of the firm’s employees have asked to cover a domestic partner. Regarding health benefits for opposite-sex domestic partners, 28% of firms report in 2016 that they have not encountered this request or that the question was not applicable 12. The vast majority of firms in the United States are small businesses; 61% of firms have between 3 and 9 employees and 98% have between 3 and 199 employees (Exhibit M.1). Therefore, statistics about the percentage of firms that offer domestic partner benefits are largely determined by small businesses. More small firms (28%) compared to large firms (2%) indicate that they have not encountered this request or that the question was not applicable 12. Regarding health benefits for same-sex domestic partners, 33% of firms report that they have not encountered the request or that the question was not applicable. More small firms (34%) than large firms (5%) report that they have not encountered the issue of offering benefits to same-sex domestic partners 12.
  • Virtually all firms offering family coverage offer coverage to spouses. Among firms offering health benefits to spouses, 13% do not allow an employee’s spouse to enroll in the firm’s plan if that spouse is offered coverage from another source, and an additional 5% allow the spouse to enroll subject to conditions 14. Among firms offering health benefits to spouses, 12% require an employee’s spouse to contribute more to the coverage if that spouse is offered coverage from another source. Very large firms (5,000 or more workers) are more likely than smaller firms to require higher spousal contributions when the spouse is offered coverage elsewhere (26% vs. 12%).
  • Among firms offering health benefits to spouses, 2% have made a significant reduction in the amount they contribute to cover an employee’s spouse in the last year, with no difference between small and large firms 15.
  • Among all firms that offer health benefits, 10% report providing additional compensation or benefits to employees if they enroll in a spouse’s plan, and 9% provide additional compensation or benefits to employees if they do not participate in the firm’s health benefits 16.

Firms Not Offering Health Benefits

  • The survey asks firms that do not offer health benefits if they have offered insurance or shopped for insurance in the recent past, and about their most important reasons for not offering coverage. Because such a small percentage of large firms report not offering health benefits, we present responses for small non-offering firms only.
  • The cost of health insurance remains the primary reason cited by firms for not offering health benefits. Among small firms not offering health benefits, 34% cite high cost as “the most important reason” for not doing so, followed by “employees are generally covered under another plan” (24%) 17.       Relatively few small employers indicate that they do not offer because they believe that employees will get a better deal on the health insurance exchanges (1%).
  • Many non-offering small firms have either offered health insurance in the past five years, or shopped for health insurance in the past year. Nineteen percent of non-offering small firms have offered health benefits in the past five years, while 23% have shopped for coverage in the past year 18. The 19% of non-offering small firms that have offered coverage in the past five years is similar to the 25% reported last year.
  • Thirty percent of non-offering small firms report that they stopped offering coverage within the last year, similar to the percentage (38%) last year.
  • Among non-offering small firms, 11% report that they provide funds to their employees to purchase health insurance on their own in the individual market or through a health insurance exchange 19. The IRS has issued guidance limiting the circumstances in which employers can contribute to an employee’s non-group plan going forward.9 

SHOP Exchanges

The Small Business Health Options Program (SHOP) is federal or state sponsored exchanges in which employers may offer and contribute to health insurance provided to their employees. Firms with 50 or fewer full-time equivalent workers (FTEs) are eligible to participate in a SHOP exchange. Beginning in 2016, states have the option to expand SHOP to include firms with up to 100 FTEs. Some employers are eligible for tax credits when purchasing coverage on the exchanges.

  • Eighteen percent of firms with 3 to 50 FTEs who do not offer health benefits said they looked at coverage on a SHOP exchange 20.
  • Thirteen percent of firms with 3 to 50 FTEs who offer health benefits said they looked at coverage on a SHOP exchange 20.
  • Among non-offering firms with 50 or fewer FTEs that looked at coverage but chose not to purchase on a SHOP exchange, 70% reported they did not do so because the plans were too expensive 21.
  • Among offering firms with 50 or fewer FTEs that looked at coverage but chose not to purchase on a SHOP exchange, their reasons included that they like their current insurer or broker (67%) and that they got a better deal elsewhere (64%) 22.

Section Three: Employee Coverage, Eligibility, And Participation

Employers are the principal source of health insurance in the United States, providing health benefits for about 150 million non-elderly people in America.10  Most workers are offered health coverage at work, and the majority of workers who are offered coverage take it. Workers may not be covered by their own employer for several reasons: their employer may not offer coverage, they may be ineligible for the benefits offered by their firm, they may elect to receive coverage through their spouse’s employer, or they may refuse coverage from their firm. Before eligible employees may enroll, almost three-quarters (72%) of covered workers face a waiting period, although the average length waiting periods for covered workers with waiting periods has decreased since 2014 when an ACA provision prescribing a maximum waiting period of 90 days was implemented.

  • Among workers at firms offering health benefits, 62% percent of workers are covered by health benefits through their own employer 2.
  • Among workers in all firms, including those that offer and those that do not offer health benefits, 55% of workers are covered by health benefits offered by their employer, similar to the percentage (56%) last year. The coverage rate in 2016 is lower than the coverage rate in 2006 (59%) and in 2011 (58%) 1.

Eligibility

  • Not all employees are eligible for the health benefits offered by their firm, and not all eligible employees “take up” (i.e., elect to participate in) the offer of coverage. The share of workers covered in a firm is a product of both the percentage of workers who are eligible for the firm’s health insurance and the percentage that choose to take up the benefit. The percentage of workers eligible for health benefits at offering firms in 2016 is similar to last year for both small firms and large firms 6.
  • Seventy-nine percent of workers in firms offering health benefits are eligible for the coverage offered by their employer. The percentage of eligible workers is higher is small firms than in large firms (82% vs. 78%) 2.
  • Eligibility varies considerably by wage level. Employees in firms with a larger share of higher-wage workers (35% or more earn $59,000 or more annually) are more likely to be eligible for health benefits than employees in firms with a smaller share of higher-wage workers (86% vs. 73%) 3.
  • Eligibility also varies by the age of the workforce. Those in firms with a smaller share of younger workers (less than 35% of workers are age 26 or younger) are more likely to be eligible for health benefits than those in firms with a larger share of younger workers (81% vs. 64%) 3.
  • The average eligibility rate is particularly low (55%) in retail firms 2.

Take-up Rate

  • Employees who are offered health benefits generally elect to take up the coverage. In 2016, 79% of eligible workers take up coverage when it is offered to them, unchanged from last year 6.11 
  • The likelihood of a worker accepting a firm’s offer of coverage also varies with the workforce’s wage level. Eligible employees in firms with a smaller share of lower-wage workers are more likely to take up coverage than eligible employees in firms with a larger share of lower-wage workers (35% or more of workers earn $23,000 or less annually) (80% vs. 61%). A similar pattern exists in firms with a larger share of higher-wage workers, with workers in these firms being more likely to take up coverage than those in firms with a smaller share of higher-wage workers (84% vs. 73%) 4.
  • The percentage of eligible workers taking up benefits in offering firms varies considerably by industry 2.

Coverage

  • The percentage of workers at firms offering health benefits that are covered by their firm’s health plan in 2016 is 62%. The coverage rate at firms offering health benefits is similar to last year for both small firms and large firms 6.
  • There is significant variation by industry in the coverage rate among workers in firms offering health benefits. For example, only 37% of workers in retail firms offering health benefits are covered by the health benefits offered by their firm, compared to 77% of workers in manufacturing, and 77% of workers in the state/local government industry category 2.
  • Among workers in firms offering health benefits, those in firms with a smaller share of lower-wage workers (less than 35% of workers earn $23,000 or less annually) are more likely to be covered by their own firm than workers in firms with a larger share of lower-wage workers (64% vs. 45%). A comparable pattern exists in firms with a larger share of higher-wage workers (35% or more earn $59,000 or more annually), with workers in these firms more likely to be covered by their employer’s health benefits than those in firms with a smaller share of higher-wage workers (72% vs. 54%) 5.
  • Among workers in firms offering health benefits, those in firms with a smaller share of younger workers (less than 35% of workers are age 26 or younger) are more likely to be covered by their own firm than those in firms with a larger share of younger workers (65% vs. 43%) 5.
  • Among workers in all firms, including those that offer and those that do not offer health benefits, 55% of workers are covered by health benefits offered by their employer, similar to the percentage (56%) last year. The coverage rate in 2016 is lower than the coverage rate in 2006 (59%) and in 2011 (58%),

Waiting Periods

  • Waiting periods are a specified length of time after beginning employment before employees are eligible to enroll in health benefits. With some exceptions, the Affordable Care Act requires that waiting periods cannot exceed 90 days.12  For example, employers are permitted to have orientation periods before the waiting period begins which, in effect, means an employee is not eligible for coverage 3 months after hire. If an employee is eligible to enroll on the 1st of the month after three months of employment, this survey rounds up and considers the firm’s waiting period four months. For these reasons, some employers still have waiting periods exceeding the 90-day maximum.
  • Seventy-two percent of covered workers face a waiting period before coverage is available, similar to last year 9. Covered workers in small firms (3-199 workers) are more likely than those in large firms to have a waiting period (78% vs. 70%) 7.
  • The average waiting period among covered workers who face a waiting period is 1.9 months 7. A small percentage (3%) of covered workers with a waiting period have a waiting period of more than 3 months.
  • Among firms with a waiting period of greater than 4 months, a majority of firms indicated that they have an employee measurement period. 13 


Section Four: Types Of Plans Offered

Most firms that offer health benefits offer only one type of health plan (83%) (see text box). Large firms (200 or more workers) are more likely to offer more than one type of health plan than small firms (3-199 workers). Employers are most likely to offer their workers a PPO plan and are least likely to offer a conventional plan (sometimes known as indemnity insurance).

  • Eighty-three percent of firms offering health benefits in 2016 offer only one type of health plan. Large firms are more likely to offer more than one plan type than small firms (53% vs. 16%) 1.
  • In addition to looking at the percentage of firms that offer multiple plan types, the percentage of covered workers at firms that offer multiple plan types can also be analyzed. Fifty-nine percent of covered workers are employed in a firm that offers more than one health plan type. Sixty-nine percent of covered workers in large firms are employed by a firm that offers more than one plan type, compared to 35% in small firms 2.
  • Nearly three quarters (74%) of covered workers in firms offering health benefits work in firms that offer one or more PPO plans; 56% work in firms that offer one or more HDHP/SO plans; 33% work in firms that offer one or more HMO plans; 13% work in firms that offer one or more POS plans; and 2% work in firms that offer one or more conventional plans 4.14 
  • Among firms offering only one type of health plan, covered workers in large firms are more likely to be offered PPO plans than covered workers in small firms (62% vs. 39%), while covered workers in small firms are more likely to be offered HMO (12%) and POS (22%) plans than covered workers in large firms (3% and 4%, respectively) 5.
  • Among firms offering only one type of health plan, 29% of covered workers are in firms that only offer an HDHP/SO and 51% of covered workers are in firms that only offer a PPO 5.

The survey collects information on a firm’s plan with the largest enrollment in each of the plan types.  While we know the number of plan types a firm has, we do not know the total number of plans a firm offers workers. In addition, firms may offer different types of plans to different workers. For example, some workers might be offered one type of plan at one location, while workers at another location are offered a different type of plan.

HMO is health maintenance organization.

PPO is preferred provider organization.

POS is point-of-service plan.

HDHP/SO is high-deductible health plan with a savings option such as an HRA or HSA.

Section Five: Market Shares Of Health Plans

Enrollment remains highest in PPO plans, covering just under half of covered workers, followed by HDHP/SOs, HMO plans, POS plans, and conventional plans. Enrollment distribution varies by firm size: for example, PPOs are relatively more popular for covered workers at large firms (200 or more workers) than small firms (3-199 workers) (52% vs. 39%) and POS plans are relatively more popular among small firms than large firms (18% vs. 4%). Enrollment in HDHP/SOs has increased significantly over the past two years while enrollment in PPOs has fallen.

  • Forty-eight percent of covered workers are enrolled in PPOs, followed by HDHP/SOs (29%), HMOs (15%), POS plans (9%), and conventional plans (< 1%) 1. More covered workers are enrolled in HDHP/SO plans than in HMOs in both small firms and large firms 2.
  • The percentage of covered workers enrolled in HDHP/SOs in is similar to last year but has grown significantly since 2014 (29% vs. 20%).15  Since 2014, enrollment in PPOs has fallen significantly (48% vs. 58%) 1.
  • Plan enrollment patterns vary by firm size.
  • Covered workers in large firms are more likely than covered workers in small firms to enroll in PPOs (52% vs. 39%). Covered workers in small firms are more likely than covered workers in large firms to enroll in POS plans (18% vs. 4%) 2.
  • The share of covered workers in HDHP/SOs is similar for large firms and small firms 2.
  • Plan enrollment patterns also differ across regions.
  • HMO enrollment is significantly higher in the West (30%) and significantly lower in the South (10%) and Midwest (6%) 3.
  • Covered workers in the South (57%) are more likely to be enrolled in PPOs than workers in other regions; covered workers in the West (35%) and the Northeast (39%) are less likely to be enrolled in a PPO 3.
  • Enrollment in HDHP/SOs is similar across regions 3.
  • Plan enrollment patterns differ by industry as well.
  • Covered workers in the agriculture/mining/construction, (5%), manufacturing (8%) and finance (8%) are less likely to be enrolled in an HMO plan than covered workers in other industries. Covered workers in the service industry (20%) are more likely to be enrolled in an HMO than covered workers in other industries 3.
  • Covered workers in the state/local government (64%) are more likely to be enrolled in a PPO plan than covered workers in other industries. Covered workers in the finance industry (32%) are less likely to be enrolled in a PPO than covered workers in other industries 3.
  • Covered workers in the state/local government (19%) and agriculture/mining/construction industries (15%) are less likely to be enrolled in an HDHP/SO plan than covered workers in other industries. Covered workers in the finance industry (49%) are more likely to be enrolled in an HDHP/SO than covered workers in other industries

Section Six: Worker And Employer Contributions For Premiums

In 2016, premium contributions by covered workers average 18% for single coverage and 30% for family coverage.16  The average monthly worker contributions are $94 for single coverage ($1,129 annually) and $440 for family coverage ($5,277 annually).17  Covered workers in small firms (3-199 workers) have a lower average contribution amount for single coverage ($1,021 vs. $1,176), but a higher average contribution amount for family coverage ($6,597 vs. $4,719) than covered workers in large firms (200 or more employees).

  • In 2016, covered workers on average contribute 18% of the premium for single coverage and 30% of the premium for family coverage 1. These contribution percentages have remained stable in recent years for both single and family coverage.
  • Covered workers in small firms contribute a higher percentage of the premium for family coverage (39% vs. 26%) than covered workers in large firms 23.
  • On average, workers with single coverage contribute $94 per month ($1,129 annually), and workers with family coverage contribute $440 per month ($5,277 annually) towards their health insurance premiums 2, 3, and 4.
  • The average worker contribution in HDHP/SOs is lower than the overall average worker contribution for single coverage ($943 vs. $1,129) and family coverage ($4,289 vs. $5,277) 5.
  • Worker contributions also differ by firm size. As in previous years, workers in small firms contribute a lower amount annually for single coverage than workers in large firms ($1,021 vs. $1,176). In contrast, workers in small firms with family coverage contribute significantly more annually than workers in large firms ($6,597 vs. $4,719) 6.
  • The average worker contributions for single coverage and family coverage are similar to last year for both small firms and large firms 8 and 9.

Variation in Worker Contributions to the Premium

  • The majority of covered workers are employed by a firm that contributes at least half of the premium for single and family coverage.
  • Twelve percent of covered workers are in plans where the employer pays the entire premium for single coverage; three percent of covered workers are in plans where the employer pays the entire premium for family coverage 17.
  • Covered workers in small firms are much more likely to work for a firm that pays 100% of the premium than workers in large firms. Thirty percent of covered workers in small firms have an employer that pays the full premium for single coverage, compared to five percent of covered workers in large firms 18. For family coverage, eight percent of covered workers in small firms have an employer that pays the full premium, compared to one percent of covered workers in large firms 19.
  • Fifteen percent of covered workers have a plan where they are required to contribute more than 50% of the cost of family coverage.
  • Three percent of covered workers in small firms and 1% of covered workers in large firms contribute more than 50% of the premium for single coverage 18. For family coverage, 34% of covered workers in small firms work in a firm where they must contribute more than 50% of the premium, compared to seven percent of covered workers in large firms 19.
  • There is considerable variation around the distribution of the average dollar contribution amounts. Note that we changed our methods beginning in 2016: previously, the percentages were calculated excluding workers who do not make a premium contribution; now all covered workers are included (with a zero dollar contribution value for those workers where the employer pays 100% of the premium).
  • For single coverage, 34% of covered workers contribute $1,355 or more annually (120% or more of the average worker contribution), while 41% of covered workers have an annual worker contribution of less than $903 (less than 80% of the average worker contribution) 16.
  • For family coverage, 27% of covered workers contribute $6,332 or more annually (120% or more of the average worker contribution), while 41% of covered workers have an annual worker contribution of less than $4,222 (less than 80% of the average worker contribution) 16.

Differences by Firm Characteristics

  • The percentage of the premium paid by covered workers varies by several firm characteristics.
  • Covered workers in firms with a larger share of lower-wage workers (35% or more earn $23,000 or less annually) contribute a greater percentage of the premium for single coverage (23% v. 18%) and family coverage (35% vs. 30%) than those in firms with a smaller share of lower-wage workers 21 and 22. Covered workers in firms with a larger share of higher-wage workers (35% or more earn $59,000 or more a year) contribute less on average for family coverage (27% vs. 33%) than those in firms with a smaller share of higher-wage workers.
  • Looking at dollar amounts, covered workers in firms with a larger share of lower-wage workers (35% or more earn $23,000 or less annually) on average contribute $1,322 for single coverage compared with $1,115 for covered workers in firms with a smaller share of lower-wage workers 15.
  • Covered workers in large firms that have at least some union workers have lower average contribution percentages for family coverage than those in firms without any unionized workers (22% vs. 29%). Covered workers at firms with some union workers have a lower average contribution amount for family coverage ($4,264 vs. $5,800) 15 and 22.
  • Covered workers in large firms that are partially or completely self-funded have a lower average percentage contribution for family coverage than workers in large firms that are fully insured (25% vs. 30%) 22.18 
  • Covered workers in public organizations have lower average premium contributions for single and family coverage than workers in private for-profit firms 21 and 22.

Contribution approaches

  • Firms take different approaches for contributing towards family coverage. Among firms offering health benefits, 45% of small firms and 18% of large firms contribute the same dollar amount for single coverage as for family coverage, which means that the worker must pay the entire difference between the cost of single and family coverage if they wish to enroll their family members. Forty-five percent of small firms and 67% of large firms make a larger dollar contribution for family coverage than for single coverage 26.
  • Among firms offering health benefits, 15% require workers who use tobacco to contribute more towards the premium or cost-sharing than those who do not use tobacco 28.

Changes over Time

  • The average worker contributions for single and family coverage have increased 80% and 78%, respectively, over the last 10 years, and 23% and 28%, respectively, over the last five years.
  • The average premium contributions for covered workers with single and family coverage have grown at similar rates in small firms and large firms 8 and 9.

Section Seven: Employee Cost Sharing

In addition to any required premium contributions, most covered workers face cost sharing for the medical services they use. Cost sharing for medical services can take a variety of forms, including deductibles (an amount that must be paid before most services are covered by the plan), copayments (fixed dollar amounts), and/or coinsurance (a percentage of the charge for services). The type and level of cost sharing often vary by the type of plan in which the worker is enrolled. Cost sharing may also vary by the type of service, such as office visits, hospitalizations, or prescription drugs.

The cost-sharing amounts reported here are for covered workers using services provided in-network by participating providers. Plan enrollees receiving services from providers that do not participate in plan networks often face higher cost sharing and may be responsible for charges that exceed plan allowable amounts. The framework of this survey does not allow us to capture all of the complex cost-sharing requirements in modern plans, particularly for ancillary services (such as durable medical equipment or physical therapy) or cost-sharing arrangements that vary across different settings (such as tiered networks). Therefore, we do not collect information on all plan provisions and limits that affect enrollee out-of-pocket liability.

General Annual Deductibles For Workers in Plans with Deductibles

  • A general annual deductible is an amount that must be paid by enrollees before most services are covered by their health plan. Non-grandfathered health plans are required to cover some services such as preventive care without cost sharing. Some plans require enrollees to meet a service-specific deductible such as on prescription drugs or hospital admissions in lieu of or in addition to a general deductible.
  • Eighty-three percent of covered workers are enrolled in a plan with a general annual deductible for single coverage, similar to 81% in 2015. Since 2011, the percentage of covered workers with a general annual deductible for single coverage has increased from 74% to 83% 2.
  • The percentage of covered workers enrolled in a plan with a general annual deductible for single coverage is similar for small firms (3-199 workers) and large firms (200 0r more workers) (82% and 83%) 1.
  • The likelihood of having a deductible varies by plan type. Covered workers in HMOs are less likely to have a general annual deductible for single coverage than workers in other plan types. Fifty-four percent of workers in HMOs do not have a general annual deductible for single coverage, compared to 24% of workers in POS plans and 16% of workers in PPOs 1. The percentage of covered workers in HMO plans with a general annual deductible for single coverage has increased from 29% in 2011 to 46% in 2016 2.
  • Covered workers in plans without a general annual deductible often have other forms of cost sharing when they are hospitalized or use other medical services. For covered workers in plans without a general annual deductible with single coverage, 82% in HMOs, 64% in PPOs, and 78% in POS plans are in plans that require some cost sharing for hospital admissions. The percentages are similar for family coverage 4.
  • For covered workers in a plan with a general annual deductible, the average annual deductible for single coverage is $1,478, an increase over the average deductible ($1,318) last year 7.
  • Average deductibles vary considerably by plan type. For covered workers in plans with a general annual deductible, the average deductibles for single coverage are $917 in HMOs, $1,028 in PPOs, $1,737 in POS plans, and $2,199 for HDHP/SOs 5.
  • Deductibles for single coverage are generally higher for covered workers in small firms than for covered workers in large firms across plan types. For example, for covered workers in PPOs with a general annual deductible, the average deductible amount for single coverage in small firms is more than twice as large as the average deductible amount in large firms ($1,662 vs. $814). Overall, for covered workers in plans with a general annual deductible, the average deductible amount for single coverage in small firms is higher than the average deductible amount in large firms ($2,069 vs. $1,238) 5.
  • The average general annual deductible for single coverage for covered workers in plans with a deductible has increased 49% over the last five years, from $991 in 2011 to $1,478 in 2016 7.
  • There is considerable variation in the dollar values of general annual deductibles for covered workers at different firms. For example, 25% of covered workers enrolled in a PPO plan with a general annual deductible for single coverage have a deductible of less than $500 while 14% have a deductible of $2,000 or more 16.
  • For family coverage, the majority of covered workers with general annual deductibles have an aggregate deductible, meaning all family members’ out-of-pocket expenses count toward meeting the deductible amount. Among those with a general annual deductible for family coverage, the percentages of covered workers with an average aggregate general annual deductible are 61% for workers in HMOs, 64% for workers in PPOs, and 77% for workers in POS plans 18.
  • The average deductible amounts for covered workers with an aggregate deductible for family coverage are $2,245 for HMOs, $2,147 for PPOs, $3,769 for POS plans, and $4,343 for HDHP/SOs 19. Deductible amounts for aggregate family deductibles are similar to last year for plan types other than POS plans 20.
  • The other type of family deductible, a separate per-person deductible, requires each family member to meet a separate per-person deductible amount before the plan covers expenses for that member. Many plans with separate per-person family deductibles (71%) consider the deductible met for all family members if a prescribed number of family members each reaches his or her separate deductible amounts 23. Plans may also require each family member to meet a separate per-person deductible until the family’s combined spending reaches a specified dollar amount.
  • For covered workers in health plans that have separate per-person general annual deductible amounts for family coverage, the average deductibles are $632 for HMOs, $1,052 for PPOs, $1,180 for POS plans, and $2,411 for HDHP/SOs 19.
  • Most covered workers in plans with a separate per-person general annual deductible for family coverage have a limit to the number of family members required to meet the separate deductible amounts 23.19  Among those covered workers in plans with a limit on the number of family members, the most frequent number of family members required to meet the separate deductible amounts is two (45%) 24.
  • The majority of covered workers with a general annual deductible are in plans where the deductible does not have to be met before certain services, such as physician office visits or prescription drugs, are covered.
  • Large majorities of covered workers (87% in HMOs, 72% in PPOs, and 60% in POS plans) with general annual deductibles are enrolled in plans where the deductible does not have to be met before physician office visits for primary care are covered 26.
  • Similarly, among workers with a general annual deductible, large shares of covered workers in HMOs (93%), PPOs (91%), and POS plans (89%) are enrolled in plans where the general annual deductible does not have to be met before prescription drugs are covered 26.

General Annual Deductibles Among All Covered Workers

  • As discussed above, the share of covered workers in plans with a general annual deductible has increased significantly over time: from 55% in 2006, to 74% in 2011, to 83% in 2016, as have the average deductible amounts for covered workers in plans with deductibles: from $584 in 2006, to $991 in 2011, to $1,478 in 2016. Neither trend by itself captures the full impact of changes in deductibles on covered workers. We can look at the average impact of both trends together on covered workers by assigning a zero deductible value to covered workers in plans with no deductible and looking at how the resulting averages change over time. These average deductible amounts are lower in any given year but the changes over time reflect both the higher deductibles in plans with deductibles and the fact that more workers face them.
  • Using this approach, the average general annual deductible for single coverage for all covered workers in 2016 is $1,221 9.
  • The 2016 value is 63% higher than the average general annual deductible of $747 in 2011 and 300% higher than the average general annual deductible of $303 in 2006 9.
  • Another way to look at deductibles is the percentage of all covered workers who are in a plan with a deductible that exceeds certain thresholds. Fifty-one percent of covered workers are in plans with a general annual deductible of $1,000 or more for single coverage, similar to the percentage in 2015 (46%) 10.
  • Over the last five years, the percentage of covered workers with a general annual deductible of $1,000 or more for single coverage has grown substantially, increasing from 31% to 51% 10.
  • Workers in small firms are more likely to have a general annual deductible of $1,000 or more for single coverage than workers in large firms (65%vs. 45%) 8.
  • Twenty-three percent of covered workers are enrolled in a plan with a deductible of $2,000 or more, similar to the percentage last year (19%) 12. Forty-one percent of covered workers at small firms have a general annual deductible of $2,000 or more, in contrast to 16% in large firms 8.
  • One of the reasons for the growth in deductible amounts has been the growth in enrollment in HDHP/SOs, which have higher deductibles than other plans. While growing deductibles in PPOs and other plan types generally increases enrollee out-of-pocket liability, the shift in enrollment to HDHP/SOs does not necessarily do so because most HDHP/SO enrollees receive an account contribution from their employers, which in essence reduces the high cost sharing in these plans.
  • Fourteen percent of covered workers in an HDHP with an HRA and 7% of covered workers in an HSA-qualified HDHP receive an account contribution for single coverage at least equal to their deductible, while another 47% of covered workers in an HDHP with an HRA and 28% of covered workers in an HSA-qualified HDHP receive account contributions that, if applied to their deductible, would reduce the deductible to $1,000 or less 14.
  • If we reduce the deductibles that workers face by employer account contributions, the percentage of covered workers with a deductible liability of $1,000 or more would be reduced from 51% to 38% 11.

Hospital and Outpatient Surgery Cost Sharing

  • Whether or not a worker has a general annual deductible, most workers face additional types of cost sharing (such as a copayment, coinsurance, or a per diem charge) when admitted to a hospital or having outpatient surgery. The distribution of workers with cost sharing for hospital and outpatient surgery does not equal 100% as workers may face a combination of types of cost sharing. In addition, the average copayment and coinsurance rates for hospital admissions include workers who may have a combination of these types of cost sharing.
  • For hospital admissions, 64% of covered workers have coinsurance and 14% have copayments. Lower percentages of workers have per day (per diem) payments (6%), a separate hospital deductible (1%), or both copayments and coinsurance (10%), while 16% have no additional cost sharing for hospital admissions after any general annual deductible has been met. For covered workers in HMO plans, copayments are more common (46%) and coinsurance (24%) is less common than in other plan types. Only 2% of covered workers in HDHP/SOs have a copayment for hospital admissions, lower than other plan types 27.
  • The percentage of covered workers in a plan that requires coinsurance for hospital admissions has increased from 55% in 2011 to 64% in 2015.
  • The average coinsurance rate for hospital admission is 19%; the average copayment is $282 per hospital admission; the average per diem charge is $281; and the average separate annual hospital deductible is $898 29.
  • The cost-sharing provisions for outpatient surgery are similar to those for hospital admissions, as most workers have coinsurance or copayments. Sixty-six percent of covered workers have coinsurance and 17% have copayments for an outpatient surgery episode. In addition, 1% has a separate annual deductible for outpatient surgery, and 4% have both copayments and coinsurance, while 17% have no additional cost sharing after any general annual deductible has been met 28.
  • For covered workers with cost sharing for outpatient surgery, the average coinsurance rate is 19% and the average copayment is $170 29.

Cost Sharing for Physician Office Visits

  • The majority of covered workers are enrolled in health plans that require cost sharing for an in-network physician office visit, in addition to any general annual deductible20 .
  • The most common form of physician office visit cost sharing for in-network services is copayments. Sixty-seven percent of covered workers have a copayment for a primary care physician office visit and 25% have coinsurance. For office visits with a specialty physician, 66% of covered workers have copayments and 26% have coinsurance. Workers in HMOs, PPOs, and POS plans are much more likely to have copayments than workers in HDHP/SOs for both primary care and specialty care physician office visits. For primary care physician office visits, 64% of covered workers in HDHP/SOs have coinsurance, 18% have no cost sharing after the general annual plan deductible is met, and 16% have copayments 30.
  • Among covered workers with a copayment for in-network physician office visits, the average copayment is $24 for primary care and $38 for specialty physician office visits 31, similar to the amounts last year 31.
  • Among workers with coinsurance for in-network physician office visits, the average coinsurance rates are 18% for a visit with a primary care physician and 19% for a visit with a specialist 31, the same rates as last year.

Out-Of-Pocket Maximum Amounts

  • Most covered workers are in a plan that partially or totally limits the cost sharing that a plan enrollee must pay in a year. These limits are generally referred to as out-of-pocket maximum amounts. The Affordable Care Act (ACA) requires that non-grandfathered health plans have an out-of-pocket maximum of $6,850 or less for single coverage and $13,700 for family coverage.21  Many plans have complex out-of-pocket structures, which makes it difficult to accurately collect information on this element of plan design.
  • In 2016, 98% percent of covered workers are in a plan with an out-of-pocket maximum for single coverage. This is a significant increase from 83% in 2011.
  • For covered workers in plans with out-of-pocket maximums for single coverage, there is wide variation in spending limits.
  • Fourteen percent of covered workers in plans with an out-of-pocket maximum for single coverage have an out-of-pocket maximum of less than $2,000, while 18% have an out-of-pocket maximum of $6,000 or more 36.

Section Eight: High-deductible Health Plans With Savings Option

To help cover out-of-pocket expenses not covered by a health plan, some employers offer high deductible plans that are paired with an account that allows enrollees to use tax-preferred savings to pay plan cost sharing and other out-of-pocket medical expenses. The two most common are health reimbursement arrangements (HRAs) and health savings accounts (HSAs). HRAs and HSAs are financial accounts that workers or their family members can use to pay for health care services. These savings arrangements are often (or, in the case of HSAs, always) paired with health plans with high deductibles. The survey treats high-deductible plans paired with a savings option as a distinct plan type – High-Deductible Health Plan with Savings Option (HDHP/SO) – even if the plan would otherwise be considered a PPO, HMO, POS plan, or conventional health plan. Specifically for the survey, HDHP/SOs are defined as (1) health plans with a deductible of at least $1,000 for single coverage and $2,000 for family coverage22  offered with an HRA (referred to as HDHP/HRAs); or (2) high-deductible health plans that meet the federal legal requirements to permit an enrollee to establish and contribute to an HSA (referred to as HSA-qualified HDHPs).23 

Percentage of Firms Offering HDHP/HRAs and HSA-Qualified HDHPs, and Enrollment

  • Twenty-eight percent of firms offering health benefits offer an HDHP/HRA, an HSA-qualified HDHP, or both. Among firms offering health benefits, 5% offer an HDHP/HRA and 24% offer an HSA-qualified HDHP 1. The percentage of firms offering an HDHP/SO is similar to last year but has increased since 2006 (7%).
  • Large firms (200 or more workers) are more likely than small firms (3-199 workers) to offer an HDHP/SO (51% vs. 27%). 2.

Health Reimbursement Arrangements (HRAs) are medical care reimbursement plans established by employers that can be used by employees to pay for health care. HRAs are funded solely by employers. Employers may commit to make a specified amount of money available in the HRA for premiums and medical expenses incurred by employees or their dependents. HRAs are accounting devices, and employers are not required to expend funds until an employee incurs expenses that would be covered by the HRA. Unspent funds in the HRA usually can be carried over to the next year (sometimes with a limit). Employees cannot take their HRA balances with them if they leave their job, although an employer can choose to make the remaining balance available to former employees to pay for health care.

HRAs often are offered along with a high-deductible health plan (HDHP). In such cases, the employee pays for health care first from his or her HRA and then out-of-pocket until the health plan deductible is met. Sometimes certain preventive services or other services such as prescription drugs are paid for by the plan before the employee meets the deductible.

Health Savings Accounts (HSAs) are savings accounts created by individuals to pay for health care. An individual may establish an HSA if he or she is covered by a “qualified health plan” –a plan with a high deductible (i.e., a deductible of at least $1,300 for single coverage and $2,600 for family coverage in 2016) that also meets other requirements.[1] Employers can encourage their employees to create HSAs by offering an HDHP that meets the federal requirements. Employers in some cases also may assist their employees by identifying HSA options, facilitating applications, or negotiating favorable fees from HSA vendors.

Both employers and employees can contribute to an HSA, up to the statutory cap of $3,350 for single coverage and $6,750 for family coverage in 2016. Employee contributions to the HSA are made on a pre-income tax basis, and some employers arrange for their employees to fund their HSAs through payroll deductions. Employers are not required to contribute to HSAs established by their employees but if they elect to do so, their contributions are not taxable to the employee. Interest and other earnings on amounts in an HSA are not taxable. Withdrawals from the HSA by the account owner to pay for qualified health care expenses are not taxed. The savings account is owned by the individual who creates the account, so employees retain their HSA balances if they leave their job.

1 See U.S. Department of the Treasury, Health Savings Accounts, available at http://www.irs.gov/pub/irs-drop/rp-14-30.pdf

  • Enrollment in HDHP/SO plans has increased over time from 17% of covered workers in 2011 to 29% in 2016.
  • Nine percent of covered workers are enrolled in HDHP/HRAs in 2016, similar to last year (9%). The percentage of covered workers enrolled in HSA-qualified HDHPs increased from 15% in 2015 to 19% in 2016 5.
  • A similar percentage of covered workers at small firms (3-199 workers) and large firms are enrolled in HDHP/SOs 5

Plan Deductibles

  • As expected, workers enrolled in HDHP/SOs have higher deductibles than workers enrolled in HMOs, PPOs, or POS plans.
  • The average general annual deductible for single coverage is $2,031 for HDHP/HRAs and $2,295 for HSA-qualified HDHPs 7. These averages are similar to the amounts reported in recent years. There is wide variation around these averages: 17% of covered workers enrolled in an HDHP/SO are in a plan with a deductible of $1,000 to $1,499 while 21% are in a plan with a deductible of $3,000 or more 9.
  • The survey asks employers whether the family deductible amount is (1) an aggregate amount (i.e., the out-of-pocket expenses of all family members are counted until the deductible is satisfied), or (2) a per-person amount that applies to each family member (typically with a limit on the number of family members that would be required to meet the deductible amount) (for more information see Section 7).
  • The average aggregate deductibles for workers with family coverage are $4,321 for HDHP/HRAs and $4,364 for HSA-qualified HDHPs 7. As with single coverage, there is wide variation around these averages for family coverage: 15% of covered workers enrolled in HDHP/SOs with an aggregate family deductible have a deductible of $2,000 to $2,999 while 19% have a deductible of $6,000 dollars or more 11.

Out-of-Pocket Maximum Amounts

  • HSA-qualified HDHPs are legally required to have a maximum annual out-of-pocket liability of no more than $6,550 for single coverage and $13,100 for family coverage in 2016. Non-grandfathered HDHP/HRA plans starting in 2016 are required to have out-of-pocket maximums of no more than $6,850 for single coverage and $13,700 for family coverage. Virtually all HDHP/HRA plans have an out of pocket maximum for single coverage in 2016.
  • The average annual out-of-pocket maximum for single coverage is $4,264 for HDHP/HRAs and $4,083 for HSA-qualified HDHPs 7.

Premiums

  • The average annual premiums in 2016 for covered workers in HDHP/HRAs are $5,860 for single coverage and $17,734 for family coverage. The average single premium for covered workers in HDHP/HRAs is lower than the average single premium for covered workers in non-HDHP/SO plans 8.
  • The average annual premium for workers in HSA-qualified HDHPs is $5,719 for single coverage and $16,246 for family coverage. These amounts are significantly less than the average single and family premium for covered workers in plans that are not HDHP/SOs 8.
  • The average single and family coverage premiums for HSA-qualified HDHPs are similar to the premiums for covered workers enrolled in HDHP/HRAs.

Worker Contributions to Premiums

  • The average annual worker contributions to premiums for workers enrolled in HDHP/HRAs are $1,143 for single coverage and $5,105 for family coverage 8.
  • The average annual worker contributions to premiums for workers in HSA-qualified HDHPs are $849 for single coverage and $3,930 for family coverage. The average contributions for single and family coverage for covered workers in HSA-qualified HDHPs are significantly less than the average premium contribution made by covered workers in plans that are not HDHP/SOs 8.

Employer Contributions to Premiums and Savings Options

  • Employers contribute to HDHP/SOs in two ways: through their contributions toward the premium for the health plan and through their contributions (if any, in the case of HSAs) to the savings account option (i.e., the HRAs or HSAs themselves).
  • Looking at only the annual employer contributions to premiums, covered workers in HDHP/HRAs on average receive employer contributions of $4,717 for single coverage and $12,628 for family coverage. The average employer contribution for covered workers in HDHP/HRAs for single coverage is lower than the average contribution for covered workers in plans that are not HDHP/SOs 8.
  • The average annual employer contributions to premiums for workers in HSA-qualified HDHPs are $4,870 for single coverage and $12,316 for family coverage. The average employer contribution for covered workers in HSA qualified HDHPs for single coverage is lower than the average contribution for covered workers in plans that are not HDHP/SOs 8.
  • When looking at employer contributions to the savings option, covered workers enrolled in HDHP/HRAs on average receive an annual employer contribution to their HRA of $1,059 for single coverage and $1,867 for family coverage 8.
  • HRAs are generally structured in such a way that employers may not actually spend the whole amount that they make available to their employees’ HRAs.24  Amounts committed to an employee’s HRA that are not used by the employee generally roll over and can be used in future years, but any balance may revert back to the employer if the employee leaves his or her job. Thus, the employer contribution amounts to HRAs that we capture in the survey may exceed the amount that employers will actually spend.
  • Covered workers enrolled in HSA-qualified HDHPs on average receive an annual employer contribution to their HSA of $686 for single coverage and $1,208 for family coverage 8. These amounts do not include the 1% of covered workers in HSA-qualified HDHPs whose employers say they vary account contributions based on certain factors, such as participation in a wellness program or job classification.
  • In many cases, employers that sponsor HSA-qualified HDHP/SOs do not make contributions to HSAs established by their employees. Fifty-two percent of employers offering single coverage and 55% offering family coverage through HSA-qualified HDHPs do not make contributions towards the HSAs that their workers establish. Twenty-five percent of workers with single coverage and 25% percent of workers with family coverage in an HSA-qualified HDHP do not receive an account contribution from their employer (see notes in 14 and 15.
  • The average HSA contributions reported above include the portion of covered workers whose employer contribution to the HSA is zero. When those firms that do not contribute to the HSA are excluded from the calculation, the average employer contribution for covered workers is $916 for single coverage and $1,617 for family coverage.
  • The percentage of covered workers enrolled in a plan where the employer makes no HSA contribution for single coverage (25%) is similar to the percentage in recent years.
  • Employer contributions to savings account options (i.e., the HRAs and HSAs themselves) for their employees can be added to their health plan premium contributions to calculate total employer contributions toward HDHP/SOs.We note that HRAs are a promise by an employer to pay up to a specified amount and that many employees will not receive the full amount of their HRA in a year, so adding the employer premium contribution amount and the HRA contribution represents an upper bound for employer liability that overstates the amount that is actually expended. Since employer contributions to employee HSA accounts immediately transfer the full amount to the employee, adding employer premium and HSA contributions is a good way to look at their total liability under these plans.
  • For HDHP/HRAs, the average annual total employer contribution for covered workers is $5,776 for single coverage and $14,495 for family coverage. The average total employer contribution amounts for covered workers for family coverage in HDHP/HRAs are higher than the average amount that employers contribute towards family coverage in health plans that are not HDHP/SOs 8.
  • For HSA-qualified HDHPs, the average total annual firm contribution for covered workers is $5,561 for single coverage and $13,528 for workers with family coverage. The average total firm contribution amounts for single and family coverage in HSA-qualified HDHPs are similar to the average firm contributions towards single and family coverage in health plans that are not HDHP/SOs 8.

Variation in Employer Contributions to Savings Options

  • There is considerable variation in the amount that employers contribute to savings accounts.
  • Looking at how contributions vary around the average, 30% of covered workers in HDHP/HRAs have an HRA contribution for single coverage of less than $635 (60% of the average), while 21% have an account contribution of $1,482 (140% of the average) or more 16.
  • Thirty-eight percent of covered workers in HSA-qualified HDHPs have an annual HSA contribution for single coverage of less than $411 (60% of the average) while 29% have an account contribution of $960 (140% of the average) or more 17.

Cost Sharing for Office Visits, Outpatient Surgery and Hospital Surgery

  • The cost-sharing pattern for primary care office visits differs for workers enrolled in HDHP/SOs. Thirty-three percent of covered workers in HDHP/HRAs have a copayment for primary care physician office visits compared to 8% enrolled in an HSA-qualified HDHP 19. Workers in other plan types are much more likely to face copayments than coinsurance for physician office visits (see Section 7 for more information).

Section Nine: Prescription Drug Benefits

Almost all covered workers have coverage for prescription drugs. For 2016, to reduce burden on respondents, we revised the survey to ask respondents about the attributes of prescription drug coverage only in their largest health plan; previously, we asked about prescription coverage in their largest plan for each of the plan types that they offered. In addition, we began asking employers about their cost sharing for tiers that cover specialty drugs exclusively.  In cases in which a tier covers only specialty drugs, we report the plan attributes under the specialty banner, rather than as one of the four standard tiers.  Therefore, the number of tiers a firm reports may not correspond with the number of tiers for which we have cost-sharing information.  For more information, see the survey design and methods section. While this new approach produces estimates that are quite similar to those obtained by the prior method, we do not do statistical comparisons with 2016 estimates and those from prior years.25 

  • Nearly all (more than 99%) covered workers work at a firm that provides prescription drug coverage in their largest health plan.
  • A large share of covered workers (89%) work at a firm whose largest health plan has a tiered cost-sharing formula for prescription drugs 1. Cost-sharing tiers generally refer to a health plan placing a drug on a formulary or preferred drug list that classifies drugs into categories that are subject to different cost sharing or management. It is common for there to be different tiers for generic, preferred and non-preferred drugs. In recent years, plans have created additional tiers which, for example, may be used for lifestyle drugs or expensive biologics. Some plans may have multiple tiers for different categories; for example, a plan may have preferred and non-preferred specialty tiers. The survey obtains information about the cost-sharing structure for up to five tiers.
  • Eighty-four percent of covered workers work at a firm that has three, four, or more tiers of cost sharing for prescription drugs in their largest health plan 1.
  • Covered workers at large firms (200 or more workers) whose largest health plan is an HDHP/SO have a different cost-sharing pattern for prescription drugs than covered workers with other plan types: they are more likely to be in a plan with the same cost sharing regardless of drug type (17% vs. 3%) or in a plan that has no cost sharing for prescriptions once the plan deductible is met (8% vs. <1%) 2.

Three or More Tiers

  • Thirty-two percent of covered workers work at a firm whose largest health plan has four or more tiers of cost sharing for prescription drugs 1.
  • For covered workers at firms whose largest plan has three or more tiers of cost sharing for prescription drugs, copayments are the most common form of cost sharing in the first three tiers and coinsurance is the next most common. Among those with a fourth tier, 46% have a coinsurance requirement and 41% have a copayment (difference not significant) 3.
  • Among covered workers at firms whose largest health plan has three or more tiers of cost sharing for prescription drugs, the average copayments are $11 for first-tier drugs, $33 second-tier drugs, $57 third-tier drugs, and $102 for fourth-tier drugs 4.
  • Among covered workers at firms whose largest health plan has three or more tiers of cost sharing for prescription drugs, the average coinsurance rates are 17% for first-tier drugs, 25% second-tier drugs, 37% third-tier drugs, and 29% for fourth-tier drugs 4.

Single and Two Tiers

  • Five percent of covered workers work at firms whose largest health plan has two tiers for prescription drug cost sharing 1. For these workers, copayments are more common than coinsurance for both first-tier and second-tier drugs. The average copayment for the first tier is $12 and the average copayment for the second tier is $29 7.
  • Seven percent of covered workers at firms whose largest health plan covers prescription drugs have the same cost sharing regardless of the type of drug 1.
  • Among these workers, 19% have copayments and 81% have coinsurance 8. The average coinsurance rate is 22% and the average copayment is $12 9.
  • Thirteen percent of these workers are at firms whose largest health plan limits coverage for prescriptions to generic drugs 10.

Limits on Coinsurance

  • Coinsurance rates for prescription drugs often have maximum and/or minimum dollar amounts associated with the coinsurance rate. Depending on the plan design, coinsurance maximums may significantly limit an enrollee’s out-of-pocket spending on higher cost drugs.
  • These coinsurance minimum and maximum amounts vary across the tiers. Among covered workers at firms whose largest health plan has coinsurance for the first cost-sharing tier, 20% have only a maximum dollar amount attached to the coinsurance rate, 4% have only a minimum dollar amount, 26% have both, and 50% have neither. For those with coinsurance for the fourth cost-sharing tier, 76% have a maximum dollar amount, 3% have a minimum dollar amount, and 21% have neither 12.

Specialty drugs

  • Specialty drugs such as biologics may be used to treat chronic conditions and often require special handling and administration. We revised the questions in the 2016 survey regarding specialty drugs, and are reporting results only among large firms because a large share of small firms were unsure whether their largest plan covered these drugs.
  • Ninety-eight percent of covered workers at large firms work for employers whose largest health plan provides coverage for specialty drugs 13. Among these workers, 43% work at firms whose largest plan has a cost-sharing tier just for specialty drugs 14.
  • Among covered workers at large firms whose largest plan has a separate tier for specialty drugs, 43% have a copayment for specialty drugs and 46% have a coinsurance requirement 15. The average copayment is $89 and the average coinsurance rate is 26% 16. Seventy-eight percent of those with a coinsurance requirement have a maximum dollar limit on the amount of coinsurance they must pay.
  • Specialty drugs are typically high cost; firms use a variety of strategies to contain these costs. Among covered workers at large firms whose largest health plan provides coverage for specialty drugs, 38% use a different pharmacy benefit manager for specialty drugs; 28% have a dispensing program with incentives to encourage enrollees to receive specialty drugs in an alternative setting; 68% use a step therapy approach where enrollees must try alternatives before specialty drugs are covered; 61% use tight limits on the number of units administered at a single time; 70% use utilization management programs to review discharges, care settings and effectiveness; 82% require prior authorization; and 89% have a mail order option for specialty drugs 17.26 

Generic drugs: Drugs product that are no longer covered by patent protection and thus may be produced and/or distributed by multiple drug companies.

Preferred drugs: Drugs included on a formulary or preferred drug list; for example, a brand-name drug without a generic substitute.

Non-preferred drugs: Drugs not included on a formulary or preferred drug list; for example, a brand-name drug with a generic substitute.

Fourth-tier drugs: New types of cost-sharing arrangements that typically build additional layers of higher copayments or coinsurance for specifically identified types of drugs, such as lifestyle drugs or biologics.

Brand-name drugs: Generally, a drug product that is covered by a patent and is thus manufactured and sold exclusively by one firm. Cross-licensing occasionally occurs, allowing an additional firm to market the drug. After the patent expires, multiple firms can produce the drug product, but the brand name or trademark remains with the original manufacturer’s product.

Section Ten: Plan Funding

Federal law (the Employee Retirement Income Security Act of 1974, or ERISA) exempts self-funded plans from most state insurance laws, including reserve requirements, mandated benefits, premium taxes, and consumer protection regulations.  Sixty-one percent of covered workers are in a self-funded health plan.  Self-funding is common among larger firms because they can spread the risk of costly claims over a large number of employees and dependents.  Many self-funded plans use insurance, often called stoploss coverage, to limit the plan sponsor’s liability for very large claims or an unexpected level of expenses.  Nearly three in five covered workers in fully or partially self-funded plans are in plans with stoploss protection.

Self-Funded Plan: An insurance arrangement in which the employer assumes direct financial responsibility for the costs of enrollees’ medical claims.  Employers sponsoring self-funded plans typically contract with a third-party administrator or insurer to provide administrative services for the self-funded plan.  In some cases, the employer may buy stoploss coverage from an insurer to protect the employer against very large claims.

Fully Insured Plan: An insurance arrangement in which the employer contracts with a health plan that assumes financial responsibility for the costs of enrollees’ medical claims.

  • Sixty-one percent of covered workers are in a plan that is completely or partially self-funded, similar to last year. The percentage of covered workers who are in a self-funded plan has increased over time from 49% in 2000 and 54% in 2005. In recent years, the percentage of covered workers enrolled in a self-funded plan has remained steady: 60% of covered workers were in such an arrangement in 2011; similar to 61% in 2016 1.
  • The percentage of covered workers enrolled in self-funded plans has been stable in recent years in both small firms (3-199 workers) and large firms (200 or more workers) 2.
  • The percentage of covered workers in self-funded plans differs by plan type: 69% of covered workers in PPOs, 67% in HDHP/SOs, 37% in HMOs, and 24% in POS plans are in a self-funded plan 3.
  • As expected, covered workers in large firms are significantly more likely to be in a self-funded plan than covered workers in small firms (82% vs. 13%). The percentage of covered workers in self-funded plans increases as the number of employees in a firm increases.  Eighty-three percent of covered workers in firms with 1,000 to 4,999 workers and 94% of covered workers in firms with 5,000 or more workers are in self-funded plans in 2016 4.

Stoploss Coverage and Attachment Points

  • Fifty-seven percent of workers in self-funded health plans are in plans that have stoploss insurance 10. Stoploss coverage may limit the amount of claims that must be paid for each employee or may limit the total amount the plan sponsor must pay for all claims over the plan year.
  • The percentage of workers in self-funded health plans with stoploss insurance is unchanged from 2011, when the survey first asked about stoploss insurance (58% in 2011 and 57% in 2016).
  • Ninety-one percent of covered workers in self-funded plans that have stoploss protection are in plans where the stoploss insurance limits the amount that the plan must spend on each employee 11. This includes stoploss insurance plans that limit a firm’s per-employee spending and plans that limit both a firm’s overall spending and per-employee spending.
  • Firms with per-enrollee stoploss coverage were asked for the dollar amount where the stoploss coverage would start to pay for most or all of the claim (called an attachment point). The average attachment point in small firms is $160,000.  For large firms with a per-person limit, the average attachment point is $330,000 11.
  • Among firms that purchase insurance underwritten by an insurer, 1% plan to self-insure because of ACA provisions 14.


Section Eleven: Retiree Health Benefits

Retiree health benefits are an important consideration for older workers making decisions about their retirement.  Health benefits for retirees provide an important supplement to Medicare for retirees age 65 or older.  Over time, the percentage of firms offering retiree coverage has decreased.

  • Twenty-four percent of large firms (200 or more workers) that offer health benefits to their employees offer retiree coverage in 2016, similar to recent years. There has been a downward trend in the percentage of firms offering retirees coverage, from 34% in 2006 and 40% in 1999 1.
  • The offering of retiree health benefits varies considerably by firm characteristics.
  • Among large firms offering health benefits, the likelihood that a firm will offer retiree health benefits increases with size: from 21% of firms with 200-999 workers, to 36% of firms with 1,000-4,999 workers, to 46% of firms with 5,000 or more workers 2.
  • The share of large firms offering retiree health benefits varies considerably by industry.  State and local governments (72%), firms in transportation/utilities/communication (55%) and firms in finance (46%) have particularly high rates of offer while retail firms (2%) have a particularly low rate 2.
  • Among large firms offering health benefits, those with a larger share of older workers (35% or more of workers are age 50 or older) are more likely to offer retiree health benefits than large firms with a smaller share of older workers (32% vs. 18%) 3.
  • Among large firms offering health benefits, those with a larger share of higher-wage workers (35% or more earn at least $59,000 per year) are more likely to offer retiree health benefits than those with a smaller share of higher-wage workers (30% vs. 20%) 3.
  • Among large firms offering health benefits, the share of public firms offering retiree benefits (58%) is higher than the shares of private for-profit firms (14%) or private not-for-profit firms (21%) offering retiree benefits 3.
  • Large firms with at least some union workers are more likely to offer retiree health benefits than large firms without any union workers (43% vs. 17%) 3.
  • Among all large firms offering retiree health benefits, most firms offer to early retirees under the age of 65 (92%). A lower percentage (72%) of large firms offering retiree health benefits offer to Medicare-age retirees.  These percentages are similar to those in recent years 4.
  • Among all large firms offering retiree health benefits, 64% offer health benefits to both early and Medicare-age retirees.

Private Exchanges and Public Exchanges

  • Private exchanges have received considerable attention over the last several years. They are typically created by a consulting company, broker, or insurer, and are different than the public exchanges created under the Affordable Care Act (ACA).  Private exchanges allow employees or retirees to choose from several health benefit options offered on the exchange.  Six percent of large firms (200 or more workers) offering retiree health benefits report they offer benefits through a private exchange, similar to the percentage last year (7%) 7.  For more information on the use of private exchanges for active employees, please see section 14.
  • Since 2014, households with an income between 100% and 400% of the federal poverty level and without an offer of employer coverage may be eligible for subsidized health insurance on federal and state exchanges. Some current retirees may be eligible for premium tax credits for coverage provided through these marketplaces.
  • Seventeen percent of large firms offering retiree health coverage report they are considering changes in the way they offer retiree health benefits because of the new marketplaces, lower than the percentage last year (26%) 9.


Section Twelve: Health Risk Assessment, Biometrics Screening And Wellness Programs

Employers continue to show considerable interest in programs that help employees identify health issues and manage chronic conditions.  Many employers believe that improving the health of their workers and their family members can improve morale, productivity and reduce health care costs.

In addition to offering wellness programs, a majority of large employers now offer health screening programs including health risk assessments, which are questionnaires asking employees about lifestyle, stress or physical health, and biometric screening, which we define as in-person health examinations conducted by a medical professional.  Employers and insurers may use the health information collected during screenings to target wellness offerings or other health services to employees with risk conditions or behaviors that pose a risk for their health.  Some employers have incentive programs that reward or penalize employees for different activities, including participating in wellness programs or completing health screenings.

In 2015 we revised the survey to better capture employers’ evolving approaches to wellness programs and health screening, including collecting information on employers’ use of incentive programs, so in most cases, statistics reported in 2015 and 2016 are not comparable to previous years’ findings because of these changes.  Only firms offering health benefits were asked about their wellness and health promotion programs.  Information about incentives is reported only for large firms (200 or more employees) because large shares of small firms (3-199 workers) did not know this information about their programs.

In 2016, of large firms offering health benefits, 59% offer employees the opportunity to complete health risk assessments, 53% offer employees the opportunity to complete biometric screening, and 83% offer employees wellness programs such as programs to help employees stop smoking, programs to help employees lose weight, or other lifestyle and behavioral coaching.  Substantial shares of these large firms provide financial incentives for employees to participate in or complete the programs.

Health Risk Assessments

Some firms provide their employees the opportunity to complete a health risk assessment to identify potential health issues.  Health risk assessments generally include questions about medical history, health status, and lifestyle.

  • Among firms offering health benefits, 32% of small firms and 59% of large firms provide employees the opportunity to complete a health risk assessment 1. Each of these is higher than the corresponding percentage for 2015 (18% for small firms and 50% for large firms) 2.
  • Seventy-four percent of firms offering health benefits with 5,000 or more employees provide employees the opportunity to complete a health risk assessment, similar to the percentage last year (72%) 1.
  • Some firms offer financial incentives to encourage employees to complete health risk assessments.
  • Among large firms that have a health risk assessment, 54% offer an incentive to employees to complete the assessment 4. Some firms offer more than one type of incentive to employees.
  • Among large firms offering incentives for employees to complete a health risk assessment, 51% lower premium contributions or reduce cost sharing; 60% offer cash, gift cards, merchandise or contributions to HSAs or HRAs; 44% require completion of a health risk assessment to be eligible for incentives under wellness or health promotion programs; and 5% offer additional paid time off 5.
  • Forty-one percent of covered workers in large firms providing the opportunity to complete a health risk assessment complete the assessment, similar to the percentage in 2015 (45%).
  • There is considerable variation in the percentage of workers who complete the assessment. Nineteen percent of large firms providing employees the opportunity to complete a health risk assessment report that more than 75% of their employees complete the assessment, while 41% report no more than 25% of employees complete the assessment 3.

Biometric Screening

Biometric screening is a health examination that measures an employee’s risk factors for certain medical issues such as cholesterol, blood pressure, stress, and nutrition.  Biometric outcomes may include meeting a target body mass index (BMI) or cholesterol level.  As defined by this survey, goals related to smoking are not included.

  • Among firms offering health benefits, 20% of small firms and 53% of large firms provide employees the opportunity to complete biometric screenings 7. These percentages are similar to last year (13% and 50%) 8.
  • Sixty-two percent of firms offering health benefits with 5,000 or more workers have biometric screening programs 7.
  • Firms that provide employees the opportunity to complete biometric screenings may include additional incentives for those employees who do so.
  • Among large firms with biometric screening programs, 59% offer an incentive for employees to complete the screening 10. Firms with 5,000 or more employees with biometric screening programs are more likely to have an incentive to complete the screening (70%) than firms in other size categories.  Some firms report having more than one type of incentive.
  • Among large firms with an incentive for employees to complete biometric screening, 52% lower premium contributions or reduce cost sharing; 56% offer cash, gift cards, merchandise or contributions to HSAs or HRAs; 32% require completion of the screening to be eligible for incentives under wellness or health promotion programs; and 7% offer additional paid time off 11.
  • Among large firms with biometric screening programs, 14% have rewards or penalties for workers based on achieving specified biometric outcomes (e.g., meeting target BMI) 10.
  • There is considerable variation in the size of the incentives that employers offer for meeting biometric outcomes. Among large firms offering a reward or penalty for meeting biometric outcomes, the maximum reward is valued at a $150 dollars or less for 10% percent of firms and $1,000 or more for 21% of firms 13.  Twenty-two percent of these firms combine the reward with incentives for other programs.

Wellness and Health Promotion Programs

Many employers and health plans offer programs to help employees engage in healthy lifestyles and reduce health risks.  Wellness and health promotion programs may include exercise programs, health education classes, and stress-management counseling.  These programs may be offered directly by the firm, an insurer, or a third-party contractor.

  • Among firms offering health benefits, 37% of small firms and 74% of large firms offer programs to help employees stop smoking, 33% of small firms and 68% of large firms offer programs to help employees lose weight, and 36% of small firms and 73% of large firms offer some other lifestyle or behavioral coaching program. Forty-six percent of small firms and 83% of large firms offering health benefits offer at least one of these three programs 15.
  • To encourage participation in wellness programs, firms may offer financial incentives to employees who participate in or complete wellness programs.
  • Forty-two percent of large firms offering one of these wellness or health promotion programs offer an incentive to encourage employees to participate in or complete the programs 16. Fifty-two percent of firms with more than 5,000 employees offering one of these wellness or health promotion programs offer an incentive to participate in or complete the programs.
  • Among large firms offering incentives to employees to participate in or complete wellness or health promotion programs, 34% lower premium contributions or reduce cost sharing; 76% offer cash, gift cards, merchandise or contributions to HSAs or HRAs; and 14% have some other type of incentive 17.
  • Firms with incentives for health risk assessment, biometric screening, or wellness or health promotion programs were asked to report the maximum reward or penalty an employee could earn for all of the firm’s health promotion activities combined. Some employers do not offer incentives for individual activities, but offer rewards to employees who complete a variety of activities.  Among large firms offering incentives for any of these programs, the maximum value for all wellness-related incentives is $150 or less in 26% of firms and more than $1,000 in 16% of firms 18.
  • Firms with incentives for health risk assessment, biometric screening, or wellness or health promotion programs were also asked how effective they believed incentives were for encouraging participation. Thirty-one percent of large firms offering incentives for any one of these programs say the incentives are “very effective” at encouraging employees to participate, 56% say that the incentives are somewhat effect, while 10% say the incentives are not effective 19.
  • Among firms offering health benefits, 3% of small firms and 16% of large firms collect information from employees’ wearable devices, such as a Fitbit or Apple Watch, as part of their wellness or health promotion program 21.

Section Thirteen: Grandfathered Health Plans

The Affordable Care Act (ACA) exempts certain health plans that were in effect when the law was passed, referred to as grandfathered plans, from some standards in the law, including the requirement to cover preventive benefits without cost sharing, have an external appeals process, or comply with the new benefit and rating provisions in the small group market.  In 2016, 23% of firms offering health benefits offer at least one grandfathered health plan, and 23% of covered workers are enrolled in a grandfathered plan.

Grandfathered Plans:  In the employer-sponsored market, health plans that were in place when the ACA was enacted (March 2010) can be grandfathered health plans.  Department of Health and Human Services (HSS) rules stipulate that firms cannot significantly change cost sharing, benefits, employer contributions, or access to coverage in grandfathered plans.  New employees can enroll in a grandfathered plan as long as the firm has maintained consecutive enrollment in the plan.  Grandfathered plans are exempted from many, but not all, of the ACA’s consumer protection provisions.

In responding to the 2016 survey, some employers found it difficult to distinguish between the grandfathering provisions in the ACA and the guidance (sometimes called “grandmothering”) issued by HHS.  We would note that smaller firms in particular appear to have some confusion about whether or not they are grandfathered.  Many smaller firms, even those offering a health plan in effect in March 2010 (when the ACA was enacted), were unsure about whether their plan was grandfathered.

  • Twenty-three percent of offering firms report having at least one grandfathered plan in 2016, down from 35% in 2015 1.
  • Twenty-three percent of covered workers are enrolled in a grandfathered health plan in 2016 2.
  • The percentage of covered workers enrolled in a grandfathered plan is similar to 2015 (25%), but down from 36% in 2013, 48% in 2012, and 56% in 2011 4.
  • Covered workers in the south are more likely to be enrolled in a grandfathered plan and covered workers in the Midwest are less likely to be enrolled in a grandfathered plan than covered workers in other regions 2.

Section Fourteen: Employer Opinions And Health Plan Practices

Employers play a significant role in health insurance coverage – so their opinions and experiences are important factors in health policy discussions.  Employer practices continue to evolve, partially in response to Affordable Care Act provisions, including the employer shared responsibility provisions, which require large employers offer coverage or pay a fee, and the impending excise tax on high-cost plans.

Employers continue to innovate as to how they offer, structure, and deliver their benefits.  A considerable number of employers have developed strategies to reduce costs or improve quality through changes to their plan’s provider networks.

Shopping for Health Coverage

Fifty-one percent of firms offering health benefits reported shopping for a new health plan or a new insurance carrier in the past year, similar to the percentages in recent years

  • Among firms that offer health benefits and who shopped for a new plan or carrier, 21% changed insurance carriers 2.

COBRA Premiums

  • Sixteen percent of small firms (3-199 workers) and 1% of large firms (200 or more workers) say they adjust the COBRA premium for former employees based on their age 24.

Networks and Delivery of Care

Many employers and health plans are delivering services through alternative sites of care.

  • Sixty-one percent of firms that offer health benefits cover services provided in retail health clinics, such as those found in pharmacies, supermarkets and retail stores 9. These percentages are similar to those reported in 2014 when this question was last asked.
  • Large firms are more likely to cover services provided through retail health clinics than small firms (73% vs. 60%) 9.
  • Six percent of firms that cover services provided in retail clinics have a financial incentive for enrollee to receive services in a clinic as compared to visiting a physician’s office 9. Large firms are more likely to have such a financial incentive than small firms (10% vs. 6%).
  • Thirty-nine percent of large firms offering health benefits cover the provision of some health care services through telecommunication in their largest health plan 7. The question in the survey were revised for 2016 to clarify that we were asking about payment for services and not just the electronic exchange of information.
  • Among these firms, 33% report that workers have a financial incentive to receive services through telemedicine rather than visiting a physician’s office 7.
  • Among firms with at least 50 employees offering health benefits, 5% provide health services to employees through an on-site health clinic at one of their major locations 11.
  • Eighty-six percent of these firms allow employees to receive treatment for non-work-related services through the on-site clinic 11.
  • Firms with at least 1,000 workers were more likely to have an on-site health clinic than smaller firms (25% vs. 4%).

A tiered or high-performance network groups providers in the network together based on quality, cost, and/or the efficiency of the care they deliver.  These networks encourage patients to visit preferred doctors by either restricting networks to efficient providers, or by having different cost sharing requirements based on the provider’s tier.

  • Fourteen percent of large firms that offer health benefits include a high-performance or tiered provider network in their health plan with the largest enrollment, down from 24% in 2015. The largest firms (those with 1,000 or more employees) are more likely to incorporate a high-performance or tiered network into their largest plan 6.

Firms offering health benefits were asked whether they offered a plan that they considered to be a narrow network.  Narrow networks are plans that limit the number of providers who can participate in order to reduce costs.  Narrow network plans are generally more restrictive than standard HMO networks.

  • Six percent of offering firms with 50 or more employees indicated that they offer a plan they considered to be a narrow network plan, similar to the percentages reported in the last few years 4.

Six percent of firms offering health benefits said that either they or their insurer eliminated a hospital or health system from a provider network in order to reduce the plan’s cost

.

Private exchanges

There has been considerable interest in private exchanges recently.  An exchange is a marketplace for health insurance.  Private exchanges allow employees to choose from several health benefit options offered on the exchange.  Private exchanges generally are created by consulting firms, insurers, or brokers, and are different than the public exchanges that have been created by states or the federal government.  There is considerable variation in the types of exchanges currently offered; some exchanges allow workers to choose between multiple plans offered by the same carrier while in other cases multiple carriers participate.  The exchange operator may establish strict standards for the plans offered or allow the insurers more flexibility in determining their plan offerings.

  • Four percent of firms offering health benefits with 50 or more employees offer coverage through a private exchange. Looking at worker enrollment, private exchanges cover 2% of covered workers at firms with 50 or more employees 15.  These percentages are similar to those in 2015.
  • Firms offering health benefits with 50 or more employees and who do not already offer health benefits through a private exchange were asked whether they were considering private exchanges in the future. Eighteen percent of these firms are considering offering benefits through a private exchange, similar to the percentage last year 14.

Private exchanges may or may not include a defined contribution for premiums. A defined contribution is a set dollar amount offered to the employee by the employer. Employees may then select one of several plans, paying the difference between the defined contribution and the cost of their chosen health insurance plan.  This permits an employer to offer a larger variety of health plans to employees and to structure contributions or other rules to encourage employees to choose more efficient plans.

  • Firms offering health benefits with 50 or more employees and who do not already offer health benefits through a private exchange were asked whether they were considering a defined contribution approach. Twenty-one percent of these firms were considering such an approach 14.

Employer shared responsibility

The Affordable Care Act (ACA) provision requiring employers with at least 50 full-time equivalent employees (FTEs) to offer health benefits that meet minimum standards for value and affordability to their full-time workers or pay a penalty took full effect in 2016.

  • Among firms offering health benefits with at least 50 FTEs, 97% report that they offer a health plan to at least 95% of their employees who worked on average 30 hours per week or more, and 96% report that they offer at least one health plan that meets the ACA standards for affordability and minimum value 22.
  • Firms made changes to their employment practices in response to the employer shared responsibility requirement:
  • Two percent of firms offering health benefits say they changed or planned to change the job classifications of some employees from full-time to part-time so that they would not be eligible for health benefits, while 7% said they changed or planned to change job classifications of some employees from part-time to full-time so that they would become eligible for health benefits 23.
  • Two percent of firms offering health benefit say they increased or were planning to increase the waiting period before new employees become eligible for benefits 23.
  • Twelve percent of firms offering health benefits say they extended or were planning to extend eligibility for health benefits to workers who were not previously eligible, and 2% reported extending or planning to extend eligibility for more comprehensive benefits to employees previously eligible only for limited benefits 23. Four percent of these firms reported that they reduced the number of employees they intended to hire because of the cost of providing health benefits 23.

Excise tax on high cost health plans

Under the ACA, employer health plans in 2020 will be subject to an excise tax of 40% on the amount by which their cost exceeds specified thresholds.27   The tax was scheduled to take effect in 2018, but its effective date was delayed two years.  The tax is calculated with respect to each employee based on the combinations of health benefits received by that employee, including the employer and employee share of health plan premiums (or premium equivalents for self-funded plans), Flexible Spending Account (FSA) contributions, and employer contributions to health savings accounts and health reimbursement arrangement contributions.  In anticipation of the high-cost plan tax (sometimes referred to as the “Cadillac plan tax”), some employers have begun making changes to their health benefits.

  • Among firms offering health benefits, 15% of small firms and 64% of large firms say that they have conducted an analysis to determine if one of their plans will be subject to the tax when it takes effect 19.
  • Among firms who have conducted an analysis, 29% report their plan with the largest enrollment will exceed the thresholds in 2020 20.
  • Some employers have already taken action to mitigate the anticipated impacts of the high-cost plan excise tax.
  • Three percent of small firms and 9% of large firms say they have switched to a lower cost plan or eliminated a plan option 19.
  • Four percent of small firms and 15% of large firms say they have increased cost sharing 19.
  • Four percent of small firms and 2% of large firms say they selected a plan with a smaller network of providers 19.
  • Three percent of small firms and 8% of large firms say they moved benefit options to an account-based plan such as an HRA or HSA 19.
  • Thirty-one percent of employers who conducted an analysis of the anticipated impact of the high-cost plan excise tax say that the delay in the implantation date from 2018 to 2020 caused them to reconsider or postpone changes that they had planned to make 21.

Survey Design And Methods

The Kaiser Family Foundation and the Health Research & Educational Trust (Kaiser/HRET) conduct this annual survey of employer-sponsored health benefits.  HRET, a nonprofit research organization, is an affiliate of the American Hospital Association.  The Kaiser Family Foundation designs, analyzes, and conducts this survey in partnership with HRET, and also funds the study.  Kaiser contracts with researchers at NORC at the University of Chicago (NORC) to work with the Kaiser and HRET researchers in conducting the study.  Kaiser/HRET retained National Research, LLC (NR), a Washington, D.C.-based survey research firm, to conduct telephone interviews with human resource and benefits managers using the Kaiser/HRET survey instrument.  From January to June 2016, NR completed full interviews with 1,933 firms.

Survey Topics

Kaiser/HRET asks each participating firm as many as 400 questions about its largest health maintenance organization (HMO), preferred provider organization (PPO), point-of-service (POS) plan, and high-deductible health plan with a savings option (HDHP/SO).28   We treat exclusive provider organizations (EPOs) and HMOs as one plan type and report the information under the banner of “HMO”; if an employer sponsors both an HMO and an EPO, they are asked about the attributes of the plan with the larger enrollment.  Similarly, starting in 2013, plan information for conventional (or indemnity) plans was collected within the PPO battery.  Less than 1% of firms that completed the PPO section had more enrollment in a conventional plan than in a PPO plan.

The survey includes questions on the cost of health insurance, health benefit offer rates, coverage, eligibility, enrollment patterns, premium contributions,29  employee cost sharing, prescription drug benefits, retiree health benefits, and wellness benefits.

Firms are asked about the attributes of their current plans during the interview.  While the survey’s fielding period begins in January, many respondents may have a plan whose 2016 plan year has not yet begun (Exhibit M.4).  In some cases, plans may report the attributes of their 2015 plans and some plan attributes (such as HSA deductible limits) may not meet the calendar year regulatory requirements.
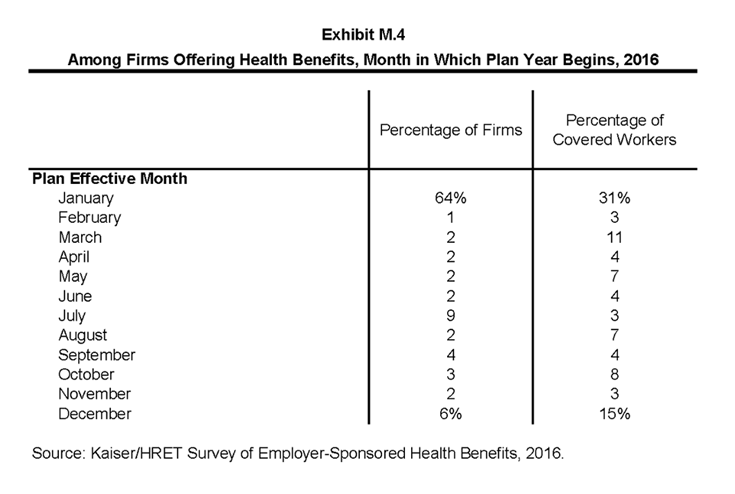
Exhibit M.4: Among Firms Offering Health Benefits, Month in Which Plan Year Begins, 2016

Response Rate

After determining the required sample from U.S. Census Bureau data, Kaiser/HRET drew its sample from a Survey Sampling Incorporated list (based on an original Dun and Bradstreet list) of the nation’s private employers and from the Census Bureau’s Census of Governments list of public employers with three or more workers.  To increase precision, Kaiser/HRET stratified the sample by ten industry categories and six size categories.   Kaiser/HRET attempted to repeat interviews with prior years’ survey respondents (with at least ten employees) who participated in either the 2014 or the 2015 survey, or both.  Firms with 3-9 employees are not included in the panel to minimize the impact of panel effects on the offer rate statistic.  As a result, 1,457 of the 1,933 firms that completed the full survey also participated in either the 2014 or 2015 surveys, or both.30   The overall response rate is 40%.31   To increase response rates, firms with 3–9 employees were offered an incentive of $75 in cash or as a donation to a charity of their choice to complete the full survey.

The vast majority of questions are asked only of firms that offer health benefits.  A total of 1,687 of the 1,933 responding firms indicated they offered health benefits.  The response rate for firms that offer health benefits is also 40%.

We asked one question of all firms in the study with which we made phone contact but where the firm declined to participate.  The question was, “Does your company offer a health insurance program as a benefit to any of your employees?”  A total of 3,110 firms responded to this question (including 1,933 who responded to the full survey and 1,177 who responded to this one question).  These responses are included in our estimates of the percentage of firms offering health benefits.32   The response rate for this question is 65%.  In 2012, the calculation of the response rates was adjusted to be slightly more conservative than previous years.

Beginning in 2014, we collected whether firms with a non-final disposition code (such as a firm that requested a callback at a later time or date) offered health benefits.  By doing so we attempt to mitigate any potential non-response bias of firms either offering or not offering health benefits on the overall offer rate statistic.  In 2016, 353 of the 1,173 firm responses that solely answered the offer question were obtained through this pathway.

Firm Size Categories and Key Definitions

Throughout the report, exhibits categorize data by size of firm, region, and industry.  Firm size definitions are as follows: small firms: 3 to 199 workers; and large firms: 200 or more workers. (Exhibit M.1) shows selected characteristics of the survey sample.  A firm’s primary industry classification is determined from Survey Sampling International’s (SSI) designation on the sampling frame and is based on the U.S. Census Bureau’s North American Industry Classification System (NAICS).  A firm’s ownership category and other firm characteristics used in exhibits such as 3.3 and 6.21 are based on respondents’ answers.  While there is considerable overlap in firms in the “State/Local Government” industry category and those in the “public” ownership category, they are not identical.  For example, public school districts are included in the service industry even though they are publicly owned.
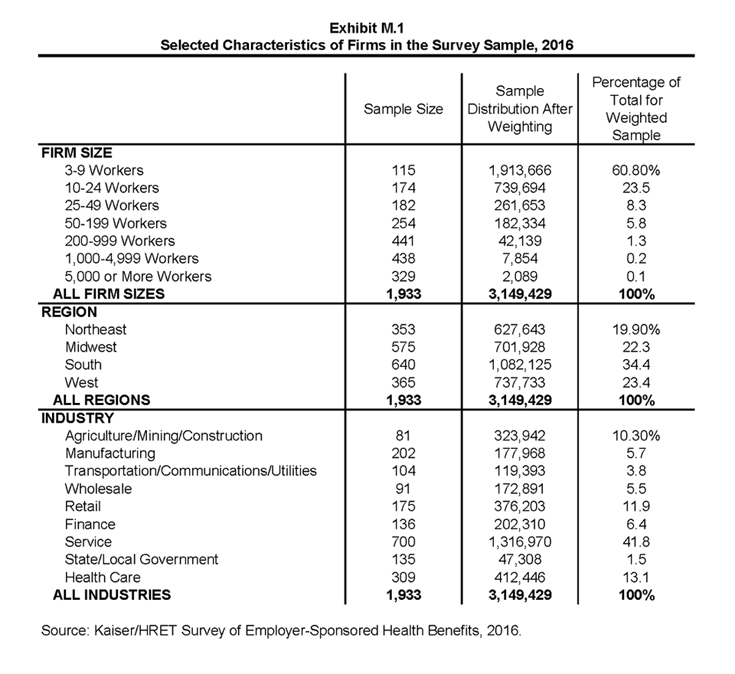
Exhibit M.1: Selected Characteristics of Firms in the Survey Sample, 2016

(Exhibit M.3) presents the breakdown of states into regions and is based on the U.S Census Bureau’s categorizations. State-level data are not reported both because the sample size is insufficient in many states and we only collect information on where a firm is headquartered rather than where workers are actually employed.  Some mid- and large-size employers have employees in more than one state, so the location of the headquarters may not match the location of the plan for which we collected premium information.
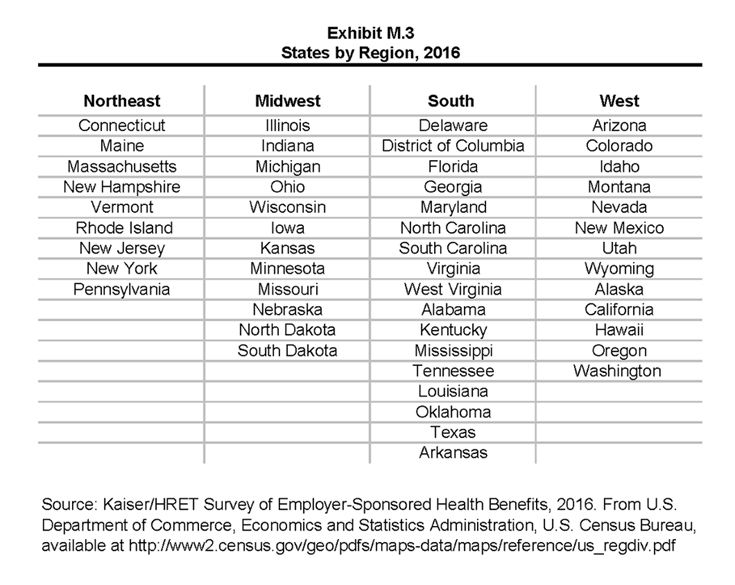
Exhibit M.3: States by Region, 2016

(Exhibit M.2) displays the distribution of the nation’s firms, workers, and covered workers (employees receiving coverage from their employer).  Among the over three million firms nationally, approximately 60.8% employ 3 to 9 workers; such firms employ 7.9% of workers, and 3.3% of workers covered by health insurance.  In contrast, less than 1% of firms employ 5,000 or more workers; these firms employ 35.4% of workers and 38.9% of covered workers.  Therefore, the smallest firms dominate any statistics weighted by the number of employers.  For this reason, most statistics about firms are broken out by size categories.  In contrast, firms with 1,000 or more workers are the most influential employer group in calculating statistics regarding covered workers, since they employ the largest percentage of the nation’s workforce.
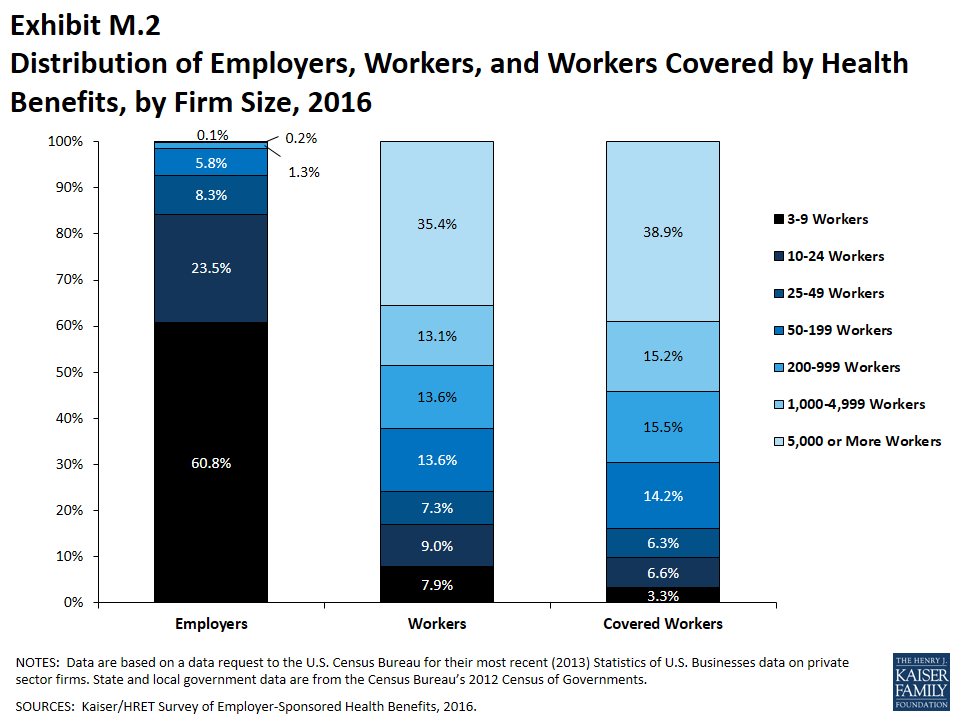
Exhibit M.2: Distribution of Employers, Workers, and Workers Covered by Health Benefits, by Firm Size, 2016

Throughout this report, we use the term “in-network” to refer to services received from a preferred provider.  Family coverage is defined as health coverage for a family of four.

The survey asks firms what percentage of their employees earn less than a specified amount in order to identify the portion of a firm’s workforce that has relatively low wages.  This year, the income threshold is $23,000 per year for lower-wage workers and $59,000 for higher-wage workers.  These thresholds are based on the 25th and 75th percentile of workers’ earnings as reported by the Bureau of Labor Statistics using data from the Occupational Employment Statistics (OES) (2015).33   The cutoffs were inflation-adjusted and rounded to the nearest thousand.  Prior to 2013, wage cutoffs were calculated using the now-eliminated National Compensation Survey.

Rounding and Imputation

Some exhibits in the report do not sum to totals due to rounding.  In a few cases, numbers from distribution exhibits may not add to the numbers referenced in the text due to rounding.  Although overall totals and totals for size and industry are statistically valid, some breakdowns may not be available due to limited sample sizes or a high relative standard error.  Where the unweighted sample size is fewer than 30 observations, exhibits include the notation “NSD” (Not Sufficient Data).  Many breakouts by subsets may have a large standard error, meaning that even large differences are not statistically different.

To control for item nonresponse bias, Kaiser/HRET imputes values that are missing for most variables in the survey.  On average, 6% of observations are imputed.  All variables are imputed following a hotdeck approach.  The hotdeck approach replaces missing information with observed values from a firm similar in size and industry to the firm for which data are missing.  In 2016, there were 12 variables where the imputation rate exceeded 20%; most of these cases were for individual plan level statistics – when aggregate variables were constructed for all of the plans, the imputation rate is usually much lower.  There are a few variables that Kaiser/HRET has decided not to impute; these are typically variables where “don’t know” is considered a valid response option (for example, firms’ opinions about the effectiveness of incentives to encourage worker participation in health and wellness programs).  In addition, there are several variables in which missing data are calculated based on respondents’ answers to other questions (for example, employer contributions to premiums are calculated from the respondent’s premium and the worker contribution to premiums).

Starting in 2012, the method to calculate missing premiums and contributions was revised; if a firm provides a premium for single coverage or family coverage, or a worker contribution for single coverage or family coverage, that information is used in the imputation.  For example, if a firm provided a worker contribution for family coverage but no premium information, a ratio between the family premium and family contribution was imputed and then the family premium was calculated.  In addition, in cases where premiums or contributions for both family and single coverage were missing, the hotdeck procedure was revised to draw all four responses from a single firm.  The change in the imputation method did not have a significant impact on the premium or contribution estimates.

Starting in 2014, we estimate separate single and family coverage premiums for firms that provide premium amounts as the average cost for all covered workers, instead of differentiating between single and family coverage.  This method more accurately accounts for the portion that each type of coverage contributes to the total cost for the 0.4% of covered workers who are enrolled at firms affected by this adjustment.

Sample Design

We determined the sample requirements based on the universe of firms obtained from the U.S. Census Bureau.  Prior to the 2010 survey, the sample requirements were based on the total counts provided by Survey Sampling Incorporated (SSI) (which obtains data from Dun and Bradstreet).  Over the years, we found the Dun and Bradstreet frequency counts to be volatile due to duplicate listings of firms, or firms that are no longer in business.  These inaccuracies vary by firm size and industry.  In 2003, we began using the more consistent and accurate counts provided by the Census Bureau’s Statistics of U.S. Businesses and the Census of Governments as the basis for post-stratification, although the sample was still drawn from a Dun and Bradstreet list.  In order to further address this concern at the time of sampling, starting in 2009, we use Census Bureau data to determine the number of firms to attempt to interview within each size and industry category.

Starting in 2010, we defined Education as a separate sampling category for the purposes of sampling, rather than as a subgroup of the Service category.  In the past, Education firms were a disproportionately large share of Service firms.  Education is controlled for during post-stratification, and adjusting the sampling frame to also control for Education allows for a more accurate representation of both the Education and Service industries.

In past years, both private and government firms were sampled from the Dun and Bradstreet database.  Beginning in 2009, Government firms were sampled from the 2007 Census of Governments.  This change was made to eliminate the overlap of state agencies that were frequently sampled from the Dun and Bradstreet database.  The sample of private firms is screened for firms that are related to state/local governments, and if these firms are identified in the Census of Governments, they are reclassified as government firms and a private firm is randomly drawn to replace the reclassified firm.  The federal government is not included in the sample frame.

Finally, the data used to determine the 2016 Employer Health Benefits Survey sample frame include the U.S. Census’ 2012 Statistics of U.S. Businesses and the 2012 Census of Governments.  At the time of the sample design (December 2015), these data represented the most current information on the number of public and private firms nationwide with three or more workers.  As in the past, the post-stratification is based on the most up-to-date Census data available (the 2013 update to the Census of U.S. Businesses was purchased during the survey fielding period).

Weighting and Statistical Significance

Because Kaiser/HRET selects firms randomly, it is possible through the use of statistical weights to extrapolate the results to national (as well as firm size, regional, and industry) averages.  These weights allow us to present findings based on the number of workers covered by health plans, the number of total workers, and the number of firms.  In general, findings in dollar amounts (such as premiums, worker contributions, and cost sharing) are weighted by covered workers.  Other estimates, such as the offer rate, are weighted by firms.  Specific weights were created to analyze the HDHP/SO plans that are offered with a Health Reimbursement Arrangement (HRA) or that are Health Savings Account (HSA)-qualified.  These weights represent the proportion of employees enrolled in each of these arrangements.

Calculation of the weights follows a common approach.  We trimmed the weights in order to reduce the influence of weight outliers.  First, we grouped firms into size and offer categories of observations.  Within each strata, we identified the median and the interquartile range of the weights and calculated the trimming cut point as the median plus six times the interquartile range (M + [6 * IQR]).  Weight values larger than this cut point are trimmed to the cut point.  In all instances, very few weight values were trimmed.  Finally, we calibrated the weights to U.S. Census Bureau’s 2013 Statistics of U.S. Businesses for firms in the private sector, and the 2012 Census of Governments as the basis for calibration / post-stratification for public sector firms.  Historic employer-weighted statistics were updated in 2011.

We conducted a follow-up survey of those firms with 3 to 49 workers that refused to participate in the full survey and conducted a McNemar test to verify that the results of the follow-up survey are comparable to the results from the original survey.

Between 2006 and 2012, only limited information was collected on conventional plans. Starting in 2013, information on conventional plans is collected under the PPO section and therefore, the covered worker weight is representative of all plan types for which the survey collects information.

The survey contains a few questions on employee cost sharing that are asked only of firms that indicate in a previous question that they have a certain cost-sharing provision. For example, copayment amounts for physician office visits are asked only of those that report they have copayments for such visits.  Because the composite variables (using data from across all plan types) are reflective of only those plans with the provision, separate weights for the relevant variables were created in order to account for the fact that not all covered workers have such provisions.

To account for design effects, the statistical computing package R and the library package “survey” were used to ­calculate standard errors.34 ,35   All statistical tests are performed at the .05 confidence level, unless otherwise noted.  For figures with multiple years, statistical tests are conducted for each year against the previous year shown, unless otherwise noted.  No statistical tests are conducted for years prior to 1999.  In 2012, the method to test the difference between distributions across years was changed to use a Wald test, which accounts for the complex survey design.  In general, this method is more conservative than the approach used in prior years.

Statistical tests for a given subgroup (firms with 25-49 workers, for instance) are tested against all other firm sizes not included in that subgroup (all firm sizes NOT including firms with 25-49 workers, in this example).  Tests are done similarly for region and industry; for example, Northeast is compared to all firms NOT in the Northeast (an aggregate of firms in the Midwest, South, and West).  However, statistical tests for estimates compared across plan types (for example, average premiums in PPOs) are tested against the “All Plans” estimate.  In some cases, we also test plan-specific estimates against similar estimates for other plan types (for example, single and family premiums for HDHP/SOs against single and family premiums for HMO, PPO, and POS plans); these are noted specifically in the text.  The two types of statistical tests performed are the t-test and the Wald test.  The small number of observations for some variables resulted in large variability around the point estimates.  These observations sometimes carry large weights, primarily for small firms.  The reader should be cautioned that these influential weights may result in large movements in point estimates from year to year; however, these movements are often not statistically significant.

2016 Survey

Between 2015 and 2016, we conducted a series of focus groups that led us to the conclusion that human resource and benefit managers at firms with between 20 and 49 employees think about health insurance premiums more similarly to benefit managers at smaller firms than larger firms.  Therefore, starting in 2016, we altered the health insurance premium question pathway for firms with between 20-49 employees to match that of firms with 3-19 employees rather than firms with 50 or more employees.  This change affected firms representing 8% of the total covered worker weight.  We believe that these questions produce comparable responses and that this edit does not create a break in trend.

Firms with 50 or more workers were asked: “Does your firm offer health benefits for current employees through a private or corporate exchange?”  Employers were still asked for plan information about their HMO, PPO, POS and HDHP/SO plan regardless of whether they purchased health benefits through a private exchange or not.

Starting in 2015, employers were asked how many full-time equivalent workers (FTEs) they employed.  In cases in which the number of full-time equivalents was relevant to the question, interviewer skip patterns may have depended on the number of FTEs.  In 2016, questions were added to ask firms to estimate the number of hours that a typical part-time worker averaged over the course of one week in order to more accurately determine which firms might be subject to the Employer Shared Responsibility Provision of the Affordable Care Act.  In cases where a firm did not know how many FTEs it employed, we calculated the number based on the number of part-time hours the firm reported.  In all cases, we assumed that firms with more than 250 full time employees had more than 50 FTES.

Starting in 2016, we made significant revisions to how the survey asks employers about their prescription drug coverage.  In most cases, information reported in Prescription Drug Benefits (Section 9) is not comparable with previous years’ findings.  First, in addition to the four standard tiers of drugs (generics, preferred, non-preferred, and lifestyle), we began asking firms about cost sharing for a drug tier that covers only specialty drugs.  This new tier pathway in the questionnaire has an effect on the trend of the four standard tiers, since respondents to the 2015 survey might have previously categorized their specialty drug tier as one of the other four standard tiers.  We did not modify the question about the number of tiers a firm’s cost-sharing structure has, but in cases in which the highest tier covered exclusively specialty drugs we reported it separately.  For example, in Exhibits 9.3 and 9.4, a firm with three tiers may only have copays or coinsurances for two tiers because their third tier copay or coinsurance is being reported as a specialty tier.  Furthermore, in order to reduce survey burden, firms were asked about the plan attributes of only their plan type with the most enrollment.  Therefore, in most cases, we no longer make comparisons between plan types.  Lastly, prior to 2016, we required firms’ cost sharing tiers to be sequential, meaning that the second tier copay was higher than the first tier, the third tier was higher than the second, and the fourth was higher than the third.  As drug formularies have become more intricate, many firms have minimum and maximums attached to their copays and coinsurances, leading us to believe it was no longer appropriate to assume that a firm’s cost sharing followed this sequential logic.

In cases where a firm had multiple plans, they were asked about their strategies for containing the cost of specialty drugs for the plan type with the largest enrollment.  Between 2015 and 2016, we modified the series of ‘Select All That Apply’ questions regarding cost containment strategies for specialty drugs.  In 2016, we elected to impute firms’ responses to these questions.  We removed the option “Separate cost sharing tier for specialty drugs” and added specialty drugs as their own drug tier questionnaire pathway.  We added question options on mail order drugs and prior authorization.

We discovered that the HRA and HSA distribution cutoff thresholds presented in prior years’ High Deductible Health Plan Section (Section 8) were calculated using each firm’s covered worker weight rather than the HRA- or HSA-specific enrollment weights.  Starting in 2016, the means and their subsequent distributions are now calculated using these plan-specific enrollment weights and therefore those thresholds are not directly comparable to prior-year statistics.

In our 2015 calculation of out-of-pocket (OOP) maximums, we mistakenly included plans in our calculations with $0 OOP maximums, representing 2.4% the total of covered worker weight, which pushed the distribution downward in 2015 Exhibit 7.31.  In the same 2016 exhibit (7.36), firms with $0 OOP maximums have been excluded.

Twenty-five firms reported allowing flexible spending account (FSA) employee contributions above the legal limit of $2,550 in 2016.  Although these firms were asked to confirm that their maximum contributions were above $2,550, we nonetheless recoded their responses to the legal ceiling of $2,550 and intend to provide additional clarification that we are interested in only a firm’s health FSA in the future.

In 2016, we modified our questions about telemedicine to clarify that we were interested in the provision of health care services, and not merely the exchange of information, through telecommunication.  We also added dependent and spousal questions to our health risk assessment question pathway.

In 2016, we ceased publication of the slide “Percentage of Firms Offering Health Benefits, by Firm Characteristics” (Exhibit 2.4 in the 2015 EHBS report).  Since firm characteristics are not collected from respondents that solely answer the offer question, this exhibit had been calculated using the employer weight derived from only firms that had completed the full survey.

Annual inflation estimates are usually calculated from April to April.   The 12 month percentage change for May to May was 1%.36 

Historical Data

Data in this report focus primarily on findings from surveys jointly authored by the Kaiser Family Foundation and the Health Research & Educational Trust, which have been conducted since 1999.  Prior to 1999, the survey was conducted by the Health Insurance Association of America (HIAA) and KPMG using a similar survey instrument, but data are not available for all the intervening years.  Following the survey’s introduction in 1987, the HIAA conducted the survey through 1990, but some data are not available for analysis.  KPMG conducted the survey from 1991-1998.  However, in 1991, 1992, 1994, and 1997, only larger firms were sampled.  In 1993, 1995, 1996, and 1998, KPMG interviewed both large and small firms.  In 1998, KPMG divested itself of its Compensation and Benefits Practice, and part of that divestiture included donating the annual survey of health benefits to HRET.

This report uses historical data from the 1993, 1996, and 1998 KPMG Surveys of Employer-Sponsored Health Benefits and the 1999-2015 Kaiser/HRET Survey of Employer-Sponsored Health Benefits.  For a longer-term perspective, we also use the 1988 survey of the nation’s employers conducted by the HIAA, on which the KPMG and Kaiser/HRET surveys are based.  The survey designs for the three surveys are similar.

Endnotes

  1. Kaiser Commission on Medicaid and the Uninsured. The uninsured: A primer—key facts about health insurance and the uninsured in America [Internet]. Washington (DC): The Commission; 2015 Nov [cited 2016 Aug 1]. https://modern.kff.org/uninsured/report/the-uninsured-a-primer/. See supplemental tables – Table 1: 270.2 million non-elderly people, 55.5% of whom are covered by ESI. ↩︎
  2. Kaiser/HRET surveys use the April-to-April time period, as do the sources in this and the following note. The inflation numbers are not seasonally adjusted. Bureau of Labor Statistics. Consumer Price Index – All Urban Consumers: Department of Labor; 2015. [cited 2016 July 28] http://data.bls.gov/timeseries/CUUR0000SA0?output_view=pct_1mth. Wage data are from the Bureau of Labor Statistics and based on the change in total average hourly earnings of production and nonsupervisory employees. Employment, hours, and earnings from the Current Employment Statistics survey: Department of Labor; 2016 [cited 2016 July 28]. http://data.bls.gov/timeseries/CES0500000008 ↩︎
  3. The change in enrollment in HDHP/SO between 2014 (20%) and 2016 (29%) is 8% due to rounding. ↩︎
  4. The change in enrollment in HDHP/SO between 2014 (20%) and 2016 (29%) is 8% due to rounding. ↩︎
  5. Federal Register. Vol. 75, No. 221, November 17, 2010. http://www.gpo.gov/fdsys/pkg/FR-2010-11-17/pdf/2010-28861.pdf ↩︎
  6. Internal Revenue Service. Section 4980I—Excise Tax on High Cost Employer-Sponsored Health Coverage: Notice 2015-16. https://www.irs.gov/pub/irs-drop/n-15-16.pdf ↩︎
  7. Because surveys only collect information from a portion of the total number of firms in the country, there is uncertainty in any estimate. Since there are so many small firms, sometimes even seemingly large differences are not statistically different. For more information on the Employer Health Benefits Survey’s weighting and design please see the Survey Design and Methods section. ↩︎
  8. Internal Revenue Code. 26 U.S. Code § 4980H – Shared responsibility for employers regarding health coverage. 2011. https://www.gpo.gov/fdsys/pkg/USCODE-2011-title26/pdf/USCODE-2011-title26-subtitleD-chap43-sec4980H.pdf ↩︎
  9. Internal Revenue Service. “Employer Health Care Arrangements”. Last updated March 4, 2016. http://www.irs.gov/Affordable-Care-Act/Employer-Health-Care-Arrangements ↩︎
  10. Kaiser Commission on Medicaid and the Uninsured. The uninsured: A primer—key facts about health insurance and the uninsured in America [Internet]. Washington (DC): The Commission; 2015 Nov [cited 2016 Aug 1]. https://modern.kff.org/uninsured/report/the-uninsured-a-primer/. See supplemental tables – Table 1: 270.2 million non-elderly people, 55.5% of whom are covered by ESI. ↩︎
  11. In 2009, Kaiser/HRET began weighting the percentage of workers that take up coverage by the number of workers eligible for coverage. The historical take up estimates have also been updated. See the Survey Design and Methods section for more information. ↩︎
  12. Variable hour employees may have a measurement period of up to 12 months before it is determined if they are eligible for benefits. Employers may require a cumulative service requirement of up to 1,200 hours before an employee may enroll. Federal Register. Vol. 79, No. 36. Feb 12, 2014. https://www.gpo.gov/fdsys/pkg/FR-2014-02-24/pdf/2014-03809.pdf ↩︎
  13. Under the ACA, employers may determine whether or not an employee is a full-time employee by looking back at the number of hours an employee has worked during a defined period. See https://www.irs.gov/affordable-care-act/employers/identifying-full-time-employees ↩︎
  14. Starting in 2010, we included firms that said they offer a plan type even if there are no covered workers enrolled in that plan type. ↩︎
  15. The change in enrollment in HDHP/SO between 2014 (20%) and 2016 (29%) is 8% due to rounding. ↩︎
  16. Estimates for premiums, worker contributions to premiums, and employer contributions to premiums presented in Section 6 do not include contributions made by the employer to Health Savings Accounts (HSAs) or Health Reimbursement Arrangements (HRAs). See Section 8 for estimates of employer contributions to HSAs and HRAs. ↩︎
  17. The average percent contribution is calculated as a weighted average of all a firm’s plan types and may not necessarily equal the average worker contribution divided by the average premium. ↩︎
  18. For definitions of Self-Funded and Fully-Insured plans, see the introduction to Section 10. ↩︎
  19. Some workers with separate per-person deductibles or out-of-pocket maximums for family coverage do not have a specific number of family members that are required to meet the deductible amount and instead have another type of limit, such as a per-person amount with a total dollar amount limit. These responses are included in the averages and distributions for separate family deductibles and out-of-pocket maximums. ↩︎
  20. Starting in 2010, the survey asked about the prevalence and cost of physician office visits separately for primary care and specialty care. Prior to the 2010 survey, if the respondent indicated the plan had a copayment for office visits, we assumed the plan had a copayment for both primary and specialty care visits. The survey did not allow for a respondent to report that a plan had a copayment for primary care visits and coinsurance for visits with a specialist physician. The changes made in 2010 allow for variations in the type of cost sharing for primary care and specialty care visits. The survey includes cost sharing for in-network services only. ↩︎
  21. For those enrolled in an HDHP/HSA, the out-of-pocket maximum is $6,550 for an individual plan and $13,100 for a family plan. ↩︎
  22. There is no legal requirement for the minimum deductible in a plan offered with an HRA. The survey defines a high-deductible HRA plan as a plan with a deductible of at least $1,000 for single coverage and $2,000 for family coverage. Federal law requires a deductible of at least $1,300 for single coverage and $2,600 for family coverage for HSA-qualified HDHPs in 2016. See the Text Box for more information on HDHP/HRAs and HSA-qualified HDHPs. ↩︎
  23. The definitions of HDHP/SOs do not include other consumer-driven plan options, such as arrangements that combine an HRA with a lower-deductible health plan or arrangements in which an insurer (rather than the employer as in the case of HRAs or the enrollee as in the case of HSAs) establishes an account for each enrollee. Other arrangements may be included in future surveys as the market evolves. ↩︎
  24. The survey asks “Up to what dollar amount does your firm promise to contribute each year to an employee’s HRA or health reimbursement arrangement for single coverage?” We refer to the amount that the employer commits to make available to an HRA as a contribution for ease of discussion. As discussed, HRAs are notional accounts, and employers are not required to actually transfer funds until an employee incurs expenses. Thus, employers may not expend the entire amount that they commit to make available to their employees through an HRA. Some employers may make their HRA contribution contingent on other factors, such as completing wellness programs. ↩︎
  25. See the Methods Section for more information. In cases in which a firm indicated that one of their tiers was exclusively for specialty drugs, we reported the cost-sharing structure and any copay or coinsurance information under the specialty drug banner. Therefore, a firm that has three tiers of cost sharing may only have plan attributes for the generic and preferred tier. ↩︎
  26. See the Methods Section for changes in these questions and responses as compared to 2015. ↩︎
  27. Internal Revenue Service. Section 4980I—Excise Tax on High Cost Employer-Sponsored Health Coverage: Notice 2015-16. https://www.irs.gov/pub/irs-drop/n-15-16.pdf ↩︎
  28. HDHP/SO includes high-deductible health plans with a deductible of at least $1,000 for single coverage and $2,000 for family coverage and that offer either a Health Reimbursement Arrangement (HRA) or a Health Savings Account (HSA). Although HRAs can be offered along with a health plan that is not an HDHP, the survey collected information only on HRAs that are offered along with HDHPs. For specific definitions of HDHPs, HRAs, and HSAs, see the introduction to Section 8. ↩︎
  29. HDHP/SO premium estimates do not include contributions made by the employer to Health Savings Accounts or Health Reimbursement Arrangements. ↩︎
  30. In total, 124 firms participated in 2014, 269 firms participated in 2015, and 1,064 firms participated in both 2014 and 2015. ↩︎
  31. Response rate estimates are calculated by dividing the number of completes over the number of refusals and the fraction of the firms with unknown eligibility to participate estimated to be eligible. Firms determined to be ineligible to complete the survey are not included in the response rate calculation. ↩︎
  32. Estimates presented in Exhibits 2.1, 2.2, 2.3 and 2.5 are based on the sample of both firms that completed the entire survey and those that answered just one question about whether they offer health benefits. ↩︎
  33. General information on the OES can be found at http://www.bls.gov/oes/oes_emp.htm#scope.  A comparison between the OES and the NCS is available at http://www.bls.gov/oes/oes_ques.htm ↩︎
  34. Analysis of the 2011 survey data using both R and SUDAAN (the statistical package used prior to 2012) produced the same estimates and standard errors. ↩︎
  35. A supplement with standard errors for select estimates can be found online at Technical Supplement: Standard Error Tables for Selected Estimates, http://ehbs.kff.org ↩︎
  36. Bureau of Labor Statistics, Consumer Price Index, U.S. City Average of Annual Inflation (April to April), 2000-2016; http://data.bls.gov/timeseries/CUUR0000SA0?output_view=pct_1mth ↩︎
News Release

The Status of Funding for Zika: Comparing the President’s Request and Congressional Proposals

Published: Sep 6, 2016

Zika, a mosquito-transmitted infection that in pregnant women can cause microcephaly as well as other serious birth defects, has recently become a global challenge, and with the first cases of local transmission now reported in the U.S., a domestic one as well. No new funding for Zika has yet been appropriated by Congress. While the President requested emergency funding from Congress to address Zika last February, it has yet to approve any funding and its own proposals differ significantly from the President’s. As lawmakers return from summer recess and consider funding for the Zika virus again, a new issue brief from the Kaiser Family Foundation provides a landscape of where the debate stands and compares the President’s emergency Zika request to Congressional proposals thus far.

The brief highlights that the President’s emergency request to Congress is significantly above the amount proposed in three Congressional bills. The proposals also differ by whether the funding would be “new” appropriations or entirely offset by changes to prior appropriations, the period of time for which funds would be available, the activities supported, and restrictions on how the funding would be utilized. In all proposals, the Department of Health and Human Services would receive the majority of resources, while the State Department and U.S. Agency for International Development would receive the remaining funding.

Key Implementers of U.S. Global Health Efforts

Published: Sep 6, 2016

Summary

To carry out global health efforts around the world, the U.S. government (USG) funds a wide range of implementing entities, including non-governmental organizations (NGOs), multilateral/international organizations, private sector organizations, educational institutions, and other governments. This brief provides an analysis of the implementing organizations that received U.S. global health funding from the U.S. Agency for International Development (USAID) in FY 2015. It helps to provide a more complete picture of key implementers of U.S. government global health efforts, building on earlier KFF analyses that focused on NGOs only.1  It finds that:

  • In FY 2015, 773 organizations received $6.65 billion to implement global health programs in 90 countries around the world.
  • Funded activities spanned all 9 major program areas of the U.S. global health portfolio, including HIV, tuberculosis, and family planning/reproductive health (FP/RH).
  • Most implementing organizations were NGOs (46%), followed by private sector organizations (41%). The largest share of funding (41%) was directed to NGOs; private sector organizations received about a quarter of funding (24%). While multilateral/international organizations made up only 2% of implementing organizations, they received more than a quarter of funding (28%). Foreign governments received only a small share of funding directly (1%).
  • While most implementing organizations were based outside the U.S. (55%), most funding was provided to U.S.-based organizations (62%); non-U.S.-based organizations, including local NGOs, received just 9% of funding.
  • The majority of funding (56%) was provided to just 10 organizations, most of which (7) were U.S.-based; none were local NGOs.
  • The greatest proportion of funding was provided to organizations working on HIV (54%), followed by maternal and child health (MCH) (13%), malaria (10%), and FP/RH (10%).

Issue Brief

Introduction

To carry out global health efforts around the world, the U.S. government (USG) funds a wide range of implementing entities, including non-governmental organizations (NGOs), multilateral/international organizations, private sector organizations, educational institutions, and other governments.

This brief provides an overview of the implementing organizations that received U.S. global health funding from the U.S. Agency for International Development (USAID) in FY 2015.2  It is based on analysis of data on USAID spending by implementing entity.3  Such spending includes funding received by USAID directly from Congress as well as through interagency transfers (primarily from the Department of State but also from the U.S. Department of Agriculture), which together account for the majority of U.S. global health spending.4  See Appendix A for a detailed methodology.

Findings

Overview

In FY 2015, 773 organizations5  received $6.65 billion in U.S. global health funding (see Table 1) to carry out global health activities in 90 countries,6  as follows:

  • Six main types of organizations received funding: NGOs,7  multilateral/international organizations, private sector organizations,8  educational institutions, foreign governments, and USG agencies and departments.
  • Most implementing organizations were NGOs (46%), followed by private sector organizations (41%). Multilateral/international organizations made up only 2% of implementing organizations. See Table 1 and Figure 1.
  • The largest share of U.S. global health funding went to NGOs (41%). Multilateral/international organizations received more than a quarter of funding (28%), while private sector organizations only received less than a quarter of funding (24%), followed by educational institutions (3%). Only a small share went to foreign governments (1%) or to USG agencies (1%). See Table 1 and Figure 1.
Table 1: USAID Global Health Spending – Number of Implementers and Spending, by Type of Implementer, FY 2015
Type of ImplementerNumber of ImplementersSpending($ millions)
Total 7736,650
NGOs359    2,760*
Multilateral/International Organizations18    1,864*
Private Sector315      1,581*
Educational Institutions36         197
Foreign Governments24          96
U.S. Government 21+84
Not Knownn/a           68
NOTES: Amounts are rounded. In the data, organizations are identified by implementer type; inaccurate categorizations appearing in the data would affect the totals above. * indicates a small amount of funding was “unattributed” to an implementing organization. + indicates the number of organizations/entities reflects entities, departments, operating divisions, etc., that were individually reflected in the data. n/a indicates the number of organizations could not be accurately determined because of redacted data.
Figure 1: USAID Global Health Spending: Implementers and Spending, Share by Type of Implementer, FY 2015
  • Most implementing organizations were based outside the U.S. (55%); the rest were U.S.-based (43%) or multilateral/international organizations (2%). See Table 2 and Figure 2.
  • On the other hand, most funding went to U.S.-based organizations, which accounted for $6 of every $10 (62%). The rest was provided through multilateral and international channels (28%) and to organizations that were based outside the U.S. (9%). See Table 2 and Figure 2.
Table 2: USAID Global Health Spending – Number of Implementers and Spending, by Channel of Distribution, FY 2015
Channel of DistributionNumber of ImplementersSpending($ millions)
Total 773      6,650
U.S.-Based 3324,093
Non-U.S.-Based 423        626
Multilateral/International 181,864
Not Known68
NOTES: Amounts are rounded. In the data, organizations are identified by implementer type and country of origin; inaccurate categorizations appearing in the data would affect the totals above. — indicates the number of organizations could not be accurately determined because of redacted data.
Figure 2: USAID Global Health Spending: Implementers and Spending, Share by Channel of Distribution, FY 2015
  • The majority of funding was provided to just 10 organizations (56%, $3.757 billion); of these, 3 were U.S.-based private sector organizations, 4 were U.S.-based NGOs, and 3 were multilateral/international organizations. None were local NGOs. See Table 3.
Table 3: Top 10 Recipients of USAID Global Health Spending, FY 2015
ImplementerSpending($ millions)Type of Implementer
Global Fund to Fight AIDS, Tuberculosis and Malaria1,267Multilateral/Int’l
John Snow, Inc.*583Private Sector
Partnership for Supply Chain Management~552NGO
FHI Development 360297NGO
Abt Associates226Private Sector
Jhpiego207NGO
Management Sciences for Health (MSH)175NGO
Gavi, the Vaccine Alliance   175Multilateral/Int’l
Chemonics149Private Sector
World Bank124Multilateral/Int’l
NOTES: Reflects organizations that received funding spent by USAID for USG global health efforts. Amounts are rounded. Multilateral/Int’l means Multilateral/International Organization. * indicates company also has a non-profit arm that is counted separately as an NGO (JSI’s non-profit arm is JSI Research & Training Institute). ~ indicates NGO is a separate legal entity established by JSI Research & Training Institute and MSH to implement specific work.
  • Organizations received funding in all 9 major program areas of the U.S. global health portfolio: HIV; tuberculosis (TB); malaria; maternal and child health (MCH); nutrition; family planning/reproductive health (FP/RH); other public health threats, including neglected tropical diseases (NTDs); pandemic influenza and other emerging threats (PIOET); and water supply and sanitation. Most funding went to HIV (54%, $3.615 billion), followed by MCH (13%, $833 million) and malaria (10%, $674 million). See Figure 3.
Figure 3: USAID Global Health Spending by Program Area, FY 2015
  • The major types of implementer varied by program area. For example, TB funding mostly went to NGOs (48%, $110 million), followed by multilateral/international organizations (30%, $70 million), while malaria funding mostly went to the private sector (67%, $451 million), followed by NGOs (21%, $140 million). See Table 4.
  • NGOs received the most funding in five program areas (HIV, FP/RH, TB, nutrition, and other public health threats); private sector organizations received most in two program areas (malaria, and water supply and sanitation); multilateral/international organizations received most in one program area (MCH); and educational institutions received most in one program area (PIOET). See Table 4.
Table 4: USAID Global Health Spending – Spending by Program Area, FY 2015
Program AreaShare of Spending by Type of Implementer(%)Spending($ millions)
NGOsMultilateral/InternationalPrivate SectorEducational InstitutionsForeign GovernmentsU.S. GovernmentNot Known
HIV4238152<1113,615
MCH36381726<1<1833
Malaria21567313<1674
FP/RH4833953<1<1640
Water*3555343<1<1249
TB483019<1<11<1232
Nutrition85752<1<1<1223
Other Threats^        73126323<1127
PIOET14241631<111557
NOTES:  Percentages and $ amounts are rounded, except <1 shows those percentages under 1%. Percentages may not sum to 100%. Abbreviations mean: Multilateral/International means Multilateral/International Organizations, MCH – Maternal and Child Health, FP/RH – Family Planning and Reproductive Health, TB – Tuberculosis, PIOET – Pandemic Influenza and Other Emerging Threats. * means Water Supply and Sanitation. ^ means Other Public Health Threats, which includes NTDs. + indicates that funding for the Global Fund is attributed by USAID in the data to HIV only rather than to HIV, TB, and malaria.

Implementers by Type

Non-Governmental Organizations (NGOs)

As mentioned above, NGOs9  received the largest share of U.S. global health funding in FY 2015 (41%, $2.76 billion). The vast majority of this funding went to U.S.-based NGOs (85%), versus NGOs based outside the U.S. (15%). On the other hand, less than half of the NGOs who received funding were U.S.-based (41%, 148); most were based outside the U.S. (59%, 211). Additionally:

  • About half (49%, $1.346 billion) of this funding went to the top 5 highest-funded NGOs, which were all U.S.-based; see Table 5.
  • The majority of funding provided to NGOs was for activities related to HIV (55%), followed by FP/RH (11%) and MCH (11%); see Table 7.
Table 5: Top 5 Recipients of USAID Global Health Spending, FY 2015 – NGOs and Multilateral/International Organizations
ImplementerSpending($ millions)
NGOs
Partnership for Supply Chain Management ~552
FHI Development 360297
Jhpiego207
Management Sciences for Health (MSH)175
Catholic Relief Services (CRS)114
Multilateral/International Organizations
Global Fund to Fight AIDS, Tuberculosis and Malaria1,267
Gavi, the Vaccine Alliance   175
World Bank    124
World Health Organization (WHO)107
United Nations Children’s Fund (UNICEF)70
NOTES: Reflects organizations across selected implementer types that received funding spent by USAID for USG global health efforts. Amounts are rounded. ~ indicates NGO is a separate legal entity established by JSI Research & Training Institute and MSH to implement specific work.
Multilateral/International Organizations10 

Nearly 20 multilateral/international organizations received more than a quarter of U.S. global health funding – the second largest share – in FY 2015 (28%, $1.864 billion). Additionally:

  • The vast majority (94%, $1.743 billion) of this funding went to the top 5 highest-funded multilateral/international organizations; see Table 5. The Global Fund to Fight AIDS, Tuberculosis and Malaria (the Global Fund; an independent, international financing institution established in 2001 that provides grants to countries to address HIV, TB, and malaria)11  alone accounts for more than two-thirds of this funding (68%, $1.267 billion)12  and is the largest organizational recipient of U.S. global health funding.13 
  • Nearly three quarters of funding provided to multilateral/international organizations was for activities related to HIV (73%).14  See Table 7.
Private Sector

Private sector organizations received less than a quarter of U.S. global health funding in FY 2015 (24%, $1.581 billion). Nearly all funding went to U.S.-based private sector organizations (93%), versus those based outside the U.S. (7%). On the other hand, less than half of the private sector organizations that received funding were U.S.-based (44%, 139); more than half were based outside the U.S. (56%, 176). Additionally:

  • Nearly three quarters (72%, $1.131 billion) of this funding went to the top 5 highest-funded private sector organizations, which were all U.S.-based; see Table 6.
  • A third of funding provided to the private sector was for activities related to HIV (34%), followed by malaria (29%) and FP/RH (16%); see Table 7.
Table 6: Top 5 Recipients of USAID Global Health Spending, FY 2015 –  Private Sector, Educational Institutions, Foreign Governments, and U.S. Government Entities
ImplementerSpending($ millions)
Private Sector
John Snow, Inc.*583
Abt Associates226
Chemonics149
University Research Co., LLC*120
Futures Group International+53
Educational Institutions
Johns Hopkins University75
University of North Carolina at Chapel Hill35
Eastern Virginia Medical School27
University of California14
Florida International University9
Foreign Governments
Afghanistan46
Liberia18
Egypt7
Pakistan6
Tanzania5
U.S. Government/Other Agencies
Centers for Disease Control and Prevention (CDC)     35
Department of State       8
U.S. Census Bureau4
General Services Administration (GSA)        4
Naval Medical Research Center (NMRC)       1
NOTES: Reflects organizations across selected implementer types that received funding spent by USAID for USG global health efforts. Amounts are rounded. * indicates company also has a non-profit arm that is counted separately as an NGO. For example, URC’s non-profit arm is The Center for Human Services. + indicates now known as Palladium.
Educational Institutions

Educational institutions received a small share of U.S. global health funding in FY 2015 (3%, $197 million). Nearly all of this funding went to U.S.-based institutions (97%), versus those based outside the U.S. (3%). Two-thirds of the educational institutions were U.S.-based (67%, 24); the rest were based outside the U.S. (33%, 12). Additionally:

  • The vast majority (81%, $160 million) of this funding went to the top 5 highest-funded institutions, which were all U.S.-based; see Table 6.
  • Nearly half of funding provided to educational institutions was for activities related to HIV (45%), followed by FP/RH (18%); see Table 7.
Foreign Governments

Foreign governments received a very small share of U.S. global health funding in FY 2015 (1%, $96 million). This funding went to the governments of 24 countries, which is about a quarter of the overall number of countries reached by U.S. global health funding in FY 2015. Additionally:

  • Five foreign governments accounted for the vast majority (85%, $81 million) of this funding; see Table 6.
  • Almost half of funding provided to foreign governments was for activities related to MCH (48%), followed by FP/RH (22%) and water (9%); see Table 7.
U.S. Government

USAID also provided approximately 1% ($84 million) of funding for global health to USG agencies:

  • Five other USG agencies/departments accounted for more than half (61%, $52 million) of this funding; see Table 6. The Centers for Disease Control and Prevention (CDC) was the largest recipient ($35 million).
  • Nearly half of funding transferred to USG entities was for activities related to HIV (47%), followed by malaria (24%); see Table 7.
Table 7: USAID Global Health Spending – Spending by Type of Implementer, FY 2015
Type of ImplementerShare of Spending by Program Area(%)Spending($ millions)
HIVMCHMalariaFP/RHWater*TBNutritionOther Threats^PIOET
NGOs55115113473<1    2,760
Multilateral/International73+172<1<14<1<1<1    1,864
Private Sector349291683<1<1<1      1,581
Educational Institutions45991851229         197
Foreign Governments74882292<13<1          96
U.S. Government47624613<15784
Not Known78536<11<124           68
NOTES: Percentages and $ amounts are rounded, except <1 shows those percentages under 1%. Percentages may not sum to 100%. Abbreviations mean: Multilateral/International means Multilateral/International Organizations, MCH – Maternal and Child Health, FP/RH – Family Planning and Reproductive Health, TB – Tuberculosis, PIOET – Pandemic Influenza and Other Emerging Threats. * means Water Supply and Sanitation. ^ means Other Public Health Threats, which includes NTDs. + indicates that funding for the Global Fund is attributed in the data to HIV only rather than to HIV, TB, and malaria.

Conclusion

To carry out its global health programs, the U.S. government funds a wide range of implementing organizations. In an effort to shed light on this landscape, this brief provides an analysis of the implementing organizations that received U.S. global health funding from USAID during FY 2015. As it finds, NGOs represent the largest group of implementers and receive the greatest share of U.S. global health funding. In addition, most implementers are based outside of the U.S. However, the analysis also finds that most funding is concentrated among a subset of implementers and is directed to U.S.-based organizations, which may have implications for longer term sustainability and country ownership. Taken together, these findings provide new information on the types of implementing organizations funded to carry out U.S. global health efforts around the world and point toward areas for further research.


Appendix

Appendix A: Detailed Methodology

This report is based on Kaiser Family Foundation analysis of USAID global health funding data for FY 2015, which were provided to KFF on request by USAID staff working on the U.S. Foreign Assistance Dashboard website and by OGAC and Global Fund staff, and additional research on some of the funded organizations.

The analysis uses transaction-level data on funding disbursed by USAID to organizations for global health activities as well as the reported U.S. contribution to the Global Fund.15  Data include funding that was appropriated by Congress to USAID for global health activities and then disbursed to organizations, as well as funding that was appropriated to other agencies for global health efforts, transferred to USAID, and then disbursed to organizations.16  It does not include funding that was directly disbursed by other USG departments/agencies, such as the Department of State or the Centers for Disease Control and Prevention, to organizations.

Funding totals are likely under-estimates, because some USAID spending has not been categorized into a specific category of activity (e.g., health, environment, economic development, etc.) in the transaction data and may include health funding.

Additionally, note:

    Organizations were classified by implementer type based on existing categories in the data, specifically non-profit organization (referred to as NGOs in the analysis17 ), for-profit (referred to as private sector in the analysis), educational institution, government, redacted (referred to as “not known” in the analysis, and public international organization (referred to as multilateral/international organizations in the analysis). The only exception to this were entries in the “not known” type that included the name of an implementing organization: six of these organizations appeared under a specific implementer type elsewhere in the data and were re-categorized accordingly, while eight of these organizations did not appear elsewhere in the data and were re-categorized using standard conventions. Five entries that included the name of an individual (which is usually redacted in this dataset) under the “not known” type were not re-categorized and were not counted as implementing organizations. It is possible that implementer type misclassifications by USAID are present in the data, meaning that one or more organizations may have been classified as a certain implementer type by USAID in the data when another type would have been more appropriate. Funding totals shown in this report represent net disbursements, which include positive and negative disbursed funding amounts as well as zero-dollar disbursed funding amounts. For zero-dollar transactions, we included only transactions we could verify as no-cost extensions.18  The numbers of organizations reflected under each type were calculated based on available data, reflecting how each organization/entity appears in the data, where possible. It was not possible to calculate the number of organizations receiving funding included under the “not known” implementer type, due to redacted data on the implementing organization. Similarly, it was also not possible to precisely calculate the number of organizations receiving funding included under the non-profit organizations, private sector, and multilateral/international organizations types, due to redacted data on the implementing organization – resulting in small amounts of unattributed funding. Funding totals in this brief should not be compared with earlier KFF analyses of USAID global health spending via NGOs, due to several differences between the datasets examined (including the availability of data on transferred funding to USAID from the U.S. Department of Agriculture, which was ultimately disbursed by USAID, in the dataset used for this analysis) as well as minor differences in methodology (including NGOs and other non-profit organizations not being delineated into distinct categories in this analysis, versus the prior analyses).


Endnotes

  1. Figures in this analysis should not to be compared to earlier KFF analyses of USAID spending to NGOs due to data and methodology differences. See Appendix A for more information. Earlier reports include KFF: The Role of NGOs in the U.S. Global Health Response, July 2015; Foreign NGO Engagement in U.S. Global Health Efforts: Foreign NGOs Receiving USG Support Through USAID, May 2015; NGO Engagement in U.S. Global Health Efforts: U.S.-Based NGOs Receiving USG Support Through USAID, Dec. 2014. ↩︎
  2. Figures in this analysis should not to be compared to earlier KFF analyses of USAID spending to NGOs due to data and methodology differences. See Appendix A for more information. Earlier reports include KFF: The Role of NGOs in the U.S. Global Health Response, July 2015; Foreign NGO Engagement in U.S. Global Health Efforts: Foreign NGOs Receiving USG Support Through USAID, May 2015; NGO Engagement in U.S. Global Health Efforts: U.S.-Based NGOs Receiving USG Support Through USAID, Dec. 2014. ↩︎
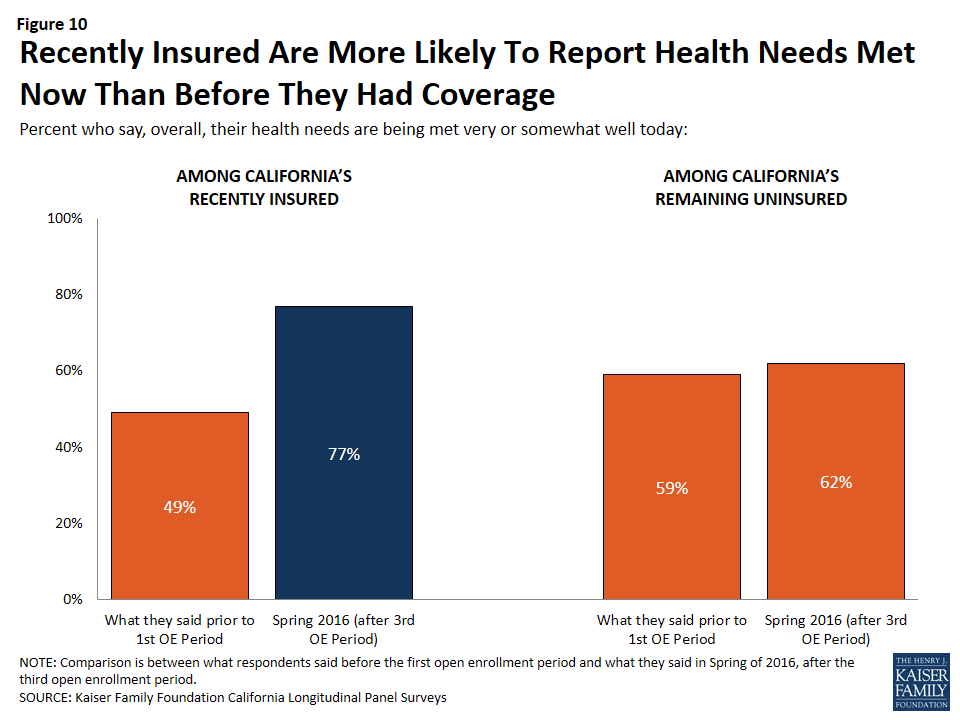
  3. KFF analysis of USAID FY 2015 transaction data provided via personal communication with USAID staff of the U.S. Foreign Assistance Dashboard, ForeignAssistance.gov, July 21, 2016; and KFF personal communication with OGAC and the Global Fund, July 2016. ↩︎
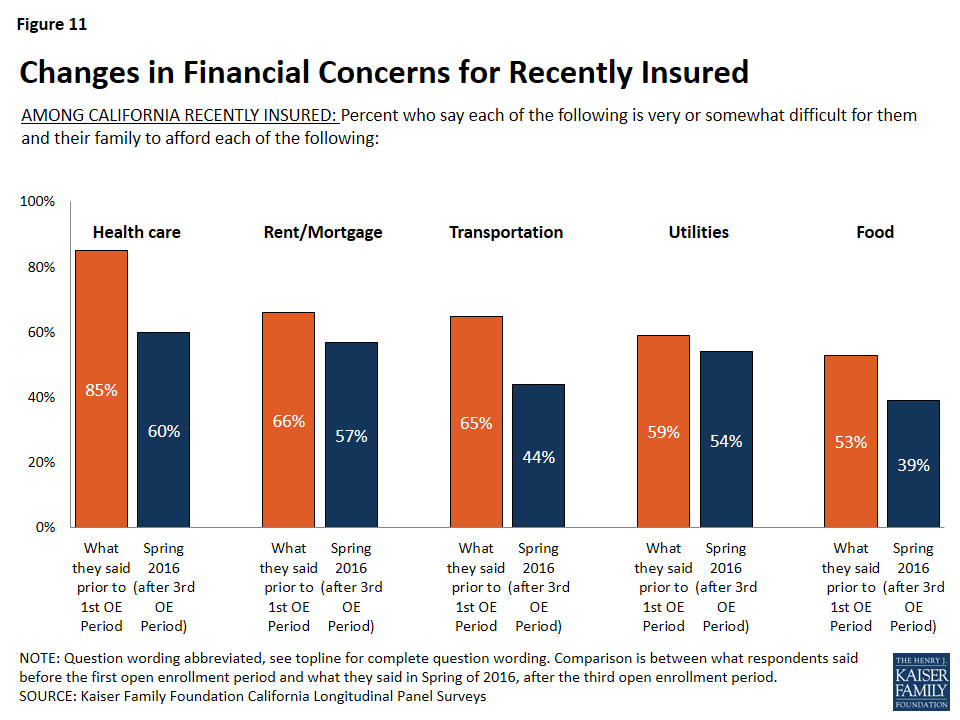
  4. Based on KFF analysis of USAID FY 2015 transaction data provided via personal communication with USAID staff of the U.S. Foreign Assistance Dashboard, ForeignAssistance.gov, July 21, 2016; FY 2015 transaction data from the U.S. Foreign Assistance Dashboard website, ForeignAssistance.gov, downloaded July 14, 2016; and data from the Office of Management and Budget, Agency Congressional Budget Justifications, and Congressional Appropriations Bills, and the U.S. Foreign Assistance Dashboard website, ForeignAssistance.gov. ↩︎
  5. Some recipients were not identified in the data, i.e., the information was redacted, most likely for privacy reasons because the recipient was an individual. ↩︎
  6. Funding through U.S.- and non-U.S.-based channels directly supported activities in 90 countries; some of this funding supported “worldwide” activities and regional activities spanning five regions (Africa, Asia, Europe & Eurasia, Latin America & the Caribbean, and the Middle East) and may have reached additional countries. Additionally, funding through multilateral and international channels indirectly supported activities that may have reached additional countries/regions as well. ↩︎
  7. Our earlier analyses of FY 2013 and FY 2014 health spending by USAID focused specifically on NGOs and include a definition of NGOs. This category also includes other non-profit organizations, which would include those that were not identified in the data as PIOs nor, in earlier analyses, by KFF as NGOs (e.g., hospitals, educational institutions, organizations with ties to government(s), and foundations supporting these) as well as recipients that were redacted in the data but were categorized as non-profit organizations in the data. In this report, we did not categorize non-profit organizations as NGOs and other non-profits specifically and, therefore, did not delineate between them, but many of the NGOs and other non-profits identified in our earlier analyses also appear in the FY 2015 USAID health spending data. Earlier analyses demonstrated that nearly all support for non-profits went to NGOs. See KFF: The Role of NGOs in the U.S. Global Health Response, July 2015; Foreign NGO Engagement in U.S. Global Health Efforts: Foreign NGOs Receiving USG Support Through USAID, May 2015; NGO Engagement in U.S. Global Health Efforts: U.S.-Based NGOs Receiving USG Support Through USAID, Dec. 2014. ↩︎
  8. For-profit organizations. ↩︎
  9. This also includes other non-profit organizations, which are organizations identified in the data as non-profits that were neither identified as public international organizations in the data, nor would they classified as NGOs (see KFF definition of NGOs used in earlier analyses); they might include hospitals, educational institutions (specifically, those not classified separately as such in the data), organizations with ties to government(s), and foundations supporting these. See KFF: The Role of NGOs in the U.S. Global Health Response, July 2015; Foreign NGO Engagement in U.S. Global Health Efforts: Foreign NGOs Receiving USG Support Through USAID, May 2015; NGO Engagement in U.S. Global Health Efforts: U.S.-Based NGOs Receiving USG Support Through USAID, Dec. 2014. ↩︎
  10. Referred to in the data as Public International Organizations (PIOs), which are defined in USAID, ADS Chapter 308: Awards to Public International Organizations, April 3, 2014, as “an international organization composed principally of countries or such other organization as designated pursuant to” a section therein, and also in USAID, ADS Glossary, April 30, 2014, as “an organization in which the U.S. participates composed principally of governments.” ↩︎
  11. For more information on the Global Fund, see KFF, “The U.S. & The Global Fund to Fight AIDS, Tuberculosis and Malaria,” fact sheet. ↩︎
  12. This is the amount of funding that the U.S. government and the Global Fund reported as the U.S. contribution for FY 2015, although a portion of it was disbursed in FY 2016 due to congressional requirements on the overall level of U.S. funding for the Global Fund. KFF personal communication with OGAC and the Global Fund, July 2016. ↩︎
  13. This funding is provided by Congress to the Department of State, which in turn provides it as a pass-through to USAID. KFF personal communication with OGAC, March 2016; CRS, U.S. Agency for International Development: Background, Operations, and Issues, July 21, 2015, R44117. ↩︎
  14. Funding for the Global Fund is attributed by USAID in the data to HIV only rather than to HIV, malaria, and TB. ↩︎
  15. This is the amount of funding that the U.S. government and the Global Fund reported as the U.S. contribution for FY 2015, although a portion of it was disbursed in FY 2016 due to congressional requirements on the overall level of U.S. funding for the Global Fund. KFF personal communication with OGAC and the Global Fund, July 2016. ↩︎
  16. For example, USAID transaction data analyzed for this report include funds transferred from the Department of State to USAID for HIV efforts, which were then obligated and eventually disbursed to various implementing organizations. ↩︎
  17. Our earlier analyses of FY 2013 and FY 2014 health spending by USAID focused specifically on NGOs and include a definition of NGOs. Other non-profit organizations would include those that were not identified in the data as PIOs, nor would they classified as NGOs (see KFF definition of NGOs used in earlier analyses); they might include hospitals, educational institutions (specifically, those not classified separately as such in the data), organizations with ties to government(s), and foundations supporting these. See KFF: The Role of NGOs in the U.S. Global Health Response, July 2015; Foreign NGO Engagement in U.S. Global Health Efforts: Foreign NGOs Receiving USG Support Through USAID, May 2015; NGO Engagement in U.S. Global Health Efforts: U.S.-Based NGOs Receiving USG Support Through USAID, Dec. 2014. ↩︎
  18. Positive and negative disbursements along with zero-dollar disbursements that are no-cost extensions are each closely linked to the recent completion or ongoing execution of global health activities, providing the best approximation available for showing where work is being done. ↩︎
Poll Finding

Kaiser Health Tracking Poll: August 2016

Authors: Ashley Kirzinger, Elise Sugarman, Bryan Wu, and Mollyann Brodie
Published: Sep 1, 2016

Findings

KEY FINDINGS:

  • Two-thirds of voters say the future of Medicare and access and affordability of health care are top priorities for the candidates to be talking about during the 2016 presidential campaign.
  • More voters trust Hillary Clinton to do a better job dealing with health care issues than trust Donald Trump, although few believe their own ability to access affordable health care would get better regardless of which candidate is elected. Voters, age 65 and older, are split between which candidate they trust to do a better job dealing with the future of Medicare with a similar share saying they trust Trump (44 percent) as say they trust Clinton (47 percent).
  • Almost all Americans have heard or read about the Zika virus (92 percent), and one-third (36 percent) say that passing new funding to deal with the outbreak in the U.S. should be a top priority for Congress, with an additional 40 percent saying it should be an important but not a top priority. A large majority of all partisans say that new Congressional funding should be at least an important priority for Congress.
  • About half of the public says they would not feel comfortable traveling to places like parts of Florida where people have been infected with the Zika virus by mosquitoes. In addition, three-fourths (77 percent) say these places are generally unsafe for pregnant women. The Kaiser Family Foundation has been tracking public opinion on Zika since February 2016; for more poll results, visit the up-to-date Zika slideshow.
  • About half of Americans are concerned that an unauthorized person might get access to their confidential records and information; despite this, 80 percent say it is important that their doctors use online medical records.
  • Americans’ opinion of the health care law remains split, with 40 percent saying they have a favorable view and 42 percent saying they have an unfavorable view.

Voters and the 2016 Presidential Campaign

There are less than 10 weeks until the 2016 general election and no shortage of issues for the presidential candidates to discuss on the campaign trail and in upcoming debates. While health care has generally taken a backseat so far in the 2016 presidential election,1  during the past month, there have been several health policy stories garnering media attention including the Zika virus outbreak, prescription drug costs, health insurers leaving ACA marketplaces, and the ongoing opioid epidemic. These are in addition to other health policy issues the next president will almost certainly have to address.

When asked which health issues the presidential candidates should prioritize discussing during the 2016 presidential campaign, two-thirds of voters say the future of Medicare and access and affordability of health care are top priorities for the candidates to be talking about. About half of voters also say the future of Medicaid (54 percent), the cost of prescription drugs (53 percent), and the future of the health care law (52 percent) are top priorities. Fewer than half say the ongoing opioid epidemic (41 percent) and women’s access to reproductive health services (40 percent) are top priorities, with 35 percent saying the same about the Zika virus outbreak and 29 percent saying the same about HIV/AIDS. While the Zika virus outbreak is not viewed by the majority of voters as a top priority for candidates to discuss during the campaign, it is the most closely followed health policy news story during August.

Figure 1: Access and Affordability of Health Care and Medicare Top Health Issues Voters Want Candidates to Discuss; ACA Ranks Lower

Partisans hold differing opinions on which health issues are a “top priority” for the presidential candidates to be talking about during the presidential campaign. Three-fourths (77 percent) of Democratic voters say access and affordability of health care is a top priority; however, this opinion is shared by a smaller majority of independent voters (62 percent) and Republican voters (55 percent). Six in ten Republican voters say the future of Medicare is a top priority for the candidates to be talking about, which is equal to the share of independent voters who say the same, and lower than the share of Democratic voters (73 percent) who say the same.

A smaller share of Republican voters than Democratic voters say that each health issue should be a top priority for the presidential candidates to discuss during the presidential campaign, with one notable exception — the future of the 2010 health care law. Similar shares of Republican voters (55 percent) and Democratic voters (59 percent) say the health care law should be a top priority for the candidates to be talking about, compared to a smaller share (44 percent) of independent voters.

Table 1: Top Health Priorities for the Candidates to Discuss During the 2016 Presidential Election
The percent who said the following should be a “top priority” for the presidential candidates to be talking about during the 2016 presidential campaignAll Registered VotersRepublicanVotersDemocraticVotersIndependentVoters
Access and affordability of health care66%55%77%62%
The future of Medicare66607360
The future of Medicaid54436450
The cost of prescription drugs53476348
The future of the 2010 health care law52555944
The ongoing heroin and prescription painkiller addiction epidemic in the U.S.41345135
Women’s access to reproductive health services40215937
The Zika virus outbreak35304430
HIV/AIDS29183828

Who Do the Voters Trust On Health Issues?

When it comes to dealing with health issues facing the country, a larger share of voters say they trust Hillary Clinton to do a better job than say they trust Donald Trump to a better job. In fact, across all of the health issues included in this survey, at least half of voters say they trust Clinton to do a better job, and on the majority of the health issues, she has a double digit percentage point advantage over Trump. The largest difference between the two presidential candidates is on women’s access to reproductive health services; 64 percent of voters say they trust Clinton to do a better job dealing with this compared to 28 percent of voters who say they trust Trump to do a better job, giving Clinton a 36 percentage point advantage. A majority of female voters (71 percent) say they trust Clinton to do a better job on women’s access to reproductive health services compared to one in five (20 percent) who say they trust Trump.  The smallest difference is on the future of the 2010 health care law, on which Clinton has a 9 percentage point advantage over Trump (50 percent compared to 41 percent). Voters, age 65 and older, are split between which candidate they trust to do a better job dealing with the future of Medicare with a similar share saying they trust Trump (44 percent) as say they trust Clinton (47 percent).

Figure 2: Larger Shares of Voters Trust Clinton to Deal with Health Issues

Majorities of voters from each political party say they trust their party’s candidate to do a better job dealing with each of the health issues compared to the other party’s candidate. Across all health issues, about nine out of ten Democratic voters say they trust Clinton to do a better job while a smaller share, yet still a majority, of Republican voters say they trust Trump to do a better job. Independent voters are more divided on all of these health care issues.

Figure 3: Partisan Voters Say They Trust Their Party’s Candidate to Do A Better Job with Health Issues
Access and Affordability of Health Care

When asked about how access to affordable health care in the country would change if Trump were elected, four in ten voters (43 percent) say that it would get worse, three in ten (29 percent) say it would get better, and one-fourth say it would not make much of a difference. When asked the same about if Clinton were elected president, 27 percent of voters say access to affordable health care in the country generally would get worse, one-third say it would get better, and four in ten (38 percent) say it would not make much of a difference.

Figure 4: Four in Ten Voters Say Access to Affordable Health Care Would Get Worse If Donald Trump Is Elected

When asked how a Trump or Clinton presidency would affect their own ability to access affordable health care, half of voters (52 percent) say if Clinton is elected president it would not make much of a difference, while similar shares say it would get better (22 percent) as say it would get worse (24 percent). This is compared to 37 percent of voters who say that if Trump is elected, it would not make much of a difference in their own ability to access affordable health care, 36 percent who say it would make their own ability to access affordable health care get worse, and 24 percent who say it would get better.

Figure 5: Small Shares of Voters Say Own Ability to Access Affordable Health Care Would Get Better If Either Candidate Is Elected

Partisan voters are divided on how access to affordable health care would change, both in the country generally and for them personally, under a Trump or Clinton presidency. Three-fourths of Democratic voters say that if Donald Trump were elected president, access to affordable health care in the country generally would get worse (compared to 11 percent of Republican voters); two-thirds of Democratic voters say their own ability to access affordable health care would get worse if Trump were elected (compared to 7 percent of Republican voters). On the other hand, if Hillary Clinton were elected president, 53 percent of Republican voters say access to affordable health care in the country generally would get worse (compared to 3 percent of Democratic voters), and 48 percent say their own ability to access affordable health care would get worse (compared to 3 percent of Democratic voters). Independent voters are split on what would happen if Trump or Clinton is elected, with about one-fourth saying their own ability to access affordable health care would get worse if either candidate was elected.

Figure 6: Partisan Voters Divided on How Presidential Election Will Impact Access and Affordability of Health Care

Americans’ Opinions of the Affordable Care Act

Americans’ opinion of the health care law remains divided, with 40 percent saying they have a favorable view and 42 percent saying they have an unfavorable view.

Figure 7: Public Divided on View of the Health Care Law

Furthermore, partisans continue to hold widely differing views; two-thirds of Democrats (67 percent) report a favorable view, while three-fourths of Republicans (76 percent) report an unfavorable view and independents tilt negative, with 37 percent saying they have a favorable opinion and 47 percent saying they have an unfavorable opinion.

When asked about the news media’s coverage of the health reform law, four in ten say that the coverage is mostly balanced while 27 percent say it is biased in favor of the law and 21 percent say it is biased against the law. About half (47 percent) of Republicans say the news media coverage of the health reform law is biased in favor of the law while half of Democrats and 43 percent of independents say the news coverage is mostly balanced.

Figure 8: Nearly Half of Republicans Say News Media Coverage of the ACA Is Biased in Favor of the Law

The Zika Virus Outbreak

The Zika virus outbreak continues to be the health policy story most followed by Americans. In July, health officials confirmed the first cases of individuals being infected by mosquitoes in the U.S. in a Miami, Florida neighborhood, and a subsequent travel advisory recommended that pregnant women stay away from the area.2 

The August tracking poll takes a look at the public’s knowledge of these recent developments, their attitudes about travel to – and safety of – areas affected by Zika, and their views on the importance of Congressional funding to deal with the outbreak in the United States. The Kaiser Family Foundation has been tracking public opinion on Zika since February 2016; for more poll results, visit the up-to-date Zika slideshow.

Knowledge of Local Transmission and Domestic Travel Warnings

Three-fourths of the public (76 percent) are aware that there are cases of local transmission in the country – that is, cases where people are being infected with the Zika virus by mosquitoes. A smaller share, but still a majority, report being aware of travel warnings issued for areas in the United States affected by the outbreak (58 percent).

Figure 9: Three in Four Americans Know About Cases of Local Transmission in U.S., Fewer Aware of Travel Warnings

Attitudes Toward Traveling to Places Affected by Zika

About half of the public (48 percent) say that they would be “not too” or “not at all” comfortable traveling to places in the U.S., like parts of Florida, where people have been infected with Zika by mosquitoes. In contrast, six in ten say they would be not be comfortable traveling to U.S. territories like Puerto Rice where people have become infected (59 percent) or to places outside the U.S. where people have become infected (61 percent).

Figure 10: Larger Share of Americans Feel Comfortable Traveling to U.S. Areas Affected by Zika Virus than to Territories, Places Abroad

Individuals who report being aware of travel warnings for areas in the U.S. affected by Zika are more likely to say they are not comfortable traveling to places affected by the virus. For example, when asked about traveling to places in the U.S. like Florida where people have been infected by mosquitoes, 59 percent of individuals aware of travel warnings say that they would not be comfortable, compared to 39 percent of those who thought travel warnings had not been issued. In addition, women are not as comfortable traveling to places affected by Zika than men. Fifty-three percent of women, compared to 43 percent of men, report being not comfortable traveling to places in the U.S. where people have been infected by mosquitoes.

Evaluations of Safety for Pregnant Women

A large majority – 77 percent – of the public say they think areas in the U.S. where people have been infected by mosquitoes are generally unsafe for pregnant women. A small share appears concerned about the safety of these places for themselves, with half saying that areas in the U.S. where people have been infected with Zika by mosquitoes are generally safe for them, personally and 39 percent saying they are generally unsafe.

Figure 11: A Large Majority Says Areas of U.S. with Cases of Local Transmission of Zika Are Generally Unsafe for Pregnant Women

Individuals aware of the travel warnings issued for places in the U.S. affected by Zika are more likely to say that places with local transmission are generally unsafe for pregnant women (89 percent v. 77 percent of those who thought travel warnings had not been issued). They are also more likely to say that such places are generally unsafe for them, personally (47 percent v. 32 percent). Furthermore, women are more likely than men to say that places with local transmission are generally unsafe for pregnant women (81 percent v. 74 percent) and to say they are generally unsafe for themselves, personally (43 percent v. 35 percent).

Most See Congressional Funding to Deal with the Virus as an Important Priority

Despite President Obama’s February request for almost $1.9 billion to deal with the Zika virus outbreak,3  U.S. Congress has not passed any additional funding. Thirty-six percent of the public say that passing new funding to deal with the outbreak in the U.S. should be a top priority, with an additional 40 percent saying it should be an important but not a top priority. Nine percent think passing new funding is not too important, and 5 percent say that new funding should not be passed at all.

Figure 12: Three in Four Say Passing New Funding for the Zika Outbreak in the U.S. Should Be an Important or Top Priority for Congress

There are partisan differences in these findings, with a larger share of Democrats than independents or Republicans saying Congressional funding to deal with the Zika virus outbreak should be a top priority (46 percent v. 34 percent and 27 percent). However, a large majority of all partisans say that new Congressional funding should be at least an important priority of Congress.

Table 2: Majorities of Democrats, Independents, and Republicans Say New Funding to Deal with Zikafrom Congress Should at Least Be an Important Priority
Percent who say new Congressional funding to deal with the Zika virusoutbreak in the U.S. should…TotalDemocratsIndependentsRepublicans
Be a top priority36%46%34%27%
Be an important but not top priority40364146
Be not too important961210
Not be done5258

Electronic Health Records

In 2009, the federal government passed the Health Information Technology for Economic and Clinical Health (HITECH) Act which allocated $27 billion for an incentive program encouraging health care providers to adopt electronic health records systems (EHR).4  In a 2009 poll5  conducted by the Kaiser Family Foundation, NPR, and the Harvard School of Public Health, about half of the public (46 percent) reported that their doctor entered their health information into a computer during a visit. In the most recent survey, eight in ten Americans say their doctor or health care provider enters their health information into a computer during a visit.

Figure 13: More Americans Now Reporting Their Doctor Enters Medical Information Electronically

In addition, half (52 percent) of Americans say it is “very important” for their health care provider to use electronic or computer-based medical records instead of using paper-based records, up from 42 percent in 2009.

Figure 14: Larger Share of Americans Now Say It Is Important for Doctors to Use Electronic Medical Records

When asked about what type of medical information is important to be able to access, the majority of the public say each type of information included in the survey is at least “somewhat” important. Eight in ten (79 percent) say being able to access the results of their lab tests is at least somewhat important. This is followed by about three-fourths who say the same about being able to access their general health history (75 percent), their prescription drug history (74 percent), and the notes written by their doctor of health care provider from their visit (73 percent). A smaller share (63 percent) say accessing information about their mental health or substance abuse treatment is at least somewhat important.

Figure 15: Majority of Americans Say Accessing All Types of Medical Information Is Important

Some Availability But Limited Accessing of EHRs

While the vast majority of Americans say it is important for their health care provider to use electronic medical records and most say that being able to access different types of medical information is important, a large share currently say their medical information is not available online. Across all the different types of health information, about a third say these types of information are not currently available to them online, with a slightly larger share (41 percent) saying the notes written by their doctor or health provider are not available.

Figure 16: Online Availability of Medical Information Is Not Widespread

While 78 percent of Americans report that at least some of their medical information is available online, much smaller shares report accessing this information. Less than half of Americans report having accessed any type of medical information online. When they do access medical information, 29 percent say they have accessed the results of lab tests, such as blood tests, x-rays, and mammograms, 26 percent say they have accessed general health history, 23 percent say they have accessed prescription drug history, and 21 percent say they have accessed notes written by their doctor or health care provider. A much smaller share report accessing information about mental health or substance abuse treatment (9 percent).

Figure 17: Large Shares Report Having Online Medical Information Available, But Few Have Accessed Certain Types
Majority of Americans Have Security or Privacy Concerns Regarding Online Medical Records

About eight in ten (78 percent) Americans have at least some medical records and personal health information available online. Of these, 60 percent (47 percent of total population) say they are either “very” or “somewhat” concerned that an unauthorized person might get access to their confidential records and information. Larger shares of Hispanic individuals (58 percent of total) and Blacks (56 percent of total) report having privacy concerns than Whites (42 percent of total).

Figure 18: About Half of Americans Say They Are Concerned about Privacy of Their Electronic Medical Records

Why Some Americans Still Don’t Access Online Medical Records

One-third of Americans report that they have the ability to access their medical records or personal health information online but have not done so. The main reason given is that they did not have a need to access the information (49 percent), followed by not having access to the internet (15 percent), not knowing how to access the information (13 percent), and being concerned about privacy or security (11 percent).

Figure 19: Half Say They Don’t Need to Access Their Health Information Online

In addition, accessing online medical records or health information is seemingly dependent on education level and income, but noticeably, not on age. Almost half of individuals who have not accessed their own medical records have a high school diploma or less (49 percent) or earn less than $40,00 a year (47 percent).

Table 3: Demographics of Those Who Have and Have Not Accessed Their Own Medical Records or Personal Health Information Online
Have AccessedHave Not AccessedTotal
Education
       High school or less31%49%40%
       Some college303130
       College+392029
Income
       <$40K344740
       $40K to less than $90K293130
       >$90K261220
Age
       18-29192120
       30-49353032
       50-64292829
       65+172019

Kaiser Health Policy News Index: August 2016

The August Kaiser Health Tracking Poll finds that the majority of Americans (71 percent) are following stories about conflicts involving ISIS and other Islamic militant groups as well as both Donald Trump’s presidential campaign (68 percent) and Hillary Clinton’s presidential campaign (67 percent). Other stories that capture the attention of Americans this month include the severe flooding in Louisiana (65 percent) and the Zika virus outbreak (60 percent). About half of Americans say they have been following stories about the 2016 Summer Olympics, which took place in Brazil from August 5th to 21st. While a majority of the public say they follow news about the Zika virus outbreak, fewer Americans report following three additional health policy stories: the ongoing heroin and prescription painkiller addiction epidemic in the U.S. (43 percent), reports about rising ACA health insurance premiums (39 percent), and news of health insurance companies leaving ACA marketplaces (36 percent).

Figure 20: Kaiser Health Policy News Index: August 2016

Methodology

This Kaiser Health Tracking Poll was designed and analyzed by public opinion researchers at the Kaiser Family Foundation (KFF). The survey was conducted August 18-24, 2016, among a nationally representative random digit dial telephone sample of 1,211 adults ages 18 and older, living in the United States, including Alaska and Hawaii (note: persons without a telephone could not be included in the random selection process). Computer-assisted telephone interviews conducted by landline (423) and cell phone (788, including 473 who had no landline telephone) were carried out in English and Spanish by Princeton Data Source under the direction of Princeton Survey Research Associates International (PSRAI). Both the random digit dial landline and cell phone samples were provided by Survey Sampling International, LLC. For the landline sample, respondents were selected by asking for the youngest adult male or female currently at home based on a random rotation. If no one of that gender was available, interviewers asked to speak with the youngest adult of the opposite gender. For the cell phone sample, interviews were conducted with the adult who answered the phone. KFF paid for all costs associated with the survey.

The combined landline and cell phone sample was weighted to balance the sample demographics to match estimates for the national population using data from the Census Bureau’s 2014 American Community Survey (ACS) on sex, age, education, race, Hispanic origin, and region along with data from the 2010 Census on population density. The sample was also weighted to match current patterns of telephone use using data from the July-December 2015 National Health Interview Survey. The weight takes into account the fact that respondents with both a landline and cell phone have a higher probability of selection in the combined sample and also adjusts for the household size for the landline sample. All statistical tests of significance account for the effect of weighting.

The margin of sampling error including the design effect for the full sample is plus or minus 3 percentage points. Numbers of respondents and margins of sampling error for key subgroups are shown in the table below. For results based on other subgroups, the margin of sampling error may be higher. Sample sizes and margins of sampling error for other subgroups are available by request. Note that sampling error is only one of many potential sources of error in this or any other public opinion poll. Kaiser Family Foundation public opinion and survey research is a charter member of the Transparency Initiative of the American Association for Public Opinion Research.

GroupN (unweighted)M.O.S.E.
Total1211±3 percentage points
Registered Voters
   Total RV1020±4 percentage points
   Democratic RV340±6 percentage points
   Republican RV256±7 percentage points
   Independent RV340±6 percentage points
Party Identification
   Democrats381±6 percentage points
   Republicans286±7 percentage points
   Independents404±6 percentage points
Gender
   Men630±5 percentage points
   Women581±5 percentage points
Zika Travel Warnings
   Aware of domestic travel warnings related to Zika742±4 percentage points
   Say there aren’t domestic travel warnings related to Zika308±6 percentage points
News Release

Campaign 2016: Voters Give Clinton Wide Edge Over Trump on Trust to Handle Health Care Issues; ACA Ranks Lower Among Health Issues Voters Want Discussed

Zika Outbreak: Half of Public Would Be Uncomfortable Visiting Affected Parts of Florida; Large Majority Says New Zika Funding Is a Top or Important Priority for Congress

Published: Sep 1, 2016

Electronic Medical Records: Eight in 10 Americans Say It Is Important for Providers to Computerize Records, But Half Worry About Unauthorized Access to Online Information

With the 2016 elections just 10 weeks away, voters give Democratic presidential nominee Hillary Clinton a substantial advantage over Republican nominee Donald Trump on a wide array of health care issues, the latest Kaiser Health Tracking Poll finds.

Two thirds of voters (66%), including large shares of Democrats, Republicans, and independents, identify access and affordability of health care and the future of Medicare, an issue not being widely discussed on the campaign trail, as top priorities for the presidential candidates to talk about during the campaign. Smaller majorities of voters say the same about Medicaid’s future (54%), prescription drug costs (53%), and the future of the 2010 health care law (52%).

Chart_1_-_Poll_Alert.png

On each of those issues and several other health policy issues, more voters say they trust Clinton to do a better job than say they trust Trump, the poll finds.  For example, Clinton leads Trump on Medicare’s future (53% compared to 38%), access and affordability to health care (52% to 39%), Medicaid’s future (54% to 37%), prescription drug costs (51% to 39%), and the Zika virus outbreak (54% to 34%). Among the nine issues asked about, Clinton’s largest lead is 36 percentage points on women’s access to reproductive health care (64% to 28%), while her smallest lead is on the future of the 2010 Affordable Care Act (50% to 41%).

A majority of female voters (71%) say they trust Clinton to do a better job on women’s access to reproductive health services compared to one in five (20%) who say they trust Trump. Voters, age 65 and older, are split between which candidate they trust to do a better job dealing with the future of Medicare with a similar share saying they trust Trump (44%) as saying they trust Clinton (47%).

In spite of Clinton’s edge with voters on these issues, most voters don’t expect much improvement in access to affordable care regardless of who wins the election. A third (33%) of voters say access to affordable care would get better across the country generally if Clinton wins; a similar share (29%) say so if Trump were to win. The poll also shows few voters expect their own ability to access affordable care to improve under either candidate. On each question, more voters say they expect the situation to get worse if Trump were elected than if Clinton were elected.

KFF has been tracking public opinion on the Zika virus outbreak since February 2016, and this month’s survey finds three quarters (76%) of the public are aware that people in the United States have become infected from the bite of mosquitoes locally. A smaller majority (58%) is aware that travel warnings have been issued for areas in the United States affected by the outbreak.

About half of the public (48%) say that they would not be comfortable traveling to places in the United States, like parts of Florida, where people have been infected by mosquitoes. Slightly more say the same about traveling to U.S. territories like Puerto Rico or to places outside the United States where people have become infected (59% and 61%, respectively).

Chart_2_-_Poll_Alert.png

With Congress set to return from its August recess after Labor Day, the poll finds a third (36%) of the public views passing new funding to combat Zika as a top priority for Congress.  An additional 40 percent say it is an important, but not top, priority. Democrats are more likely than Republicans or independents to view Zika as a top Congressional priority, though large majorities within each group consider it at least an important priority.

The survey also probes the public’s experience and views with electronic medical records. Today, 80 percent of the public says their doctor or other healthcare provider usually enters their health information into a computer while they are present – up sharply since 2009, when an earlier KFF poll found 46 percent said this usually happened. Half (52%) now say it is “very important” for their providers to use electronic medical records, up from 42 percent in 2009.

About eight in ten (78%) Americans say they have at least some medical records and personal health information available online. Of these, 60 percent (47% of total population) say they are either “very” or “somewhat” concerned that an unauthorized person might get access to their confidential records and information.

Other poll findings include:

  • Americans’ opinion of the health care law remains split with 40 percent saying they have a favorable view and 42 percent saying they have an unfavorable view.
  • When asked about the news media’s coverage of the health reform law, four in ten say that the coverage is mostly balanced while 27 percent say it is biased in favor of the law and 21 percent say it is biased against the law. About half (47 percent) of Republicans say the news media coverage of the health reform law is biased in favor of the law while half of Democrats and 43 percent of independents say the news coverage is mostly balanced.

Designed and analyzed by public opinion researchers at the Kaiser Family Foundation, the poll was conducted from August 18-24 among a nationally representative random digit dial telephone sample of 1,211 adults. Interviews were conducted in English and Spanish by landline (423) and cell phone (788). The margin of sampling error is plus or minus 3 percentage points for the full sample. For results based on subgroups, the margin of sampling error may be higher.

Preliminary Data on Insurer Exits and Entrants in 2017 Affordable Care Act Marketplaces

Authors: Cynthia Cox and Ashley Semanskee
Published: Aug 28, 2016

In October 2016, the Foundation issued a updated version of this analysis with a new county-level interactive map and slideshow

The following charts provide a preliminary picture of the potential effect insurer exits and entrants may have on competition and consumer choice in the Affordable Care Act (ACA) marketplaces. This analysis was done at the request of the Wall Street Journal. Our earlier analysis found that UnitedHealth’s absence from these markets would leave many parts of the country with fewer marketplace insurers, and that the number of counties with a single insurer would likely increase substantially if there were no new entrants. Similarly, our July analysis of insurer participation in 17 states with detailed, publicly available premium and participation data found that on average there would be fewer insurers participating in 2017 in these states than there had been in 2016 or 2015.

Since the time of our earlier analyses, more details have emerged on the degree to which some insurance companies, most recently Aetna and Oscar, are planning to scale back or withdrawing their participation on the marketplaces. Meanwhile other insurers, including Cigna, have noted their intent to enter into new markets or expand their offerings in their 2017 rate filings to state regulators.

Despite these new details, much is still unknown and the majority of states’ 2017 filings are either redacted or unavailable publicly. Because only premium changes, and not new entrant premiums, are posted on Healthcare.gov’s rate review site, it is also likely that more is known at this time of market exits than is known of entrants. Complete information on insurer participation and premiums across all states does not typically become public until shortly before the beginning of the open enrollment season. It is therefore likely that the complete picture of how entrants and exits are shaping these markets in 2017 will not come into focus for two more months.

Given these limitations, it is too soon to say with certainty how many marketplace insurers enrollees will have available to them when they go to shop for coverage in November. In this analysis, we start with insurers’ participation in 2016 and make adjustments for reported entrants, exits, scale-backs, and expansions. More information on our methods and limitations can be found below. We intend to update this analysis when more complete data are available.

Figure 1: Distribution of Exchange Enrollment by Number of Insurers in 2016 and Potential Distribution in 2017

We find that most marketplace enrollees will likely continue to have a choice of three or more plans in 2017, based on what is currently known of marketplace insurer participation and changes next year. However, assuming county-level enrollment holds steady from 2016 to 2017, a smaller share of enrollees will likely have a choice of three or more insurers in 2017 than in previous years. We estimate that 62% of enrollees in 2017 will have a choice of three or more insurers, compared to 85% of enrollees in 2016.

We estimate that 2.3 million marketplace enrollees, or 19% of all enrollees, could have a choice of a single insurer in 2017, which is an increase of 2 million people compared to 2016. Going into marketplace open enrollment in 2016, about 303,000 enrollees (2%) had a single insurer option.

Similarly, we estimate that the number of counties with a single marketplace insurer is likely to increase, from 225 (7% of counties) in 2016 to 974 (31% of counties) in 2017. Approximately 6 in 10 counties could have 2 or fewer marketplace insurers in 2017. The bulk of the increase in single-insurer counties is a result of the UnitedHealth exit, as the company was often the second insurer in rural areas.

Figure 2: Number of Insurers Available to Exchange Enrollees in 2016 and Estimated Number of Insurers in 2017

In 2016, counties with a single marketplace insurer are concentrated in a handful of states, particularly rural ones: Wyoming (where 100% of counties have one insurer), West Virginia (82%), Utah (69%), South Carolina (63%), and Nevada (59%).

Given what is known at this time of entrants and exits, four additional states are likely to have a single marketplace insurer in all counties: Alabama, Alaska, Oklahoma, and South Carolina, for a total of five states (including Wyoming, which already had one insurer in the state). Other states with significantly more single-insurer counties in 2017 will likely include Arizona (87% of counties in 2017, compared to none in 2016), Mississippi (80% vs. 0%), Missouri (85% vs. 2%), Florida (73% vs. 0%), North Carolina (90% vs. 23%), and Tennessee (60% vs. 0%). With the exception of Alaska, the states left with the most limited exchange participation as a result of 2017 market exits are likely to be in the south.

One county, Pinal County in Arizona, could be at risk of having no insurer options on the marketplace, given what is currently known of exits in the state. However, this could change as another plan that offers elsewhere in the state could expand its service area. In the figures cited in the paragraph above, Pinal County is grouped with single-insurer counties in Arizona.

Figure 3: Distribution of Enrollment and Counties by Number of Exchange Insurers in 2016 and Potential Distribution in 2017

Rural areas have historically had lower insurer participation, so even one exit can have a significant effect on consumer choice. About 629,000 marketplace enrollees who live in primarily rural counties will likely have a single insurer in 2017, representing 41% of all marketplace enrollees living in mostly rural counties (up from 7% in 2016). Marketplace enrollees living in some urban areas will also have less choice as a result of the exits.  As many as 1.7 million enrollees who live in primarily urban counties could have a single marketplace insurer in 2017, representing 15% of all enrollees living in mostly urban counties (up from 2% in 2016).

About 7.9 million enrollees are likely to have three or more choices of marketplace insures in 2017, based on information currently available on entrants and exits. Of these enrollees with at least three choices, the vast majority (7.4 million) live in counties that are primarily urban, while 504,000 live in counties that are primarily rural. Our analysis of information currently available finds that about two out of every three enrollees in primarily urban counties (66%) will likely have a choice of at least three marketplace insurers in 2017, while one in three enrollees in primarily rural counties (33%) are likely to have a choice of three or more insurers.

The map below shows counties where we estimate there could be one or two marketplace insurers in 2017, and the 50-state tables show changes in the number of counties with one insurer from 2016 to 2017 in each state.

Table 1: Distribution of Counties by Number of Exchange Insurers in 2016 and Potential Distribution in 2017
State20162017 (Estimated)
No Insurer1 Insurer2 Insurer3+ InsurerNo Insurer1 Insurer2 Insurer3+ Insurer
AL60 (90%)7 (10%)67 (100%)
AK30 (100%)30 (100%)
AZ8 (53%)7 (47%)1 (7%)12 (80%)2 (13%)
AR75 (100%)75 (100%)
CA1 (2%)57 (98%)27 (47%)31 (53%)
CO4 (6%)60 (94%)47 (73%)17 (27%)
CT8 (100%)8 (100%)
DE3 (100%)3 (100%)
DC1 (100%)1 (100%)
FL44 (66%)23 (34%)49 (73%)8 (12%)10 (15%)
GA30 (19%)129 (81%)77 (48%)49 (31%)33 (21%)
HI5 (100%)5 (100%)
ID44 (100%)44 (100%)
IL102 (100%)8 (8%)69 (68%)25 (25%)
IN92 (100%)27 (29%)65 (71%)
IA21 (21%)78 (79%)49 (49%)50 (51%)
KS105 (100%)105 (100%)
KY66 (55%)54 (45%)54 (45%)48 (40%)18 (15%)
LA64 (100%)59 (92%)5 (8%)
ME16 (100%)16 (100%)
MD24 (100%)24 (100%)
MA14 (100%)14 (100%)
MI14 (17%)24 (29%)45 (54%)14 (17%)27 (33%)42 (51%)
MN87 (100%)26 (30%)61 (70%)
MS50 (61%)32 (39%)66 (80%)16 (20%)
MO2 (2%)113 (98%)98 (85%)13 (11%)4 (3%)
MT56 (100%)56 (100%)
NE93 (100%)2 (2%)91 (98%)
NV10 (59%)4 (24%)3 (18%)10 (59%)4 (24%)3 (18%)
NH10 (100%)10 (100%)
NJ21 (100%)21 (100%)
NM33 (100%)33 (100%)
NY3 (5%)59 (95%)3 (5%)59 (95%)
NC23 (23%)38 (38%)39 (39%)90 (90%)10 (10%)
ND4 (8%)49 (92%)4 (8%)49 (92%)
OH88 (100%)5 (6%)83 (94%)
OK77 (100%)77 (100%)
OR36 (100%)36 (100%)
PA67 (100%)5 (7%)34 (51%)28 (42%)
RI5 (100%)5 (100%)
SC29 (63%)15 (33%)2 (4%)46 (100%)
SD66 (100%)66 (100%)
TN57 (60%)38 (40%)57 (60%)24 (25%)14 (15%)
TX58 (23%)110 (43%)86 (34%)88 (35%)129 (51%)37 (15%)
UT20 (69%)3 (10%)6 (21%)20 (69%)2 (7%)7 (24%)
VT14 (100%)14 (100%)
VA37 (28%)97 (72%)29 (22%)38 (28%)67 (50%)
WA6 (15%)33 (85%)5 (13%)11 (28%)23 (59%)
WV45 (82%)10 (18%)45 (82%)10 (18%)
WI3 (4%)7 (10%)62 (86%)4 (6%)13 (18%)55 (76%)
WY23 (100%)23 (100%)
US – 225 (7%) 905 (29%)2,014 (64%) 1 (0%) 974 (31%) 963 (31%) 1,206 (38%)
Source: Kaiser Family Foundation analysis as of August 26, 2016.
Table 2: Distribution of Enrollees by Number of Exchange Insurers in 2016 and Potential Distribution in 2017
State20162017 (Estimated)
No Insurer1 Insurer2 Insurer3+ InsurerNo Insurer1 Insurer2 Insurer3+ Insurer
AL130,000 (67%)65,000 (33%)195,000 (100%)
AK23,000 (100%)23,000 (100%)
AZ31,000 (15%)172,000 (85%)10,000 (5%)36,000 (18%)157,000 (78%)
AR74,000 (100%)74,000 (100%)
CA1,000 (0%)1,575,000 (100%)86,000 (5%)1,489,000 (95%)
CO8,000 (5%)143,000 (95%)30,000 (20%)120,000 (80%)
CT116,000 (100%)116,000 (100%)
DE28,000 (100%)28,000 (100%)
DC23,000 (100%)23,000 (100%)
FL268,000 (15%)1,475,000 (85%)352,000 (20%)258,000 (15%)1,133,000 (65%)
GA20,000 (3%)568,000 (97%)81,000 (14%)83,000 (14%)424,000 (72%)
HI15,000 (100%)15,000 (100%)
ID101,000 (100%)101,000 (100%)
IL388,000 (100%)56,000 (14%)99,000 (26%)233,000 (60%)
IN196,000 (100%)24,000 (12%)172,000 (88%)
IA5,000 (10%)50,000 (90%)17,000 (31%)38,000 (69%)
KS102,000 (100%)102,000 (100%)
KY31,000 (33%)63,000 (67%)26,000 (28%)32,000 (35%)35,000 (38%)
LA214,000 (100%)131,000 (61%)83,000 (39%)
ME84,000 (100%)84,000 (100%)
MD162,000 (100%)162,000 (100%)
MA214,000 (100%)214,000 (100%)
MI13,000 (4%)57,000 (17%)276,000 (80%)13,000 (4%)59,000 (17%)274,000 (79%)
MN84,000 (100%)13,000 (16%)70,000 (84%)
MS47,000 (43%)62,000 (57%)63,000 (58%)46,000 (42%)
MO4,000 (1%)286,000 (99%)101,000 (35%)136,000 (47%)53,000 (18%)
MT58,000 (100%)58,000 (100%)
NE88,000 (100%)1,000 (1%)87,000 (99%)
NV3,000 (3%)6,000 (7%)79,000 (90%)3,000 (3%)6,000 (7%)79,000 (90%)
NH55,000 (100%)55,000 (100%)
NJ289,000 (100%)289,000 (100%)
NM55,000 (100%)55,000 (100%)
NY2,000 (1%)269,000 (99%)2,000 (1%)269,000 (99%)
NC50,000 (8%)155,000 (25%)409,000 (67%)490,000 (80%)123,000 (20%)
ND1,000 (3%)21,000 (97%)1,000 (3%)21,000 (97%)
OH244,000 (100%)3,000 (1%)241,000 (99%)
OK145,000 (100%)145,000 (100%)
OR147,000 (100%)147,000 (100%)
PA439,000 (100%)173,000 (39%)143,000 (33%)124,000 (28%)
RI35,000 (100%)35,000 (100%)
SC91,000 (39%)116,000 (50%)25,000 (11%)232,000 (100%)
SD26,000 (100%)26,000 (100%)
TN79,000 (29%)190,000 (71%)79,000 (29%)69,000 (26%)121,000 (45%)
TX55,000 (4%)123,000 (9%)1,128,000 (86%)162,000 (12%)383,000 (29%)761,000 (58%)
UT34,000 (19%)6,000 (3%)136,000 (77%)34,000 (19%)3,000 (2%)139,000 (79%)
VT29,000 (100%)29,000 (100%)
VA73,000 (17%)349,000 (83%)21,000 (5%)91,000 (22%)309,000 (73%)
WA7,000 (3%)194,000 (97%)7,000 (3%)22,000 (11%)172,000 (86%)
WV26,000 (70%)11,000 (30%)26,000 (70%)11,000 (30%)
WI7,000 (3%)7,000 (3%)225,000 (94%)8,000 (3%)12,000 (5%)219,000 (92%)
WY24,000 (100%)24,000 (100%)
US – 303,000 (2%) 1,578,000 (12%)10,801,000 (85%) 10,000 (0%) 2,349,000 (19%) 2,417,000 (19%) 7,906,000 (62%)
Source: Kaiser Family Foundation analysis as of August 26, 2016.

Methods and Limitations

As complete insurer participation data are not yet available for the 2017 marketplaces, we began our analysis with data on participation in 2016. We gathered these data from healthcare.gov for states with a federally run, partnership, and facilitated marketplaces. For states that run their own exchanges, we compiled 2016 insurer participation data by reviewing rate filings to state regulators and reports released by some states. We then verified county-level data in these states by searching state plan shopping tools. We grouped insurers by parent company or group affiliation, which we obtained from HHS Medical Loss Ratio public use files and supplemented with additional research. We then analyzed, at the county level, how many parent companies participate in these Marketplaces.

Using this data on 2016 insurer participation, we made adjustments based on information we could find on 2017 entrants, exits, scale-backs, and expansions. In total, we made over 600 changes at both the state and county levels. We took two different approaches, depending on the amount of information that is available in a given state:

  1. In the 17 states included in our 2017 premium and participation analysis published in July, 2016 we are able to account for changes in participation, including new entrants and service area expansions based on rate filings to state regulators. For example, in California, the start-up insurer Oscar had already participated in 2016 and is planning to expand to other parts of the state in 2017, according to a report by the exchange. In the 17 states in our premium analysis where detailed information is available, we also compared insurer participation in 2016 and 2017 to account for any scale-backs. For example, we found that Sentara (Optima) is scaling back its participation in many Virginia counties, while remaining in some counties. We then supplemented rate filing data with media reports when necessary. For example, Aetna had submitted filings to enter into the Indiana exchange, but reportedly no longer intends to expand into new states, so we do not include the company as a new entrant.
  2. In other states not included in our July analysis, we also account for new entrants, scale-backs, and expansions where we could find this information through news coverage and press releases, and attempted to verify these reports against redacted rate filings available on Healthcare.gov. For all reported new entrants in our analysis, we attempt to verify the counties and/or regions they would service rather than assuming state-wide entry. For example, a press release indicates that Medica is entering the entire state of Kansas, while Wellcare is entering 47 counties in Iowa. In cases where a new entrant is reported to offer in a specific metro area, but where counties are not specified and no detailed filing is available, for example in the case of Cigna reportedly entering into Raleigh, NC and other cities, we treat the company as if it is entering the rating area that includes the major city.We also attempt to account for reported scale-backs, or insurers continuing to offer in states but with a more limited service area, when information is available. In these states where detailed filings are not publicly available, we rely on what is known of insurers’ current participation and what has been reported of their future participation. For example, in Georgia, UnitedHealth Group will no longer offer plans under its subsidiary United Healthcare but reportedly will continue to offer through another subsidiary, Harken Health. Therefore, we treat UnitedHealth Group as exiting all counties in Georgia with the exception of those counties where Harken Health branded plans are currently offered.

To the extent possible, we have attempted to account for any reported entrant, exit, scale-back, or expansion in our analysis, but are limited in our ability to do so because the market is undergoing changes, data are limited, and we may not be aware of all developments even if they have been reported. The information we gathered for this analysis is still preliminary and will continue to evolve over the coming months as more information becomes public. We intend to update this analysis when more complete data are available for 2017 exchange insurer participation.Enrollment numbers in this analysis are based on 2016 exchange signups as of the end of open enrollment (February 2016). In states using Healthcare.gov, county level enrollment is made available by The U.S. Department of Health and Human Services. In states that run their own exchanges, county-level enrollment is estimated by distributing total state enrollment by county population using data from the Missouri Census Data Center. All estimates relating to 2017 enrollment assume that enrollment at the county level holds steady from 2016 to 2017, but total enrollment will likely change as will the distribution of enrollment across counties. The percent of county population residing in rural areas was obtained from the Missouri Census Data Center. Counties where more than 50% of the population lives in rural areas are considered primarily rural and other counties are considered primarily urban.

A Final Look: California’s Previously Uninsured after the ACA’s Third Open Enrollment Period

Authors: Ashley Kirzinger, Bianca DiJulio, Elise Sugarman, Bryan Wu, and Mollyann Brodie
Published: Aug 18, 2016

Executive Summary

The Kaiser Family Foundation California Longitudinal Panel Survey is a series of surveys that, over time, tracked the experiences and views of a representative, randomly selected sample of Californians who were uninsured prior to the major coverage expansions under the Affordable Care Act (ACA). The initial baseline survey was conducted with a representative sample of 2,001 nonelderly uninsured Californian adults in summer 2013, prior to the ACA’s initial open enrollment period.

After each enrollment period concluded, a survey was conducted of the same group of previously uninsured Californians who participated in the baseline (a longitudinal panel survey). The fourth and final survey in the series, and the focus of this report, followed up with them after the third open enrollment period in spring 2016 to find out whether more have gained coverage, lost coverage, or remained uninsured, what barriers to coverage remain, how those who now have insurance view their coverage, and to assess the impacts that gaining health insurance may have had on financial security and access to care. The surveys were designed and analyzed by researchers at KFF and the fieldwork costs associated with the spring 2014, spring 2015, and spring 2016 surveys were paid for by The California Endowment.

This longitudinal panel study allows us to follow a large group of randomly selected uninsured Californians and assess how their insurance status changed over time to learn more about why those changes did or did not occur, and what gaining health insurance means for their daily lives without having to rely on respondents’ ability to report and recall details from months or years ago. By tracking a scientifically representative panel, we can quantify how widespread or limited certain problems or changes that may have been reported anecdotally actually were. Statistically representative narratives and stories from individuals’ actual experiences can then be drawn from the sample to illuminate more accurately how the uninsured fare as the law is implemented in California.

Key Findings

Coverage Among Key Groups

After three rounds of open enrollment under the Affordable Care Act, 72 percent of Californians who were uninsured prior to the first open enrollment period now report that they have health insurance (including 78 percent of all eligible individuals). This is similar to the share who reported having insurance last year, after the second open enrollment period (68 percent). The largest share of California’s previously uninsured, one-third, say they have coverage through the state’s Medicaid program, Medi-Cal, while 21 percent say they have insurance through an employer, about one in ten (11 percent) say they have a plan through Covered California — the state’s health insurance marketplace where people can shop for and compare health insurance plans and access federal subsidies for coverage — and another 8 percent say they have non-group coverage or insurance through some other source.

By tracking the insurance status of these individuals over a period of four years, it is clear that the majority of individuals who get health insurance coverage keep some form of coverage. Sixty-three percent of habitual survey respondents report having had health insurance for a period of at least one year, including 48 percent who have had coverage for at least two years. In fact, 14 percent of the habitual respondents have unstable health insurance status, meaning that they have gained health insurance in the past two years and have subsequently lost their coverage. Of the individuals with unstable health insurance status, 5 percent gained coverage again but 9 percent remain without health insurance coverage.

Gains In Financial Security and Health Needs Being Met For Recently Insured

Overall, Californians who recently obtained health insurance are more likely to report that their health needs are being met today than they were in 2013. About three-fourths (77 percent) of those who report now having coverage after the third open enrollment period say their health needs are being met either “very” or “somewhat” well today, while half of them (49 percent) said the same thing when they were uninsured in summer 2013, prior to the first open enrollment period. This is compared to the remaining uninsured, among whom a similar share say their health needs are being met well today as did in 2013 (62 percent compared to 59 percent). In addition, 60 percent of insured Californians currently say it is difficult for them to afford health care. While this is still more than half, it is considerably smaller than the 85 percent of these individuals who reported the same in 2013. And while half (53 percent) of California’s recently insured are still “very worried” that they would not be able to pay medical bills in the event of a serious illness or accident, this is a smaller share than the percent of these who reported being “very worried” in 2013 (80 percent) and smaller than the share of the remaining uninsured who now report being “very worried” (72 percent).

Most Rate Plan Favorably, But Some Report Access Challenges

The majority of the recently insured say their experiences with their current health insurance plan have been positive. About one-third (31 percent) say their experiences have been very positive with an additional 48 percent saying their experiences have been somewhat positive. Only 15 percent say their experiences have been negative. Despite this, one-fifth of the recently insured report forgoing needed medical care in the past year due to cost. But this share is smaller than the share of those remaining without insurance (32 percent) who report not getting medical care due to costs. The share of those with insurance who have foregone medical care due to costs is similar across insurance type, with about one in five of those with Medi-Cal, Covered California, and employer-sponsored insurance saying they have not gotten care due to costs. In addition, some of the recently insured report problems accessing medical care. One-fourth of the recently insured say they have had to wait longer than a reasonable time to get an appointment for medical care and about one in ten (12 percent) say they have been told by a doctor’s office or clinic in the past 12 months that they would not be accepted as a new patient.

Remaining Uninsured Are Largely Long-Term Uninsured, Cite Costs As Reason For Not Getting Insurance

Although many previously uninsured Californians gained coverage since the health care law went into effect, 27 percent report that they do not currently have health insurance. Many of these remaining uninsured had little interaction with the health insurance system in the years prior to the ACA implementation. Nearly four in ten of the remaining uninsured reported in the baseline survey that they had been without health insurance for two or more years. When asked to say in their own words the main reason why they do not currently have health insurance, 47 percent of California’s remaining uninsured say it is because health insurance is too expensive and they can’t afford it. This is in spite of the fact that many of the remaining uninsured report a family income that makes them likely eligible for Medi-Cal (27 percent) or for financial assistance through Covered California (30 percent).

Hispanics Lag in Coverage

One-third of the Hispanic individuals included in the panel still do not have insurance. A significant portion of these uninsured Hispanics may not have insurance due to the fact that they are not eligible for coverage because of their immigration status. Of all eligible Hispanics in this survey, three-fourths (76 percent) report having health insurance, which is similar to the share of non-Hispanic whites who report having health insurance (80 percent).

Most Know About Health Care Law Fines, Fewer Know About Provisions

A large share (83 percent) of the remaining uninsured in California are aware of the health care law’s requirement that most Americans have health insurance or pay a fine, and most (54 percent) think that the requirement applies to them. Smaller shares of the remaining uninsured are aware of provisions of the health care law, beyond the requirement to have coverage, intended to expand coverage to the uninsured and those with lower-incomes. Just over half know that the law allowed for the expansion of the Medi-Cal program to cover more low-income Californians (54 percent), and half (49 percent) know that the law provides financial help to low- and moderate-income people to help them purchase health insurance coverage.

Introduction

This report is the fourth, and final, in the California Longitudinal Panel Survey series examining how previously uninsured Californians navigate the health care system as the Affordable Care Act (ACA) goes into effect. Prior to the enactment of the health care law, California had the largest nonelderly uninsured adult population in the nation, at nearly 6 million.1  The state eagerly adopted options under the ACA to expand coverage to more low- and moderate-income people, primarily through the development of Covered California, the state’s marketplace where people can shop for and compare health plans and access financial help to purchase insurance, and by expanding eligibility for Medi-Cal, the state’s Medicaid program, to include parents and adults without dependent children earning 138% of the federal poverty level (FPL) or less (about $33,534 annually for a family of 4 in 2016). As an early adopter with large numbers of uninsured, California is a particularly valuable place to track how the rollout of the health care law has impacted the state’s uninsured, and its progress and challenges can help inform future enrollment efforts state-wide and nationally.

To track the experiences and perceptions of California’s uninsured as the ACA is implemented, the Kaiser Family Foundation conducted the California Longitudinal Panel Survey series, following the same group of randomly selected Californians over time who were uninsured prior to the major coverage expansions under the ACA. The initial baseline survey was conducted with a representative sample of 2,001 nonelderly uninsured Californian adults in summer 2013, prior to the ACA’s initial open enrollment period.2  It found most of the state’s uninsured said they wanted insurance but that most didn’t think they could afford it, as the vast majority reported family incomes under 400% FPL (about $94,000 a year for a family of 4 in 2013). At that time, the first open enrollment period under the ACA was just a couple months away, and many of California’s uninsured were unaware of the upcoming coverage expansion opportunities and were unsure of how the law would impact them.

After the first open enrollment concluded in spring 2014, the second survey in the series followed up with the same group of previously uninsured Californians to find out whether they gained coverage or remained uninsured, how they felt about and interacted with the new coverage options, and what barriers to getting insurance remained.3  Many (58 percent) of California’s previously uninsured reported having health insurance at the close of the first open enrollment period. Most reported that shopping for coverage went smoothly; however, some expressed difficulty affording the cost of coverage. Still, about four in ten remained uninsured, despite the fact that many reported incomes that put them in the group likely eligible for Medi-Cal or for financial assistance through Covered California. The third survey in the series found recently insured residents reported very different experiences than they did in 2013 when they were uninsured, but many still reported problems paying for and accessing care.4 

While the surveys are generally timed around the ACA’s open enrollment periods, it is important to note that eligible individuals are able to enroll in Medi-Cal year round. California has made considerable strides in enrolling eligible low- and moderate-income people in new coverage options under the ACA. By following a representative group of Californians who were uninsured prior to the ACA’s coverage expansions, a key target of the ACA, we can better understand how these new coverage opportunities have impacted this group’s ability to access coverage and gain insight into their interactions with these new pathways to coverage.

While the ACA makes it easier for some people to get and keep coverage, other people will move in and out of coverage due to job status changes, shifts in income that change their eligibility for public subsidies or coverage, or missed deadlines for enrollment. While many previously uninsured Californians now have insurance, other Californians who had insurance prior to the ACA’s coverage expansions may now be uninsured, a group whose experiences and movements within the health care system are not captured in this series of surveys. As a result, this survey does not estimate the overall change in the number of uninsured Californians since the start of open enrollment but instead estimates the share of previously uninsured who gained coverage.

Figure 1: Kaiser Family Foundation California Longitudinal Panel Survey


Section 1: Coverage Among The Previously Uninsured

Enrolling in Health Care Coverage

After three rounds of open enrollment under the Affordable Care Act, 72 percent of Californians who were uninsured prior to the first open enrollment period now report that they have health insurance. This is similar to the share who were insured after the second open enrollment period (68 percent), which may indicate a stabilizing of health insurance coverage. About one-fourth (27 percent) report being currently uninsured, a group referred to throughout this report as the “remaining uninsured.” Excluding those who are likely ineligible for coverage under the ACA due to their immigration status,5  78 percent of California’s eligible uninsured now report having coverage.

For the purposes of this report, the “eligible uninsured’” are California residents who said they had been uninsured for at least two months in the baseline survey and would be eligible for participation in the ACA coverage expansion based on their self-reported status as a citizen, permanent resident, or lawfully present immigrant.6 

Figure 2: Coverage Among California’s Previously Uninsured

Those previously uninsured Californians who report after the third open enrollment period that they have health insurance (72 percent), referred to throughout this report as “California’s recently insured,” say they gained coverage from several different sources. The largest share of California’s previously uninsured (33 percent) say they have coverage through the state’s Medicaid program, Medi-Cal, which is similar to the share reported in 2015 (34 percent). One in five say they have insurance through an employer, up from 14 percent in 2015. About one in ten (11 percent) say they have a plan through Covered California, the state’s health insurance marketplace where people can shop for and compare health insurance plans and access federal subsidies for coverage, and another 8 percent say they have non-group coverage or insurance through some other source.7 

Figure 3: Medi-Cal Is Source of Coverage For Many Previously Uninsured Californians

Who Now Has Coverage?

Similar shares of many demographic groups now report having coverage, such as men and women, people of different ages, and people of different employment status, with one notable exception: Hispanic individuals. One-third of previously uninsured Hispanic individuals still do not have insurance, with individuals who may not be eligible for insurance comprising nearly half of this group. This subgroup is examined in more depth in Section 3.

There are some factors that contribute to now being insured. Over half (62 percent) of those who said in 2013 that they had spent their lifetime without insurance now report having coverage while nearly eight in ten of the individuals who reported in 2013 that they had health insurance less than a year earlier report now being insured. Previously uninsured people who report being in good health are slightly less likely to say they have coverage than those who report being in fair or poor health (69 percent v. 78 percent). In addition, those who report having a debilitating chronic disease that keeps them from fully participating in work or other activities are more likely to say they have coverage now than those without significant chronic disease (85 percent vs. 70 percent).

Table 1: Percentage Of Each Group Of Previously Uninsured Reporting That They Are Recently Insured Or Remain Uninsured
TOTAL RECENTLY INSUREDIN 2016COVERAGE TYPE IN 2016TOTALREMAININGUNINSUREDIN 2016
Medi-CalCovered CaliforniaOther Non-GroupEmployer-Sponsored Insurance
TOTAL72%33%11%3%21%27%
AGE19-3470%30%8%1%28%29%
35-4965%28%8%6%20%35%
50-6481%42%18%3%14%19%
RACEWhite non-Hispanic80%33%15%6%21%18%
Hispanic (NET)67%32%8%2%21%33%
Hispanic, Eligible76%37%11%3%22%24%
GENDERMale72%30%10%2%24%27%
Female73%38%11%5%17%27%
LENGTH OF TIME UNINSURED PRIOR TO ACA2mo – <1 year81%32%10%5%32%19%
1 year to <2 years75%33%7%3%26%25%
2 or more years77%35%14%3%19%23%
Never had insurance62%32%7%3%16%37%
EMPLOYMENTEmployed75%27%13%2%31%25%
Unemployed60%44%8%3%4%38%
A student, retired, on disability, or stay at home parent72%44%7%6%4%28%
EDUCATIONHigh school or less65%35%6%3%18%34%
Some college79%35%15%4%21%21%
College or more88%22%21%3%36%12%
HEALTH STATUSExcellent/ Very good/ Good69%30%12%4%20%30%
Fair/ Poor78%39%8%2%22%22%
MARITAL STATUSMarried71%27%12%4%23%29%
Not married73%37%10%3%20%26%
FAMILY INCOMELess than 138% FPL71%49%4%4%11%29%
Between 138% – 400% FPL73%18%17%2%30%27%
DEBILITATING CHRONIC CONDITIONYes85%44%15%3%12%15%
No70%31%10%4%22%30%

The Enrollment/Renewal Process

Being contacted by phone, email or a door-to-door visit about signing up for health insurance appears to have played a role in some of California’s previously uninsured gaining or keeping coverage. A large majority (85 percent) of those who say they were personally contacted since November 1st say they now have coverage, compared to 68 percent of those who report that they were not contacted.

Figure 4: Over Eight In Ten Outreach Recipients In California Are Currently Insured

In addition, of the recently insured individuals whose main source of health insurance is not an employer-sponsored plan, 43 percent say that someone either helped them complete the enrollment/renewal process or someone else did the entire thing. This share includes 14 percent who report that a Covered California representative helped them enroll or renew, which is slightly higher than the share (8 percent) who say a community or county health worker helped them or who say a health plan representative helped them. Five percent of recently insured individuals without employer-sponsored coverage say a family member or friend helped them enroll or renew.

Figure 5: Large Share of Recently Insured Without Employer Sponsored Coverage had Help With Enrollment Process

The majority of California’s recently insured (70 percent) have the same plan in 2016 that they did in 2015 while one-fourth say they changed to a different plan and 5 percent were uninsured last year. This is also true of only those who got health insurance through Covered California. Of individuals who currently have health insurance coverage through Covered California, 68 percent say they have the same health insurance plan as they had last year in 2015, one-fourth say they changed to a different plan, and 7 percent were uninsured in 2015.

Figure 6: Most Recently Insured Keep Same Health Insurance Plan

For most recently insured, re-enrolling was automatic, with two-thirds saying they were re-enrolled in the same health plan without having to take any action while one-third say they took action to re-enroll in their same health plan. Only 15 percent of those who kept the same plan as they had last year shopped around for another health plan (9 percent of total insured).

Changing Health Insurance Plans

Of the one-fourth of California’s recently insured who did change health insurance plans, about three-fourths (77 percent) found the process either “very easy” or “somewhat easy” while 22 percent say the process was either “somewhat” or “very” difficult.

Figure 7: Of Those Who Changed Plans, Most Found Process To Be Easy

When those who had changed plans in the past year were asked their reasoning for switching to a different health plan, more than half (56 percent) say it was because their income changed. This was followed by half (49 percent) who say it was because they were able to enroll in an employer-sponsored plan, 31 percent who found a plan with a lower monthly premium, 28 percent who wanted a plan with more choice in providers, 27 percent who wanted a plan with a lower annual deductible, and 22 percent who said their or their family’s health needs changed. Only 5 percent say they changed health plans because they wanted to be eligible for government financial help.8 

Dynamics In Enrollment And Coverage

People tend to move in and out of coverage as their income, employment status and other life factors change, particularly those with lower incomes or recent experience being uninsured. Many (57 percent) Californians who reported being uninsured in 2013, prior to the ACA’s first open enrollment period, reported gaining insurance in the spring 2014 or the second open enrollment period (spring 2015), and now report still having insurance coverage after the third open enrollment period (spring 2016). These individuals are referred to here as those “still insured.”9  While these people may have fluctuated in and out of coverage or changed plans over the course of the past two years, they are not new to health insurance. Another 15 percent of California’s previously uninsured are more likely to be new to their coverage because they reported being uninsured in the survey they most recently completed (whether it was Wave 3 or Wave 2). This group is referred to here as the “newly insured.”10  In addition, 22 percent of people reported being uninsured after three open enrollment periods and another 5 percent said they had coverage in the most recent survey they completed (either Wave 3 or Wave 2) but now say they are without health insurance. These groups combined are referred to here as the “remaining uninsured.” To see a demographic profile of each of these groups, see Appendix A.

Figure 8: Dynamics Of Health Insurance

Getting Health Insurance Coverage and Keeping Coverage

By tracking the insurance status of these individuals over a period of four years, it is clear that the majority of individuals who get health insurance coverage keep some form of coverage. Individuals who completed all four waves of interviews are known as “habitual respondents.” In the first survey, conducted in 2013, 70 percent of the habitual respondents reported not having health insurance for a period of at least 2 years. Now, after collecting the insurance status of these individuals over the past three years, we can report that 63 percent of these individuals have reported having health insurance for at least one year, including 48 percent who have had coverage for at least two years. In addition, 14 percent of the habitual respondents have unstable health insurance status meaning that they have gotten health insurance in the past two years and have subsequently lost their coverage. Of the individuals with unstable health insurance status, 5 percent gained coverage again but 9 percent remain without health insurance coverage.

Figure 9: Majority of Recently Insured Californians Have Stable Coverage

Section 2: Financial Security, Health-related Worries, Accessing Care, And Evaluations Of Insurance Plans

By repeatedly contacting individuals who participated in a baseline survey, one of the strengths of the California Longitudinal Panel Survey is to track the experiences and perceptions of these individuals over time, while comparing their current experiences to previous experiences. One of the ways this is best illustrated is by comparing the change over time between individuals who recently got health insurance and those who remain uninsured.

Overall, Californians who recently got health insurance are more likely to report that their health needs are being met today than in the past. About three-fourths (77 percent) of those who report now having coverage after the third open enrollment period say their health needs are being met either “very” or “somewhat” well today, while only half of them (49 percent) said the same thing when they were uninsured in summer 2013, prior to the first open enrollment period. This is compared to the remaining uninsured, in which a similar share say their health needs are being met well today as did in 2013 (62 percent compared to 59 percent).

Figure 10: Recently Insured Are More Likely To Report Health Needs Met Now Than Before They Had Coverage

Californians who recently got health insurance are also less likely to report having difficulty affording a variety of household expenses, including health care, in 2016 than they did in 2013.

Figure 11: Changes in Financial Concerns for Recently Insured

In 2016, 60 percent of California’s recently insured say it is difficult for them to afford health care. While this is still a majority, it is considerably less than the share of these individuals who reported the same in 2013 (85 percent). In comparison, of the remaining uninsured, the percent who say it is difficult for them to afford health care has remained stable (80 percent in 2016 v. 84 percent in 2013). For those who report having health insurance in spring 2016 after the third open enrollment period, affording health care falls among one of several household expenses people say they have difficulty affording. But, for those who remain uninsured, health care is by far the most frequently cited burdensome household expense, with eight in ten saying it is at least somewhat difficult to afford.

Figure 12: Top Financial Concerns for Recently Insured and Remaining Uninsured

Financial Security

Even with some saying coverage is difficult to afford, overall, about half (46 percent) of previously uninsured Californians who have recently gained coverage say that having health insurance makes them feel more financially secure. About four in ten (41 percent) say it doesn’t make a difference, and a smaller share (11 percent) say it makes them feel less financially secure. In addition, most (58 percent) of those now with insurance say they feel well-protected by their health insurance, but 40 percent say they feel vulnerable to medical bills. The share of the insured who say they feel vulnerable to medical bills has increased slightly since 2015 (33 percent).

Figure 13: Large Shares Say Coverage Makes Them Feel More Financially Secure and They Feel Well-Protected By Plan

Among the recently insured, a larger share (52 percent) of individuals who have Medi-Cal report that getting insured made them feel more financially secure compared to those with Covered California (42 percent) and those with employer-sponsored insurance (40 percent).

Figure 14: California Recently Insured Are Split on Whether They Feel More Financially Secure

Similarly, a larger share of individuals with Medi-Cal feel well protected by their health insurance plan from high medical bills than those with Covered California and those with employer-sponsored insurance (62 percent compared to 50 percent and 53 percent, respectively). This is likely due to lower cost sharing for those with Medi-Cal.

Figure 15: Most Say They Feel Well-Protected From High Medical Bills

While many who have recently gained insurance report feeling more financially secure as a result of their coverage, one-fifth of the recently insured report forgoing needed medical care in the past year due to cost. But this share is smaller than the share of those remaining without insurance (32 percent) who report not getting medical care due to costs. The share of those with insurance who have foregone medical care due to costs is similar across insurance type, with about one in five of those with Medi-Cal (17 percent), and about one in four with those with Covered California (23 percent) and employer-sponsored insurance (24 percent) saying they have not gotten care due to costs.

 Table 2: Likelihood Of Forgoing Medical Care and Worries About Health Costs
REMAINING UNINSUREDRECENTLY INSURED
Total Recently InsuredMedi-CalCovered CaliforniaEmployer-Sponsored Insurance
Was there a time over the past twelve months when you needed medical care, but did not get it because of the cost, or not?
YES32%20%17%23%24%
NO6879827776
Percent who say they are very worried about not being able to do the following:
Pay medical bills for health care services5539472928
Pay medical bills in the event of a serious illness or accident7253614447
Find a doctor or health professional who will treat you4435422330

Having health insurance also leads to lower rates of reporting being worried about a series of health-care related concerns. Forty-four percent of California’s remaining uninsured saying they are “very worried” they will not be able to find a doctor or health professional to treat them, 55 percent are “very worried” they won’t be able to pay medical bills for health care services, and 72 percent are “very worried” they won’t be able to pay medical bills in the event of a serious illness or accident. This is compared to smaller shares of recently insured individuals who report being “very worried” about all of these health-related concerns. In addition, California’s recently insured now report a lower rate of being “very worried” about being able to pay medical bills for routine health care services than they did in 2013 (39 percent in 2016 compared to 52 percent in 2013), while the share of the remaining uninsured who are very worried has not changed and is 55 percent now compared to 57 percent in 2013.

Figure 16: Recently Insured Are Now Less Worried About Health-Related Costs Than Before They Had Coverage

While half (53 percent) of California’s recently insured are still “very worried” that they would not be able to pay medical bills in the event of a serious illness or accident, this is a smaller share than the percent of these people who reported being “very worried” in 2013 (80 percent) and smaller than the share of the remaining uninsured who now report being “very worried” (72 percent). A larger share of individuals with Medi-Cal coverage (61 percent) say they are “very worried” about medical expenses for a serious illness compared to 47 percent of those with employer-sponsored coverage and 44 percent of individuals with Covered California health insurance coverage.

Figure 17: While Cost Concerns About Serious Illness or Injury Remain, They Are Less Of A Concern for Recently Insured

Accessing Health Care

Three-fourths of California’s recently insured have visited a doctor or health clinic in the past 12 months compared to 40 percent of California’s remaining uninsured.

Figure 18: Larger Shares of Recently Insured Have Visited a Doctor or Health Clinic in the Past Year

Among California’s recently insured, 57 percent say they have a usual source of care outside of the hospital emergency room, which is slightly higher than the share of these individuals who reported having a usual source of care outside of the hospital emergency room in 2013 (48 percent).

Figure 19: Recently Insured Are More Likely To Report Usual Source Of Care Now Than Before They Had Coverage

A larger share of California’s recently insured now report there is a place they usually go to, outside of the hospital emergency room, when they are sick or need advice about their health. In 2016, nearly six in ten (57 percent) of the recently insured report a usual source of care outside of the emergency room. In 2013, 48 percent of these individuals reported the same.

Figure 20: More than Half of Recently Insured Have a Usual Source of Care

Problems Accessing Medical Care Among Recently Insured

Yet, for some of the recently insured, some problems accessing medical care remain. One-fourth of the recently insured say they have had to wait longer than a reasonable time to get an appointment for medical care and about one in ten (12 percent) say they have been told by a doctor’s office or clinic in the past 12 months that they would not be accepted as a new patient.

Figure 21: Some Recently Insured Have Problems Accessing Medical Care

Evaluations of Health Insurance

Sixty-five percent of California’s recently insured say health insurance is worth the money that it costs. This is slightly larger than the share in 2013, in which 58 percent of these individuals reported that health insurance is worth the money that it costs. Among the remaining uninsured, 56 percent say health insurance is worth the money it costs.

Figure 22: Two-Thirds of Recently Insured Say Insurance Is Worth the Costs

In addition, 85 percent of California’s recently insured say health insurance is something they need compared to 75 percent of those who remain uninsured. There are differences by gender within insurance status. Of the men who were recently insured, eight in ten say health insurance is something they need compared to 69 percent of men who remain uninsured. More than eight in ten women, regardless of insurance status, say health insurance is something they need.

 Table 3: Gender Differences in Perceptions of Whether Health Insurance is Needed
RECENTLY INSUREDREMAINING UNINSURED
TotalMenWomenTotalMenWomen
Health insurance is something I need85%80%90%75%69%82%
I’m healthy enough that I don’t really need health insurance14208222815

Satisfaction with Current Health Insurance Plan

Of the recently insured, the majority say their experiences with their current health insurance plan have been positive. About one-third (31 percent) say their experiences have been “very positive” with an additional 48 percent saying their experiences have been “somewhat positive.” Only 15 percent say their experiences have been negative: 10 percent say “somewhat negative” and 5 percent “very negative.” When looking at differences among coverage type, slightly larger shares of recently insured individuals with Medi-Cal say their experiences have been either very or somewhat positive (85 percent), compared to about three-fourths of those with employer-sponsored insurance and 70 percent of those with Covered California.

Figure 23: Most California Recently Insured Say Their Experience With Their Current Plan Has Been Positive

In addition, the majority of the recently insured report that they are either “very satisfied’ or “somewhat satisfied” with various aspects of their current plan including their choice of hospital (80 percent), their choice of primary doctors (76 percent), and their choice of specialists (68 percent).

Figure 24: Most California Recently Insured Say They Are Satisfied with Elements of Their Current Plan

Section 3: The Remaining Uninsured

Who are the Remaining Uninsured?

Although many previously uninsured Californians gained coverage since the health care law went into effect, 27 percent report that they do not currently have health insurance. Many of these remaining uninsured had little interaction with the health insurance system in the years prior to the ACA implementation. Nearly four in ten of the remaining uninsured reported in the baseline survey that they had been without health insurance for two or more years (39 percent), and an additional 41 percent said they have never had insurance. Seventeen percent of the remaining uninsured are between the ages of 19 and 26 and therefore may be eligible to be covered through a parent or guardian’s health plan — if their parents have health insurance. However, the largest share are individuals between the ages of 30 and 39 (33 percent), followed by those between the ages of 40 and 49 (22 percent). Hispanics make up two-thirds of the remaining uninsured. Though half of them (33 percent of all remaining uninsured) are likely undocumented immigrants who are not eligible for Medi-Cal or assistance through Covered California. Many report a family income that makes them likely eligible for Medi-Cal (27 percent) or for financial assistance through Covered California (30 percent), while 41 percent are likely undocumented and therefore are ineligible.11 

Figure 25: Demographics Of California’s Remaining Uninsured In 2016

Why Don’t They Have Insurance?

When asked to say in their own words the main reason why they do not currently have health insurance, 47 percent of California’s remaining uninsured say it is because health insurance is too expensive or they can’t afford it. Affordability is by far the most common reason named for lacking health insurance, followed by eligibility reasons (19 percent), such as immigration concerns (10 percent) or the fact that they believe they are ineligible for Medi-Cal or government help (4 percent). One in ten say they haven’t tried to get insurance, they don’t need insurance, or they just haven’t gotten around to it, and about one in ten (9 percent) name application-process-related issues as the main reason. Small shares say other reasons such as unavailability (2 percent) — including that their employer doesn’t offer coverage (1 percent), unemployment (2 percent), and opposition to the health care law (2 percent).

Figure 26: Reasons Why California Uninsured Say They Do Not Currently Have Health Insurance

Did They Try To Get Insurance?

Slightly more than one-third (36 percent) of California’s remaining uninsured say they tried to get health insurance in the past 6 months.  Those who tried but did not gain health insurance point to cost as a main reason they were unsuccessful. About a quarter (27 percent) of California’s remaining uninsured say they tried but didn’t get insurance because it was too expensive, including 19 percent who say they shopped for health insurance and 7 percent who say they didn’t bother shopping because they didn’t think they could afford it. Another 15 percent say they weren’t eligible for coverage, and less than one in ten (7 percent) say they were not able to complete the application process.

Figure 27: Most Remaining Uninsured Who Tried But Did Not Enroll In Health Insurance Say It Was Too Expensive

While a large share of California’s remaining uninsured say they did not get insurance because it was too expensive, there is little consensus on how much they would be willing to pay each month for health insurance or how much they think it will cost for them to buy health insurance. About half of the remaining uninsured say they are willing to pay up to $99. However, only 20 percent say they think it will cost them that much per month. About one-third (35 percent) of the remaining uninsured is unsure how much it would cost them each month to buy health insurance for themselves.

Figure 28: Uncertainty Remains Among the Remaining Uninsured on Cost of Insurance

In addition, getting health insurance for free and buying health insurance for less than they thought are two of the many factors that could influence the remaining uninsured to get coverage. In fact, more than half of the remaining uninsured say they would be likely to get health insurance in the future if they had time to explore their options, they could get health insurance for free, they had more time to understand how to sign up, they could buy health insurance for less than they thought, the fine for not getting health insurance is higher this year, they or their spouse’s employer offered health insurance coverage, or if they had to pay a fine for not having health insurance.

Figure 29: Large Shares of Remaining Uninsured Say Various Factors Will Make Them Likely to Get Coverage

Knowledge About Health Care Law Fines and Provisions

A large share (83 percent) of the remaining uninsured in California are aware of the health care law’s requirement that most Americans have health insurance or pay a fine, and most (54 percent) think that the requirement applies to them but more than one-third (37 percent) say the requirement does not apply to them.

In fact, nearly equal shares of the uninsured think they will have to pay a fine for not having health insurance (45 percent) as think they will not have to pay a fine (40 percent), with the remaining 15 percent unsure of whether or not they will have to pay a fine.  It is important to note that many may in fact be exempt from the requirement due to financial hardship or other exceptions under the law, including exceptions for undocumented immigrants.

Smaller shares of the remaining uninsured are aware of provisions of the health care law, beyond the requirement to have coverage, intended to expand coverage to the uninsured and those with lower incomes. Just over half know that the law allowed for the expansion of the Medi-Cal program to cover more low-income Californians (54 percent), and half (49 percent) know that the law provides financial help to low- and moderate-income people to help them purchase health insurance coverage.

Figure 30: Large Majority Of California Remaining Uninsured Know About Individual Mandate, Fewer Are Aware Of Other Provisions

California’s Remaining Uninsured Immigrants

The Hispanic population is particularly important in California because Latinos make up the largest racial or ethnic group in the state, accounting for 39 percent of the population,12  and about seven in ten of the remaining uninsured are Hispanic (67 percent). Overall, one-third of California’s Hispanics remain uninsured. A significant portion of these uninsured Hispanics may not have insurance due to the fact that they are not eligible for coverage because of their immigration status. Of the total Hispanic population, about one-third (32 percent) are likely not eligible for health insurance coverage. Of all eligible Hispanics in this survey, three-fourths report having health insurance leaving one-fourth (24 percent) eligible for, but without health insurance coverage. This is compared to about one in five of white non-Hispanics who do not have health insurance coverage.

Figure 31: Coverage Among Previously Uninsured Hispanics And Whites After Health Care Law’s 3rd Open Enrollment Period

Half (55 percent) of uninsured Hispanics and two-thirds of uninsured Hispanics who completed the survey in Spanish say they are very or somewhat worried that if they sign up for health insurance, it will draw attention to their immigration status or that of a family member.

Figure 32: Many Remaining Uninsured Hispanics Worry Signing Up For Health Insurance Will Draw Attention To Immigration Status

In fact, concerns about immigration status exist for all California’s remaining uninsured who were born in another country —  both Hispanics and non-Hispanics. One-fourth (27 percent) of California’s remaining uninsured worry that they or a family member could be deported if they sign up for health insurance. In addition, 50 percent of all uninsured who were born in another country worry that signing up for health insurance could hurt their ability to become a U.S. citizen.

Figure 33: Remaining Uninsured Worry About How Signing Up for Health Insurance May Affect Immigration Status

Spanish Language Assistance

Navigating health insurance options and health care jargon can be confusing, and adding language differences to the equation has the potential to be an even bigger barrier to enrollment. However, Californians currently without health insurance who prefer to communicate in Spanish give largely positive feedback when asked how much information is available in Spanish and whether there are people in their community trained to help them sign up for insurance in Spanish. Most (65 percent) remaining uninsured Spanish speakers say that, in their experience, there is at least some information about signing up for insurance available in Spanish – about four in ten (39 percent) say there is a lot of information available and another 26 percent say there is some information available. There is still room for improvement though, as a third of Spanish-speaking remaining uninsured Californians report that there is only a little information available in Spanish (24 percent) or say that there is none available at all (7 percent). Six in ten Spanish-speaking uninsured report there are people in their community trained to help them sign up (compared to 72 percent in 2015), while one-third (35 percent) say that there are not people in their community trained to help and 6 percent say they do not know.

Figure 34: Most Spanish Speakers Say There Is Information Available In Spanish And There Are People In Community Trained To Help

Conclusion: Conclusion

The Kaiser Family Foundation California Longitudinal Panel Survey provides unique insights into the experiences and views of a representative, randomly selected sample of Californians who were uninsured prior to the major coverage expansions under the Affordable Care Act (ACA). The initial baseline survey was conducted with a representative sample of 2,001 nonelderly uninsured Californian adults in summer 2013, prior to the ACA’s initial open enrollment period. Because the same group of previously uninsured people has been followed over time, the survey is able to explore the dynamics of health insurance and track how many people have moved in to or back out of coverage since the baseline survey in 2013.

After three rounds of open enrollment under the Affordable Care Act, nearly three-fourths (72 percent) of Californians who were uninsured prior to the first open enrollment period now report that they have health insurance. This share is similar to the 68 percent who said they were insured after the second open enrollment period in the spring of 2015, and is an increase from 58 percent after the first open enrollment period in the spring of 2014. This indicates that the percent of Californians with health insurance may have reached a relatively steady rate, with less fluctuation in the market as individuals gain and keep coverage.

Most of California’s previously uninsured who reported having coverage after the first open enrollment period continued to report having coverage, but some have since become uninsured, while some others who reported being uninsured after the first open enrollment period or the second enrollment period now report having coverage. These dynamics indicate the potential challenges of getting and keeping coverage for the previously uninsured as well as potential opportunities for new enrollment gains among those who have potentially missed chances to enroll in the past. Future gains in coverage may be moderate, however, with the remaining shares of California’s previously uninsured consisting largely of harder-to-reach groups: those who are undocumented immigrants and therefore ineligible for coverage through the ACA and those who reported as of the baseline survey that they had been without coverage for two or more years or had never had health insurance. There is some lack of knowledge of the assistance that is currently available, which indicates that there is potential for outreach to make a difference.

Among the recently insured, there have been considerable gains in access and affordability compared to what they said in the baseline survey, but concerns about health care costs remain. The final fourth wave of the Kaiser Family Foundation California Longitudinal Panel Survey illustrates that while more individuals are gaining access to health insurance coverage, challenges still exist for both the remaining uninsured and those who now have health insurance coverage.

Conclusion: About The Terms Used In This Report

This report primarily uses the following definitions for key groups examined in the survey:

The overall group of Californians who were uninsured prior to the ACA’s first open enrollment period, most often referred to as “California’s previously uninsured.”

  1. The subgroup of previously uninsured Californians who currently report that they are uninsured, referred to as “California’s remaining uninsured.” This group includes some who reported having coverage in 2014 or 2015, some who reported not having coverage in 2014 or 2015, and some whose 2014 coverage status or 2015 coverage status is unknown because they were unable to be contacted during those years.
  2. The subgroup of previously uninsured Californians who now report that they have health insurance, referred to as “California’s recently insured.” Two subgroups within California’s recently insured are:
      1. Those who reported that they were uninsured in the summer of 2013 and either said in spring 2014 or spring 2015 that they did not have coverage or were unable to be contacted, but now report having health insurance, referred to as “California’s newly insured,” and
      2. Those who reported that they were uninsured in the summer of 2013, reported gaining insurance sometime in the past two years and say they still have coverage in spring 2016, referred to as “California’s still insured.”

And, as noted in the Survey Methodology Section, only those uninsured for at least two months were included in the baseline survey. Other terms used occasionally throughout the report are defined below.

  • Eligible Previously Uninsured Californians: Because the coverage expansions under the ACA do not extend to undocumented immigrants, some of the analyses focuses on those who reported being U.S. citizens or permanent residents in the baseline survey, described in shorthand as those who are ‘eligible’ for the ACA’s coverage expansions.
  • Undocumented Previously Uninsured Californians: For the purposes of this report, undocumented immigrants are defined as those who reported in the baseline survey that a) they were not born in the United States or Puerto Rico, b) they came to this country without a green card, and c) they have not received a green card or become a permanent resident since arriving. There are several ways that this definition, while workable for the purposes of a broad analysis of this sort, falls short of the complexity of real life. First, it relies on self-reporting, and since respondents have an incentive not to reveal unlawful immigration status, it is undoubtedly a somewhat imperfect measure. Second, those that did not answer all three in the series of immigration status items in the baseline survey were not able to be categorized. Third, by necessity of time and efficiency, the survey did not allow for a full exploration of the many nuances inherent in the U.S. immigration system. For example, this category may actually include a small number of individuals in California as refugees, asylees or other humanitarian immigrants who might better be placed among the ‘eligible uninsured’. The survey, unfortunately, does not allow this level of detailed sorting. Since estimated immigration status is based on individuals’ responses to the baseline survey, it is possible that some small share of those thought to be undocumented immigrants have now become permanent residents or received a green card.
  • Income categories: Because eligibility for two of the law’s main components – the Medi-Cal expansion and the tax credits being made available to purchase insurance on the new exchanges – is based on an individual’s family income relative to the federal poverty level (FPL), in some cases we report survey results by FPL categories. Eligible previously uninsured Californians with incomes 138% FPL or less (roughly $33,000 a year for a family of 4 in 2015) are eligible for Medi-Cal coverage, while those with incomes greater than 138% and up to 400% FPL (roughly $33,000-$97,000 for a family of 4 in 2015), are eligible for subsidies to purchase insurance through Covered California Marketplace. Those with incomes above 400% FPL are allowed to buy insurance through Covered California but are not eligible for subsidy assistance. For convenience, we sometimes refer to the eligible group with incomes 138% FPL or less as the “Medi-Cal target group”, and those greater than 138% and up to 400% FPL as the “exchange subsidy target group”. These obviously are approximations that do not allow for every real world exception to be taken into account. For example, lawfully present immigrants may remain subject to a five year wait before they may enroll in Medi-Cal, but for the purposes of this analysis they are included in the Medi-Cal target group if they meet the income criteria. Similarly, some of those in the exchange subsidy target group may not be eligible for marketplace subsidies if they have access to affordable employer coverage, a situation difficult to ascertain in a phone survey.

Methodology

Survey Methodology

This is the fourth in a series of surveys by the Kaiser Family Foundation (KFF) tracking the views and experiences of a group of Californians who were uninsured in the summer of 2013, prior to implementation of the ACA’s insurance market reforms and coverage expansions through Covered California and Medi-Cal. The first survey (Wave 1) was conducted from July 11-August 29, 2013, with a randomly selected group of individuals who were uninsured at the time of the interview, and was paid for entirely by KFF. The second survey (Wave 2) was conducted from April 1-June 15, 2014. The third survey (Wave 3) was conducted from February 18-May 13, 2015, and the current survey (wave 4) was conducted from February 10-June 20, 2016,   with the same longitudinal panel of respondents, whether they obtained coverage or remained uninsured. All four surveys were designed and analyzed by researchers at KFF. Social Science Research Solutions collaborated with KFF researchers on sample design, weighting, and supervised fieldwork. Fieldwork costs associated with Waves 2, 3, and 4 of the survey were paid for by The California Endowment.

The Wave 1 survey was conducted among a representative random sample of 2,001 adults ages 19-64 living in California who reported having been without health insurance for at least two months at the time of the interview13  (NOTE: persons without a telephone could not be included in the random selection process). Computer-assisted telephone interviews conducted by landline (990) and cell phone (1,011, including 660 who had no landline telephone) were carried out in English and Spanish by SSRS. To increase efficiency in reaching this low-incidence, hard-to-reach group, both the landline and cell phone sampling frames oversampled areas with a lower-income population (since being uninsured is negatively correlated with income). The landline sample frame also oversampled households whose phone numbers were matched with directory listings indicating the presence of at least one person age 19-64 and a household income of less than $25,000. Additionally, 230 interviews (130 landline, 100 cell phone) were conducted with respondents who previously completed recent national SSRS omnibus surveys of the general public and indicated they were ages 19-64 and uninsured. These previous surveys were conducted with nationally representative, random-digit-dial landline and cell phone samples. Waves 2, 3, and 4 also consisted of computer-assisted telephone interviews conducted in English and Spanish by landline and cell phone, including those who had no landline phone.

 Table 4: Comparing Respondent Contact Mode Across Waves
TotalLandlineCell phone (no landline)Web
Wave 1 (July 11-August 29, 2013)2,0019901,011 (660)Not applicable
Wave 2 (April 1-June 15, 2014)1,219623545 (327)51
Wave 3 (February 18-May 13, 2015)1,105555463 (317)87
Wave 4 (February 10-June 20, 2016)1001484404 (240)113

In order to re-connect with respondents who may be more willing to complete the survey online, an abbreviated web version was introduced for Waves 2, 3, and 4 after attempts had been made to reach respondents by phone. The online questionnaire was offered in English and Spanish and was limited to key questions about insurance status, type of coverage, and reasons for obtaining coverage or remaining uninsured. A total of 51 respondents in Wave 2, 87 respondents in Wave 3, and 113 in Wave 4 completed the online version of the survey.

Screening for Waves 2, 3, and 4 involved verifying that the respondent had participated in Wave 1. Multiple attempts were made to reach every respondent from Wave 1 and encourage participation in later waves. Efforts included multiple dialing at various times of day and throughout the week, mailings and emails to those who provided such contact information, repeated dialing of non-working numbers, and attempts to find alternative phone numbers for non-working numbers.

A multi-stage weighting design was applied to ensure accurate representation of California’s nonelderly adult uninsured population prior to the ACA’s coverage expansions. The weighting process for Waves 2, 3, and 4 involved corrections for sample design, as well as sample weighting to match the weighted Wave 2 sample, weighted Wave 3 sample, and weighted Wave 4 sample to Wave 1 responses along demographic characteristics. As it did for Wave 1, the base weight for Waves 2, 3, and 4 accounted for the oversamples used in the sample design, as well as the likelihood of non-response for the sample from earlier omnibus surveys, number of eligible household members for the landline sample, and a correction to account for the fact that respondents with both a landline and cell phone have a higher probability of selection. Demographic weighting parameters for Waves 2, 3, and 4 were based on Wave 1 weighted demographics, which were adjusted for age, education, race/ethnicity, nativity (for Hispanics only), Hispanics by gender, presence of own child in household, marital status, California region, poverty level, and phone usage. For more information on weighting and data sources, see the Wave 1 methodology. All differences referred to in the report are statistically significant. Statistical tests of significance account for the effect of weighting, and, for trend analysis, testing takes into account the survey’s panel design.

A unique consideration for panel surveys such as the Kaiser Family Foundation California Longitudinal Panel Survey, is whether those who participate in subsequent waves are different in terms of their attitudes or demographics than those who refuse to participate again or were unable to be re-contacted. Of the total 2,001 respondents who completed Wave 1, 1,219 participated in Wave 2, 1,105 completed Wave 3, and 1001 completed Wave 4. These completion rates are within an expected range given that the uninsured are already an often a difficult to reach population since many are lower income, younger, undocumented immigrants, and members of racial/ethnic minority groups, and may change phone numbers or move more often than the public at large. After data collection was complete, data from Wave 1 and Wave 4 were compared to evaluate the impact of some respondents not completing Wave 4, referred to as attrition. While there are some differences in the unweighted demographics of those who completed Wave 4 and the full Wave 1 sample, these observable differences are corrected for by weighting. As shown in the table below the total weighted distributions are similar for Wave 1 and Wave 4 for age, gender, race/ethnicity, party identification, education and income. See the Wave 4 Attrition Appendix for more information on attrition.

 Table 5: Comparing Respondent Demographics
UnweightedWeighted
Wave 1

(n=2001)

Completed Wave 4

(n=1001)

Completed all 4 Waves

(n=764)

Percentage PointDifference(W1 – W4 Total)Wave 1Completed Wave 4Completed all 4 WavesPercentage PointDifference(W1 – W4 Total)
Gender
Male48%43%41%554%53%50%1
Female52%57%59%-546%47%50%-1
Race/ethnicity
White27%33%36%-626%27%28%-1
Black7%8%8%-15%5%5%0
Hispanic58%51%50%756%55%54%1
Other Race8%8%7%013%12%13%1
Age
18 to 2923%19%17%433%31%28%2
30 to 3921%19%19%224%23%24%1
40 to 4922%20%19%221%22%23%-1
50 to 6435%43%45%-822%24%25%-2
Education
HS or less57%49%47%858%57%57%1
Some college28%33%34%-529%29%29%0
College Grad+15%17%18%-212%13%14%-1
Phone status
Landline49%55%56%-642%45%48%-3
Cell51%45%44%658%55%52%3
Marital status
Married33%34%33%-137%38%37%-1
Not Married67%65%67%262%62%63%0
Family income
<138% FPL60%57%57%352%53%55%-1
138%-400% FPL30%33%33%-336%34%33%2
400%+5%6%6%-17%7%6%0
Language of interview
English63%70%72%-765%66%64%-1
Spanish37%30%28%735%34%34%1
Resident Status
Citizen/ legal immigrant79%85%86%-678%81%81%-3
Undocumented immigrant20%14%13%621%18%18%3
Party Identification
Republican11%13%13%-211%11%12%0
Democrat35%39%39%-432%34%34%-2
Independent35%32%32%337%36%35%1
Other9%8%8%19%9%9%0

Another consideration for panel surveys is the potential for “sensitization effects,” that is, what effect returning to the same people about the same topics has on their experiences or views. For example, after taking the baseline survey that covered many aspects of the coverage expansions under the ACA, were people more likely to seek out information about health insurance and enroll than they would have been otherwise? While there is no direct way to measure this effect on this survey, other analyses have found that these effects are minimal and short-lived,14  and we do not believe they would have had a substantial impact on results presented here, particularly given all the other media coverage, advertising, and outreach targeted at this population during the fall and winter of 2013, 2014, and 2015.

The margin of sampling error including the design effect for the full sample is plus or minus 5 percentage points. For the recently insured, it is plus or minus 5 percentage points and for the remaining uninsured it is plus or minus 9 percentage points. Numbers of respondents and margin of sampling error for key subgroups are shown in the table below.

 Table 6: Margin of Sampling Errors Across Subgroups
GroupNMOSE
Total Wave 41001+/- 5 percentage points
Recently Insured781+/- 5 percentage points
     Recently insured by Medi-Cal393+/- 7 percentage points
     Recently insured by non-group plan147+/- 11 percentage points
          Recently insured through Covered California121+/- 12 percentage points
     Recently insured through an employer180+/- 10 percentage points
     Recently insured Hispanics366+/- 7 percentage points
Remaining Uninsured218+/- 9 percentage points
     Remaining uninsured Hispanics143+/- 11 percentage points

For results based on other subgroups, the margin of sampling error may be higher. Sample sizes and margin of sampling errors for other subgroups are available by request. Note that sampling error is only one of many potential sources of error in this or any other public opinion poll.

Some demographic measures referred to in the report were only asked during the baseline survey, such as questions about educational attainment, debilitating chronic condition, length of time uninsured, resident status, and race/ethnicity. For more information on the first and second waves of the Kaiser Family Foundation California Longitudinal Panel Survey visit:

Wave 1: https://www.kff.org/health-reform/report/californias-uninsured-on-the-eve-of-aca-open-enrollment/

Wave 2: https://www.kff.org/health-reform/report/where-are-californias-uninsured-now-wave-2-of-the-kaiser-family-foundation-california-longitudinal-panel-survey/

Wave 3: https://www.kff.org/health-reform/report/californias-previously-uninsured-after-the-acas-second-open-enrollment-period/

Appendices

Findings Appendix

Table A1: Demographic Profiles Of Each Group Of Newly Insured, Still Insured, and Remaining Uninsured Californians
NEWLY INSURED IN 2016

(15%)

STILL INSURED IN 2016

(57%)

REMAINING UNINSURED IN 2016

(28%)

AGE19-2932%21%24%
30-4935%42%55%
50-6432%31%19%
65+2%6%1%
RACEWhite non-Hispanic19%33%18%
Black non-Hispanic8%5%4%
Other non-Hispanic26%13%9%
Hispanic59%48%67%
Hispanic, eligible30%40%33%
GENDERMale57%51%53%
Female43%49%47%
LENGTH OF TIME UNINSURED PRIOR TO ACA2 months to less than a year6%15%8%
1 year to less than 2 years6%16%12%
2 years or more43%49%39%
Never had insurance45%21%41%
EMPLOYMENTEmployed58%67%57%
Unemployed14%11%19%
A student, retired, on disability, or stay at home parent26%21%24%
EDUCATIONHigh school or less52%51%72%
Some college31%32%22%
College or more13%16%6%
HEALTH STATUSExcellent/ Very good/ Good61%59%70%
Fair/ Poor39%41%30%
MARITAL STATUSMarried22%42%42%
Not married77%57%58%
FAMILY INCOMELess than 138% FPL56%51%56%
Between 138% – 400% FPL41%37%37%
Over 400% FPL3%11%6%
DEBILITATING CHRONIC CONDITIONYes12%20%8%
No87%79%92%
PERSONALLY CONTACTEDYes, been contacted30%32%15%
No, have not been contacted70%67%84%

Wave 4 Attrition Appendix

A unique consideration for panel surveys such as the Kaiser Family Foundation California Longitudinal Panel Survey is whether those who participate in subsequent waves are different in terms of their attitudes or demographics than those who refuse to participate again or were unable to be re-contacted. Of the total 2,001 respondents who completed Wave 1, 1,219 participated in Wave 2, 1,105 completed Wave 3, and 1,001 completed Wave 4. These completion rates are within an expected range given that the uninsured are already a difficult to reach population since many are lower income, younger, undocumented immigrants, and members of racial/ethnic minority groups, and may change phone numbers or move more often than the public at large. After data collection was complete, data from Wave 1 and Wave 4 were compared to evaluate the impact of some respondents not completing Wave 4, referred to as attrition. Wave 4 respondents included those who completed all four waves (n=764) as well as those who completed Waves 1 and 4 only (n=52), those who completed Waves 1, 2, and 4 (n=87), and those who completed Waves 1, 3, and 4 (n=98). The analysis was designed to assess whether: (1) The makeup of respondents differed systematically between the waves; and (2) whether these differences correspond with bias as far as the study’s substantive questions.

As detailed below in Table A1, we compared Wave 1 question responses for the total Wave 1 and Wave 4 samples to assess whether Wave 4 consists of respondents who answered Wave 1 differently than the full Wave 1 sample. The table also includes comparisons for the subsample of Wave 4 respondents who have completed all four waves. The weighted columns indicate whether any differences in sample characteristics and substantive responses were minimized through Wave 4 weighting. The comparison indicates that the greatest difference between the complete Wave 1 sample and the Wave 4 sample centers on respondents with lower educational attainment (8 percentage points less in Wave 4), Spanish speaking (7 percentage points less in Wave 4), undocumented respondents (6 percentage points less in Wave 4), male respondents (5 percentage points less in Wave 4), cell phone respondents (6 percentage points less in Wave 4), and respondents under age 30 (4 percentage points less in Wave 4), along with an increase in the share of white respondents as well as a decrease in the share of Hispanic respondents (6 and 7 percentage points, respectively). This seems to indicate that the harder-to-reach (namely undocumented), more transient (cell phone), and younger respondents were slightly less likely to be reached and to complete the Wave 4 interview. These differences are similar to the differences among those who completed all four waves of the survey. However, these demographic differences between the samples did not translate into meaningful differences on the questions of self-reported party identification, self-reported health status, or whether respondents reported having a usual source of care at Wave 1. Furthermore, once the sample was weighted as it would be in any case, only slight demographic differences remained. The variables not included in the weighting were hardly affected by weighting, or became more similar to Wave 1 (Table A2). Overall, this analysis finds fairly small observable differences between Wave 4 respondents and the full Wave 1 sample as far as Wave 1 responses. Attrition does not appear to introduce significant bias, and most differences are addressed by weighting (that was specifically designed to match the Wave 1 sample, adding parameters such as language of interview and income relative to the federal poverty level (FPL)).

Table A2: Wave 1 To Wave 4 Sample Comparisons For Wave 1 Questions (Weighted And Unweighted)
UnweightedWeighted
Wave 1(n=2001)Completed Wave 4(n=1001)Completed all 4 Waves (n=764)Percentage PointDifference(W1 – W4 Total)Wave 1Completed Wave 4Completed all 4 WavesPercentage PointDifference(W1 – W4 Total)
Gender
Male48%43%41%554%53%50%1
Female52%57%59%-546%47%50%-1
Race/ Ethnicity
White27%33%36%-626%27%28%-1
Black7%8%8%-15%5%5%0
Hispanic58%51%48%756%55%54%1
Other Race8%8%8%013%12%13%1
Age
19 to 2923%19%17%433%31%28%2
30 to 3921%19%19%224%23%24%1
40 to 4922%20%19%221%22%23%-1
50 to 6435%43%45%-822%24%25%-2
Education
HS or less57%49%47%858%57%57%1
Some college28%33%34%-529%29%29%0
College Grad+15%17%18%-212%13%14%-1
Phone status
Landline49%55%56%-642%45%48%-3
Cell51%45%44%658%55%52%3
Marital status
Married33%34%33%-137%38%37%-1
Not Married67%65%67%262%62%63%0
Family income
<138% FPL60%57%57%352%53%55%-1
138%-400% FPL30%33%33%-336%34%33%2
400%+ FPL5%6%6%-17%7%6%0
Language of interview
English63%70%72%-765%66%64%-1
Spanish37%30%28%735%34%34%1
Table A3: Wave 1 And Wave 4 Sample Comparisons For Wave 1 Questions Not Used In Weighting (Weighted And Unweighted)
UnweightedWeighted
Wave 1(n=2001)Completed Wave 4(n=1001)Completed all 4 Waves (n=764)Percentage PointDifference(W1 – W4 Total)Wave 1Completed Wave 4Completed all 4 WavesPercentage PointDifference(W1 – W4 Total)
Resident Status
Citizen/ legal immigrant79%85%86%-678%81%81%-3
Undocumented immigrant20%14%13%621%18%18%3
Party Identification
Republican11%13%13%-211%11%12%0
Democrat35%39%39%-432%34%34%-2
Independent35%32%32%337%36%35%1
Other9%8%8%19%9%9%0
Length of time uninsured prior to ACA
2 months to less than a year12%11%11%113%11%11%2
1 year to less than 2 years12%12%13%014%13%15%1
2 years or more48%53%55%-544%45%45%-1
Never insured28%23%21%529%30%30%-1
Self-reported health status
Excellent/Very good/Good59%60%60%-162%62%64%0
Fair/Poor41%40%40%138%37%36%-1
Debilitating Chronic Condition
Yes16%19%21%-313%15%15%-2
No84%81%79%387%84%85%3
Usual place for care
Yes61%63%63%-256%57%57%-1
No39%36%37%343%42%43%1

An indicator consistent with this observation is the mean Wave 1 Weight of the Wave 4 sample. This value, 0.979 (SE=0.031), indicates that the measure to which Wave 4 respondents further accentuated Wave 1 non-response patterns (corresponding with smaller weights) was relatively small, about 2%. For those who responded to all four waves, this value was slightly smaller (0.973; SE=0.036), but still indicative of overall similarity between responders and non-responders.

We also compared the unweighted demographics for those who completed Wave 4 with those who didn’t (a typical nonresponse analysis) and there are some differences between these two groups. Those who did not participate in Wave 4 were somewhat more likely to be younger, male, Hispanic, undocumented, have lower levels of education, report never having had health insurance, or prefer taking the survey in Spanish. In order to further isolate the demographic factors associated with completing the Wave 4 survey or not, we conducted a logistic regression analysis. After controlling for demographic characteristics such as income, race/ethnicity, and party identification, the factors associated with completing Wave 4 include being interviewed on a landline telephone, being older, having a disability, and having higher levels of education. The factors associated with not completing Wave 4 are being male and being Hispanic as well as being undocumented. This pattern is similar when looking at those who completed all 4 waves as well as those who have not participated since taking the initial baseline survey. As noted above, weighting corrects for some of these differences.

Endnotes

  1. Kaiser Family Foundation analysis of 2013 ASEC Supplement to the Current Population Survey. ↩︎
  2. Kaiser Family Foundation, California’s Uninsured On The Eve Of ACA Open Enrollment, September 2013, https://modern.kff.org/health-reform/report/californias-uninsured-on-the-eve-of-aca-open-enrollment/. ↩︎
  3. Kaiser Family Foundation, Where Are California’s Uninsured Now? Wave 2 Of The Kaiser Family Foundation California Longitudinal Panel Survey, July 2014, https://modern.kff.org/health-reform/report/where-are-californias-uninsured-now-wave-2-of-the-kaiser-family-foundation-california-longitudinal-panel-survey/. ↩︎
  4. Kaiser Family Foundation, California’s Previously Uninsured After The ACA’s Second Open Enrollment Period, July 2015, https://modern.kff.org/health-reform/report/californias-previously-uninsured-after-the-acas-second-open-enrollment-period/. ↩︎
  5. For the purposes of this report, the ‘eligible uninsured’ are California residents who said they had been uninsured for at least two months in the baseline survey and would be eligible for participation in the ACA coverage expansion based on their self-reported status as a citizen, permanent resident, or lawfully present immigrant. See the “About The Terms In This Report” Section for more details. ↩︎
  6. See the “About The Terms In This Report” Section for more details. ↩︎
  7. The total share with non-group coverage, including those in Covered California, remained stable in the past three waves. ↩︎
  8. It is important to note that among individuals with health insurance through Covered California, the most common reason for changing health insurance plans was that they found a plan with a lower monthly premium, however, the number of individuals in this group is too small to report. ↩︎
  9. The analysis of the dynamics of health insurance includes those who were unable to be contacted in spring 2014 or spring 2015. For instances of missing data from the most recent survey, their previous insurance status is reported. The only criteria for being included in this group is completing either Wave 2 or Wave 3 and completing both Wave 1 and Wave 4 surveys. ↩︎
  10. As previously mentioned, the analysis of the dynamics of health insurance includes those who were unable to be contacted in spring 2014 or spring 2015. For instances of missing data from the most recent survey, their previous insurance status is reported. The only criteria for being included in this group is either reporting being uninsured in Wave 2, not completing Wave 3, and reporting being insured in Wave 4; or not completing Wave 2, reporting being uninsured in Wave 3, and reporting being insured in Wave 4. ↩︎
  11. See the “About The Terms In This Report” Section for more details. ↩︎
  12. US Census Bureau, California State & County QuickFacts http://quickfacts.census.gov/qfd/states/06000.html ↩︎
  13. Those who had been uninsured for less than two months were excluded from the survey since they may be experiencing a short period of uninsurance (i.e. someone who is between jobs), and the goal of the survey was to capture the experiences and views of those who have been without insurance for a longer period of time and are poised to experience the new coverage provisions of the ACA. ↩︎
  14. M. Brodie, “Sensitization Effects in a Study of the Impact of a Nationally Broadcast Special on Health Care Reform,” in Doctoral Thesis: Political Institutions, Participation, and Media Evaluations— Influences on Health Care Policy (Boston, Mass.: Harvard University, 1995). ↩︎
News Release

New Survey Finds 72% of Previously Uninsured Californians Now Have Coverage, Including 78% of Those Eligible for New Affordable Care Act Options

Recently Insured Residents Report Greater Health and Financial Security, Though Worries about Health Care Costs and Access Persist for Some

Published: Aug 18, 2016

For Remaining Uninsured Residents, Cost and Immigration Status Are Main Obstacles

Three years after the Affordable Care Act’s coverage expansions were fully implemented in California, nearly three quarters (72%) of the state’s previously uninsured residents now have health coverage, finds the fourth Kaiser Family Foundation Longitudinal Panel Survey, which is tracking the experiences of a randomly selected group of Californian adults who were uninsured in 2013. This is similar to the share who reported having insurance last year (68%).

The share with coverage is even higher (78%) among those likely eligible for Medi-Cal and private insurance purchased through Covered California, but unchanged from last year. Undocumented immigrants are not eligible to sign up for either type of coverage.

charts_for_CA_release_-_final.png

The four waves of the survey provide a detailed look at how the health and financial security of previously uninsured residents have changed in a state that fully embraced the Affordable Care Act’s opportunities to expand coverage, including creating the Covered California insurance marketplace and expanding its Medi-Cal program.

Reflecting the low incomes reported by many previously uninsured California, the largest share of recently insured residents are covered through Medi-Cal (33%), the state’s Medicaid program. The state’s marketplace, Covered California, covers about one in 10 (11%), a fifth (21%) now report employer coverage, and the rest report other sources of coverage. This new coverage likely reflects a variety of factors, including: the impact of the ACA’s new coverage options and requirements for individuals to obtain coverage and for large employer to offer it or pay penalties; a growing economy; and the regular churn of people in and out of coverage.

Overall, recently insured Californians are more likely to report that their health needs are being met today than when they were uninsured in 2013 (77% now versus 49% in 2013) and less likely to say they are very worried about paying medical bills. Californians who remain uninsured show less improvement on these and other measures of financial security and are worse off than the recently insured.

updated_CA_chart8-17.png

Of the recently insured, eight in 10 (79%) say their experiences with their current health insurance plan have been positive, including nearly a third (31%) who say their experiences have been very positive. Far fewer (15%) say their experiences have been negative, including just 5 percent who say very negative. Most of the recently insured also report that they are either very or somewhat satisfied with their plan’s choice of hospitals (81%), primary care doctors (76%), and specialists (68%).

At the same time, the survey finds that some recently insured Californians continue to worry about health care costs and access.  For instance, one in five (20%) say they did not get medical care at some point in the past year due to cost, and more than half (53%) say they are very worried about paying medical bills in the event of a serious illness or accident, which is similar to the shares in other Foundation surveys of people with insurance nationally.

Similarly, one quarter (25%) of the recently insured say they have had to wait longer than a reasonable time to get an appointment for medical care, and 12 percent say they have been told by a doctor’s office or clinic in the past 12 months that they would not be accepted as a new patient.

While seven in 10 of California’s previously uninsured residents had gone at least two years without coverage prior to 2013, the majority now report stable coverage with nearly two thirds (63%) reporting having coverage for at least a year, including nearly half (48%) who report coverage for two or three years. Far fewer (14%) have unstable coverage, gaining it at some point, then losing it, and in some cases gaining it again.

In spite of the gains in coverage, the survey finds slightly more than a quarter (27%) of previously uninsured Californians are still without coverage. This includes 10 percent who are likely undocumented immigrants and ineligible for Medi-Cal or Covered California, leaving 17 percent who could potentially be helped by the law’s coverage expansions.

Hispanics make up two thirds (67%) of the remaining uninsured, though half of them (33% of all remaining uninsured) are likely undocumented immigrants who are not eligible for Medi-Cal or to enroll in Covered California. (Eligible Hispanics obtained coverage at rates similar to whites.)

When asked to say in their own words the main reason why they do not currently have health insurance, nearly half of the remaining uninsured (47%) say it is because health insurance is too expensive and they can’t afford it. Fewer cite eligibility issues (19%), including immigration concerns (10%).  Just 2 percent cite opposition to the health care law as their main reason they don’t have coverage.

About The Survey

The survey is the fourth in a series based on the Kaiser Family Foundation California Longitudinal Panel Survey Project. It was designed and analyzed by researchers at the Foundation. The fourth and final wave of the survey was conducted primarily by telephone from February 10-June 20, 2016, among 1,001 individuals who had participated in the baseline survey. The baseline survey was conducted from July 11-August 29, 2013 with a representative sample of 2,001 adults ages 19 to 64 living in California who reported having been without health insurance for at least two months at the time of the survey. Interviews were carried out in English and Spanish by SSRS, an independent research company. The panel survey estimates the percentage of the previously uninsured who gained coverage and does not estimate the overall change in the number of uninsured Californians because it does not include anyone who may have been insured prior to open enrollment but is now uninsured. The margin of sampling error including the design effect is plus or minus 5 percentage points for results based on the full sample and for recently insured Californians, and 9 percentage points for those Californians who remain uninsured. For other subgroups, the margin of sampling error may be higher. Fieldwork for the panel survey is supported by a grant from The California Endowment.

Explaining Health Care Reform: Risk Adjustment, Reinsurance, and Risk Corridors

Authors: Cynthia Cox, Ashley Semanskee, Gary Claxton, and Larry Levitt
Published: Aug 17, 2016

As of January 1, 2014, insurers are no longer able to deny coverage or charge higher premiums based on preexisting conditions (under rules referred to as guaranteed issue and modified community rating, respectively). These aspects of the Affordable Care Act (ACA) – along with tax credits for low and middle income people buying insurance on their own in new health insurance marketplaces – make it easier for people with preexisting conditions to gain insurance coverage. However, if not accompanied by other regulatory measures, these provisions could have unintended consequences for the insurance market. Namely, insurers may try to compete by avoiding sicker enrollees rather than by providing the best value to consumers. In addition, in the early years of market reform insurers faced uncertainty as to how to price coverage as new people (including those previously considered “uninsurable”) gained coverage, potentially leading to premium volatility. This brief explains three provisions of the ACA – risk adjustment, reinsurance, and risk corridors – that were intended to promote insurer competition on the basis of quality and value and promote insurance market stability, particularly in the early years of reform.

Background: Adverse Selection & Risk Selection

One concern with the guaranteed availability of insurance is that consumers who are most in need of health care may be more likely to purchase insurance. This phenomenon, known as adverse selection, can lead to higher average premiums, thereby disrupting the insurance market and undermining the goals of reform. Uncertainty about the health status of enrollees could also make insurers cautious about offering plans in a reformed individual market or cause them to be overly conservative in setting premiums. To discourage behavior that could lead to adverse selection, the ACA makes it difficult for people to wait until they are sick to purchase insurance (i.e. by limiting open enrollment periods, requiring most people to have insurance coverage or pay a penalty, and providing subsidies to help with the cost of insurance).

Risk selection is a related concern, which occurs when insurers have an incentive to avoid enrolling people who are in worse health and likely to require costly medical care. Under the ACA, insurers are no longer permitted to deny coverage or charge higher premiums on the basis of health status. However, insurers may still try to attract healthier clients by making their products unattractive to people with expensive health conditions (e.g., in what benefits they cover or through their drug formularies). Or, certain products (e.g., ones with higher deductibles and lower premiums) may be inherently more attractive to healthier individuals. This type of risk selection has the potential to make the market less efficient because insurers may compete on the basis of attracting healthier people to enroll, as opposed to competing by providing the most value to consumers.

The ACA’s risk adjustment, reinsurance, and risk corridors programs were intended to protect against the negative effects of adverse selection and risk selection, and also work to stabilize premiums, particularly during the initial years of ACA implementation.

Each program varies by the types of plans that participate, the level of government responsible for oversight, the criteria for charges and payments, the sources of funds, and the duration of the program. The table below outlines the basic characteristics of each program.

Table 1: Summary of Risk and Market Stabilization Programs in the Affordable Care Act
Risk AdjustmentReinsuranceRisk Corridors
What

the program does

Redistributes funds from plans with lower-risk enrollees to plans with higher-risk enrolleesProvides payment to plans that enroll higher-cost individualsLimits losses and gains beyond an allowable range
Why

it was enacted

Protects against adverse selection and risk selection in the individual and small group markets, inside and outside the exchanges by spreading financial risk across the marketsProtects against premium increases in the individual market by offsetting the expenses of high-cost individualsStabilizes premiums and protects against inaccurate premium setting during initial years of the reform
Who

participates

Non-grandfathered individual and small group market plans, both inside and outside of the exchangesAll health insurance issuers and  self-insured plans contribute funds; individual market plans subject to new market rules (both inside and outside the exchange) are eligible for paymentQualified Health Plans (QHPs), which are plans qualified to be offered on a health insurance marketplace (also called exchange)
How

 it works

Plans’ average actuarial risk will be determined based on enrollees’ individual risk scores.  Plans with lower actuarial risk will make payments to higher risk plans.

Payments net to zero.

If an enrollee’s costs exceed a certain threshold (called an attachment point), the plan is eligible for payment (up to the reinsurance cap).

Payments net to zero.

HHS collects funds from plans with lower than expected claims and makes payments to plans with higher than expected claims. Plans with actual claims less than 97% of target amounts pay into the program and plans with claims greater than 103% of target amounts receive funds.

Payments net to zero.

When

it goes into effect

2014, onward          (Permanent)2014 – 2016                         (Temporary – 3 years)2014 – 2016(Temporary – 3 years)

Risk Adjustment

The ACA’s risk adjustment program is intended to reinforce market rules that prohibit risk selection by insurers.  Risk adjustment accomplishes this by transferring funds from plans with lower-risk enrollees to plans with higher-risk enrollees. The goal of the risk adjustment program is to encourage insurers to compete based on the value and efficiency of their plans rather than by attracting healthier enrollees.   To the extent that risk selecting behavior by insurers – or decisions made by enrollees – drive up costs in the health insurance marketplaces (for example, if insurers selling outside the Exchange try to keep premiums low by steering sick applicants to Exchange coverage), risk adjustment also works to stabilize premiums and the cost of tax credit subsidies to the federal government.

Figure 1: Risk Adjustment Under the Affordable Care Act

Program Participation

The risk adjustment program applies to non-grandfathered plans in the individual and small group insurance markets, both inside and outside of the exchanges, with some exceptions. Plans in existence at the time the ACA was enacted in March 2010 were grandfathered under the law and are subject to fewer requirements. Plans lose their grandfathered status if they make significant changes (such as significantly increasing cost-sharing or imposing new annual benefit limits). Plans that were renewed prior to January 1, 2014, and are therefore not subject to most ACA requirements, are not part of the risk adjustment system. Multi-state plans and Consumer Operated and Oriented Plans (COOP) are subject to risk adjustment. Unless a state chooses to combine its individual and small group markets, separate risk adjustment systems operate in each market.

Government Oversight

States operating an exchange have the option to either establish their own state-run risk adjustment program or allow the federal government to run the program. States choosing not to operate an exchange or marketplace (and thus utilizing the federally-run exchange, called the Health Insurance Marketplace) do not have the option to run their own risk adjustment programs and must use the federal model. In states for which HHS operates risk adjustment, issuers are charged a fee to cover the costs of administering the program.

HHS developed a federally-certified risk adjustment methodology to be used by states or by HHS on behalf of states. States electing to use an alternative model must first seek federal approval and must submit yearly reports to HHS. States electing to run their own risk adjustment program must publish a notice of benefit and payment parameters by March 1 of the year prior to the benefit year; otherwise they will forgo the option to deviate from the federal methodology. Once a state’s alternative methodology is approved, it becomes federally-certified and can be used by other states. Massachusetts, the only state so far to operate its own risk adjustment program, will end is program in 2017. In 2017, HHS will operate risk adjustment programs in all states.

Calculation of Payments & Charges

Under risk adjustment, eligible insurers are compared based on the average financial risk of their enrollees. The HHS methodology estimates financial risk using enrollee demographics and claims for specified medical diagnoses. It then compares plans in each geographic area and market segment based on the average risk of their enrollees, in order to assess which plans will be charged and which will be issued payments.

Under HHS’s methodology, individual risk scores – based on each individual’s age, sex, and diagnoses – are assigned to each enrollee. Diagnoses are grouped into a Hierarchical Condition Category (HCC) and assigned a numeric value that represents the relative expenditures a plan is likely to incur for an enrollee with a given category of medical diagnosis. If an enrollee has multiple, unrelated diagnoses (such as prostate cancer and arthritis), both HCC values are used in calculating the individual risk score. Additionally, if an adult enrollee has certain combinations of illnesses (such as a severe illness and an opportunistic infection), an interaction factor is added to the person’s individual risk score. Finally, if the enrollee is receiving subsidies to reduce their cost-sharing, an induced utilization factor is applied to account for induced demand. Plans with enrollees that receive cost-sharing reductions under the ACA receive an adjustment because cost-sharing reductions may induce demand for health care and are not otherwise accounted for in the other premium stabilization programs. Once individual risk scores are calculated for all enrollees in the plan, these values are averaged across the plan to arrive at the plan’s average risk score. The average risk score, which is a weighted average of all enrollees’ individual risk scores, represents the plan’s predicted expenses. Under the HHS methodology, adjustments are made for a variety of factors, including actuarial value (i.e., the extent of patient cost-sharing in the plan), allowable rating variation, and geographic cost variation.   Under risk adjustment, plans with a relatively low average risk score make payments into the system, while plans with relatively high average risk scores receive payments.

Transfers (both payments and charges) are calculated by comparing each plan’s average risk score to a baseline premium (the average premium in the state). Transfers are calculated for each geographic rating area, such that insurers offering coverage in multiple rating areas in a given state have multiple transfer amounts that are grouped into a single invoice. Transfers within a given state net to zero.

On March 25, 2016, CMS hosted a public conference and released a white paper to review risk adjustment methodology and build on the first several years of experience. The white paper examined proposals to account for partial year enrollees and prescription drug use in the risk adjustment model. CMS intends to propose that the risk adjustment model begin to account for partial year enrollees in the 2017 benefit year, and begin to account for prescription drug utilization in the 2018 benefit year. Beginning in 2017, HHS will also begin to incorporate preventive services into their simulation of plan liability, and will incorporate different trend factors for traditional drugs, specialty drugs, and medical and surgical expenditures. This is intended to better reflect the growth of prescription drug expenditures compared to other medical expenditures. The risk adjustment model will be recalibrated using the most recent claims data from the Truven Health Analytics 2012, 2013, and 2014 MarketScan Commercial Claims and Encounters database (MarketScan). In response to issuer feedback from the 2014 benefit year of the risk adjustment program, CMS will also begin providing insurers with early estimates of health plan specific risk adjustment calculations. This is intended to give plans more timely information in order to set premiums. In addition, CMS has indicated that it is exploring other options to modify the permanent risk adjustment program to better adjust for higher-cost enrollees, as the temporary reinsurance program phases out in 2016.

Data Collection & Privacy

Under the federal risk adjustment program, to protect consumer privacy and confidentiality, insurers are responsible for providing HHS with de-identified data, including enrollees’ individual risk scores. States are not required to use this model of data collection, but are required to only collect information reasonably necessary to operate the risk adjustment program and are prohibited from collecting personally identifiable information. Insurers may require providers and suppliers to submit the appropriate data needed for risk adjustment calculations.

For each benefit year, an issuer of a risk adjustment covered plan or a reinsurance-eligible plan must establish a dedicated data environment (i.e. an EDGE server) and provide data access to HHS, in a timeframe specified by HHS, to be eligible for risk adjustment and/or reinsurance payments. CMS released guidance for EDGE Data submissions for the 2015 benefit year.

To ensure accurate reporting, HHS recommends that insurers first validate their data through an independent audit and then submit the data to HHS for a second audit.  For the first two benefit years (2014 and 2015) no adjustments to payments or charges were made as HHS optimized the data validation process. In 2016 and onward, if an issuer fails to establish a dedicated distributed data environment, fails to submit risk adjustment data, or if any errors are found through these audits, the insurer’s average actuarial risk will be adjusted, along with any payments or charges. Because the audit process is expected to take more than one year to complete, the first adjustments to payments (for the 2016 benefit year) will be issued in 2018.  Any issuer that fails to provide HHS access to EDGE server data in time to assess payments will be assessed a default risk adjustment charge. In 2015, 817 of 821 issuers participating in the risk adjustment program submitted the EDGE server data necessary to calculate risk adjustment transfers and 4 issuers were assessed the default charge.

Payments for the 2014 and 2015 Benefit Years

On Oct 1, 2015, HHS announced the results of the reinsurance, risk adjustment, and risk corridors programs for the first benefit year, 2014. For the 2014 benefit year of the risk adjustment program, $4.6 billion was transferred among insurers, and 758 total issuers participated in the program. An independent analysis found that the relative health of enrollees was the main determinant of whether an issuer received a risk adjustment payment. CMS reports that this is a sign that the risk adjustment formula is working as intended in transferring payments from plans with healthier enrollees to plans with sicker enrollees.

On June 30, 2016, HHS released a summary report on the results of the reinsurance and risk adjustment programs for the 2015 benefit year. For the 2015 benefit year of the risk adjustment program, risk adjustment transfers averaged 10% of premiums in the individual market and 6% of premiums in the small group market, similar to 2014. 821 issuers participated in the risk adjustment program. HHS also made available to each issuer of a risk adjustment covered plan a report that includes the issuer’s risk adjustment payment or charge.

Risk adjustment payments to issuers for benefit year 2015 will be sequestered at a rate of 7%, per government sequestration requirements for fiscal year 2016. HHS has suggested that risk adjustment payments sequestered in fiscal year 2016 will become available for payment to issuers in fiscal year 2017 without further Congressional action.

Reinsurance

The goal of the ACA’s temporary reinsurance program was to stabilize individual market premiums during the early years of new market reforms (e.g. guaranteed issue). The temporary program is in place from 2014 through 2016. The program transfers funds to individual market insurance plans with higher-cost enrollees in order to reduce the incentive for insurers to charge higher premiums due to new market reforms that guarantee the availability of coverage regardless of health status.

Reinsurance differs from risk adjustment in that reinsurance is meant to stabilize premiums by reducing the incentive for insurers to charge higher premiums due to concerns about higher-risk people enrolling early in the program, whereas risk adjustment is meant to stabilize premiums by mitigating the effects of risk selection across plans. Thus, reinsurance payments are only made to individual market plans that are subject to new market rules (e.g., guaranteed issue), whereas risk adjustment payments are made to both individual and small group plans. Additionally, reinsurance payments are based on actual costs, whereas risk adjustment payments are based on expected costs. As reinsurance is based on actual rather than predicted costs, reinsurance payments will also account for low-risk individuals who may have unexpectedly high costs (such as costs incurred due to an accident or sudden onset of an illness). Under reinsurance, some plans may receive payments for high-cost/high-risk enrollees, and still be eligible for payment for those enrollees under risk adjustment.

While risk adjustment payments net to zero within the individual and small group markets, reinsurance payments represent a net flow of dollars into the individual market, in effect subsidizing premiums in that market for a period of time.  To cover the costs of reinsurance payments and administering the program, funds are collected from all health insurance issuers and third party administrators (including those in the individual and group markets). HHS issues reinsurance payments to plans based on need, rather than issuing payments proportional to the amount of contributions from each state.

Figure 2: Reinsurance Under the Affordable Care Act

Program Participation

All individual, small group, and large group market issuers of fully-insured major medical products, as well as self-funded plans, contribute funds to the reinsurance program. Reinsurance payments are made to individual market issuers that cover high-cost individuals (and are subject to the ACA’s market rules). State high risk pools are excluded from the program.

Government Oversight

States have the option to operate their own reinsurance program or allow HHS to run one for the state. For states that choose to operate their own reinsurance program, there is no formal HHS approval process. However, states’ ability to deviate from the HHS guidelines is limited: HHS collects all reinsurance contributions – even if the program is state-run – and all states must follow a national payment schedule. Additionally, states that wish to modify data requirements must publish a notice of benefit and payment parameters. States may collect additional funds if they believe the cost of reinsurance payments and program administration will exceed the amount specified at the national level. States wishing to continue reinsurance programs after 2016 may do so, but they may not continue to use funds collected as part of the ACA’s reinsurance program after the year 2018. Connecticut was the only state to operate its own reinsurance program for benefit years 2014 and 2015. In July 2016, Alaska signed into law a two-year reinsurance program that recreates Alaska’s high-risk pool as a reinsurance fund. Alaska’s reinsurance program will cover claims for 2015 and 2016 benefit years.

Calculation of Payments and Charges

The ACA set national levels for reinsurance funds at $10 billion in 2014, $6 billion in 2015, and $4 billion in 2016.  Based on estimates of the number of enrollees, HHS set a uniform reinsurance contribution rate of $63 per person in 2014, $44 per person in 2015, and $27 per person in 2016.

Eligible insurance plans received reinsurance payments when the plan’s cost for an enrollee crossed a certain threshold, called an attachment point. HHS set the attachment point (a dollar amount of insurer costs, above which the insurer is eligible for reinsurance payments) at $45,000 in 2014 and 2015. Given the smaller reinsurance payments pool for 2016, HHS raised the attachment point to $90,000 for the 2016 benefit year. HHS also set a reinsurance cap (a dollar-amount threshold, above which the insurer is no longer eligible for reinsurance) at $250,000 in 2014, 2015, and 2016. HHS initially set the coinsurance rate (the percentage of the costs above an attachment point and below the reinsurance cap that were reimbursed through the reinsurance program) at 80 percent in 2014 and 50 percent in 2015 and 2016.  If reinsurance contributions exceeded the amount of payments requested, then that year’s reinsurance payments to insurers were increased proportionately (i.e. the coinsurance rate increased up to 100%). For example, in 2014, HHS was ultimately able to pay out 100 percent of claims rather than 80 percent, and in 2015 HHS raised the coinsurance rate to 55.1 percent. If surplus reinsurance funds remained available, they were rolled forward to the next benefit year. For example, $1.7 billion in surplus reinsurance funds collected for the 2014 benefit year were rolled forward to the 2015 benefit year. Similarly, if reinsurance contributions had fallen short of the amount requested for payments, then that year’s reinsurance payments would have decreased proportionately. Overall, total payments could not exceed the amount collected through contributions by insurers and third-party administrators.

States opting to raise additional reinsurance funds may do so by decreasing the attachment point, increasing the reinsurance cap, and/or increasing the coinsurance rate. States may not make changes to the national attachment point, reinsurance cap, or coinsurance rate that would result in lower reinsurance payments.

Data Collection & Privacy

Payment amounts made to eligible individual market insurers were based on medical cost data (to identify high-cost enrollees, for which plans receive reinsurance payment). Therefore, in order to calculate reinsurance payments, HHS or state reinsurance entities must either collect or be allowed access to claims data as well as data on cost-sharing reductions (because reinsurance payments were not made for costs that have already been reimbursed through cost sharing subsidies). In states for which HHS ran the reinsurance program, HHS used the same distributed data collection approach used for the risk adjustment program (i.e. an EDGE server) and similarly ensured that the collection of personally identifiable information was limited to that necessary to calculate payments. HHS proposed to conduct audits of participating insurers as well as states conducting their own reinsurance programs.

For the first two benefit years (2014 and 2015) no adjustments to reinsurance payments were made as HHS optimized the data validation process. In 2016, if an issuer fails to establish a dedicated distributed data environment or fails to adhere to reinsurance data submission requirements, the insurer may forfeit reinsurance payments. In 2015, 574 of 575 issuers participating in the reinsurance program submitted the EDGE server data necessary to calculate reinsurance payments.

Payments for the 2014 and 2015 Benefit Years

In June 2015, CMS announced the results of the reinsurance program for the first benefit year, 2014. In 2014, reinsurance contributions ($9.7 billion) exceeded requests for payments ($7.9 billion) and CMS was able to payout 100 percent of eligible claims rather than 80 percent – this amounted to $7.9 billion in reinsurance payments made to 437 issuers nationwide. Following these payments, approximately $1.7 billion in surplus reinsurance funds from the 2014 benefit year remained available, and were rolled forward to the 2015 benefit year.

CMS used this surplus of $1.7 billion, combined with additional collections of reinsurance contributions for the 2015 benefit year, to make an early partial reinsurance payment to issuers for the 2015 benefit year in March and April 2016. CMS calculated this early payment based on accepted enrollment and claims data as of February 1, 2016, at a coinsurance rate of 25%. CMS stated that reinsurance funds not paid out through this early payment will be paid out in late 2016, as part of the standard reinsurance payment process.

On June 30, 2016, CMS announced the results of the reinsurance program for the second benefit year, 2015. In 2015, estimated reinsurance contributions ($6.5 billion) were smaller than requests for payments ($14.3 billion). CMS estimates it will make $7.8 billion in reinsurance payments to 497 of the 575 participating issuers nationwide at a coinsurance rate of 55.1%.

CMS has collected approximately $5.5 billion in reinsurance contributions for 2015, with approximately $1 billion more scheduled to be collected on or before November 15, 2016. Any reinsurance contribution amounts collected above $6 billion for the 2015 benefit year are required to be allocated to the U.S. Treasury on a pro rata basis as an operating expense of the program. Combined with the surplus of $1.7 billion from 2014, CMS estimates it will have approximately $7.8 billion in reinsurance contributions available to be distributed as payments to issuers for the 2015 benefit year. On June 30, 2016 HHS made available to each issuer of a reinsurance-eligible plan a report that includes the issuer’s initial, estimated reinsurance payment for the 2015 benefit year. On August 11, 2016, CMS released an analysis based on reinsurance payments that suggests per-enrollee costs in the individual market were essentially unchanged between 2014 and 2015.

Reinsurance payments to issuers for benefit year 2015 will be sequestered at a rate of 6.8% per government sequestration requirements for fiscal year 2016. HHS has suggested that risk adjustment payments sequestered in fiscal year 2016 will become available for payment to issuers in fiscal year 2017 without further Congressional action.

Risk Corridors

The ACA’s temporary risk corridor program was intended to promote accurate premiums in the early years of the exchanges (2014 through 2016) by discouraging insurers from setting premiums high in response to uncertainty about who will enroll and what they will cost. The program worked by cushioning insurers participating in exchanges and marketplaces from extreme gains and losses.

Figure 3: Risk Corridors Under the Affordable Care Act

The Risk Corridors program set a target for exchange participating insurers to spend 80% of premium dollars on health care and quality improvement. Insurers with costs less than 3% of the target amount must pay into the risk corridors program; the funds collected were used to reimburse plans with costs that exceed 3% of the target amount.

This program was intended to work in conjunction with the ACA’s medical loss ratio (MLR) provision, which requires most individual and small group insurers to spend at least 80% of premium dollars on enrollee’s medical care and quality improvement expenses, or else issue a refund to enrollees.

Program Participation

All Qualified Health Plans (or QHPs, plans qualified to participate in the exchanges) were subject to the risk corridor program. Only those plans with expenses falling outside of allowable ranges made payments to the program (or qualified to receive payments). Qualified Health Plan (QHP) issuers may also offer QHPs outside of the exchange, in which case the QHP outside of the exchange were also subject to the risk corridors program.

Government Oversight

The risk corridor program was federally administered. HHS charged plans with larger than expected gains and made payments to plans with larger than expected losses.

Calculation of Payments and Charges

Each year, each Qualified Health Plan was assigned a target amount for what are called allowable costs (expenditures on medical care for enrollees and quality improvement activities) based on its premiums. Allowable costs included medical claims and costs associated with quality improvement efforts, as defined in the ACA’s medical loss ratio (MLR) calculations. Insurers must also account for any cost-sharing reductions received from HHS by reducing their allowable costs by this amount. If an insurer’s actual claims fell within plus or minus three percent of the target amount (i.e. premiums less allowable costs), it made no payments into the risk corridor program and received no payments from it. In other words, the plan was fully at risk for any loss or gain. QHPs with lower than expected claims paid into the risk corridor program:

  • A QHP with claims falling below its target amount by 3% – 8% paid HHS in the amount of 50% of the difference between its actual claims and 97% of its target amount.
  • A QHP with claims falling below its target amount by more than 8% paid 2.5 percent of the target amount plus 80% of the difference between their actual claims and 92% of its target.

HHS provides an example of an insurer with a $10 million target amount and actual claims of $8.8 million (or 88% of the target amount). The insurer would have to pay $570,000 to the risk corridors program because (2.5%*$10 million) + (80%*((92%*10 million)-8.8 million) = 570,000.

Conversely, HHS reimbursed plans with higher than expected costs:

  • A QHP with actual claims that exceeded its target amount by 3% to 8% received a payment in the amount of 50% of the amount in excess of 103% of the target.
  • A QHP with claims that exceed its target amount by more than 8% received payment in the amount of 2.5% of the target amount plus 80% of the amount in excess of 108% of the target.

In response to reports of individual market plan cancelations in November 2013, HHS instituted a transitional policy allowing certain plans to be reinstated if state regulators agree to adopt a similar transitional policy. As this policy change affected the composition of the exchange risk pool, HHS modified the risk corridors program in 2015 to change the way allowable costs are calculated (i.e., by increasing the ceiling on administrative costs and the profit margin floor by 2 percent).

In the original statute, risk corridor payments were not required to net to zero, meaning that the federal government could experience an increase in revenues or an increase in costs under the program.  However, in the 2015 and 2016 appropriations bills, Congress specified that payments under the risk corridor program made to insurers in 2015 could not exceed collections from that year, and that CMS cannot transfer funds from other accounts to pay for the risk corridors program. This made the risk corridors program revenue neutral –meaning that only contributions collected from insurers could be used to fund payments for the risk corridor program. In the event that claims exceeded funds collected in a given year, CMS paid out claims pro rata and carried over deficiencies to be paid in the following year before any other claims are paid in that year. If the three-year risk corridors program ends with outstanding claims, HHS has stated it will work with Congress to secure funding for outstanding risk corridors payments, subject to the availability of appropriations.

Data Collection & Privacy

In order to calculate payments and charges for the risk corridors program, QHPs were required to submit financial data to HHS, including the actual amount of premiums earned as well as any cost-sharing reductions received. To reduce the administrative burden on insurers, HHS tied the data collection and validation requirements for the risk corridors to that of the Medical Loss Ratio (MLR) provision of the ACA. HHS will also conduct audits for the risk corridors program in conjunction with audits for the reinsurance and risk corridors program to minimize the burden on insurers.

Payments for the 2014 Benefit Year

On October 1, 2015, CMS announced that total risk corridors claims for 2014 amounted to $2.87 billion, and that insurer risk corridor contributions totaled $362 million. As a result, risk corridor payments for 2014 claims were paid out at 12.6% of claims. CMS anticipates that the remaining claims for 2014 will be paid out from 2015 risk corridor collections, and any shortfalls from 2015 claims will be covered by 2016 collections in 2017.  If there are still outstanding claims when the risk corridors program ends in 2017, HHS has stated it will work with Congress to explore other sources of funding for risk corridor payments, subject to availability of appropriations.

Conclusion

The Affordable Care Act’s risk adjustment, reinsurance, and risk corridors programs were designed to work together to mitigate the potential effects of adverse selection and risk selection. All three programs aimed to provide stability in the early years of a reformed health insurance market, with risk adjustment continuing over the long-term. Many health insurance plans are subject to more than one premium stabilization program, and while the programs have similar goals, they are designed to be complementary. Specifically, risk adjustment is designed to mitigate any incentives for plans to attract healthier individuals and compensate those that enroll a disproportionately sick population. Risk corridors were intended to reduce overall financial uncertainty for insurers, though they largely did not fulfill that goal following congressional changes to the program. Reinsurance compensated plans for their high-cost enrollees, and by the nature of its financing provided a subsidy for individual market premiums generally over a three-year period. Premium increases are expected to be higher in 2017 in part due to the end of the reinsurance program.