Findings from the Field: Enrollment and Consumer Assistance in Four States in Year Three of the ACA

Authors: Jennifer Tolbert, Samantha Artiga, Robin Rudowitz, Julia Paradise, and Melissa Majerol
Published: Sep 20, 2016

Executive Summary

Three years into the implementation of the ACA, many states continue to streamline their eligibility and enrollment processes and refine their outreach efforts and consumer assistance programs in order to maintain and expand on the coverage gains achieved to date. Based on case studies and focus groups, this brief reviews experiences with Medicaid and Marketplace enrollment, renewal, and consumer assistance in Colorado, Connecticut, Kentucky, and Washington as of Spring 2016. These states implemented the Medicaid expansion and established a state-based Marketplace (SBM) in 2014. This brief builds on previous reports that examined states’ preparation for implementation prior to the initial ACA open enrollment period and their experiences after completion of the first and second open enrollment periods. Together, this work provides an in-depth understanding of ACA implementation from multiple perspectives, tracking and documenting experiences that may help shape efforts moving forward. Key findings from this brief include the following:

Eligibility systems worked well during OE3, with fewer glitches than previous years. States continued to enhance system functionality between OE2 and OE3, improving system performance and providing consumers enhanced options to compare plans. Some system challenges persist for certain individuals and situations, such as immigrants and families with mixed coverage types. Colorado, Connecticut, and Washington are building on their systems to make continued improvements. In contrast, Kentucky is dismantling its Marketplace system, kynect. It transitioned to a new Benefind system for Medicaid enrollment following OE3 and plans to transition to Healthcare.gov for Marketplace enrollment for OE4.

Medicaid enrollment continued to grow during OE3, but this growth began to stabilize. All four states have experienced significant increases in Medicaid enrollment since initial implementation of the ACA. The slowing of enrollment growth during OE3 reflects the fact that the states had already enrolled most of the eligible population. The remaining eligible population includes harder to reach groups who will require more intensive, targeted efforts to enroll. Medicaid retention rates are high in the four study states, with nearly 90% of enrollees successfully renewing coverage. The study states are utilizing automated Medicaid renewal processes that generally appear to be working well. Reductions in Medicaid eligibility levels for parents in Connecticut and proposed changes to the Medicaid expansion in Kentucky may affect future enrollment in these states.

Marketplace enrollment increased in three of the study states during OE3. Colorado, Connecticut, and Washington experienced growth in Marketplace enrollment; however, Marketplace enrollment in Kentucky was flat from OE3. Several factors may have contributed to the lack of enrollment growth in Kentucky, including the exit of the CO-OP plan that had offered more affordable coverage and confusion over whether coverage through kynect remained available as the newly elected Governor ran on a campaign to dismantle kynect. With improvements in system performance and greater familiarity with the renewal process on the part of consumers, Marketplace renewal generally went smoothly in the four states. However, some enrollees expressed frustration that their plans were no longer available, forcing them to find a new plan.

Affordability of coverage continues to be a barrier for many Marketplace enrollees. Many individuals lack information about the availability of subsidies to reduce premium costs, but premiums can still be unaffordable for individuals even when the subsidies are applied. In addition, deductibles and other out-of-pocket costs also pose challenges for many Marketplace enrollees. Marketplace officials reported exploring strategies to provide consumers with more information on costs, including building on the decision support tools they had developed and noted the need for more education about the availability subsidies to reduce out-of-pocket costs.

Local level outreach and enrollment initiatives remained key for supporting successful enrollment and renewal. Consumer awareness of ACA coverage has increased compared to prior open enrollment periods, but there remain gaps in knowledge about the availability of financial assistance for Marketplace coverage and a continued need to educate consumers about how to use their coverage and how cost-sharing and deductibles work. During OE3, the case study states employed ongoing local level outreach and enrollment strategies that built on successful efforts from previous open enrollment periods. These initiatives included targeted efforts to reach specific populations, such as immigrants and people of color. Funding decreases led to some shifts away from broad mass media campaigns.

A broad range of individuals and organizations provided application and enrollment assistance, most of whom provided assistance in prior years. This experience, coupled with improved systems, enabled them to devote more time to outreach and helping people understand their benefits, as well as addressing post-enrollment problems and tax-related issues. Increased emphasis by the Marketplaces on finding and enrolling consumers into qualified health plans, as well as cuts to assister funding, led to some restructuring of assister networks. Future funding for consumer assistance remains a concern across the states, and particularly in Kentucky where the future role for kynectors is uncertain. Call center capacity and operations improved compared to prior years, but some challenges remained related to the quality of the assistance provided and long waits during peak times.

Looking ahead, states seek to build upon and sustain coverage gains. Three of the study states will continue to make improvements to their eligibility and enrollment systems to streamline further the enrollment and renewal processes for Medicaid and the Marketplace. They also plan to continue investments in outreach and consumer assistance efforts to find and enroll harder to reach populations, though a greater emphasis on enrolling consumers into QHPs coupled with funding constraints may lead to restructuring of navigator and other assister networks. With affordability of Marketplace coverage a concern, state officials are exploring strategies to address costs and help consumers make informed health plan choices. In contrast, efforts in Kentucky to dismantle its integrated eligibility and enrollment platform, kynect, and proposed changes to the Medicaid expansion may have implications for continued strong enrollment in Medicaid.

Issue Brief

Introduction

As of Spring 2016, states had completed the third open enrollment period (OE3) for the Health Insurance Marketplaces established by the ACA and most of the 32 states, including DC, that had adopted the Medicaid expansion to low-income adults were well into their third year of implementation. With three years of expanded coverage in place, many states have streamlined their eligibility and enrollment processes with the goal of increasing enrollment and retention of Medicaid and Marketplace enrollees. They continue to invest in outreach and consumer assistance, even as these efforts and programs evolve in response to changes in funding and priorities.

In Spring 2016, the Kaiser Family Foundation’s Commission on Medicaid and the Uninsured (KCMU) conducted case studies to gain an on-the-ground view of ACA implementation in four states, Colorado, Connecticut, Kentucky, and Washington, after completion of OE3. Working with PerryUndem Research/Communication, the Foundation conducted 28 in-person and phone interviews with a range of stakeholders in each state, including Medicaid and Marketplace officials, consumer advocates, assisters, and hospital and community health center (CHC) representatives. In addition, focus groups were conducted with Medicaid and Marketplace enrollees in each state. This work builds on previous analyses that examined states’ preparation for implementation prior to the initial ACA open enrollment period in October 2013 and subsequent reports examining state experiences after completion of the first and second open enrollment periods. Together, this work provides an in-depth understanding of ACA implementation from multiple perspectives, tracking and documenting experiences that may help shape efforts moving forward.

The four states included in these case studies implemented the Medicaid expansion and established a state-based Marketplace (SBM) in 2014.  As of OE3, all four states had very successful experiences implementing the coverage expansions. As such, these states’ experiences may provide key lessons about factors contributing to successful enrollment and greater insight into access and utilization of care as a growing number of people gain coverage. This brief reviews these states’ experiences with enrollment and renewal in Medicaid and Marketplace coverage, as well as outreach and consumer assistance during OE3. A separate brief reviews the experiences of Medicaid enrollees with access to care and explores state efforts to transform the Medicaid and broader health care delivery system.

Key Findings

Enrollment and Renewal

Perspectives on the Third Open Enrollment Period

Stakeholders in all four study states viewed OE3 as successful. They reported that systems functioned smoothly with fewer glitches than in previous years. Overall, enrollment continued to grow and Marketplaces were largely stable with the exception of some high profile plan exits. Moreover, stakeholders felt consumer awareness and understanding of coverage options and how to navigate enrollment and renewal processes improved compared to prior years. However, stakeholders also pointed to remaining challenges, including difficulties enrolling immigrant and mixed immigration status families as well as families with mixed coverage, in which some individuals qualify for Medicaid and others qualify for Marketplace coverage. Stakeholders also noted reductions in funding for outreach and enrollment assistance resources. In Kentucky, the gubernatorial election included significant debate around the future of coverage through its Marketplace, kynect, as well as the Medicaid expansion, with the newly elected Governor running on a platform to dismantle kynect. This led to confusion among consumers about the availability of kynect, which stakeholders felt dampened enrollment.

All four study states have had large declines in their uninsured rates since implementation of the ACA, which continued through OE3 (Table 1). Stakeholders agree that successful enrollment into the ACA coverage options contributed to these large declines, which have led to record low uninsured rates in each of the study states. Even with the significant success in reducing the number of uninsured, stakeholders in the states believe it is possible to achieve continued coverage gains by increasing enrollment of the remaining uninsured who are eligible for coverage. They noted that many of the remaining uninsured are eligible for Medicaid and that through continued efforts they should be able to find and enroll these individuals.

Table 1: Uninsured Rates for the Nonelderly Population
U.S.ColoradoConnecticutKentuckyWashington
Nonelderly Uninsured Rate, 201316.6%14.7%10.5%18.8%18.3%
Nonelderly Uninsured Rate, 201510.5%6.7%5.7%6.8%9.3%
Percentage Point Change Between 2013 and 2015-6.1%-8.0%-4.8%-12.0%-9.0%
Source: Health Insurance Coverage: Early Release of Estimates from the National Health Interview Survey, 2013 and 2015.
Eligibility Systems

During OE3, all four states had an integrated eligibility system that made eligibility determinations for both Medicaid and Marketplace coverage. In the four study states, the Marketplace eligibility system served as the online enrollment pathway for both Marketplace and Medicaid coverage during OE3 (Figure 1). In Colorado, the state also maintains a separate online Medicaid application, called PEAK, which allows individuals to apply for Medicaid and other programs, such as food and cash assistance, simultaneously. After OE3, Kentucky began dismantling its kynect eligibility system.
Figure 1: Integrated Medicaid and Marketplace Systems

States continued to enhance system functionality between OE2 and OE3. For example, during OE2, Washington utilized a premium aggregation approach in which consumers paid premiums to qualified health plans (QHPs) directly through the Marketplace system, Washington Healthplanfinder; however, problems with the system led to many consumers experiencing delays in completing the enrollment process. Washington eliminated premium aggregation from its system in OE3, which Marketplace officials reported significantly reduced problems for consumers. For OE3, Colorado implemented an expedited enrollment path that uses a set of initial dynamic income questions to direct people to the right program. It also added new decision support tools for consumers, including formulary and network tools, which officials indicated were particularly useful for helping individuals with chronic conditions select a QHP. In addition, Colorado added a broker referral tool to help individuals identify local brokers and implemented an online chat function. However, the chat function was not as successful as the state anticipated, and it will likely eliminate it next year. In Connecticut, AccessHealthCT launched a decision support tool during OE3; stakeholders noted that about 30% of consumers spent nearly 15 minutes using the tool to help them select a QHP.

Stakeholders in all four study states reported that eligibility systems worked well during OE3 with fewer glitches than in previous years. In Connecticut, stakeholders pointed to faster system operations and fewer shutdown periods. They also indicated that many previous system issues that had produced duplicate applications had been resolved. In Colorado, state officials reported that the share of individuals receiving real-time eligibility determinations has improved from year to year, and that during OE3, approximately 80% of applicants received a determination upon completion of an application. Stakeholders in Kentucky and Washington noted that, in addition to improved system functionality during OE3, increased consumer familiarity with the systems contributed to improved experiences. Most participants in the Medicaid and Marketplace focus groups also reported that the systems were functioning better compared to previous years, though some said they continued to experience problems enrolling or renewing online.

Initially it was confusing….it was much smoother now.  I think they worked out all the kinks, so it’s much easier to navigate and to reenroll.
-Kevin, Colorado Marketplace enrollee

While systems are functioning well overall, some challenges remain for certain individuals and situations. Stakeholders reported that some groups, including immigrants and mixed immigration status families as well as children turning 19, continue to experience problems with eligibility determinations. In Colorado, stakeholders also pointed to issues coordinating between the Connect for Health CO Marketplace system and the PEAK Medicaid eligibility system as well as with county Medicaid offices. For example, they noted that updates or information entered through the PEAK system did not always successfully transfer to Connect for Health CO, which sometimes led to enrollment delays or coverage losses. In Connecticut, stakeholders indicated that there had been some delays between an individual receiving an eligibility determination through AccessHealthCT and having their information entered into the Medicaid enrollment system, since this is still a manual process. The state has worked to reduce this delay and is working with providers to ensure enrollees can access care while this data entry is pending. In Washington, while the elimination of premium aggregation resolved many problems, some consumers reported that they did not receive their subsidies and were charged the full price for their premium. The Marketplace recognized that some insurers are having trouble transferring subsidy data to the Marketplace system, resulting in an about 5,000 people being overcharged, and is resolving these problems on a case-by-case basis.

Three of the study states are building on their existing systems to make continued improvements going forward, while Kentucky is dismantling its system. Connect for Health CO is planning additional system enhancements, including a total out-of-pocket calculator. Washington Healthplanfinder is considering adding a similar tool, but officials referenced some concerns about the ability to provide accurate information. In Connecticut, a new Medicaid enrollment system is set to launch in October, which will be better integrated with the AccessHealthCT eligibility determination system and allow for a more fully automated enrollment process. Despite these planned improvements, stakeholders indicated that resource limitations remain a challenge to system upgrades. In Connecticut, a lower than expected Marketplace budget limited funding available for system maintenance and improvements. Similarly, in Colorado, officials from Connect for Health CO indicated that funding for system fixes dropped from $8.7 million to $2.0 million planned for OE4. In contrast to the other three study states, Kentucky is dismantling its single integrated Medicaid and Marketplace system, kynect. The state will transition to Healthcare.gov for Marketplace eligibility determinations in OE4, and launched a new state-level system, called Benefind, to processes eligibility determinations for Medicaid and other assistance programs (see Box 1).

Box 1: Dismantling kynect in Kentucky

After taking office, Governor Matt Bevin began moving forward to transition Kentucky from its fully state-run Marketplace, kynect, to a federally-supported state-based Marketplace. As part of this transition, the state is dismantling the kynect eligibility system, which provided integrated eligibility determinations for Marketplace and Medicaid coverage. Beginning in OE4, the state plans to rely on Healthcare.gov for Marketplace eligibility determinations. In February 2016, the state launched a new Benefind eligibility system, which serves as the state online application and eligibility determination system for Medicaid and other programs, such as cash and food assistance.

Transitioning to Healthcare.gov. The Department of Health and Human Services (HHS) identified key milestones and requirements that Kentucky must meet to transition to Healthcare.gov.1  On June 1, the state met the initial test of its ability to communicate with Healthcare.gov.2  It has additional dates to determine connectivity and work through real cases leading up to the beginning of open enrollment in November. In addition, the state is responsible for developing a communication plan for the transition, although the details of this plan are not yet available.

Launch of Benefind. The state had planned Benefind prior to the decision to dismantle kynect. It originally intended for it to serve as an online multi-benefit application in addition to kynect. However, it now is the state’s sole online enrollment pathway to Medicaid. Stakeholders noted a range of challenges that emerged when the system launched. For example, the system incorrectly generated letters notifying individuals they were no longer eligible for services (Medicaid and other programs), enrollment assisters (called kynectors) had limited access to the system to help individuals, and there were long waits for call center help. In addition, lack of communication about the transition to Benefind led to confusion among the public. Stakeholders noted that the system was working better by early May, and they expected continued improvements.

Medicaid Enrollment and Renewal

Enrollment in Medicaid remained strong in the four states, with growth stabilizing during the OE3. Across the four study states, Medicaid enrollment has been successful, outpacing enrollment in the Marketplaces. All four states have experienced significant enrollment growth since initial implementation of the ACA (Table 2). Stakeholders noted that although enrollment growth continued during OE3, it leveled off compared to the prior two years since they had already enrolled so many of the eligible population. Stakeholders noted that those who have not yet enrolled are harder to reach and often need more assistance with the application and enrollment process. Two states have made or are planning to make changes to their Medicaid programs that will likely affect enrollment. Connecticut reduced parent eligibility from 205% to 155% of the federal poverty level in 2015. Many of these parents were able to maintain coverage through Transitional Medicaid Assistance (TMA); however, this TMA coverage ended on August 1, 2016. The state plans to help the nearly 18,000 parents affected by this change to transition to Marketplace coverage, but anticipates that some individuals may lose coverage when their TMA coverage ends. In Kentucky, Governor Bevin has submitted a request to the Centers for Medicare and Medicaid Services to alter the Medicaid expansion by charging premiums, among other changes that, if approved, could affect enrollment in future years.

Table 2: Medicaid and CHIP Enrollment
U.S.ColoradoConnecticutKentuckyWashington
Pre-ACA Average Monthly Medicaid/CHIP Enrollment56,392,477783,420704,387*606,8051,117,576
Total Monthly Medicaid/CHIP Enrollment as of June 201672,675,7261,356,251771,5121,225,8421,776,842
Percent Change in Enrollment27%73%10%102%59%
*Connecticut did not report pre-ACA Average Monthly Medicaid/CHIP Enrollment; data reported here are from March 2014.Source: Medicaid & CHIP Monthly Applications, Eligibility Determinations, and Enrollment Report: February 2014-June 2016 (preliminary), Centers for Medicare and Medicaid Services. Medicaid and CHIP Application, Eligibility Determination and Enrollment Data.

All four of the study states have implemented automated renewal processes in Medicaid that are generally working well. Stakeholders indicated that automated processes have improved the timeliness and processing of renewals. Overall, the share of renewals completed through automated processes ranged from 60% in Kentucky to 70-80% in Washington and Connecticut. In addition, officials in all four states estimated that about 90% of enrollees are successfully renewed. While renewals generally are working well, stakeholders referenced some remaining challenges. For example, officials in Washington noted that the majority of Medicaid renewals occur during the Marketplace open enrollment period, creating an additional burden for Medicaid, Marketplace, and call center staff, as well as the website during a period of high-volume enrollments. Stakeholders in Colorado noted that renewal letters are confusing for enrollees and system issues are leading to some individuals losing coverage even though they thought they had successfully renewed. The state is working to make the renewal notice more client friendly. In Connecticut, stakeholders reported the renewal process is generally working smoothly; however, when enrollees report changes to their information on file, staff must manually enter the changes into the legacy Medicaid system, which can lead to delays in completing the process. The launch of the new Medicaid system later this year should further streamline the renewal process.

You even have the option of clicking to verify that your income hasn’t changed and if it hasn’t changed, you just submit and it’s automatically applied.
Michael, Kentucky Medicaid enrollee

I feel like it was automatic because… I didn’t do anything. And they have all your information so I just know I got a new card.
Eva, Connecticut Medicaid enrollee

Marketplace Enrollment and Renewal

The study states had varying experiences in plan participation and premium increases in their Marketplaces going into OE3 (Table 3). Competition in the Marketplaces was strong, with robust plan participation; however, CO-OP plans in Kentucky and Colorado both exited the markets prior to OE3. The exit of the CO-OP in Kentucky had particularly significant effects because it was the lowest-cost plan and had about 50,000 people enrolled. Marketplaces in both states conducted outreach to individuals enrolled in the CO-OP plans to help them enroll in a new plan. In contrast, the Marketplaces in Connecticut and Washington were relatively stable, with no major plan exits. Stakeholders in Washington noted some small carriers left the market, but these exits did not cause major disruptions for consumers. Average premium increases for QHPs in the four states also varied. In each state, the percent change in the premium for the silver benchmark plan in the largest city ranged from an increase of 32% in Denver to a decrease of 11% in Seattle. In Colorado, there remains significant geographic variation in price points, with very high prices in resort areas.

Table 3: Marketplace Changes between 2015 and 2016
ColoradoConnecticutKentuckyWashington
Carriers
Number of Carriers in Marketplace, 2016814273114
Net Change in Number of Carriers in Marketplace, 2015-2016-20+2+1
Status of state CO-OPClosedWill close in 2017ClosedN/A
Percent Change in Monthly Benchmark Silver Plan Premium 2015-2016
Before tax credit232.2%-1.2%7.1%-10.6%
After tax credit2-1.0%-1.0%-1.0%-1.0%
Note: The percent change in monthly premium rates are associated with the second-lowest cost (“benchmark”) Silver Marketplace plans in major cities in the 50 states and the District of Columbia, for a 40 year old non-smoker making $30,000/year.Sources: 1 Overlap Between Medicaid Health Plans and QHPs in the Marketplaces: An Examination, Association for Community Affiliated Plans and 2015-2016 Open Enrollment Report By the Numbers, Connect for Health Colorado.2 Kaiser Family Foundation, Analysis of 2016 Premium Changes and Insurer Participation in the Affordable Care Act’s Health Insurance Marketplaces.3Plans offered on kynect in 2015 and Plans offered on kynect in 2016, Kentucky Health Benefit Exchange.4 Qualified Health Plans for Children and Families, 2015 and 2016, Washington Health Benefit Exchange.

Marketplace enrollment increased in three of the study states during OE3. In Colorado, Connecticut, and Washington, Marketplace enrollment grew (Table 4). In Connecticut, stakeholders noted that 20,000 new enrollees signed up for Marketplace coverage, which was a nearly 20% increase over OE2. Officials in Washington reported that, after not meeting Marketplace enrollment targets in OE2, enrollment rebounded in OE3 and it met enrollment goals. Stakeholders in Colorado also reported strong Marketplace enrollment in OE3. They noted that 48% were new enrollees in OE3, which was the highest share of new enrollees among all states. In contrast, Marketplace enrollment in Kentucky was nearly unchanged compared to OE2 and only 9% higher than enrollment as of December 2015. Stakeholders cited a number of possible reasons for the leveling off of enrollment, including confusion over whether coverage through kynect remained available following the Governor’s election, as well as some problems with the renewal process.

Table 4: Marketplace Enrollment Data
ColoradoConnecticutKentuckyWashington
Marketplace Enrollment (as of February 1, 2016)
Total Enrollment150,769116,01993,666200,691
  % change since March 201523%18%1%26%
  % change since December 201546%38%9%39%
  As share of potential Marketplace population31%40%38%35%
New vs. Re-enrolling Consumers
  New consumers48%32%20%37%
  Re-enrolled consumers52%68%80%63%
Share actively renewing77%19%74%38%
Share auto renewing25%81%28%62%
Financial Assistance
Total receiving financial assistance91,96990,49562,756140,484
  Share of enrollees receiving financial assistance61%78%67%70%
Sources: March 31, 2015 Effectuated Enrollment and Financial Assistance by State, December 31, 2015 Effectuated Enrollment Snapshot, and March 11, 2016 Final Enrollment Report, Centers for Medicare and Medicaid Services and Kaiser analysis. Data on New vs. Re-enrolling Consumers reflect individuals who had selected or reenrolled in a 2016 plan but may not have paid the first month’s premium. Office of the Assistant Secretary for Planning and Evaluation.

[The renewal process] was very easy. We kept the same Silver level and everything and I don’t even remember going online.  I think it was one of these things like just sign this if you want to keep everything the same or whatever.
Lucinda, Connecticut Marketplace enrollee 

My plan…wasn’t renewed, so I had to change and they had…very similar options, but honestly that was the most confusing thing. I’m like ‘this is basically exactly what I had,’…but they called it something else.
Elisa, Colorado Marketplace enrollee

Marketplace renewal generally went smoothly in the study states, but changes in QHP availability created confusion for consumers. Stakeholders reported that consumers had greater familiarity with the renewal process, which contributed to a more positive consumer experience. While some focus group participants reported the renewal process was seamless and straightforward, others expressed frustration that their plans were no longer available, forcing them to find a new plan. The need to change plans occurred in both states where insurers exited the market and in states where insurer participation did not change. In Kentucky, there were some challenges with passive renewals. When individuals initially enrolled in kynect, they had the option to choose only one year of auto-enrollment. Many individuals who selected this option and who auto-renewed last year were not aware that they needed to take action to complete enrollment during OE3, which may have led to some people losing coverage.

Despite gains in Marketplace enrollment, affordability of coverage remained an enrollment barrier. In some cases, individuals lack information about the availability of subsidies, but in other cases, the premiums and cost-sharing are still unaffordable for individuals even when the subsidies are applied. Marketplace focus group participants in Kentucky, Washington, and Connecticut said their premiums were manageable but expensive, and the cost put more pressure on their household finances. Some participants reported missing payments and others worried about being able to keep up with their payments. Participants in Colorado generally reported their premiums were affordable. However, stakeholders in Colorado noted that premiums in some geographic areas, such as the resort towns, remain very high.

It’s manageable.  For three people I can’t really complain.
Amy, Connecticut Marketplace enrollee 

I’ve definitely made lifestyles choices in the last year, like I don’t have a car anymore…I’ve made adjustments so I can afford insurance.
Roniq, Washington Marketplace enrollee

Marketplace officials in Colorado, Connecticut, and Washington expressed concern about the affordability of coverage and indicated they were exploring strategies to provide consumers with more information on costs, including building on the decision support tools they had developed. In Kentucky, stakeholders noted that plans were more affordable for people who qualified for cost-sharing reductions and worried about the long-term affordability of plans for those who do not qualify for subsidies.

I feel like what I’m paying for isn’t that affordable considering I still have to pay a lot if I do go to the doctor or anything like that happens.
-Jessica, Kentucky Marketplace enrollee

Deductibles and other out-of-pocket costs also pose challenges for many Marketplace enrollees. While most Marketplace focus group participants appreciated having coverage, those with high deductible plans worried about what would happen if they experienced a major medical need. Respondents who qualified for cost-sharing reductions did not appear to be facing affordability challenges, but those with income just over the threshold for this assistance reported significant challenges. Stakeholders in Connecticut noted that about 12% of individuals who would qualify for cost-sharing reductions by enrolling in Silver plans have instead enrolled in Bronze plans, leading them to face greater out-of-pocket costs for care. Similarly, stakeholders in Colorado and Washington were concerned that many consumers were enrolling in Bronze plans to minimize premium costs, but would have difficulty affording their deductible and out-of-pocket costs.

Coverage Transitions

While no major problems were identified with people moving from Marketplace to Medicaid coverage, stakeholders noted that some people losing Medicaid may not be transitioning to Marketplace coverage. In Colorado, stakeholders indicated that there is a lack of awareness among individuals about the availability of Marketplace coverage and subsidies that may be contributing to gaps in coverage after individuals lose Medicaid eligibility. To try to address this issue, Connect for Health Colorado officials are targeting outreach on those who receive a Medicaid denial notice, are eligible for subsidies in the Marketplace, but fail to enroll. Stakeholders in the study states also indicated that there may be gaps in coverage for people moving from Medicaid to Marketplace because of the requirement to select a QHP within a certain period of time. Officials in Washington noted that systems changes implemented following OE3 have created a more seamless process that allows consumers losing Medicaid coverage to select a QHP after the 23rd of the month to avoid a gap in coverage.

Outreach, Marketing, and Consumer Assistance

Consumer Awareness

Across the study states, stakeholders agreed that consumer awareness of ACA coverage options has improved compared to prior years, but that gaps in knowledge about availability of financial assistance in the Marketplaces persist. Stakeholders indicated that, overall, individuals have much better understanding of coverage options as well as enrollment and renewal requirements and processes than they did in OE1 and OE2. However, there remain some gaps in knowledge about the availability of Marketplace coverage and subsidies, particularly among the lower-income population covered by Medicaid. Stakeholders in Connecticut and Washington noted that consumers need education on the availability of cost-sharing reductions and the differences between Silver and Bronze plans. Stakeholders in all states also pointed to continued needs to improve health insurance literacy among individuals enrolling in coverage by providing education about what their insurance covers and how to use it. Particularly for Marketplace consumers, assisters in Washington emphasized the importance of helping clients understand what deductibles are and how they work. In Kentucky, in addition to helping clients select a Marketplace plan or a Medicaid managed care plan, assisters reported encouraging individuals to use primary care providers in lieu of relying on the hospital emergency department when they seek care.

Outreach and Marketing

Consistent with previous years, the study states employed a wide range of local level outreach and enrollment strategies. Stakeholders in all four study states emphasized the importance of ongoing outreach to maintain and grow enrollment in coverage. In OE3, they utilized activities that built on successful strategies in year one and two and relied on community partnerships through libraries, churches, and schools. Stakeholders in Washington noted that assisters were often available at community locations and community events, such as health fairs, to provide outreach and education. In Connecticut, officials from AccessHealthCT met with community leaders across the state to engage their support in conducting outreach to eligible consumers. Assisters and Marketplaces also deployed targeted efforts to reach specific populations, including immigrants, people of color, and the LGBT community. In Washington, assisters worked with county court systems to provide outreach and enrollment assistance to inmates being released from jail. The state Department of Corrections is now looking to adopt a similar approach statewide. Kentucky also has similar efforts underway, which began in year two and continued in OE3.

I was walking through the mall and I saw the little booth and…it didn’t look too busy so I stopped in and I said how long does this take, and they said about 30 minutes…It was real smooth when I went with them.
-Adam, Kentucky Marketplace enrollee

In Kentucky, enrollment storefronts placed in the community continued to be highly successful in OE3. Following successful efforts in previous years, Kentucky offered two enrollment storefronts during OE3, which had high visibility. Focus group participants in Kentucky were aware of the storefronts and several reported using them to get help applying for coverage. Assisters, known as kynectors, and other stakeholders noted that the enrollment storefronts provide the opportunity to have key enrollment staff co-located in one place to assist with complex cases. Stakeholders in Washington indicated the Marketplace is considering establishing storefronts in five counties for OE4 as a way to improve convenience for consumers and increase visibility of coverage options. Colorado only had one storefront available during OE3. While the storefront was successful, stakeholders did not view it as such a significant driver of enrollment compared to Kentucky.

Funding decreases led to some reductions in mass media campaigns. For example, Colorado and Washington shifted away from television advertising toward digital marketing. Stakeholders in Colorado noted there were more limited media buys for cable television during OE3. Washington did not run any television ads, and radio ads were limited to mostly Spanish-language radio. Stakeholders in Kentucky reported that a longstanding marketing contract ended in December and the state did not put any additional marketing efforts in place. They suggested that the absence of a marketing campaign added to public confusion regarding the Governor’s decision to dismantle kynect and uncertainty about whether coverage remained available. In contrast, AccessHealthCT continued its mass media campaign to continue building the brand and to drive enrollment in QHPs. Stakeholders indicated that a renegotiation of the marketing contracts for OE3 provided the same marketing push for less money.

Consumer Assistance

As in previous years, navigators, certified application assisters (CACs), CHCs, and agents and brokers all provided application and enrollment assistance to consumers. Most of the individuals and programs providing assistance in OE3 had provided assistance in prior years. Stakeholders in Colorado and Washington reported that this previous experience coupled with improved systems enabled assisters to devote more time to outreach and helping people understand how to use their coverage and the scope of their benefits. Assisters also assumed a larger role in addressing post-enrollment problems and tax-related issues. Brokers continue to play a significant role in the study states. In Colorado and Kentucky, brokers account for 50% of assisted enrollments. Focus group participants in Colorado who relied on brokers were generally satisfied with the assistance they received. However, some stakeholders remain concerned about whether brokers receive adequate training on coverage options. AccessHealthCT also relies heavily on brokers to provide enrollment assistance, but there are concerns that reductions in commissions paid for Marketplace plans will limit broker willingness to continue this role in the future.

Increased emphasis on finding and enrolling consumers into QHPs led to restructuring of assister networks. In Colorado, Connecticut, and Washington, assisters faced tensions between the goal of maximizing coverage regardless of coverage type and the Marketplaces’ emphasis on boosting QHP enrollment. To increase QHP enrollment, Washington Healthplanfinder restructured the Lead Organization (navigator) contracts, making full funding contingent on meeting separate Medicaid and QHP enrollment targets. While Healthplanfinder met overall QHP enrollment goals, this change led to some turnover among assister programs, including three Lead Organizations that did not renew their contracts, and restructuring of assister networks. In Colorado, stakeholders noted a lack of coordination between Health Coverage Guides responsible for helping consumers enroll in QHPs and assisters who help consumers enroll in Medicaid. Funding cuts have also contributed to restructuring of assister networks in Colorado and Connecticut. Unlike the other states, Connecticut eliminated its year-round in-person assister program following OE1 and transitioned some assisters to CACs. Its navigator program now consists of temporary workers hired during the open enrollment period who provide enrollment assistance in libraries and other locations. A new emphasis on expanding Marketplace enrollment, plus the need to assist the nearly 18,000 parents losing transitional Medicaid coverage, has renewed discussions in the state over whether or how to restructure the program.

In Kentucky, there is uncertainty about the future role and funding for kynectors. Kynectors continued providing outreach and enrollment assistance during OE3. However, when the Benefind Medicaid portal launched in February, kynectors were initially unable to assist clients who received termination notices or who needed to renew their coverage. Only state Medicaid eligibility workers could resolve these problems through the new system. Since then, the state has provided kynectors access to Benefind, and they can now assist their clients with the entire application or renewal process. Stakeholders noted that the kynector contracts have been extended through October 31st; however, contracts and funding for OE4 remain uncertain.

While stakeholders noted improvements in call center wait times and ability to respond to consumer needs, problems with capacity and staff capability remain. As systems have improved in the study states, the number of calls to call centers have dropped. In addition, states have adjusted call center capacity to meet anticipated demand. As a result, stakeholders noted that call center wait times during OE3 were shorter compared to prior years. However, stakeholders reported that there were still long waits during peak times, and there remain concerns about the quality of assistance provided through the centers. For example, in Washington, some focus group participants reported that the staff did not provide adequate answers to their questions. Similarly, stakeholders in Connecticut felt the call center training was not adequate, leaving the staff unable to handle complicated cases. AccessHealthCT negotiated a contract with a new vendor to run the call center that will reduce costs by 40-60%. Officials at Connect for Health CO expressed concern over long wait times and indicated that the state is examining how to improve call center capacity through contracting arrangements. In Kentucky, with the confusion around kynect and Benefind, the call center experienced increased call volume, and stakeholders reported that there were long wait times and limited capacity to deal with the calls. As issues related to the transition to Benefind are addressed, the call volume is expected to decline.

Conclusion

As of the end of the third open enrollment period, states were continuing to make progress with implementing the ACA coverage expansions. In the four study states, eligibility systems were working well, and Medicaid and Marketplace enrollment continued to grow. Consumer awareness of available coverage options has improved as has their knowledge of how to navigate enrollment and renewal processes and where to go to get help. Outreach and consumer assistance in year three built on successful strategies from prior years and remained an important component of state efforts to find and enroll eligible individuals.

Looking ahead, with coverage gains established, three of the study states will continue to make improvements to their eligibility and enrollment systems. However, new leadership in Kentucky is moving to dismantle the integrated eligibility and enrollment platform, kynect, shift to separate portals for Medicaid and QHP enrollment, and possibly change the terms of the state’s Medicaid expansion.  It remains to be seen how these changes will affect health coverage rates overall. Affordability of Marketplace coverage remains a concern and state officials are exploring strategies to address costs and help consumers make informed health plan choices. Investments in outreach and consumer assistance efforts remain important, especially to find and enroll harder to reach populations. An increased focus on enrolling consumers into QHP coverage coupled with funding constraints may lead to further restructuring of navigator and other assister programs and may have implications for continued strong enrollment in Medicaid.

Methods

The findings in this brief are based on structured interviews with key stakeholders and focus groups with Medicaid and Marketplace enrollees conducted by the Kaiser Commission on Medicaid and the Uninsured and PerryUndem Research/Communications in four states, Colorado, Connecticut, Kentucky, and Washington, in May 2016. In total, we conducted 28 in-person and phone interviews with a range of stakeholders in each state, including Medicaid and Marketplace officials, consumer advocates, assisters, and hospital and community health center (CHC) representatives. Two focus groups were held in each state, one with individuals enrolled in Medicaid coverage and the other with individuals with income less than 300% of the federal poverty level ($35,640 for an individual in 2016) enrolled in coverage through the Marketplace. The focus groups were held in Denver, Colorado; Hartford, Connecticut; Lexington, Kentucky; and Seattle, Washington. Each focus group consisted of 8 participants with a total of 64 participants, including 32 enrolled in Medicaid and 32 enrolled in Marketplace coverage. Focus group participants were selected to provide a mix of demographic characteristics, including age, race/ethnicity, and health status. Most individuals had used services since obtaining their current coverage.

The authors gratefully acknowledge Michael Perry, Sean Dryden, and Naomi Mulligan Kolb with PerryUndem Research/Communication for their work managing the fieldwork logistics, conducting the interviews, and moderating the focus groups. They also extend their deep appreciation to all the participants for sharing their perspectives and experiences to inform this project.

Endnotes

  1. Letter from Kevin Counihan, CEO, Health Insurance Marketplace to Vickie Yates Brown Glisson, Secretary, Kentucky Cabinet for Health and Family Services, dated 3.25.16. ↩︎
  2. Ryland Barton, Bevin Administration: Progress Made in Dismantling Kynect, WFPL 89.3, May 30, 2016, http://wfpl.org/bevin-administration-progress-made-dismantling-kynect/ ↩︎
News Release

Few People Switch Medicare Advantage Plans Each Year, Raising Questions About Whether Seniors Have the Tools and Information They Need To Compare Plans  

Published: Sep 20, 2016

A small share of Medicare Advantage enrollees switch plans each year, but those who do tend to pick plans with lower premiums and out-of-pocket limits than the plans they left behind, according to a new analysis by the Kaiser Family Foundation.

Eleven percent of enrollees voluntarily switched from one Medicare Advantage plan to another between 2013 and 2014, the analysis finds, while another four percent were forced to change because their Medicare Advantage plan exited the marketplace. Looked at another way, roughly 8 in 10 enrollees stayed in the same plan from one year to the next – a share that has remained fairly steady since 2007.

exhibits_medicare-advantage-plan-switching-exception-or-norm_tff

The relatively small share of Medicare Advantage enrollees to change plans – what some policy experts call “stickiness” – mirrors earlier research about Medicare prescription drug plan enrollees. (In contrast, 43 percent of Affordable Care Act marketplace enrollees switched plans between 2015 and 2016.)

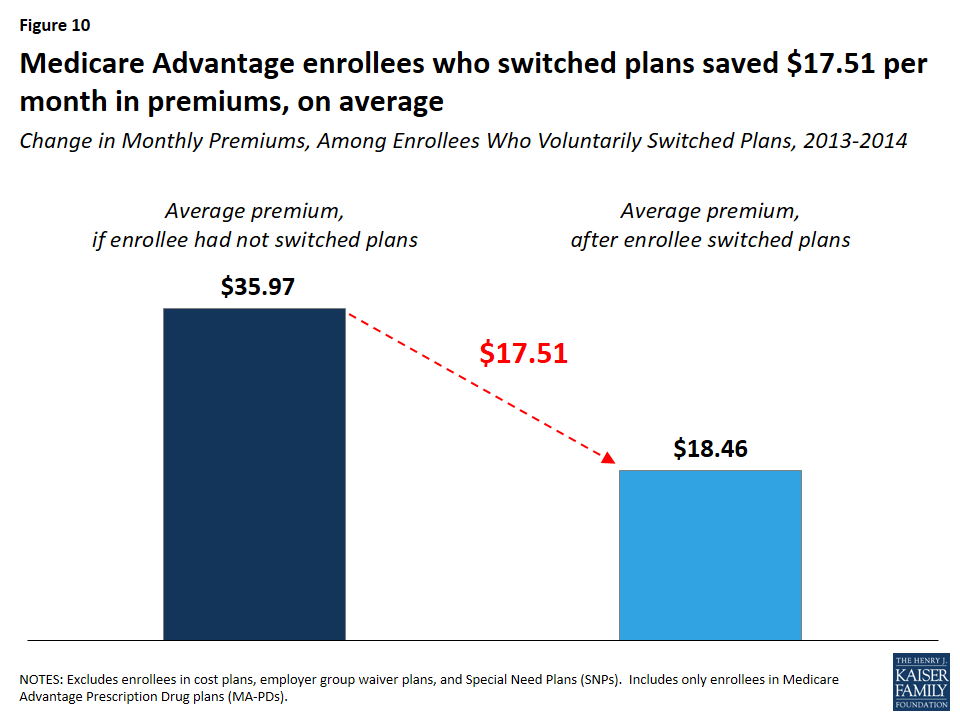
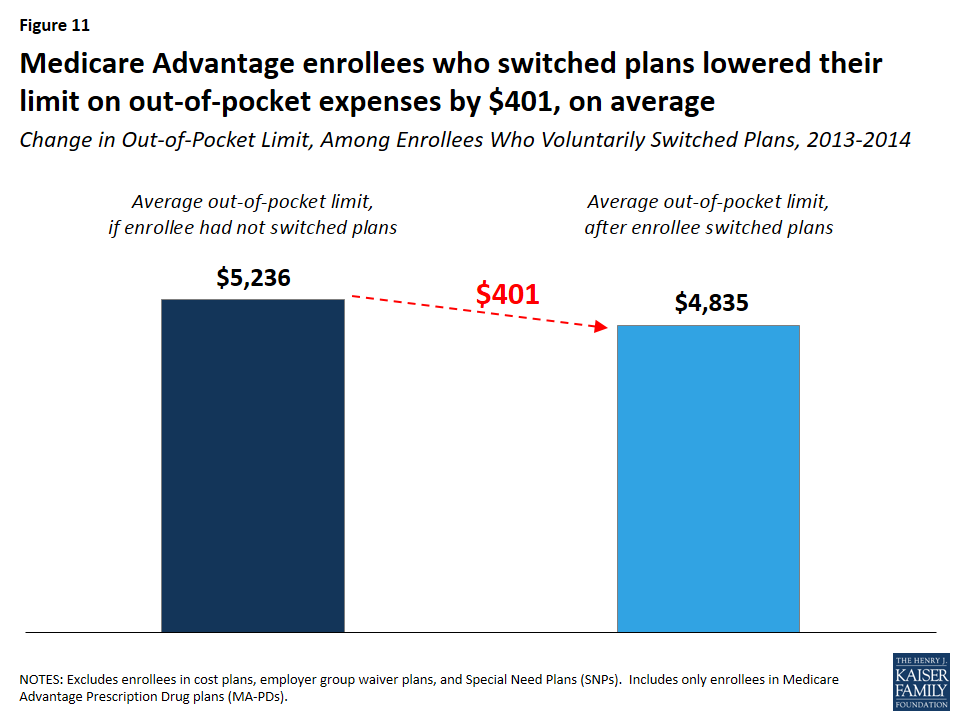
Medicare Advantage enrollees who switch plans reap some benefits by shifting to plans with lower average premiums ($17.51 per month lower, on average) and lower out-of-pocket limits ($401 lower, on average) than they would have paid had they remained in the same plan.

These findings and previous research underscore the importance of tools and support to help beneficiaries choose plans that are most likely to meet their individual needs. Efforts that aim to make it easier for Medicare beneficiaries to evaluate their options could possibly increase competition among plans and improve beneficiaries’ satisfaction with their coverage.

How Much Has Medicare Spent on the EpiPen Since 2007?

Authors: Juliette Cubanski, Tricia Neuman, and Anthony Damico
Published: Sep 20, 2016

Issue Brief

The latest example of high and rising prescription drug prices to attract significant media and public attention relates to the EpiPen, an auto-injector containing the drug epinephrine which is used to reverse the effects of severe allergic reactions. Since Mylan acquired the EpiPen from Merck in 2007, the company has increased the list price for a pack of two EpiPens nearly 550%, from $94 in January 2007 to $609 in May 2016.1  While the EpiPen can be a lifesaver for children with serious food allergies, it is also used to treat life-threatening allergic reactions experienced by the older adults and people with disabilities who are covered by Medicare. The EpiPen is covered under Medicare Part D, which provides outpatient prescription drug coverage to beneficiaries who enroll in private drug plans.

This data note examines the effects of rising EpiPen prices on Medicare and beneficiaries. Using data from a 5% sample of Medicare prescription drug event claims from the Centers for Medicare & Medicaid Services (CMS) Chronic Conditions Data Warehouse, we analyze EpiPen spending, in the aggregate and per user, in Medicare Part D between 2007 (the year after the drug benefit took effect, and the year Mylan acquired the product) and 2014 (the most recent year of data available). Our analysis is restricted to Medicare beneficiaries who had at least one month of Part D enrollment during the year and at least one prescription drug event with a brand name of EpiPen 2-pak, EpiPen Jr. 2-pak, EpiPen, or EpiPen Jr. during the year. The analysis is based on retail claims data that do not take into account manufacturer discounts (rebates) to plans, which ranged from an average of 9.6% of total Part D spending in 2007 to 14.3% in 2014, according to Medicare’s actuaries.2  Part D rebate information submitted to CMS is confidential3 ; therefore, no data on rebates for the EpiPen to Part D plans is publicly available.

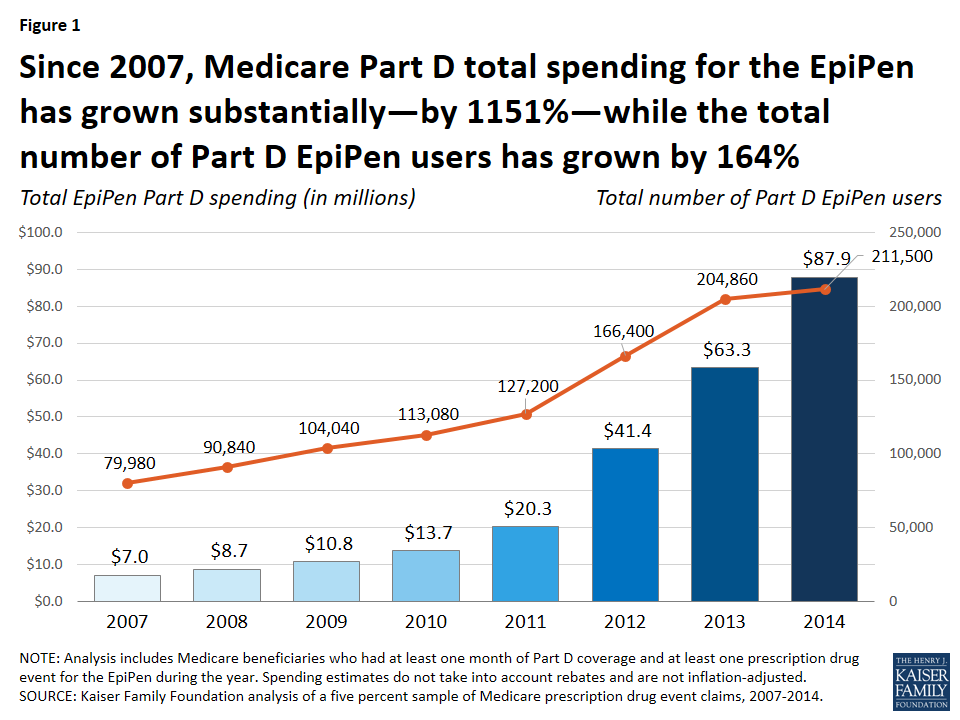
Total Medicare Part D spending on the EpiPen. According to our analysis, total Medicare Part D spending for the EpiPen increased from $7.0 million in 2007 to $87.9 million in 2014, an increase of 1151% (Figure 1).

Figure 1: Since 2007, Medicare Part D total spending for the EpiPen has grown substantially—by 1151%—while the total number of Part D EpiPen users has grown by 164%

While the total number of Part D enrollees using the EpiPen also increased over this time period—from nearly 80,000 users in 2007 to more than 211,000 in 2014—the increase was significantly lower in percentage terms (164%).

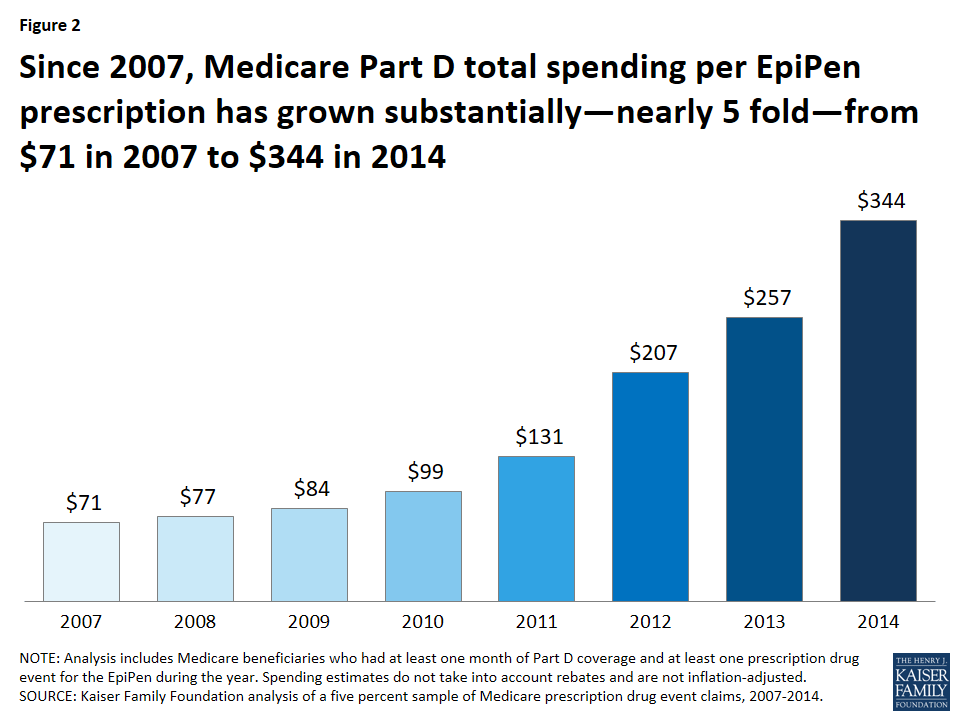
Over this same time period, average total Part D spending per EpiPen prescription increased nearly five-fold, from an average of $71 in 2007 to $344 in 2014 (a 383% increase) (Figure 2).

Figure 2: Since 2007, Medicare Part D total spending per EpiPen prescription has grown substantially—nearly 5 fold—from $71 in 2007 to $344 in 2014

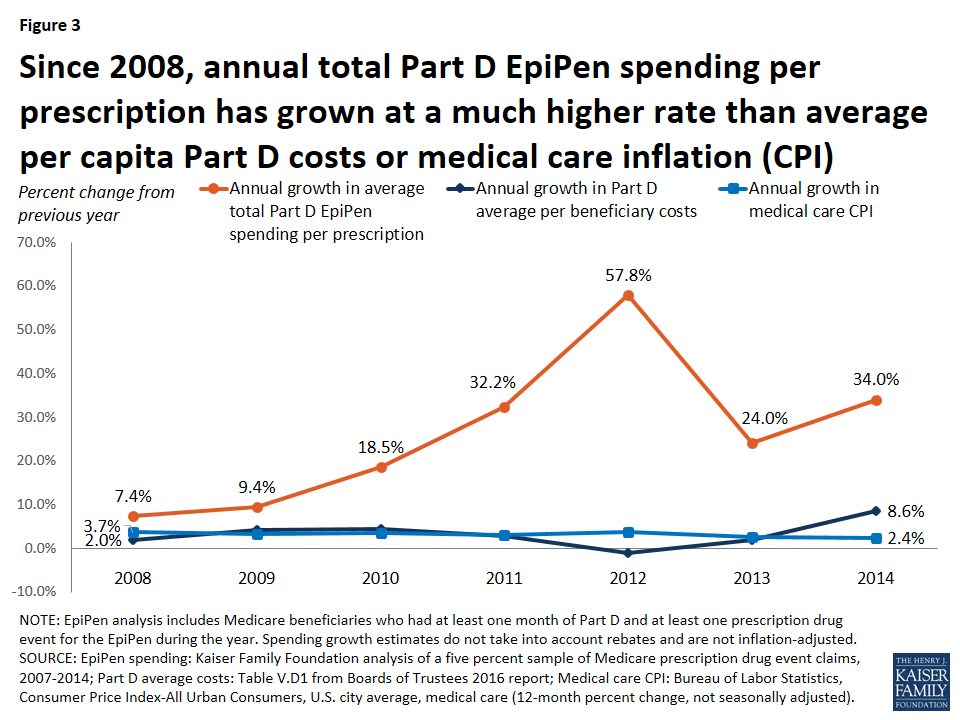
To put EpiPen spending increases in context, we compared annual growth in average total Part D spending per EpiPen prescription in each year from 2008 to 2014 to annual growth in average per capita costs for Part D overall and in medical price inflation (the Consumer Price Index, or CPI, for medical care). The annual rate of growth for total Part D EpiPen spending per prescription was significantly higher each year (Figure 3).

Figure 3: Since 2008, annual total Part D EpiPen spending per prescription has grown at a much higher rate than average per capita Part D costs or medical care inflation (CPI)

For example, in 2008, Part D spending per EpiPen prescription increased by 7.4%, more than 3.5 times greater than the increase in total Part D per capita spending (2.0%) and twice the rate of medical care price inflation (3.7%). In 2014, Part D spending per EpiPen prescription increased by 34.0%, four times the rate of increase in Part D per capita spending (8.6%) and 14 times larger than the 2.4% increase in medical care price inflation.

Out-of-pocket spending on the EpiPen by Medicare Part D enrollees. Since Medicare Part D plans cover a portion of enrollees’ total drug costs, beneficiaries in Part D plans pay less than the full retail cost of drugs covered by their plan, including the EpiPen. Still, average out-of-pocket spending by Part D enrollees for each EpiPen prescription nearly doubled between 2007 and 2014, from $30 to $56, among enrollees who do not receive Low-Income Subsidies (LIS) under Part D4  (Table 1). In the aggregate, out-of-pocket spending by all Part D enrollees who used the EpiPen increased more than five-fold between 2007 and 2014, from $1.6 million to $8.5 million, reflecting both an increase in the number of users and price increases for the EpiPen.

Table 1: Medicare Part D Spending for the EpiPen, 2007-2014
YearNumber of EpiPen usersNumber of EpiPen prescriptions1Total EpiPen spendingAverage total spending per EpiPen prescriptionTotal out-of-pocket spending on the EpiPenAverage out-of-pocket spending by non-LIS enrollees per EpiPen prescription 2
200779,98098,579$7,027,685$71$1,608,896$30
200890,840113,027$8,653,183$77$1,979,054$31
2009104,040128,624$10,769,049$84$2,543,034$36
2010113,080138,212$13,713,744$99$3,000,749$40
2011127,200154,460$20,264,292$131$3,685,566$42
2012166,400199,853$41,379,681$207$5,831,017$51
2013204,860246,725$63,342,313$257$7,504,229$51
2014211,500255,419$87,892,967$344$8,481,497$56
NOTE: LIS is Low-Income Subsidy. Analysis includes Medicare beneficiaries who had at least one month of Part D coverage and at least one prescription drug event for the EpiPen during the year. Total spending does not take into account rebates and is not inflation-adjusted. 1Standardized to a 30-day supply. 2Reflects out-of-pocket spending by Part D enrollees not receiving Low-Income Subsidies.SOURCE: Kaiser Family Foundation analysis of a 5% sample of Medicare prescription drug event claims, 2007-2014.

The impact of rising EpiPen prices since 2014. Because our analysis is based on data available only to 2014, our estimates do not reflect additional EpiPen price increases that have occurred since then. The list price of the EpiPen has increased (in nominal terms) from $349 in May 2014 to $609 in May 2016, a 74% increase. If total Part D spending per EpiPen prescription also increased by 74% between 2014 and 2016, Medicare Part D spending for the EpiPen would have increased from $344 per prescription in 2014 to $600 per prescription in 2016—more than an eight-fold increase since 2007.

Illustrating the potential effect of rebates. As noted above, Medicare does not disclose drug-specific rebates, and therefore we are unable to determine the extent to which our estimates of total Part D spending on the EpiPen might overstate actual plan costs for the EpiPen over this time period. To approximate the potential effect of rebates on total Part D spending, if we assume that all Part D plans had received for the EpiPen the average rebate reported by Medicare’s actuaries each year between 2007 and 2014, EpiPen spending would have increased from $6.4 million in 2007 (applying the 9.6% average rebate in 2007) to $75.3 million in 2014 (applying the 14.3% average rebate in 2014)—for an increase in total spending of nearly 1100%. This is similar to the 1151% increase based on total gross Medicare spending not accounting for rebates. In other words, even if total Part D spending for the EpiPen had been lower each year as a result of rebates, we might still expect to see a similar trend in the rate of Medicare Part D spending growth for the EpiPen, unless plans received significantly larger rebates over time. But it could also be the case that plans received relatively low rebates for the EpiPen, due to the lack of competition for this product—a situation that gives drug manufacturers less incentive to negotiate price discounts with insurers.

Implications. Although the total cost of the EpiPen to Medicare and beneficiaries may seem modest relative to the cost of more expensive specialty drugs and biologics, our analysis demonstrates that EpiPen price increases have translated into higher spending for Medicare Part D plans, enrollees, and the program overall. When drug manufacturers raise prices for their products and insurers’ costs increase as a result, these increases can translate into higher cost sharing and higher premiums for consumers. Rising prices for the EpiPen in recent years and the resulting significant increases in Medicare Part D spending illustrate why the cost of prescription drugs is an ongoing concern for consumers, public and private payers, and policy makers alike.

Juliette Cubanski and Tricia Neuman are with the Kaiser Family Foundation.Anthony Damico is an independent consultant.

Endnotes

  1. Dollars in nominal terms using the Bureau of Labor Statistics’ CPI inflation calculator, based on 2016 inflation-adjusted prices from Elsevier Gold Standard Drug Database; see Ike Swetlitz, “High price of EpiPen spurs consumers, EMTs to resort to syringes for allergic reactions,” STAT, July 6, 2016. ↩︎
  2. These estimates include rebates for both generics and brands; see Boards of Trustees, 2016 Annual Report of the Boards of Trustees of the Federal Hospital Insurance and Federal Supplementary Medical Insurance Trust Funds, Table IV.B8. ↩︎
  3. Social Security Act sections 1860D-2(d)(2) and 1927(b)(3)(D). ↩︎
  4. Part D Low-Income Subsidies provide additional financial assistance for enrollees with low incomes and modest assets, by paying some or all of plan premiums and reducing prescription drug cost-sharing amounts. ↩︎

Medicare Advantage Plan Switching: Exception or Norm?

Authors: Gretchen Jacobson, Tricia Neuman, and Anthony Damico
Published: Sep 20, 2016

Overview

Each year, Medicare Advantage enrollees have the opportunity to change plans during an annual enrollment period. This opportunity is important because Medicare Advantage plans can make changes in their benefits, cost-sharing, provider networks, and premiums each year, and beneficiaries’ health needs may change from one year to the next. The open enrollment period allows enrollees to compare plans, stick with their current plan, switch to another plan, or shift to traditional Medicare. It is also the time when beneficiaries in traditional Medicare can switch to Medicare Advantage plans.

Little is known about the extent to which Medicare Advantage enrollees change plans during the annual open enrollment period. Prior research shows that roughly the same share of beneficiaries, 5 percent, shift between Medicare Advantage and traditional Medicare each year,1  that most enrollees tend to stay in a Medicare Advantage plan once in Medicare Advantage,2  and that switching rates from Medicare Advantage to traditional Medicare are higher among high-need, high-cost patients.3 ,4 

This analysis focuses on enrollees in Medicare Advantage plans with prescription drug coverage (MA-PDs) who change plans when given the opportunity. It also analyzes the variation in the rate of plan switching by enrollee and plan characteristics and whether people who voluntarily switch plans tend to move to plans with lower premiums, lower out-of-pocket limits, or higher quality ratings. The analysis is based on a five percent sample of Medicare claims data merged with plan data from 2007 to 2014 (see Methods).

Issue Brief

Switching Rates

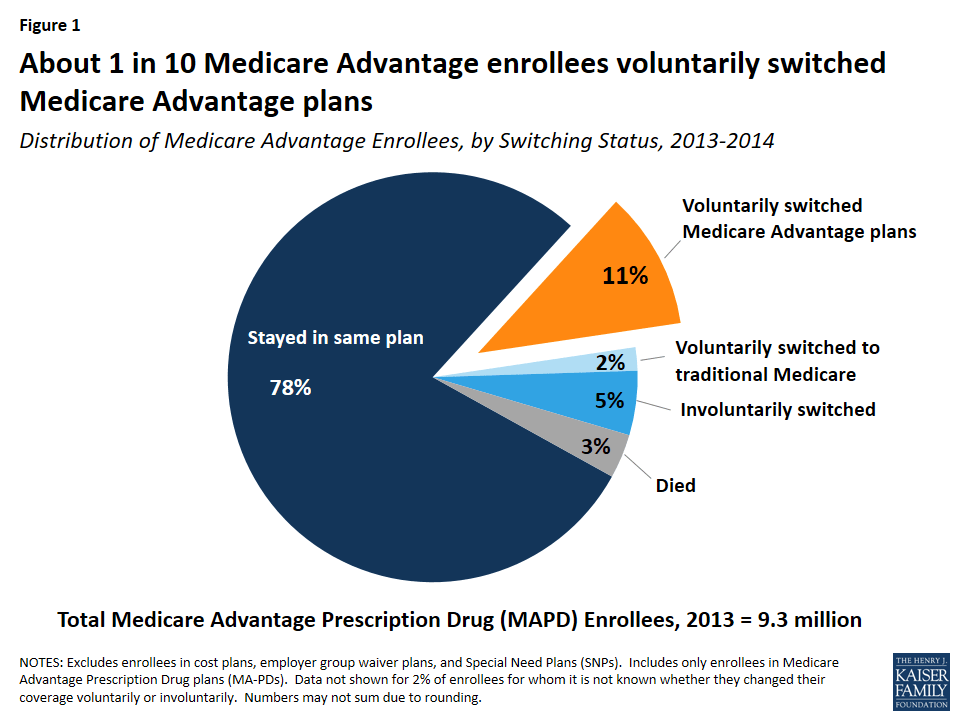
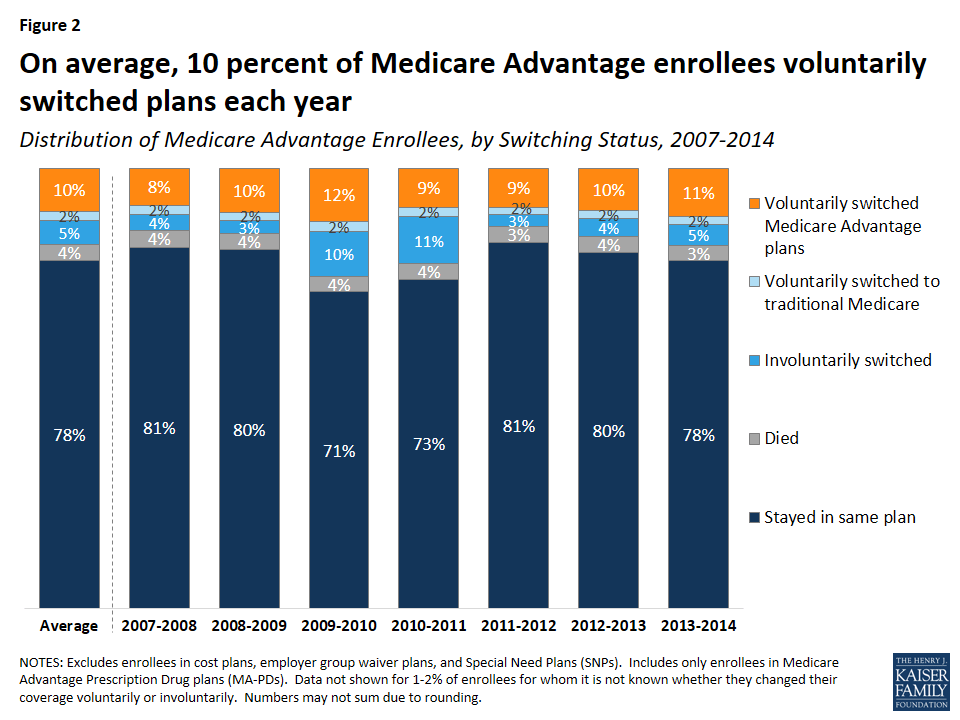
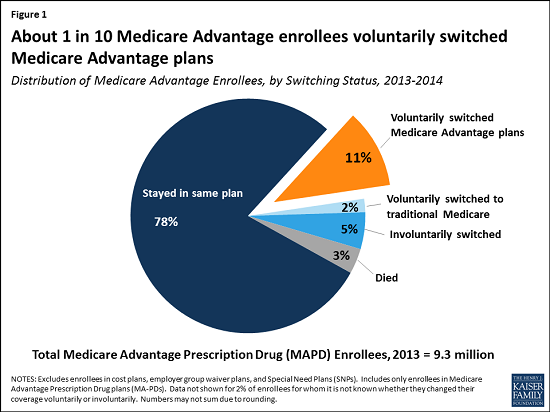
About one in ten Medicare Advantage plan enrollees (11 percent) in 2013 voluntarily switched to another plan in 2014 (Figure 1). Another two percent of enrollees voluntarily switched to traditional Medicare5  and another five percent were required to switch (involuntarily switched) plans because their plan exited the market.

Figure 1: About 1 in 10 Medicare Advantage enrollees voluntarily switched Medicare Advantage plans

Of the five percent of involuntary switchers, four percent switched to a different Medicare Advantage plan, and about one percent elected coverage under traditional Medicare. Another three percent of enrollees in 2013 died before the start of the 2014 calendar year. Overall, 78 percent of Medicare Advantage enrollees did not change their source of coverage between 2013 and 2014.

Switching Rates, by Year

The share of Medicare Advantage enrollees switching plans has been virtually the same each year between 2007 and 2013, averaging 9 percent annually (Figure 2). The relatively constant rate of voluntary plan switching is noteworthy given the number of changes in Medicare Advantage policies and payments implemented during this time frame, including the establishment of new network requirements for private fee-for-service (PFFS) plans enacted as part of the Medicare Improvements for Patients and Providers Act (MIPPA) and implemented in 2011, as well as the reductions in federal payments to plans enacted as part of the Affordable Care Act of 2010.

Figure 2: On average, 10 percent of Medicare Advantage enrollees voluntarily switched plans each year

Voluntary switching rates were slightly higher between 2009 and 2010 and between 2013 and 2014 than in other years. The slight increase between 2009 and 2010 may have been due to PFFS plans encouraging their enrollees to switch to another plan offered by their firm in anticipation of terminating their PFFS plans in 2011 due to new provider network requirements for PFFS plans.6  Involuntary switching rates were also higher between 2009 and 2011.

Switching Rates, By Firm

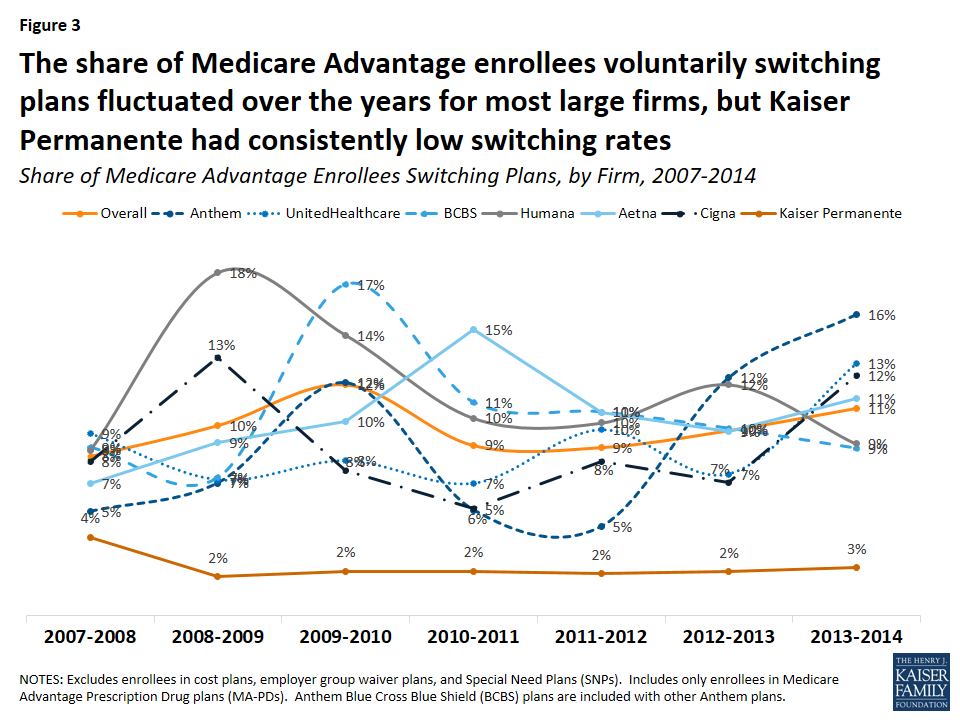
Switching rates among enrollees were not consistently higher or lower in one large firm compared to another, with the exception of plans offered by Kaiser Permanente, which had consistently low switching rates relative to all other firms (Figure 3). Switching rates by firm fluctuated over the years. Higher switching rates in some years may have been due to PFFS plans exiting markets, a larger share of people switching out of regional PPOs, or other firm-specific factors.

Figure 3: The share of Medicare Advantage enrollees voluntarily switching plans fluctuated over the years for most large firms, but Kaiser Permanente had consistently low switching rates

Between two percent and four percent of Kaiser Permanente enrollees switched Medicare Advantage plans between 2007 and 2014 – far lower than the overall average of ten percent. The low voluntary switching rate among enrollees in Kaiser Permanente plans could be partly due to its integrated delivery system, which would require enrollees to change doctors if they switched to a plan offered by another firm.

Comparison of Switching Rates Across Markets

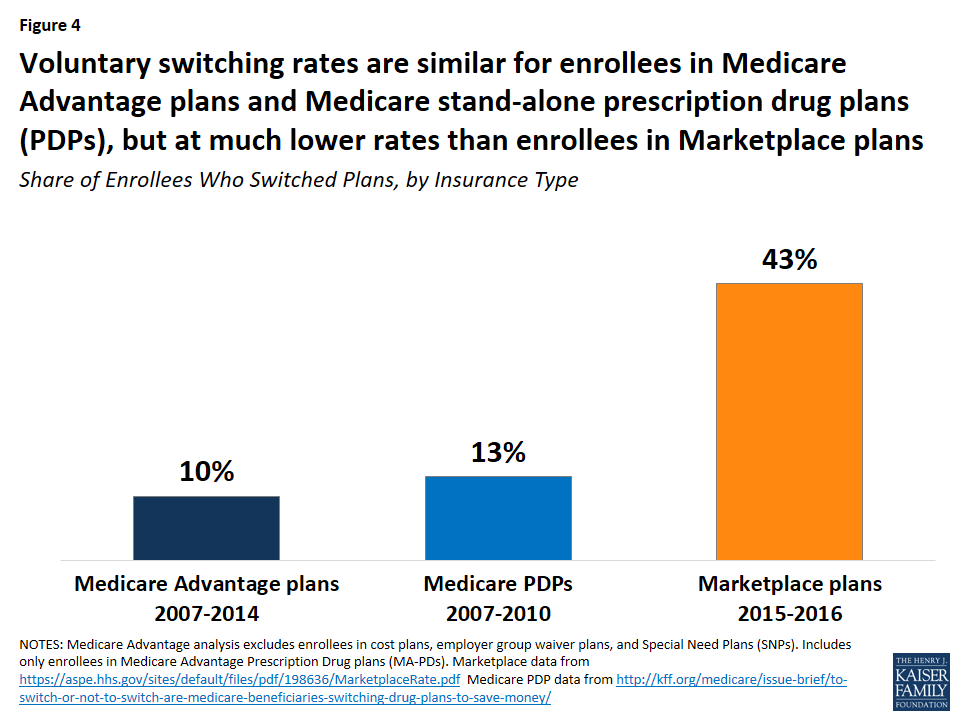
Medicare Advantage enrollees switch plans at similar rates as Medicare prescription drug plan (PDP) plan enrollees but at much lower rates than enrollees in ACA Marketplace plans (Figure 4). Between 2006 and 2010, 13 percent of Medicare PDP enrollees voluntarily switched plans (excluding enrollees receiving Low Income Subsidies),7  similar to the share of Medicare Advantage enrollees switching plans between 2007 and 2014. A much higher share of Marketplace enrollees – 43 percent – switched plans between 2015 and 2016.8  Even when all plan switchers, both voluntary and involuntary, are included, the rate (17 percent) is still much lower among Medicare Advantage than Marketplace enrollees.9 

Figure 4: Voluntary switching rates are similar for enrollees in Medicare Advantage plans and Medicare stand-alone prescription drug plans (PDPs), but at much lower rates than enrollees in Marketplace plans

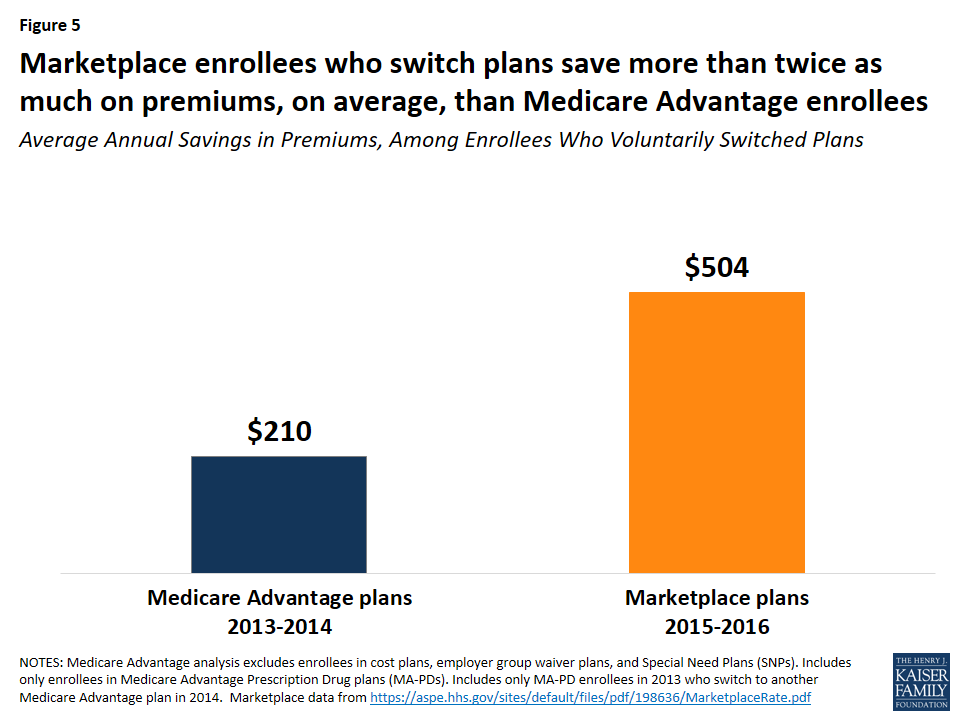
The lower switching rate among Medicare Advantage enrollees may be due to a number of factors. Marketplace enrollees save more in premiums when they switch plans than Medicare Advantage enrollees. Between 2015 and 2016, for example, Marketplace enrollees saved more than twice as much on annual premiums (saving $504 per year, on average) than Medicare Advantage enrollees saved by switching plans in 2014 (saving $210 per year, on average; Figure 5).10  Other factors influencing the difference in switching rates could include the anchoring of subsidies to the second lowest cost silver plan in the Marketplaces, more news coverage about the importance of switching Marketplace plans, greater volatility in premiums among the Marketplace plans, more technology savviness among younger Marketplace enrollees,11  and better tools available to help Marketplace enrollees shop for plans.

Figure 5: Marketplace enrollees who switch plans save more than twice as much on premiums, on average, than Medicare Advantage enrollees

Factors Associated with Voluntarily Switching Plans

Beneficiary Characteristics

Age

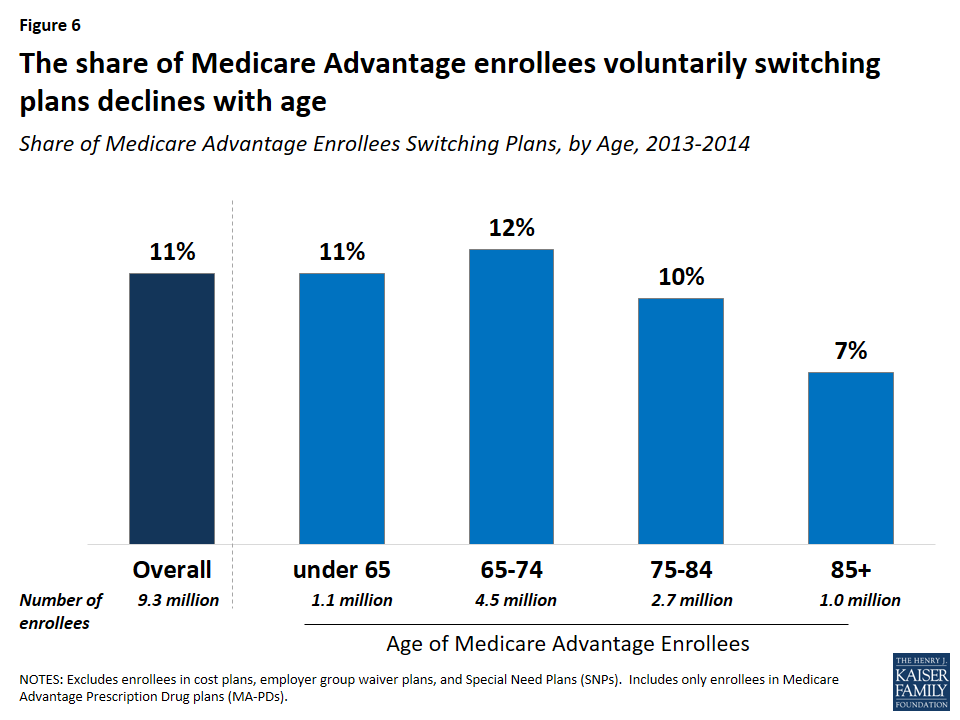
Switching rates among enrollees were somewhat higher among beneficiaries who were relatively young (ages 65 to 75). Plan switching declined with age, from 12 percent (ages 65-74) to 7 percent (ages 85 and older) between 2013 and 2014 (Figure 6).

Figure 6: The share of Medicare Advantage enrollees voluntarily switching plans declines with age
Dual Eligibles

A somewhat larger share of enrollees dually eligible for Medicare and Medicaid (13 percent) than other Medicare Advantage enrollees (10 percent) switched plans. One possible explanation for this is that dually eligible beneficiaries are permitted to switch plans at any time during the year, unlike other Medicare Advantage enrollees, while another possible explanation is that dually eligible beneficiaries feel their needs are not being met by their current plan. Other research has also noted that a larger share of dually eligible beneficiaries than other Medicare beneficiaries switch from Medicare Advantage to traditional Medicare.12 

Switching rates were lower among dual eligibles in Medicare Advantage Special Needs Plans (SNPs), which are for beneficiaries who are either dually eligible for Medicare and Medicaid, require an institutional level of care, or have specific chronic conditions. Between 2013 and 2014, about nine percent of dually eligible beneficiaries in SNPs switched to another Medicare Advantage plan compared to 13 percent of dual eligibles in non-SNP Medicare Advantage plans and 11 percent of all dual eligibles in Medicare Advantage plans.13 

Other Characteristics

Switching rates among Medicare Advantage enrollees did not vary by gender, nor were they consistently higher or lower than among enrollees in metropolitan or non-metropolitan areas.14  Due to data limitations, this analysis does not examine whether switching rates differed by enrollees’ health status, chronic conditions, or use of health care services.

Plan Characteristics

Premiums

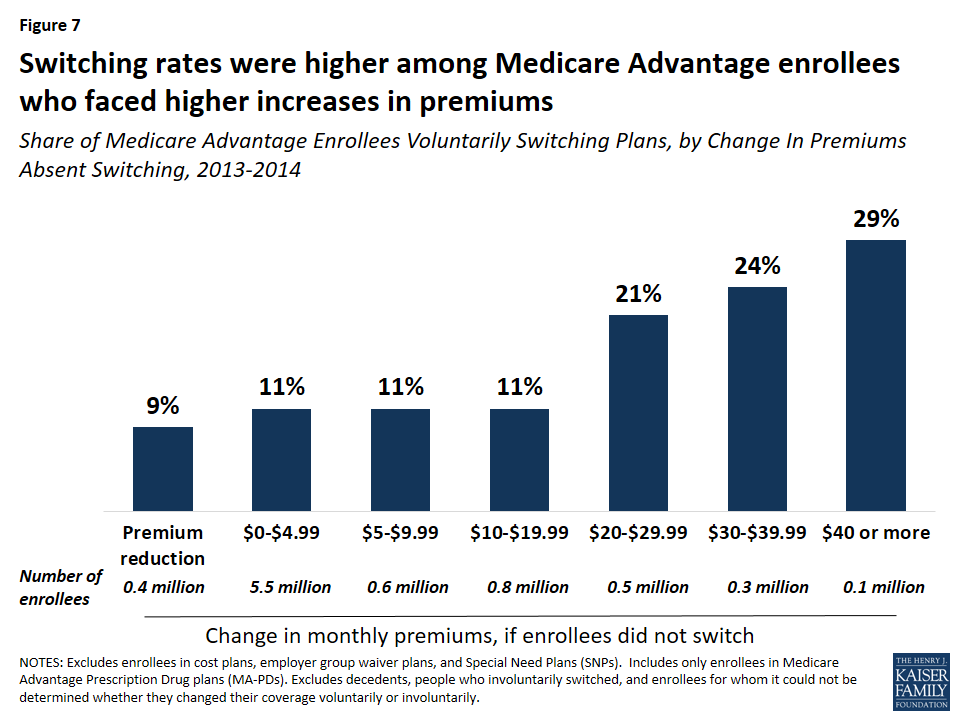
Switching rates were higher among Medicare Advantage enrollees who faced higher increases in premiums between 2013 and 2014. Among Medicare Advantage enrollees who faced a premium increase of less than $20, about 11 percent switched plans, but switching rates were much higher among enrollees who faced a premium increase of $20 or more and switching rates rose with premium increases (Figure 7). About one in five (21 percent) enrollees who faced a premium increase of $20 to $29 switched plans, one in four (24 percent)enrollees who faced a premium increase of $30 to $39 switched plans, and three in ten (29 percent) enrollees who faced a premium increase of $40 or more switched plans.15  Notably, nine percent of enrollees who faced a premium reduction switched plans – similar to the switching rates for enrollees with premium increases between $0 and $19.

Figure 7: Switching rates were higher among Medicare Advantage enrollees who faced higher increases in premiums

Most (79 percent) Medicare Advantage enrollees in 2013 faced premium increases of less than $10, which may have influenced their decision to stay in their plan. Conversely, 11 percent of Medicare Advantage enrollees faced premium increases of $20 or more, and more than 20 percent of these enrollees elected to change plans. As noted in more detail later, Medicare Advantage enrollees who switched plans tended to change to a plan with a lower premium, on average.

Quality Ratings

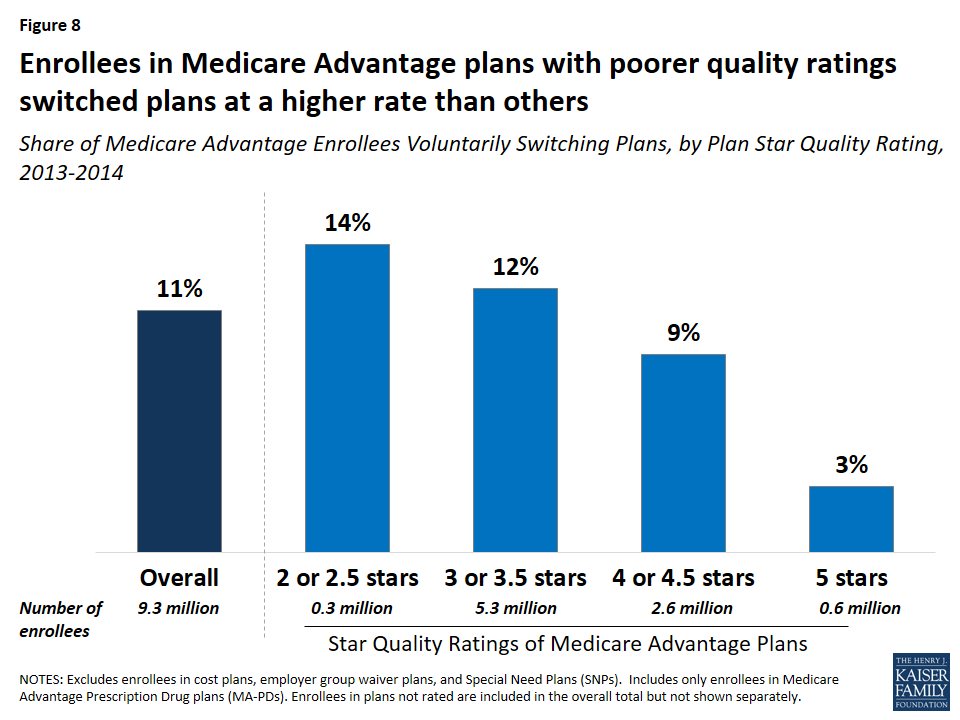
Medicare Advantage enrollees who voluntarily switched plans were disproportionately in plans with lower quality ratings. Between 2013 and 2014, one in seven (14 percent) enrollees in plans with 2 or 2.5 star quality ratings switched plans compared to one in ten (9 percent) enrollees in plans with 4 or 4.5 stars and only one in thirty (3 percent) enrollees in 5 star plans (Figure 8). These findings suggest that factors related to the star ratings may cause some beneficiaries to switch plans. However, as noted later, enrollees who switched plans ended up in a plan with only modestly higher quality ratings.

Figure 8: Enrollees in Medicare Advantage plans with poorer quality ratings switched plans at a higher rate than others

Plan Type

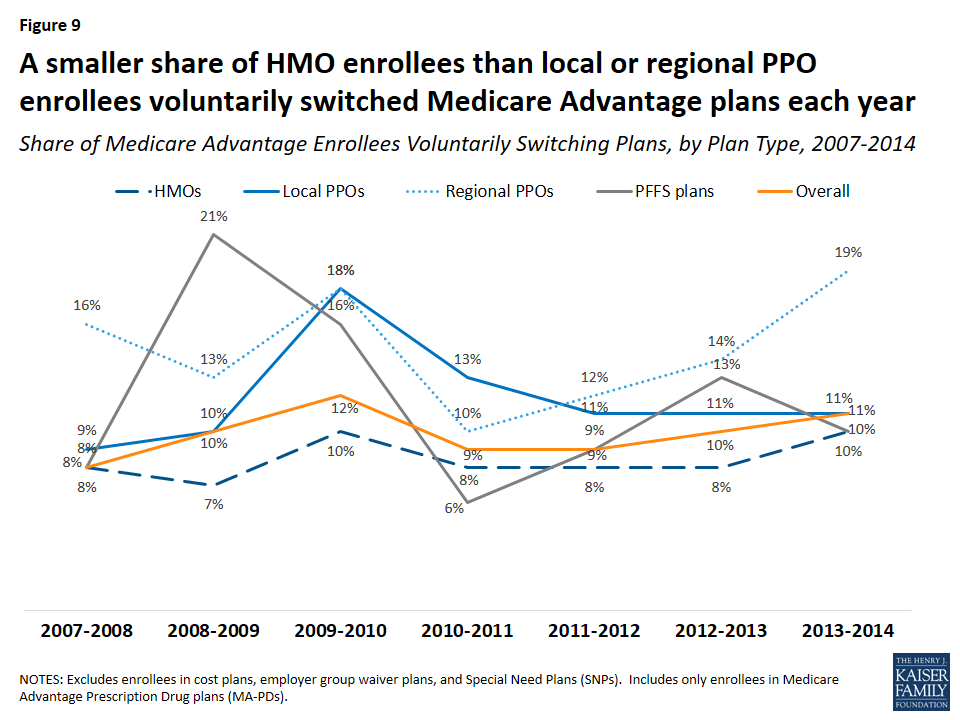
For most years between 2007 and 2014, a larger share of enrollees in regional PPOs than enrollees in other plan types voluntarily switched plans (Figure 9). In contrast, the switching rate was generally lowest among HMO enrollees.

Figure 9: A smaller share of HMO enrollees than local or regional PPO enrollees voluntarily switched Medicare Advantage plans each year

Age of Contract

Switching rates from enrollees in plans under relatively new contracts (beginning in 2006 or more recent) were higher than among enrollees in plans under older contracts. Between 2013 and 2014, nine percent of enrollees in contracts that began before 2000 switched plans compared to 15 percent of enrollees in contracts that began in 2006 or later. However, these differences are intertwined with the types of plans that were available in a given year. For example, regional PPOs, which have higher switching rates than other plan types, could not be offered prior to 2006. Similarly, most of the contracts prior to 2000 were for HMOs.

County Characteristics

Voluntary switching rates did not differ across the county characteristics that were examined, including the number of plans available or the Medicare Advantage payment quartile for the county.

Changes in Premiums, Out-of-Pocket Limits, Quality Ratings, Firms, and Plan Types

Premiums

Enrollees who switched plans saved $15.87 per month in premiums, on average. Enrollees who switched plans would have paid $35.97 per month in premiums, on average, had they stayed in the same plan, but instead paid $18.46 per month, on average, after switching to another plan, saving $17.51 per month, on average (Figure 10). In contrast, enrollees who stayed in the same plan paid $4.26 more per month in premiums, on average. As noted earlier, switching rates were higher among Medicare Advantage enrollees who faced higher premium increases, particularly among enrollees with monthly premium increases of $20 or more.

Figure 10: Medicare Advantage enrollees who switched plans saved $17.51 per month in premiums, on average

Out-Of-Pocket Limits

Enrollees who switched plans lowered their out-of-pocket limit by $401, on average (Figure 11). Medicare Advantage enrollees who switched plans between 2013 and 2014 would have seen their out-of-pocket spending limits rise by $728, from $4,508 to $5,236, on average, had they stayed in the same plan. By switching plans, enrollees got better catastrophic protection, with lower out-of-pocket spending limits ($4,835, on average), a difference of $401.

Figure 11: Medicare Advantage enrollees who switched plans lowered their limit on out-of-pocket expenses by $401, on average

Since 2011, all Medicare Advantage plans have been required to limit enrollees’ out-of-pocket expenses on Medicare Part A and B services to no more than $6,700 and are encouraged by the Centers for Medicare and Medicaid Services (CMS) to have limits of $3,400 or less.

Quality Ratings

Medicare Advantage enrollees who voluntarily switched plans changed to plans with slightly higher star ratings than their original plan, but the improvement was a modest 0.11 stars, on average. Between 2013 and 2014, Medicare Advantage enrollees who switched plans moved from a plan with 3.51 stars in 2014, on average, to a plan with 3.79 stars in 2014, on average –0.28 points higher than their prior plan. Had they stayed in the same plan, they would have seen their plan’s rating increase 0.17 points, on average, the same as the increase in quality ratings for enrollees who did not switch plans.

Firm and Plan Type

Among enrollees who voluntarily switched plans between 2013 and 2014, seven in 10 (71 percent) switched to a plan offered by a different firm (Table 1). Among enrollees who switched to a different firm, most chose a plan of the same type as their original plan. The fact that most people who switched plans moved to a plan offered by a different firm could be an indication that brand loyalty was not a strong factor in their plan choice.

Table 1: Share of Medicare Advantage Enrollees Switching Plans, by Differences in Firm and Plan Type
Same FirmDifferent FirmTotal
Same Plan Type18%44%62%
Different Plan Type11%27%38%
Total29%71%100%

Most (62 percent) Medicare Advantage enrollees who voluntarily switched plans changed to a plan of the same type as their original plan, even if from a different firm. Yet, most of the loyalty to plan type was among the HMO enrollees. The majority of HMO enrollees who switched plans shifted to another HMO (81 percent), while a majority of local PPO, regional PPO, and PFFS enrollees who switched plans changed to a different type of Medicare Advantage plan between 2013 and 2014.

Discussion

Relatively few Medicare Advantage enrollees, roughly one in ten, voluntarily switch from one MA-PD to another MA-PD each year, suggesting that plan switching among seniors is more the exception than norm. The takeaway from this analysis for beneficiaries is not entirely clear. On the one hand, our analysis shows some price sensitivity among Medicare Advantage enrollees: switching rates were higher among the minority of enrollees with relatively big premium increases. On the other hand, the findings confirm that the vast majority of enrollees do not change plans, and that plan “stickiness” may come at a cost, in terms of higher premiums and higher out-of-pocket spending limits.

Enrollees may be sticking with their plan for a number of reasons. They may be satisfied with their coverage. They may decide they would rather pay a bit more in premiums to avoid the hassle and time involved with making a change, particularly because most face a premium increase of less than $10 on average, in 2014. In focus groups, seniors have said that they appreciate the opportunity to change plans but often feel that the differences across plans are not important enough to warrant the time and effort it takes to compare and change plans.16  Some enrollees may place a higher value on other factors, such as having access to specific doctors or the comfort of sticking with a plan that is familiar. They may find that the information they need to compare plans is not readily available or that the process of comparing premiums, benefits, and provider networks across plans is too tedious.

For plans, the relatively high enrollee retention rate could strengthen incentives to keep their enrollees relatively healthy with low medical costs over the course of many years.  However, it could also send a signal to plans that the risk of losing enrollees to a competitor is low as long as they do not drastically increase enrollees’ costs or disrupt their care arrangements.

For policymakers, these findings underscore the importance of tools and other support to help beneficiaries choose plans that are most likely to meet their individual needs. For instance, the Medicare Plan Finder could be improved to allow beneficiaries to more easily compare provider networks, cost-sharing, and benefits. Additionally, support could be strengthened for counselors and others who help Medicare beneficiaries with these increasingly complex decisions. Efforts that aim to make it easier for Medicare beneficiaries to evaluate their options could increase competition among plans and improve beneficiaries’ satisfaction with their coverage. The fact that most Medicare Advantage enrollees are not changing plans may not be cause for concern, but it does raise questions about whether the Medicare Advantage market is working as well as it could for consumers, especially those who are relatively old or with significant health care needs.

Methods

This analysis focuses on enrollees in Medicare Advantage Prescription Drug plans (MA-PDs) who switched plans when they had the option of remaining in the same plan (voluntary switchers) rather than Medicare Advantage enrollees who had no choice but to switch because their plan exited the market (involuntary switchers) or beneficiaries who switched from Medicare Advantage to traditional Medicare. The brief uses claims data from a 5 percent sample of Medicare beneficiaries from the Master Beneficiary Summary Files of CMS’s Chronic Conditions Data Warehouse for 2007 through 2014, the latest year of data available. The data was used in conjunction with the Medicare Advantage landscape file, Medicare Advantage crosswalk file, and Medicare Advantage enrollment file for each year. Some plans that were in the claims data and the Medicare Advantage landscape file were not in the Medicare Advantage crosswalk file, thus it could not be determined for a small share of Medicare Advantage enrollees (1-2 percent, depending on the year) whether they switched plans voluntarily or were forced to switch plans because their plan withdrew from the market (involuntary switching). The analysis excluded 4.96 million Medicare Advantage enrollees in 2013 because they were in plans that are not available for general enrollment (employer group waiver plans, Special Needs Plans, and demonstrations), in plans that are structured differently from Medicare Advantage plans (cost plans), or in plans that did not offer prescription drug coverage and are not marketed for general enrollment.

Gretchen Jacobson and Tricia Neuman are with the Kaiser Family Foundation. Anthony Damico is an independent consultant.

The authors appreciate the helpful review and comments that Marsha Gold provided on this paper.

Endnotes

  1. Jacobson, Gretchen A., Patricia Neuman, and Anthony Damico, “At Least Half Of New Medicare Advantage Enrollees Had Switched From Traditional Medicare During 2006-11,” Health Affairs (Milwood), 34(1): 148-55, January 2015. ↩︎
  2. Riley, Gerald F., “Impact of Continued Biased Disenrollment from the Medicare Advantage Program to Fee-for-Service” Medicare & Medicaid Research Review 2(4): E1-E16, 2012. Available at: https://www.cms.gov/mmrr/Downloads/MMRR2012_002_04_A08.pdf. ↩︎
  3. McWilliams, J. Michael, John Hsu, and Joseph P. Newhouse. “New Risk-Adjustment System Was Associated with Reduced Favorable Selection in Medicare Advantage.” Health Affairs (Milwood) 31(12): 2630-2640, December 2012. Available at: http://content.healthaffairs.org/content/31/12/2630.full.pdf+html. ↩︎
  4. Newhouse, Joseph P., Mary Price, Jie Huang, J. Michael McWilliams, and John Hsu. “Steps to Reduce Favorable Risk Selection in Medicare Advantage Largely Succeeded, Boding Well for Health Insurance Exchanges.” Health Affairs (Milwood), 31(12): 2618-2628, December 2012. Available at: http://content.healthaffairs.org/content/31/12/2618.full.pdf+html. ↩︎
  5. A prior analysis found a higher rate of switching between Medicare Advantage and traditional Medicare. The rate is somewhat lower in this analysis because it excludes beneficiaries enrolled in Medicare Advantage plans that did not offer prescription drug coverage, employer group waiver plans, and Special Needs Plans (n=4.78 million beneficiaries in 2013). In total, 4.78 million beneficiaries who would have been included in the other analysis were excluded from this analysis for 2013. For the other analysis, see Jacobson, Gretchen A., Patricia Neuman, and Anthony Damico, “At Least Half Of New Medicare Advantage Enrollees Had Switched From Traditional Medicare During 2006-11,” Health Affairs (Milwood), 34(1): 148-55, January 2015. ↩︎
  6. For more information about the change in plans available between 2009 and 2010, see Gold, Marsha, Dawn Phelps, Gretchen Jacobson, and Tricia Neuman. “Medicare Advantage 2010 Data Spotlight: Plan Enrollment Patterns and Trends.” Kaiser Family Foundation, June 2010. Available at: https://modern.kff.org/medicare/issue-brief/medicare-advantage-2010-data-spotlight-plan-enrollment/. ↩︎
  7. Hoadley, Jack, Elizabeth Hargrave, Laura Summer, Juliette Cubanski, and Tricia Neuman. “To Switch or Not to Switch: Are Medicare Beneficiaries Switching Drug Plans To Save Money?” Kaiser Family Foundation, October 2013. Available at: https://modern.kff.org/medicare/issue-brief/to-switch-or-not-to-switch-are-medicare-beneficiaries-switching-drug-plans-to-save-money/. ↩︎
  8. Office of the Assistant Secretary for Planning and Evaluation. “Health Insurance Marketplace Premiums After Shopping, Switching and Premium Tax Credits, 2015-2016.” ASPE Issue Brief, April 2016. Available at: https://aspe.hhs.gov/sites/default/files/pdf/198636/MarketplaceRate.pdf. ↩︎
  9. The rates of plan switching in the Federal Employees Health Benefits (FEHB) Program was 12 percent between 2000 and 2001. See Atherly, Adam, Curtis Florence, and Kenneth E. Thorpe. “Health Plan Switching Among Members of the Federal Employees Health Benefits Program.” Inquiry, 42: 255-265, Fall 2005. Available at: http://inq.sagepub.com/content/42/3/255.full.pdf. Approximately 6 percent of CalPERS members switched health plans between 2014 and 2015, which was higher than previous years. See CalPERS Pension and Health Benefits Committee. “Health Open Enrollment Results.” February 18, 2015. Available at: https://www.calpers.ca.gov/docs/board-agendas/201502/pension/item-10.pdf. ↩︎
  10. Office of the Assistant Secretary for Planning and Evaluation. “Health Insurance Marketplace Premiums After Shopping, Switching and Premium Tax Credits, 2015-2016.” ASPE Issue Brief, April 2016. Available at: https://aspe.hhs.gov/sites/default/files/pdf/198636/MarketplaceRate.pdf. ↩︎
  11. Levine, David M., Stuart R. Lipsitz, and Jeffrey A. Linder. “Trends in Seniors’ Use of Digital Health Technology in the United States, 2011-2014.” JAMA, August 2016. Available at: http://jama.jamanetwork.com/article.aspx?articleid=2540389. ↩︎
  12. Jacobson, Gretchen A., Patricia Neuman, and Anthony Damico, “At Least Half Of New Medicare Advantage Enrollees Had Switched From Traditional Medicare During 2006-11,” Health Affairs (Milwood), 34(1): 148-55, January 2015. ↩︎
  13. While most SNP enrollees are dual eligibles, not all dually eligible beneficiaries who are enrolled in Medicare Advantage plans are in SNPs: about 1.2 million dual eligibles were enrolled in SNPs and about 1.1 million dual eligibles were enrolled in other Medicare Advantage plans in 2013. ↩︎
  14. Notably, a larger share of enrollees in non-metropolitan areas (8 percent) than metropolitan areas (4 percent) were forced to switch plans (involuntary switching) because their plan exited the market between 2013 and 2014. This difference in involuntary switching rates was consistent across all years of this study. ↩︎
  15. For another example and discussion of price elasticity in plan choice, see Buchmueller, Thomas C. and Paul J. Feldstein. “The Effect of Price on Switching Among Health Plans.” Journal of Health Economics, 16(2): 231-247, April 1997. ↩︎
  16. Jacobson, Gretchen, Christina Swoope, Michael Perry, and Mary C. Slosar. “How are Seniors Choosing and Changing Health Insurance Plans?” Kaiser Family Foundation, May 2014. Available at: https://modern.kff.org/medicare/report/how-are-seniors-choosing-and-changing-health-insurance-plans/. ↩︎
Poll Finding

Kaiser Family Foundation/CNN Working-Class Whites Poll

Authors: Liz Hamel, Elise Sugarman, and Mollyann Brodie
Published: Sep 19, 2016

The latest Kaiser Family Foundation/CNN partnership poll explores the views and experiences of white Americans without college degrees (a group defined in this survey as “working-class whites”), including how they feel about their own lives and the direction of the country, their attitudes towards government, their economic priorities, feelings about immigration and increasing racial and ethnic diversity, and personal experiences with employment and finances. It also compares this group’s attitudes and experiences with those of whites with college degrees, as well as those of blacks and Hispanics without college degrees (working-class blacks and Hispanics). Finally, the survey explores the views of different subgroups within the white working class, including variations by partisanship, age, income, region of the country, and religious identification.

CNN’s coverage:

White, Working Class & Worried: Full coverage

The anatomy of a white, working-class Trump voter

The ‘forgotten tribe’ in West Virginia; why America’s white working class feels left behind

2016: Last call for working class whites?

Working class whites blame Washington, but still want more government help

White working-class Americans have complicated view of Muslim immigrants

Alabama town mirrors US class divide on immigration

News Release

Most State Medicaid Programs Cover Prescription Contraceptives, While Coverage of Over-the-Counter Contraceptives Varies

Published: Sep 16, 2016

A new Kaiser Family Foundation survey of states’ Medicaid family planning policies under fee-for-service finds wide coverage of most prescription contraceptives among 40 states and the District of Columbia (DC), but variable coverage of emergency contraceptives and other family planning-related services. It is the first published report on state coverage of family planning benefits since the passage of the Affordable Care Act (ACA).

The states surveyed all cover daily oral contraceptives, and most also cover other prescription contraceptive methods such as injectable contraceptives, the diaphragm, the patch, and vaginal ring. Coverage of long-acting reversible contraceptives such as intra-uterine devices and implants is widespread across states that participated in the survey, and few states put limits or restrictions on these devices or their removal. Furthermore, many states are experimenting with a variety of payment policies for long-acting reversible contraception provided immediately after labor and delivery.

Medicaid coverage of the over-the-counter emergency contraception product Plan B and other over-the-counter contraceptives is more limited than prescription methods. At least one form of emergency contraceptive pills is covered through traditional Medicaid programs in all but three surveyed states, but the over-the-counter product Plan B is covered in fewer states than ella, which is a prescription form of emergency contraception.  Coverage for other over-the-counter contraceptives is more limited than prescription methods: ten states do not cover condoms, spermicide, and sponges.

While virtually all states surveyed covered family planning-related services like contraceptive counseling, well women visits, and cervical and breast cancer screenings, fewer (35 out of 41) reported coverage for screenings for intimate partner violence. Only one state, Nebraska, covered fertility treatments for either women or men and this coverage was limited to infertility caused by medical issues.

The report, prepared by Health Management Associates and the Kaiser Family Foundation, features detailed data for 40 states and DC and looks at family planning benefits across full scope traditional Medicaid programs and Medicaid expansion under the Affordable Care Act (ACA), as well as limited scope Medicaid family planning programs.

Medicare Part D in 2016 and Trends over Time

Authors: Jack Hoadley, Juliette Cubanski, and Tricia Neuman
Published: Sep 16, 2016
Section:
0 / 0

Summary

Since 2006, Medicare beneficiaries have had access to prescription drug coverage offered by private plans, either stand-alone prescription drug plans (PDPs) or Medicare Advantage drug plans (MA-PD plans). Medicare drug plans (also referred to as Part D plans) receive payments from the government to provide Medicare-subsidized drug coverage to enrolled beneficiaries, who pay a monthly premium that varies by plan. The law that established Part D defined a standard drug benefit, but nearly all Part D plan sponsors offer plans with alternative designs that are equal in value, and plans may also offer an enhanced benefit. Part D plans also must meet certain other requirements, but vary in terms of premiums, benefit design, gap coverage, formularies, and pharmacy networks.

This chart collection presents findings on the Medicare Part D marketplace in 2016 and trends since 2006:

  • Nearly 41 million of the 57 million people on Medicare (71 percent) are enrolled in a Part D plan in 2016; most (60 percent) are in PDPs, but a rising share (40 percent in 2016, up from 28 percent in 2006) are in MA-PD plans (Exhibit S.1). More than half of Part D enrollees are in enhanced plans.

    Exhibit S.1: Distribution of Medicare Part D Enrollment, by Plan Type, Plan Sponsor, and LIS Status, 2016

  • Nearly three in 10 Part D enrollees (29 percent, or about 12 million enrollees) are receiving extra help through the Part D Low-Income Subsidy (LIS) program that pays their drug plan premiums (if they enroll in a benchmark plan) and reduces their cost sharing.
  • Three firms—UnitedHealth, Humana, and CVS Health—account for over half (53 percent) of all Part D enrollment in 2016; if the Humana-Aetna merger goes through, the combined firm would account for 26 percent of Part D enrollment nationwide, without divestitures.
  • After several years of relatively low growth, average monthly PDP premiums increased by 6 percent in 2016 to $39.21 per month. However, monthly premiums for two of the most popular PDPs (AARP Rx Preferred and Humana Enhanced) increased by more than 20 percent in 2016. Premiums vary widely across regions and across plans, even among those of the same benefit type (basic or enhanced).
  • The average Medicare beneficiary has a choice of 26 PDPs and 16 MA-PD plans in 2016; by contrast, the average Part D enrollee receiving the LIS has a choice of seven premium-free benchmark PDPs, fewer than in any year since 2006.
  • One in eight Part D enrollees who receive the LIS—1.5 million beneficiaries—pay a monthly premium for Part D coverage, averaging $21 per month, even though premium-free PDPs are available in all regions; 45 percent of these 1.5 million enrollees pay $20 or more per month.
  • Almost all Part D enrollees are in plans with five cost-sharing tiers: two generic tiers, two brand tiers, and a specialty tier. PDPs typically charge coinsurance rather than copayments for brand-name drugs, and the use of tiered pharmacy networks is now the norm in PDPs. These trends have cost implications for beneficiaries, with greater unpredictably in out-of-pocket costs associated with coinsurance rates, but also the potential for savings if beneficiaries use drugs on preferred tiers or obtained from preferred cost-sharing pharmacies.

Key Findings: Section 1: Part D Enrollment And Plan Availability

Since 2006, the share of Medicare beneficiaries enrolled in a Part D plan has increased from 52 percent to 71 percent of all eligible Medicare beneficiaries.

  • Nearly 41 million Medicare beneficiaries, or 71 percent of all Medicare beneficiaries nationwide, are enrolled in Part D plans, including plans open to everyone and employer-only plans designed solely for retirees of a former employer 1. The percent of Medicare beneficiaries with Part D coverage in 2016 varies by state, from 56 percent in Alaska to 89 percent in North Dakota 2.
  • More than half (60 percent) of Part D enrollees are in PDPs, but enrollment in MA-PD plans has increased over time as a share of total Part D enrollment, from 28 percent in 2006 to 40 percent in 2016, roughly in line with overall growth in Medicare Advantage enrollment 3. In five states (Arizona, California, Florida, Hawaii, and Oregon), MA-PD plan enrollees account for over half of all Part D enrollees 4.
  • In 2016, 6.6 million Medicare beneficiaries are enrolled in employer-only Part D plans 5. This number has grown rapidly since a change in the tax status of the federal retiree drug subsidy (RDS), which is available to employers that provide drug benefits directly to their retirees, took effect in the 2013 tax year. Only 1.9 million beneficiaries (down from 7.2 million in 2006) have drug coverage from employers that receive the RDS.

In 2016, three Part D sponsors account for more than half of all Part D enrollees.

  • UnitedHealth, Humana, and CVS Health have enrolled half (52 percent) of all participants in Part D 6. This level of market concentration has increased modestly since 2006, but more so among PDPs. UnitedHealth and Humana have had large market shares since the program began, while enrollment in CVS Health has grown through acquisition of other plan sponsors 7.
  • If the acquisition of Humana by Aetna is approved, the combined firm would account for 26 percent of total Part D enrollment in 2016 nationwide, without divestitures. But in seven regions, the combined firm would have between 40 percent and 50 percent of total Part D enrollment. This acquisition, along with the proposed acquisition of Cigna by Anthem, would increase market concentration. Two thirds of all regions (23 of 34) would be considered highly concentrated, based on the Herfindahl index, with respect to PDP enrollees who are not receiving Low-Income Subsidies (LIS), up from 10 of 34 regions today 8. The market for LIS enrollment would also become highly concentrated in more regions (15 post-acquisitions versus four today).
  • The vast majority of PDP enrollees are in plans sponsored by firms participating in all or most all regions of the country 9. Firms offering plans in one or a few regions play a relatively small role in the program. MA-PD plans sponsored by local firms play a much larger role in that Part D market segment. Nationally, Blue Cross Blue Shield plans comprise 7 percent of PDP enrollment and 17 percent of MA-PD plan enrollment.
  • The ten largest sponsors of Part D plans account for 80 percent of all enrollment 10, and have varying shares of enrollees in PDPs versus MA-PD plans 11. UnitedHealth, by itself, has maintained the top position for all 10 years of the program, and in 2016 provides coverage to more than one in five PDP and MA-PD plan enrollees, but CVS Health has the most PDP enrollees for the first time in 2016. At the individual plan level, SilverScript Choice PDP has the most enrollees in 2016, a position previously held by AARP MedicareRx Preferred PDP 12. Since 2006, PDP enrollment has grown substantially in some of the largest plan sponsors; in others, enrollment growth has been relatively flat 13.
  • SilverScript Choice PDP has the most LIS PDP enrollees 14, while AARP MedicareRx Preferred PDP has the most non-LIS PDP enrollees 15.

The average Medicare beneficiary has a choice of 26 PDPs and 16 MA-PD plans in 2016.

  • The average number of PDPs available to people on Medicare has dropped from a high of 55 plans in 2007 to 26 plans in 2016, which are offered by 13 different firms 16. The number of MA-PD plans per beneficiary in 2016 increased slightly from 2015, from 15 to 16 plans. The total number of stand-alone PDPs available in 2016—886 PDPs—is lower than in any previous year 17.

Key Findings: Section 2: Part D Premiums

Average monthly PDP premiums rose in 2016 after being essentially flat since 2010; MA-PD plan premiums for Part D coverage only have risen modestly in the past few years.

  • PDP enrollees are in plans with an average monthly premium of $39.21 in 2016, up by 6 percent from 2015 1. MA-PD plan enrollees are in plans with an average monthly premium of $16.99 for Part D benefits, a lower amount due in part to the ability of firms offering MA-PD plans to use rebate dollars from Medicare payments for benefits covered under Parts A and B to lower their Part D premiums. The combined average Part D premium for PDP and MA-PD plan enrollees is $31.21 in 2016.
  • Premiums for enhanced PDPs grew more rapidly than premiums for basic plans from 2015 to 2016 (11 percent versus 4 percent) 2.
  • In 2016, just over half of MA-PD plan enrollees are in plans that charge no monthly premium for Part D coverage. Nearly half of PDP enrollees are in plans that charge less than $30 per month, but one in five are in plans charging at least $60 3.
  • Monthly premiums for three of the six largest PDPs (AARP MedicareRx Preferred, AARP MedicareRx Saver Plus, and Humana Enhanced) increased premiums by at least 20 percent in 2016 over 2015 levels 4; 5. By contrast, SilverScript Choice lowered its premium by 3 percent. Some PDPs have entered the market and gained enrollment by charging low premiums, but increased premiums substantially in later years.

Premiums vary widely across plans, even among those offering an equivalent benefit type.

  • PDPs offering the basic Part D benefit have an average monthly premium of $29.30 in 2016, while PDPs offering enhanced benefits have a higher average monthly premium of $52.91. The portion of the premium for enhanced plans that is attributable to the basic benefit is about 40 percent higher than the average premium for basic plans, suggesting that some of the difference may be attributable to health differences of enrollees in enhanced plans not captured by risk adjusters 6.
  • Premiums vary widely for basic-benefit PDPs, ranging from $11.40 (SilverScript Choice in Arkansas) to $139.70 (Transamerica MedicareRx Classic in Illinois). Premiums for enhanced PDPs also vary widely, from $18.40 for the Humana Walmart Rx PDP, available in all 34 regions, to $174.40 for the BlueMedicare Rx-Option 2 PDP, only available in Florida. Even within any given region, stand-alone PDPs offering the same type of benefit—basic or enhanced—can have vastly different monthly premiums 7.
  • MA-PD plan monthly premiums for Part D benefits also vary considerably, although MA-PD plan enrollees typically see a total premium that combines the cost of their medical and drug benefits. About half of MA-PD plan enrollees are in plans with a $0 drug premium, but premiums range as high as $78.80 for a plan offering the basic benefit and $139.10 for a plan with an enhanced benefit. Weighted average Part D premiums for the firms with the most MA-PD plan enrollees range from about $5 per month (Aetna and Cigna) to about $20 per month (Anthem) 8.

Premiums vary widely across geographic regions.

  • The average monthly premium for PDPs offering the basic benefit is $17.05 in New Mexico, but it is more than twice that amount ($37.13) in New Jersey 9.
  • For the identical plan offered by the same sponsor, monthly premiums vary across regions by as much as nearly four-fold 10. For example, premiums for SilverScript Choice, the PDP with the most enrollees nationally, range from $11.40 in Arkansas to more than three times that amount ($39.90) in Alaska.
  •  In most regions, the range of premiums for PDPs offering the basic benefit is substantial 11. In Illinois, for example, the highest basic PDP premium is $139.70, almost seven times higher than the lowest basic PDP premium of $20.50. These differences are exaggerated by high premiums for the Transamerica MedicareRx Classic PDPs, which has no more than 0.2 percent of enrollment in any of the 30 regions where it is offered.

Key Findings: Section 3: Part D Benefit Design And Cost Sharing

  • The majority of PDP and MA-PD plan enrollees are in plans with five-tier formularies, tiered pharmacy networks, enhanced benefits, no additional gap coverage, and deductibles below the standard amount of $360. However, a much larger share of MA-PD plan enrollees are in enhanced plans with deductibles less than $360. More PDP enrollees are in plans with tiered pharmacy networks 1.

Over half of PDP enrollees are in PDPs offering the basic benefit in 2016.

  • In 2016, 58 percent of PDP enrollees—but only 14 percent of MA-PD plan enrollees—are in plans offering the basic (rather than enhanced) benefit, a sizeable reduction from 83 percent of PDP enrollees in basic-benefit plans in 2006 2.

In 2016, about half of all enrollees in PDPs or MA-PD plans are in plans that waive the Part D deductible.

  • About 48 percent of PDP enrollees are in plans charging the full standard deductible ($360) in 2016, and 3 percent of PDP enrollees are in plans with a deductible that is smaller than the standard amount 3. The shares among MA-PD plan enrollees are 14 percent and 37 percent, respectively 4.

In 2016, nearly all plans use five cost-sharing tiers: preferred and non-preferred generic drugs, preferred and non-preferred brand drugs, and specialty drugs.

  • The vast majority of all Part D enrollees (98 percent of PDP enrollees and 96 percent of MA-PD plan enrollees) are in plans that use five cost-sharing tiers for their formularies, a design that gained popularity starting in 2012 5; 6. In 2006, most enrollees were in plans with only three or four tiers.

Cost sharing for generic drugs is lower in 2016 than in 2006 for those drugs now placed on preferred generic tiers.

  • Median cost sharing for preferred generics is $1 for PDPs and $3 for MA-PD plans in 2016, down from $5 in 2006 7. For drugs on the non-preferred generic tier—a tier that became common in 2012—median cost sharing is $7 for PDPs and $12 for MA-PD plans. In 2016, 13 percent of PDP enrollees and 22 percent of MA-PD plan enrollees are in plans that charge $0 copayment for preferred generics 8.
  • Unlike Part D plans, most employer plans do not use two generic tiers. Median cost sharing in 2015 for employer plans was $10 for the single generic tier, well above median copayments for generics in Part D.

Cost sharing for PDP enrollees for brand-name drugs increasingly takes the form of coinsurance instead of copayments.

  • In 2016, many PDP enrollees are in plans that charge coinsurance instead of copayments: 31 percent of enrollees now face coinsurance for preferred brand drugs and 96 percent do so for non-preferred brand drugs 9. By contrast, nearly all PDPs and MA-PD plans charge copayments for generic tiers, and most MA-PD plans use copayments for all tiers except the specialty tier.

Cost sharing for brand-name drugs has been relatively stable in recent years, but is much higher in 2016 than in 2006.

  • Median cost sharing for preferred brands increased between 2006 and 2016 by about 46 percent ($28 to $41) for PDP enrollees and by nearly 70 percent ($27 to $45) for MA-PD plan enrollees. For PDP enrollees who face coinsurance for preferred brands, the median coinsurance rate is 20 percent. Copayments for brand-name drugs in Part D are higher than those typically charged by large employer plans.
  • Among PDP enrollees in plans that use copayments for preferred brands, a majority (70 percent) are in plans charging between $29 and $44, while most MA-PD plan enrollees (78 percent) are in plans charging at least $45 for preferred brands 10.
  • For non-preferred brands, most PDP enrollees are in plans charging coinsurance of 40 percent or more; most MA-PD plan enrollees are in plans charging copayments more than $90 11. For PDP enrollees, the median coinsurance rate for non-preferred brands is 40 percent, while for MA-PD plan enrollees, the median copayment amount is $95.

Nearly all Part D plans use specialty tiers for high-cost drugs and charge coinsurance of 25 percent to 33 percent during the benefit’s initial coverage period.

  • Nearly half of PDP enrollees (49 percent) and more than 4 in 10 MA-PD plan enrollees (43 percent) are in plans that charge the maximum 33 percent coinsurance rate for specialty drugs, defined by CMS as those that cost at least $600 per month 12. Between 2015 and 2016, the share of MA-PD plan enrollees facing 33 percent specialty tier coinsurance declined. Only those plans that waive some or all of the standard deductible are permitted to set specialty tier coinsurance above 25 percent.

The use of tiered pharmacy networks has grown rapidly in recent years and is now the norm in PDPs.

  • The share of stand-alone PDPs with tiered pharmacy networks grew from 7 percent in 2011 to 85 percent in 2016 13. These plans have 96 percent of PDP enrollees. By contrast, only 30 percent of MA-PD plans, with 21 percent of MA-PD plan enrollees, use tiered pharmacy networks 14.
  • Non-LIS enrollees in plans with tiered pharmacy networks pay lower cost sharing in pharmacies offering preferred cost sharing and higher cost sharing in other pharmacies 15. The largest differences are for preferred generic drugs: a median copayment of $1 at pharmacies offering preferred cost sharing versus $7 at other pharmacies ($7 versus $13 for non-preferred generic drugs). Differences are more modest for preferred brand drugs: $35 versus $45 for PDPs using copays and 25 percent versus 35 percent for PDPs using coinsurance.

Most Part D enrollees are in plans without additional gap coverage beyond what is provided in the standard benefit as the coverage gap is being phased out.

  • In 2016, 88 percent of PDP enrollees and 54 percent of MA-PD plans enrollees are in plans without additional gap coverage 16. Although CMS no longer reports on the share of formulary drugs for which additional gap coverage is provided, gap coverage typically applies only to generic drugs and at most a small share of brand drugs, based on data from earlier years.
  • Monthly premiums for PDPs that offer additional gap coverage are twice the premium amount for PDPs that lack additional coverage, despite the modest additional gap coverage offered in these PDPs 17.

Key Findings: Section 4: The Low-income Subsidy Program

Nearly three in 10 Part D enrollees receive additional financial subsidies for Part D coverage through the Low-Income Subsidy program.

  • About 12 million Part D enrollees (29 percent of all Part D enrollees) receive additional subsidies through the Low-Income Subsidy (LIS) program (also called “extra help”) 1. The LIS pays Part D premiums for eligible beneficiaries, as long as they enroll in PDPs designated as benchmark plans, and also reduces cost sharing.
  • About two-thirds of LIS enrollees (66 percent, or 8 million) are enrolled in stand-alone PDPs; others are in standard MA-PD plans, Special Needs Plans (SNPs), Medicare-Medicaid plans participating in financial alignment demonstrations, cost plans, or PACE plans 2. PDP LIS enrollment has been relatively constant since the program began, but MA-PD plan enrollment (including enrollment in SNPs) has more than tripled since 2006.
  • The percent of Part D enrollees receiving LIS is higher in some states than others, and tends to be higher in southern states than in other regions of the country 3.
  • In three states (Arizona, Florida, and Hawaii), more than half of LIS enrollees are in some type of MA-PD plan 4. In six states, more than 95 percent of LIS enrollees are in PDPs.

Fewer PDPs qualify as benchmark plans in 2016, compared to any previous year.

  • In 2016, 226 PDPs nationwide (about one-fourth of plans) qualify as benchmark plans; that is, plans that are available to beneficiaries receiving the LIS for no monthly premium 5. This represents a 20 percent reduction in benchmark plans since 2015. In 2016, the average LIS beneficiary has a choice of seven benchmark plans, fewer than any previous year. About one-fourth of benchmark PDPs in 2016 qualify through a policy that allows plans to waive a premium of up to $2 per month.
  • Benchmark plan availability ranges by region in 2016 6. LIS beneficiaries have a choice of 10 benchmark plans in three regions (Arizona, Idaho/Utah, and Pennsylvania/West Virginia), but just two benchmark plans in Hawaii and three in Florida.

Some LIS beneficiaries pay premiums, even though they are eligible for premium-free Part D coverage; of the 1.5 million LIS enrollees paying premiums, close to half pay $20 or more per month.

  • In 2016, about 13 percent of all LIS beneficiaries (1.5 million) pay a premium because they are not enrolled in benchmark plans 7. CMS reassigns some beneficiaries to a zero-premium PDP during open enrollment if their previous PDP loses benchmark status and charges a premium. But these LIS enrollees are not reassigned by CMS because they have actively selected the plan they are in, whether it is a PDP or an MA-PD plan.
  • The number of LIS beneficiaries paying premiums is currently lower than in 2009 and 2010, at least partly because of the policy that allows plans to waive premiums up to $2 per month.
  • In 2016, 71 percent of the 1.5 million LIS enrollees who pay a premium for Part D coverage pay $10 or more per month 8. Almost half (45 percent) of the 1.5 million LIS enrollees who pay a premium pay $20 or more a month for their Part D coverage.
  • On average, the 1.5 million LIS beneficiaries paying Part D premiums in 2016 pay $20.51 per month ($246 per year) 9. This amount is up 19 percent from 2015 and is more than double the amount in 2006.

Key Findings: Section 5: Part D Plan Performance Ratings

In 2016, a much larger share of MA-PD plan enrollees than PDP enrollees are in plans with 4 or more stars out of a possible 5 stars for the rating factors based on their Part D performance.

  • Less than one in five PDPs (18 percent) are rated with 4 or more stars in 2016; one-fourth of all PDP enrollees are in these plans 1. By contrast, 69 percent of MA-PD plans, with 83 percent of MA-PD plan enrollees, have 4 or more stars for the rating factors based on their Part D performance. Medicare Advantage plans receive higher payments if they receive at least 4 stars for their performance providing all Medicare-covered services, including Part D, where applicable. Stand-alone PDPs have no direct financial incentives connected to their star ratings.
  • In 2016, one in four PDPs (26 percent), with 7 percent of PDP enrollees, are rated 2.5 or fewer stars. By contrast, only 1 percent of MA-PD plans, with less than 1 percent of enrollees, have 2.5 or fewer stars for their Part D performance in 2016. Plans with ratings this low for three consecutive years are flagged by CMS as “low-performing plans” and are at risk for having their contracts canceled, though CMS has not yet exercised the option of canceling contracts.
  • About 20 percent of MA-PD plan enrollees are in 5-star drug plans in 2016, as measured by their Part D performance ratings alone. By contrast, only 2 PDPs with 21,000 enrollees, both offered by WPS Health Insurance in Wisconsin, are rated with 5 stars in 2016.

In terms of both national averages and the performance of the leading plan sponsors, ratings have fluctuated annually.

  • In the years between 2010 and 2016, plans offered by CVS Health have received as few as 1.5 stars and as many as 4 stars, while the ratings for Humana’s plans have ranged from 2.5 to 4 stars 2. Changes are made each year to star rating component measures and to the cut points on each measure; these factors may influence the year-to-year variability in ratings. This variability limits the value of ratings to CMS in assessing plan performance and to consumers in selecting plans.
  • The average PDP plan rating, weighted by enrollment, declined from 3.7 stars in 2015 to 3.3 stars in 2016, but is closer to the averages in 2013 (3.1 stars) and 2014 (3.0 stars) 3. The average PDP plan rating has fluctuated up and down since 2011, in contrast to the trend in the average MA-PD plan rating for the rating factors based on their Part D performance, even though both types of plans are scored on the same Part D performance factors.

Methodology

This chart collection presents an analysis of the Medicare Part D 2016 marketplace and trends since 2006, prepared by Jack Hoadley, Health Policy Institute, Georgetown University; and Juliette Cubanski and Tricia Neuman, Kaiser Family Foundation. Anthony Damico, an independent consultant, provided data analysis on the average number of Medicare Advantage drug plans per beneficiary.

Data on Part D plan availability, enrollment, and premiums were collected primarily from a set of data files released by the Centers for Medicare & Medicaid Services (CMS) on a regular basis:

  • Part D plan landscape files, released each fall prior to the annual enrollment period. These files include basic plan characteristics, such as plan names, premiums, deductibles, gap coverage, and benchmark plan status.
  • Part D plan premium files, released each fall. These files include more detail on plan characteristics, including premiums charged to LIS beneficiaries, the portions of the premiums allocated to the basic and enhanced benefits, and the separate drug premiums for MA-PD plans.
  • Part D plan crosswalk files, released each fall. These files identify which plans are matched up when a plan sponsor changes its plan offerings from one year to the next.
  • Part D enrollment files, released on a monthly basis. These files include total enrollment by plan. We use February 2016 enrollment counts for enrollment-based analysis in this report. Enrollment files suppress totals for plans with 10 or fewer enrollees. We impute a value of five enrollees for these plans.
  • Part D Low-Income Subsidy enrollment files, released each spring (in March for 2016). These files include total enrollment counts for LIS enrollees. There are small differences, most likely due to different dates and underlying files, between total enrollment counts in the LIS enrollment files and those in the general enrollment files. As with the other enrollment files, we impute a value of five enrollees for amounts suppressed for plans with 10 or fewer enrollees.
  • Medicare plan benefit package files, released each fall. These files supply detailed information on the benefits offered by plans, including cost-sharing amounts for each formulary tier, tier labels, and the different cost-sharing amounts for standard and preferred cost-sharing pharmacies, where applicable.
  • Medicare county-level enrollment files, released on a monthly basis. These files are used to create total counts at the state level. Because they are different than the plan-level enrollment files, national totals for these files are not identical to totals in other exhibits. We impute values of one beneficiary for all plan/county combination where values of 10 or fewer beneficiaries are suppressed.

Due to methodological differences, some numbers for MA-PD plans in this analysis differ from those in a May 2016 Kaiser Family Foundation report, Medicare Advantage 2016 Spotlight: Enrollment Market Update. Methodological differences include:

  • How Blue Cross Blue Shield (BCBS) affiliates are treated: this analysis treats BCBS-affiliated firms separately; the Medicare Advantage Spotlight combines BCBS-affiliated firms [excluding Anthem).
  • How plans in the territories are treated: this analysis does not include data for plans in the territories, including Puerto Rico; the Medicare Advantage Spotlight includes Puerto Rico but excludes other territories.
  • Which month is used for enrollment counts: this analysis uses February for Part D enrollment; the Medicare Advantage Spotlight uses March enrollment files.
  • How plans with small enrollment counts that are suppressed in CMS files are treated: this analysis imputes a value of five enrollees for total enrollment in such plans; the Medicare Advantage Spotlight excludes plans with small enrollment counts in estimates that are plan-enrollment weighted.


Medicaid Coverage of Family Planning Benefits: Results from a State Survey

Authors: Jenna Walls, Kathy Gifford, Usha Ranji, Alina Salganicoff, and Ivette Gomez
Published: Sep 15, 2016

Executive Summary

An updated version of this report was released on February 17, 2022 and can be found here.

Overview

Medicaid plays a major role financing family planning services for low-income women in the United States. Family planning services are “mandatory” benefits under Medicaid and must be provided to individuals of childbearing age free of cost-sharing. There is, however, no formal federal definition of “family planning,” which has given states considerable discretion to determine the specific services covered under this benefit. Furthermore, a state may establish different coverage requirements for Medicaid funded family planning services for different eligibility pathways. The Affordable Care Act (ACA) created a new Medicaid eligibility category which has federally-specified coverage requirements for aspects of family planning (contraceptives, screening services, and counseling), but these requirements do not apply to traditional Medicaid available prior to the ACA. This has magnified the potential for variations in coverage standards for different Medicaid eligibility pathways (e.g. traditional Medicaid available prior to the ACA, ACA Medicaid expansion, or Medicaid Family Planning Expansion program) within a state. The multiple pathways and coverage options make it difficult to assess coverage differences for family planning services both within and across states under fee-for-service.

This report presents findings from a state-level survey on states’ family planning benefits under Medicaid, as of July 2015. The survey queried states about their coverage policies under fee-for-service for the following family planning services: reversible contraceptives, sterilization services, fertility diagnosis and treatment, services related to family planning and sexual health such as cancer treatment and partner violence, and managed care policies. The survey identifies differences between states as well as within states between Medicaid eligibility pathways: traditional Medicaid (available pre-ACA), Medicaid expansion under the ACA, and family planning-only coverage through a state Medicaid waiver or State Plan Amendment (SPA). All 50 states and the District of Columbia were invited to respond to the survey, but data are presented for 40 states and the District of Columbia that provided responses (Figure 1). Throughout the report, DC is counted as a state, totaling 41 respondents.

Figure 1: State Medicaid Eligibility Pathways for Women

Key Findings

Reversible Contraception

All responding states cover nearly all prescription contraceptive methods approved by the Food and Drug Administration under their fee-for-service programs, including IUDs and implants (Table 1).1  Coverage of over-the-counter contraceptives, particularly emergency contraception, showed more variation and utilization controls. Most states, but not all states, have aligned their coverage of prescription contraceptives across all of their Medicaid eligibility pathways.

  • Thirty-six out of 41 states covered all prescription methods in the survey under their traditional Medicaid pathway. Of the five states that did not cover all methods, two states did not cover one form of injectable and three of them did not cover ella, an emergency contraceptive pill.
  • While most contraceptives are covered, a number of states apply utilization controls such as quantity limits on oral contraceptives and injectables. Some states, however, have moved in the opposite direction, permitting clinics to dispense a 12-month supply of oral contraceptives.
  • Coverage of IUDs and implants is widespread and no states reported that they limited access to long-acting reversible contraceptives (LARCs) by requiring prior authorization, although some have utilization limits under fee-for-service, such as limiting coverage to certain brands.
  • States are considering and adopting a variety of payment policies to facilitate postpartum LARC While maternity services are typically paid for with a global fee that includes postpartum care, some states have developed a separate payment outside the global fee to compensate clinicians and hospitals for postpartum LARC insertions. Several states continue to include either the device or clinician fee in the maternity global fee, which can be a disincentive for providers to insert postpartum LARCs given the relatively higher costs of IUDs and lack of separate reimbursement for the insertion.
Table 1: Summary Findings on State Coverage of Contraceptive Methods in Traditional Medicaid Programs
Covers 20 forms of prescription contraceptives in Traditional Medicaid Program (36/41 states)AK, AR, AZ, CO, CT, DC, DE, GA, HI, IA, IL, IN, KY, MA, MD, MI, MN, MO, MS, MT, NC, NE, NH, NM, NV, NY, OH, OK, OR, TN, TX, VA, VT, WA, WV, WY

5 states that do not cover all methods:

CA, ME cover all methods except Injectable- subcutaneous

AL, ID, SC cover all methods except ella emergency contraceptive

Cover 3 forms of LARC in Traditional Medicaid Program (41/41states)AL, AK, AZ, AR, CA, CO, CT, DE, DC, GA, HI, ID, IL, IN, IA, KY, ME, MD, MA, MI, MN, MS, MO, MT, NE, NV, NH, NM, NY, NC, OH, OK, OR, SC, TN, TX, VT, VA, WA, WV, WY
Covers 2 forms of Emergency Contraception in Traditional Medicaid Program (35/41 states)AK, AR, AZ, CA, CO, CT, DC, DE, GA, HI, IA, IL, MA, MD, ME, MI, MN, MO, MT, NC, NE, NH, NM, NV, NY, OH, OK, OR, TN, TX, VA, VT, WA, WV, WY
Covers 4 forms of OTC contraceptives Traditional Medicaid Program (22/41 states)AK, AZ, CA, DC, HI, IA, IL, MA, MD, MI, MN, MT, NE, NH, NM, NV, NY, OH, OK, VA, WA, WY
NOTES: Prescription contraceptive methods in this survey are: Copper IUD, Hormonal IUD, Implant, Injectable- intra-muscular, Injectable- subcutaneous, Diaphragm, Contraceptive Patch, Vaginal Ring, Oral Contraceptive Pills Combined, Oral Contraceptive Pills- Progestin Only, Oral Contraceptive Pills-Extended Use, ella Emergency Contraceptive Pills, Tubal Ligation- General, Tubal Ligation- Post Partum, Sterilization Implant, and Vasectomy. LARC methods in this survey are: Copper IUD, Hormonal IUD, and Implant. OTC contraceptive methods in this survey are: Male condom, spermicide, sponges and levonorgestrel emergency contraceptive pills.
  • Coverage for emergency contraception (EC) pills, particularly the over-the-counter (OTC) product (levonorgestrel, also known as Plan B), is not as uniform as for the prescription method (ulipristal acetate, also known as ella). While at least one form of EC pills is covered in traditional Medicaid programs in most states, the OTC option is covered in fewer states and subject to greater utilization controls, sometimes requiring a prescription. Three states report that they do not cover either type of EC pills. All states reported that they cover the copper IUD, which can be used as an EC, in all of their pathways.
  • Variation in coverage across the states was most notable for over-the-counter (OTC) contraceptives, including condoms and Plan B emergency contraception. Coverage for OTC supplies also varied across state Medicaid eligibility pathways, and a number of states require prescriptions for coverage, which creates an access barrier for products the FDA has deemed to be safe and effective for over-the-counter use.

Sterilization and Fertility Services

Most states cover sterilization services in their FFS program, but few pay for fertility services. Federal law specifies that states must cover surgical and implant sterilization procedures for women under ACA Medicaid expansion, and all of the responding states reported that they cover these procedures in traditional Medicaid as well.

  • Medicaid family planning expansion program do not always pay for sterilization services for women.
  • While all states reported they cover vasectomies under traditional Medicaid, not all cover the procedure in their family planning expansion programs or under their full scope Medicaid expansion programs.
  • Very few states cover diagnostic testing related to fertility, including laparoscopy for women and semen analysis for men.
  • Only one state covers fertility treatments for either women or men, but this is restricted to individuals who have infertility as a symptom of separate medical problem.

The definition of high quality family planning encompasses a broad array of services including screening and treatment for cervical and breast cancers, interpersonal violence screening and prevention, and sexual health counseling. These family planning-related services, however, are less consistently covered by family planning expansion programs than contraceptives.

  • Although breast cancer screening is considered “optional” under traditional Medicaid, it is a required benefit in ACA Medicaid expansion programs. All responding states provided breast cancer screening services under these two full scope eligibility pathways. Few states, however, provide this benefit through their family planning waiver or SPA.
  • All states cover Pap screening for cervical cancer regardless of eligibility pathway, but follow-up tests for abnormal screening results are less likely to be covered in state family planning waivers or SPAs.
  • HPV vaccines for young adults are covered in all but one state, but the benefit is less likely to be covered through a family planning expansion program.
  • Contraceptive counseling and screening for intimate partner violence are covered by most states, but services are typically subject to restrictions and are not always covered for all eligibility pathways available within a state.

Managed Care Policies

The majority of states have capitated managed care contracts that include family planning services. Many of these states, however, do not address how utilization controls can be used in the context of family planning in their contracts. Some of the states noted that they contract with MCOs that include providers with religious objections to family planning in their networks, but not all of these states detailed referral processes to assure that women can get family planning care from other providers.

  • Most of the responding states have capitated contracts that include family planning in the capitation rate. Just over one-third of these states explicitly address potential utilization controls on family planning services in the contracts with managed care organizations.
  • A handful of states reported that they do not claim the enhanced 90% federal match for family planning services provided through managed care organizations.
  • California and New York, states with the most beneficiaries, also contract with faith-based plans that oppose some forms of contraception. While California reported that they have a process in place for referral for family planning services for the beneficiaries in these plans, New York did not report a referral practice.

Conclusion

The analysis of state responses to this survey found that overall most states cover a broad range of prescription contraceptive methods in their full scope, traditional Medicaid programs and their full scope ACA Medicaid expansions, but finds more variation in coverage through the family planning expansion programs. Thirty-six of 41 surveyed states report that they cover all prescription contraceptives for women through their full scope programs. While states are not required to cover all methods under all pathways, most do. However, there is more variation between and within states for coverage of over-the-counter contraceptives, including condoms and Plan B emergency contraception pills. In some states that provide coverage, it is only with a prescription which can limit access to these safe and effective methods. Furthermore, over the years the family planning field has evolved to encompass other services beyond contraception that help women and men maintain and control their reproductive and sexual health. Medicaid coverage for prevention and management of breast and cervical cancers and screening for interpersonal violence is available in most states, but not as consistently as for contraceptives. These preventive services must be covered by new private insurance plans as a result of the ACA, but there is no requirement that they be covered under traditional Medicaid or under the family planning expansion programs.

Access to the full range of contraceptive methods as well as related family planning services has become a standard of comprehensive health care for women and men in their reproductive years.2  As enrollment in the Medicaid program continues to grow as a result of the ACA and state decisions to expand coverage for family planning services, policy choices defining coverage of services under Medicaid family planning will continue to be a significant force shaping access to sexual and reproductive health services for low-income women and men in years to come.

Acknowledgements

The authors express appreciation for the assistance of several individuals who assisted with the preparation, testing, and refinement of the survey instrument, including Yali Bair of Ursa Consulting, Amy Moy from the California Family Health Council, Tasmeen Weik of the federal Office of Population Affairs, Melanie Reece of Colorado’s Department of Health Care Policy and Financing, and Lisa DiLernia of Michigan’s Department of Health and Human Services.

We thank the following colleagues from Health Management Associates: Joan Henneberry for guidance and subject matter expertise; Dennis Roberts for database development and management; and Nicole McMahon for assistance with compiling the state data tables.

We also thank the Medicaid directors and staff in the 40 states and the District of Columbia who completed the survey on which this report is based.

Introduction

Introduction

Overview

Medicaid is the primary funding source for family planning services for low-income women. While the federal and state governments jointly finance the program, states operate their programs and establish benefits, eligibility and coverage policies subject to broad federal guidelines. To understand variations in the scope of coverage for family planning and perinatal services and related state Medicaid policies across the nation, the staff of the Kaiser Family Foundation and Health Management Associates surveyed states about benefit policies in place as of July 1, 2015, for family planning and perinatal services.

The survey was conducted between October 2015 and February 2016. Forty states and the District of Columbia responded to the survey. Non-responding states are: Florida, Kansas, Louisiana, New Jersey, North Dakota, Pennsylvania, Rhode Island, South Dakota, Utah and Wisconsin. A majority of the states responding to the survey contract with managed care organizations (MCOs) under a capitated structure to deliver Medicaid services, including family planning. While the survey asked states to consider only state Medicaid policies under fee-for-service when responding to the questions, it is possible that MCOs provide additional family planning services to enrollees as added value benefits, unless they are contractually prohibited from doing so.

As illustrated in Figure 2, of the 41 responding states, as of July 1, 2015:

  • 25 had adopted an ACA Medicaid expansion program 3 
  • 23 had a family planning-only waiver or SPA4 
  • 13 had both an ACA expansion program and a family planning-only waiver or SPA program
  • 6 provide services through their traditional Medicaid program only, although one (Texas) also has an exclusively state-funded family planning program.
Figure 2: State Medicaid Eligibility Pathways for Women

This report presents the survey findings on 41 states’ Medicaid coverage of family planning services as of July 2015 (DC is referred to as a state throughout this report, for simplicity). Summary tables are presented throughout the report and more detailed, state-level tables are in Appendix A. A companion report summarizing state Medicaid coverage of perinatal services will be issued in the near future.

Background

The manner in which family planning services are financed and organized is unique within the Medicaid program. Federal law:

  • Classifies family planning services and supplies as a “mandatory” benefit category that states must cover, but states have some discretion as to which services they include in this category;
  • Prohibits copayments or any other form of patient cost sharing for family planning services;
  • Entitles beneficiaries to seek family planning services from any provider that participates in the Medicaid program, called freedom of choice; and
  • Provides a 90% federal matching rate for the costs of family planning services, a higher proportion than for other services. States pay the remaining 10% of costs.

In addition to long-standing coverage under traditional Medicaid programs, states have also applied to the federal government via “Section 1115 Medicaid waivers” establish programs that extend Medicaid coverage for family planning services only to women and men who are not otherwise eligible for full-scope Medicaid. Prior to the ACA, waivers were the only mechanism for states to establish these limited scope programs.  The waivers must be approved by the Centers for Medicare and Medicaid Services (CMS), the federal agency that oversees the Medicaid program.  Multiple studies have found that these programs prevent unintended pregnancies and abortions, thus improving women’s health and saving money for the federal and state governments.5 

The ACA made many changes to Medicaid coverage that affected beneficiaries’ access to family planning services under the program. Beginning in 2014, states could expand Medicaid eligibility to most people with incomes below 138% FPL without regard to categorical eligibility. As of March 14, 2016, 31 states and the District of Columbia have chosen to adopt full scope Medicaid expansion programs.6  ACA also defined a minimum “Alternative Benefit Plan” (ABP) that states must provide to beneficiaries under this full scope Medicaid expansion option. The ACA specifies that the ABP must include ten “essential health benefits,” including preventive services, at no cost to the patient.7  The preventive services under this policy include several services related to family planning, such as all FDA-approved contraceptives with a prescription, testing for sexually transmitted infections, screening for cervical and breast cancers, the HPV vaccine, and screening for intimate partner violence. Traditional, pre-ACA Medicaid programs and waiver-specific programs, however, are not bound by the ABP requirements, which means that the benefits package can vary within states for different Medicaid populations based on their eligibility pathway (Appendix B).

The ACA also eased the process for states to establish limited scope family planning programs, enabling them to change their program by adopting “state plan amendments,” or SPAs, without requesting a federal waiver of Medicaid rules. States could continue to operate their family planning programs under the waivers as they had historically done, or they could establish the program under SPA authority.

Table 2: Medicaid Eligibility Pathways for Family Planning Services
Traditional Medicaid – Medicaid coverage available prior to the Affordable Care Act (ACA) was based on an individual having income below states’ very low thresholds as well as being in one of the program’s eligibility categories: pregnant, mothers of children 18 and younger, disabled, or over age 65
ACA Medicaid Expansion – The ACA allowed states to eliminate categorical requirements and extend Medicaid to most women and men with family income at or below 138 percent of the federal poverty level.
Family planning-only programs – Several states operate programs that provide Medicaid coverage just for family planning services to women who are not otherwise eligible for full Medicaid benefits. These programs are authorized either with waivers or State Plan Amendments (SPAs) that must be approved by CMS.

There is a minimum floor of family planning services that must be covered under ACA Medicaid expansion, but that is not the case for traditional Medicaid or family planning-only coverage (Table 2). This survey asked states about the scope of states’ coverage of family planning benefits under multiple eligibility pathways for Medicaid. Detailed findings from 40 states and DC on commonalities and differences between and within states are presented for reversible contraceptives, sterilization services, fertility diagnosis and treatment, related sexual health services such as cancer treatment and partner violence screening, and managed care policies.

Reversible Contraception

Key Finding: Prescription Contraceptives

All responding states provide coverage for most prescription contraceptive methods approved by the Food and Drug Administration (FDA). In addition, with few exceptions, most states aligned their coverage of prescription contraceptives across all of their Medicaid eligibility pathways.

While most contraceptives are covered, a number of states apply utilization controls such as quantity limits on oral contraceptives and injectables.

The survey examined state coverage policies for multiple types of contraceptive devices and methods including, prescription and non-prescription methods, as well as reversible methods and sterilization procedures for women and men. Reversible methods include a wide range such as long-acting reversible contraceptives (LARCs) – intra-uterine devices (IUDs) and implants; oral contraceptives; injectables, emergency contraceptives; and various other products and devices available by prescription or over-the-counter (OTC).

Long-Acting Reversible Contraceptives (LARCs)

Key Finding: LARC

Coverage of IUDs and implants is widespread and no states limited access to LARCs by requiring prior authorization or other utilization limits.

LARCs are highly effective for extended periods of time, ranging from three to 10 years depending on the specific type that a woman uses. In the United States, three types of LARCs are available: Hormonal and non-hormonal IUDs and implants. All states participating in the survey cover all LARC methods through all of their Medicaid programs offering family planning services (Table 3). The ACA requires coverage of these benefits in Medicaid expansion programs.

Table 3: State Coverage of LARCs
Contraceptive Device or ServiceTraditional Medicaid(n = 41)Family Planning Waiver or SPA(n = 23)ACA Medicaid Expansion(n=25)Apply Limitations or Restrictions
Copper IUD4123Required3
Hormonal IUD4123Required6
IUD Removal 4123Required4*
Implant4123Required3
Implant Removal 4123Required3*
* “Medical necessity” is included in the count of states with restriction or limitations for IUD and implant removal.

LARC Limitations or Restrictions

Only a few states noted utilization controls or restrictions for devices. Typically, restrictions apply to benefit frequency or for specific devices (Table 4). For device removal, “medical necessity” was treated as a limitation since it is not clear whether states consider the desire to become pregnant a medical necessity. This was the most common restriction noted for device removal.

For removal of an IUD, Alabama specified the following criteria: the recipient develops high blood pressure or other medical condition that would allow for a progestin only method; any nulliparous woman who has a spontaneous expulsion within six months of placement; Mirena IUD is removed to allow a pregnancy; surgical removal of an embedded IUD in an office or outpatient setting. Missouri noted that the specific CPT code for IUD removal is not covered, but providers are instructed to use an office visit code for reimbursement. In addition to limits on quantity, California noted that LARC devices are limited to clinic dispensing only.

Table 4: State Utilization Controls for LARCs
IUD DeviceIUD RemovalImplant DeviceImplant Removal
Quantity/frequency limitsAL, CA, MI, MOCA, MI, MO
Brand/type restrictionsAL, ME, OK
Coverage subject to certain medical conditions or “medical necessity” AL, NY, OK, TNNY, OK, TN
Removal covered to allow pregnancyAL

LARCs Provided Immediately Post Labor and Delivery

Key Finding: LARC Reimbursement

States are experimenting with a variety of payment policies to facilitate postpartum LARC insertion. Approaches include separate payments for LARC device as well as clinician fee outside of the global fee. Several states continue to include either the device or the clinical fee within the global fee that is used to typically pay for maternity care.

States were asked how they reimburse providers for LARCs provided immediately after labor and delivery. This has been the source of considerable research, public health education, and policy activity in recent years in part because data that suggests birth spacing is an important component of healthy pregnancies and optimal birth outcomes.8  LARCs are among the most effective forms of reversible contraception and research suggests that providing them during the postpartum period, either at the time of delivery or at the follow up visit can help lower the rate of unintended pregnancies.

Labor and delivery is typically reimbursed through a global fee that covers the costs of all maternity care, including labor and delivery services, and postpartum care. Many providers have reported that the global fee is not sufficient to cover the costs of providing a LARC postpartum at the time of delivery or at the follow up postpartum visit. The absence of a separate fee or an increase has been a disincentive for some providers. Among the 41 states responding to the survey, the reimbursement methodology for hospitals most frequently reported is a global fee for both the LARC device and insertion (17 states), followed by 10 states that include insertion in a global fee and reimburse hospitals separately for the device. Conversely, the most frequently reported methodology for reimbursing other providers was a separate fee for both the device and insertion (25 states). Table 5 illustrates summary data for reimbursement for LARC device and insertion post labor and delivery. Appendix Table A1 provides detail for each state response.

Three states indicated no specific hospital reimbursement for post labor/delivery LARCs. Arizona indicated that when the state implemented a hospital APR DRG9  payment methodology, the fee associated with the labor and delivery for the hospital did not consider the inclusion of LARC, but it will be considered in the future. The District of Columbia noted it does not reimburse for immediate post- partum LARC, but the managed care plans do, and the reimbursement methodology varies across the three contracted health plans. North Carolina reported that many hospitals and physician offices have chosen not to place LARCs in the immediate postpartum period.

Table 5: Reimbursement Structure for Post Labor & Delivery LARC Device and Services
Hospital(n=41)Other Provider(n=40)*
Global Fee includes LARC Device and Insertion176
Separate Fee for Both LARC Device and Insertion725
Device included in Global Fee; Insertion Separate Reimbursement44
Device Separate Reimbursement; Insertion included in Global Fee101
Other34*
*Maryland did not provide a response for reimbursing other providers; Delaware noted that other providers are reimbursed for insertion as part of a global fee, but did not provide a response for the device itself.

States were asked to identify and briefly describe any known policy or reimbursement barriers that inhibit the provision of LARCs immediately following labor and delivery. Several states that use a global fee to reimburse hospitals noted low utilization of postpartum LARC provision, whether the global fee was for the device, insertion or both. Several states reported plans to change their reimbursement methodology.

CMS Bulletin on Payment Approaches for LARCs

In April 2016, CMS issued a bulletin addressing reimbursement for LARC devices. CMS identifies some of the barriers that have impeded broader use of these devices, including low reimbursement levels, the absence of a separate payment from the typical global maternity fee, and administrative hurdles for providers to keeping devices on hand so that they can be provided upon request. The bulletin highlights recent state activity to address these barriers as well as potential strategies to encourage clinicians to provide LARCs postpartum and in the primary care setting, including:

  • Raising provider payment rates
  • Unbundling payment for LARC from other maternity services.
  • Reducing logistical barriers for supply management
  • Removing administrative barriers for provision of LARC

SOURCE: Centers for Medicare and Medicaid Services (2016). State Medicaid Payment Approaches to Improve Access to Long-Acting Reversible Contraception.

Colorado and Tennessee use the global maternity fee to reimburse hospitals for both the device and insertion. Colorado notes that postpartum LARCs are currently covered and available under normal labor and delivery reimbursement but also stated that the state is “looking to carve out payment from the global [labor and delivery] fee, but [are] still working on an appropriate process and CMS approval.” Tennessee plans to unbundle payments in 2016 to allow for separate reimbursement for postpartum LARCs “…in hopes of improving access for this contraceptive technology to Medicaid enrollees.”

Georgia reimburses hospitals for LARC insertion using a global fee and reimburses for the device separately, but notes that few LARCs have been purchased by hospitals to date for immediate postpartum insertion. The state intends to make system changes in 2016 that will allow separate reimbursement to hospitals for postpartum LARC insertion.

Texas included LARC device reimbursement within the hospital DRG but effective January 1, 2016 allows hospitals to receive reimbursement for the LARC device in addition to the DRG payment when the device is inserted immediately postpartum.

Other states reported issues with global payments for postpartum LARC procedures and devices: Massachusetts, which uses global payments, noted that providers would prefer a different reimbursement mechanism; Minnesota noted that they do not have a different DRG for LARC procedures/devices following a birth, as there is with sterilization procedures following a birth; Oregon reported that the DRG payment does not adequately cover the hospital cost so they are currently considering options to enhance the reimbursement amount; Washington changed its policy to allow separate reimbursement for a LARC device and enhanced reimbursement for LARC insertion added to the RVU-based fee.

Two states that use a global hospital reimbursement for both the device and LARC insertion, Michigan and Ohio, reported no barriers to utilization. Virginia, which also uses a global reimbursement methodology, described a four month pilot project implemented by one of its managed care plans that allowed for separate payment for the LARC device. However, there were no requests for immediate postpartum LARC insertions, so the pilot ended. The state noted “…it appears that a primary potential barrier of accessing this method of LARC is lack of provider and member education and training versus policy and reimbursement.”

Oral Contraceptives

Key Finding: Oral Contraceptives

All responding states cover daily use oral contraceptives (Combined, Progestin only, as well as Oral Extended and Continuous use) regardless of the eligibility pathway.

Few states allow a 12-month supply for oral contraceptives; supply limits are the most common method to control utilization.

Oral contraceptives are the most commonly used form of reversible contraception among women in the United States. All states surveyed cover all forms of oral contraceptives in their traditional Medicaid program and their family planning waiver or SPA as applicable. The ACA requires states to cover oral contraceptives for adults in their Medicaid expansion programs (Table 6). The survey also asked states whether they provide coverage for 12 months’ supply of oral contraceptives. Eleven of the responding states indicated that they allow a 12-month supply of oral contraceptives to be dispensed, but typically with some restrictions (7 states). For example, California10  and Virginia noted that 12-month dispensing is restricted to clinics and on-site dispensing by medical providers. Pharmacies may not dispense a 12-month supply, with the exception of California’s family planning expansion program.

Table 6: Oral Contraceptive Coverage
BenefitTraditional Medicaid(n=41)ACA Medicaid Expansion(n=25)Family Planning Waiver or SPA(n=23)
Oral Contraceptives (specific)
     – Combined Estrogen Progestin41Required23
     – Progestin Only41Required23
     – Oral Extended/Continuous Use41Required23
Limitations and Restrictions

Supply limits are the most common restriction reported for oral contraceptives, and limits are most usually tied to the dispensing provider, or program (Table 7). Seven states reported they restrict their supply to three months. Vermont requires prior authorization for non-preferred brands, along with a trial of a preferred brand. Mississippi and Vermont include oral contraceptives on the state’s Preferred Drug List (PDL), which means that coverage for these drugs is not subject to prior authorization. Appendix Table A2 provides state response detail around 12 month supply dispensing and utilization controls for oral contraceptives.


Table 7: State Utilization Policies for Oral Contraceptives
Utilization ControlStates UtilizingNotes
Limited to 3 month/90 day supply (7)CA, IL, MI, MN, MS, NH, WYCA and MI limit applies to pharmacy dispensing
Limited to 6 month supply (1)CO
Allow 12 month supply (11)AL, CA, IN, MO, MS, NM, OR, SC, TX, VA, WAAL, CA, MS, SC, TX, VA allowance applies to clinic dispensing only; OR applies only to family planning waiver service recipients
Quantity limit, unspecified (1)AR
Pharmacy benefit only (2)GA, CACA limit applies only to extended use oral contraceptives for family planning expansion program
Included on Preferred Drug List (2)MS, VT
Prior Authorization (2)CA, VTCA limit applies to extended use oral contraceptives only; VT requires prior authorization for non-preferred brand with trial of preferred brand

Other Prescription Contraceptives – Injectable, Diaphragm, Patch, Ring

Almost all of the responding states covered the remaining prescription contraceptives included in the survey across all available eligibility pathways. These methods include injectable contraceptives, the diaphragm, contraceptive patch, and vaginal ring. California and Maine indicated they do not cover the subcutaneous injectable, but California was in the process of adding coverage for this method.

Limitations and Restrictions

The most common utilization control noted by states for these contraceptive methods is limits on quantity or dose (Table 8). States that identified quantity and/or dose limits for one or more of the methods include: Alabama, Arkansas, California, Illinois, Michigan, and Missouri. Other restrictions pertain to the type of provider that can provide or dispense the contraceptive. California allows only clinics to dispense injectable contraceptives, but restricts dispensing of diaphragms to pharmacies. The place of service – either pharmacy or clinic – for the contraceptive patch and vaginal ring depends on the type of product dispensed. Michigan allows up to two diaphragms per year, but they must be dispensed from the same billing provider. States also reported other policies and program integrity measures. For example, in Texas the claim for the product must be accompanied by a family planning diagnosis code.

Table 8: Coverage and Utilization Controls for Other Contraceptive Methods
Traditional Medicaid(n=41)ACA Medicaid Expansion(n=25)Family Planning Waiver or SPA(n=23)Number of States with Utilization Controls
Injectable –intra-muscular41Required23Quantity/dose: 5Place of service: 1Other: 4
Injectable – subcutaneous39Required22Quantity/dose: 4Other: 4
Diaphragm41*Required23Quantity/dose: 4Place of Service: 2Other: 1
Contraceptive Patch41Required23Quantity/dose: 4Place of Service: 1Other: 3
Vaginal Ring41*Required23Quantity/dose: 3Place of Service: 1Other: 2
* North Carolina covers diaphragm fitting only; Georgia covers the Vaginal Ring as a component of a family planning visit.

Emergency Contraceptives

Key Finding: Emergency Contraception

At least one form of emergency contraceptive pills (levonorgestrel and ulipristal acetate) are covered in traditional Medicaid programs in all but three responding states. The over-the-counter option (levonorgestrel, also known as Plan B) is covered in fewer states and subject to greater utilization controls, including requiring a prescription. All states reported that they cover the copper IUD, which can be used as an emergency contraceptive, in all of their pathways.

In addition to coverage for Copper IUDs, which can be used as an emergency contraceptive, the survey asked states about their policies with respect to oral emergency contraceptives, including ella (ulipristal acetate) which is only available with a prescription, and Plan B products (levonorgestrel)11  which are available OTC without a prescription.

A few states provide unrestricted access to emergency contraception, or provide Plan B without a prescription: Maryland, Nebraska, Oregon, and Washington. Only three states reported that they do not cover either form of emergency contraceptive pills in any of their Medicaid programs – Alabama, Idaho, and South Carolina. Thirty-eight states cover ella, and 35 cover both Plan B products and ella emergency contraceptives in their traditional Medicaid programs. The ACA requires that Medicaid expansion programs cover emergency contraceptives, but only with a prescription under the ABP (Table 9). This means that these programs must always cover ella, but only are required to cover Plan B with a prescription.

For OTC Plan B emergency contraception, 21 of 25 states with an ACA Medicaid expansion population provide coverage through that pathway. Alabama, Idaho, Indiana, Kentucky, Mississippi, and South Carolina do not provide emergency OTC contraceptive coverage in any of the eligibility pathways available within the state. Minnesota does not provide the benefit in its ACA Medicaid expansion, but does provide it in the traditional Medicaid program and through the family planning SPA. Wyoming does not provide the benefit through its family planning waiver but does cover the benefit under traditional Medicaid.

Table 9 State Coverage of Emergency Contraceptives, by Type of Program
 Traditional Medicaid(n=41)ACA Medicaid Expansion(n=25)Family Planning Waiver or SPA(n=23)Number of States Noting Restrictions*
Ella38Required207
Plan B35211831
Both Ella and Plan B352117
Neither Ella nor Plan B302AL, ID, SC do not cover either ella or Plan B in traditional Medicaid; AL and SC do not cover in family planning waiver/SPA
* Requiring a prescription is not counted as a restriction for Ella, since a prescription is required in all states for this product. Requiring a prescription is counted as a restriction for Plan B products, which are available for purchase over the counter.
Utilization Controls and Restrictions for Emergency Contraceptives

In the case of ella, which requires a provider prescription, fewer states apply utilization controls across states compared to Plan B OTC products (Table 10). Only seven states note any kind of utilization control for ella, with quantity limits the most prevalent limitation. The most common utilization restriction imposed by states, other than requiring a prescription for OTC products is quantity control (6 states). Two states restrict the place of dispensing to pharmacies and Washington allows pharmacists to dispense OTC emergency contraceptives directly to the client without prescription. Appendix Tables A3 and A4 include more detail on state responses to survey questions concerning how states cover of emergency contraception.

Seven states cover Plan B products but do not cover other methods of OTC contraceptives (Georgia, Maine, Missouri, North Carolina, Tennessee, Vermont, and West Virginia). Of the 41 responding states, most require prescriptions for OTC products (29 states), including Plan B (27 states).

Table 10: State Utilization Controls for Emergency Contraceptives
Utilization Controls – Ella (Rx)States with Utilization Control Policies
Quantity Limits (5)AR, CA, IL, MN, NY,
Place of dispensing controls (1)GA (pharmacy benefit only)
Gender controls (2)AR, CA
On PDL (1)MS
Utilization Controls – Plan B (OTC) 
Requires Prescription (27)AK, AR*, AZ, CA, CO, CT, DC, DE, HI, IA, MA, ME*, MI, MO*, MT, NC*, NH, NM, NV, OH, OK, TN*, TX, VA, VT*, WV*, WY
Quantity Limits (6)AR, CA, IL, ME, MN, NY,
Place of dispensing controls (2)GA, TX (pharmacy benefit only)
Gender Controls (2)AR, CA
Prior Authorization (1)VT*
Age Controls (1)GA
* Arkansas requires a prescription within the ACA Medicaid expansion population only.Georgia, Maine, Missouri, North Carolina, Tennessee, Vermont, and West Virginia do not cover OTC contraceptives except for Plan B emergency contraception.Vermont requires prior authorization for Plan B brand only. Other products are covered with a prescription.

Over-the-Counter (OTC) Contraceptives

Key Findings: OTC Contraceptives

There is more variation in coverage for over-the-counter contraceptive methods compared to prescription methods. A number of states also require prescriptions for these methods to be covered by Medicaid.

In addition to emergency contraceptive options discussed above, states were asked about their Medicaid coverage policies for male condoms, spermicide and sponges which are available over the counter to the public. Under the ACA, full scope Medicaid expansion pathways must cover prescription methods, but the requirement does not apply to over the counter methods. The survey found more variability between states and between eligibility groups for over-the-counter methods, compared to prescription methods.

Fewer than half of responding states (20 states), cover all three types of OTCs in all eligibility pathways available within the state. Ten states do not cover any of the three OTC products in any Medicaid program: Alabama, Georgia, Idaho, Kentucky, Maine, Missouri, North Carolina, Tennessee, Vermont and West Virginia. As illustrated in Table 11, male condoms and spermicide are covered in 27 of the 41 responding states and the sponge in 26 states. All three types of contraceptives were covered for ACA Medicaid expansion groups in 18 states of the 25 states with that eligibility pathway. Most of the responding states with a family planning waiver or SPA cover male condoms, spermicide and sponges (18, 17, and 17 states respectively). Appendix Tables A5 and A6 provide additional detail on state coverage of OTCs and utilization controls applied and coverage of OTC contraceptives in each of the eligibility pathways.

Table 11: Medicaid Coverage of OTC Contraceptives
Traditional Medicaid(n=41)ACA Medicaid Expansion(n=25)Family Planning Waiver/SPA(n=23)Not Covered in Any Program
Male Condoms27181811
Spermicide27181712
Sponges26181713
Utilization Controls for Over-the-Counter Contraceptive Supplies

Only six states noted no restrictions for any of the three OTC supplies for which they provide coverage: Illinois, Indiana,12  Maryland, Minnesota, Nebraska and Oregon (Table 12). Requiring a prescription is the most common utilization control for OTC contraceptive supplies. This is likely due, at least in part, to the established reimbursement mechanism to pharmacies for prescription drugs. Twenty-two states require a prescription or other form of documentation for OTCs. Michigan requires a prescription for spermicide and sponges purchased OTC, but does not require a prescription for condoms. Delaware also requires a prescription for both spermicide and sponge contraceptives, but does not cover male condoms.

Some states noted differences in coverage of OTCs based on whether the supply was obtained through a pharmacy benefit or through a clinic (point of service). For example, Virginia restricts access to all three OTC types to pharmacy dispensing only with a prescription. Connecticut does not cover spermicide under the retail pharmacy benefit (but does cover condoms that contain spermicide). Under the medical benefit, spermicide is covered when provided by an enrolled family planning clinic or from a medical/surgical supplier. Texas only allows reimbursement to family planning agencies for dispensing male condoms and spermicide. In Mississippi, condoms are only reimbursable through a medical claim for family planning waiver participants.

Table 12: Methods Used by States to Restrict Utilization of OTC Contraceptive Supplies
Male CondomSpermicideSponges
No restrictions (6)IL, IN, MD, MN, NE, ORIL, IN, MD, MN, NE, ORIL, IN, MD, MN, NE, OR
Quantity/Claim limits (3)CA, MI, OHCA, OHCA
Point of service restriction (4)MS, TX, VACT, TX, VAVA
Prescription or other documentation required (22)AK, AZ, AR, CA, CO, CT, DC, HI, IA, MA, MT, NV, NH, NM, NY, OH, OK, SC, VA, WA, WYAK, AZ, AR, CA, CT, DE, DC, HI, IA, MA, MI, MT, NV, NH, NM, NY, OH, OK, SC, VA, WA, WYAK, AZ, CA, CO, DE, DC, HI, IA, MA, MI, MT, NV, NH, NM, NY, OH, OK, SC, VA, WA, WY
Prior authorization (1)OHOH
* Ohio requires prior authorization to exceed quantity limits (36/month for condoms;1/month spermicide)

Sterilization Procedures

Key Finding: Sterilization

Coverage of sterilization services varied by eligibility pathway. States must cover surgical and implant sterilization procedures for women under ACA Medicaid expansion, and all of the responding states reported that they cover these procedures in Traditional Medicaid as well. However, not all family planning expansion programs cover these services.

This survey inquired about states coverage of sterilization procedures for women (tubal ligation and non-surgical essure) and men (vasectomy). As with FDA-approved reversible methods, the ACA requires coverage under the ACA Medicaid expansion to include surgical and non-surgical sterilization procedures for women. The requirement does not apply to vasectomy for men.

Federal Rules for Payment of Sterilization

Federal funds can only be used to pay for the sterilization of an individual when:

a) The individual is at least 21 years old at the time consent is obtained;

b) The individual is not a mentally incompetent individual;

c) The individual has voluntarily given informed consent in accordance with all the requirements prescribed in §§441.257 and 441.258; and

d) At least 30 days, but not more than 180 days, have passed between the date of informed consent and the date of the sterilization, except in the case of premature delivery or emergency abdominal surgery. An individual may consent to be sterilized at the time of a premature delivery or emergency abdominal surgery, if at least 72 hours have passed since he or she gave informed consent for the sterilization. In the case of premature delivery, the informed consent must have been given at least 30 days before the expected date of delivery.

Source: 42 CFR §441.253

The federal government requires states to cover sterilization procedures only when certain conditions are met. These requirements are intended to protect against coercive practices that had historically forced sterilizations upon marginalized groups, including low-income women, women with disabilities, women of color, and incarcerated women.13  Protections against these practices include requiring women to sign an informed consent form at least 30 days prior to a procedure as well as prohibition of federal matching funds for the sterilization of a mentally incompetent or institutionalized individual.

Most states with a Family Planning waiver or SPA also cover the procedures for women (Table 13), but there are exceptions. Ohio and Oregon do not cover tubal ligation (neither general nor post-partum) in their family planning programs. Connecticut, Georgia, Missouri, and Mississippi do not cover tubal ligation performed post-partum in their family planning programs, with Georgia noting that pregnant women are not enrolled in the state’s family planning waiver.

Although vasectomy is not a required benefit, all but two of the surveyed states covered this service for men. The District of Columbia and Hawaii, do not provide the benefit in their ACA Medicaid expansion programs. In Michigan, Missouri, Wyoming, Georgia and Maryland, only women are enrolled in their family planning waivers so they didn’t cover vasectomies. Ohio’s’ family planning SPA included men, but also did not cover vasectomies.

In the survey, three states noted utilization controls. North Carolina noted that only one procedure is allowed per lifetime. Kentucky requires prior authorization for vasectomies. Alabama will not pay for family planning services after a sterilization procedure has been conducted and also requires prior authorization for Essure.

Table 13: Number of States Covering Sterilization Procedures, by Type of Program
ProcedureTraditional Medicaid(n=41)Family Planning Waiver/SPA(n=23)ACA Medicaid Expansion(n=25)
Tubal Ligation Post-Partum4117Required
Tubal Ligation General4121Required
Essure: Non-surgical4119Required
Vasectomy411723

Fertility Services

Key Finding: Fertility Services

No state covers fertility treatments for either women or men. Some states cover diagnostic testing related to fertility, although some restrict the test for medical reasons other than for fertility.

There are no federal requirements for state Medicaid programs to cover fertility testing or treatment such as medications, intrauterine insemination, or in-vitro fertilization for individuals enrolled in Medicaid. States may cover diagnostic services to detect the underlying medical reasons for infertility.

States were asked about diagnostic testing for both women (laparoscopy) and men (semen analysis). Nine of the 41 responding states cover fertility testing for women and men in their traditional Medicaid program as do 6 of the 25 responding ACA expansion states (Table 14). Just 3 of 23 states cover testing for women (Maryland, Minnesota, Oklahoma) and men (Alabama, Maryland, Minnesota) under a family planning waiver or SPA. Overall, five states provide the coverage for both genders in all of their eligibility pathways: Arkansas, Hawaii, Massachusetts, Maryland, and Nebraska. Notably, Nebraska is the only state that indicated it provides women with medication such as clomid and hCG, but only when infertility is a symptom of a separate medical problem. Appendix Tables A7 and A8 detail fertility testing policies for women and men.

Table 14: Fertility Testing and Services in State Medicaid Programs, by Type of Program
Traditional Medicaid(n=41)ACA Medicaid Expansion(n=25)Family Planning Waiver/SPA(n=23)
Diagnostic Testing for Women 963
Diagnostic Testing for Men 963
Medications for women (Clomid, hCG)110
Intrauterine Insemination000
In-vitro Fertilization000

Family Planning Support Services

Key Finding: Family Planning Support Services

There is broad coverage for some family planning-related services such as counseling and well woman visits, but considerably fewer states reported they cover screenings for intimate partner violence.

Family planning services are an integral component of comprehensive primary, preventive, and sexual health care. The survey asked states about their coverage policies for family planning support services including contraceptive counseling, contraceptive follow-up and side effects management, well woman visits and check-ups, and intimate partner violence (IPV) screening. Nearly all states indicated that they cover support services, but this varied across eligibility pathways (coverage is required for ACA expansion programs), and some states indicated the service is not separately reimbursable, but is a component of some other type of office visit.

Coverage across Eligibility Pathways

Six states noted that contraceptive counseling is provided as a component of an office visit and is not separately reimbursable: Alaska, Alabama, Connecticut, Washington and West Virginia indicated the service is a component of a clinic or office visit and Georgia noted the service is a component of a family planning visit. In 2012, Illinois implemented a special initiative to pay an enhanced rate for family planning counseling services to select providers that have a family planning focus.

Coverage varied considerably across eligibility pathways for IPV screening (Table 15). Of the responding states with a family planning waiver or SPA, 16 out of 23 cover IPV screening. Nine states noted that intimate partner violence screening would be included in the context of other types of office visits or services. Maryland, Missouri, New Mexico, Virginia and Wyoming do not cover IPV screening in either their family planning waiver/SPA or in their traditional Medicaid program.

Limitations and Utilization Controls

A few states reported utilization controls for family planning support services. North Carolina allows one annual visit and six follow up exams for contraceptive counseling and follow up in its family planning waiver. Well woman visits are limited to one annual exam per year and IPV screening is left to the discretion of the provider. Alabama allows one initial visit, one annual visit and four periodic visits for contraceptive side effects management and for well woman visits. Contraceptive counseling is considered a component of these visits. The state also covers IPV screening for family planning waiver recipients receiving care coordination (not available under traditional Medicaid). Ohio provides one well woman or checkup visit per year.

Table 15: Coverage for Family Planning Services
 Traditional Medicaid(n=41)Family Planning Waiver/SPA(n=23)Covered as a componentof an office visit or other serviceNot Covered in Either Program
Contraceptive Counseling40226MD
Follow-up Visit/Side Effects Management41221
Well Woman Visits/Check-ups41224
Intimate Partner Violence Screening35169*MD, MO, NM, VA, WY
NOTES: *West Virginia’s Right from the Start program assesses each prenatal and infant client for partner or household violence. The state requires that the screening happen once, but the Designated Care Coordinator (DCC) is free to complete the assessment for partner violence at any time it is felt necessary. Service is billed under care coordination. The state also noted that screening is a component of a mental health assessment.Alabama provides screening under its care coordination benefit for family planning recipients.Oregon provides the service in its family planning waiver in the context of a contraceptive management visit. Connecticut, Illinois, Michigan, Montana, and Washington report that the service is provided with a clinic or routine office visit. Georgia noted the service is a component of a family planning visit.

Cervical And Breast Cancer Services

The survey asked states about their policies with respect to coverage of services for cervical and breast cancers under their traditional programs and family planning expansion programs. These include the HPV vaccine, pap smear and follow up testing after abnormal laboratory results, mammograms, genetic (BRCA) screening for high-risk women, and breast cancer preventive medication for high-risk women. These services are required coverage for the ACA expansion group as they are recommended by the US Preventive Services Task Force.

Cervical Cancer Services – PAP Test and Follow Up, HPV Vaccine

Key Finding: Cervical Cancer Services

All states cover Pap screening for cervical cancer regardless of eligibility pathway, but follow-up tests for abnormal screening results are less likely to be covered in state family planning waivers or SPAs. Of the states that do provide coverage, many indicate that the procedures or services are covered as part of a family planning visit under a family planning waiver or SPA, rather than as a specific benefit.

The survey inquired about coverage of pap and lab testing as well as additional screening procedures subsequent to an abnormal result from the pap test. These procedures include:

  • Colposcopy is a procedure to examine the cervix following abnormal pap smear results. The procedure may include extracting a small sample of tissue (biopsy) during the examination.
  • LEEP, Loop Electrosurgical Excision Procedure, is a treatment for abnormal cells on the cervix, using a thin wire loop that has an electric current to remove the abnormal tissue. LEEP may be performed after abnormal cells are discovered during a pap test, colposcopy or biopsy.
  • HPV DNA testing consists of using one of various biologic tests on a sample of tissue to detect the presence of DNA or RNA from the human papilloma virus.

Coverage across Eligibility Pathways

All of the states responding to the survey provide coverage for pap smear and lab in all three Medicaid pathways. All states participating in the survey cover the three follow-up screening methods in their traditional Medicaid and ACA Medicaid expansion programs, except North Carolina, which does not cover HPV DNA testing through any Medicaid pathway offered in the state. Coverage of the three follow-up screening methods varies more in state family planning programs (Table 16). Five states do not cover any of the three follow-up procedures in their family planning waiver or SPA: North Carolina, Oklahoma, Oregon, Virginia and Washington. Four states cover HPV DNA testing within their family planning waiver or SPA, but do not cover colposcopy or LEEP: Alabama, Michigan, South Carolina and Wyoming. Missouri covers colposcopy and HPV DNA testing, but does not cover LEEP.

All but one state (South Carolina) cover HPV vaccines for young adults in their traditional Medicaid programs, but only 14 of 23 states cover HPV vaccines in their family planning waiver or SPA despite the widespread coverage for pap screening. States must cover the vaccine for ACA expansion groups, as all vaccines recommended by the national Advisory Committee on Immunization Practices (ACIP) are included in the ACA’s preventive services coverage requirement.

Utilization Controls

Only two states noted utilization controls for cancer screening methods. California restricts utilization to women ages 21 through 65 regardless of sexual history. Colorado limits a pap smear and lab to one per year unless additional screens are determined to be medically necessary.

Table 15: Coverage of Cervical Cancer Services
Traditional Medicaid(n=41)ACA Medicaid Expansion(n=25)Family Planning Waiver/SPA(n=23)Covered in Context of Family Planning Visit
HPV Vaccine40Required14: AL, CT, IA, IN, MD, MN, MO, MS, MT, NH, NM, OH, OK, WY
PAP Smear and Lab41Required23: AL, CA, CT, GA, IA, IN, MD, MI, MN, MO, MS, MT, NC, NH, NM, NY, OH, OK, OR, SC, VA, WA, WYCA, IA*, MO, OR*, VA
Follow- up Procedures with Abnormal Pap
Colposcopy412414: CA, CT, GA, IA, IN, MD, MN, MO, MS, MT, NH, NM, NY, OHIA*, MO
LEEP412413: CA, CT, GA, IA, IN, MD, MN, MS, MT, NH, NM, NY, OH
HPV DNA Testing40ǂRequired18: AL, CA, CT, GA, IA, IN, MD, MI, MN, MO, MS, MT, NH, NM, NY, OH, SC, WYMO
Note: Not covered in SC. ǂ Not covered in NC. *IA: sometimes considered family planning, depending on context of the visit. OR: Pap covered under state family planning waiver when provided in context of a contraceptive management visit.

Breast Cancer Services

Key Finding: Breast Cancer Services

Breast cancer screening is a required benefit in ACA Medicaid expansion programs, but it is considered “optional” under traditional Medicaid; however, all states covered this screening under these two programs.

Few states cover breast cancer screening and prevention services through their family planning waiver or SPA.

The USPSTF recommends three services for women related to detection and prevention of breast cancer: 1) biannual mammograms for women ages 50 to 74 to screen for breast cancer; 2) genetic testing for mutation of the BRCA1 and BRCA2 genes in some women with family members that have breast, ovarian, fallopian tube, or peritoneal cancer; 3) preventive medication for some women with elevated risk of breast cancer. Because these services are all recommended by the USPSTF, they must be covered in Medicaid ACA expansion programs but are not required in traditional or family planning pathways.

Minnesota, Montana, New Hampshire, and New Mexico cover all three services across all of their eligibility pathways. Thirty-three states and DC cover all of these services under traditional Medicaid (Figure 3). All states cover mammograms, and most cover genetic BRCA screening (37 of 41 states), and breast cancer preventive medication (36 of 41 states) for high-risk women under their traditional Medicaid program (Table 17). Maine and South Carolina do not cover BRCA Screening/Counseling nor breast cancer preventive medication in any of the pathways where coverage for these services is optional.

Figure 3: Traditional Medicaid Coverage of Preventative Breast Cancer Services

Coverage of breast cancer screening and prevention under state family planning waivers or SPAs is much less common, with seven of 23 of these programs covering mammograms (Maryland, Minnesota, Montana, New Hampshire, and New Mexico, Ohio, South Carolina) and six states covering BRCA screening and counseling (Minnesota, Montana, New Hampshire, and New Mexico Maryland, Iowa) or preventive breast cancer medication (Minnesota, Montana, New Hampshire, and New Mexico, Ohio, Iowa).

Utilization Controls

No states noted utilization controls for mammograms. Five states have utilization controls applied to BRCA screening and counseling. Michigan, Texas, Vermont and Washington require prior authorization and in Nevada, genetic counseling must precede the testing. Michigan requires prior authorization for preventive medications. Appendix Table A9 provides detail for state responses on breast cancer services.

Table 17: Coverage for Breast Cancer Screening and Prevention
Traditional Medicaid(n=41) ACA Medicaid Expansion(n=25)Family Planning Waiver/SPA(n=23)
Mammogram41Required7
Genetic (BRCA) Screening and Counseling for High-Risk Women37Required6
Breast Cancer Preventive Medication for High-Risk Women36Required6

Managed Care And Family Planning Services

Key Finding: Managed Care and Family Planning Services

Most of the responding states have capitated contracts that include family planning in the capitation rate. Just over one-third of these states explicitly address potential utilization controls on family planning services in the contracts.

Managed care is now the predominant delivery system for Medicaid in most states. Over three in four women of reproductive age covered by Medicaid are enrolled in managed care arrangements.14 

For MCO enrollees, ensuring that federal family planning requirements are met can present special challenges. For example, while MCOs typically limit beneficiaries to a contracted network of providers, in the case of family planning this is not allowed under the federal “freedom of choice” policy. Beneficiaries are entitled to see any Medicaid provider for family planning care, but may not be aware of this right. Some providers have also reported difficulty receiving reimbursement if they are not part of an MCO network. In capitated arrangements, it can also be difficult to know whether the state is obtaining the higher 90% matching rate applicable to family planning services. This survey included questions that explore the role of capitated MCOs in providing family planning services to women enrolled in Medicaid.

Of the 41 states responding to this survey, 31 reported contracting with capitated MCOs and 29 of these states indicated that family planning supplies and services are always included within the MCO capitation rate (Table 18). Two additional states, New York and Texas, indicated that some or all family planning services are carved-out of MCO contracts only but for MCOs claiming a “conscience” or religious exemption from the requirement to provide family planning services.

Twenty-five of the 31 responding states with MCOs reported that they claimed the higher 90 percent federal matching rate (“FMAP”) for family planning services provided through the MCO while five states15  indicated that they did not.

Table 18: State Reporting on Capitated MCO Contracts
YesNo
State has capitated MCO contracts? (N=41)3110
State include family planning within capitation rates? (N=31)

29 – Always2 – Sometimes

State claims 90% FMAP for family planning services provided through an MCO? (N=31)256*
MCO states contract with MCO with religious exemption? (N= 31)427
MCO contract addresses family planning utilization controls? (N=31)1120
* South Carolina was in the process of claiming 90% FMAP

In addition to New York and Texas, only two other states (California and Oregon) reported having contracts with MCOs having a conscience or religious exemption from the requirement to provide family planning services. Only California reported having a referral process for enrollees in these plans, requiring the MCO to arrange for the timely referral and coordination of family planning services and to demonstrate the ability to arrange, coordinate and ensure provision of services through referrals at no additional expense to the state. The MCO is also required to identify these services in its Member Services Guide.

Key Finding: Faith-Based Plans

California and New York, states with the most beneficiaries, also contract with faith-based plans that oppose some forms of contraception. While California reported that they have a process in place for referral for family planning services for the beneficiaries in these plans, New York did not report a referral practice.

States were also asked whether their contracts with MCOs explicitly address how MCOs can use prior authorization, step therapy or other medical management controls for contraceptives. Eleven of the 31 of the responding states with MCO contracts answered “Yes.” Of these, three states (Illinois, Massachusetts and Texas) indicated that their MCO contracts prohibit prior authorization requirements for contraceptives and Arizona reported that MCOs are “not allowed to create barriers to contraceptive utilization.” Conversely, Maryland indicated that prior authorization and quantity limitations are permitted and Delaware reported that MCOs are required to follow the state’s preferred drug list, which includes contraceptive agents. Three states (Illinois, Maryland and New Mexico) said that MCOs are required to cover all FDA-approved contraceptives. Appendix Table A10 provides additional detail for state managed care policies.

Conclusion

Conclusion

The analysis of state responses to this survey found that overall most states cover a broad range of prescription contraceptive methods in their full scope traditional Medicaid program, their full scope ACA Medicaid expansion, and the family planning expansion programs. Thirty-six of 41 surveyed states report that they cover all prescription contraceptives for women through their full scope programs. While states are not required to cover all methods under all pathways, most do. However, there is more variation between and within states for coverage of over-the-counter contraceptives, including condoms and Plan B emergency contraception pills. In some cases, when states provide coverage, it is only with a prescription which can limit access to these safe and effective methods.

Under traditional Medicaid, many screening and preventive services that are considered family planning “related services”, such as screening for partner violence and preventive therapies for breast cancer for women at elevated risk are optional. While coverage is provided for many women who qualify for the full scope pathways (traditional Medicaid or ACA expansion), coverage is less consistent for women who qualify for family planning expansions programs (SPA or Waiver). These are services that often allow providers to address underlying health and personal issues that affect sexual and reproductive health for women and men; limited reimbursement options mean that many will not get these services because providers do not have a way to charge for this care. This is not an issue that is unique to family planning and has long plagued the health care system for a broad array of preventive health care issues.16 

The survey also finds that several states are actively working to promote access to LARC contraception methods. Most states provided coverage for the different types of IUDs that are available under all of their pathways and without utilization limits such as prior authorization or step therapy. Use of LARCs has increased significantly in recent years and the provider community has been encouraging greater use. Most recently, the American College of Obstetricians and Gynecologists endorsed broader provision of LARC methods postpartum.17 

However, there are a number of financial and administrative disincentives that have made it challenging for clinicians to facilitate access to LARCs for women who want them. Policies including the integration of the cost of postpartum LARC insertion with the global maternity fee, low reimbursement levels, and administrative requirements can make it difficult for providers to retain a stock of IUDs. Given that Medicaid finances roughly half all birth in the US, state Medicaid policy on reimbursement of post-partum LARCs has the potential to broaden access to these effective methods for women who desire them. An April 2016 bulletin from CMS outlines a number of options for states to facilitate the use of post-partum LARC, including: increasing reimbursement, unbundling post-partum LARC insertion from the typical maternity care global fee, reducing administrative and logistical barriers to stocking IUDs, and providing them the same day a patient visits her provider.18  The survey finds that a number of states are providing payment separate from the maternity fee for postpartum LARCs, a change that has likely taken place in recent years as documented by other research.19 

Medicaid enrollment has risen significantly since the ACA’s passage and could further increase if all states take up the ACA option to expand the program to all individuals living below 138% of the poverty level. Short of that, some of the states that have chosen not to expand full scope Medicaid have opted to establish family planning programs through Medicaid waivers or SPAs. These programs offer access to some family planning services, particularly contraceptives, but often not to the same degree as full scope Medicaid. Access to the full range of contraceptive methods as well as related family planning services has become a standard of comprehensive health care for women and men in their reproductive years.20  As enrollment in the Medicaid program continues to grow as a result of the ACA, coverage of family planning services under Medicaid will continue to be a significant force in shaping access to sexual and reproductive health services for low-income women and men in years to come.

Endnotes

  1. Food and Drug Administration (FDA), Approved methods of contraception for women. ↩︎
  2. Gavin, L., et al. Providing Quality Family Planning Services, MMWR, April 25, 2014. ↩︎
  3. Kaiser Family Foundation; Status of State Action on the Medicaid Expansion Decision; As of January 12, 2016; Since July 1, 2015 Alaska implemented a Medicaid expansion (9/1/2015) as did Montana (1/1/2016) and Louisiana’s (7/1/2016). ↩︎
  4. Guttmacher Institute, Medicaid Family Planning Eligibility Expansions, State Policies in Brief, as of October 1, 2015. ↩︎
  5. Gold, RB. “Doing More for Less: Study Says State Medicaid Family Planning Expansions Are Cost-Effective.” Guttmacher Report on Public Policy, March 2004. ↩︎
  6. Kaiser Family Foundation. Status of State Action on the Medicaid Expansion Decision. ↩︎
  7. Kaiser Family Foundation. Women and Health Insurance, November 2013 ↩︎
  8. Cooper, C., et al. Interpregnancy Intervals in the United States: Data From the Birth Certificate and the National Survey of Family Growth, National Vital Statistics Reports, April 16, 2015. ↩︎
  9. All Patient Refined Diagnosis Related Group. Currently three major versions of the DRG in use include: basic DRGs, All Patient DRGs, and All Patient Refined DRGs. DRGs, used by Medicare, measure the typical resource use of an inpatient stay. AP-DRGs are similar to DRGs, but also include a more detailed DRG breakdown for non-Medicare patients such as newborns and children. The APR-DRG structure is similar to AP-DRG, but also measures severity of illness and risk of mortality in addition to resource utilization. See: Jason Shafrin; What is the Difference Between DRGs, AP-DRGs and APR-DRGs; Healthcare Economist; June 2012; accessed at: http://healthcare-economist.com/2012/06/19/what-is-the-difference-between-drgs-ap-drgs-and-apr-drgs/ ↩︎
  10. This survey was conducted prior to California’s implementation of policy requiring Medicaid plans to cover 12 month supply of oral contraceptives. ↩︎
  11. Plan B, progestin, brand names include Plan B One Step, Next Choice One Dose, My Way and Take Action. ↩︎
  12. In Indiana, contraceptive drugs and supplies may be administered, dispensed, prescribed, or ordered. However, for a pharmacy provider to be reimbursed for over-the counter external contraceptive supplies, a Medicaid practitioner with prescriptive authority must prescribe them. IHCP Bulletin BT201301; January 8, 2013 accessed at: http://provider.indianamedicaid.com/ihcp/Bulletins/BT201301.pdf. ↩︎
  13. 42 CFR §441.250 through 441.259 ↩︎
  14. Kaiser Family Foundation, Medicaid’s Role for Family Planning, July 2015. ↩︎
  15. One of the five states reporting that it does not claim the 90 percent FMAP (Idaho) contracts with only one MCO to provide services in the state’s Medicare Medicaid Coordinated Plan (MMCP), a type of Fully Integrated Dual Eligible Special Needs Plan that enrolls individuals over the age of 21 that are eligible for both Medicare and Medicaid. For a description of the MMCP, see: http://healthandwelfare.idaho.gov/Medical/Medicaid/MedicaidParticipants/MedicareMedicaidCoordinatedPlan/tabid/2538/Default.aspx. ↩︎
  16. Yarnall, et al. Primary Care: Is there Enough Time for Prevention?, AJPH, 2002. ↩︎
  17. ACOG Committee on Obstetric Practice (2016). Immediate Postpartum Long Acting Reversible Contraception. ↩︎
  18. Centers for Medicare and Medicaid Services (2016). State Medicaid Payment Approaches to Improve Access to Long-Acting Reversible Contraception. ↩︎
  19. Moniz, M., et al.  Medicaid Administrator Experiences with the Implementation of Immediate Postpartum Long-Acting Reversible Contraception, Women’s Health Issues, May-June 2016. ↩︎
  20. Gavin, L., et al. Providing Quality Family Planning Services, MMWR, April 25, 2014. ↩︎
News Release

Average Annual Workplace Family Health Premiums Rise Modest 3% to $18,142 in 2016; More Workers Enroll in High-Deductible Plans With Savings Option Over Past Two Years

Average Deductible Rises 12% to $1,478 Annually for Covered Workers Who Have Them; At Small Firms, Average Deductibles Now Top $2,000

Published: Sep 14, 2016


Few Employers Report Changing Workers’ Hours Due to ACA’s Employer Requirements; Those That Do Are More Likely to Shift Workers to Full-Time Status

Menlo Park, Calif. – Annual family premiums for employer-sponsored health insurance rose an average of 3 percent to $18,142 this year, a modest increase at a time when workers’ wages (2.5%) and inflation (1.1%) also grew modestly, according to the benchmark Kaiser Family Foundation/Health Research & Educational Trust (HRET) 2016 Employer Health Benefits Survey released today. Workers on average contribute $5,277 annually toward their family premiums.

This year’s low family premium increase is similar to last year’s (4%) and reflects a significant slowdown over the past 15 years. Since 2011, average family premiums have increased 20 percent, more slowly than the previous five years (31% increase from 2006 and 2011) and more slowly than the five years before that (63% from 2001 to 2006).

“We’re seeing premiums rising at historically slow rates, which helps workers and employers alike, but it’s made possible in part by the more rapid rise in the deductibles workers must pay,” KFF President and CEO Drew Altman said.

The recent trend in part reflects covered workers moving into high-deductible plans compatible with Health Savings Accounts (HSAs) or tied to Health Reimbursement Arrangements (HRAs).  These plans have lower average premiums than other plan types.

In 2016, 29 percent of all workers were in such plans, up from 20 percent in 2014, while a shrinking share of workers (48% in 2016, down from 58% in 2014) are enrolled in Preferred Provider Organization (PPO) plans, which have higher-than-average premiums. These shifts effectively reduced the average premium increase by half a percentage point in each of the past two years, the analysis shows.

EHBS_slides_for_initial_graphics_1.png

Again, partly as a result of this trend, the survey finds average deductibles continuing to rise for covered workers. In 2016, 83 percent of covered workers face a deductible for single coverage, which averages $1,478.  That’s up $159 or 12 percent from 2015, and $486 or 49 percent since 2011. The average deductible for workers who face one is higher for workers in small firms (three to 199 employers) than in large firms ($2,069 vs. $1,238).

For the first time, the survey also finds half (51%) of all covered workers face deductibles of at least $1,000 annually for single coverage. This includes two thirds (65%) of workers at small firms (three-199 workers), who typically face higher deductibles than workers at large firms (200 or more workers).

In some cases, employers make contributions to tax-preferred HSAs or HRAs, which workers can use to pay part or all of their deductible expenses, thereby reducing their effective deductible. Counting employer contributions this way would reduce the share of covered workers with deductibles of at least $1,000 to 38 percent.

The 18th annual Kaiser/HRET survey of more than 1,900 small and large employers provides a detailed picture of the status and trends in employer-sponsored health insurance, costs, and coverage. In addition to the full report and summary of findings released today, the journal Health Affairs is publishing a Web First article with select findings, and the Foundation is releasing an updated interactive graphic that charts the survey’s premium trends for different groups, including by firm size, region, and industry.

“The importance of this study is its ability to inform decision makers from all sectors as new or emerging strategies for health care coverage are being constructed. This is especially helpful for consumers as they understand health plan structures and what it means for them,” said Dr. Ken Anderson, HRET’s chief operating officer.

EHBS_slides_for_initial_graphics_2.png

This year, the Affordable Care Act provision requiring employers with at least 50 full-time equivalent employees to offer health benefits to full-time workers or pay a penalty took full effect.  The survey finds 93 percent of firms with at least 50 employees offer health benefits to at least some employees, and the vast majority say their coverage meets the ACA’s requirements for value and affordability.

The survey also finds little evidence that businesses are reducing workers’ hours to avoid the law’s requirements to offer coverage.  In fact, more employers with 50 or more full-time equivalent workers who offer coverage say they shifted or plan to shift workers’ hours from part-time to full-time status to make them eligible for health benefits (7%) than say they shifted or plan to shift workers from full-time to part-time status to make them ineligible (2%).

Overall 56 percent of employers offer health benefits to at least some of their workers this year, statistically unchanged from 57 percent last year.  Offer rates vary by firm size, with less than half (46%) of the smallest firms (three to nine workers) offering coverage and essentially all employers with at least 1,000 workers doing so. Since 2011, the share of firms with 10 to 49 workers who offer coverage has fallen from 74 percent to 66 percent.

This year’s survey finds that while most employers who provide health benefits offer coverage to workers’ spouses, some employers are using a number of strategies that can limit workers and their spouses from enrolling in coverage when other options are available. For example:

  • Among employers that offer spousal coverage, 13 percent of small firms and 5 percent of large ones do not allow a worker’s spouse to enroll in coverage if their spouse is offered coverage from another source. An additional 5 percent of small firms and 8 percent of large ones only allow enrollment under certain conditions. In addition, 12 percent of firms require spouses with other coverage options to pay higher premiums or cost-sharing than other spouses;
  • 10 percent of all offering firms give additional compensation to workers who enroll in their spouse’s health plan instead of the company’s plan. This share is similar for large and small firms.
  • Among firms offering family coverage, 45 percent of small businesses and 18 percent of larger ones contribute the same dollar amount towards premiums for workers whether they enroll their dependents or not. This in effect requires workers to pay the full costs of enrolling their dependents.

“Particularly for workers at small firms, these limitations and incentives can create challenges for low-income workers to afford health coverage for their families,” said study lead author Gary Claxton, a Foundation vice president and director of the Health Care Marketplace Project.

Other findings from the survey include:

  • Single Premiums. Premiums for single coverage now average $6,435 annually, of which workers contribute $1,129 on average.
  • Cadillac tax. The survey provides an updated look at employers’ response to the Affordable Care Act’s excise tax on high-cost health plans, sometimes called the “Cadillac tax,” which is now scheduled to take effect in 2020. Nearly two thirds (64%) of large employers offering health benefits say that they conducted an analysis to determine if any of their plans would exceed the Cadillac tax thresholds, and a quarter (27%) of this group say their largest plan would do so. In addition, 15 percent say they have increased their plan’s cost-sharing to avoid reaching the excise tax thresholds, and 9 percent say they switched to a lower-cost health plan.
  • Health risk assessments. Most large firms offering health benefits (59%) offer to give workers a health risk assessment that asks questions about their medical history, health status, and lifestyle. Of those that do, most (54%) offer financial incentives to encourage workers to complete the assessment, such as reduced premiums or cost-sharing; eligibility for other wellness benefits; or cash, contributions to an HSA, or merchandise.
  • Biometric screenings. As with health risk assessments, most large firms offering health benefits (53%) offer workers biometric screenings, which are health examinations that measure such things as body weight, cholesterol, blood pressure, stress, and nutrition. Most (59%) of these firms offer financial incentives for undergoing the screenings, and some (14%) tie the incentives to meeting specific outcomes such as a targeted body mass index (BMI) or cholesterol level.

Methodology

The annual survey is a joint project of the Kaiser Family Foundation and the Health Research & Educational Trust. The survey was conducted between January and June of 2016 and included 3,110 randomly selected, non-federal public and private firms with three or more employees (including 1,933 that responded to the full survey and 1,177 others that responded to a single question about offering coverage). A research team at Kaiser, HRET and NORC at the University of Chicago, led by Kaiser vice president and long-time project director Gary Claxton, designed, conducted and analyzed the survey. For more information on the survey methodology, please visit the Survey Design and Methods Section.

Founded in 1944, the Health Research & Educational Trust (HRET) is a private, not-for-profit organization involved in research, education, and demonstration programs addressing health management and policy issues. An affiliate of the American Hospital Association (AHA), HRET collaborates with health care, government, academic, business, and community organizations across the United States to conduct research and disseminate findings that shape the future of health care. For more information about HRET, visit http://www.hret.org.

Health Affairs is the leading journal at the intersection of health, health care, and policy. Published by Project HOPE, the peer-reviewed journal appears each month in print, with frequent Web First studies and health policy briefs published at www.healthaffairs.org. The full text of each Health Affairs Web First paper is available free of charge to all website visitors for a one-week period following posting; it then switches to pay-per-view for nonsubscribers. You can also find the journal on Facebook and Twitter. Read daily perspectives on Health Affairs Blog. Download our podcasts, including monthly Narrative Matters essays, on iTunes. Tap into Health Affairs content with the iPad app.

Diminishing Offer and Coverage Rates Among Private Sector Employees

Authors: Gary Claxton, Larry Levitt, and Anthony Damico
Published: Sep 14, 2016

Issue Brief

The recent release of 2015 information from the Insurance Component of the Medical Expenditure Panel Survey (MEPS-IC) shows continuation of the fairly long-term decline in the share of private-sector workers in small firms that are offered coverage and that receive coverage at their job.  This is part of a larger, long-term trend that shows a decline among all private-sector workers in the percentage who are covered by their own employer.  While many of these workers are able to find coverage from other sources, such as coverage as a dependent through a spouse or through a public program, the decline is a concern because employer-based coverage is by far the largest source of coverage in the U.S., and its diminishing reliability puts more workers at risk of being left without a source of coverage.  Workers who are not offered coverage at their job in general are more likely to be uninsured than workers who are.  Among workers aged 18 to 64 at private industries, 28 percent of workers without an offer of employer sponsored insurance (ESI) were uninsured compared to only 4 percent of workers with an offer of ESI1 .  Workers without an offer of ESI are natural beneficiaries of the new coverage options under the Affordable Care Act (ACA), and we find that the rate of uninsurance fell after 2013 among workers in smaller establishments not offered coverage at their job.

We use information from multiple years of the MEPS-IC to look at long-term trends in health insurance offer and enrollment rates in private sector establishments, broken out by size of firm.  Although MEPS-IC surveys state and local government employers, we have limited this analysis to the private sector since a very large share of governments offer health benefits to their workers.  It also is not possible to classify state and local government workers by “firm or establishment size” in the MEPS-IC with available public information.  We also use the National Health Interview Survey (NHIS) to look at health insurance status over time.  NHIS provides the most current coverage information and it permits us to differentiate workers based on whether or not they were offered coverage at their job.  Beginning in 2001, NHIS contains information about the size of the establishment for workers (Generally, “establishment” refers to a business location, while “firm” refers to the whole enterprise and may include multiple locations. See Methods Box for difference between “firm” and “establishment”).

Overall, we find from the MEPS-IC that the percentage of workers in private-sector businesses who work in firms that offer health benefits and who are eligible for those benefits (“Share Offered”) has been falling for many years, as has the percentage of workers covered by health insurance in their own firm (“Share Covered”).  These declines were particularly large for workers in firms with fewer than 50 employees.  The NHIS shows that the uninsurance rate for workers in small establishments who are not offered health insurance at work has been consistent and high over many years, but fell when the new ACA coverage options were implemented in 2014.  While an improvement in the insurance status for these workers, their rates of uninsurance remains considerably higher than those of workers in small establishments who are offered coverage at their job.

Of the almost 120 million private-sector employees in the U.S., not quite one-half (48%) are covered by health insurance offered by their employer in 2015, and this rate has been falling since MEPS-IC began collecting offer and coverage rates in 1996 (Table 1, Appendix).  The share covered has two components:  the share of workers in businesses that offer health insurance who enroll in that insurance, and the share of workers in businesses that do not offer health insurance to any of their workers.  In 2015, about 84% of private-sector workers worked in a business that offered health insurance to at least some of the employees working at the firm, about three-quarters (76%) of those workers were eligible to enroll in the coverage, and of those eligible, three-quarters (75%) enrolled in the coverage.  This means about 57% of private-sector workers in businesses offering coverage were covered at their job, and when combined with the 16% of workers in businesses not offering coverage to any workers, the overall coverage rate was about 48%.  Most of these percentages have declined over time: between 2000 and 2015, the Share Offered fell from 71% to 64%, while the Share Covered fell from 57% to 48%.  The Appendix table displays the complete annual trend in eligibility and enrollment for both all firms and small firms over the period from 1996 to 2015.

 Table 1: Offer and Coverage Rates at All Private Employers
YearShare of All Employees Who Work in Firms That Offer Health Insurance and Who are Eligible to EnrollShare of All Employees Covered At Their Employer
200071%57%
200568%54%
201068%52%
201564%48%
SOURCE: Agency for Healthcare Research and Quality.  Medical Expenditure Panel Survey Insurance Component Tables.

The declines have been more significant for workers in smaller firms (fewer than 50 employees at all locations).  Between 2000 and 2015, the share of workers offered coverage fell from 53% to 38%, while the share covered by their own employer fell from 42% to 27% (Table 2, Appendix).

Table 2: Offer and Coverage Rates at Small Firms (Fewer than 50 Employees At All Locations)
YearShare of All Employees Who Work in Firms That Offer Health Insurance and Who are Eligible to EnrollShare of All Employees Covered At Their Employer
200053%42%
200549%37%
201045%34%
201538%27%
SOURCE: Agency for Healthcare Research and Quality.  Medical Expenditure Panel Survey Insurance Component Tables.

As noted above, many workers who are not offered coverage at work are able to find alternate sources of coverage.  We use the NHIS to look at the insurance status of these workers.

Effect of New Coverage Options

Employees not offered coverage at work have high rates of uninsurance; this is true for all workers and for workers in small establishments (Figure 1).  Unfortunately, the NHIS statistics are reported for “establishments” of fewer than 50 workers, which is a more inclusive grouping than “firms of fewer than 50 workers” reported in MEPS-IC: a firm may have several smaller establishments (for example, a franchise with several small fast food restaurant locations).  This means that the NHIS statistics include information for some workers in smaller establishments owned by larger firms as well as information about smaller firms.  There are no alternative sources of data that would allow us to identify workers in smaller firms over the same period, so the establishment-size information in NHIS is the best approximation that we have.  We excluded government workers from the analysis to more closely match the private-sector workers in the MEPS-IC statistics.

Figure 1: Among Private-Sector Workers Aged 18-64, Percent Uninsured by Health Insurance Offer Status and Establishment Size, 2001-2015

Figure 1 shows the rate of uninsurance among nongovernment workers age 18 to 64.  For those not offered coverage at work, the uninsurance rate ranged between 43% and 51% between 2001 and 2013, before falling to 36% in 2014 and 28% in 2015.  The uninsurance rate was much lower for those offered coverage at work, ranging between 6% and 8% between 2001 and 2013, before falling to 4% in 2015.  The pattern is quite similar for workers in smaller establishments.

Not surprisingly, offers of health insurance are strongly tied to earnings: in 2015 workers offered coverage at work had average earnings of $53,960 while those without an offer had average earnings of just $23,245.  The difference in 2010 (Pre-ACA) was $47,297 for workers offered coverage and $19,684 for those who were not.  Looked at another way, only 42% of worker in the lowest earnings quartile (earnings below $23,400) in 2015 were offered coverage age work, compared with 92% of workers in the highest earnings quartile (earnings greater than $58,900).

We looked at the trends by type of coverage for workers not offered coverage at work to see how the new ACA coverage options were affecting this population (Figure 2).  The ACA particularly benefits low and moderate income workers who are not offered employer-based coverage by providing income-related premium subsidies; it also expanded Medicaid coverage for low-income workers.  After 2013, the uninsurance rate fell sharply for this group of workers, while coverage in both Medicaid and nongroup insurance increased.  The same pattern holds for workers in smaller establishments not offered coverage at work (Figure 3).  Even with these coverage improvements, however, workers not offered coverage at their job remain much more likely to be uninsured than those offered coverage at work.

Figure 2: Among Workers Not Offered Coverage at Work, Selected Health Insurance Coverage Types, 2001-2015
Figure 3: Among Workers at Smaller Establishments Not Offered Coverage at Work, Selected Health Insurance Coverage Types, 2001-2015

Discussion

Private sector firms, particularly smaller firms, have been a diminishing source of coverage for their workers, with long-term decline in both the Share Offered and Shared Covered.  Workers with lower earnings are particularly unlikely to be offered coverage at their job.  While many workers who are not offered or covered at their job have other sources of coverage, such as dependent coverage through a spouse, the uninsurance rate for these workers has been high for many years.  The new ACA coverage options have significantly improved coverage for this group, many of whom can benefit from the subsidized coverage made available in Marketplaces or Medicaid in states that have adopted the ACA coverage expansion.  Despite these advances, however, the uninsurance rate for this group remains higher than the rate for workers offered coverage at work, suggesting that additional steps may need to be considered to improve the affordability of coverage for this population.

METHODS

This Insight relies on the Agency for Healthcare Research and Quality’s Medical Expenditure Panel Survey – Insurance Component (MEPS-IC) dataset for firm-level estimates of offers and take-up (enrollment) of ESI from the start of the survey in 1996 up until the most recent available estimates in 2015.  Although MEPS-IC can be disaggregated by firm-level characteristics such as number of employees and private ownership, its publicly-available data do not include employee-level characteristics (such as worker age or non-ESI sources of health insurance coverage).  In order to investigate the relationship between offers of ESI and workers’ uninsured rate, we used the Centers for Disease Control and Prevention (CDC)’s National Health Interview Survey (NHIS) microdata to examine coverage trends at the worker-level.  Since nearly all Americans aged 65 or older are eligible for Medicare, we restricted our NHIS analyses of the uninsured rate to non-elderly workers at privately-held firms.

Between 2000 and 2001, NHIS altered the text of their workers’ place of employment size question from asking, ‘Thinking about this MAIN job or business, how many people are employed there full and part time, including employees at all locations?’ to instead asking the question ‘Thinking about {this MAIN job or business}, how many people work(ed) at this location? Note to FR: “People” includes both full- and part-time employees; “location” refers to the street address of the workplace.’  Starting in 2001, NHIS began collecting establishment size rather than firm size.  For more detail about the difference between establishments and firms, see the US Census Bureau’s definition. Due to this change, we limited the NHIS component of our analysis to the period from 2001 to 2015.

Although this paper only presents NHIS statistics from establishments with fewer than fifty workers, we also examined the offer and take-up patterns of workers at establishments with fewer than twenty-five workers and found the trends to move in the same direction as workplaces with less than fifty employees.

NHIS has information about which member of a household is the policyholder for employer-sponsored coverage, and also asks workers that do not report employer-sponsored coverage whether or not they were offered coverage at work.  We considered individuals who were working to have been offered coverage at their job if they were a policyholder of employer-sponsored coverage or if they said they were offered coverage at work but did not accept it.

The MEPS-IC tables provide information about the number of private sector employees, the percent of private sector employees in firms that offer health insurance, and the share of private sector employees in firms that offer health insurance who are eligible to enroll and who enroll.  To derive the share of all private sector employees offered coverage, we multiply the number of employees in firms that offer health insurance by the share of employees at offering firms who are eligible to enroll themselves, and divide that number by the total number of employees. To derive the share of all private sector employees enrolled with their employer, we multiply the number of employees enrolled in firms that offer health insurance by the share of employees at offering firms who are eligible to enroll themselves and then divide that number by the total number of employees.  We do this for all private sector employees and for employees in firms with fewer than 50 workers.  By doing this, we do not have standard errors for the final statistics and cannot do statistical testing for the change over time.

We did test year-to-year changes in both the share of employees covered by firms that offer health benefits and also the share of employees that are eligible to enroll at firms that offer health benefits across the period from 1996-2015 for both all private firms and also firms with fewer than 50 employees.  For all private sector workers and for private sector workers in firms with fewer than 50 workers, there were statistically significant declines for the 2000 to 2010 period and for the 2005 to 2015 period in (1) the percent of employees in establishments offering health insurance, (2) the percent of employees that are enrolled in health insurance among employees eligible for health insurance , and (3) the percent of employees that are enrolled in health insurance among employees of establishments offering health insurance.

Appendix

Appendix: Offer and Coverage Rates at Private Employers, 1996-2015
YearFirms that Offer Health InsuranceAll FirmsSmall Firms (Fewer than 50 Employees At All Locations)
Percent of Employees Eligible for Health InsurancePercent of Eligible Employees Enrolled in Health InsurancePercent of Employees in Firms that Offer Health Insurance to Any Worker

Percent of Employees Eligible for Health Insurance

(“Share Offered”)

Percent of Employees  Enrolled in Health Insurance

(“Share Covered”)

Percent of Employees in Firms that Offer Health Insurance to Any Worker

Percent of Employees Eligible for Health Insurance

(“Share Offered”)

Percent of Employees  Enrolled in Health Insurance

(“Share Covered”)

199681%86%87%70%60%62%51%42%
199779%84%86%68%57%62%50%40%
199878%85%87%68%58%65%49%39%
199979%82%89%70%58%68%53%43%
200079%81%89%71%57%68%53%42%
200178%80%89%69%55%65%50%39%
200277%81%88%68%55%64%50%39%
200379%80%87%68%55%62%48%37%
200478%80%87%68%54%61%48%38%
200579%80%87%68%54%62%49%37%
200678%78%87%67%53%61%48%37%
200878%79%88%68%54%62%48%37%
200980%77%88%70%54%60%47%36%
201078%77%87%68%52%58%45%34%
201178%76%85%67%51%55%43%32%
201278%76%85%66%50%53%41%31%
201378%75%85%66%49%53%41%30%
201475%77%83%63%48%50%39%28%
201576%75%84%64%48%48%38%27%
NOTES: 2007 data were not collected for the MEPS-ICSOURCE: Agency for Healthcare Research and Quality.  Medical Expenditure Panel Survey Insurance Component Tables.


Endnotes

  1. Kaiser Family Foundation Analysis of the National Health Interview Survey, 2015. ↩︎