KFF designs, conducts and analyzes original public opinion and survey research on Americans’ attitudes, knowledge, and experiences with the health care system to help amplify the public’s voice in major national debates.
The Trump Administration is pursuing changes that, for the first time, would allow the federal government to take into account the use of federal health, nutrition, and other non-cash public programs, including Medicaid and the Children’s Health Insurance Program (CHIP), when making a determination about whether someone is likely to be a “public charge.” Under these changes, use of these programs by an individual or a family member, including a citizen child, could result in an individual being denied lawful permanent resident status or entry into the U.S.
Such changes would apply to coverage provided to legal immigrants and their citizen children, likely leading to decreased participation in Medicaid, CHIP, Affordable Care Act marketplace coverage and other programs, even though they would remain eligible for them.
A new issue brief from the Kaiser Family Foundation provides an overview of the 10.4 million children in the U.S. with at least one non-citizen parent, a group that potentially would be affected by the changes. It presents different scenarios of disenrollment from Medicaid and CHIP to illustrate the potential effects on their health coverage and discusses the implications for their health and families’ financial stability.
The Trump Administration is pursuing changes that, for the first time, would allow the federal government to take into account use of Medicaid, CHIP, subsidies for Marketplace coverage and other health, nutrition, and non-cash programs when making public charge determinations. These changes would likely lead to decreased participation in Medicaid, CHIP, Marketplace coverage, and other programs among legal immigrants and their citizen children, even though they would remain eligible. This brief provides an overview of citizen children with a noncitizen parent potentially affected by the changes and analyzes three Medicaid/CHIP disenrollment scenarios to illustrate how the changes could potentially affect their health coverage and uninsured rate.
In 2016, there were 10.4 million citizen children with at least one noncitizen parent. Nearly nine in ten of these children live in a family with a full-time worker, but these workers often are in low-wage jobs, leading to lower family incomes and more limited access to health coverage. As such, over half (56%), or 5.8 million, citizen children with a noncitizen parent had Medicaid or CHIP coverage in 2016. (See Appendix tables for state data.)
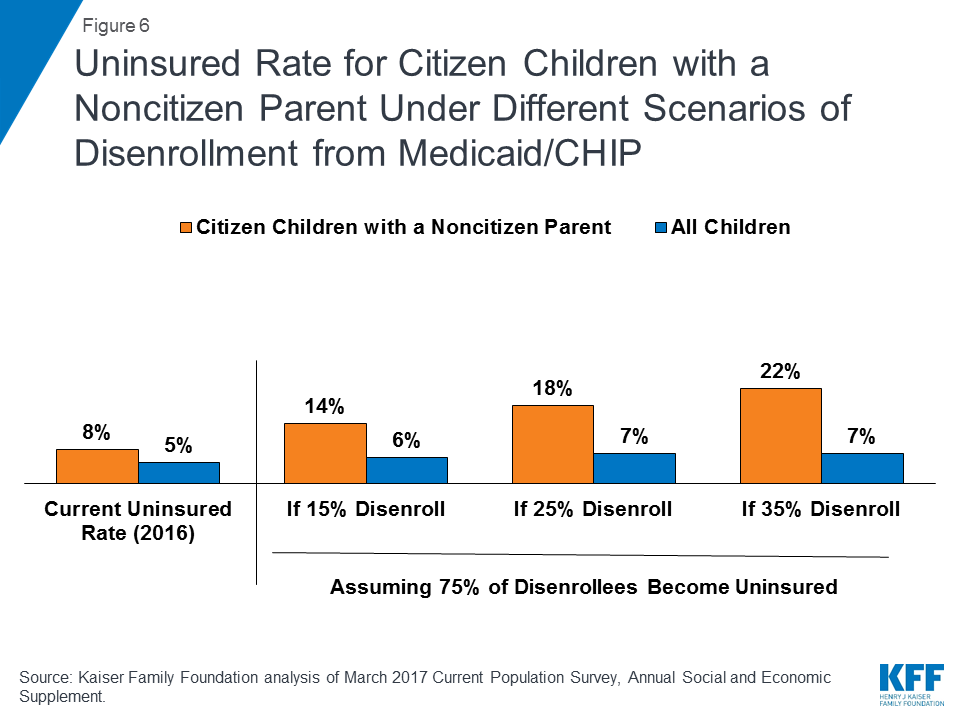
We illustrate the potential impact of different Medicaid/CHIP disenrollment rates and show that, if the policy leads to disenrollment rates from 15% to 35%, an estimated 875,000 to 2 million citizen children with a noncitizen parent could drop Medicaid/CHIP coverage despite remaining eligible. The majority disenrolling would become uninsured, increasing their uninsured rate from 8% to between 14% and 22% and the uninsured rate for all children from 5% to between 6% and 7%. Although it is difficult to predict the effect of the policy change, these disenrollment rates illustrate the potential impact and draw on previous research on the chilling effect welfare reform had on enrollment of immigrant families. However, unlike the current draft policy, welfare reform did not affect immigration status. Thus, this illustrative analysis may underestimate the policy’s impact on Medicaid/CHIP participation. In addition, this analysis does not account for coverage losses that would result from decreased participation in Marketplace coverage.
Coverage losses would negatively affect the health of children and their families’ financial stability. Coverage losses would reduce access to care, contributing to worse health outcomes. Moreover, reduced participation in nutrition and other support programs that are also proposed to be considered as part of public charge determinations would likely compound these effects.
Introduction
The Trump Administration is pursuing changes that, for the first time, would allow the federal government to take into account use of health, nutrition, and other non-cash programs when making public charge determinations. Under these changes, use of these programs, including Medicaid, CHIP, and subsidies for Marketplace coverage, by an individual or family member, including a citizen child, could result in the federal government denying an individual a “green card” or adjustment to lawful permanent status or entry into the U.S. These changes would likely result in reduced participation in Medicaid, CHIP, Marketplace coverage, and other programs by immigrant families, including citizen children, even though they would remain eligible. Decreases in Medicaid and CHIP enrollment would increase the number of uninsured and reduce access to care, increase financial strains on families, and widen disparities in coverage. This brief provides an overview of citizen children with a noncitizen parent who could potentially be affected by the proposed changes and presents three Medicaid/CHIP disenrollment scenarios to illustrate how the changes could potentially affect their health coverage and uninsured rate. It is based on Kaiser Family Foundation analysis of Current Population Survey Data. (See Methods for more details.) Appendix Tables 2 and 3 provide state-specific data.
In 2016, there were 10.4 million citizen children in the U.S. with at least one noncitizen parent. What are the potential effects of “public charge” changes on health coverage for this population?
Overview of Citizen Children with a Noncitizen Parent
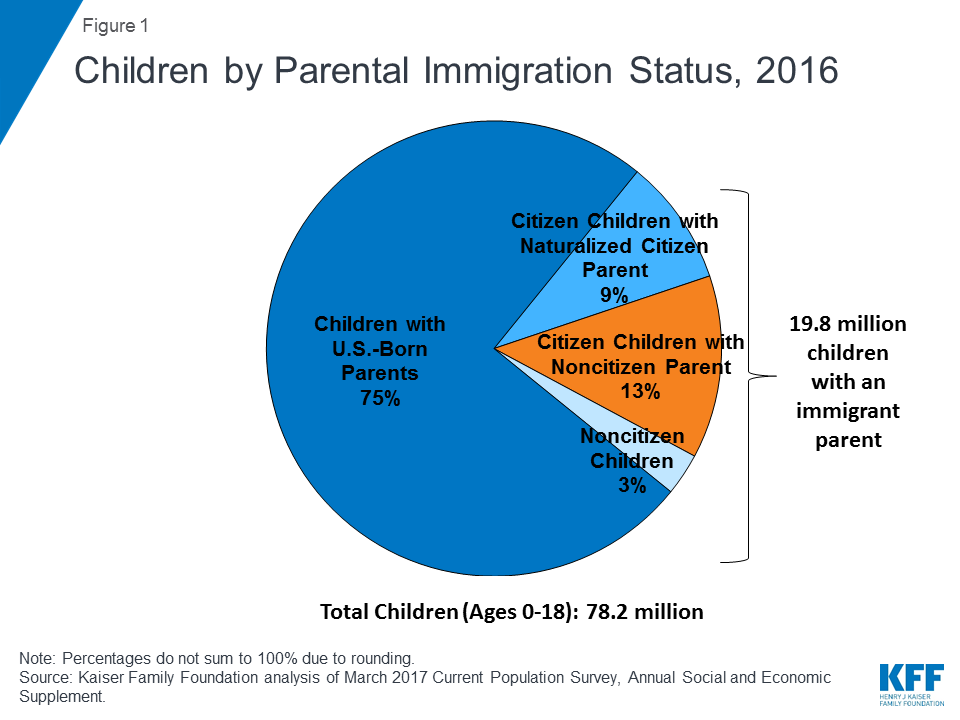
In 2016, nearly 20 million, or one in four, children had at least one immigrant parent, and nearly nine in ten (88%) of these children were citizens (Figure 1). Over half, or 10.4 million, of these children lived in mixed status families, where the child is a citizen and at least one parent is a noncitizen. Citizen children with a noncitizen parent are heavily concentrated in a few states. Over half of children with a noncitizen parent live in California (25%), Texas (16%), New York (7%), and Florida (6%) (Appendix Table 2).
Figure 1: Children by Parental Immigration Status, 2016
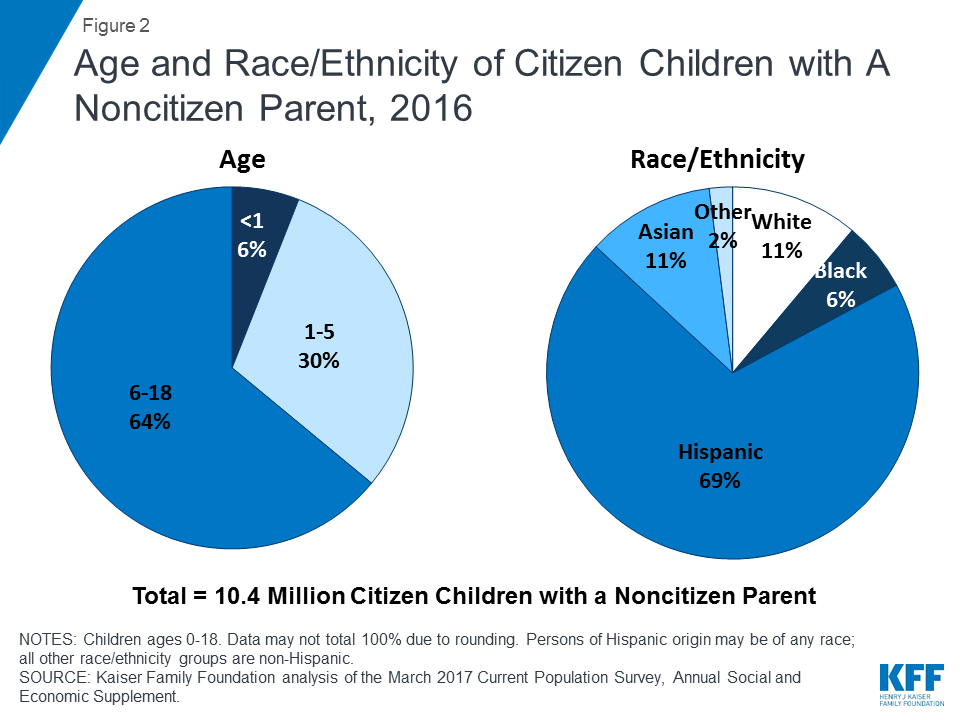
Citizen children with a noncitizen parent range in age and race/ethnicity, although the majority are between ages 6-18 and Hispanic (Figure 2). About one in three (36%) citizen children with a noncitizen parent are below age six; the remaining 64% are between ages 6-18. Over two-thirds (69%) of citizen children with a noncitizen parent are Hispanic and 11% are Asian. The remaining 19% includes 11% who are White non-Hispanic, 6% who are Black non-Hispanic, and 2% who are another or mixed race.
Figure 2: Age and Race/Ethnicity of Citizen Children with A Noncitizen Parent, 2016
Although citizen children with a noncitizen parent are more likely to live in a family with a full-time worker compared to those with U.S. born parents, they have lower family incomes. Nearly nine in ten (86%) citizen children with a noncitizen parent live in a family with at least one full-time worker (Figure 3). However, over two-thirds (67%) of citizen children with a noncitizen parent have family incomes below 250% of the federal poverty level (FPL), compared to 45% of children with U.S. born parents. This finding reflects that noncitizens are often employed in low-wage jobs and industries.
Figure 3: Employment and Income among Children by Parental Citizenship Status, 2016
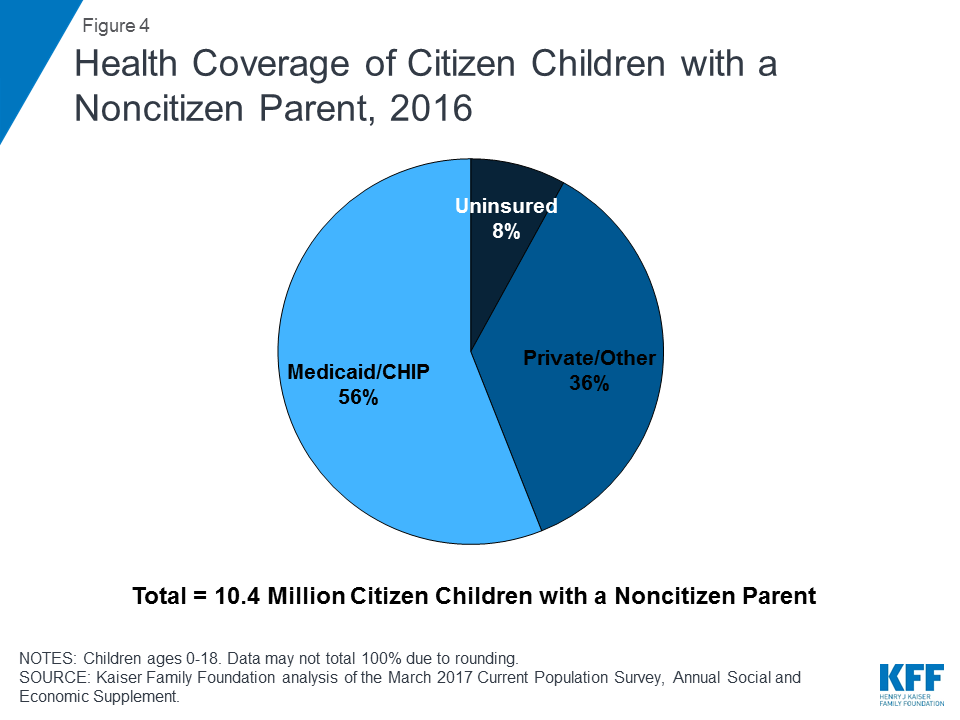
Reflecting their lower family incomes, Medicaid and CHIP play a key role in covering citizen children with a noncitizen parent, but they remain more likely than those with U.S. born parents to be uninsured. Given that over two-thirds of citizen children with a noncitizen parent have family incomes below 250% FPL, many are within the income eligibility limits for Medicaid or CHIP.1 As such, Medicaid and CHIP cover over half (56%), or 5.8 million, citizen children with a noncitizen parent. This coverage helps to fill gaps in private coverage since many noncitizen parents work in low-wage jobs that often do not offer health coverage. However, citizen children with a noncitizen parent remain more likely than children with U.S. born parents to be uninsured (8% vs. 5%). Moreover, their parents are more than three times as likely to be uninsured themselves compared to U.S. born parents (24% vs. 7%).
Figure 4: Health Coverage of Citizen Children with a Noncitizen Parent, 2016
Potential Coverage Losses Due to Public Charge Policies
Under draft changes proposed by the Trump Administration, use of health, nutrition, and other non-cash programs by an individual or a family member, including a citizen child, could result in the federal government denying an individual adjustment to lawful permanent resident status (i.e., a “green card”) or entry into the United States.2 Under longstanding policy, individuals who are determined to be a “public charge” can be denied lawful permanent residence or entry into the U.S. Today, individuals may be determined a public charge if they rely on or are likely to rely on public cash assistance or government funded long-term institutional care. Current policy does not allow the federal government to consider the use of non-cash benefits, such as health and nutrition programs, in public charge determinations. Under the draft proposed changes, the federal government could consider previously excluded health, nutrition, and other non-cash programs in public charge determinations. These programs would include Medicaid, CHIP, and subsidies for Marketplace coverage. In addition, the changes would newly allow the federal government to take into account use of programs by citizen children and other family members in making a public charge determination.
The changes in public charge policy would likely lead to decreased participation in Medicaid, CHIP, Marketplace coverage, and other programs among legal immigrant families, including their citizen children, even though they would remain eligible. Fears of negative consequences on immigration status are a barrier to Medicaid and CHIP enrollment for eligible immigrant families today even though the federal government cannot consider use of Medicaid and CHIP in public charge determinations under current policy.3 The proposed changes would amplify these fears because use of Medicaid, CHIP, as well as subsidies for Marketplace coverage and other programs could negatively affect immigration status. The preamble to the draft proposed rule notes, “the action provides a strong disincentive for the receipt or use of public benefits by aliens, as well as their household members, including U.S. children.” It is expected that the public charge policy change would primarily affect individuals seeking a green card through a family-based petition. However, increased fears would likely extend beyond individuals directly affected by the policy to the broader immigrant community.4 Due to increased fears, it is likely that fewer eligible individuals would enroll themselves and their children in health coverage and individuals currently enrolled in programs would disenroll themselves and their children despite remaining eligible for coverage.
To illustrate potential effects of these changes on health coverage of children, we present three scenarios of disenrollment from Medicaid and CHIP among citizen children with a noncitizen parent. As of 2016, 5.8 million citizen children with a noncitizen parent were enrolled in Medicaid or CHIP (see Appendix 2 for state data), and 790,000 or 8% were uninsured. We applied disenrollment rates from Medicaid and CHIP of 15%, 25%, and 35%. Although it is difficult to predict the effect of the policy change, these disenrollment rates illustrate the potential impact and draw on previous research on the chilling effect welfare reform had on enrollment of immigrant families.5 However, unlike the current draft policy, welfare reform did not affect immigration status. Thus, this illustrative analysis may underestimate the impact that the policy may have on participation in Medicaid/CHIP. We assume that 75% of children disenrolling from Medicaid and CHIP would become uninsured based on data showing some access to private coverage among this population.6 However, some families may not be able to afford private coverage even if it is available. As such, this analysis may underestimate the share of children disenrolling from Medicaid/CHIP who would become uninsured. In addition, this analysis does not account for decreased coverage due to fewer individuals enrolling their eligible children in Medicaid or CHIP or coverage losses that would result from decreased participation in Marketplace coverage.
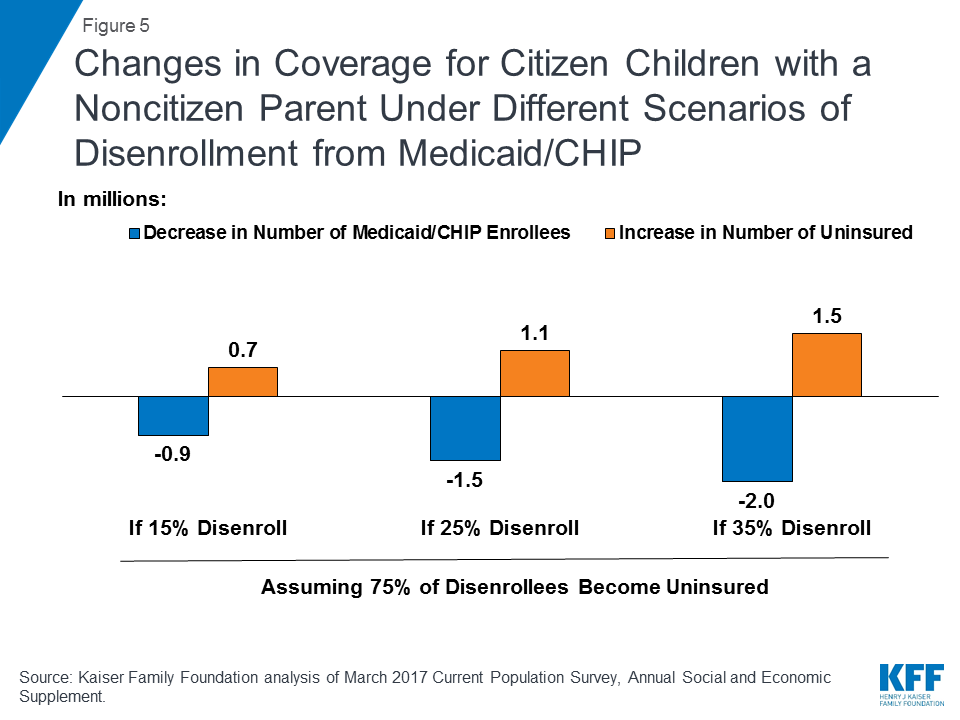
If the public charge policy change leads to Medicaid/CHIP disenrollment rates ranging from 15% to 35%, an estimated 875,000 to 2 million citizen children with a noncitizen parent could drop Medicaid/CHIP coverage despite remaining eligible, and their uninsured rate would rise from 8% to between 14% and 22%. Specifically, as shown in Figures 5 and 6 and Appendix Table 1:
A 15% decline in Medicaid/CHIP enrollment among citizen children with a noncitizen parent would result in 875,000 children losing Medicaid/CHIP coverage and 657,000 becoming uninsured. These losses would increase the uninsured rate for citizen children with a noncitizen parent from 8% to 14%, and the uninsured rate for all children would increase from 5% to 6%.
A 25% decline in Medicaid/CHIP enrollment among citizen children with a noncitizen parent would result in 1.5 million children losing Medicaid/CHIP coverage and 1.1 million becoming uninsured. These losses would increase the uninsured rate for citizen children with a noncitizen parent from 8% to 18%, and the uninsured rate for all children would increase from 5% to 7%.
A 35% decline in Medicaid/CHIP enrollment among citizen children with a noncitizen parent would result in 2.0 million children losing Medicaid/CHIP coverage and 1.5 million becoming uninsured. These losses would increase the uninsured rate for citizen children with a noncitizen parent from 8% to 22%, and the uninsured rate for all children would increase from 5% to 7%.
Figure 5: Changes in Coverage for Citizen Children with a Noncitizen Parent Under Different Scenarios of Disenrollment from Medicaid/CHIPFigure 6: Uninsured Rate for Citizen Children with a Noncitizen Parent Under Different Scenarios of Disenrollment from Medicaid/CHIP
Coverage losses would negatively affect the health of children and their families’ financial stability. Coverage losses would reduce access to care, contributing to worse health outcomes.7 Reduced participation in nutrition and other programs that are also proposed to be considered in public charge determinations would likely compound these effects. In particular, the Earned Income Tax Credit, free or reduced price lunch program, Supplemental Nutrition Assistance Program, and Women Infant and Children’s Program (WIC) provide important sources of support for these households (Appendix 3). Decreased participation in these programs would negatively affect the financial stability of families and the growth and healthy development of their children.8
Methods
Findings in this brief are based on Kaiser Family Foundation analysis of the March 2017 Current Population Survey, Annual Social and Economic Supplement. Children include individuals ages 0-18. For the analysis, children are grouped into mutually exclusive categories, including: children with U.S. born parents, citizen children in a household where at least one parent is a naturalized citizen, citizen children in a household where at least one parent is a noncitizen, and noncitizen children.
For estimates of potential changes in coverage due to public charge policies, we present several scenarios using different disenrollment rates for Medicaid and CHIP. These disenrollment scenarios are illustrative of the potential impact of the public charge policy change and draw on previous research on the chilling effect welfare reform had on enrollment of immigrant families. Specifically, Kaushal and Kaestner found 25% disenrollment among children of foreign-born parents.1 This study was most relevant to our analysis given its focus on children and its inclusion of children who remained eligible after the welfare reform changes. Using this 25% disenrollment rate as a midpoint, we also examined the impact if the disenrollment rate was lower at 15% or higher at 35% to illustrate the impact of alternate disenrollment rates given uncertainty about the actual impact if the policy is implemented. Because, unlike the current draft proposed policy, welfare reform did not affect immigration status, this illustrative analysis may underestimate the impact the policy may have on participation in Medicaid/CHIP.
The estimates also assume that 75% of those disenrolling from Medicaid and CHIP would become uninsured. This assumption is based on Kaiser Family Foundation analysis of Current Population Survey data showing some access to private coverage among this population. However, this analysis may underestimate the share of children disenrolling from Medicaid/CHIP who would become uninsured since some families may not be able to afford private coverage even if it is available. Further, this analysis does not account for decreased coverage due to fewer individuals enrolling their eligible children in Medicaid or CHIP or coverage losses that would result from decreased participation in Marketplace coverage.
This brief was prepared by Samantha Artiga and Rachel Garfield, with the Kaiser Family Foundation, and Anthony Damico, an independent consultant to the Kaiser Family Foundation.
Appendix
Appendix Table 1: Projected Changes in Children’s Coverage Based Assumed Disenrollment of Citizen Children with a Noncitizen Parent from Medicaid/CHIP (in Millions)
Current Coverage (as of 2016)
15% Disenrollment Rate
25% Disenrollment Rate
35% Disenrollment Rate
Number Disenrolled from Medicaid/CHIP
0.9
1.5
2.0
Increase in Uninsured(if 75% of disenrollees become uninsured)
0.7
1.1
1.5
Citizen Children with a Noncitizen Parent
Medicaid/CHIP
5.8
5.0
4.4
3.8
Uninsured
0.8
1.4
1.9
2.3
Uninsured Rate
8%
14%
18%
22%
Total Children
Medicaid/CHIP
29.8
28.9
28.4
27.8
Uninsured
4.2
4.9
5.3
5.7
Uninsured Rate
5%
6%
7%
7%
Source: Kaiser Family Foundation analysis of March 2017 Current Population Survey, Annual Social and Economic Supplement.
Appendix Table 2: Medicaid/CHIP Coverage for Citizen Children With a Noncitizen Parent, 2016
All Children
Citizen Children with a Noncitizen Parent
Total
Income <250% FPL
Medicaid/CHIP Coverage
United States
78,150,000
10,398,000
6,985,000
5,836,000
Alabama
1,155,000
59,000
44,000
34,000
Alaska
202,000
11,000
NA
NA
Arizona
1,715,000
312,000
264,000
168,000
Arkansas
742,000
38,000
26,000
20,000
California
9,678,000
2,559,000
1,815,000
1,567,000
Colorado
1,318,000
136,000
NA
84,000
Connecticut
804,000
83,000
42,000
45,000
Delaware
215,000
25,000
15,000
12,000
DC
128,000
12,000
6,000
5,000
Florida
4,450,000
638,000
416,000
308,000
Georgia
2,666,000
315,000
238,000
204,000
Hawaii
319,000
37,000
23,000
17,000
Idaho
473,000
49,000
42,000
NA
Illinois
3,048,000
442,000
251,000
224,000
Indiana
1,694,000
NA
NA
NA
Iowa
756,000
46,000
39,000
29,000
Kansas
763,000
65,000
50,000
NA
Kentucky
1,104,000
NA
NA
NA
Louisiana
1,176,000
36,000
NA
NA
Maine
272,000
NA
NA
NA
Maryland
1,428,000
190,000
113,000
91,000
Massachusetts
1,480,000
208,000
105,000
102,000
Michigan
2,280,000
118,000
46,000
55,000
Minnesota
1,383,000
131,000
NA
NA
Mississippi
768,000
19,000
NA
NA
Missouri
1,479,000
63,000
NA
NA
Montana
241,000
6,000
NA
NA
Nebraska
500,000
56,000
39,000
26,000
Nevada
729,000
140,000
94,000
61,000
New Hampshire
283,000
NA
NA
NA
New Jersey
2,077,000
362,000
194,000
150,000
New Mexico
522,000
65,000
53,000
46,000
New York
4,397,000
678,000
406,000
392,000
North Carolina
2,450,000
300,000
221,000
197,000
North Dakota
188,000
NA
NA
NA
Ohio
2,792,000
126,000
81,000
70,000
Oklahoma
1,023,000
121,000
97,000
90,000
Oregon
933,000
162,000
127,000
110,000
Pennsylvania
2,836,000
165,000
86,000
97,000
Rhode Island
217,000
25,000
NA
NA
South Carolina
1,183,000
76,000
44,000
NA
South Dakota
229,000
NA
NA
NA
Tennessee
1,550,000
104,000
82,000
58,000
Texas
7,731,000
1,644,000
1,170,000
966,000
Utah
963,000
76,000
56,000
NA
Vermont
131,000
NA
NA
NA
Virginia
2,013,000
243,000
151,000
93,000
Washington
1,721,000
262,000
164,000
157,000
West Virginia
398,000
NA
NA
NA
Wisconsin
1,396,000
NA
NA
NA
Wyoming
153,000
6,000
4,000
NA
NA: Estimate not reported; Relative Standard Error is greater than 30%. FPL is Federal Poverty Level.SOURCE: Kaiser Family Foundation analysis of March 2017 Current Population Survey, Annual Social and Economic Supplement.
Appendix Table 3: Household Use of Selected Programs for Citizen Children with a Non-Citizen Parent, 2016
Earned Income Tax Credit
Free or Reduced Price Lunch
Supplemental NutritionAssistance Program
Women, Infant, andChildren’s Service
United States
5,849,000
5,267,000
2,644,000
1,932,000
Alabama
38,000
29,000
NA
NA
Alaska
NA
NA
NA
NA
Arizona
241,000
195,000
123,000
88,000
Arkansas
20,000
22,000
NA
NA
California
1,554,000
1,507,000
715,000
573,000
Colorado
64,000
47,000
NA
NA
Connecticut
33,000
39,000
NA
NA
Delaware
13,000
11,000
NA
NA
DC
6,000
4,000
NA
NA
Florida
321,000
279,000
159,000
102,000
Georgia
201,000
162,000
NA
NA
Hawaii
18,000
16,000
NA
NA
Idaho
38,000
28,000
20,000
NA
Illinois
194,000
181,000
94,000
NA
Indiana
46,000
NA
NA
NA
Iowa
25,000
24,000
NA
NA
Kansas
50,000
47,000
NA
21,000
Kentucky
20,000
23,000
NA
NA
Louisiana
19,000
18,000
NA
NA
Maine
NA
NA
NA
NA
Maryland
103,000
89,000
NA
NA
Massachusetts
82,000
71,000
NA
41,000
Michigan
44,000
NA
NA
NA
Minnesota
76,000
76,000
NA
NA
Mississippi
10,000
NA
NA
NA
Missouri
33,000
36,000
NA
NA
Montana
NA
NA
NA
NA
Nebraska
36,000
32,000
NA
NA
Nevada
87,000
77,000
NA
NA
New Hampshire
NA
NA
NA
NA
New Jersey
171,000
127,000
NA
NA
New Mexico
42,000
32,000
31,000
13,000
New York
352,000
296,000
194,000
73,000
North Carolina
171,000
200,000
88,000
103,000
North Dakota
5,000
NA
NA
5,000
Ohio
61,000
62,000
60,000
NA
Oklahoma
78,000
55,000
45,000
54,000
Oregon
102,000
107,000
61,000
NA
Pennsylvania
63,000
63,000
54,000
NA
Rhode Island
14,000
15,000
12,000
NA
South Carolina
37,000
37,000
NA
NA
South Dakota
6,000
5,000
NA
NA
Tennessee
62,000
59,000
36,000
NA
Texas
987,000
856,000
395,000
289,000
Utah
42,000
26,000
NA
NA
Vermont
NA
NA
NA
NA
Virginia
119,000
79,000
NA
38,000
Washington
117,000
145,000
91,000
78,000
West Virginia
NA
NA
NA
NA
Wisconsin
33,000
27,000
NA
NA
Wyoming
NA
NA
NA
NA
NA: Estimate not reported; Relative Standard Error is greater than 30%.SOURCE: Kaiser Family Foundation analysis of March 2017 Current Population Survey, Annual Social and Economic Supplement.
Findings show that recent immigration policy changes have increased fears and confusion among broad groups of immigrants beyond those directly affected by the changes. See Samantha Artiga and Petry Ubri, Living in an Immigrant Family in America: How Fear and Toxic Stress are Affecting Daily Life, Well-Being, & Health, (Washington, DC: Kaiser Family Foundation, December 2017), https://modern.kff.org/disparities-policy/issue-brief/living-in-an-immigrant-family-in-america-how-fear-and-toxic-stress-are-affecting-daily-life-well-being-health/. Similarly, earlier experiences show that welfare reform changes increased confusion and fear about enrolling in public benefits among immigrant families beyond those directly affected by the changes. See. Neeraj Kaushal and Robert Kaestner, “Welfare Reform and Health Insurance of Immigrants,” Health Services Research,40(3), (June 2005), https://www.ncbi.nlm.nih.gov/pmc/articles/PMC1361164/; ↩︎
In 2018, three Medicare Part D plan sponsors—UnitedHealth, Humana, and CVS Health—account for more than half of the program’s 43 million Part D enrollees (55%) and two-thirds of all stand-alone drug plan enrollees, indicating a marketplace that is dominated by a handful of major insurers, according to a new Kaiser Family Foundation analysis of Part D enrollment, premiums and cost-sharing data.
The proposed mergers of CVS Health and Aetna, and Cigna and Express Scripts would result in further consolidation of the Part D marketplace. If these mergers go through, four firms—the two merged firms plus UnitedHealth and Humana—would cover 71% of all Part D enrollees and 86% of stand-alone drug plan enrollees, based on 2018 enrollment.
In addition to examining the latest trends in Part D enrollment, the analysis, Medicare Part D in 2018: The Latest on Enrollment, Premiums, and Cost Sharing, finds that premiums for stand-alone prescription drug plans have risen modestly in recent years, with a 2 percent increase in 2018, to $41 per month. At the same time, premiums vary widely among the most popular PDPs, ranging from $20 per month for Humana Walmart Rx to $84 per month for AARP Medicare Rx Preferred.
With consumers increasingly concerned about the cost of medication, the analysis finds that most Part D enrollees face modest cost-sharing amounts for generic drugs but can face much higher cost sharing for brands and non-preferred drugs. For PDP enrollees, for example, median cost sharing ranges from $1 for preferred generics to $37 for preferred brands, and a 40% coinsurance rate for non-preferred drugs. For specialty drugs, defined as those that cost at least $670 per month, more than 4 in 10 Part D enrollees are in plans charging the maximum 33 percent coinsurance for these drugs.
This analysis presents findings on Medicare Part D enrollment, premiums, and cost sharing in 2018 and key trends over time, based on data from the Centers for Medicare & Medicaid Services (CMS).
Enrollment: In 2018, 43 million of the 60 million people with Medicare have prescription drug coverage under a Medicare Part D plan; most (58%) are covered under a stand-alone prescription drug plan (PDP) but a growing share (42% in 2018) are in Medicare Advantage prescription drug plans (MA-PDs), which also provide other Medicare-covered benefits. More than 12 million Part D enrollees receive premium and cost-sharing assistance through the Part D Low-Income Subsidy (LIS) program.
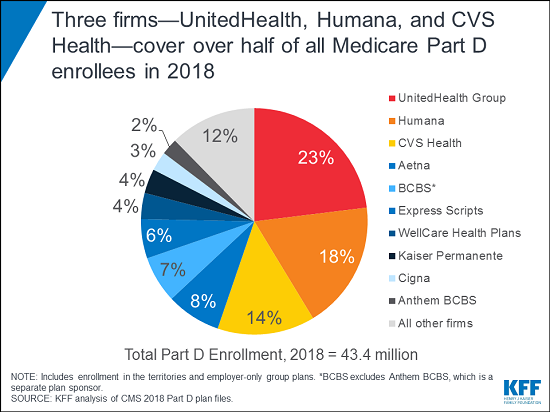
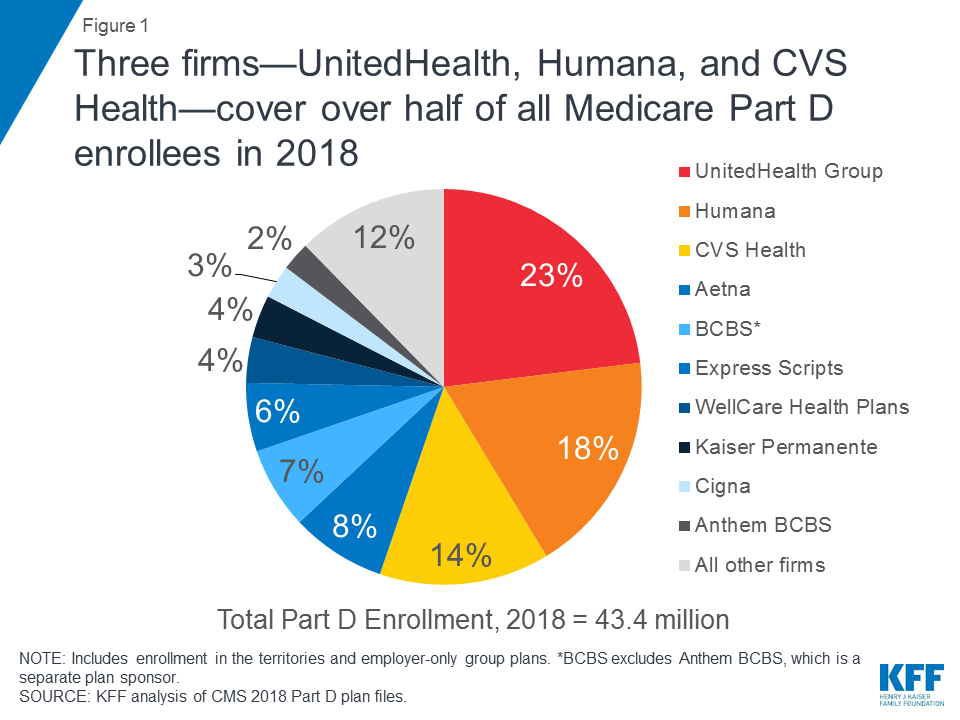
Three firms—UnitedHealth, Humana, and CVS Health—account for over half (55%) of all Part D (PDP and MA-PD) enrollees in 2018 (Figure 1).
Figure 1: Three firms—UnitedHealth, Humana, and CVS Health—cover over half of all Medicare Part D enrollees in 2018
Premiums: Monthly Part D PDP premiums average $41 in 2018, but premiums vary widely among the most popular PDPs, ranging from $20 per month for Humana Walmart Rx to $84 per month for AARP Medicare Rx Preferred. Overall, average monthly PDP premiums increased by a modest 2 percent in 2018.
Deductibles: More than 4 in 10 PDP and MA-PD enrollees are in plans that charge no Part D deductible, but a larger share of PDP enrollees than MA-PD enrollees are in plans that charge the standard deductible amount of $405 in 2018.
Cost sharing for generics and brands: Most Part D enrollees face modest cost-sharing amounts for generic drugs but can face much higher cost sharing for brands and non-preferred drugs, and a mix of copayments and coinsurance for different formulary tiers. For example, for PDP enrollees, median cost sharing ranges from $1 for preferred generics to $37 for preferred brands, and a 40% coinsurance rate for non-preferred drugs.
Specialty drugs: More than 4 in 10 Part D enrollees are in plans that charge 33 percent coinsurance for specialty tier drugs, defined by CMS as drugs that cost at least $670.
Findings
Enrollment
More than 43 million Medicare beneficiaries, or 72 percent of all Medicare beneficiaries nationwide, are enrolled in Part D plans.
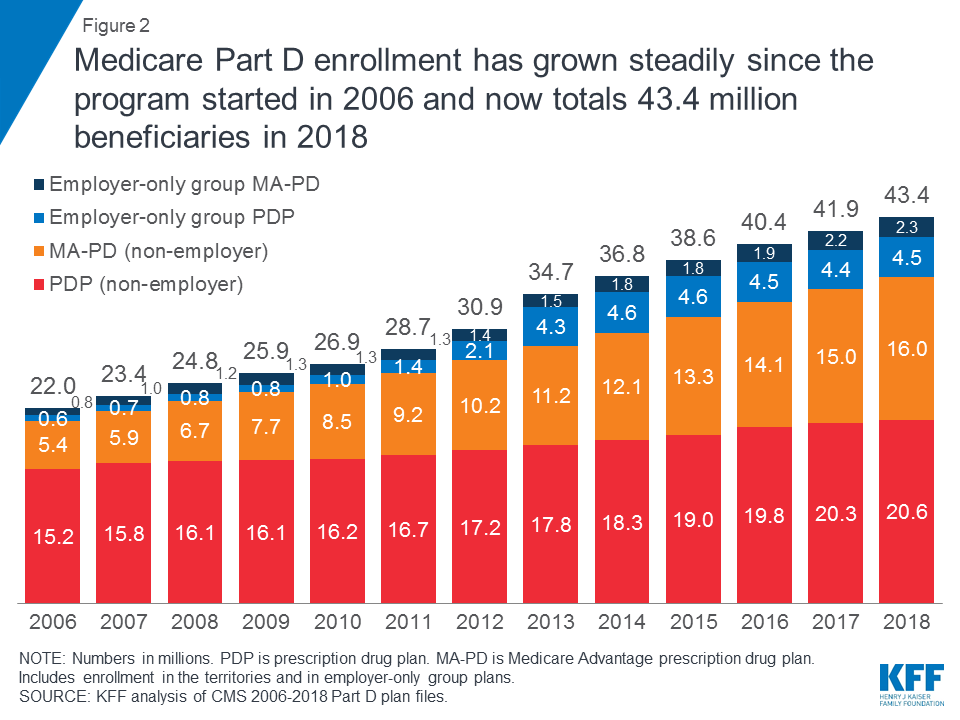
This total includes plans open to everyone and employer-only group plans for retirees of a former employer or union (Figure 2). Most Part D enrollees (58 percent) are in stand-alone prescription drug plans (PDPs), but a rising share (42 percent in 2018, up from 28 percent in 2006) are in Medicare Advantage prescription drug plans (MA-PDs), reflecting overall enrollment growth in Medicare Advantage.
Figure 2: Medicare Part D enrollment has grown steadily since the program started in 2006 and now totals 43.4 million beneficiaries in 2018
In 2018, three Part D sponsors account for more than half of all Part D enrollees and two-thirds of all PDP enrollees.
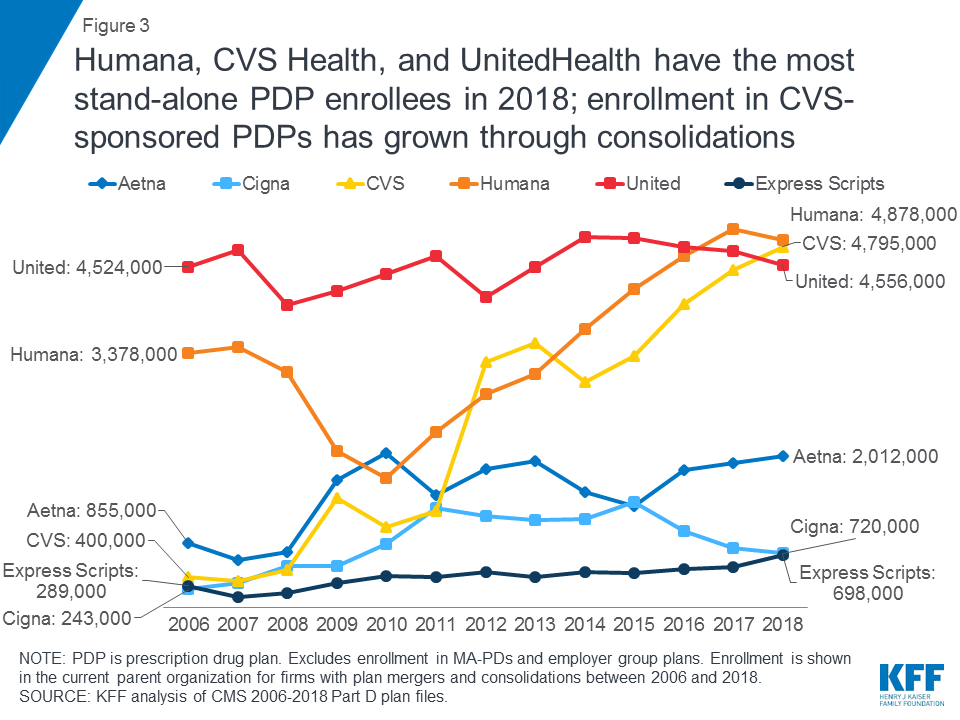
UnitedHealth, Humana, and CVS Health cover more than half (55%) of all beneficiaries enrolled in Part D in 2018, and two-thirds (67%) of all stand-alone PDP enrollees (Table 1). UnitedHealth and Humana have had large market shares since the program began, while enrollment in CVS Health has grown over time through acquisition of other plan sponsors (Figure 3).
Figure 3: Humana, CVS Health, and UnitedHealth have the most stand-alone PDP enrollees in 2018; enrollment in CVS-sponsored PDPs has grown through consolidations
The proposed mergers of CVS Health and Aetna, and Cigna and Express Scripts would result in further consolidation of the Part D marketplace. If these mergers go through, four firms—the two merged firms plus UnitedHealth and Humana—would cover 71 percent of all Part D enrollees and 86 percent of stand-alone drug plan enrollees, based on 2018 enrollment.
The ten largest sponsors of Part D plans account for nearly 90 percent of all enrollment.
UnitedHealth has maintained the top position since the Part D program started, and in 2018 provides coverage to nearly one quarter of Part D enrollees, when PDP and MA-PD enrollment is combined (Table 1). Among all plan sponsors, UnitedHealth has the most MA-PD enrollees in 2018, while CVS Health has the most PDP enrollees.
At the state level, UnitedHealth is the top firm in terms of 2018 Part D enrollment in 26 states and territories, and is one of the top 3 firms in 44 states/territories (Figure 4, Table 2). Humana is the top firm in 17 states/territories, and is one of the top 3 firms in 41 states/territories.
Figure 4: UnitedHealth, Humana, and CVS Health are one of the top 3 Part D firms by enrollment in many states/territories
CVS Health, which sponsors PDPs but not MA-PDs, is the top Part D firm in only 6 states/territories, but is among the top 3 firms in 35. Together, three firms—UnitedHealth, Humana, and CVS Health—occupy all of the top 3 spots in terms of Part D 2018 enrollment in 19 states and territories (in varying orders).
Among PDPs, at the plan level, SilverScript Choice PDP (sponsored by CVS Health) has the most enrollees in 2018, covering more than 1 in 10 Part D enrollees, or 4.6 million (Table 3). This total is nearly double that of the second most popular plan, AARP MedicareRx Preferred (sponsored by UnitedHealth), with 2.6 million enrollees.
Premiums
PDP premiums have risen modestly in recent years; for 2018, the average PDP premium is $41 per month.
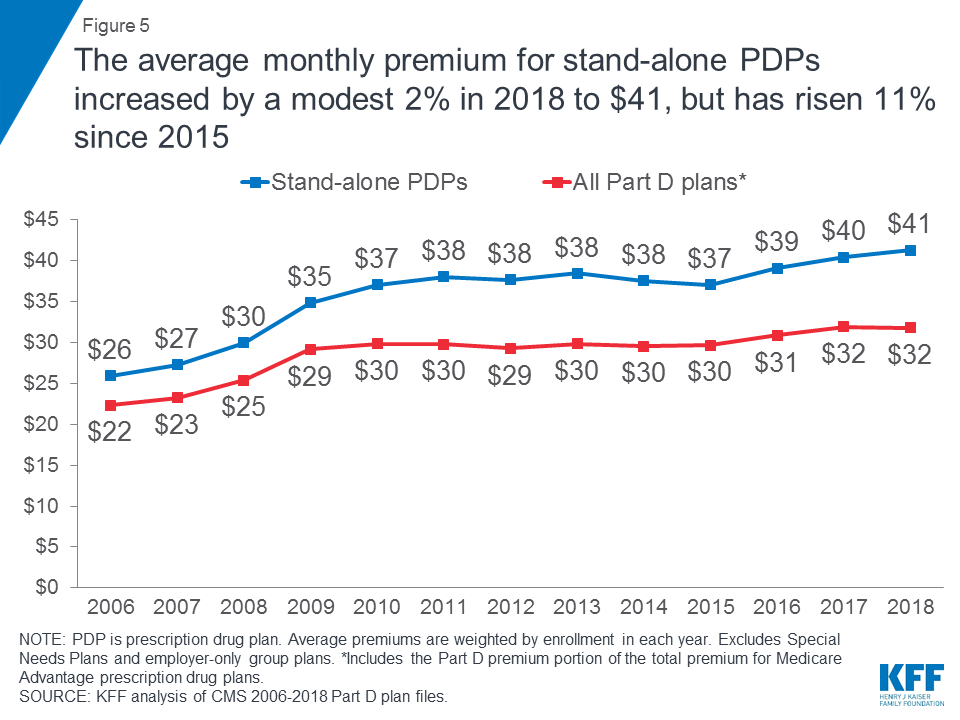
PDP enrollees are in plans with an average monthly premium of $41 in 2018, a modest 2 percent increase over 2017 but up by 11 percent since 2015 (Figure 5). The combined average Part D premium for PDP and MA-PD enrollees is $32 in 2018. This is lower than the average for PDPs due in part to the ability of MA-PD sponsors to use rebate dollars from Medicare payments for benefits covered under Parts A and B to lower their Part D premiums. The average MA-PD premium is $34 in 2018, which includes Part D and other benefits.
Figure 5: The average monthly premium for stand-alone PDPs increased by a modest 2% in 2018 to $41, but has risen 11% since 2015
Premiums for 7 of the 10 most popular PDPs increased in 2018, and continue to vary widely across plans.
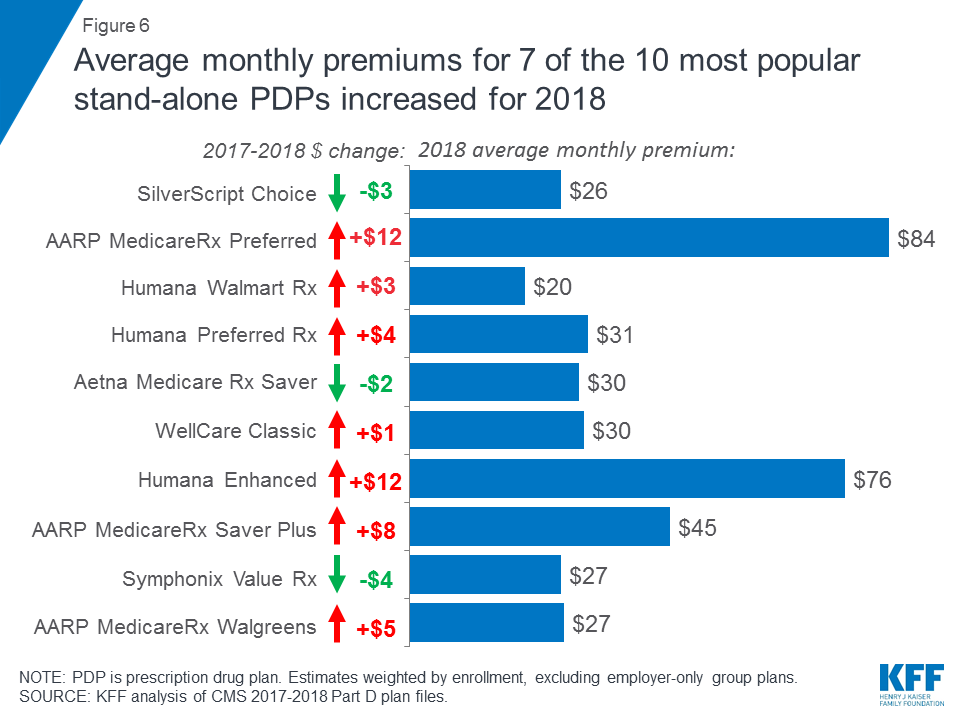
Monthly premiums for 2 of the 10 largest PDPs–AARP MedicareRx Preferred and Humana Enhanced—increased by more than $10 in 2018 (Figure 6). Premium decreases among the top PDPs were generally of a smaller magnitude; for example, the average monthly premium for SilverScript Choice, the PDP with the most enrollees, fell by $3.
Figure 6: Average monthly premiums for 7 of the 10 most popular stand-alone PDPs increased for 2018
Monthly premiums in 2018 vary widely among the most popular PDPs. Premiums range from $20 per month for Humana Walmart Rx to four times more—$84 per month—for AARP Medicare Rx Preferred.
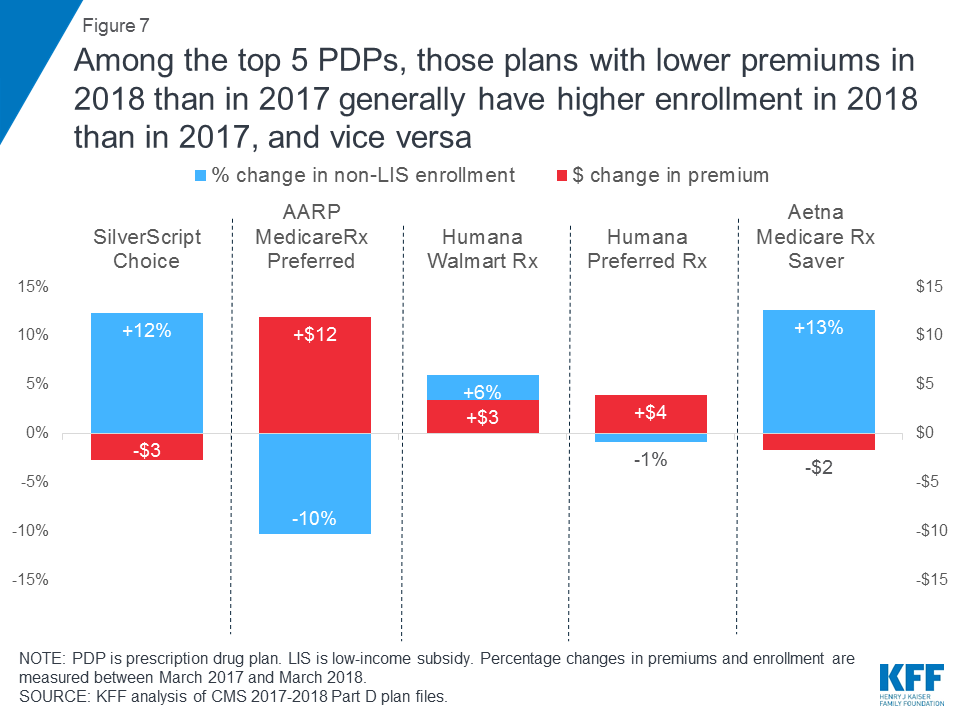
Among the top 5 PDPs, those plans with lower premiums in 2018 than in 2017 generally have higher enrollment in 2018 than in 2017, and vice versa.
Among several of the top PDPs, there appears to be an inverse relationship between premium changes from 2017 to 2018 and the year-to-year change in voluntary enrollment among enrollees who are not receiving low-income subsidies (LIS). (Low-income enrollees may be reassigned automatically in response to premium increases under certain circumstances.)
For example, the monthly premium for SilverScript Choice fell by $3 for 2018 (from $29 to $26), and its non-LIS enrollment increased by 12 percent between 2017 and 2018 (Figure 7). By contrast, the premium for AARP MedicareRx Preferred increased by $12 for 2018 (from $72 to $84), and its non-LIS enrollment decreased by 10 percent between 2017 and 2018. These enrollment changes take into account both enrollment of new Part D enrollees and plan changes by current enrollees.
Figure 7: Among the top 5 PDPs, those plans with lower premiums in 2018 than in 2017 generally have higher enrollment in 2018 than in 2017, and vice versa
The one exception to this inverse relationship among the top 5 PDPs was Humana Walmart Rx, which experienced a 6 percent increase in enrollment despite a $3 premium increase for 2018 (from $17 to $20). This could be related to the fact that, despite its premium increase for 2018, the Humana Walmart Rx PDP is among the lowest-premium PDPs available in almost all regions in 2018; while some PDPs have lower premiums, they are not available nationwide.
Deductibles and Cost Sharing
In 2018, more than 4 in 10 Part D enrollees are in plans that charge no deductible for drug coverage.
While more than 4 in 10 PDP and MA-PD enrollees (45%) are in plans that charge no deductible, a larger share of PDP enrollees than MA-PD enrollees are in plans charging the standard deductible amount of $405 in 2018 (46% and 3%, respectively), while a larger share of MA-PD enrollees than PDP enrollees face a partial deductible amount (Table 4). As a result, the weighted average Part D deductible is higher among PDP enrollees than MA-PD enrollees in 2018 ($213 and $129, respectively).
Cost Sharing for Generic Drugs
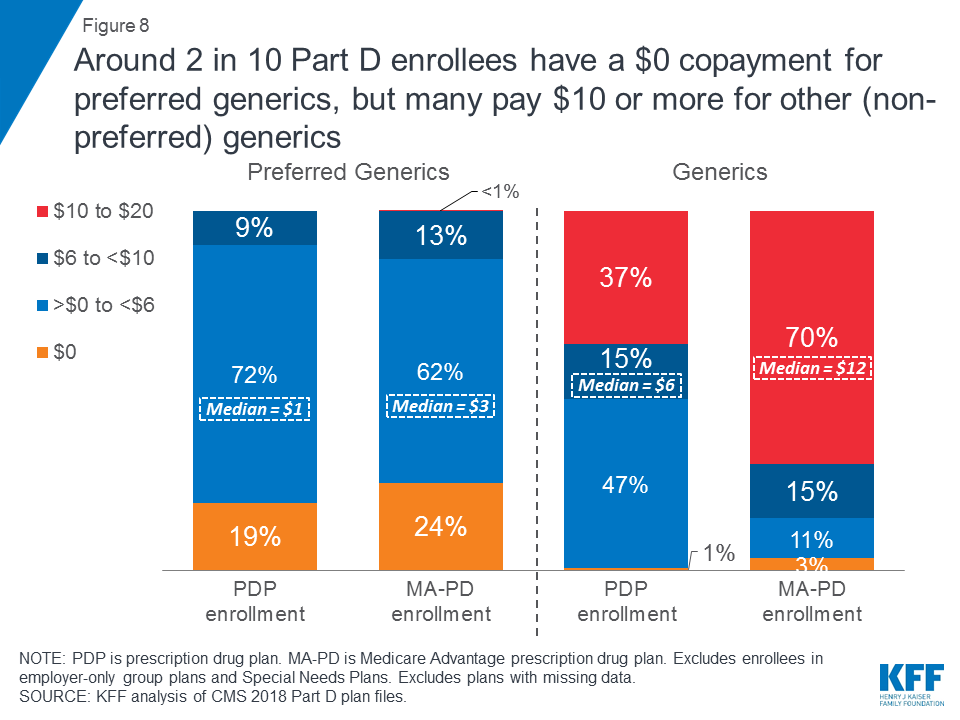
Around 2 in 10 Part D enrollees have a $0 copayment for preferred generics, but many pay $10 or more for other (non-preferred) generics.
In 2018, 19 percent of PDP enrollees and 24 percent of MA-PD enrollees have a $0 copayment for preferred generics (Figure 8). Median cost sharing for preferred generics is $1 for PDP enrollees and $3 for MA-PD enrollees in 2018, a reduction from earlier years (Table 5).
Figure 8: Around 2 in 10 Part D enrollees have a $0 copayment for preferred generics, but many pay $10 or more for other (non-preferred) generics
For drugs on the second (non-preferred) generic tier—a tier that became common in 2012—median cost sharing is $6 for PDPs and $12 for MA-PDs. Nearly 4 in 10 PDP enrollees (37%) and 70 percent of MA-PD enrollees pay between $10 and $20 for generics on this tier.
Cost Sharing for Brand-Name Drugs
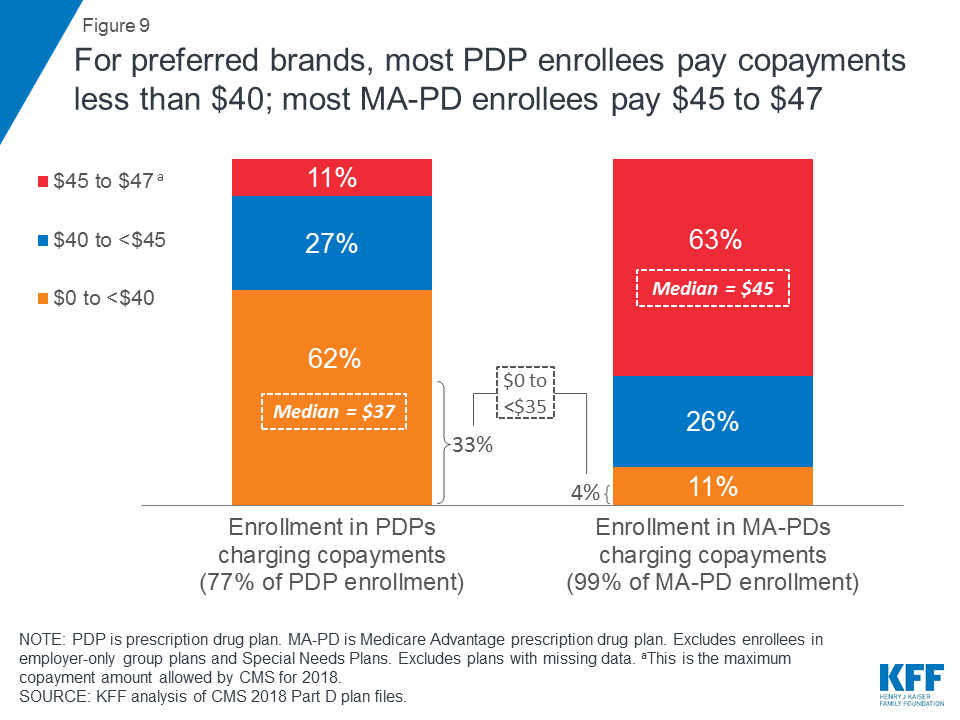
For preferred brands, most PDP enrollees pay copayments less than $40; most MA-PD enrollees pay $45 to $47.
The vast majority of Part D plans (both PDPs and MA-PDs) charge copayments for preferred brand-name drugs rather than coinsurance. Among Part D enrollees in plans that use copayments for preferred brands, enrollees typically face lower copayments in PDPs than MA-PDs (Figure 9). Nearly two-thirds of PDP enrollees (62%) are in plans charging less than $40 for these drugs, while a similar share of MA-PD enrollees (63%) are in plans charging at least $45. Median cost sharing for preferred brands in 2018 is $37 for PDP enrollees and $45 for MA-PD enrollees.
Figure 9: For preferred brands, most PDP enrollees pay copayments less than $40; most MA-PD enrollees pay $45 to $47
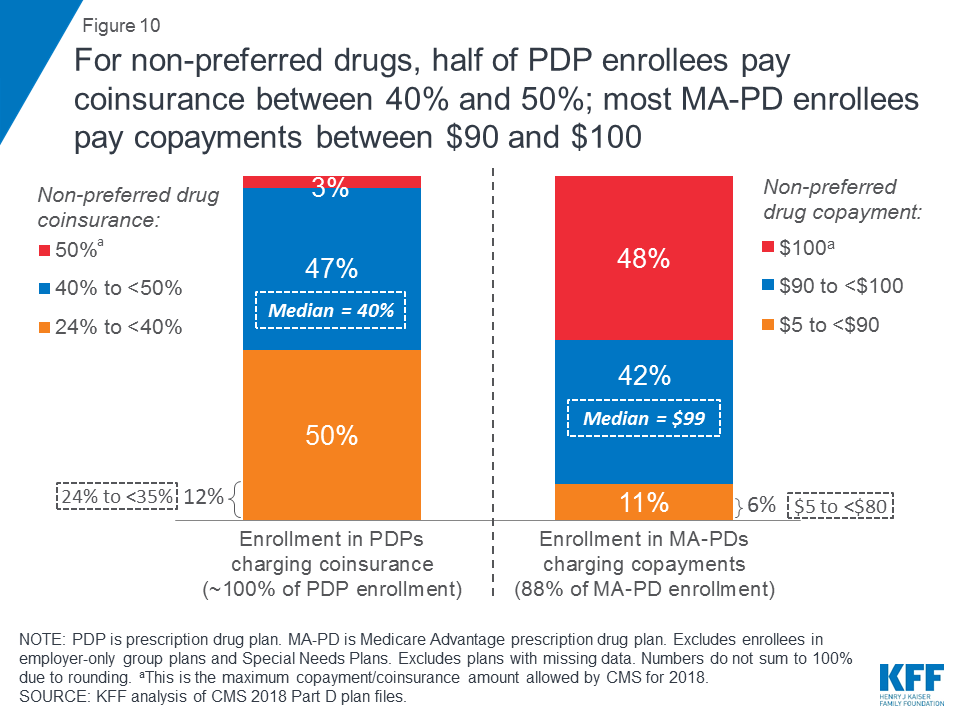
For non-preferred drugs, half of PDP enrollees pay coinsurance between 40% and 50%; most MA-PD enrollees pay copayments between $90 and $100.
For non-preferred drugs (or non-preferred brands; 5-tier plans use one or the other), nearly all PDP enrollees pay a coinsurance rate, whereas most MA-PD enrollees pay a copayment amount. Half of PDP enrollees pay coinsurance of 40 percent or more for non-preferred drugs, while among MA-PD enrollees in plans charging copayments for non-preferred drugs, most (89%) pay between $90-$100 (Figure 10).
Figure 10: For non-preferred drugs, half of PDP enrollees pay coinsurance between 40% and 50%; most MA-PD enrollees pay copayments between $90 and $100
Whether one group of enrollees faces higher average out-of-pocket costs than the other for non-preferred drugs cannot be assessed because of the different approaches to cost sharing that each plan type uses; in particular, the actual out-of-pocket cost that PDP enrollees face who pay coinsurance for non-preferred drugs depends on the list price of the drug.
Cost Sharing for Specialty Drugs
More than 4 in 10 Part D enrollees are in plans charging 33 percent coinsurance for specialty tier drugs.
Close to half of PDP enrollees (45%) and more than 4 in 10 MA-PD enrollees (42%) are in plans that charge the maximum 33 percent coinsurance rate for specialty drugs, defined by CMS as those that cost at least $670 per month (Table 4). Only those plans that waive some or all of the standard deductible are permitted to set the specialty tier coinsurance rate above 25 percent.
Low-Income Subsidies
Three in 10 Part D enrollees receive additional subsidies for Part D coverage through the Low-Income Subsidy program.
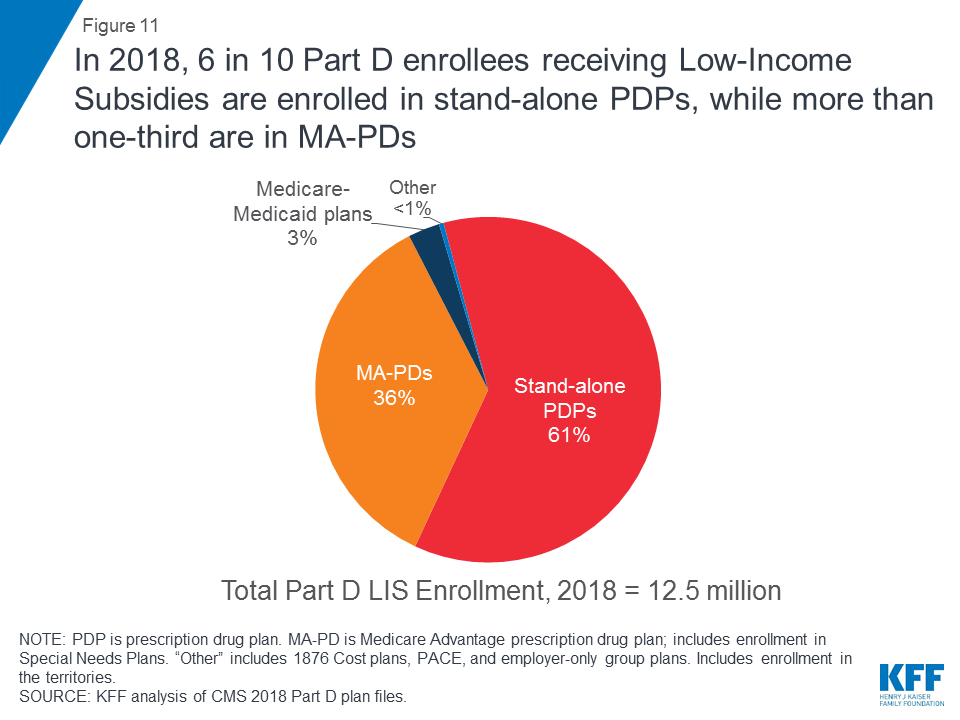
More than 12 million Part D enrollees (29%) receive low-income subsidies (Figure 11). These additional financial subsidies, also called “Extra Help,” pay Part D premiums for eligible beneficiaries, as long as they enroll in PDPs designated as premium-free “benchmark” plans, and also reduces cost sharing. Six in 10 low-income subsidy (LIS) enrollees (61%, or 7.6 million) are enrolled in stand-alone PDPs. The other 4.9 million LIS enrollees are in standard MA-PDs, Medicare Advantage Special Needs Plans (SNPs), Medicare-Medicaid plans participating in financial alignment demonstrations, cost plans, or PACE plans.
Figure 11: In 2018, 6 in 10 Part D enrollees receiving Low-Income Subsidies are enrolled in stand-alone PDPs, while more than one-third are in MA-PDs
More than 1 million LIS beneficiaries pay premiums for Part D coverage, even though they may be able to obtain coverage with no premium, either through a benchmark PDP or through a zero-premium MA-PD.
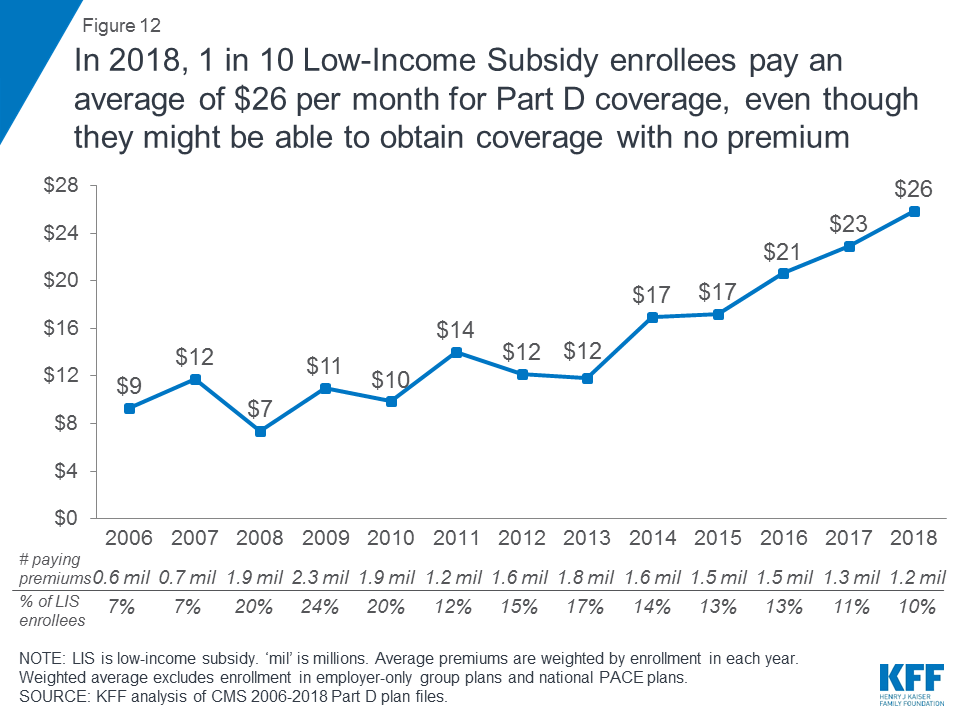
In 2018, 1.2 million LIS beneficiaries (10% of all LIS beneficiaries) pay a premium for Part D coverage, even though they may be able to obtain coverage without paying a premium. This total includes 0.9 million PDP enrollees who are not enrolled in benchmark PDPs, and more than 0.3 million MA-PD enrollees who are enrolled in MA-PDs that charge a premium. MA-PDs are not designated as benchmark plans by CMS, although most of the LIS enrollees in MA-PDs are currently enrolled in zero-premium plans.
CMS reassigns some LIS beneficiaries in PDPs to a premium-free PDP during open enrollment if their previous PDP loses benchmark status and charges a premium. But other LIS enrollees are not reassigned by CMS because they have actively selected the plan they are in, whether it is a PDP or an MA-PD.
On average, the 1.2 million LIS beneficiaries paying Part D premiums in 2018 pay $26 per month, or more than $300 per year (Figure 12). This amount is up 13 percent from 2017 and is nearly three times the amount in 2006.
Figure 12: In 2018, 1 in 10 Low-Income Subsidy enrollees pay an average of $26 per month for Part D coverage, even though they might be able to obtain coverage with no premium
Methodology
This analysis focuses on the Medicare Part D marketplace in 2018 and trends over time. Data on Part D plan availability, enrollment, and premiums were collected primarily from a set of data files released by the CMS on a regular basis:
Part D plan landscape files, released each fall prior to the annual enrollment period. These files include basic plan characteristics, such as plan names, premiums, deductibles, gap coverage, and benchmark plan status.
Part D plan and premium files, released each fall. These files include more detail on plan characteristics, including premiums charged to LIS beneficiaries, the portions of the premiums allocated to the basic and enhanced benefits, and the separate drug premiums for MA-PDs.
Part D plan crosswalk files, released each fall. These files identify which plans are matched up when a plan sponsor changes its plan offerings from one year to the next.
Part D contract/plan/state/county level enrollment files, released on a monthly basis. These files include total enrollment by contract and plan at the state and county level. We use March enrollment counts for enrollment-weighted analysis in this report. Enrollment files suppress totals for plans with 10 or fewer enrollees.
Part D Low-Income Subsidy enrollment files, released once annually (in March for 2018). These files include total enrollment counts for LIS enrollees. As with the other enrollment files, we exclude plans with small enrollment counts in estimates that are plan-enrollment weighted.
Medicare plan benefit package files, released each fall. These files supply detailed information on the benefits offered by plans, including cost-sharing amounts for each formulary tier, tier labels, and the different cost-sharing amounts for standard and preferred cost-sharing pharmacies, where applicable.
Medicare penetration files, released on a monthly basis. These files are used to estimate average counts of plans available per beneficiary.
For analysis of changes in premiums for the top 5 PDPs and changes in non-LIS enrollment, we calculated the percentage change in premiums and enrollment between March 2017 and March 2018. We did not measure the change in non-LIS enrollment that occurred during the open enrollment period specifically.
For analysis of cost sharing for formulary tiers in PDPs and MA-PDs, we did not analyze which drugs are on what tier under each type of plan and whether this has changed over time, factors which would also influence enrollees’ out-of-pocket costs.
Juliette Cubanski and Tricia Neuman are with the Kaiser Family Foundation.Anthony Damico is an independent consultant.
Tables
Table 1: Top 10 Firms Offering Medicare Part D Plans Ranked by 2018 Enrollment
Name of firm
Rank
Enrollment (in millions)
% of total Part D
PDP
MA-PD
Total
UnitedHealth Group
1
5.3
4.7
10.0
23%
Humana
2
4.9
3.0
7.9
18%
CVS Health
3
6.0
0
6.0
14%
Aetna
4
2.1
1.3
3.4
8%
BCBS*
5
1.0
1.9
2.9
7%
Express Scripts
6
2.4
0
2.4
6%
WellCare Health Plans
7
1.1
0.5
1.6
4%
Kaiser Permanente
8
0
1.5
1.5
4%
Cigna
9
0.8
0.4
1.2
3%
Anthem BCBS
10
0.4
0.6
1.0
2%
Total top 10 firms
24.2
13.9
38.1
88%
Total Part D
25.1
18.3
43.4
100%
NOTE: PDP is prescription drug plan. MA-PD is Medicare Advantage prescription drug plan. Includes enrollment in the territories and employer group plans. Number may not sum to total due to rounding. *BCBS excludes Anthem BCBS, which is a separate plan sponsor.SOURCE: KFF analysis of CMS 2018 Part D plan files.
Table 2: Top Firms Offering Medicare Part D Plans by State, 2018
State/ territory
TotalPart D enrollment
#1 firm
% of total
#2 firm
% of total
#3 firm
% of total
Top 3 firms % of total
All other firms % of total
AK
35,152
Humana
40%
UnitedHealth
30%
CIGNA
12%
81%
19%
AL
730,549
UnitedHealth
25%
Humana
17%
BCBS
17%
59%
41%
AR
429,440
CVS Health
24%
Humana
22%
UnitedHealth
16%
62%
38%
AS
95
CVS Health
34%
UnitedHealth
32%
Aetna
23%
88%
12%
AZ
915,596
UnitedHealth
39%
Humana
18%
CVS Health
8%
65%
35%
CA
4,777,625
Kaiser Foundation Health Plan
24%
UnitedHealth
22%
CVS Health
12%
57%
43%
CO
622,279
UnitedHealth
36%
Humana
22%
Kaiser Foundation Health Plan
18%
76%
24%
CT
516,578
UnitedHealth
35%
CVS Health
12%
Aetna
12%
60%
40%
DC
55,006
UnitedHealth
31%
CVS Health
14%
Kaiser Foundation Health Plan
11%
57%
43%
DE
146,584
UnitedHealth
26%
Express Scripts
23%
Humana
14%
63%
37%
FL
3,299,357
UnitedHealth
27%
Humana
26%
CVS Health
15%
69%
31%
GA
1,186,871
UnitedHealth
32%
Humana
20%
CVS Health
16%
68%
32%
HI
185,910
CVS Health
25%
UnitedHealth
19%
BCBS
18%
63%
37%
IA
463,528
Humana
30%
BCBS
18%
UnitedHealth
17%
65%
35%
ID
212,023
Humana
23%
UnitedHealth
22%
BCBS
14%
59%
41%
IL
1,598,234
UnitedHealth
25%
Humana
19%
BCBS
16%
60%
40%
IN
921,327
Humana
26%
UnitedHealth
24%
CVS Health
14%
64%
36%
KS
361,451
Humana
32%
Aetna
20%
CVS Health
20%
72%
28%
KY
671,121
Humana
36%
CVS Health
15%
Express Scripts
13%
63%
37%
LA
628,819
Humana
36%
CVS Health
16%
PH Holdings, LLC
10%
62%
38%
MA
988,022
CVS Health
22%
UnitedHealth
15%
Anthem BCBS
13%
49%
51%
MD
615,389
CVS Health
26%
UnitedHealth
20%
Humana
12%
58%
42%
ME
233,896
UnitedHealth
28%
Martin’s Point Health Care
18%
WellCare Health Plans
13%
59%
41%
MI
1,577,228
UnitedHealth
21%
Express Scripts
16%
BCBS
13%
50%
50%
MN
745,107
BCBS
26%
Humana
24%
UCare Minnesota
12%
61%
39%
MO
890,815
UnitedHealth
24%
Humana
21%
Aetna
17%
63%
37%
MS
416,961
Humana
31%
CVS Health
24%
WellCare Health Plans
15%
70%
30%
MT
142,912
Humana
39%
BCBS
20%
CVS Health
15%
74%
26%
NC
1,410,633
UnitedHealth
32%
Humana
22%
CVS Health
14%
68%
32%
ND
86,636
Humana
31%
CVS Health
24%
BCBS
13%
69%
31%
NE
236,212
Humana
33%
UnitedHealth
19%
CVS Health
17%
69%
31%
NH
189,952
UnitedHealth
28%
Humana
17%
CVS Health
12%
58%
42%
NJ
1,163,696
UnitedHealth
41%
CVS Health
13%
Humana
11%
65%
35%
NM
285,307
UnitedHealth
24%
Presbyterian Healthcare Services
15%
Humana
14%
53%
47%
NV
344,086
UnitedHealth
39%
Humana
31%
Aetna
8%
79%
21%
NY
2,733,417
UnitedHealth
20%
CVS Health
18%
Express Scripts
7%
46%
54%
OH
1,767,794
Humana
18%
UnitedHealth
17%
Express Scripts
13%
47%
53%
OK
469,737
CVS Health
26%
Humana
21%
UnitedHealth
18%
65%
35%
OR
607,487
UnitedHealth
18%
Centene Corporation
11%
Humana
11%
40%
60%
PA
2,047,633
BCBS
18%
CVS Health
15%
Aetna
12%
45%
55%
PR
575,911
Medical Card System
35%
InnovaCare Inc.
34%
BCBS
19%
88%
12%
RI
162,225
BCBS
32%
UnitedHealth
24%
CVS Health
9%
65%
35%
SC
732,424
UnitedHealth
29%
Humana
22%
CVS Health
15%
65%
35%
SD
111,201
Humana
43%
CVS Health
17%
BCBS
13%
73%
27%
TN
977,307
Humana
25%
UnitedHealth
20%
BCBS
15%
60%
40%
TX
2,839,293
UnitedHealth
30%
Humana
19%
CVS Health
16%
65%
35%
UT
262,839
UnitedHealth
37%
Humana
17%
Intermountain Health Care
9%
63%
37%
VA
914,191
Humana
32%
UnitedHealth
19%
CVS Health
14%
65%
35%
VI
11,655
UnitedHealth
98%
CIGNA
2%
Express Scripts
0%
100%
0%
VT
103,432
UnitedHealth
28%
CVS Health
19%
Humana
17%
63%
37%
WA
836,641
UnitedHealth
30%
Humana
17%
CVS Health
10%
57%
43%
WI
807,064
UnitedHealth
31%
Humana
21%
CVS Health
10%
62%
38%
WV
296,780
Humana
37%
CVS Health
16%
UnitedHealth
13%
65%
35%
WY
63,933
Humana
32%
UnitedHealth
22%
CVS Health
18%
72%
28%
NOTE: Includes enrollment in the territories and employer-only group plans. Excludes Guam, where only two firms are operating in 2018. *BCBS excludes Anthem BCBS, which is a separate plan sponsor.SOURCE: KFF analysis of CMS 2018 Part D plan files.
Table 3: Top 10 Medicare Part D Plans Ranked by 2018 Enrollment
Name of plan
2018
2017
Change, 2017-2018
Type of benefit
Rank
Enrollment(in millions)
% of total Part D
Rank
SilverScript Choice
Basic
1
4.6
12.5%
1
+7%
AARP MedicareRx Preferred
Enhanced
2
2.6
7.0%
2
-12%
Humana Walmart Rx Plan
Enhanced
3
2.4
6.5%
3
+6%
Humana Preferred Rx Plan
Basic
4
1.7
4.6%
4
-9%
Aetna Medicare Rx Saver
Basic
5
1.2
3.2%
5
+4%
WellCare Classic
Basic
6
1.0
2.8%
7
+0.2%
Humana Enhanced
Enhanced
7
0.8
2.2%
8
-13%
AARP MedicareRx Saver Plus
Basic
8
0.7
1.9%
6
-35%
Symphonix Value Rx
Basic
9
0.7
1.9%
13
+70%
AARP MedicareRx Walgreens
Enhanced
10
0.6
1.6%
14
+72%
NOTE: Excludes employer-group only (EGWP) plans; in 2018, one EGWP (Express Scripts Medicare PDP) had 1.7 million enrollees. Plan names can change from year to year; plans are designated the same if they have the same contract/plan ID.SOURCE: KFF analysis of CMS 2017-2018 Part D plan files.
Table 4: Distribution of Medicare Part D Enrollment by Deductible and Cost-Sharing Amounts, 2018
All Part D Enrollment
PDPEnrollment
MA-PD Enrollment
Deductible
None
45%
45%
45%
Partial
26%
9%
52%
Standard
29%
46%
3%
Cost sharing
Preferred generics
$0
21%
19%
24%
>$0 to <$3
33%
41%
19%
$3 to <$6
35%
31%
43%
$6 to <$10
11%
9%
13%
$10 to <$12
<1%
0%
<1%
$12 to <$15
0%
0%
0%
$15
<1%
0%
<1%
Other (non-preferred) generics
$0
2%
1%
3%
>$0 to <$3
13%
21%
<1%
$3 to <$6
20%
26%
11%
$6 to <$10
15%
15%
15%
$10 to <$12
14%
10%
20%
$12 to <$15
19%
17%
22%
$15 to $20
17%
10%
28%
Preferred brands
$0 to <$35
20%
33%
4%
$35 to <$40
19%
29%
7%
$40 to <$45
27%
27%
26%
$45 to $47
34%
11%
63%
Non-preferred brands/drugs (coinsurance)
24% to <35%
12%
12%
—
35% to <40%
35%
38%
—
40% to <46%
30%
30%
—
46% to <50%
17%
17%
—
50%
6%
3%
—
Non-preferred brands/drugs (copayment)
$5 to <$80
6%
—
6%
$80 to <$90
5%
—
5%
$90 to <$95
7%
—
7%
$95 to <$100
34%
—
35%
$100
47%
—
48%
Specialty tier
25%
33%
47%
11%
>25% to <33%
23%
8%
47%
33%
44%
45%
42%
NOTE: PDP is prescription drug plan. MA-PD is Medicare Advantage prescription drug plan. Excludes enrollees in employer-only group plans and Special Needs Plans. Excludes plans with missing data. ‘–‘ indicates data not shown for this plan type since the majority of these plans use the alternative cost-sharing arrangement (coinsurance or copayment) for non-preferred brands/drugs.SOURCE: KFF analysis of CMS 2018 Part D plan files.
Table 5: Cost Sharing for Medicare Part D Plans, 2010 and 2018
Formulary tier
Plan type
2010
2018
Minimum
Mean
Median
Maximum
Minimum
Mean
Median
Maximum
Preferred generic
PDP
$0
$5
$6
$15
$0
$2
$1
$9
MA-PD
$0
$6
$7
$15
$0
$3
$3
$15
Generic
PDP
$13
$27
$26
$37
$0
$7
$6
$20a
MA-PD
$0
$15
$10
$38
$0
$11
$12
$20a
Preferred brand copayment% of enrollees in plans charging
PDP
$16.25
$33
$34
$45
$18
$37
$37
$47a
46%
77%
MA-PD
$0
$34
$35
$55
$0
$43
$45
$47a
99%
99%
Preferred brand coinsurance% of enrollees in plans charging
PDP
10%
22%
22%
33%
10%
21%
20%
25%a
54%
23%
MA-PD
23%
24%
23%
40%
15%
22%
25%
25%a
1%
1%
Non-preferred drug copayment% of enrollees in plans charging
PDP
$40
$80
$75
$98
$70
$85
$93
$100a
65%
<1%
MA-PD
$10
$70
$80
$95
$5
$95
$99
$100a
99%
88%
Non-preferred drug coinsurance% of enrollees in plans charging
PDP
25%
57%
55%
75%
24%
39%
40%
50%a
35%
~100%
MA-PD
25%
39%
50%
60%
24%
44%
46%
50%a
1%
12%
Specialty
PDP
25%
29%
30%
33%
25%
29%
27%
33%a
MA-PD
25%
31%
33%
33%
25%
30%
31%
33%a
NOTE: PDP is prescription drug plan. MA-PD is Medicare Advantage prescription drug plan. Part D estimates weighted by enrollment in each year. Mean and median amounts are weighted by enrollment. Excludes Special Needs Plans and plans with missing data. aThis is the maximum copayment/coinsurance amount allowed by CMS for 2018.SOURCE: KFF analysis of CMS 2010 and 2018 Part D plan files.
Analysis: Individual Market Insurers Experienced Their Best Financial Year under the ACA in 2017, Though Subsequent Political and Policy Changes Complicate the Outlook for Future Years
Insurers in 2017 had their best financial year selling individual market health insurance since the Affordable Care Act began requiring guaranteed access to coverage for people with pre-existing conditions in 2014, though recent political and policy changes create new challenges for insurers trying to succeed in this market, new Kaiser Family Foundation analysis finds.
This analysis finds insurers posted their strongest performance in the individual market using two different financial indicators:
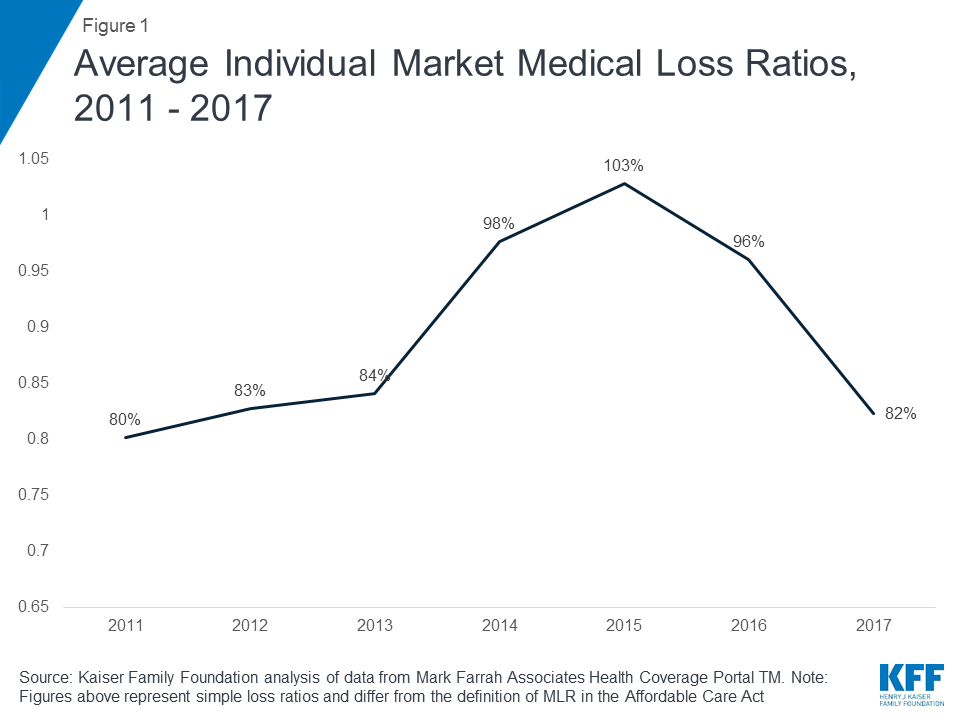
The average share of health premiums paid out in claims (or medical loss ratio) fell to 82 percent in 2017 from 96 percent in 2016 and 103 percent in 2015.
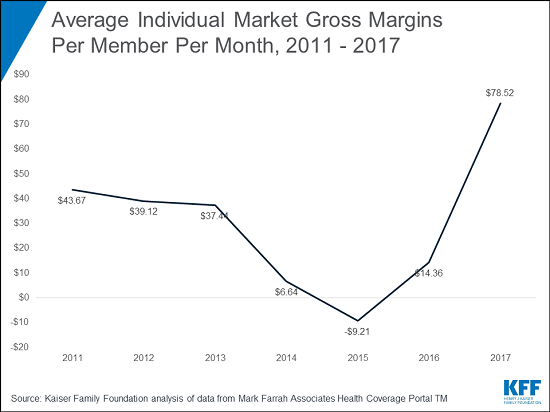
Average premiums collected in excess of claims (or gross margins) reached $79 in 2017 per member per month, up from $14 in 2016 and -$9 in 2015.
The strong financial performance suggests insurers on average priced their plans adequately last year, though the outlook for this year and next year is cloudier, given recent policy changes and political uncertainties that are driving up premiums and potentially pricing out healthy middle-class consumers.
The analysis notes those complicating factors include the Trump Administration’s decision to stop making cost-sharing subsidy payments to insurers; the repeal of the individual mandate penalty as part of tax reform legislation; and proposed regulations to expand loosely-regulated short-term insurance plans.
The analysis is based on insurer-reported financial data, including information from the National Association of Insurance Commissioners, compiled and maintained by Mark Farrah Associates.
Concerns about the stability of the individual insurance market under the Affordable Care Act (ACA) have been raised in the past year following exits of several insurers from the exchange markets for 2017, and again last year during the debate over repeal of the health law.
In this brief, we look at recently-released annual financial data from 2017 to examine whether recent premium increases were sufficient to bring insurer performance back to pre-2014 levels, when new ACA insurance market rules took effect. These new data from 2017 offer further evidence that insurers in the individual market are regaining profitability, even as political and policy uncertainty, repeal of the individual mandate penalty as part of tax reform legislation, and proposed regulations to expand loosely-regulated short-term insurance plans cloud expectations for the future.
Analysis: Individual market insurers in 2017 had their best year financially since the ACA’s guaranteed coverage for people with pre-existing conditions, but future outlook is uncertain
Annual financial data reflects insurer performance in 2017 through December of last year. The Administration ceased payments for cost-sharing subsidies effective October 12, 2017. The loss of these payments during the fourth quarter of 2017 diminished insurer profits, but nonetheless, insurers saw better financial results in 2017 than they did in earlier years of the ACA. Markets in parts of the country remain fragile, with little competition and an insufficient number of healthy enrollees to balance those who are sick. However, absent any policy changes, it is likely that insurers would generally have required only modest premium increases in 2018 and in 2019 as well. Insurers are now beginning to file proposed rates for 2019.
We use financial data reported by insurance companies to the National Association of Insurance Commissioners and compiled by Mark Farrah Associates to look at the average premiums, claims, medical loss ratios, gross margins, and enrollee utilization from 2011 through 2017 in the individual insurance market.1 These figures include coverage purchased through the ACA’s exchange marketplaces and ACA-compliant plans purchased directly from insurers outside the marketplaces (which are part of the same risk pool), as well as individual plans originally purchased before the ACA went into effect.
Medical Loss Ratios
As we found in our previous analysis, insurer financial performance as measured by loss ratios (the share of health premiums paid out as claims) worsened in the earliest years of the Affordable Care Act, but began to improve more recently. This is to be expected, as the market had just undergone significant regulatory changes in 2014 and insurers had very little information to work with in setting their premiums, even going into the second year of the exchange markets.
Loss ratios began to decline in 2016, suggesting improved financial performance. In 2017, following relatively large premium increases, individual market insurers saw significant improvement in loss ratios, averaging 82%. Though 2017 annual loss ratios are impacted by the loss of cost-sharing subsidy payments during the last three months of the year, this is nevertheless a sign that individual market insurers on average were beginning to stabilize in 2017, better matching premium revenues to claims costs.
Figure 1: Average Individual Market Medical Loss Ratios, 2011 – 2017
Margins
Another way to look at individual market financial performance is to examine average gross margins per member per month, or the average amount by which premium income exceeds claims costs per enrollee in a given month. Gross margins are an indicator of performance, but positive margins do not necessarily translate into profitability since they do not account for administrative expenses.
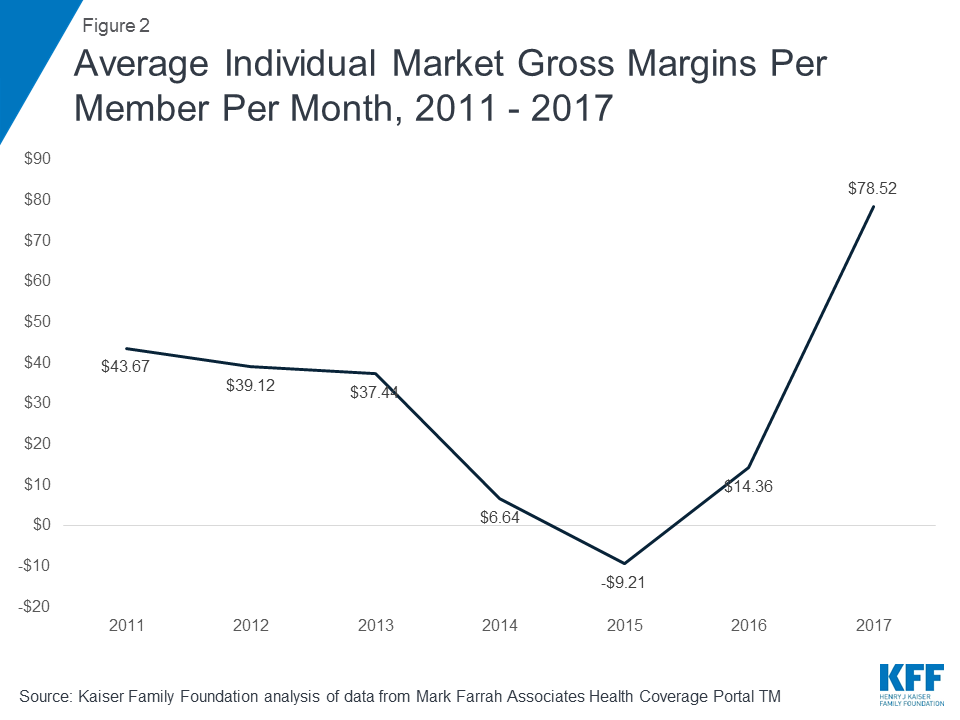
Figure 2: Average Individual Market Gross Margins Per Member Per Month, 2011 – 2017
Looking at gross margins, we see a similar pattern as we did looking at loss ratios, where insurer financial performance improved dramatically through 2017 (increasing to $79 per enrollee, from a recent annual low of -$9 in 2015). These data suggest that insurers in this market are on track to reach pre-ACA individual market performance levels, and that insurers are generally now earning a profit in the individual market.
Underlying Trends
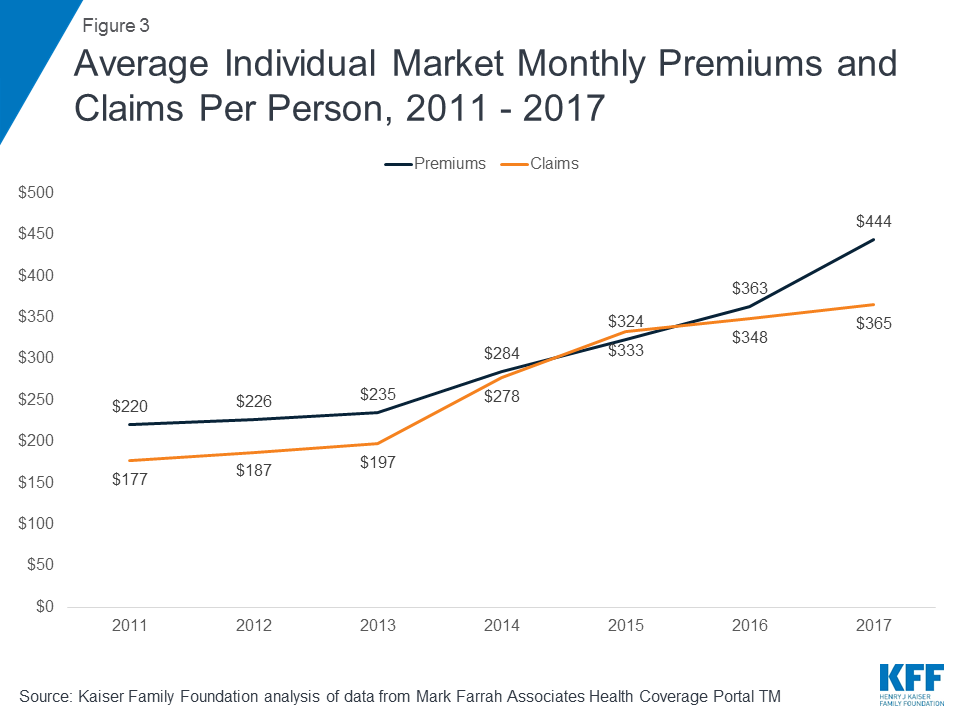
Driving recent improvements in individual market insurer financial performance are the premium increases in 2017 and simultaneous slow growth in claims for medical expenses. On average, premiums per enrollee grew 22% from 2016 to 2017, while per person claims grew only 5%.
Figure 3: Average Individual Market Monthly Premiums and Claims Per Person, 2011 – 2017
One concern about rising premiums in the individual market was whether healthy enrollees would drop out of the market in large numbers rather than pay higher rates. While the vast majority of exchange enrollees are subsidized and sheltered from paying premium increases, those enrolling off-exchange would have to pay the full increase. As average claims costs grew very slowly through 2017, it does not appear that the enrollees in the market last year were noticeably sicker than in the early years of ACA implementation.
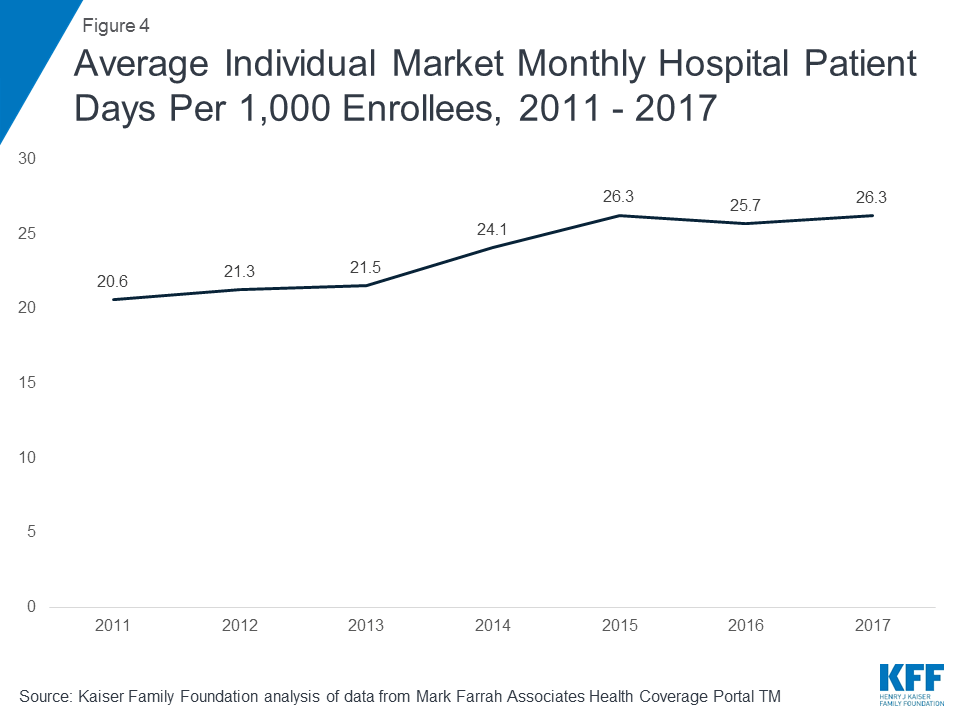
On average, the number of days individual market enrollees spent in a hospital in 2017 was similar to inpatient days in the previous two years.
Figure 4: Average Individual Market Monthly Hospital Patient Days Per 1,000 Enrollees, 2011 – 2017
Taken together, these data on claims and utilization suggest that the individual market risk pool is relatively stable, though sicker on average than the pre-ACA market, which is to be expected since people with pre-existing conditions have guaranteed access to coverage under the ACA.
Discussion
Annual results from 2017 suggest the individual market was stabilizing and insurers in this market were regaining profitability. Insurer financial results through 2017 – after the Administration’s decision to stop making cost-sharing subsidy payments and before the repeal of the individual mandate penalty in the tax overhaul goes into effect – showed no sign of a market collapse. Annual premium and claims data from 2017 support the notion that 2017 premium increases were necessary as a one-time market correction to adjust for a sicker-than-expected risk pool. Although individual market enrollees appear on average to be sicker than the market pre-ACA — which is to be expected once people with pre-existing conditions were guaranteed access to insurance — data on hospitalizations in this market suggest that the risk pool was stable on average and was not getting progressively sicker. Some insurers have exited the market in recent years, but others have been successful and expanded their footprints, as would be expected in a competitive marketplace.
While the market on average was stabilizing, there remain some areas of the country that are more fragile. In addition, policy changes have the potential to destabilize the individual market generally. The decision by the Administration to cease cost-sharing subsidy payments led some insurers to leave the market or request larger premium increases than they would otherwise. A few parts of the country were thought to be at risk of having no insurer on exchange in 2018, though new entrants or expanding insurers have since moved in to cover all areas previously at risk of being bare. Signups through the federal marketplace during the recently completed open enrollment period declined somewhat, but were higher than many expected, which could help to keep the market stable. However, repeal of the individual mandate as part of tax reform legislation will take effect in 2019, combined with the likely expansion of loosely-regulated short-term insurance plans that could siphon off healthy enrollees from the ACA-regulated individual market. These changes will increase uncertainty for insurers and likely push premiums higher.
Methods
We analyzed insurer-reported financial data from Health Coverage Portal TM, a market database maintained by Mark Farrah Associates, which includes information from the National Association of Insurance Commissioners. The dataset analyzed in this report does not include NAIC plans licensed as life insurance or California HMOs regulated by California’s Department of Managed Health Care; in total, the plans in this dataset represent at least 80% of the individual market. All figures in this data note are for the individual health insurance market as a whole, which includes major medical insurance plans sold both on and off exchange. We excluded some plans that filed negative enrollment, premiums, or claims and corrected for plans that did not file “member months” in the annual statement but did file current year membership.
To calculate the weighted average loss ratio across the individual market, we divided the market-wide sum of total incurred claims by the sum of all unadjusted health premiums earned. Medical loss ratios in this analysis are simple loss ratios and do not adjust for quality improvement expenses, taxes, or risk program payments. Gross margins were calculated by subtracting the sum of total incurred claims from the sum of unadjusted health premiums earned and dividing by the total number of member months (average monthly enrollment) in the individual insurance market. Using earned premiums adjusted for taxes and fees to calculate loss ratios and gross margins increases the MLR by 5 percentage points and decreases the gross margin per member by $23 in 2017. On average across all years, using earned premiums adjusted for taxes and fees increases the MLR by 3 percentage points and decreases the gross margin per member by $10.
Endnotes
The loss ratios shown in this data note differ from the definition of MLR in the ACA, which makes some adjustments for quality improvement and taxes, and do not account for reinsurance, risk corridors, or risk adjustment payments. Reinsurance payments, in particular, helped offset some losses insurers would have otherwise experienced. However, the ACAu2019s reinsurance program was temporary, ending in 2016, so loss ratio calculations excluding reinsurance payments are a good indicator of financial stability going forward. ↩︎
States that have expanded Medicaid under the Affordable Care Act generally have seen gains in coverage, improvements in access to and affordability of health care, and net fiscal benefits, a growing body of research and data show.
At the same time, Medicaid expansion has not diverted coverage from traditional groups or significantly reduced state spending on other programs, the research shows, contrary to assertions by some critics of Medicaid expansion. For example, data do not support a relationship between states’ expansion status and Medicaid community-based long-term care services waiver waiting lists.
These are the key findings in a new issue brief from the Kaiser Family Foundation that summarizes the existing research as the debate intensifies over the costs and benefits of Medicaid expansion. Some studies look at 2014-2016, when expansion costs were 100 percent financed by the federal government, so savings estimates could change, but other studies anticipate net fiscal gains even after states begin to pay the state share of the expansion costs. Several more states are considering expanding Medicaid to cover low-income adults (some through ballot initiatives), joining 32 states and Washington D.C. that have already adopted Medicaid expansion.
Amid the renewed debate, some states, encouraged by the Trump Administration, are pursuing waivers to reshape their Medicaid programs with work or community engagement requirements that would lead to declines in enrollment and scale back Medicaid expansion coverage. The new brief highlights what the latest research shows about Medicaid expansion’s effects on coverage, access, affordability, health outcomes, economic measures, and work.
With a new outbreak reported in the Democratic Republic of Congo (DRC) in May 2018, the Ebola virus is again in the news; four years have passed since the emergence of a major epidemic in West Africa in 2014 that eventually killed over 11,000 people. Counting the current outbreak, DRC has experienced a total of 9 outbreaks of Ebola since 1976, including one just last year. The current outbreak is generating a growing international response, including funding and technical assistance from the World Health Organization (WHO) and other global health organizations.
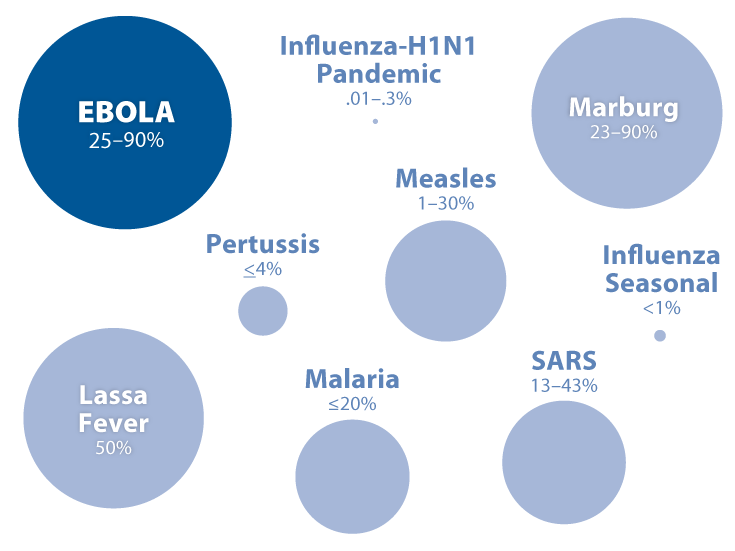
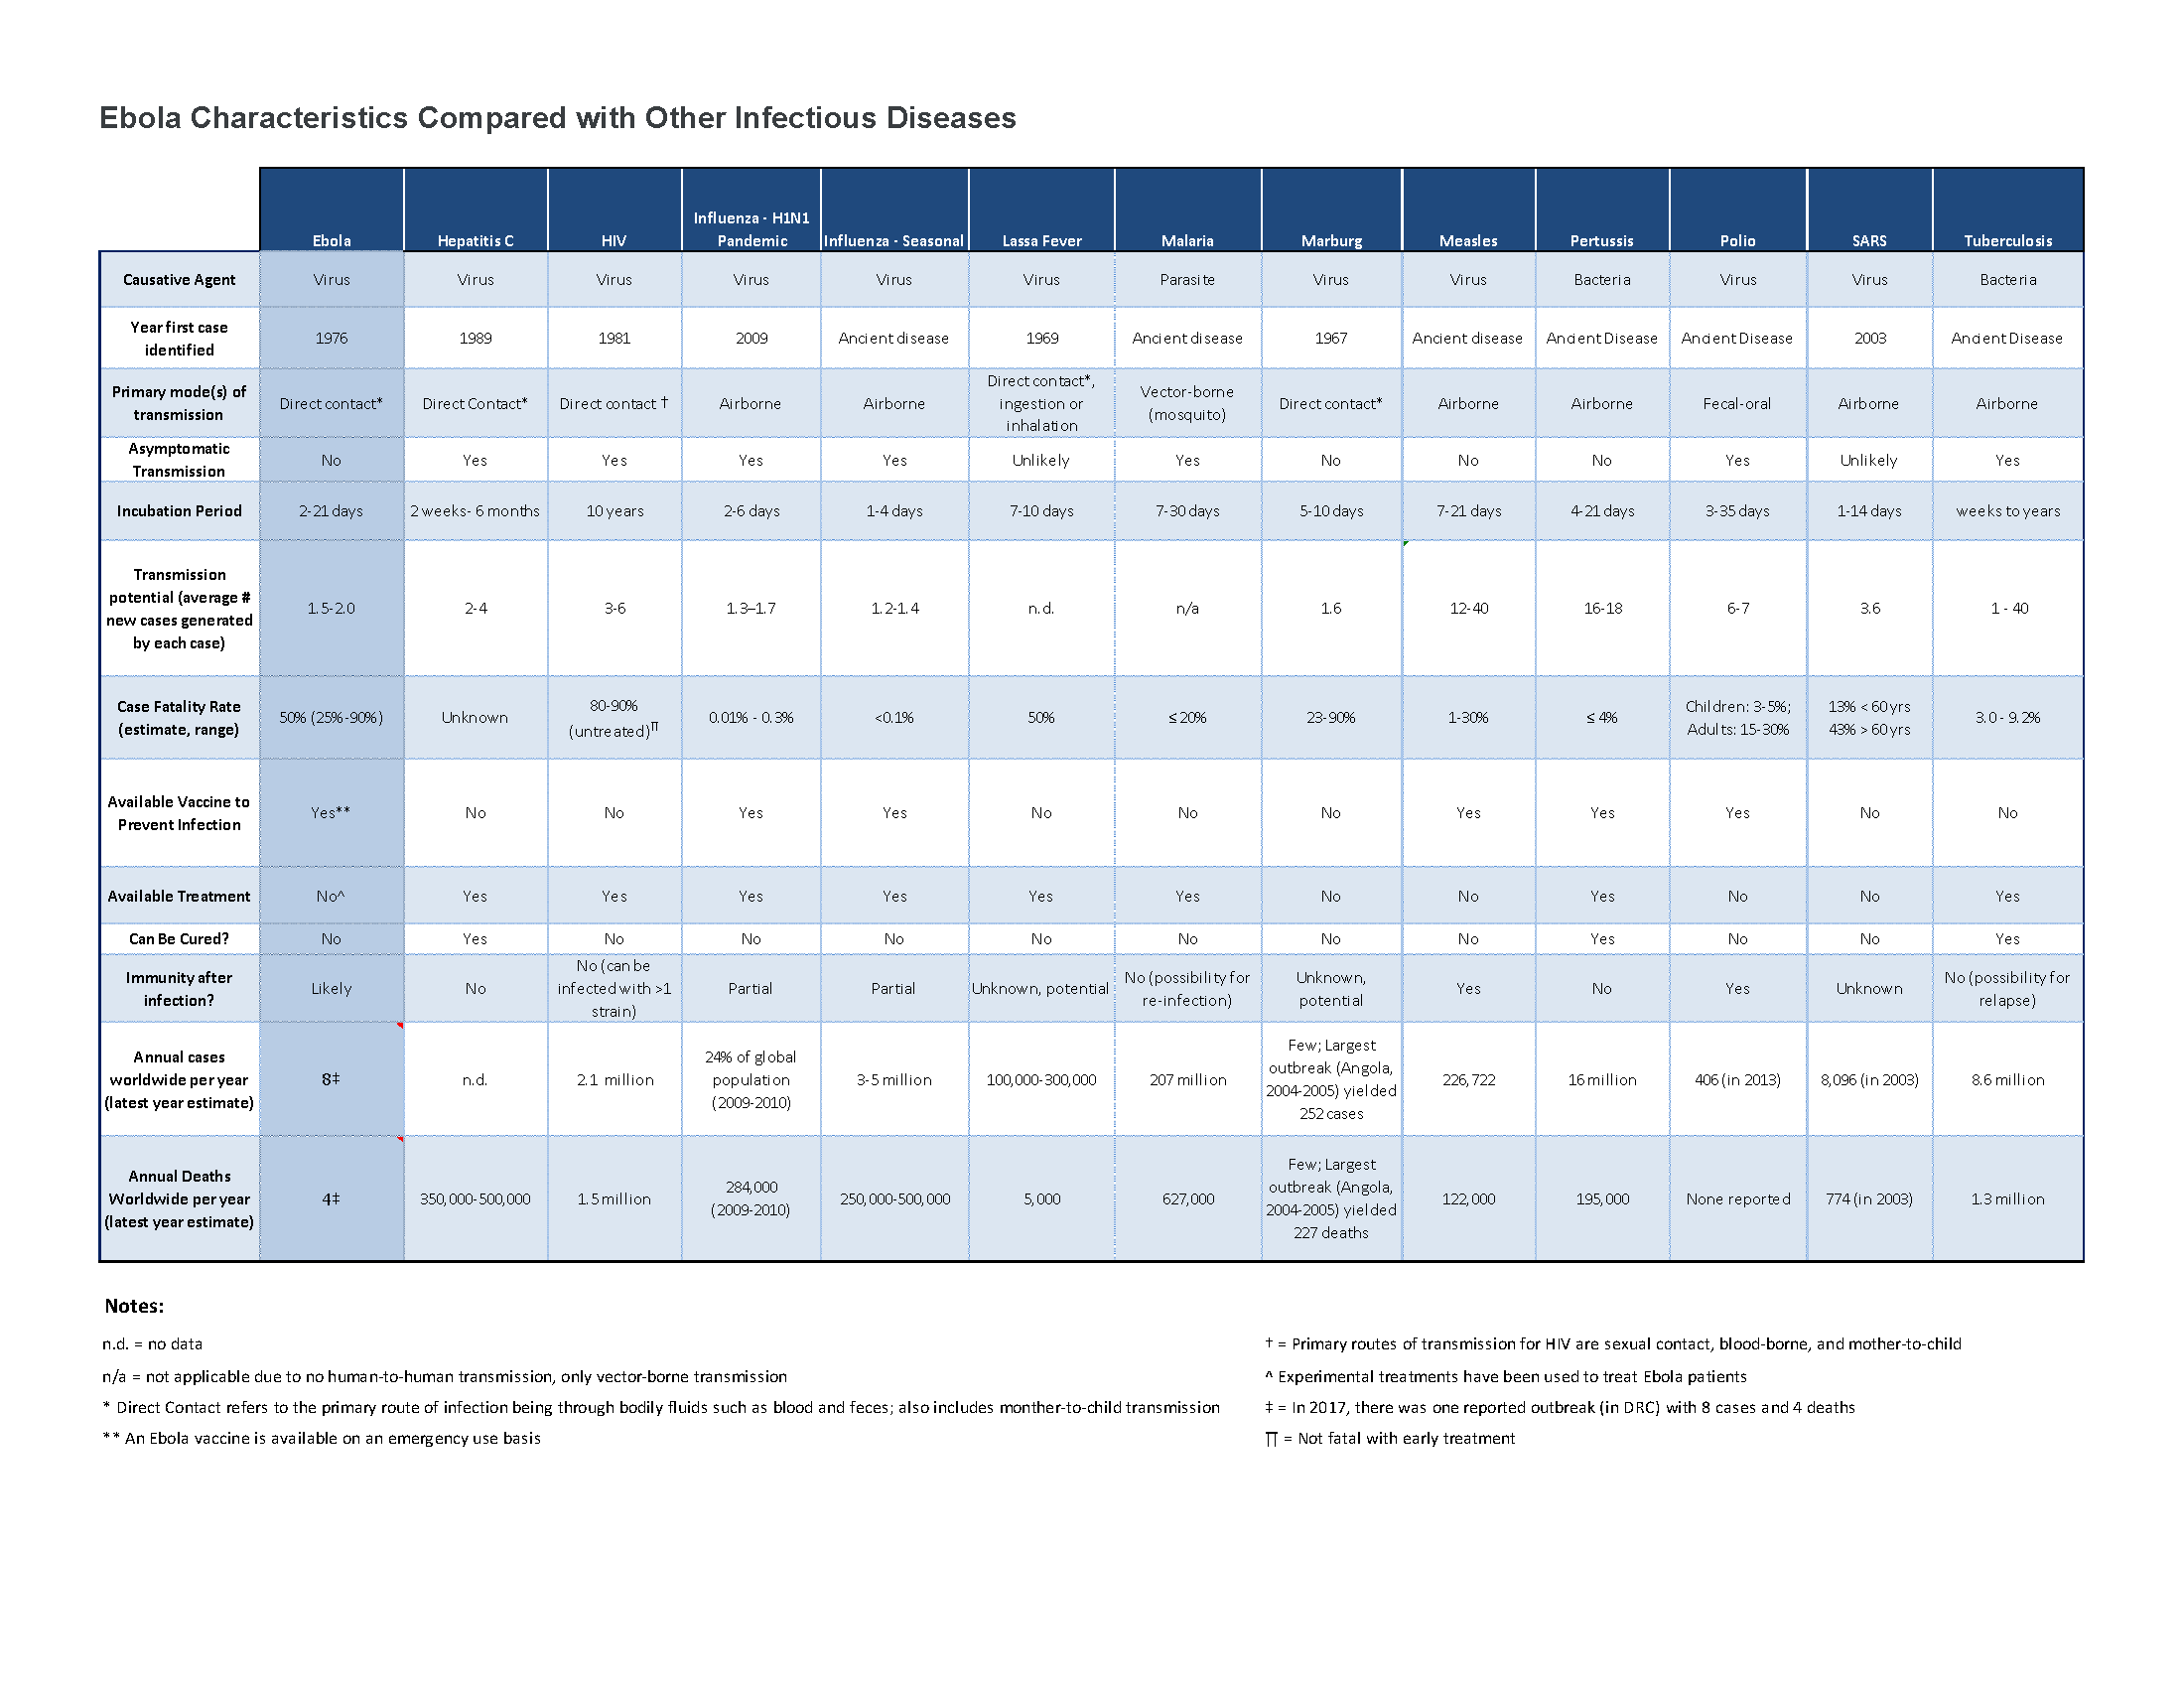
Ebola virus has a unique set of characteristics that determines its spread and how deadly it is. To better understand Ebola, we pose five key questions about Ebola and compare it to twelve other infectious diseases that represent public health challenges today. These different diseases vary in terms of how they are spread, how deadly they are, and whether there are vaccines, treatments, or cures to address them.
1. How is Ebola transmitted?
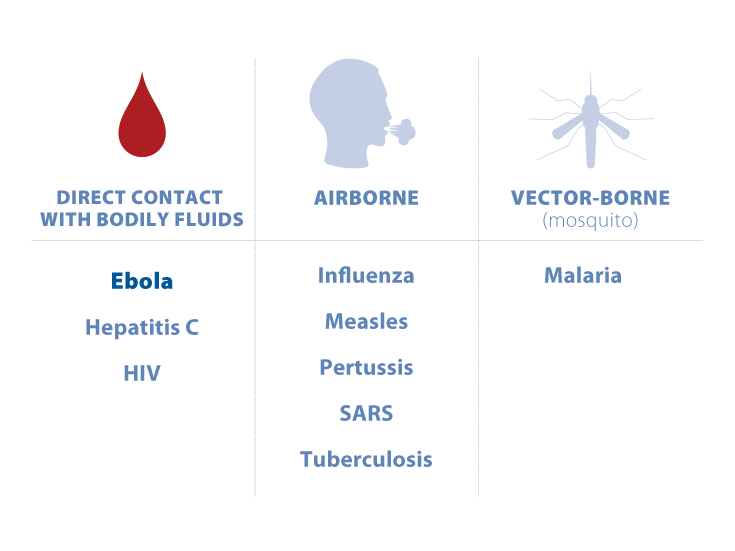
How an infectious disease is transmitted – whether through direct contact with bodily fluids, through air, or other means, as well as whether human-to-human transmission is possible – is important for understanding how to prevent and track the disease. Ebola is transmitted only through direct contact with bodily fluids, as are HIV and Hepatitis C. Other diseases, such as measles and SARS, are transmitted through airborne means. Human- to-human transmission occurs for all of the diseases included in this profile except for malaria, which is transmitted by mosquitoes to humans.
2. Is asymptomatic transmission of Ebola possible?
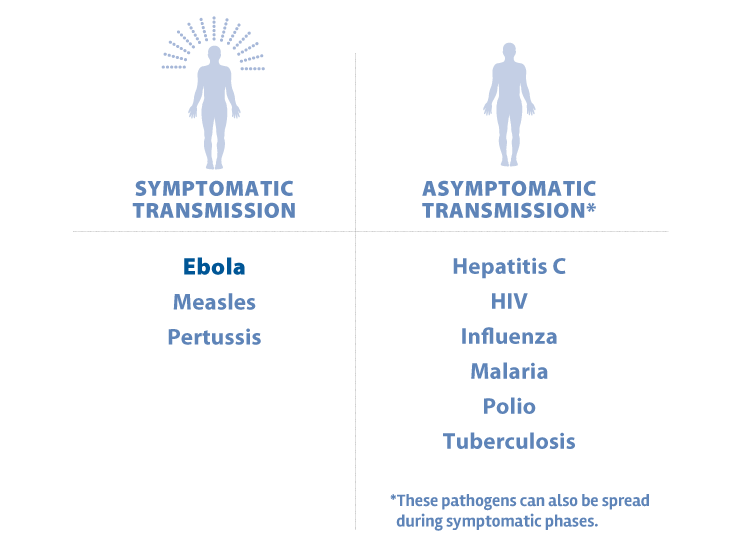
Some diseases can be transmitted only when symptoms are present (such as fever, coughing or lesions), while others can be transmitted even when a person does not yet have symptoms, known as being asymptomatic. Ebola is only transmitted when symptoms are present, in contrast to diseases such as HIV, influenza, and malaria which have symptomatic and asymptomatic transmission.
3. How long is Ebola’s incubation period?
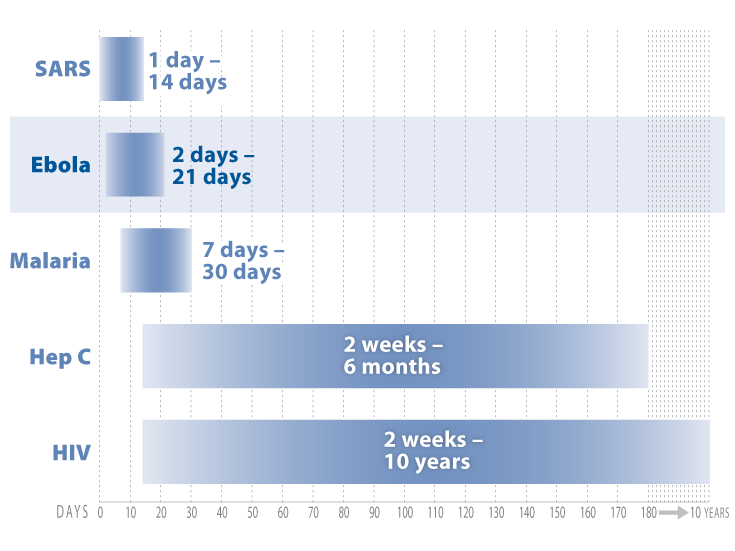
The incubation period of a disease is the time between initial infection and when symptoms first appear. Ebola’s incubation period of 2 to 21 days is fairly short compared to other infectious diseases such as HIV, which can have an incubation period of 10 years or even longer. It is also shorter than the incubation period for Tuberculosis and Hepatitis C. However, some other infectious diseases, such as SARS and influenza, have, on average, shorter incubation periods than Ebola.
4. Is there a vaccine, treatment, or cure for Ebola?
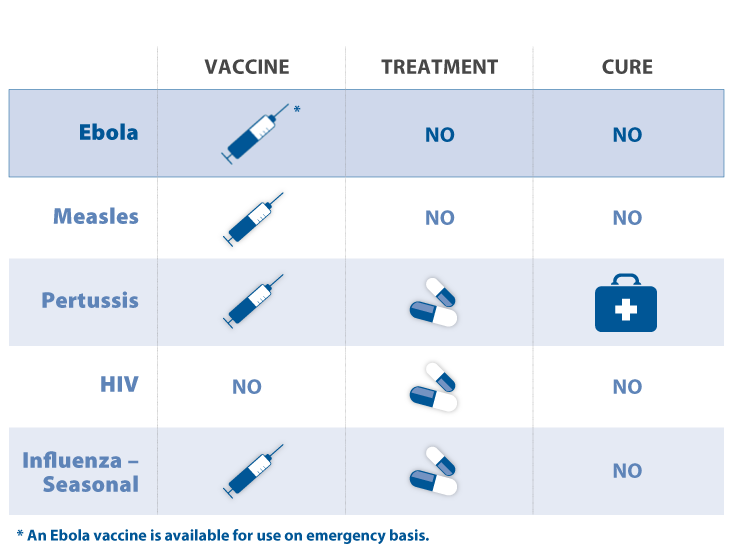
Currently, there are no approved treatments for Ebola (other than highly experimental treatments, and treatments for its symptoms), and no cure at the moment. An Ebola vaccine, developed since the 2014 West Africa epidemic, is now available in limited quantities on an emergency use basis; WHO and DRC have agreed to use this vaccine in the effort to combat the current outbreak.
Other diseases have treatments but no vaccine and no cure (such as HIV), while still others have vaccines and treatments (such as influenza).
5. How deadly is Ebola?
Ebola is one of the most deadly infectious diseases we know of, causing death in approximately 50 percent of people who become infected (its estimated case-fatality rate). Still, case fatality rates can differ across different outbreaks, and for Ebola it has ranged from 25% to as high as 90% in previous outbreaks. Case fatality rates for other diseases are much lower, including those for seasonal influenza (less than 1%) and SARS (13-43%).
Ebola: Key Characteristics Compared to Other Infectious Diseases (Table)
Social determinants of health are the conditions in which people are born, grow, live, work and age that shape health. This brief provides an overview of social determinants of health and emerging initiatives to address them. It shows:
Social determinants of health include factors like socioeconomic status, education, neighborhood and physical environment, employment, and social support networks, as well as access to health care. Addressing social determinants of health is important for improving health and reducing longstanding disparities in health and health care.
There are a growing number of initiatives to address social determinants of health within and outside of the health care system. Outside of the health care system, initiatives seek to shape policies and practices in non-health sectors in ways that promote health and health equity. Within the health care system, there are multi-payer federal and state initiatives as well as Medicaid-specific initiatives focused on addressing social needs. These include models under the Center for Medicare and Medicaid Innovation, Medicaid delivery system and payment reform initiatives, and options under Medicaid. Managed care plans and providers also are engaged in activities to identify and address social needs. For example, 19 states required Medicaid managed care plans to screen for and/or provide referrals for social needs in 2017, and a recent survey of Medicaid managed care plans found that almost all (91%) responding plans reported activities to address social determinants of health.
Many challenges remain to address social determinants of health, and new directions pursued by the Trump Administration could limit resources and initiatives focused on these efforts. The Trump Administration is pursuing a range of new policies and policy changes, including enforcing and expanding work requirements associated with public programs and reducing funding for prevention and public health. These changes may limit individuals’ access to assistance programs to address health and other needs and reduce resources available to address social determinants of health.
Introduction
Efforts to improve health in the U.S. have traditionally looked to the health care system as the key driver of health and health outcomes. However, there has been increased recognition that improving health and achieving health equity will require broader approaches that address social, economic, and environmental factors that influence health. This brief provides an overview of these social determinants of health and discusses emerging initiatives to address them.
What are Social Determinants of Health?
Social determinants of health are the conditions in which people are born, grow, live, work and age.1 They include factors like socioeconomic status, education, neighborhood and physical environment, employment, and social support networks, as well as access to health care (Figure 1).
Figure 1: Social Determinants of Health
Addressing social determinants of health is important for improving health and reducing health disparities.2 Though health care is essential to health, it is a relatively weak health determinant.3 Research shows that health outcomes are driven by an array of factors, including underlying genetics, health behaviors, social and environmental factors, and health care. While there is currently no consensus in the research on the magnitude of the relative contributions of each of these factors to health, studies suggest that health behaviors, such as smoking, diet, and exercise, and social and economic factors are the primary drivers of health outcomes, and social and economic factors can shape individuals’ health behaviors. For example, children born to parents who have not completed high school are more likely to live in an environment that poses barriers to health such as lack of safety, exposed garbage, and substandard housing. They also are less likely to have access to sidewalks, parks or playgrounds, recreation centers, or a library.4 Further, evidence shows that stress negatively affects health across the lifespan5 and that environmental factors may have multi-generational impacts.6 Addressing social determinants of health is not only important for improving overall health, but also for reducing health disparities that are often rooted in social and economic disadvantages.
Initiatives to Address Social Determinants of Health
A growing number of initiatives are emerging to address social determinants of health. Some of these initiatives seek to increase the focus on health in non-health sectors, while others focus on having the health care system address broader social and environmental factors that influence health.
Focus on Health in Non-Health Sectors
Policies and practices in non-health sectors have impacts on health and health equity. For example, the availability and accessibility of public transportation affects access to employment, affordable healthy foods, health care, and other important drivers of health and wellness. Nutrition programs and policies can also promote health, for example, by supporting healthier corner stores in low-income communities,7 farm to school programs8 and community and school gardens, and through broader efforts to support the production and consumption of healthy foods.9 The provision of early childhood education to children in low-income families and communities of color helps to reduce achievement gaps, improve the health of low-income students, and promote health equity.10
“Health in All Policies” is an approach that incorporates health considerations into decision making across sectors and policy areas.11 A Health in All Policies approach identifies the ways in which decisions in multiple sectors affect health, and how improved health can support the goals of these multiple sectors. It engages diverse partners and stakeholders to work together to promote health, equity, and sustainability, and simultaneously advance other goals such as promoting job creation and economic stability, transportation access and mobility, a strong agricultural system, and improved educational attainment. States and localities are utilizing the Health in All Policies approach through task forces and workgroups focused on bringing together leaders across agencies and the community to collaborate and prioritize a focus on health and health equity.12 At the federal level, the Affordable Care Act (ACA) established the National Prevention Council, which brings together senior leadership from 20 federal departments, agencies, and offices, who worked with the Prevention Advisory Group, stakeholders, and the pubic to develop the National Prevention Strategy.
Place-based initiatives focus on implementing cross-sector strategies to improve health in neighborhoods or communities with poor health outcomes. There continues to be growing recognition of the relationship between neighborhoods and health, with zip code understood to be a stronger predictor of a person’s health than their genetic code.13 A number of initiatives focus on implementing coordinated strategies across different sectors in neighborhoods with social, economic, and environmental barriers that lead to poor health outcomes and health disparities. For example, the Harlem Children’s Zone (HCZ) project focuses on children within a 100-block area in Central Harlem that had chronic disease and infant mortality rates that exceeded rates for many other sections of the city as well as high rates of poverty and unemployment. HCZ seeks to improve the educational, economic, and health outcomes of the community through a broad range of family-based, social service, and health programs.
Addressing Social Determinants in the Health Care System
In addition to the growing movement to incorporate health impact/outcome considerations into non-health policy areas, there are also emerging efforts to address non-medical, social determinants of health within the context of the health care delivery system. These include multi-payer federal and state initiatives, Medicaid initiatives led by states or by health plans, as well as provider-level activities focused on identifying and addressing the non-medical, social needs of their patients.
Federal and State Initiatives
In 2016, Center for Medicare and Medicaid Innovation (CMMI), which was established by the ACA, announced a new “Accountable Health Communities” model focused on connecting Medicare and Medicaid beneficiaries with community services to address health-related social needs. The model provides funding to test whether systematically identifying and addressing the health-related social needs of Medicare and Medicaid beneficiaries through screening, referral, and community navigation services will affect health costs and reduce inpatient and outpatient utilization. In 2017, CMMI awarded 32 grants to organizations to participate in the model over a five-year period. Twelve awardees will provide navigation services to assist high-risk beneficiaries with accessing community services and 20 awardees will encourage partner alignment to ensure that community services are available and responsive to the needs of enrollees.14
Through the CMMI State Innovation Models Initiative (SIM), a number of states are engaged in multi-payer delivery and payment reforms that include a focus on population health and recognize the role of social determinants. SIM is a CMMI initiative that provides financial and technical support to states for the development and testing of state-led, multi-payer health care payment and service delivery models that aim to improve health system performance, increase quality of care, and decrease costs. To date, the SIM initiative has awarded nearly $950 million in grants to over half of states to design and/or test innovative payment and delivery models. As part of the second round of SIM grant awards, states are required to develop a statewide plan to improve population health. States that received Round 2 grants are pursuing a variety of approaches to identify and prioritize population health needs; link clinical, public health, and community-based resources; and address social determinants of health.
All 11 states that received Round 2 SIM testing grants plan to establish links between primary care and community-based organizations and social services.15 For example, Ohio is using SIM funds, in part, to support a comprehensive primary care (CPC) program in which primary care providers connect patients with needed social services and community-based prevention programs. As of December 2017, 96 practices were participating in the CPC program. Connecticut’s SIM model seeks to promote an Advanced Medical Home model that will address the wide array of individuals’ needs, including environmental and socioeconomic factors that contribute to their ongoing health.
A number of the states with Round 2 testing grants are creating local or regional entities to identify and address population health needs and establish links to community services. For example, Washington State established nine regional “Accountable Communities of Health,” which will bring together local stakeholders from multiple sectors to determine priorities for and implement regional health improvement projects.16 Delaware plans to implement ten “Healthy Neighborhoods” across the state that will focus on priorities such as healthy lifestyles, maternal and child health, mental health and addiction, and chronic disease prevention and management.17 Idaho is creating seven “Regional Health Collaboratives” through the state’s public health districts that will support local primary care practices in Patient-Centered Medical Home transformation and create formal referral and feedback protocols to link medical and social services providers.18
The Round 2 testing grant states also are pursuing a range of other activities focused on population health and social determinants. Some of these activities include using population health measures to qualify practices as medical homes or determine incentive payments, incorporating use of community health workers in care teams, and expanding data collection and analysis infrastructure focused on population health and social determinants of health.19
Medicaid Initiatives
Delivery System and Payment Reform
A number of delivery and payment reform initiatives within Medicaid include a focus on linking health care and social needs. In many cases, these efforts are part of the larger multi-payer SIM models noted above and may be part of Section 1115 Medicaid demonstration waivers.20 For example, Colorado and Oregon are implementing Medicaid payment and delivery models that provide care through regional entities that focus on integration of physical, behavioral, and social services as well as community engagement and collaboration.
In Oregon, each Coordinated Care Organization (or “CCO”) is required to establish a community advisory council and develop a community health needs assessment.21 CCOs receive a global payment for each enrollee, providing flexibility for CCOs to offer “health-related services” – which supplement traditional covered Medicaid benefits and may target the social determinants of health.22 Early experiences suggest that CCOs are connecting with community partners and beginning to address social factors that influence health through a range of projects. For example, one CCO has funded a community health worker to help link pregnant or parenting teens to health services and address other needs, such as housing, food, and income.23 Another CCO worked with providers and the local Meals on Wheels program to deliver meals to Medicaid enrollees discharged from the hospital who need food assistance as part of their recovery.24 An evaluation conducted by the Oregon Health & Science University’s Center for Health Systems Effectiveness released in 2017 found CCOs were associated with reductions in spending growth and improvement in some quality domains.25 According to the evaluation, most CCOs believed health-related flexible services were effective at improving outcomes and reducing costs.26
Similarly, in Colorado, the Regional Collaborative Organizations (RCCOs), which are paid a per member per month payment for enrollees, help connect individuals to community services through referral systems as well as through targeted programs designed to address specific needs identified within the community.27 A study published in 2017 comparing Oregon’s CCO program to Colorado’s RCCO program found that Colorado’s RCCO program generated comparable reductions in expenditures and inpatient care days.28
Several other state Medicaid programs have launched Accountable Care Organization (ACO) models that often include population-based payments or total cost of care formulas, which may provide incentives for providers to address the broad needs of Medicaid beneficiaries, including the social determinants of health.29
Some state Medicaid programs are supporting providers’ focus on social determinants of health through “Delivery System Reform Incentive Payment” (DSRIP) initiatives. DSRIP initiatives emerged under the Obama Administration as part of Section 1115 Medicaid demonstration waivers. DSRIP initiatives link Medicaid funding for eligible providers to process and performance metrics, which may involve addressing social needs and factors. For example, in New York, provider systems may implement DSRIP projects aimed at ensuring that people have supportive housing. The state also has invested significant state dollars outside of its DSRIP waiver in housing stock to ensure that a better supply of appropriate housing is available.30 In Texas, some providers have used DSRIP funds to install refrigerators in homeless shelters to improve individuals’ access to insulin.31 The California DSRIP waiver has increased the extent to which the public hospital systems focus on coordination with social services agencies and county-level welfare offices.32 To date, data on the results of DSRIP programs are limited, but a final federal evaluation report is scheduled to for 2019.33
Medicaid programs also are providing broader services to support health through the health homes option established by the ACA. Under this option, states can establish health homes to coordinate care for people who have chronic conditions. Health home services include comprehensive care management, care coordination, health promotion, comprehensive transitional care, patient and family support, as well as referrals to community and social support services. Health home providers can be a designated provider, a team of health professionals linked to a designated provider, or a community health team. A total of 21 states report that health homes were in place in fiscal year 2017.34 A federally-funded evaluation of the health homes model found that most providers reported significant growth in their ability to connect patients to nonclinical social services and supports under the model, but that lack of stable housing and transportation were common problems for many enrollees that were difficult for providers to address with insufficient affordable housing and rent support resources.35
Housing and Employment Supports
Some states are providing housing support to Medicaid enrollees through a range of optional state plan and waiver authorities. While states cannot use Medicaid funds to pay for room and board, Medicaid funds can support a range of housing-related activities, including referral, support services, and case management services that help connect and retain individuals in stable housing.36 For example, the Louisiana Department of Health formed a partnership with the Louisiana Housing Authority to establish a Permanent Supportive Housing (PSH) program with the dual goals of preventing and reducing homelessness and unnecessary institutionalization among people with disabilities. Louisiana’s Medicaid program covers three phases of tenancy support services for Medicaid beneficiaries in permanent supportive housing: pre-tenancy services (housing search assistance, application assistance etc.), move-in services, and ongoing tenancy services.37 Louisiana reports a 94% housing retention rate since the program began housing tenants in 2008. A preliminary analysis shows statistically significant reductions in hospitalizations and emergency department utilization after the PSH intervention, and an early independent analysis of the PSH program’s impact on Medicaid spending found a 24% reduction in Medicaid acute care costs after a person was housed.38
Through a range of optional and waiver authorities, some states are providing voluntary supported employment services to Medicaid enrollees. Supported employment services may include pre-employment services (e.g., employment assessment, assistance with identifying and obtaining employment, and/or working with employer on job customization) as well as employment sustaining services (e.g., job coaching and/or consultation with employers). States often target these services to specific Medicaid populations, such as persons with serious mental illness or substance use disorders and individuals with intellectual or developmental disabilities. For example, under a Section 1115 waiver, Hawaii offers supportive employment services to Medicaid enrollees with serious mental illness (SMI), individuals with serious and persistent mental illness (SPMI), and individuals who require support for emotional and behavioral development (SEBD).39
Medicaid Managed Care Organizations (MCOs)
Medicaid MCOs are increasingly engaging in activities to address social determinants of health. Data from the Kaiser Family Foundation’s 50-state Medicaid budget survey show that a growing number of states are requiring Medicaid MCOs to address social determinants of health as part of their contractual agreements (Box 1). In 2017, 19 states required Medicaid MCOs to screen beneficiaries for social needs and/or provide enrollees with referrals to social services and six states required MCOs to provide care coordination services to enrollees moving out of incarceration, with additional states planning to implement such requirements in 2018.40 Other data from a 2017 Kaiser Family Foundation survey of Medicaid managed care plans show that almost all responding MCOs41 (91%) reported activities to address social determinants of health, with housing and nutrition/food security as the top areas of focus.42 The most common activities plans reported engaging in were working with community -based organizations to link members to social services (93%), assessing members’ social needs (91%), and maintaining community or social service resource databases (81%) (Figure 2).43 Some plans also reported using community health workers (67%), using interdisciplinary community care teams (66%), offering application assistance and counseling referrals for social services (52%), and assisting justice-involved individuals with community reintegration (20%).
Box 1: Examples of States Integrating Social Determinants into Medicaid Managed Care Contracts
Arizona requires coordination of community resources like housing and utility assistance under its managed long-term services and supports (MLTSS) contract. The state provides state-only funding in conjunction with its managed behavioral health contract to provide housing assistance. The state also encourages health plans to coordinate with the Veterans’ Administration and other programs to meet members’ social support needs.
The District of Columbia encourages MCOs to refer beneficiaries with three or more chronic conditions to the “My Health GPS” Health Home program for care coordination and case management services, including a biopsychosocial needs assessment and referral to community and social support services.
Louisiana requires its plans to screen for problem gaming and tobacco use and requires referrals to Special Supplemental Nutrition Program for Women, Infants, and Children (WIC) and the Louisiana Permanent Supportive Housing program when appropriate.
Nebraska requires MCOs to have staff trained on social determinants of health and be familiar with community resources; plans are also required to have policies to address members with multiple biopsychosocial needs.
Figure 2: Strategies Medicaid MCOs Use to Connect Members to Social Services
PROVIDER ACTIVITIES
Under the ACA, not-for-profit hospitals are required to conduct a community health needs assessment (CHNA) once every three years and develop strategies to meet needs identified by the CHNA. The CDC defines a community health assessment as “the process of community engagement; collection, analysis, and interpretation of data on health outcomes and health determinants; identification of health disparities; and identification of resources that can be used to address priority needs.”44 Under the ACA, the assessment must take into account input from people who represent the broad interests of the community being served, including those with public health knowledge or expertise.
Some providers have adopted screening tools within their practices to identify health-related social needs of patients. For example, according to a survey of nearly 300 hospitals and health systems conducted by the Deloitte Center for Health Solutions in 2017, nearly 9 in 10 (88%) hospitals screen patients to gauge their health-related social needs, though only 62% report screening target populations in a systematic or consistent way.45 These hospitals are mostly screening inpatient and high-utilizer populations.46 The National Association for Community Health Centers, in coordination with several other organizations, developed the Protocol for Responding to and Assessing Patients’ Assets, Risks, and Experiences (PRAPARE) tool to help health centers and other providers collect data to better understand and act on their patients’ social determinants of health. Other organizations and entities have created screening tools, including Health Leads, a non-profit organization funded by the Robert Wood Johnson Foundation, which has developed a social needs screening toolkit for providers and CMMI, which released an Accountable Health Communities screening tool to help providers identify unmet patient needs.47
Looking Ahead
The ACA provided a key opportunity to help improve access to care and reduce longstanding disparities faced by historically underserved populations through both its coverage expansions and provisions to help bridge health care and community health. To date, millions of Americans have gained coverage through the coverage expansions, but coverage alone is not enough to improve health outcomes and achieve health equity. With growing recognition of the importance of social factors to health outcomes, an increasing number of initiatives have emerged to address social determinants of health by bringing a greater focus on health within non-health sectors and increasingly recognizing and addressing health-related social needs through the health care system.
Within the health care system, a broad range of initiatives have been launched at the federal and state level, including efforts within Medicaid. Many of these initiatives reflect new funding and demonstration authorities provided through the ACA to address social determinants of health and further health equity. They also reflect a broader system movement toward care integration and “whole-person” delivery models, which aim to address patients’ physical, mental, and social needs, as well as a shifts towards payments tied to value, quality, and/or outcomes.
Although there has been significant progress recognizing and addressing social determinants of health, many challenges remain. Notably, these efforts require working across siloed sectors with separate funding streams, where investments in one sector may accrue savings in another. Moreover, communities may not always have sufficient service capacity or supply to meet identified needs. Further, there remain gaps and inconsistencies in data on social determinants of health that limit the ability to aggregate data across settings or to use data to inform policy and operations, guide quality improvement, or evaluate interventions.48 Within Medicaid, the growing focus on social determinants of health raises new questions about the appropriate role Medicaid should play in addressing non-medical determinants of health and how to incentivize and engage Medicaid MCOs in addressing social determinants of health.49
The Trump Administration is pursuing policies that may limit individuals’ access to assistance programs to address health and other needs and reduce resources to address social determinants of health. The Administration has begun phasing out DSRIP programs,50 is revising Medicaid managed care regulations,51 and has signaled reductions in funding for prevention and public health. It has also announced plans to change the direction of models under the CMMI.52 , 53 , 54 The Administration also is pursuing approaches to enforce and expand work requirements in public programs,55 including Medicaid.56 CMS asserts that this policy is designed to “improve Medicaid enrollee health and well-being through incentivizing work and community engagement” and that state efforts to make participation in work or other community engagement a requirement for Medicaid coverage may “help individuals and families rise out of poverty and attain independence.”57 In guidance, CMS has specified that states implementing such programs will be required to describe strategies to assist enrollees in meeting work requirements (e.g., linking individuals to job training, childcare assistance, transportation, and other work supports), but that states may not use federal Medicaid funds for supportive services to help people overcome barriers to work.58 Data show that most nonelderly Medicaid adults already are working or face significant barriers to work, leaving a small share of adults to whom these policies are directed.59 However, eligible individuals could lose Medicaid coverage due to difficulty navigating documentation and administrative processes associated with these requirements.60
This brief updates an earlier version that was produced with Harry J. Heiman, formerly with the Satcher Health Leadership Institute at the Morehouse School of Medicine.