KFF designs, conducts and analyzes original public opinion and survey research on Americans’ attitudes, knowledge, and experiences with the health care system to help amplify the public’s voice in major national debates.
Coverage at Work: The Share of Nonelderly Americans with Employer-Based Insurance Rose Modestly in Recent Years, but Has Declined Markedly Over the Long Term
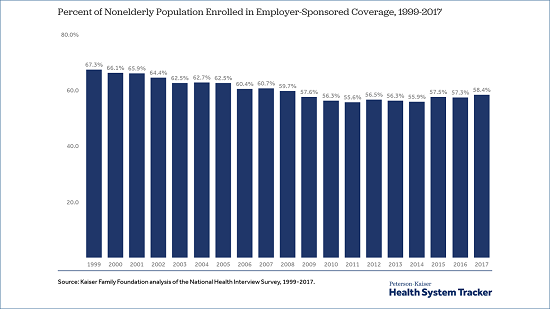
An improving economy and the Affordable Care Act’s individual mandate may be behind a modest increase in the share of Americans with job-based health insurance in recent years, but the long-term trend remains a downward one, according to a new KFF analysis.
Data from the federal National Health Interview Survey show the share of the nonelderly population covered by workplace plans rose from 56.3 percent in 2013 to 58.4 percent in 2017. That was still nearly nine percentage points lower than the 67.3 percent covered by employer-sponsored plans in 1999. The share has declined markedly over the last two decades, with the greatest percentage reductions among people with incomes under 400 percent of poverty ($85,320 for a family of three in 2019).
(It is still the single largest form of coverage, KFF President and CEO Drew Altman writes in an Axios column.)
While job-based insurance remains the nation’s single largest source of coverage, the 156.3 million people covered in workplace plans in 2017 was roughly equivalent to the 159.4 million covered in 1999 – this despite an increase in the nonelderly population of 31.5 million people since then. Had coverage rates stayed at the 1999 level, almost 24 million more people would have been in employer plans in 2017.
Several factors may help explain the recent upward trend, which has resulted in about seven million more people with employer-based health coverage since 2013. The economy improved steadily from the deep recession of 2008 and 2009, with both incomes and employment increasing, resulting in more people being eligible for and able to afford employer-sponsored coverage. Additionally, the ACA’s requirement that people obtain health insurance or pay a tax penalty, known as the “individual mandate,” may have pushed more Americans to enroll in employer coverage that they would have otherwise declined, and the law’s employer mandate may have helped boost the availability of coverage for lower-wage workers. (Congress has set the tax penalty for the individual mandate to $0 beginning this year.)
Pushing in the other direction, the availability of subsidies in the ACA marketplaces may have led some smaller employers not subject to the law’s employer mandate to stop offering coverage. More recently, though, rising premiums have helped drive a decline in individual market enrollment, especially among those not receiving ACA tax credits.
The new analysis is available on the Peterson-Kaiser Health System Tracker, a partnership between the Peterson Center on Healthcare and KFF that monitors the U.S. health system’s performance on key quality and cost measures.
Despite Medicare’s protections, Part D enrollees with serious health conditions can face thousands of dollars in annual out-of-pocket costs for expensive specialty drugs, a new KFF anaylsis finds.
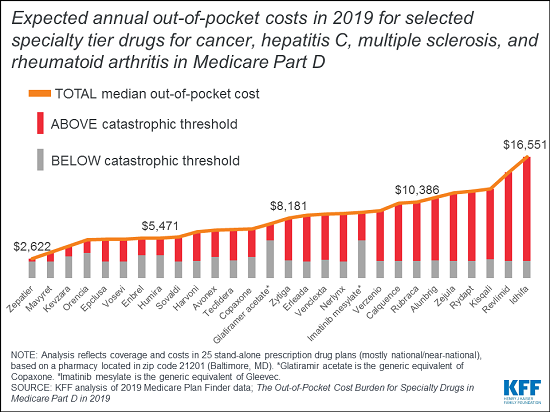
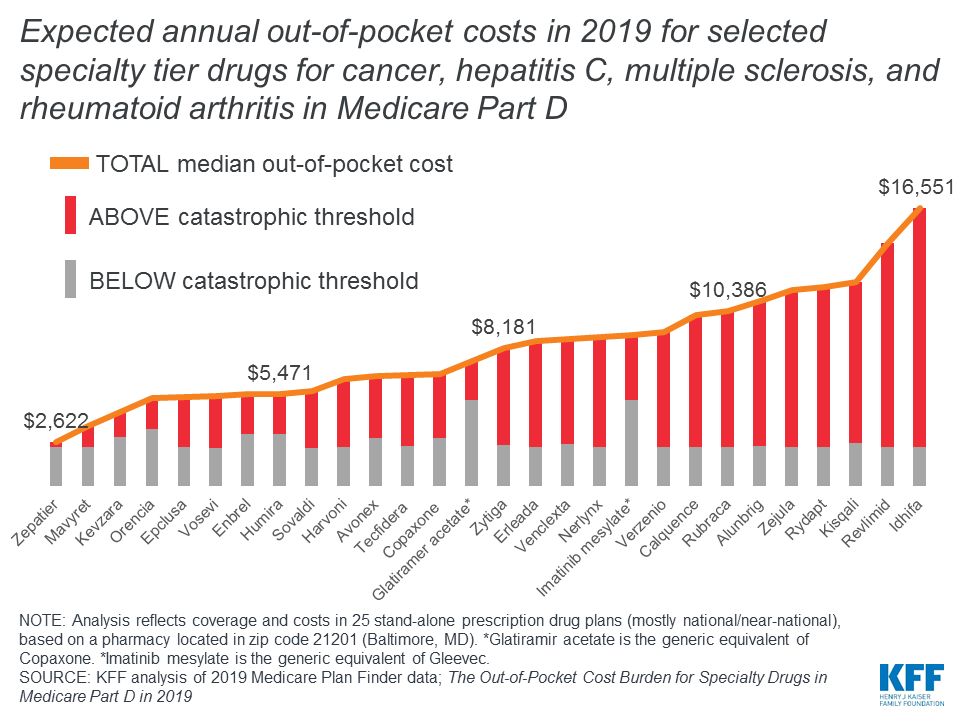
The analysis draws on data from Medicare’s Plan Finder website to calculate expected annual 2019 costs for more than two dozen specialty tier drugs used to treat four health conditions — cancer, hepatitis C, multiple sclerosis and rheumatoid arthritis – based on coverage and costs in national and near-national stand-alone drug plans, using a pharmacy in Baltimore, MD. It found that expected median out-of-pocket costs for Part D enrollees not receiving low-income subsidies would range from $2,622 for Zepatier (for hepatitis C) to $16,551 for Idhifa (for leukemia) in 2019.
The findings come at a time when the public has expressed concern about the rising cost of prescription drugs and policymakers are considering ways to curb such spending, especially in public programs like Medicare and Medicaid.
Medicare beneficiaries continue to confront high out-of-pocket costs for specialty medications even now that the Part D coverage gap for brand-name drugs (the so-called “doughnut hole”) has been closed. Medicare requires Part D enrollees to pay 5 percent coinsurance when their total annual out-of-pocket spending exceeds an annual threshold ($5,100 in 2019), a benchmark that is commonly surpassed by beneficiaries who take just one high-priced specialty drug and people who take multiple costly drugs. The catastrophic threshold is not an absolute limit on out-of-pocket spending.
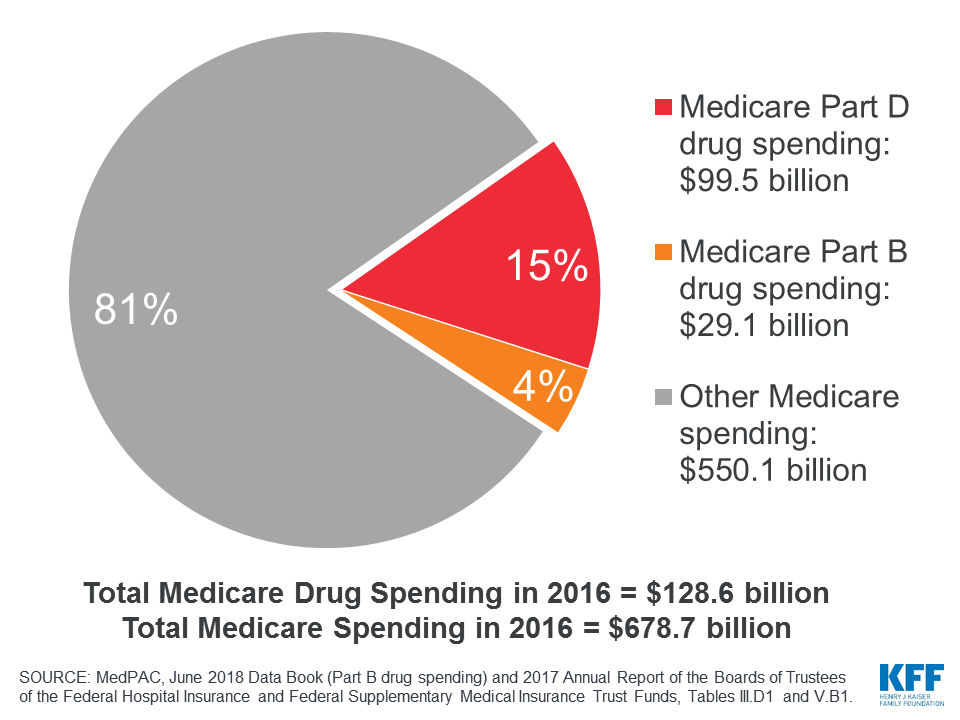
Prescription drugs play an important role in medical care for 60 million seniors and people with disabilities, and account for nearly $1 out of every $5 in Medicare spending. The majority of Medicare prescription drug spending—totaling $129 billion in 2016—is for drugs covered under the Part D prescription drug benefit, which is administered by private stand-alone drug plans and Medicare Advantage drug plans. Medicare Part B also covers drugs that are administered to patients in physician offices and other outpatient settings.
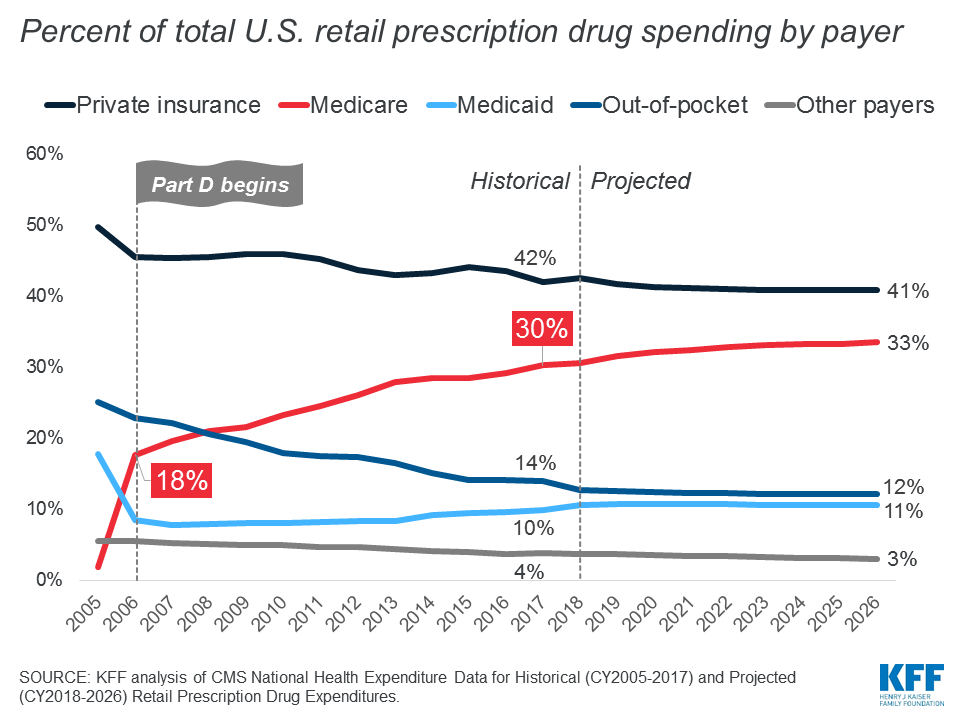
Medicare is second only to private insurance as a major payer for retail prescription drugs. The program’s share of the nation’s retail prescription drug spending has increased from 18% in 2006 to 30% in 2017.
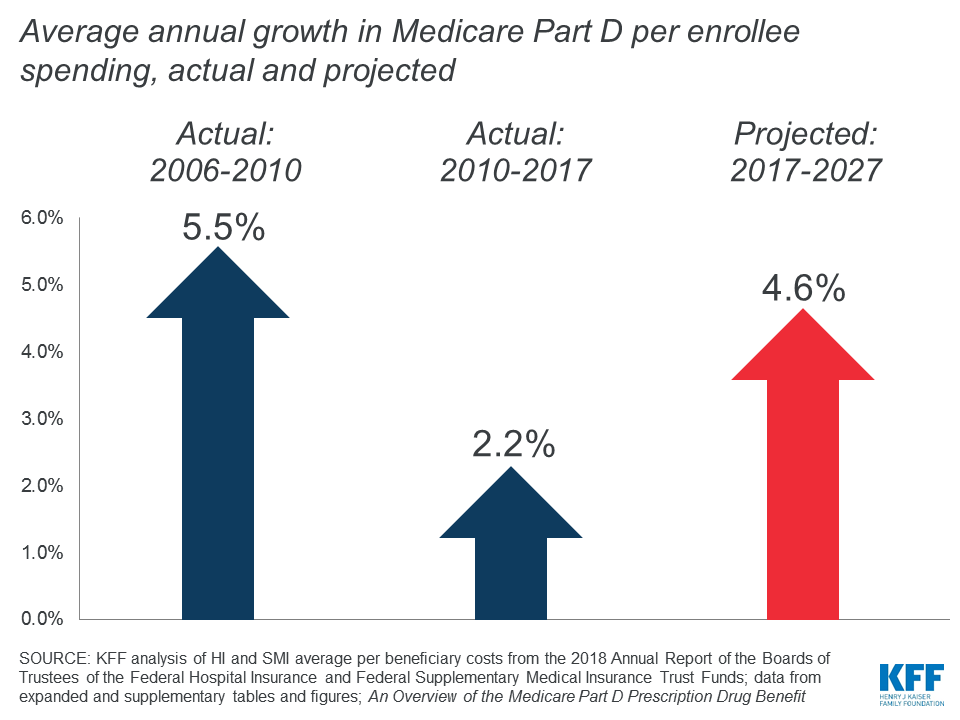
After a period of relatively slow growth, total and per capita Part D spending has increased more rapidly in the past few years mainly due to treatments for hepatitis C, and is projected to increase more rapidly in the next decade as more high-priced specialty drugs become available, according to the latest annual report of the Medicare Boards of Trustees.
Even with Medicare’s prescription drug coverage, beneficiaries can face substantial out-of-pocket costs, particularly if they use specialty drugs or multiple high-cost brand-name drugs. The following chart series examines trends in Medicare and beneficiary out-of-pocket spending on prescription drugs, and what the public thinks about different options for keeping drug costs down.
1. Medicare’s share of the nation’s retail prescription drug spending has increased from 18% in 2006 to 30% in 2017.
2. Prescription drugs covered under both Part B and Part D accounted for 19% of all Medicare spending in 2016.
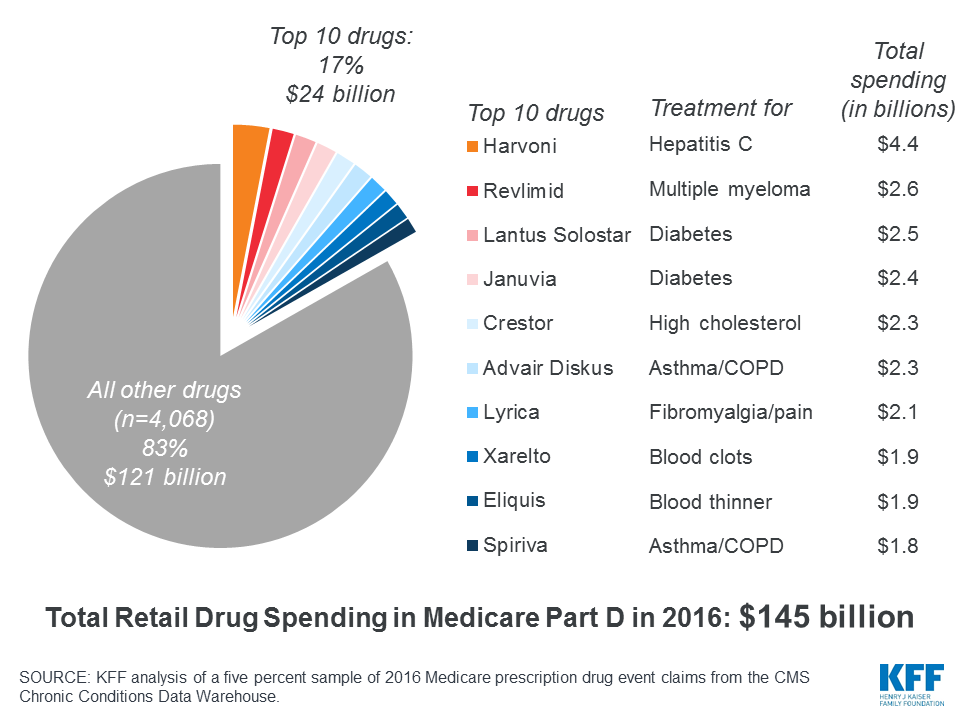
3. Ten drugs accounted for 17% of all Part D spending in 2016 (including both Medicare and out-of-pocket spending).
4. After a period of relatively slow growth, Medicare Part D spending per enrollee is projected to increase at a faster rate in the coming decade.
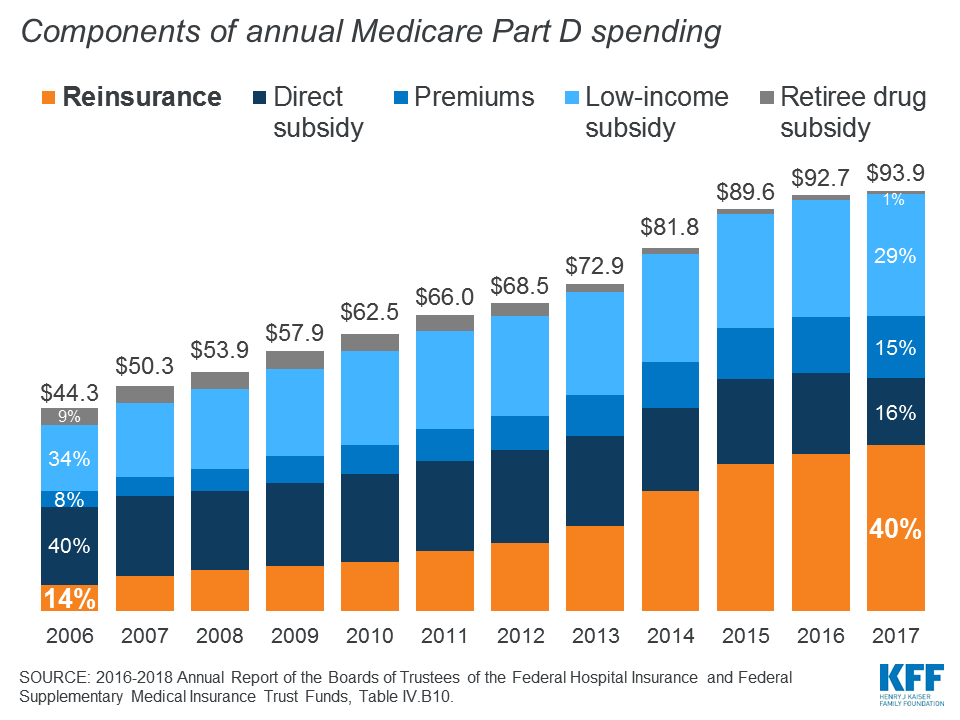
5. Spending for catastrophic coverage (“reinsurance”) has increased as a share of total Medicare Part D spending, from 14% in 2006 to 40% in 2017.
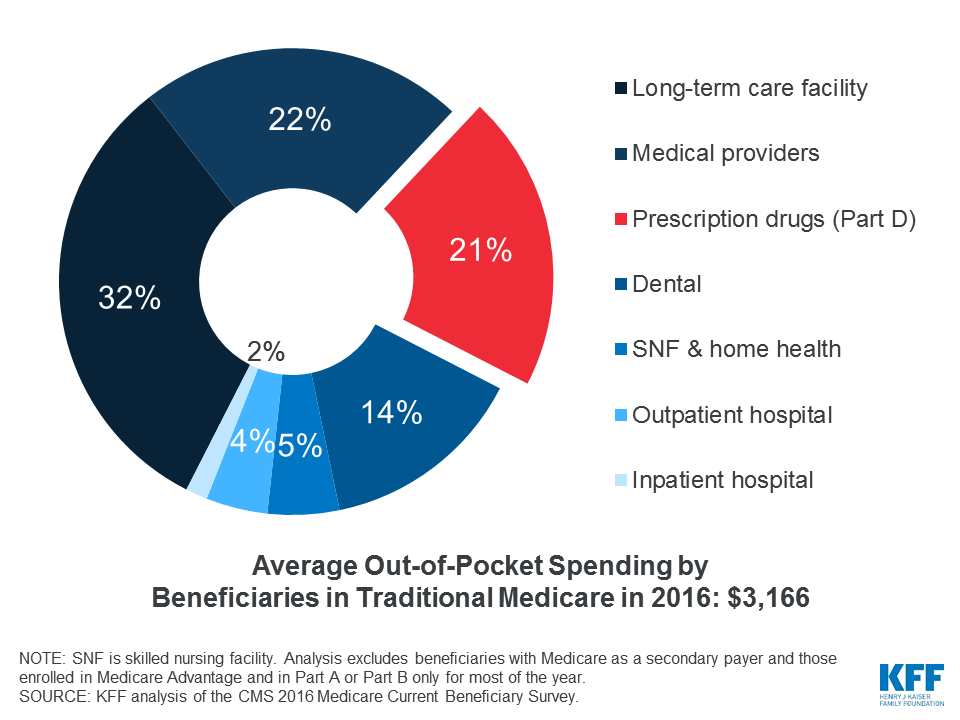
6. Prescription drugs accounted for $1 in every $5 that Medicare beneficiaries spent out-of-pocket on health care services in 2016, not including premiums.
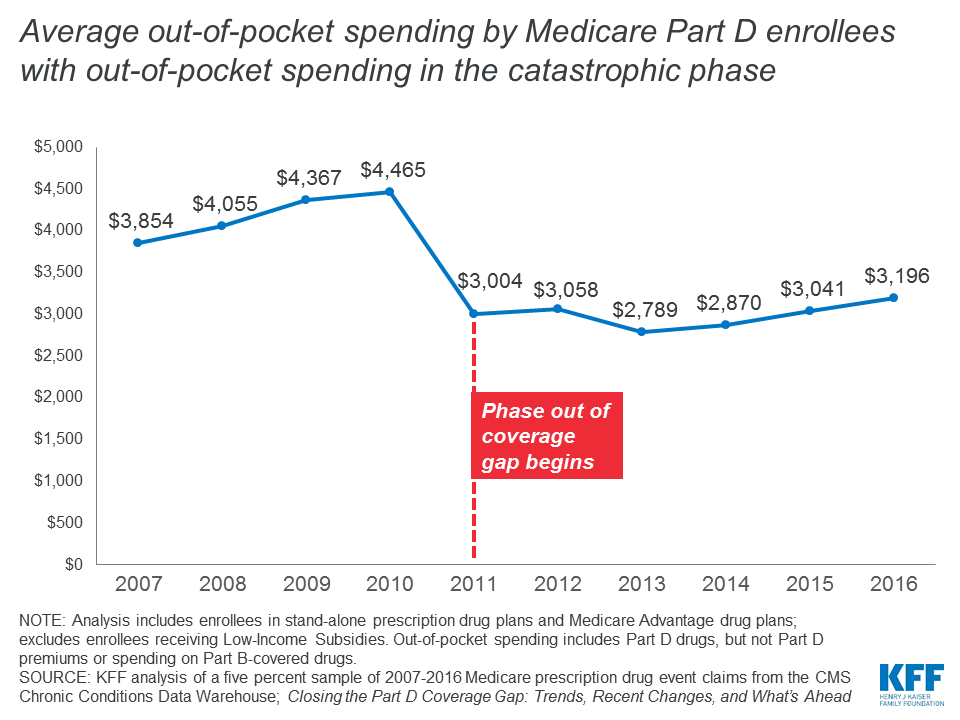
7. Medicare Part D enrollees who did not receive low-income subsidies spent about $500 out of pocket on their prescriptions in 2016, on average, but 1 million enrollees with spending above the catastrophic threshold spent nearly $3,200 out of pocket.
8. Average Part D enrollees’ out-of-pocket spending in the catastrophic phase dropped in 2011 due to the Affordable Care Act provision to phase out the coverage gap—but costs for this group are on the rise as total drug spending grows.
9. Medicare Part D enrollees can pay thousands of dollars out of pocket for specialty tier drugs, with the majority of costs for many specialty drugs occurring in the catastrophic phase of the benefit.
10. Many proposals to reduce prescription drug costs enjoy broad support among Democrats and Republicans.
Karen Pollitz, a Senior Fellow at KFF, testified on January 29, 2019, before the U.S. House Committee on Ways and Means as part of a hearing on Protecting Americans with Pre-Existing Conditions. Her testimony examines the prevalence of pre-existing conditions, the impact of the Affordable Care Act’s prohibition against medical underwriting and other provisions aimed at stabilizing the insurance risk pool, and the trade-offs involved in relaxing those provisions.
Non-communicable diseases (NCDs) are the leading causes of death and disability globally, killing more than three in five people worldwide and responsible for more than half of the global burden of disease.
NCDs cause and perpetuate poverty while hindering economic development in low- and middle-income countries. If they continue their upward trend, NCDs are estimated to cause a cumulative loss of output of $47 trillion between 2011 and 2030.
NCDs have received greater attention worldwide and within the United States in recent years, such as when the U.N. General Assembly met to discuss NCDs in 2011 (only the second time it met to discuss a specific health issue, with the first being HIV) and ultimately called for new global targets and an action plan for addressing NCDs. After reviewing progress in 2014, it again convened a high-level meeting on NCDs in 2018.
The U.S. government (U.S.) is increasingly engaged in addressing the challenge of NCDs in low- and middle-income countries, as several U.S. agencies and departments have begun to integrate activities targeting NCDs into other global health efforts, particularly through technical assistance and research activities.
To date, however, the U.S. response to NCDs is much smaller in scale and approach than its other global health efforts, such as its responses to global HIV and malaria.
Global Situation
Non-communicable diseases (NCDs) are not a new problem, having long been of concern in developed countries; they are, however, of increasing concern in developing countries because of their transition from low-income to middle-income status, the influence of globalization on consumption patterns, and the aging of populations.1 Identified as “one of the major challenges for sustainable development in the twenty-first century,”2 NCDs have received greater attention worldwide and within the United States in recent years, as global efforts to tackle this growing health challenge have become more organized and prominent.
Non-Communicable Diseases (NCDs): non-infectious and non-transmissible diseases that may be caused by genetic or behavioral factors and generally have a slow progression and long duration.3 These include cardiovascular diseases, cancer, chronic respiratory diseases, and diabetes.
Impact
NCDs cause more than two-thirds (71%, around 41 million) of all annual deaths4 and are among the leading causes of preventable illness and related disability.5 Cardiovascular diseases, cancer, chronic respiratory diseases, and diabetes (see Table 16) account for more than 80% of these deaths.7 Other NCDs include: diseases causing blindness or deafness, birth defects, mental and neurological disorders (including Alzheimer’s disease), and renal and autoimmune diseases.8
Table 1: NCDs Accounting for Most Global Deaths from NCDs
NCD
Description
Cardiovascular diseases(CVDs)
CVDs, the number one cause of death globally (mainly from coronary heart disease and stroke), can be mostly prevented by addressing risk factors; these include tobacco use, unhealthy diet and obesity, physical inactivity, and diabetes.
Cancer
With lung, stomach, liver, colon, and breast cancer causing most cancer deaths, behavioral and dietary risks include high body mass index, lack of physical activity, low fruit/vegetable intake, and tobacco and alcohol use. Viral infections (e.g., Hepatitis B and C viruses; Human papillomavirus) are also causes of cancer.
Chronic respiratory diseases
These are chronic diseases of the airways and other structures of the lung; among the most common are asthma and chronic obstructive pulmonary disease (COPD, an incurable, life-threatening lung disease that interferes with normal breathing). COPD is caused primarily by tobacco smoke (firsthand use or secondhand smoke).
Diabetes
A chronic disease that occurs when the body cannot effectively regulate blood sugar, uncontrolled diabetes can lead to death as a consequence of high fasting blood sugar. Addressing risk factors (e.g., healthy diet, physical activity, normal body weight) can help prevent or delay onset of adult-onset diabetes (type 2).
Affected Groups and Regions
The impact of NCDs is growing rapidly, affecting people of all ages and income levels in all regions of the world. The problem is expanding most in developing countries, where more than three quarters (32 million) of all NCD deaths occur (see Table 2).9 Though NCDs are often associated with older people, 15 million deaths caused by NCDs each year occur before the age of 70 (“premature deaths”); nearly all (over 85%) of these premature deaths occur in developing countries.10 For all regions except Africa, NCDs are now the leading causes of death; it is projected that by 2030, this will also be the case in Africa.11 With the growing incidence of NCDs and the ongoing challenge of tackling infectious diseases, some regions like Africa are facing a “double burden” of disease.
Age-Standardized, Deaths per 100,000 Population, 2016
Prevalence of Smoking Any Tobacco Product
Adults AgedAbove 15 Years,%, 2016
AlcoholConsumptionAdults AgedAbove 15 Years,Liters of Pure Alcohol per Person/Year, 2016
Obesity RateAdults AgedAbove 18 Years,%, 2016
Male
Female
Global
513
21.9
6.4
11.1
15.1
Africa
635
13.9
6.3
5.6
15.3
Americas
429
16.9
8.0
25.9
31.0
South-East Asia
603
24.8
4.5
3.3
6.1
Europe
454
24.8
9.8
21.9
24.5
Eastern Mediterranean
680
19.8
0.6
15.7
26.0
Western Pacific
478
24.1
7.3
6.0
6.7
LI/ LMI/UMI
632/631/533
—
—
3.6/5.3/11.3
9.9/9.9/16.2
High-Income
347
—
—
24.5
24.7
NOTES: LI means low income, LMI means lower middle income, UMI means upper middle income. – indicates data not available.
Economic Cost
The growing burden of NCDs also exacts an economic cost, as people are less productive, work for fewer years, and die prematurely. If they continue their upward trend, NCDs are estimated to cause a cumulative loss of output of $47 trillion between 2011 and 2030.13
Risk Factors
Risk factors for NCDs include behavioral, environmental, economic, and other social determinants of health.14 Behavioral risk factors are associated with higher health costs and reduced productivity; they include:
tobacco use,
unhealthy diets,
physical inactivity, and
harmful use of alcohol.
Other risk factors include growing urbanization, which contributes to changing physical activity and dietary patterns as well as pollution; poverty and growing inequalities in wealth (particularly in low- and middle-income countries), which affects access to affordable, nutritious food; and indoor air pollution, which is a more frequent problem in developing countries where inefficient cooking stoves are often used for indoor cooking/heating and result in smoke exposure. Risk for NCDs also varies by age, sex, and genetics.
Interventions
A range of interventions exist for addressing NCDs, including:15
prevention interventions that target modifiable risk factors and promote healthy living, such as education about NCDs and their risk factors, efforts to prevent and reduce the use of tobacco and the harmful use of alcohol, and creating environments that support increased consumption of fruit and vegetables, reduced salt intake, and increased physical activity;
measures to support effective treatment and quality care (with particular attention to the needs of the poor and most vulnerable, including those with major chronic diseases16 ), such as building the capacity of health systems and health workers to respond effectively to NCDs and ensuring the availability and affordability of medicines and basic technologies; and
efforts to raise the priority accorded to NCDs at the global and national levels (i.e., leadership and country ownership), to integrate NCD prevention and control into governments and multilateral institutions’ policies, plans, and programs, and to promote legislative, regulatory, and fiscal measures that discourage the use of tobacco and support health living.
Additionally, multisectoral and other partnerships for the prevention and control of NCDs support more holistic efforts by involving public health implementers as well as education, business, and other stakeholders in efforts.
U.N. High-Level Meetings
In 2011, the United Nations (U.N.) held a High-level Meeting on the Prevention and Control of NCDs. As only the second time that the U.N. General Assembly had met to discuss a specific health issue (the first being HIV), the High-Level Meeting led to greater global attention to NCDs and called for new global targets and an action plan for addressing NCDs.17 In 2014, the U.N. held a second High-level Meeting on the topic in order to review progress, and most recently, in September 2018, it again convened a comprehensive review of progress at a third High-level Meeting on NCDs.18
Global Goals
In recent years, major global NCD goals have been set through:
WHO Global Action Plan for NCDs
The WHO Global Action Plan for the Prevention and Control of NCDs, 2013–202019 was endorsed by the World Health Assembly in 2013.20 Among its targets are:
reducing deaths from NCDs by 25 percent by 2025.21 Achieving this target, which is often referred to as the “25 by 25” goal, is the focus of the roadmap laid out in the WHO Global Action Plan.
reducing the prevalence of current tobacco use in persons aged 15+ years by 30 percent. This target builds upon the goals of the 2003 Framework Convention on Tobacco Control (FCTC): reducing demand for and supply of tobacco.22
reducing the harmful use of alcohol by at least 10% (as appropriate, within the national context). Adopted in 2010, the WHO Global Strategy to Reduce the Harmful Use of Alcohol describes relevant policy options and interventions.23
reducing the prevalence of insufficient physical activity by 10%. Though more than a decade old now, the 2004 WHO Global Strategy on Diet, Physical Inactivity, and Health assigns responsibilities and sets objectives for improving physical health.24
achieving an 80% availability of the affordable basic technologies and essential medicines, including generics, required to treat major NCDs in both public and private facilities.
Additionally, the WHO Global Action Plan stresses that other NCDs are “often associated with mental disorders and other conditions and that mental disorders often coexist with other medical and social factors;” consequently, the plan should be implemented “in close coordination with the WHO Global Mental Health Action Plan, 2013–2020.”25
SDG 3: Reduce Premature Mortality from NCDs
Adopted in 2015 by all member-states of the United Nations, the Sustainable Development Goals (SDGs) include an NCD target and several risk-factor-related targets for achievement by 2030 under SDG 3 (“ensure healthy lives and promote well-being for all at all ages”), including reducing by one third premature mortality from NCDs through prevention and treatment and promoting mental health and well-being.26
U.S. Government Efforts
Though not an area of major focus historically, U.S. government attention to NCDs has grown recently. U.S. engagement in global NCDs has largely included health diplomacy, scientific research, and technical assistance, often drawing on the U.S. government’s experience with NCDs domestically, as well as some funding. For example, the U.S. has played an important role in international efforts to outline global priorities for and monitor country efforts to reduce the impact of NCDs.
Organization
Although there is no U.S. program that specifically focuses on NCDs in low- and middle-income countries, NCDs and their risk factors have been addressed as part of other U.S. global health activities, such as maternal and child health (MCH), HIV, and nutrition efforts.27 Such efforts are supported through the Department of Health and Human Services (HHS) and its operating divisions, including the Centers for Disease Control and Prevention (CDC) and the National Institutes for Health (NIH), as well as other agencies and departments:
HHS
CDC reports working on global NCDs for over 20 years through disease surveillance and epidemiology, risk factor identification, development of evidence-based prevention strategies, and efforts to increase country capacity to address NCDs. Efforts address issues like cervical cancer, clean cookstoves, epidemiology and training focused specifically on NCDs, hypertension, promoting physical activity, and tobacco control.28
Several NIH Institutes conduct NCD research, including globally-focused research as members of the Global Alliance for Chronic Diseases29 (an international public-private partnership that facilitates research collaborations focused on NCDs), as well as support NCD surveillance and training programs, strengthening local capacity and informing countries’ NCD policies.
The HHS Office of Global Affairs (OGA) leads the department’s engagement with multilateral partners and coordinates HHS operating divisions’ contributions to achieving the department’s NCD objectives.30
Other U.S. NCD Efforts
The efforts of the Department of State emphasize public-private partnerships with a focus on cancer and exposure to smoke from cookstoves.31
The approach of the U.S. Agency for International Development (USAID) to NCDs emphasizes investments in health systems strengthening, with existing global health efforts “building the foundation upon which future NCD efforts can be based.”32 In a few cases, the agency has identified cost-effective interventions to address NCDs, such as integrating tobacco screening and counseling into antenatal care programs.
The Millennium Challenge Corporation (MCC), a U.S. government corporation focused on promoting economic growth and reducing poverty in low- and middle-income countries, supports health projects addressing NCDs in certain countries.33
The U.S. also uses a collaborative approach across agencies and departments to address global NCDs. For instance, the President’s Emergency Plan for AIDS Relief (PEPFAR) in collaboration with NIH’s Fogarty International Center launched an HIV/NCD Integration Project that explores how existing HIV health system platforms could be used to address NCDs, particularly cardiovascular disease, cervical cancer, depression, and diabetes (NCDs that are more likely to cause health issues for people living with HIV).34
Funding
Currently, funding to specifically address NCDs in low- and middle-income countries is not designated by Congress, nor is such funding easily identifiable at the agency level. Where NCD funding is identifiable, it remains relatively small. For example: In 2012, NIH’s Fogarty International Center awarded $14 million to 15 research institutions to fund training in research areas related to NCDs in developing countries, and in recent years, it has made additional announcements of funding availability along similar lines.35 From FY 2002 through FY 2012, NIH and CDC awarded nearly $41 million to investigators to fund research related to tobacco’s use and impact globally.36 In 2014, USAID announced its intention to support, through partial credit loan guarantees offered by its Development Credit Authority, making $125 million in private financing available for manufacturers and distributors of clean cookstoves and cooking fuels.37 From 2008 through 2013, MCC provided about $42 million to address NCDs in Mongolia over the five-year life of this country’s MCC compact.38
Key Issues for the U.S.
Without significant efforts to address the key risk factors and underlying social determinants driving NCDs, the economic and social toll of burgeoning numbers of people affected by NCDs in developing countries will continue to grow. Many public health experts stress the importance of early intervention in efforts to reduce NCDs, as they generally develop over time and are more difficult – and costly – to address later. Some have called for dedicated U.S. government funding for NCDs, while others say there is a need to prioritize funding for existing global health programs during a time of constrained budgets, particularly in light of the current Administration’s proposal to significantly reduce global health funding.
Going forward, an overarching question is whether the current Administration will support global NCD efforts. Other opportunities and challenges facing policymakers include:
balancing the need to address a growing NCD problem with the need to finish the infectious diseases agenda (e.g., ending the HIV epidemic, eradicating polio);
deciding how the U.S. may best contribute to global NCD efforts (in light of its experience in addressing NCDs domestically);
supporting further research into the risk factors and drivers behind NCDs and accelerating research into and implementation of innovative solutions that address these risk factors and strengthen the capacity of health systems to respond to NCDs; and
addressing trade and intellectual property concerns in order to buttress continuing NCD research and development efforts while expanding the availability of and affordable access to NCD medicines, diagnostics, and treatments in developing countries.
IHME, The Global Burden of Disease: Generating Evidence, Guiding Policy, 2013. ↩︎
U.N., Report of the United Nations Conference on Sustainable Development (Rio de Janeiro, Brazil, 20–22 June 2012), A/CONF.216/16, 2012. ↩︎
Some NCDs may be caused by viral infections, but the diseases themselves are not infectious nor transmissible. Though they are sometimes referred to as “chronic diseases,” NCDs are not distinguished by their duration. WHO, “Noncommunicable diseases,” webpage, http://www.who.int/topics/noncommunicable_diseases/en/; WHO, “Noncommunicable diseases,” fact sheet, Jan. 2015; WHO, “Noncommunicable diseases,” fact sheet, June 2018. ↩︎
WHO, “Noncommunicable diseases,” fact sheet, June 2018. ↩︎
In 2015. WHO, “Noncommunicable diseases,” fact sheet, June 2017.; WHO, “Disease burden: WHO estimates for DALYs, 2000-2015,” Global Health Estimates 2015 Summary Tables, Dec. 2016; UN, “Political declaration of the High-level Meeting of the General Assembly on the Prevention and Control of Non-communicable Diseases,” A/66/L.1, Sept. 16, 2011. ↩︎
WHO, “Noncommunicable diseases,” fact sheet, June 2018. ↩︎
The 2008 WHO 2008-2013 action plan for the global strategy for the prevention and control of noncommunicable diseases : prevent and control cardiovascular diseases, cancers, chronic respiratory diseases and diabetes stated, “There are many other noncommunicable conditions of public-health importance. They include osteoporosis, renal diseases, oral diseases, genetic diseases, neurological diseases, and diseases causing blindness and deafness. Many of these conditions are the subjects of other WHO strategies, action plans and technical guidance and are therefore not considered directly by this plan. Similarly, mental health disorders are not included here despite the heavy burden of disease that they impose, as they do not share the same risk factors (other than the harmful use of alcohol), and because they require different intervention strategies.” Likewise, the 2013 WHO Global action plan for the prevention and control of NCDs, 2013-2020 acknowledged other NCDs of importance. ↩︎
WHO, “Noncommunicable diseases,” fact sheet, June 2018. ↩︎
In 2015. WHO, “Noncommunicable diseases,” fact sheet, June 2018. ↩︎
According to WHO, “In African nations, deaths from NCDs are projected to exceed the combined deaths of communicable and nutritional diseases and maternal and perinatal deaths as the most common causes of death by 2030;” see WHO, “Noncommunicable diseases,” fact sheet, March 2013. See also WHO, “Projections of mortality and causes of death, 2015 and 2030,” Global Health Estimates 2012 Summary Tables, July 2013. ↩︎
WHO, “Global Health Estimates 2016: Deaths by Cause, Age, Sex, by Country and by Region, 2000-2016” and “Global Health Estimates 2016: Deaths by Cause, Age and Sex, by World Bank Income Group, 2000-2015,” Global Health Estimates 2016 Summary Tables, April 2018; WHO, “Indicator: Prevalence of Tobacco Smoking in 2016,” World Health Statistics Visualizations Dashboard, http://apps.who.int/gho/data/node.sdg.3-a-viz?lang=en; WHO, World Health Statistics 2018, 2018; WHO, Global Health Observatory data repository http://apps.who.int/gho/data/view.main.1780?lang=en; WHO, Global Health Observatory data repository, http://apps.who.int/gho/data/view.main.WB2480A?lang=en. ↩︎
D.E. Bloom, et al., The Global Economic Burden of Noncommunicable Diseases, World Economic Forum/Harvard School of Public Health, Sept. 2011. ↩︎
U.N., “Political declaration of the High-level Meeting of the General Assembly on the Prevention and Control of Non-communicable Diseases,” A/66/L.1, Sept. 16, 2011. ↩︎
Robert Beaglehole, et al., “Priority actions for the non-communicable disease crisis,” The Lancet, April 6, 2011; WHO, Global action plan for the prevention and control of NCDs, 2013-2020, 2013; WHO, Global status report on noncommunicable diseases 2010, 2011; WHO, Global status report on noncommunicable diseases 2014, 2014. WHO, Noncommunicable Diseases Progress Monitor 2017, 2017. ↩︎
U.N., “Political declaration of the High-level Meeting of the General Assembly on the Prevention and Control of Non-communicable Diseases,” A/66/L.1, Sept. 16, 2011. ↩︎
The plan includes a comprehensive monitoring framework for prevention and control of NCDs that outlines nine voluntary global targets for 2025 and 25 indicators for monitoring progress toward them. WHO, Global action plan for the prevention and control of NCDs, 2013-2020, 2013. ↩︎
66th WHA, “Follow-up to the Political Declaration of the High-level Meeting of the General Assembly on the Prevention and Control of Non-communicable Diseases,” WHA66.10, May 27, 2013. ↩︎
Specifically, the 25% relative reduction in overall mortality from cardiovascular diseases, cancer, diabetes or chronic respiratory diseases concerns premature mortality from noncommunicable diseases between ages 30 and 70. 66th WHA, “Follow-up to the Political Declaration of the High-level Meeting of the General Assembly on the Prevention and Control of Non-communicable Diseases,” WHA66.10, May 27, 2013. ↩︎
Adopted by the World Health Assembly in 2003 and entered into force in 2005, the FCTC is the first international treaty negotiated under the auspices of WHO and addresses a number of areas related to tobacco, including “protection of public health policies with respect to tobacco control from the interests of the tobacco industry.” ↩︎
WHO, Global strategy to reduce harmful use of alcohol, 2010. ↩︎
WHO, Global strategy on diet, physical inactivity, and health, 2004. ↩︎
Mental health disorders are themselves NCDs, but they are addressed separately by WHO through WHO, Mental health action plan, 2013-2020, 2013. ↩︎
The risk-factor and other related targets of the SDGs include: Strengthen the prevention and treatment of substance abuse, including narcotic drug abuse and harmful use of alcohol; By 2030, substantially reduce the number of deaths and illnesses from hazardous chemicals and air, water and soil pollution and contamination; Strengthen the implementation of the World Health Organization Framework Convention on Tobacco Control in all countries, as appropriate; and Support the research and development of vaccines and medicines for the communicable and non-communicable diseases that primarily affect developing countries, provide access to affordable essential medicines and vaccines, in accordance with the Doha Declaration on the TRIPS Agreement and Public Health, which affirms the right of developing countries to use to the full the provisions in the Agreement on Trade-Related Aspects of Intellectual Property Rights regarding flexibilities to protect public health, and, in particular, provide access to medicines for all. UN, Transforming our world: the 2030 Agenda for Sustainable Development, 2015. ↩︎
InterAction, “Non-Communicable Diseases,” Global Health Briefing Book, 2013. ↩︎
HHS/OGA, “What We Do,” webpage, http://www.hhs.gov/about/agencies/oga/about-oga/what-we-do/index.html. The Global Strategy of the U.S. Department of Health and Human Services (2016) includes Objective 6, which aims to “Address the Changing Global Patterns of Death, Illness, and Impairment Related to Aging Populations.” ↩︎
For example, the Pink Ribbon/Red Ribbon partnership brings the U.S. government’s global HIV/AIDS platform together with partners to increase the availability of cervical cancer screening and treatment, particularly for HIV-positive women who are at high risk, and promote breast cancer education programs in sub-Saharan African and Latin American countries. In addition, the Global Alliance for Clean Cookstoves – which is now hosted by the U.N. Foundation – promotes the adoption of clean, efficient stoves and fuels in 100 million homes by 2020. State Department, “Pink Ribbon Red Ribbon Overview,” fact sheet, Sept. 2011; OGAC, Pink Ribbon/Red Ribbon webpage, www.pepfar.gov/partnerships/ppp/prrr/; State Department, “Global Alliance for Clean Cookstoves,” webpage, https://2009-2017.state.gov/s/partnerships/cleancookstoves/index.htm; Global Alliance for Clean Cookstoves, “About,” webpage, http://cleancookstoves.org/about/. ↩︎
Ariel Pablos-Mendez, “Delivering Quality, Affordable and Equitable Care to Improve Health,” USAID Impact Blog, 2011. ↩︎
FIC, “$14M awarded for chronic disease research training through NCD-Lifespan program,” Global Health Matters, newsletter, Sept./Oct. 2012. For example, it currently has a funding announcement for the same program, the NCDs and Injury Across the Lifespan program, at FIC, “Global Noncommunicable Diseases and Injury Research,” webpage, https://www.fic.nih.gov/Programs/Pages/global-ncds-research.aspx. ↩︎
FIC, et al., International Tobacco and Health Research and Capacity Building Program: Program Review 2002-2012, 2013. ↩︎
Individuals born in the U.S. territories are U.S. citizens or nationals, but the territories differ from the states on key demographic, economic, and health status indicators. Most of the territories have a larger share of people living in poverty and longstanding fiscal challenges. Recent hurricanes, typhoons, and the North Korean missile crisis exacerbated pre-existing fiscal issues by damaging infrastructure and limiting tourism. In addition, a larger share of residents in the territories report that they are in fair or poor health than in the states. However, Medicaid, the program that serves low-income and vulnerable individuals, operates differently in the territories. The most fundamental difference is that federal funding for Medicaid in the territories is subject to a statutory cap and a fixed federal matching rate, unlike in the states, where federal Medicaid funding is not capped, and the federal share varies based on states’ per capita income. This brief draws on a survey of and interviews with territory Medicaid officials, as well as other research, to examine key issues and trends in their Medicaid programs.1 Key findings include the following:
The expiration in September 2019 of most of the temporary federal Medicaid funds provided for all territories through the Affordable Care Act (ACA) is expected to result in what some territory officials describe as a fiscal cliff. All of the territories have increasingly relied on the ACA funds to finance their Medicaid programs, and Puerto Rico and the U.S. Virgin Islands have also used hurricane relief funds that are set to expire at the end of September 2019.
Medicaid enrollment trends have been relatively stable in the territories, except in Puerto Rico and the U.S. Virgin Islands, where enrollment increases followed recent hurricanes, although future trends are somewhat uncertain.
Medicaid benefits and delivery systems vary in the territories. Only Guam offers long-term services, and Guam, American Samoa, and the Northern Mariana Islands provide nearly all Medicaid services through one public hospital. Puerto Rico is the only territory to operate a managed care delivery system, with new reforms implemented in November 2018.
The territories have struggled with provider shortages, which are often tied to outmigration and poor infrastructure and are most prominent for specialty care and mental health services.
Looking ahead, long-term Medicaid financing reforms such as increased federal matching rates, increased spending caps, or elimination of the caps could help the territories meet the health care needs of their Medicaid populations. Conversely, the expiration of temporary Medicaid funds without new resources to address the resulting fiscal cliff could have negative consequences for Medicaid coverage and services.
Issue Brief
Introduction
Individuals born in the U.S. territories are U.S. citizens or nationals, but Medicaid, like other public programs, operates differently in the territories than it does in the states. This brief examines key issues and trends in the U.S. territories’ Medicaid programs. The findings are drawn from a budget survey and interviews with Medicaid officials in four of the five U.S. territories — Puerto Rico, the U.S. Virgin Islands (USVI), Guam, and American Samoa. The survey and interviews were conducted by the Kaiser Family Foundation (KFF) and Health Management Associates (HMA) in July and August 2018.2 Due to wide variation in the structure and administration of the territories’ Medicaid programs, this brief does not provide a comprehensive overview of each territory’s program, but instead focuses on major issues and changes from fiscal years 2017 to 2019. Information was also drawn from other Kaiser Family Foundation briefs examining the impact of 2017 Hurricanes Irma and Maria on Puerto Rico and USVI. All territories but Puerto Rico follow the federal fiscal year, which begins on October 1, while Puerto Rico’s fiscal year begins July 1. Key findings from the surveys and interviews are included in the following areas: Medicaid financing, eligibility and enrollment, benefits, and provider access and delivery systems.
Background
The territories differ from the states on key demographic, economic and health status indicators. The population of the U.S territories ranges from approximately 51,000 people in American Samoa to nearly 3.3 million people in Puerto Rico.3 Recent data for Puerto Rico show a poverty rate 31 percentage points higher (42%) than that of the states (11%), and much older data for the other four territories show that between 22% and 57% of residents were living in poverty.4 In addition, territory residents often face heightened health challenges. For example, self-reported health is significantly more likely to be fair or poor in Guam (22%) and Puerto Rico (37%) than in the 50 states and D.C. (18%).5 Individuals in Guam and USVI also report needing to see a doctor in the previous 12 months but being unable to do so because of cost at significantly higher rates than individuals in the 50 states and D.C. While 13% of individuals report this access challenge in the 50 states and D.C., the rate jumps to 21% in Guam and 22% in USVI.6 Finally, the rates of Medicaid or CHIP coverage in the territories are equal to or higher than those in United States overall (21%) (see Table 1).
Table 1: Medicaid and CHIP Enrollment in the U.S. Territories, July 2016
Territory
Total Population Size
Number Covered by Medicaid and CHIP
Share Covered by Medicaid or CHIP
American Samoa
51,500
40,517
79%
Guam
167,400
35,798
21%
Northern Mariana Islands
52,300
17,000
33%
Puerto Rico
3,351,800
1,370,437
41%
U.S. Virgin Islands
107,300
23,177
22%
NOTES: Number of enrollees for American Samoa are estimates of the portion of the population below 200% FPL, the population which Medicaid pays for health care services. Enrollment figures for Puerto Rico include 89,372 children enrolled in CHIP as reported by Puerto Rico for July 2016.SOURCES: MACPAC, Medicaid and CHIP in the Territories, (Washington, DC: MACPAC, October 2017), https://www.macpac.gov/publication/medicaid-and-chip-in-the-territories/. Kaiser Family Foundation analysis of population estimates from The World Factbook 2017. Washington, DC: Central Intelligence Agency, 2017, https://www.cia.gov/library/publications/the-world-factbook/index.html.
Many of the territories face longstanding fiscal challenges. For example, in response to the economic crisis in Puerto Rico, Congress passed the Puerto Rico Oversight, Management and Economic Stability Act (PROMESA) in June 2016 to allow Puerto Rico to restructure its debts and manage its revenues and expenditures. PROMESA created the Financial Oversight and Management Board (FOMB), which in part requires Puerto Rico’s government to submit a fiscal plan that gains the FOMB’s approval.7 USVI has also faced financial challenges, as its economy declined by over 30% between 2008 and 2016, accompanied by population loss and job loss in certain industries.8 American Samoa reported that its economy is vulnerable and locally unsustainable, as federal grants comprise three quarters of the territory’s budget.
Recent natural disasters and other external factors exacerbated longstanding economic challenges in the territories. The 2017 hurricanes and their aftermath worsened the existing fiscal challenges in Puerto Rico and USVI by exacerbating outmigration of professionals and job loss; destroying homes, schools, and other buildings; and reducing tourism. While navigating its hurricane recovery and slow rebuilding processes, Puerto Rico has also taken steps to comply with the FOMB-approved fiscal plan that calls for spending cuts in the territory. In Guam, the North Korean missile crisis in 2017 and 2018 affected the territory’s tourism economy. Guam also suffered from Typhoon Mangkut in September 2018, and Super Typhoon Yutu tore through the Northern Mariana Islands (NMI) in October 2018, with both storms bringing widespread destruction.9
Context and Findings
Medicaid Financing
Unlike in the 50 states and D.C., annual federal funding for Medicaid in the territories is subject to a statutory cap and fixed matching rate.The territories’ federal matching rate (known as the federal medical assistance percentage, or FMAP) is fixed in statute, unlike the statutory formula for states, which is uncapped and adjusted annually based on a state’s relative per capita income. The ACA increased the traditional territory FMAP from 50% to 55% (plus 2.2 percentage points for 2014 and 2015) and provided the territories with a higher matching rate for non-disabled adults without children (87% in 2017). In contrast, Mississippi – a state with per capita income of $22,500 compared to Puerto Rico’s $12,08110 – receives a traditional FMAP of 74.63% in FFY 2019. Notwithstanding temporary relief funds discussed below, once a territory exhausts its capped federal funds, it no longer receives federal financial support for its Medicaid program during that fiscal year, placing additional pressure on territory resources if Medicaid spending continues beyond the federal cap. In this scenario, the effective FMAP rate is lower than the 55% set in statute.
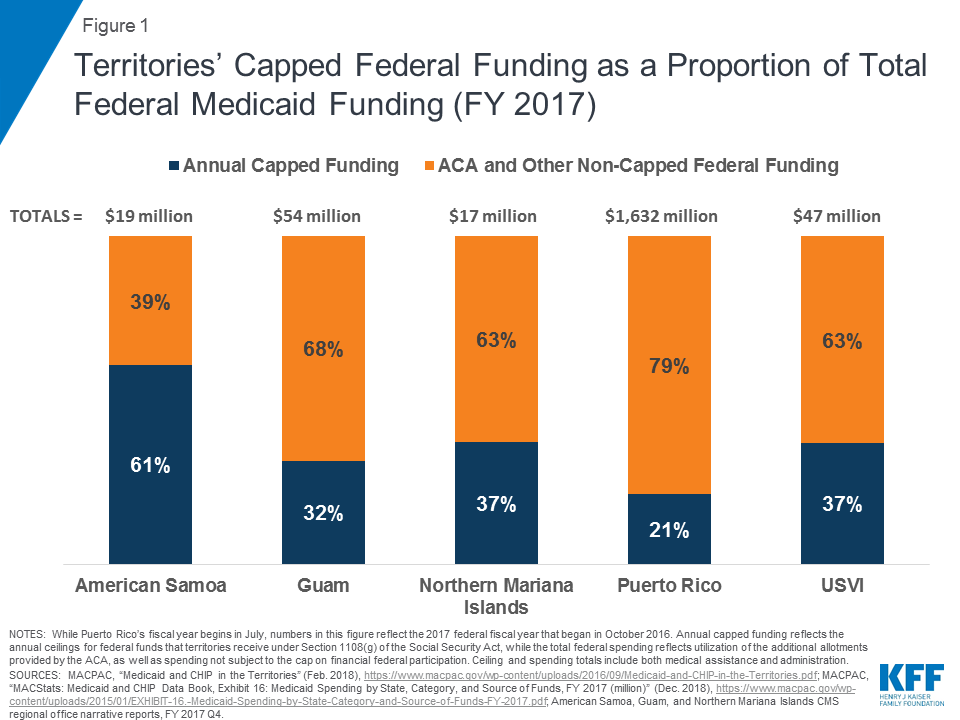
The federal government made a total of $7.3 billion in additional funds available across all five territories under the ACA, but most of these funds expire at the end of September 2019. The $7.3 billion consists of a $6.3 billion allotment available between July 2011 and September 2019 and another $1 billion in funds, provided in lieu of the territories creating their own health insurance exchanges, which expire at the end of December 2019.11 Of this $7.3 billion, Puerto Rico received the large majority ($6.3 billion). While Puerto Rico is the only territory that expects to exhaust its ACA funds before they expire, all territories have consistently relied on ACA dollars to fund their Medicaid programs beyond the federal caps (see Table 2). Specifically, federal funds from the caps represent 21 percent to 59 percent of annual federal Medicaid spending in the territories (see Figure 1). American Samoa described the impending 2019 expiration of the temporary ACA funds as “devastating,” while USVI anticipated a “giant” fiscal cliff after their expiration.
Table 2: Medicaid Funding and Spending in the U.S. Territories, FY 2017 (millions)
NOTES: While Puerto Rico’s fiscal year begins in July, numbers in this table reflect the 2017 federal fiscal year that began in October 2016. Federal Medicaid ceilings reflect the annual ceilings for federal funds that territories receive under Section 1108(g) of the Social Security Act, while the actual federal spending reflects utilization of the additional allotments provided by the ACA, as well as spending not subject to the cap on financial federal participation. Ceiling and spending totals include both medical assistance and administration.SOURCES: MACPAC, “Medicaid and CHIP in the Territories” (Feb. 2018), https://www.macpac.gov/wp-content/uploads/2016/09/Medicaid-and-CHIP-in-the-Territories.pdf; MACPAC, “MACStats: Medicaid and CHIP Data Book, Exhibit 16: Medicaid Spending by State, Category, and Source of Funds, FY 2017 (million)” (Dec. 2018), https://www.macpac.gov/wp-content/uploads/2015/01/EXHIBIT-16.-Medicaid-Spending-by-State-Category-and-Source-of-Funds-FY-2017.pdf; American Samoa, Guam, and Northern Mariana Islands CMS regional office narrative reports, FY 2017 Q4.
Figure 1: Territories’ Capped Federal Funding as a Proportion of Total Federal Medicaid Funding (FY 2017)
Puerto Rico and USVI officials worry about the expiration of temporary Medicaid relief funds in September 2019. After Hurricanes Irma and Maria hit Puerto Rico and the USVI in September 2017, Congress included additional funding for these territories in the Bipartisan Budget Act (BBA) of 2018: $4.8 billion for Puerto Rico ($1.2 billion of which were conditional funds) and $142.5 million for USVI ($35.6 million of which were conditional). These relief funds do not require a local/territory match and will expire at the end of September 2019. Because of the 100% FMAP for these funds, both Puerto Rico and USVI saw their non-federal shares of Medicaid spending drastically decline in FY 2018 and FY 2019, but they anticipate a fiscal cliff after both the ACA and BBA funds expire in September 2019 that will require large increases in territory spending to make up for the loss of federal funds. As noted in a separate report, one Puerto Rico official said that, without additional support, the budget pressures could lead the uninsured population to increase from about 500,000 to over 1 million people.
The territories reported that paying for off-island services and enrollment increases were additional key upward pressures on Medicaid spending. Two territories — American Samoa and USVI — reported that off-island service referrals were significant factors in expenditure growth, driven by hurricane damage to the health care infrastructure in USVI and by the general lack of certain specialty services, such as knee replacement surgery, in American Samoa. Other current or expected expenditure drivers cited included enrollment increases in USVI, planned coverage of durable medical equipment in American Samoa, and pharmacy costs and reimbursement of a new private hospital in Guam.
Guam and Puerto Rico reported factors that could exert downward pressure on Medicaid spending. Guam reported that an increase in available on-island specialty services was resulting in fewer off-island transfers and helping to mitigate costs. In Puerto Rico, the FOMB finalized a fiscal plan in October 2018 that called for significant spending cuts.13 Under the plan, education and health care face the sharpest budget cuts, which could result in out-year reductions in Medicaid managed care spending. These cuts are designed to mitigate the increase in local funds after ACA and BBA funds expire, as Puerto Rico has traditionally expended beyond its annual federal cap to finance its health care system. In addition, the effects of Puerto Rico’s broader outmigration on Medicaid enrollment are unclear.
Eligibility and Enrollment
The territories use different methods to set Medicaid eligibility levels. Guam, Puerto Rico, and USVI determine eligibility according to local poverty levels, while American Samoa does not determine eligibility on an individual basis. Instead, American Samoa receives federal Medicaid funds in proportion to the percentage of the population that would have incomes below 200% FPL and presumes eligibility for this population. NMI, which is the only territory that is eligible for Supplemental Security Income (SSI), ties eligibility for Medicaid to the income and resource requirements for SSI. Through statutory or waiver authority, all five territories are also exempt from covering certain mandatory Medicaid coverage groups, including poverty-related children and pregnant women and qualified Medicare beneficiaries.14 However, three territories have expanded Medicaid eligibility, with Guam, Puerto Rico, and USVI electing to cover the ACA’s new adult group with incomes up to 133% of the territories’ local poverty levels.
The 2017 hurricanes in Puerto Rico and USVI affected eligibility and enrollment trends in the two territories. Compared to one year earlier, Puerto Rico and USVI reported that their enrollment had increased in FY 2018. Puerto Rico reported that, after increasing in FY 2018 due to automatic one-year eligibility renewals implemented after the hurricanes, the territory expects the expiration of these automatic renewals and the ongoing outmigration to exert downward pressure on enrollment in FY 2019. The effects of Puerto Rico’s broader outmigration trends on Medicaid enrollment and its case mix are still unclear. Conversely, USVI reported that it expected enrollment to increase due to hurricane-related impacts and the ongoing phase-in of expansion populations and outreach to eligible individuals.
Other territories reported stable enrollment trends. Guam reported that its enrollment was stable and that it expected enrollment to remain the same in 2019 as well even with some upward enrollment pressure resulting from its previous ACA childless adult expansion and from migration related to the Compact of Free Association (COFA), an international agreement that applies to residents of the Marshall Islands, Micronesia, and Palau.15 American Samoa has a unique form of presumptive eligibility but noted that the size of the presumptively eligible population has remained flat or decreased due to outmigration over the past two to three years.
Benefits
Benefit coverage varies across the territories and in comparison to the states. While Guam, Puerto Rico, and USVI are required to cover all mandatory Medicaid benefits, only Guam does so.16 American Samoa and NMI operate their Medicaid programs under Section 1902(j) waivers, which allow the federal government to waive any Medicaid program requirements except for the statutory FMAP and ceiling on federal funds. Under these waivers, American Samoa and NMI are not required to cover all mandatory benefits. All territories, however, cover some optional benefits, including prescription drugs and dental services.17
Some officials cited long-term services and supports (LTSS), non-emergency medical transportation (NEMT), coverage of hepatitis C drugs, and durable medical equipment as Medicaid benefits that the territory was seeking to add. Guam was the only territory to report coverage of LTSS, although USVI reported that it was currently working internally and with stakeholders to implement LTSS coverage in the future, including implementation of a Health Home program for the aged. Puerto Rico reported that it had no plans in place to add LTSS coverage and that its benefit expansion priorities, when resources become available, are NEMT and coverage of hepatitis C antivirals. American Samoa reported that it had implemented two recent benefit expansions: coverage of off-island services through direct reimbursement as of FY 2018, and coverage of durable medical equipment as of FY 2019.18
Provider Access and Delivery Systems
Medicaid in the territories helps to finance public and private hospitals and clinics, some of which face resource challenges. While both private and public hospitals operate in Puerto Rico, the only two hospitals in USVI are public; there are no private acute care facilities in USVI.19 American Samoa, Guam, and NMI provide nearly all of their Medicaid services through one public hospital in each territory, although a private hospital that accepts Medicaid patients opened in Guam in 2015.20,21 Due to staffing and facility shortcomings, the hospitals in American Samoa, Guam, NMI, and USVI have struggled to maintain compliance with CMS standards for Medicare certification.22,23,24 All territories also operate federally qualified health centers (FQHCs) and community health centers.
The 2017 hurricanes had a significant impact on hospitals and clinics in Puerto Rico and USVI. Both Puerto Rico and USVI reported that hurricane damage has affected the availability of hospital services. For example, Puerto Rico reported that all hospitals are now up and running, but many have closed floors and are waiting for pending insurance claims, delaying repairs. Puerto Rico also reported that a decrease in births in the territory had led some hospitals to close their obstetrical units. In USVI, one of the territory’s two hospitals suffered extensive damage and still did not have an operating suite or the ability to do CAT scans at the time of the survey. While the other territory hospital was providing surgery, emergency, and ancillary services as of July 2018, its cancer center remained closed due to hurricane damage, and it was still waiting for complete federal assessments for determination of repair or rebuilding.
Most territories have struggled with provider shortages. Prior to the hurricanes, Puerto Rico was already experiencing ongoing provider outmigration and shortages,25 which the territory attributed to lower reimbursement rates compared to the states. As of January 2017, 55 of Puerto Rico’s 78 municipalities contained at least one federally designated Health Professional Shortage Area (HPSA).26 Similarly, USVI was experiencing a shortage of health providers and services prior to the hurricanes, as the federal government had previously designated the entire territory a HPSA.27 The hurricanes further exacerbated the provider access challenges in Puerto Rico and USVI, with increased rates of provider outmigration. In American Samoa, Guam, and NMI, the public hospitals that provide most of their Medicaid services have historically faced staff shortages due to factors such as low staff salaries and poor infrastructure tied to high rates of uncompensated care and other economic forces.28,29 These provider shortages and the remote island geography of the territories in the South Pacific can require patients to travel long distances to receive medical services that are not available on-island. For example, residents in these three territories often travel thousands of miles to Hawaii, the Philippines, or New Zealand for care.
Some territories cite challenges with provider supply in certain services or specialties. For example, both USVI and American Samoa reported shortages of behavioral health (BH) providers. USVI reported that BH services were at the top of the list of health care needs and a “huge” challenge that has persisted for years. The need for BH services among USVI residents has only increased since the 2017 hurricanes. USVI noted shortages of various additional specialties. Puerto Rico reported general problems with provider availability, driven by the outmigration of providers to the states, a longstanding challenge that worsened after the 2017 hurricanes. Like USVI, Puerto Rico also faces a mental health crisis among its residents after the hurricanes. None of the territories cited access to primary care as an area of concern.
Puerto Rico and USVI reported updates about delivery system reforms. Among the territories, only Puerto Rico operates its Medicaid program through managed care organizations (MCOs). As part of Puerto Rico’s certified fiscal plan, the territory has shifted its managed care system from its previous eight regions with one plan available per region to one territory-wide region in which plans compete for providers and enrollees. In the midst of its recovery from the 2017 hurricanes, Puerto Rico continued work to launch the new system, and enrollment in the new plans began on November 1, 2018. The changes are intended to improve access by enabling enrollees to access medical services throughout the territory. Under the new contracts, capitation rates are risk-adjusted, providing higher payments for enrollees with high needs. The MCOs, in turn, are required to offer new prevention and care programs for enrollees with chronic conditions and high needs, such as cancer, diabetes, end-stage renal disease, chronic obstructive pulmonary disease (COPD) with asthma, hypertension, severe heart failure, and severe mental illness.30 In addition, USVI reported that it had received a Care Management grant from CMS and that various workgroups had formed to support work on this topic. The territory is also actively pursuing improvements to its behavioral health care system, including adding new providers, expanding facilities, and supporting a territory-wide Behavioral Health Planning and Advisory Council to oversee the changes.
Looking Ahead
While additional information and research are needed to better understand how Medicaid operates in the territories, it is clear that the federal financing caps present a challenge for all territories. These underlying financing issues will reemerge and may worsen when temporary federal Medicaid funds tied to the ACA and disaster relief expire in September and December 2019. Puerto Rico and USVI face the additional challenge of losing the 100% FMAP tied to the relief funds. Officials in the territories cite the difficulties of both managing their programs within these federal caps and raising the local 45% share to access those funds. These financing issues are at the core of ongoing challenges related to eligibility, benefit coverage, adequate provider access, and delivery system reforms. Financing changes in the form of increased federal matching rates, higher spending caps, or an elimination of the spending caps entirely could help catalyze changes and advances in these and other areas as the territories strategize to meet the health care needs of their Medicaid populations. On the other hand, expiration of temporary Medicaid funds without new resources to address the resulting fiscal cliff could have negative consequences for Medicaid coverage and services.
This report does not include information on the Northern Mariana Islands Medicaid program, as that territory did not complete the survey. This brief accompanies the 18th annual budget survey of Medicaid officials in all 50 states and the District of Columbia, which examines trends in Medicaid programs in all states across the country. The territories received a separate survey tailored to them, but most territories were not able to complete all of the questions. ↩︎
50 states and DC and Puerto Rico: Kaiser Family Foundation analysis of 2017 American Community Survey (ACS), 1-Year Estimates. For other U.S. territories: U.S. Census Bureau, 2010 Census of the Islands Areas, Tables DP-2 and DP-3, using American FactFinder, http://factfinder.census.gov. ↩︎
Kaiser Family Foundation analysis of the 2016 (USVI) and 2017 (50 States and D.C., Guam, Puerto Rico) Behavioral Risk Factor Surveillance System (BRFSS). Significance testing for USVI BRFSS data from 2016 was completed using 2016 BRFSS data for the 50 states and D.C., while significance testing for Guam and Puerto Rico used 2017 BRFSS data. BRFSS data from 2016 and 2017 were not available for American Samoa and Northern Mariana Islands. ↩︎
114th Congress of the United States of America. Public Law 114-187. “Puerto Rico Oversight, Management, and Economic Stability Act [PROMESA]” (Washington, DC: U.S. Congress, June 30, 2016), https://www.congress.gov/114/plaws/publ187/PLAW-114publ187.pdf. ↩︎
Under Sections 2005 and 1323 of the ACA. Does not reflect any utilization of these funds by the territories. Does not include the additional $295.9 million in funds added to the amount Puerto Rico received under the Consolidated Appropriations Act of 2017 or the funds provided to Puerto Rico and USVI by the Balanced Budget Act of 2018. ↩︎
Under the COFA, in exchange for exclusive U.S. defensive use and other operating rights in the islands, residents of the Marshall Islands, Micronesia, and Palau are able to move freely throughout the United States and its territories, including Guam, with a legal non-immigrant status. While COFA migrants in Guam are generally not eligible for Medicaid, the territory reported that COFA children will become eligible. ↩︎
Assessing Current Conditions and Challenges at the Lyndon B. Johnson Tropical Medical Center in American Samoa: Oversight Hearing before the Subcommittee on Indian, Insular, and Alaska Native Affairs; Committee on Natural Resources, U.S. House of Representatives; 115th Congress of the United States of America (Washington, DC: July 25, 2017), https://www.govinfo.gov/content/pkg/CHRG-115hhrg26408/html/CHRG-115hhrg26408.htm. ↩︎
Assessing Current Conditions and Challenges at the Lyndon B. Johnson Tropical Medical Center in American Samoa: Oversight Hearing before the Subcommittee on Indian, Insular, and Alaska Native Affairs; Committee on Natural Resources, U.S. House of Representatives; 115th Congress of the United States of America (Washington, DC: July 25, 2017), https://www.govinfo.gov/content/pkg/CHRG-115hhrg26408/html/CHRG-115hhrg26408.htm. ↩︎
In the past, gaps in the public insurance system and lack of access to affordable private coverage left millions without health insurance, and the number of uninsured Americans grew over time, particularly during economic downturns. By 2013, the year before the major coverage provisions of the Affordable Care Act (ACA) went into effect, more than 44 million nonelderly individuals lacked coverage.1
Under the ACA, as of 2014, Medicaid coverage expanded to nearly all adults with incomes at or below 138% of poverty in states that have adopted the expansion, and tax credits are available for people with incomes up to 400% of poverty who purchase coverage through a health insurance marketplace. Millions of people enrolled in ACA coverage, and the uninsured rate dropped to a historic low by 2016. Coverage gains were particularly large among low-income adults in states that expanded Medicaid.
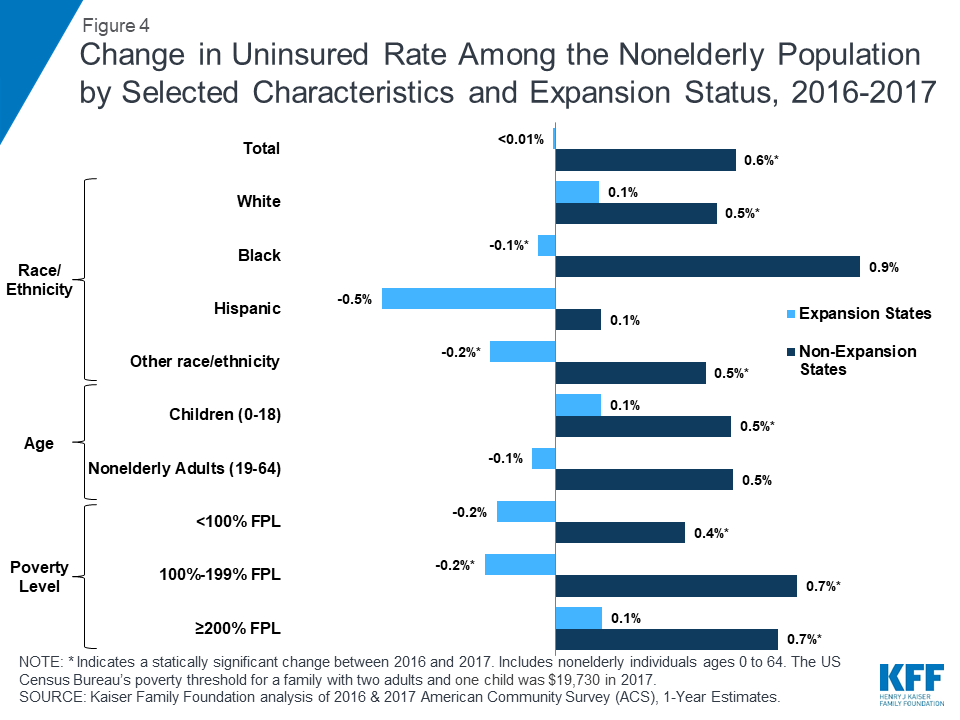
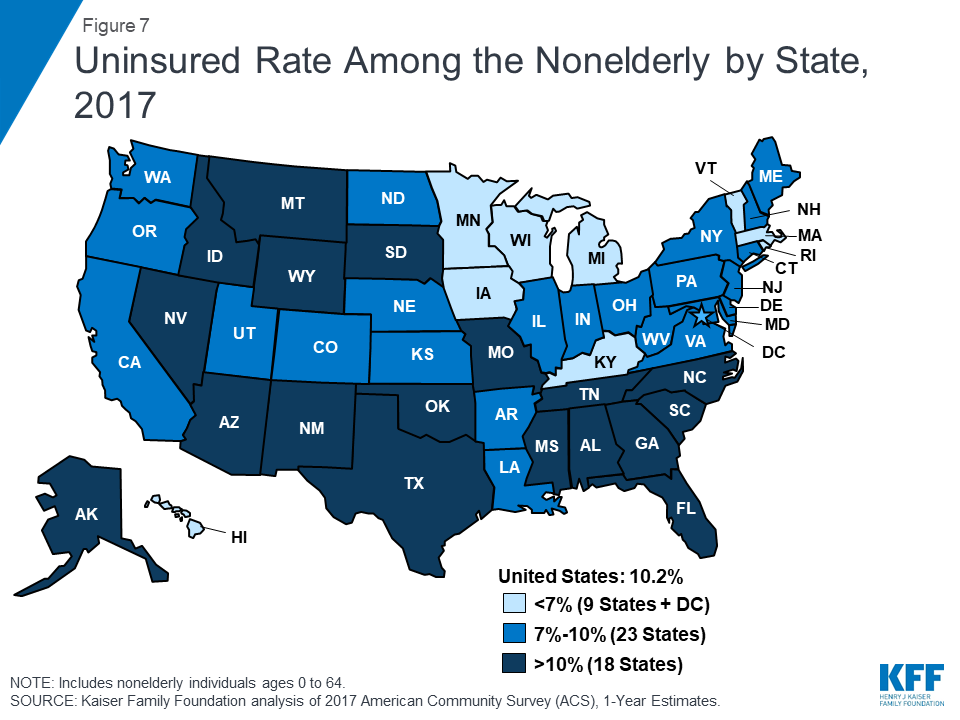
Despite large gains in health coverage, some people continued to lack coverage, and the ACA remained the subject of political debate. Attempts to repeal and replace the ACA stalled in summer 2017, but there have been several changes to implementation of the ACA under the Trump Administration that affect coverage. In 2017, the number of uninsured rose for the first time since implementation of the ACA to 27.4 million.2 Those most at risk of being uninsured include low-income individuals, adults, and people of color. The cost of coverage continues to be the most commonly cited barrier to coverage.3
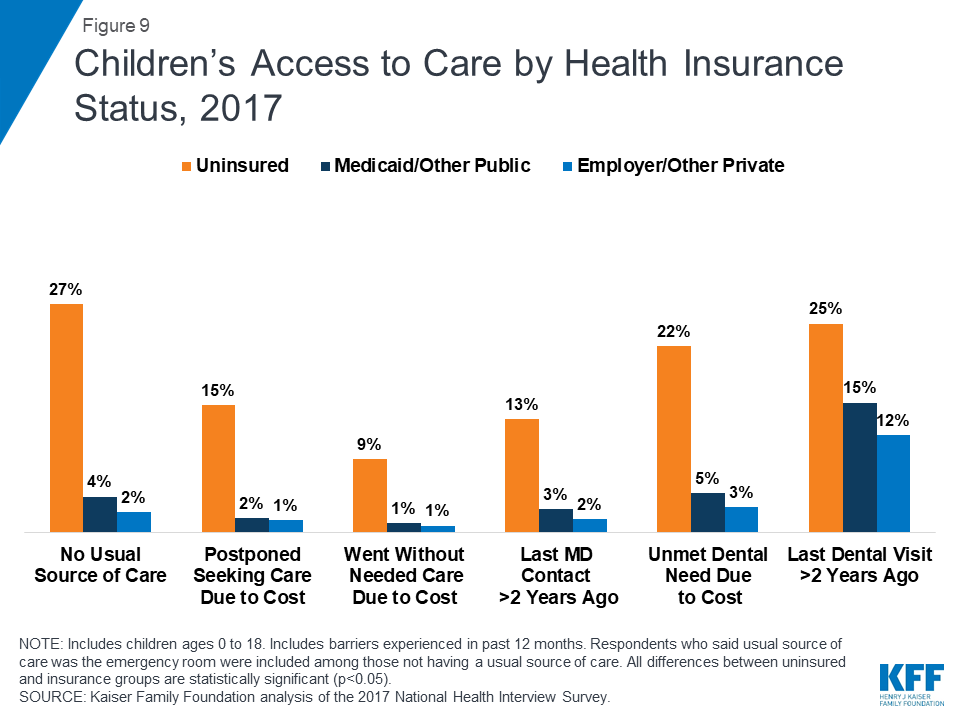
Health insurance makes a difference in whether and when people get necessary medical care, where they get their care, and ultimately, how healthy they are. Uninsured people are far more likely than those with insurance to postpone health care or forgo it altogether. The consequences can be severe, particularly when preventable conditions or chronic diseases go undetected. While the safety net of public hospitals, community clinics and health centers, and local providers provides a crucial health care source for uninsured people, it does not close the access gap for the uninsured.
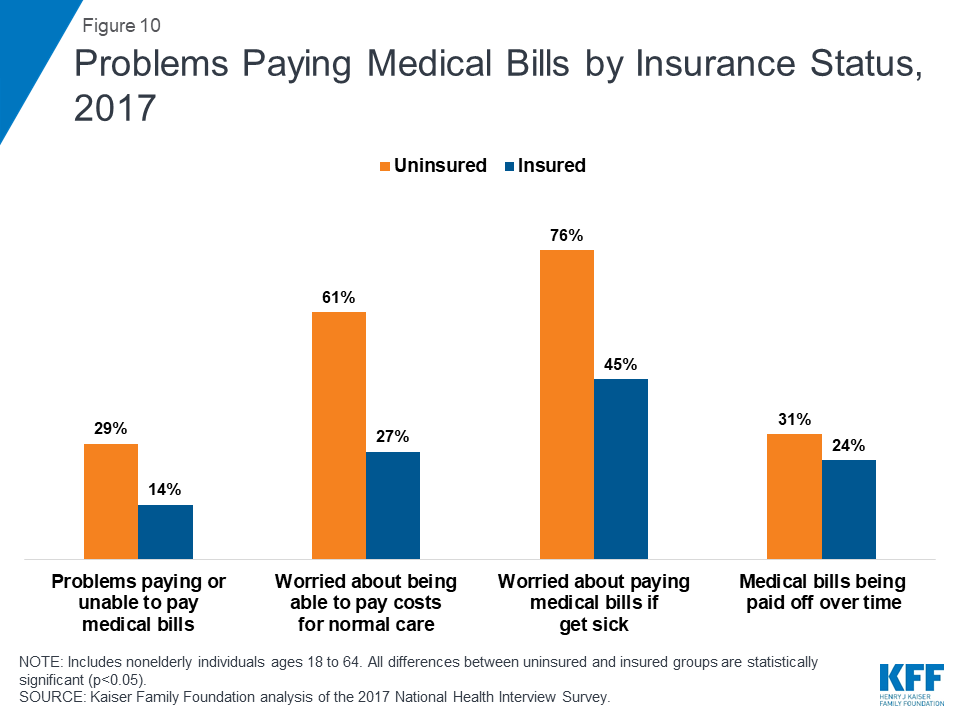
For many uninsured people, the costs of health insurance and medical care are weighed against equally essential needs, like housing, food, and transportation to work, and many uninsured adults report financial stress beyond health care.4 When uninsured people use health care, they may be charged for the full cost of that care (versus insurers, who negotiate discounts) and often face difficulty paying medical bills. Providers absorb some of the cost of care for the uninsured, and while uncompensated care funds cover some of those costs, these funds do not fully offset the cost of care for the uninsured.
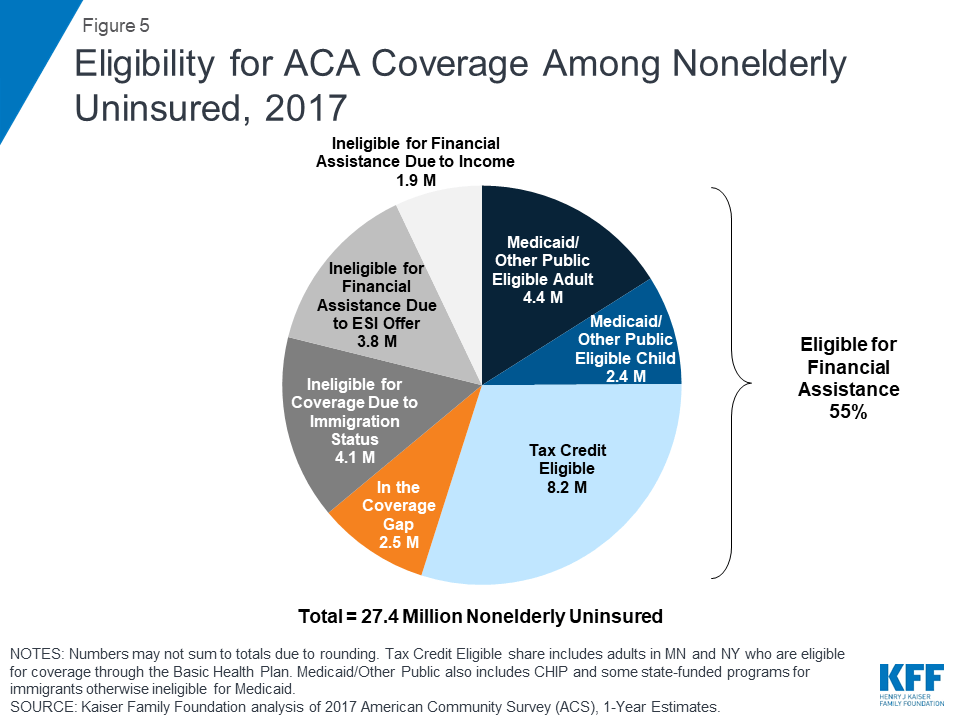
Under current law, nearly half (45%) of the remaining uninsured are outside the reach of the ACA either because their state did not expand Medicaid, they are subject to immigrant eligibility restrictions, or their income makes them ineligible for financial assistance.5 The remainder are eligible for assistance under the law but may still struggle with affordability and knowledge of options. Ongoing efforts to further alter the ACA or to make receipt of Medicaid more restrictive may further erode coverage gains seen under the ACA. On the other hand, state action to take up the ACA Medicaid expansion could make more people eligible for affordable coverage. The outcome of current debate over health coverage policy in the nation and the states has substantial implications for people’s coverage, access, and overall health and well-being.
Report: Introduction
The Affordable Care Act (ACA) led to historic gains in health insurance coverage. The ACA builds on the foundation of employer-based coverage and fills gaps in insurance availability and affordability by expanding Medicaid for adults with incomes at or below 138% of the federal poverty level ($16,753 per year for an individual in 2018)6 and providing premium tax credits to make private insurance in the individual market more affordable for many with incomes between 100-400% of poverty (between $12,140 and $48,560 per year for an individual in 2018). Most of the ACA’s major coverage provisions went into effect in 2014, and millions of people have gained coverage under the law. Despite historic coverage gains, millions of people continue to lack coverage, and the ACA remained the subject of political debate. Under the Trump Administration, several changes to ACA implementation have altered the availability of coverage or likelihood that people will sign up for coverage. In 2017, after years of decreasing uninsured rates, the US saw coverage gains stall or reverse for some groups. Lack of coverage reflects the fact that Medicaid eligibility for adults remains limited in states that have not adopted the expansion, some people remain ineligible for financial assistance for private coverage, and some still find coverage unaffordable even with financial assistance. Furthermore, ongoing efforts to alter the ACA or limit Medicaid coverage for some groups may have caused confusion or fear among some people and led them to drop or forgo coverage. These changes pose a challenge to further reducing the number of uninsured and may further threaten coverage gains seen in recent years.
The gaps in our health insurance system affect people of all ages, races and ethnicities; however, those with lower incomes face the greatest risk of being uninsured. Being uninsured affects people’s ability to access needed medical care and their financial security. As a result, uninsured people are less likely to receive preventive care and are more likely to be hospitalized for conditions that could have been prevented.7 The financial impact can also be severe. Uninsured families struggle financially to meet basic needs, and medical bills can quickly lead to medical debt.
The Uninsured and the ACA: A Primer provides information on how insurance has changed under the ACA, how many people remain uninsured, who they are, and why they lack health coverage. It also summarizes what we know about the impact that a lack of insurance can have on health outcomes and personal finances and the difference health insurance can make in people’s lives.
Report: How Have Health Insurance Coverage Options And Availability Changed Under The Aca?
In the past, gaps in the public insurance system and lack of access to affordable private coverage left millions without health insurance. The ACA filled in many of these gaps and provided new coverage options. Under the ACA, as of 2014, Medicaid coverage has been expanded to nearly all adults with incomes at or below 138% of poverty in states that have adopted the expansion, and tax credits are available for people with incomes up to 400% of poverty who purchase coverage through a health insurance marketplace. These new coverage options have increased access to health insurance and health care for millions, but recent actions may affect coverage options and people’s likelihood of signing up for or retaining ACA coverage.
ACA Coverage Provisions
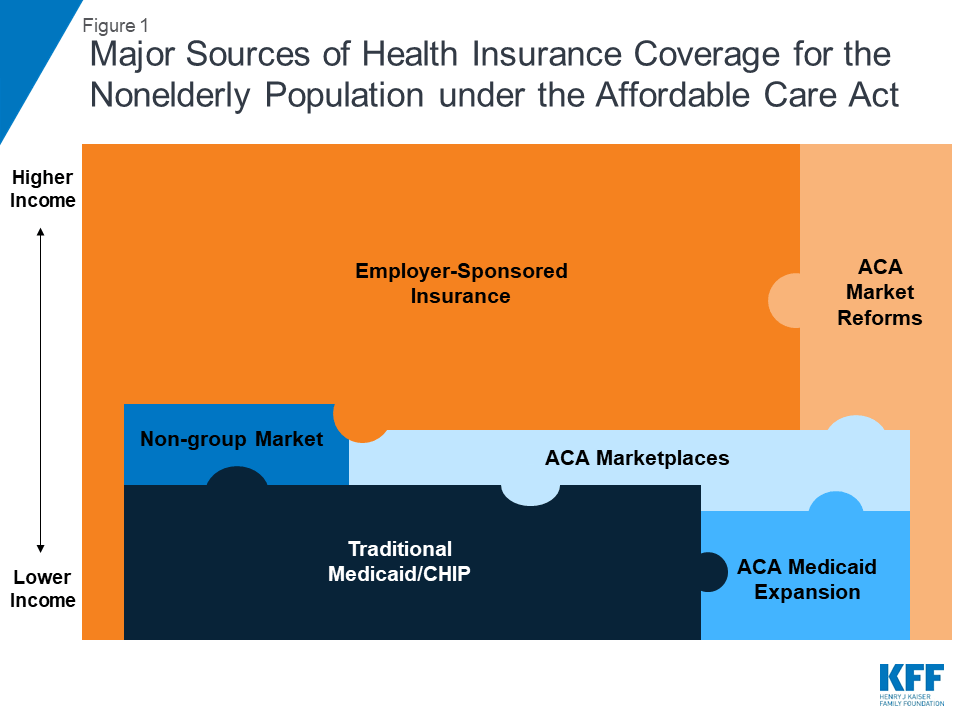
The ACA’s coverage provisions built on and attempted to fill gaps in a piecemeal insurance system that historically left many without affordable coverage. In the past, many people did not have access to affordable private coverage or were ineligible for public coverage. Poor and low-income adults were particularly likely to lack coverage, and the main reason that most people said they lacked coverage was inability to afford the cost.8 The ACA aimed to provide coverage options across the income spectrum by filling in gaps in eligibility for public coverage, access to employer coverage, and availability of affordable non-group coverage (Figure 1).9
Figure 1: Major Sources of Health Insurance Coverage for the Nonelderly Population under the Affordable Care Act
The ACA expanded Medicaid eligibility to low-income adults, eliminating categorical restrictions on coverage in states that have expanded their programs. Medicaid and CHIP have long been important sources of coverage for low-income children and people with disabilities, but in the past, coverage for parents was limited to those with very low incomes (often below 50% of the poverty level), and adults without dependent children—regardless of how poor—were ineligible.10 The ACA expanded Medicaid eligibility to nearly all adults with income at or below 138% of poverty. The 2012 Supreme Court ruling effectively made the expansion a state option. As of January 2019, 37 states, including DC, had adopted Medicaid expansion under the ACA,11 and over 12 million people were covered through the ACA Medicaid expansion.12
The ACA established health insurance marketplaces where individuals and small employers can purchase non-group insurance, often with a subsidy. Very few people were covered by non-group health insurance policies prior to the ACA, as such policies could be prohibitively expensive or restrictive.13 Under the ACA, health insurance marketplaces where individuals can shop for health coverage operate in each state.14 To make coverage purchased in these new marketplaces affordable, the federal government provides tax credits for people with incomes between 100% and 400% of poverty. Tax credits are available on a sliding scale based on income and limit premium costs to a share of income. In addition, ACA allows for cost-sharing subsidies to reduce what people with incomes between 100% and 250% of poverty have to pay out-of-pocket to access health services. In 2018, more than 10 million people enrolled in marketplace plans, and the vast majority received financial assistance with their coverage.15 A small number of people still purchase non-group coverage outside the marketplace.16
The ACA includes provisions to promote employer-based coverage. The availability and affordability of employer-sponsored coverage has declined over time. From 2008 to 2013, the share of firms that offered workers health benefits declined from 63% to 57%, and health insurance premium increases outpaced growth in workers’ earnings and overall inflation.17 Under the ACA, large and medium-size employers (those with 50 or more full-time equivalent employees) are assessed a fee per full-time employee (up to $2,320 in 2018) if they do not offer affordable coverage and have at least one employee who receives a marketplace premium tax credit. To avoid penalties, employers must offer insurance that pays for at least 60% of covered health care expenses, and the employee’s share of the individual premium must not exceed a set share of family income (9.86% in 2019).18, 19 In addition, the ACA established the Small Business Health Options Program (SHOP) marketplace to help small employers and their workers access affordable health coverage.20 Offer, eligibility, and take-up rates of employer-sponsored insurance have largely stabilized since 2013,21 and employer coverage remains the largest source of health coverage for the nonelderly (covering 153 million people in 2017).22
The ACA also extends dependent coverage in the private market. In the past, young adults (age 19-26) were at particularly high risk of being uninsured, largely due to their low incomes and difficulty affording coverage. As of 2010, young adults may remain on their parents’ private plans (including non-group and employer-based plans) until age 26. This provision led to drastic decline in the young adult uninsured rate from 32% in 2010 to 14% in 2017.23
The ACA included nationwide insurance regulations to improve access to coverage for those who may have been previously denied coverage and set new requirements for benefits and cost sharing in ACA plans. Prior to the ACA, in many states, premiums in the non-group market could vary by age or health status, and people with health problems or at risk for health problems could be charged high rates, offered only limited coverage, or denied coverage altogether. The ACA included new rules for insurers prevent them from denying coverage to people for any reason, including their health status, and from charging people who are sick more (though insurers can, within limits, still charge older people more for coverage). In addition, the ACA established a minimum “essential health benefits” package for marketplace plans, Medicaid expansion enrollees, and some employer plans.
Under the ACA, almost all people were required to have health insurance coverage or be subject to a tax penalty. This requirement was intended to encourage healthier individuals to purchase coverage through the marketplace. The requirement only applied to those with access to affordable coverage, defined as costing no more than 8% of an individual’s or family’s income (certain other exemptions to the mandate also were granted). The penalty from 2016 to 2018 was assessed as 2.5 percent of family income, with both a minimum and maximum.24
Coverage for immigrants remains limited under the ACA. Lawfully-present immigrants can receive coverage through the ACA marketplaces, but they continue to face eligibility restrictions in Medicaid that have been in place since prior to the ACA. Specifically, many lawfully present non-citizens who would otherwise be eligible for Medicaid remain subject to a five-year waiting period before they may enroll.25 Undocumented immigrants are ineligible for Medicaid and are prohibited from purchasing coverage through a marketplace or receiving tax credits.
Changes to the ACA under the Trump Administration
With the change in Administration in January 2017, there was renewed debate over the future of the ACA. Discussion of ACA repeal and public comments from President Trump declaring the law to be “dead” and “finished,”26 led some people to be confused about whether the law remained in effect.27 In addition, reduced funding for outreach and enrollment assistance programs led to reduction in these services.28 While attempts to repeal and replace the ACA stalled out in summer 2017, there have been several changes to implementation of the ACA that affect coverage options and people’s likelihood of signing up for or retaining ACA coverage.
In October 2017, the Trump Administration announced it would no longer make payments to insurers for cost-sharing reductions (CSRs). Regardless of whether the federal government reimburses insurers for CSR subsidies, insurers are still legally required under the ACA to offer reduced cost-sharing via silver-level plans to eligible consumers. Many built the loss of CSR payments into their premiums for silver plans for 2018 and again in 2019.29,30 Because premium tax credits on the exchanges are tied to the cost of silver premiums, the effect of the loss of CSR payments was cushioned for many enrollees purchasing insurance through the ACA marketplace.
The individual mandate is no longer in effect as of 2019. As part of tax reform legislation passed in December 2017, Congress reduced the individual mandate penalty to $0 effective in 2019. Repeal of the individual mandate is expected to deter healthier people from enrolling in coverage and thus lead to a sicker—and more expensive—risk pool in the marketplace. Analysis of insurer rate filings shows that plans increased marketplace premiums to account for the loss of the individual mandate.31 Because customers receiving marketplace subsidies will continue to pay sliding-scale premiums based largely on their incomes, these premium increases primarily affect unsubsidized customers and those purchasing individual coverage outside the ACA marketplace. In December 2018, a federal judge in Texas ruled that the change to the law’s individual mandate made the entire law itself unconstitutional, though that decision has no effect as the case works its way through the appeals process.
New, more loosely-regulated plans may now compete with ACA marketplace plans. In 2018, the Trump administration announced new rules that will allow more loosely regulated plans – both short-term limited duration (STLD) plans and association health plans (AHPs) – to proliferate on the individual market in competition with ACA-compliant coverage.32 These more loosely regulated plans will serve as a more affordable option for some people who are not eligible for the ACA’s premium tax credits. However, particularly in the case of short-term plans, this lower-cost coverage is generally unavailable to people with pre-existing conditions, and the plans often exclude coverage for certain services.33 These plans will attract disproportionately healthy individuals away from ACA-compliant coverage, thus having an upward effect on premiums in the ACA-compliant individual market.
In 2018, the Centers for Medicare and Medicaid Services (CMS) issued new guidance regarding Medicaid waivers and invited states to develop waivers, including some that restrict Medicaid eligibility and enrollment.34 Under the previous administration, CMS approved certain eligibility- and enrollment-related waiver provisions as part of ACA Medicaid expansion waivers. Under the Trump administration, states are seeking to apply these previously approved provisions as well as new restrictions to both expansion and traditional Medicaid populations. The Trump administration also has approved eligibility and enrollment restrictions that have never been approved before, such as conditioning eligibility on meeting work requirements; coverage lock-outs for failure to report changes affecting eligibility; and eliminating retroactive coverage for nearly all Medicaid enrollees, among others. In some states, these provisions apply to both expansion adults and traditional Medicaid populations.
New public charge rules could have a chilling effect on coverage among immigrants. In October 2018, the Trump Administration published a proposed rule that would make changes to “public charge” policies. Under longstanding policy, the federal government can deny an individual entry into the U.S. or adjustment to legal permanent resident (LPR) status (i.e., a green card) if he or she is determined likely to become a public charge. Under the proposed rule, officials would newly consider use of certain previously excluded programs, including Medicaid, in public charge determinations. The changes would likely lead to decreases in participation in Medicaid among legal immigrant families and their U.S.-born children beyond those directly affected by the changes.35
The effect of these policy changes on enrollment and coverage is currently playing out and will continue to develop. After growing for the first few years of ACA implementation, marketplace enrollment declined slightly in 2017 and 2018 then dropped substantially in 2019.36 In the one state that has implemented Medicaid work requirements to date, Arkansas, over 18,000 people lost Medicaid in 2018 for failing to meet work or reporting requirements;37 it is unclear whether these people gained other sources of coverage, but low offer rates of employer coverage among low-wage workers make it likely that many did not.38 In addition, recent research suggests that changes in immigration policy focused on restricting immigration and enhancing immigration enforcement are causing some immigrant families to turn away from public programs, including Medicaid and CHIP.39 As additional data on health coverage becomes available, it will be important to assess the effect of these changes, combined with other economic trends, on health coverage.
Report: How Many People Are Uninsured?
Before the ACA, the number of uninsured Americans grew over time, particularly during economic downturns. By 2013, the year before the major coverage provisions of the ACA went into effect, more than 44 million people lacked coverage.40 Under the ACA, millions of people have gained health coverage, and the uninsured rate dropped to a historic low in 2016. Coverage gains were particularly large among low-income people living in states that expanded Medicaid. However, for the first time since the implementation of the ACA, the number of people remaining without coverage increased by half a million in 2017, reaching 27.4 million.
Under the ACA, the uninsured rate and number of uninsured people declined to a historic low by 2016. The number of uninsured people and the share of the nonelderly population that was uninsured rose from 44.2 million (17.1%) to 46.5 million (17.8%) between 2008 and 2010 as the country faced an economic recession (Figure 2). As early provisions of the ACA went into effect in 2010, and as the economy improved, the number of uninsured and uninsured rate began to drop, hitting 44.4 million (16.8%) in 2013. When the major ACA coverage provisions went into effect in 2014, the number of uninsured and uninsured rate dropped dramatically and continued to fall through 2016 to 26.7 million (10.0%).41 Overall, nearly 20 million more people had coverage in 2016 than before the ACA was passed.
Figure 2: Number of Uninsured and Uninsured Rate Among the Nonelderly Population, 2008-2017
Coverage gains through 2016 were largest among low-income people, people of color, and adults—groups that had high uninsured rates prior to 2014—and were particularly large in states that expanded Medicaid. While uninsured rates decreased across all income groups from 2013 to 2016, they declined most sharply for poor and near-poor people, dropping by 9.7 percentage points and 11.4 percentage points, respectively (Figure 3). Among racial and ethnic groups, Hispanics, Blacks, and Asians had particularly large declines in uninsured rates, with each group seeing a drop of over 8 percentage points from 2013 to 2016 (Figure 3).42 Because the expansions are largely targeted to adults, who have historically had higher uninsured rates than children, nearly the entire decline in the number of uninsured people under the ACA has occurred among adults. Uninsured rates dropped nearly immediately in expansion states following implementation of the ACA’s coverage provisions, declining by 7.4 percentage points from 2013 to 2016, with even larger declines among adults (a 9.2 percentage point drop) widely attributed to gains in Medicaid coverage. Uninsured rates among the nonelderly population also dropped in non-expansion states following ACA implementation (down 5.9 percentage points), in part as a result of the availability of ACA subsidies for private insurance to those with incomes above poverty, increased participation among those eligible but not enrolled in Medicaid, and increased outreach and enrollment efforts surrounding the ACA in all states.43
Figure 3: Change in Uninsured Rate Among the Nonelderly Population by Selected Characteristics, 2013-2016
In 2017, the uninsured rate reversed course and, for the first time since the passage of the ACA, rose significantly to 10.2%. Groups that saw significant increases in their uninsured rate from 2016 to 2017 include Black, non-Hispanics, children, older adults (age 45-64), and middle-income families (above twice the poverty level) (Appendix Table 1). From 2016 to 2017, changes in the uninsured rate in the set of states that expanded Medicaid were essentially flat overall, declining by less than 0.1 percentage points, but patterns varied by states and by demographic group (Figure 4). In contrast, the uninsured rate in states that did not expand Medicaid increased both overall (rising by 0.6 percentage points) and for most groups. As with expansion states, changes in coverage from 2016-2017 varied within the set of states that have not expanded Medicaid.
Figure 4: Change in Uninsured Rate Among the Nonelderly Population by Selected Characteristics and Expansion Status, 2016-2017
Many remain uninsured are eligible for ACA assistance, but about half are outside the reach of the ACA. Of the remaining uninsured in 2017, more than half (15.0 million, or 55%) are eligible for financial assistance through either Medicaid or subsidized marketplace coverage. However, nearly half of uninsured people remain outside the reach of the ACA. Some (4.1 million, or 15%) are ineligible due to their immigration status or their state’s decision not to expand Medicaid. The remainder of the uninsured either has an offer of coverage through an employer or has income above the limit for marketplace tax credits (Figure 5). These patterns of eligibility vary by state.44
Figure 5: Eligibility for ACA Coverage Among Nonelderly Uninsured, 2017
In the fourteen states that had not expanded Medicaid as of January 2019, 2.5 million poor adults fall into a “coverage gap.”45 These adults have incomes above Medicaid eligibility limits in their state but below the lower limit for marketplace premium tax credits, which begin at 100% of poverty. In non-expansion states, the median income eligibility level for parents is 43% of poverty and 0% for childless adults.46 People in the coverage gap are concentrated in Southern states, with the largest number of people in the coverage gap in Texas (759,000 people, or 31%) followed by Florida (445,000, or 18%), Georgia (267,000, or 11%), and North Carolina (215,000, or 9%).47
Report: Who Remains Uninsured After The Aca And Why Do They Lack Coverage?
Despite coverage gains, groups with historically high uninsured rates continue to be at highest risk of being uninsured, including low-income individuals, adults, and people of color. Although most remaining uninsured people are in working families, cost continues to pose a major barrier to coverage with nearly half (45%) of uninsured nonelderly adults in 2017 saying that they lacked coverage because it was too expensive.48
Though provisions in the ACA aim to make coverage more affordable for low and moderate-income families, these income groups still make up the vast majority of the uninsured. Low-income individuals are at the highest risk of being uninsured.49 Nearly half of the remaining uninsured population (47%) has family income below 200% of poverty ($19,730 for a family with two adults and one child in 2017)50 and another 35% has family income between 200 and 399% of poverty (Figure 6).
Figure 6: Characteristics of the Nonelderly Uninsured, 2017
A majority of the remaining uninsured population is in a family with at least one worker, and many uninsured workers continue to lack access to coverage through their job. Not all workers have access to health coverage through their jobs or can afford the coverage offered to them. In 2017, more than three-quarters (77%) of the uninsured had at least one full-time worker in their family, and an additional 10% had a part-time worker in their family (Figure 6).51 As in the past, low-income workers and those who work in agriculture, construction, and service jobs are more likely than other workers to be uninsured.52 Moreover, not all workers have access to health coverage through their job. In 2017, 71% of nonelderly uninsured workers worked for an employer that did not offer health benefits to the worker.53
People of color are at higher risk of being uninsured than Whites. While a plurality (41%) of the uninsured are non-Hispanic Whites, people of color are disproportionately likely to be uninsured: they make up 42% of the overall nonelderly U.S. population but account for over half of the total nonelderly uninsured population (Figure 6). Hispanics and Blacks have significantly higher nonelderly uninsured rates (18.9% and 11.1%, respectively) than Whites (7.3%).54 Differences in coverage by race/ethnicity likely reflect a combination of factors, including language and immigration barriers, income and work status, and state of residence.
Adults are still more likely than children to be uninsured. Nonelderly adults were more than twice as likely as children (12% vs. 5%) to be uninsured in 2017.55 This disparity reflects ongoing differences in eligibility for public coverage. While the ACA has increased Medicaid eligibility levels for adults, states have expanded coverage for children even higher through CHIP, while adults without children are excluded from Medicaid in all but one non-expansion state.56
Uninsured rates for children are low, and most uninsured children are eligible for Medicaid or CHIP. Largely due to expanded eligibility for public coverage under Medicaid and CHIP, the uninsured rate for children is relatively low: in 2017, 5% of children nationwide were uninsured.57 Over three in five (64%) uninsured children are eligible for Medicaid, CHIP, or other public programs.58 Some of these children may be reached by covering their parents, as research has found that parent coverage in public programs is associated with higher enrollment of eligible children.59,60
Insurance coverage continues to vary by state and region, with individuals living in non-expansion states being most likely to be uninsured (Figure 7). In 2017, thirteen out of the eighteen states with the highest uninsured rates were non-expansion states.61 Economic conditions, availability of employer-sponsored coverage, and demographics are other factors contributing to variation in uninsured rates across states.
Figure 7: Uninsured Rate Among the Nonelderly by State, 2017
While most of the uninsured are U.S. citizens, non-citizens continue to be at much higher risk of being uninsured. In 2017, three out of four (75%) uninsured nonelderly individuals were citizens. However, non-citizens (including those who are lawfully present and those who are undocumented) are more likely than citizens to be uninsured in 2017. Among citizens, 8% were uninsured in 2017, compared to 33% of non-citizens.62
Cost still poses a major barrier to coverage for the uninsured. Nearly half (45%) of uninsured adults in 2017 said that they lacked coverage was because of high cost.63 Though financial assistance is available to many of the remaining uninsured under the ACA,64 not everyone who is uninsured is eligible for free or subsidized coverage. In addition, some uninsured who are eligible for help may not be aware of coverage options or may face barriers to enrollment.65 Outreach and enrollment assistance was key to facilitating both initial and ongoing enrollment in ACA coverage, but these programs face challenges due to funding cuts and high demand.66,67
Access to health coverage changes as a person’s situation changes. In 2017, 22% of uninsured nonelderly adults said they were uninsured because the person who carried the health coverage in their family lost their job or changed employers.68 More than one in ten were uninsured because of a marital status change, the death of a spouse or parent, or loss of eligibility due to age or leaving school (11%), and some lost Medicaid because of a new job/increase in income or the plan stopping after pregnancy (11%).69
Most people who remained uninsured nonelderly adults in 2017 were uninsured for more than a year. Though the share of uninsured who lacked coverage for more than a year decreased from 81% in 2013 to 74% in 2017,70 the vast majority of uninsured people were still long-term uninsured. People who have been without coverage for long periods may be particularly hard to reach through outreach and enrollment efforts.
Report: How Does Lack Of Insurance Affect Access To Care?
Health insurance makes a difference in whether and when people get necessary medical care, where they get their care, and ultimately, how healthy they are. Uninsured people are far more likely than those with insurance to postpone health care or forgo it altogether. The consequences can be severe, particularly when preventable conditions or chronic diseases go undetected.
Compared to those who have health coverage, people without health insurance are more likely to skip preventive services and report that they do not have a regular source of health care. Adults who are uninsured are over three times more likely than insured adults to say they have not had a visit about their own health to a doctor or other health professional’s office or clinic in the past 12 months.71 They are also less likely to receive recommended screening tests such as blood pressure checks, cholesterol checks, blood sugar screening, pap smear or mammogram (among women), and colon cancer screening.72 Part of the reason for poor access among the uninsured is that half do not have a regular place to go when they are sick or need medical advice, while the majority of insured people do have a regular source of care (Figure 8).73
Figure 8: Barriers to Health Care Among Nonelderly Adults by Insurance Status, 2017
Uninsured people are more likely than those with insurance to report problems getting needed medical care. One in five (20%) uninsured adults say that they went without needed care in the past year because of cost compared to 3% of adults with private coverage and 8% of adults with public coverage.74 Many uninsured people do not obtain the treatments their health care providers recommend for them. In 2017, 19% of uninsured adults said they delayed or did not get a needed prescription drug due to cost, compared to 14% with public coverage and 6% with private coverage.75 And while insured and uninsured people who are injured or newly diagnosed with a chronic condition receive similar plans for follow-up care from their doctors, people without health coverage are less likely than those with coverage to obtain all the recommended services.76,77
Because uninsured people are less likely than those with insurance to have regular outpatient care, they are more likely to have negative health consequences. Because uninsured patients are also less likely to receive necessary follow-up screenings than their insured counterparts,78 they have an increased risk of being diagnosed at later stages of diseases, including cancer, and have higher mortality rates than those with insurance.79,80,81 In addition, when uninsured people are hospitalized, they receive fewer diagnostic and therapeutic services and also have higher mortality rates than those with insurance.82,83,84,85
Uninsured children also face problems getting needed care. Uninsured children are more likely to lack a usual source of care, to delay care, or to have unmet medical needs than children with insurance (Figure 9).86 Further, uninsured children with common childhood illnesses and injuries do not receive the same level of care as others and are at higher risk for preventable hospitalizations and for missed diagnoses of serious health conditions.87,88 Among children with special health care needs, those without health insurance have worse access to care than those with insurance.89
Figure 9: Children’s Access to Care by Health Insurance Status, 2017
Lack of health coverage, even for short periods of time, results in decreased access to care. Research has shown that adults who experience gaps in their health insurance coverage are less likely to have a regular source of care or to be up to date with blood pressure or cholesterol checks than those with continuous coverage.90 Research also indicates that children who are uninsured for part of the year have more access problems than those with full-year coverage.91,92 Similarly, adults who lack insurance for an entire year have poorer access to care than those who have coverage for at least part of the year, suggesting that even a short period of coverage can improve access to care.93
Research demonstrates that gaining health insurance improves access to health care considerably and diminishes the adverse effects of having been uninsured. A seminal study of a Medicaid expansion in Oregon found that uninsured adults who gained Medicaid coverage were more likely to have an outpatient visit or receive a prescription and less likely to have depression or stress in the short term than their counterparts who did not gain coverage.94 Findings two years out from the expansion showed significant improvements in access, utilization, and self-reported health among the adults who gained coverage.95 In addition, a large body of research on the impact of Medicaid expansion under the ACA demonstrates that gains in Medicaid coverage positively impact access to care and utilization of health care services.96 Research also shows that individuals who gained marketplace coverage in 2014 were far more likely than those who remained uninsured to obtain a usual source of care and receive preventive care services.97
Public hospitals, community clinics and health centers provide a crucial health care safety net for uninsured people; however, the safety net does not close the access gap for the uninsured. Safety net providers, including public and community hospitals, community health centers, rural health centers, and local health departments, provide care to many people without health coverage. In addition, nearly all other hospitals and some private physicians provide some charity care. However, safety net providers have limited resources and service capacity, and not all uninsured people have geographic access to a safety net provider.98,99 The ACA has led to significant growth in the number of health centers and their service capacity through both new grant funds and new patient revenues due to expanded coverage.100 However, this impact has been more limited in states not expanding Medicaid, where a much larger share of health center patients remains uninsured than in states that did expand.101 In addition, health centers in all states report that securing needed specialty care for their uninsured patients is a major challenge.102
Report: What Are The Financial Implications Of Lacking Insurance?
For many uninsured people, the costs of health insurance and medical care are weighed against equally essential needs, like housing, food, and transportation to work, and many uninsured adults report being very or moderately worried about paying basic monthly expenses such as rent or other housing costs and monthly bills.103 When uninsured people use health care, they may be charged for the full cost of that care (versus insurers, who negotiate discounts) and often face difficulty paying medical bills. Providers absorb some of the cost of care for the uninsured, and while uncompensated care funds cover some of those costs, these funds do not fully offset the cost of care for the uninsured.
Most uninsured people do not receive health services for free or at reduced charge. Hospitals frequently charge uninsured patients two to four times what health insurers and public programs actually pay for hospital services.104, 105 In 2015, only 27% of uninsured adults reported receiving free or reduced cost care.106
Uninsured people often must pay “up front” before services will be rendered. When people without health coverage are unable to pay the full medical bill in cash at the time of service, they can sometimes negotiate a payment schedule with a provider, pay with credit cards (typically with high interest rates), or be turned away.107,108 Among uninsured adults in 2015, a third (33%) were asked to pay for the full cost of medical care before they could see a doctor.109
People without health insurance have lower medical expenditures than those with insurance, but they pay a much larger portion of their medical costs out-of-pocket. Nonelderly people without health coverage had an average of $1,719 in health spending in 2016, less than half of average annual spending for people with any private coverage ($4,846) and less than a third of average annual spending for people with only public coverage ($6,421).110 Despite lower overall medical spending, people without insurance who use services pay a greater percentage of their expenses out-of-pocket than those with insurance. As a result, in 2014, those without insurance who used medical services paid an average of $752 out of pocket, compared to $658 for those with any private coverage and just $236 for those with public coverage.111
Providers incur billions in the cost of uncompensated care for the uninsured, not all of which is offset by funding to defray these costs. In 2013, before the ACA was fully implemented, the uncompensated costs of care for the uninsured amounted to about $85 billion, and funding from a number of sources helped providers defray these costs. Most of these funds came from the federal government through a variety of programs including Medicaid and Medicare disproportionate share hospital (DSH) payments, the Veterans Health Administration, the Indian Health Service, the Community Health Centers block grant, and the Ryan White CARE Act, though states and localities provided billions and the private sector provided a small share. Given the high cost of hospital-based care, the majority of the cost of uncompensated care is incurred in hospitals. While substantial, these payments to providers for uncompensated care amount to a small slice of total health care spending in the U.S.112
With the expansion of coverage under the ACA, providers in states that expanded Medicaid are seeing reductions in uncompensated care costs. For example, between 2013 and 2015, total uncompensated care costs for hospitals (including charity care costs and bad debt) dropped from $37.3 billion to $28.7 billion, a $8.6 billion or 23% drop.113 States that expanded Medicaid saw greater declines in uncompensated care than states that have not expanded.114 Anticipating fewer uninsured and lower levels of uncompensated care, the ACA called for a reduction in federal Medicaid DSH payments; these cuts have been postponed and are now scheduled to begin in 2020.115
Being uninsured leaves individuals at an increased risk of financial strain due to medical bills. In 2017, nonelderly uninsured adults were over twice as likely as those with insurance to have problems paying medical bills (29% vs. 14%; Figure 10) with nearly two thirds of uninsured who had medical bill problems unable to pay their medical bills at all (65%).116 Uninsured adults are also more likely to face negative consequences due to medical bills, such as using up savings, having difficulty paying for necessities, borrowing money, or having medical bills sent to collection.117
Figure 10: Problems Paying Medical Bills by Insurance Status, 2017
Most uninsured people have few, if any, savings or assets they can easily use to pay health care costs. Uninsured people typically have limited access to funds to finance care. Only 40 and 50 percent of single- and multi-person households with an uninsured person, respectively, had liquid assets in excess of $1,000 in 2016, and less than a fifth (18 percent) in both household types had liquid assets above $5,000.118 Uninsured nonelderly adults are over twice as likely as insured adults to worry about being able to pay costs for normal health care (61% vs. 27%; Figure 10). Furthermore, over three quarters of uninsured nonelderly adults (76%) say they are very or somewhat worried about paying medical bills if they get sick or have an accident, compared to 45% of insured adults.119
Uninsured people are at risk of medical debt. Like any bill, when medical bills are not paid or are paid off too slowly, they are turned over to a collection agency. Nearly three in five consumers (59%) reported being contacted regarding a collection for medical bills in the United States.120 In 2017, uninsured adults were more likely than insured adults to say they have medical bills that are being paid off over time (31% vs. 24%).121 More than half (53%) of uninsured people said they had problems paying household medical bills in the past year.122
Conclusion
The ACA led to historic drops in the uninsured rate, with millions of previously uninsured Americans gaining insurance and access to health services and protection from catastrophic health costs. Prior to the ACA, the options for the uninsured population were limited in the individual market, as coverage was often expensive and insurers could deny coverage based on health status. Medicaid and CHIP have provided coverage to many families, but pre-2014 eligibility levels were low for parents and few states provided coverage to adults without dependent children. The ACA filled in many of these gaps by expanding Medicaid to low-income adults and providing subsidized coverage to people with incomes from 100 to 400% of poverty in the marketplaces.
Nonetheless, even with the ACA, the nation’s system of health insurance continues to have many gaps that currently leave millions of people without coverage, and recent actions to alter the ACA under the Trump Administration may limit availability of coverage. For the first time since passage of the law, the number of uninsured people increased in 2017, and 27.4 million remain uninsured. Nearly half (45%) of the remaining uninsured are outside the reach of the ACA either because their state did not expand Medicaid, they are subject to immigrant eligibility restrictions, or their income makes them ineligible for financial assistance. The remainder are eligible for assistance under the law but may still struggle with affordability and knowledge of options and require targeted outreach to help them gain coverage. Going without coverage can have serious health consequences for the uninsured because they receive less preventive care, and delayed care often results in serious illness or other health problems. Being uninsured can also have serious financial consequences, with many unable to pay their medical bills, resulting in medical debt.
Ongoing debate about altering the ACA or limiting Medicaid to populations traditionally served by the program could lead to further loss of coverage and place more people in jeopardy of facing access barriers or financial strain due to being uninsured. On the other hand, if additional states opt to expand Medicaid as allowed under the ACA, there may be additional coverage gains as low-income individuals gain access to affordable coverage. The outcome of current debate over health coverage policy in the nation and the states has substantial implications for people’s coverage, access, and overall health and well-being.
Rachel Garfield and Kendal Orgera are with the Kaiser Family Foundation. Anthony Damico is an independent consultant to the Kaiser Family Foundation.
Appendix
Appendix Table 1: Uninsured Rate Among the Nonelderly, 2013-2017
2013Uninsured Rate
2016Uninsured Rate
2017Uninsured Rate
Change in Uninsured Rate2013-2017
Change in Uninsured Rate2016-2017
Total – Nonelderlya
16.8%
10.0%
10.2%
-6.6%*
0.2%*
Age
Children – Total
7.5%
4.7%
5.0%
-2.6%*
0.3%*
Adults – Total
20.6%
12.1%
12.3%
-8.2%*
0.2%*
Adults 19-25
26.8%
14.6%
14.8%
-11.9%*
0.2%
Adults 26-34
26.3%
15.6%
15.6%
-10.7%*
0.0%
Adults 35-44
21.2%
13.6%
13.6%
-7.6%*
0.0%
Adults 45-54
17.4%
10.4%
10.7%
-6.7%*
0.3%*
Adults 55-64
13.4%
7.5%
7.9%
-5.5%*
0.4%*
Annual Family Income
<$20,000
28.0%
17.1%
17.2%
-10.8%*
0.0%
$20,000 – $39,999
27.4%
16.8%
17.3%
-10.1%*
0.5%*
$40,000 +
11.4%
7.1%
7.5%
-3.9%*
0.4%*
Family Poverty Levelb
<100%
26.2%
16.5%
16.6%
-9.6%*
0.1%
100-199%
28.4%
17.0%
17.2%
-11.2%*
0.3%
200-399%
17.7%
11.3%
11.7%
-5.9%*
0.4%*
400%+
6.8%
4.1%
4.5%
-2.3%*
0.3%*
Household Type
1 Parent with childrenc
11.5%
6.8%
7.1%
-4.4%*
0.3%
2 Parents with childrenc
10.8%
6.9%
7.2%
-3.6%*
0.3%*
Multigenerationald
20.5%
11.8%
11.6%
-8.9%*
-0.2%
Adults living alone or with other adults
20.1%
11.6%
11.8%
-8.3%*
0.3%*
Other
22.5%
13.5%
13.6%
-8.8%*
0.1%
Family Work Status
2+ Full-time
13.4%
8.2%
8.5%
-5.0%*
0.3%*
1 Full-time
16.5%
10.2%
10.4%
-6.1%*
0.2%*
Only Part-timee
26.2%
14.4%
14.6%
-11.6%*
0.2%
Non-Workers
21.2%
12.7%
13.0%
-8.2%*
0.3%*
Race/Ethnicity
White only (non-Hispanic)
12.3%
7.1%
7.3%
-5.0%*
0.3%*
Black only (non-Hispanic)
18.8%
10.7%
11.1%
-7.7%*
0.5%*
Hispanic
30.0%
19.1%
18.9%
-11.1%*
-0.2%
Asian/Native Hawaiian and Pacific Islander
15.8%
7.2%
7.2%
-8.6%*
0.0%
Am. Indian/Alaska Native
30.4%
22.0%
22.0%
-8.4%*
0.1%
Two or more racesf
13.5%
7.7%
7.9%
-5.6%*
0.2%
Citizenship
U.S. citizen – native
13.8%
7.9%
8.2%
-5.6%*
0.3%*
U.S. citizen – naturalized
20.3%
9.8%
10.0%
-10.3%*
0.2%
Non-U.S. citizen, resident for < 5 years
38.5%
26.4%
27.2%
-11.3%*
0.8%
Non-U.S. citizen, resident for 5+ years
51.4%
37.0%
36.0%
-15.4%*
-1.0%*
* Indicates a statistically significant difference from 2017 at the p < 0.05 level. a Nonelderly includes all individuals under age 65.
b The U.S. Census Bureau’s poverty threshold for a family with two adults and one child was $19,730 in 2017. c Parent includes any person with a dependent child. d Multigenerational families with children include families with at least three generations in a household. Other families include those with adults are caring for children other than their own (e.g., a niece living with her aunt).
e Part-time workers are defined as working < 35 hours per week. f Respondents can identify as more than one racial or ethnic group. The hierarchy we use for determining racial/ethnic categories places all respondents who self-identify as mixed race who do not also identify as Hispanic into the “Two or More Races” category. All individuals who identify with Hispanic ethnicity fall into the Hispanic category regardless of selected race.
SOURCE: Kaiser Family Foundation analysis of the 2013-2017 American Community Survey (ACS).
Endnotes
Kaiser Family Foundation analysis of 2013 American Community Survey (ACS), 1-Year Estimates. ↩︎
Kaiser Family Foundation analysis of the 2017 American Community Survey (ACS), 1-Year Estimates. ↩︎
Kaiser Family Foundation analysis of the 2017 National Health Interview Survey. ↩︎
U.S. Department of Health and Human Services, Office of The Assistant Secretary for Planning and Evaluation, 2018 Poverty Guidelines. Available at: https://aspe.hhs.gov/poverty-guidelines. ↩︎
Samuel L Dickman, David Himmelstein, and Steffie Woolhandler, Inequality and the health-care system in the USA (London, England: The Lancet, April 8, 2017), https://doi.org/10.1016/S0140-6736(17)30398-7. ↩︎
Kaiser Family Foundation analysis of the 2013 Kaiser Survey of Low-Income Americans and the ACA, 2014. ↩︎
Under the SHOP, employers with no more than 50 full-time equivalent (FTE) employees can purchase coverage and employers with no more than 25 FTE employees and annual wages below a limit ($53,000 for tax year 2017) may be eligible for tax credits for up to two years to reduce the cost of SHOP coverage. Beginning in January 2016, states had the option to expand the SHOP to include employers with 100 or fewer FTEs. For tax years beginning in 2014 or later, employers could receive a tax credit of up to 50% of the employer’s contribution to the premium, calculated on a sliding scale basis tied to average wages and number of employees. For small businesses with tax-exempt status meeting the requirements above, the tax credit is 35% of the employer contribution. In order to qualify, a business must pay premiums on behalf of employees enrolled in a qualified health plan offered through the SHOP marketplace or qualify for an exemption to this requirement. “Small Business Health Care Tax Credit and the SHOP Marketplace,” Internal Revenue Service, accessed December 2018, https://www.irs.gov/affordable-care-act/employers/small-business-health-care-tax-credit-and-the-shop-marketplace. Centers for Medicare and Medicaid Services, Health Insurance Marketplace, Who Can Use the SHOP Marketplace (Baltimore, MD: CMS, Health Insurance Marketplace, October 2014), https://marketplace.cms.gov/outreach-and-education/who-can-use-shop.pdf. ↩︎
Lawfully present immigrants who would be eligible for Medicaid but are in a five-year waiting period are eligible for tax credits for marketplace coverage. Samantha Artiga and Anthony Damico, Health Coverage and Care for Immigrants (Washington, DC: Kaiser Family Foundation, July 2017), http://modern.kff.org/disparities-policy/issue-brief/health-coverage-and-care-for-immigrants/. ↩︎
Kaiser Family Foundation analysis based on 2017 Medicaid eligibility levels and March 2017 Current Population Survey, Annual Social and Economic Supplement. ↩︎
Kaiser Family Foundation analysis of the 2017 American Community Survey (ACS), 1-Year Estimates. ↩︎
Other public programs include some state-funded programs for immigrants otherwise ineligible for Medicaid. Kaiser Family Foundation analysis based on 2018 Medicaid eligibility levels and 2017 American Community Survey, 1-Year Estimates. ↩︎
Julie L. Hudson and Asako S. Moriya, “Medicaid Expansion for Adults Had Measureable ‘Welcome Mat’ Effects on Their Children,” Health Affairs 36, no.9 (September 2017): 1643-51. ↩︎
Jack Hadley, “Insurance Coverage, Medical Care Use, and Short-term Health Changes Following an Unintentional Injury or the Onset of a Chronic Condition,” JAMA 297, no. 10 (March 2007): 1073-84. ↩︎
Broadwater-Hollifield et al. “Predictors of Patient Adherence to Follow-Up Recommendations after an ED Visit,” The American Journal of Emergency Medicine 33, no.10 (October 2015): 1368-73. ↩︎
Silvia Tejada et al., “Patient Barriers to Follow-Up Care for Breast and Cervical Cancer Abnormalities.” Journal of Women’s Health 22, no. 6 (June 2013): 507-517. ↩︎
Steffie Woolhandler, et al., “The Relationship of Health Insurance and Mortality: Is Lack of Insurance Deadly?” Annals of Internal Medicine 167 (June 2017): 424-431. ↩︎
Andrea S. Christopher, et al., “Access to Care and Chronic Disease Outcomes Among Medicaid-Insured Persons Versus the Uninsured,” American Journal of Public Health 106, no. 1 (January 2016): 63-69. ↩︎
Fizan Abdullah et al., “Analysis of 23 Million US Hospitalizations: Uninsured Children Have Higher All-Cause In-Hospital Mortality,” Journal of Public Health 32, no. 2 (June 2010): 236-44. ↩︎
Steffie Woolhandler, et al., “The Relationship of Health Insurance and Mortality: Is Lack of Insurance Deadly?” Annals of Internal Medicine 167 (June 2017): 424-431. ↩︎
Destini A Smith, et al., “The effect of health insurance coverage and the doctor-patient relationship on health care utilization in high poverty neighborhoods.” Preventive Medicine Reports 7 (2017): 158-161. ↩︎
Andrea S. Christopher, et al., “Access to Care and Chronic Disease Outcomes Among Medicaid-Insured Persons Versus the Uninsured,” American Journal of Public Health 106, no. 1 (January 2016): 63-69. ↩︎
Kaiser Family Foundation analysis of the 2017 National Health Interview Survey. ↩︎
Amanda Haboush-Deloye, Spencer Hensley, Masaru Teramoto, Tara Phebus, Denise Tanata-Ashby, “The Impacts of Health Insurance Coverage on Access to Healthcare in Children Entering Kindergarten,” Maternal and Child Health Journal 18, no.7 (Sep 2014): 1753-64. ↩︎
Amy Cassedy, Gerry Fairbrother, and Paul Newacheck, “The Impact of Insurance Instability on Children’s Access, Utilization, and Satisfaction with Health Care,” Ambulatory Pediatrics 8, no. 5 (October 2008): 321-8. ↩︎
Thomas Buchmueller, Sean Orzol, and Lara Shore-Sheppard, “Stability of Children’s Insurance Coverage and Implications for Access to Care: Evidence from the Survey of Income and Program Participation”, International Journal of Health Care Finance and Economics 14, no.2 (Jun 2014). ↩︎
Salam Abdus, “Part-Year Coverage and Access to Care for Nonelderly Adults,” Medical Care 52, no. 8 (August 2014): 709-14. ↩︎
Amy Finkelstein et al., “The Oregon Health Insurance Experiment: Evidence from the First Year” (National Bureau of Economic Research, July 2011), http://www.nber.org/papers/w17190. ↩︎
Katherine Baicker et al., “The Oregon Experiment — Effects of Medicaid on Clinical Outcomes,” New England Journal of Medicine 368 (May 2013): 1713-1722. ↩︎
James B Kirby and Jessica P. Vistnes,“Access to Care Improved for People Who Gained Medicaid or Marketplace Coverage in 2014” Health Affairs,35, no.10 (Oct 2016): 1830-1834. ↩︎
Kaiser Family Foundation analysis of the 2017 National Health Interview Survey. ↩︎
Gerard Anderson , “From ‘Soak The Rich’ To ‘Soak The Poor’: Recent Trends In Hospital Pricing” Health Affairs 26, no. 4 (May 2007): 780-789. ↩︎
Stacie Dusetzina, Ethan Basch, and Nancy Keating, “For Uninsured Cancer Patients, Outpatient Charges Can Be Costly, Putting Treatments out of Reach,” Health Affairs 34, no. 4 (April 2015): 584-591. ↩︎
Kaiser Family Foundation analysis of the 2015 Kaiser Family Foundation/New York Times Medical Bills Survey. ↩︎
Brent Asplin et al., “Insurance Status and Access to Urgent Ambulatory Care Follow-up Appointments,” JAMA 294, no. 10 (September 2005): 1248-54. ↩︎
Brendan Saloner, et al., “Most Uninsured Adults Could Schedule Primary Care Appointments Before The ACA, But Average Price Was $160,” Health Affairs 34, no. 5 (May 2015), https://doi.org/10.1377/hlthaff.2014.1258. ↩︎
Kaiser Family Foundation analysis of the 2015 Kaiser Family Foundation/New York Times Medical Bills Survey. ↩︎
California Poll: Access to Mental Health Care, Insurance Coverage, and Affordability Rank among Californians’ Top Health Care Priorities for the New Governor and Legislature
Most Californians Say Their Community Does Not Have Enough Mental Health Providers
Large Majorities across Parties Say Medi-Cal is Important to the State; Most Residents Say Program is Important to Their Families; Access to Care Remains a Challenge for Some Enrollees
Californians rank making health care more affordable among their top overall priorities for the state’s new governor and legislature, with 45 percent citing it as “extremely important,” just behind improving public education (48%) and ahead of affordable housing (40%), finds a new KFF (Kaiser Family Foundation)/California Health Care Foundation poll examining state health policy issues.
Among health issues, Californians’ top priorities are ensuring people with mental health problems can get treatment (49% say it is “extremely important”), making sure all Californians have access to health coverage (45%), and reducing what people pay for their health care (41%).
Mental health access ranks in the top two health priorities for Democrats, Republicans and independents alike. Half (52%) of all Californians say their community does not have enough mental health providers to serve local needs.
“We have never before seen the public place such strong emphasis on access to mental health treatment in our national or state polls,” said KFF’s President and CEO Drew Altman.
“There is a strong sense of urgency in these mental health findings,” said Sandra R. Hernández, president and CEO of the California Health Care Foundation. “Californians are telling us loud and clear that more should be done to expand and improve mental health treatment.”
The poll also gauges Californians’ views on the Medi-Cal program and finds an overwhelming majority (91%) say Medi-Cal is “very” or “somewhat” important to the state, including large majorities of Democrats (97%), independents (90%), and Republicans (80%). About six in 10 Californians (59%) say Medi-Cal is personally important to them and their families.
The state-wide survey of 1,404 California residents was conducted before new Gov. Gavin Newsom unveiled his budget plan and priorities, which include proposals to expand health care access, affordability and coverage. Its findings highlight many of the challenges Californians face in these areas as the governor, legislature and other policymakers weigh potential solutions. For example:
Affordability
More than four in 10 Californians (44%) say they or someone in their household delayed or skipped medical care in the past year because of the cost. The share rises to more than half for people who are uninsured (54%) as well as those with incomes below 200% of the federal poverty level (55%).
One in five (20%) say they have had problems paying household medical bills in the past year. The share is higher among those who suffer from a debilitating health condition (34%).
Worries about affording unexpected medical bills (63%) outrank worries about affording routine out-of-pocket medical costs (56%) and worries about affording other basic needs, including transportation (53%) and housing (52%).
Access
Most Californians (57%) say residents with mental health conditions are not able to get needed services, and nearly half (48%) say the same about people with alcohol and drug use problems. The share reporting lack of access is even higher among those who say they or a family member sought treatment for these problems in the past 12 months.
Nearly a quarter (23%) of Californians say they had to wait longer than they thought reasonable to get an appointment for medical care in the past 12 months. This includes one in three (33%) Medi-Cal enrollees.
Among those who say they or a family member sought treatment for a mental health condition in the past year, about a quarter (23%) say they had to wait longer than they thought reasonable to get an appointment for mental health care, a share rising to four in ten (42%) for Medi-Cal enrollees.
In addition to half of Californians citing a shortage of mental health providers, about a third say their communities don’t have enough primary care doctors (35%) or specialists (33%) to serve local residents, and a quarter say they don’t have enough hospitals (27%). People living in the San Joaquin Valley and the Inland Empire are more likely than other Californians to say their local community lacks adequate numbers of providers.
The poll finds Californians strongly support one potential idea for addressing regional provider shortages: a large majority (83%) say the state government should provide medical and nursing students with scholarships and financial help if they agree to work in areas with too few providers.
Coverage
Half (50%) of the uninsured in California say they have been without insurance for at least two years. The main reason people report for being uninsured is that insurance is too expensive or they cannot afford it.
Worries about immigration status may also contribute to some uninsured Californians’ reluctance to seek coverage. Among the uninsured, 40 percent say they are worried that signing up for insurance could draw attention to their or a family member’s immigration status.
Although ensuring access to insurance is a top priority for Californians, residents hold mixed views on establishing a single-payer health system in the state. About half the public (48%) favors such a plan, while four in 10 (40%) oppose it. Notably, six in ten California Republicans (62%) strongly oppose such a plan, while about half as many Democrats (32%) strongly support it.
Views on the Affordable Care Act and Covered California
Most Californians (58%) view the Affordable Care Act favorably, making the national health reform law somewhat more popular in California than the country as a whole. This may be largely due to the fact that California leans Democrat, and Democrats are more supportive of the law than independents or Republicans.
Most Californians (56%) also say the state-run health insurance marketplace, Covered California, is working well. This includes majorities of Democrats (70%) and independents (55%), but only a third of Republicans (34%).
METHODOLOGY
Designed and analyzed by researchers at KFF and the California Health Care Foundation, the California Health Policy Survey was conducted from November 12-December 27, 2018 among a random digit dial telephone sample of 1,404 adults living in California. Interviews were conducted in English and Spanish by landline (476) and cell phone (928). The margin of sampling error including the design effect for the full sample is plus or minus 3 percentage points. For results based on subgroups, the margin of sampling error may be higher.
California, the nation’s most populous state and one with a diverse population in terms of race, ethnicity, income, and geography, has often been at the leading edge of national health care trends. A state that fully embraced the Affordable Care Act (ACA), California has the nation’s largest Medicaid program (known in the state as Medi-Cal) with a total enrollment of over 13 million, and the second-largest ACA marketplace enrollment of nearly 1.5 million, just behind Florida. California’s newly-elected governor, Gavin Newsom, made health care a prominent part of his campaign platform in 2018, and announced a sweeping set of health care proposals soon after being sworn in in January 2019.
In late 2018, the Kaiser Family Foundation and the California Health Care Foundation conducted a representative survey of the state’s residents to gauge their views on health policy priorities facing the state, as well as their experiences in the health care system. Key findings from the survey are presented here.
Key Findings: Section 1: Priorities For State Government
As the new governor takes office and a new legislative session begins, health care is an important priority for California residents. Making health care more affordable ranks high on Californians’ list of overall priorities for the new governor and legislature to address, with 45 percent calling it an “extremely important” priority, ranking just behind improving public education (48 percent say this is “extremely important”) and just ahead of affordable housing (40 percent). [Figure 1]
While health care affordability ranks second on the priority list for both Democrats and independents (behind education for each group), it ranks lower for Republicans, whose top priority is immigration enforcement. [Figure 2]
In a new @KaiserFamFound/ @CHCFNews poll, access to mental health care tops California residents’ health care priorities for the new governor and state legislature to address.
There is broad support for many health care priorities in the state, with the exception of decreasing state government spending on health care. Making sure people with mental health problems can get the treatment they need was identified by 88 percent of Californians as an “extremely” or “very” important priority (including 49 percent “extremely” important). At least three-quarters also see other health priorities as at least “very important,” including making sure Californians have access to health insurance coverage (78 percent, including 45 percent “extremely” important); lowering the amount people pay for health care (81 percent, 41 percent “extremely”); lowering the price of prescription drugs (75 percent, 39 percent “extremely”); making sure there are enough health care providers across California (77 percent, 38 percent “extremely”); and making information about medical prices more available (76 percent, 37 percent “extremely”). [Figure 3]
The survey finds some areas of bi-partisan agreement when it comes to health care priorities in the state, and other areas where priorities differ for residents with different partisan identification. For example, mental health is an area of agreement: ensuring access to mental health treatment is seen as an extremely important priority by substantial shares of Democrats (54 percent), independents (46 percent), and Republicans (43 percent), and ranks in the top two health care priorities for each of these groups. There is less agreement between people of different political parties when it comes to some other priorities. For example, Democrats and independents are much more likely than Republicans to view ensuring access to insurance coverage as an “extremely important” priority (56 percent, 44 percent, and 21 percent, respectively). [Figure 4]
The ranking of most health care priorities is similar across income levels. However, those with lower self-reported incomes (below 200 percent of the federal poverty level) are more likely than those with higher incomes to say making sure there are enough doctors, nurses, and other health care providers across California should be extremely important for the state government to work on in 2019 (46 percent versus 33 percent). [Figure 5]
Figure 1
Figure 1: Improving Public Education And Lowering The Cost Of Health Care Rank High In Californians’ Priorities For 2019
Key Findings: Section 2: Mental Health Coverage And Access To Treatment
As noted above, making sure people with mental health problems can get treatment tops the list of California residents’ health care priorities for the state government to address. This may be related to the fact that about half (52 percent) of Californians say their community does not have enough mental health providers to serve the needs of local residents, compared to 27 percent who say it does have enough and 21 percent who say they don’t know enough to say. In four of the six California regions broken out in the survey, majorities of residents say their community does not have enough mental health providers to serve residents’ needs, with the highest share in Los Angeles County (58 percent). [Figure 6]
In addition, Californians who are Black (75 percent) or Hispanic (57 percent) are more likely than those who are white (49 percent) or Asian (42 percent) to feel their community lacks adequate numbers of mental health providers, and women are somewhat more likely than men to feel this way (57 percent versus 47 percent). [Figure 7]
About a quarter (24 percent) of California residents say that they or a family member sought counseling or treatment for a mental health condition in the past 12 months. [Figure 8] Among this group, nearly two-thirds (63 percent) say their community does not have enough providers.
More broadly, a majority (57 percent) of state residents think that most people with mental health conditions in California are not able to get the services they need, and nearly half (48 percent) say the same about people with alcohol or drug use problems. [Figure 9]
Again, these shares are higher among those who have sought such services: 66 percent of those who say they or a family member sought services for a mental health condition say most Californians are not able to get needed mental health services. Similarly, 61 percent of those who say they or a family member sought treatment for substance use problems say most Californians are not able to get needed treatment services. [Figure 10]
Access to mental health treatment may be a particular issue for residents with Medi-Cal coverage. Among non-elderly Medi-Cal enrollees who say they or a family member sought counseling or treatment for a mental health condition in the past 12 months, four in ten (42 percent) say there was a time when they had to wait longer than they thought was reasonable to get an appointment for these services. Among all Californians who say someone in their family sought mental health treatment, this share is about one quarter (23 percent). [Figure 11]
Treatments for mental health and substance use disorders are widely seen by Californians as effective. About three-quarters (76 percent) of state residents say that counseling and medical treatment is very effective in helping people with mental health conditions lead healthy and productive lives, and a similar share (73 percent) say the same about people with alcohol or drug use problems. [Figure 12]
Despite the high priority placed on this issue, few Californians are aware of mental health parity laws that require health insurance plans to provide mental health and substance use disorder treatment benefits that are on par with benefits for other medical services1 . One third (33 percent) know that insurance plans are required to provide mental health benefits with the same rules about cost-sharing and coverage limits as other medical services, and just a quarter know this is the case for coverage of substance abuse treatment. [Figure 13]
Figure 6
Figure 6: Across California Regions, Large Shares Say Their Community Doesn’t Have Enough Mental Health Providers
Key Findings: Section 3: Insurance Coverage, Including The Aca, Covered California, Medi-cal, And Single-payer
Views of the Affordable Care Act (ACA) are slightly more favorable in California than they are in the nation as a whole, with 58 percent having a favorable view of the law and 30 percent having an unfavorable view. [Figure 14] In the January 2019 KFF Health Tracking Poll, views of the law nationally were 51 percent favorable and 40 percent unfavorable. This difference is likely due to the fact that Californians lean more Democratic in their party identification than the nation as a whole.
Most Californians also believe the state marketplace, Covered California, is working well (56 percent). Views of both the ACA and the state marketplace are divided along party lines. [Figure 15]
As is true nationally, Medi-Cal, the state Medicaid program, is more popular than the ACA, including across parties. Seven in ten California residents overall have a favorable opinion of Medi-Cal, including large majorities of Democrats (82 percent) and independents (67 percent) and about half (53 percent) of Republicans. [Figure 16] In addition, an overwhelming majority of residents say that Medi-Cal is very or somewhat important for the state of California (91 percent), including large majorities of Democrats (97 percent), independents (90 percent), and Republicans (80 percent). A majority (59 percent) of state residents say the Medicaid program is important for their own family, including about six in ten Democrats and independents (62 percent each) and four in ten Republicans (39 percent). [Figure 17]
While large majorities across income levels and racial/ethnic groups say Medi-Cal is important for the state of California, people who are Black or Hispanic, and those with self-reported incomes below 200 percent FPL are much more likely than their counterparts to say the program is important for their own family. [Figure 18]
Despite high levels of support for the program, misperceptions about Medi-Cal are common. Fewer than four in ten state residents (37 percent) are aware that most working age adults without disabilities who have health insurance through Medi-Cal are working, while a similar share (42 percent) believe most are unemployed and 20 percent say they don’t know. [Figure 19] In fact, 62 percent of non-elderly, non-disabled adults enrolled in Medi-Cal were employed in 2016.2
While making sure Californians have access to health insurance coverage is near the top of the list of Californians’ health care priorities for the new governor and legislature, views are somewhat divided on achieving this through a single-payer health plan in the state. About half the public (48 percent) favors such a plan, while four in ten are opposed. Notably, six in ten California Republicans (62 percent) strongly oppose such a plan, while about half as many Democrats (32 percent) strongly favor it. [Figure 20]
As with national polling, support for single-payer in the state is malleable; support can be pushed as high as 63 percent when opponents are told such a plan would ensure all Californians would have coverage [Figure 21], while opposition can be pushed up to 59 percent when tax increases are mentioned. [Figure 22]
While most Californians (71 percent) believe their family would have to pay more in taxes if a single-payer plan were implemented, nearly half (47 percent) of those ages 18-64 with private insurance incorrectly think they’d be able to keep their current coverage under such a plan. [Figure 23]
Figure 14
Figure 14: Nearly Six In Ten Californians Have A Favorable View Of The Affordable Care Act
Key Findings: Section 4: Access To Providers And Provider Shortages
About three-quarters (77 percent) of Californians say that “making sure there are enough doctors, nurses, and other health care providers across California” should be an important priority for the state government to address, including 38 percent who call it an “extremely important” priority. About a third of California residents say their community doesn’t have enough primary care doctors (35 percent) or specialists (33 percent) to serve the needs of local residents, and about a quarter (27 percent) say it doesn’t have enough hospitals. [Figure 24]
People who are Black or Hispanic, those with lower incomes, as well as those living in the San Joaquin Valley and the Inland Empire are more likely than their counterparts to say their community lacks adequate numbers of providers. [Figure 25, Figure 26, and Figure 27] These responses are in line with data showing the distribution of both primary and specialty care providers is uneven across the state.3
In addition, waiting times for appointments are an issue for some residents, particularly those with lower incomes and those with Medi-Cal coverage. Nearly a quarter (23 percent) of all state residents say there was a time in the past year when they had to wait longer than they thought was reasonable for an appointment for medical care, rising to 33 percent of those with Medi-Cal coverage. [Figure 28]
There is broad support (including across parties) for the state government providing medical and nursing students with scholarships and financial help if they agree to work in areas of the state with provider shortages. [Figure 29]
Figure 24
Figure 24: One-Third Believe Their Community Does Not Have Enough Primary Care Doctors, Specialists To Serve Residents’ Needs
Key Findings: Section 5: Experiences With Health Care Affordability
As noted above, making health care more affordable ranks second in the public’s overall priority list for the incoming administration, just behind improving public education. One reason for this may be people’s own experiences affording health care for themselves and their families. For example, one in five California residents (20 percent) reports problems paying medical bills, rising to three in ten among those with a debilitating medical condition (34 percent), those ages 18-64 who are on Medi-Cal (31 percent) or without health insurance (31 percent), and those with self-reported incomes below 200 of the federal poverty level (29 percent). Problems paying medical bills are also more common among California residents who are Black (30 percent) or Hispanic (28 percent) compared with those who are white (16 percent) or Asian (8 percent). [Figure 30]
Many of those struggling to pay medical bills report having to make certain sacrifices to pay off their bills. For example, about seven in ten of those with bill problems report cutting spending on basic household items (72 percent), two-thirds report putting off vacations or major purchases (66 percent), and 61 percent report using up all or most of their savings to pay their medical bills. [Figure 31]
Unexpected medical bills are also a problem for those with insurance. Three in ten non-elderly Californians with health insurance (31 percent) say there was a time in the past year when they received a medical bill they thought was covered, but their insurance did not cover the bill at all or paid less than they expected. About four in ten of this group (12 percent of all insured Californians) say this happened because the provider was not in their plan’s network. [Figure 32]
Whether or not they have personally experienced such bills, unexpected medical bills represent a large financial worry for Californians. Nearly two-thirds (63 percent) say they are very or somewhat worried about being able to afford unexpected medical bills, ranking higher than worries about affording out-of-pocket medical costs in general (56 percent), prescription drug costs (42 percent), or health insurance premiums (39 percent of those with insurance). Worries about surprise medical bills outrank worries about affording other basic needs, such as transportation costs (53 percent), housing costs (52 percent), and utilities (47 percent). [Figure 33]
Just a third (34 percent) of those with health insurance are aware that California law (through Assembly Bill No. 72 passed in 20174 ) prohibits providers from charging out-of-network prices for care received at in-network hospitals. [Figure 34]
Challenges affording care also may lead some Californians to delay or forgo medical treatments or prescription drugs. Over four in ten residents (44 percent) say they or another family member in their household has postponed or skipped care in the past year because of the cost, including skipping dental care or check-ups (30 percent), putting off or postponing getting health care (20 percent), skipping recommended tests or treatments (19 percent), not filling a prescription for medicine (18 percent), cutting pills in half or skipping doses of a medicine (12 percent), or putting off or postponing getting mental health care (10 percent). [Figure 35]
Californians with lower incomes, those without health insurance, and Black and Hispanic residents are more likely than their counterparts to experience problems paying medical bills, postponing or forgoing health care because of the cost, and worries about affording care. For example, those with self-reported incomes below 200% FPL are almost twice as likely as those with higher incomes to report problems paying medical bills in the past year, and much more likely to report skipping or delaying care (55 percent versus 36 percent). They are also almost twice as likely to say they are very worried about affording unexpected medical bills or general out-of-pocket health care costs. [Figure 36]
Similarly, uninsured Californians are more likely than those with insurance to report medical bill problems (31 percent versus 21 percent), and to say they are very worried about affording unexpected medical bills (63 percent versus 37 percent) or out-of-pocket costs (56 percent versus 30 percent). [Figure 37]
While numerous public and private initiatives seek to increase cost transparency for individuals, most Californians (62 percent) say it is difficult to find out how much different medical treatments and procedures provided by different doctors and hospitals would cost before they receive them. [Figure 38] As noted above, 76 percent of Californians think it is extremely or very important for the new governor and legislature to work on making information about provider costs more widely available.
Figure 30
Figure 30: 1 in 5 California Residents Report Problems Paying Medical Bills For Self Or Family Member In Past Year
Key Findings: Section 6: Experiences Of The Uninsured
Half of the non-elderly uninsured in California say they’ve been without insurance for 2 years or more. The main reason they report being without insurance is that it’s too expensive or they can’t afford it (31 percent), followed by employment-related reasons (10 percent). [Figure 39]
Worries about exposing their own or someone else’s immigration status may also prevent some uninsured Californians from seeking coverage. Four in ten of those without insurance say they are worried that if they signed up for health insurance, they would draw attention to their own or a family member’s immigration status. This includes three in ten who say they are “very worried” and another one in ten who say they are “somewhat” worried. [Figure 40]
Figure 39
Figure 39: Cost Is The Biggest Barrier To Getting Insurance For The Uninsured
The Kaiser Family Foundation/California Health Care Foundation California Health Policy Survey was conducted by telephone November 12 – December 27, 2018 among a random representative sample of 1,404 adults age 18 and older living in the state of California (note: persons without a telephone could not be included in the random selection process). Interviews were administered in English and Spanish, combining random samples of both landline (476) and cellular telephones (928, including 668 who had no landline telephone). Sampling, data collection, weighting and tabulation were managed by SSRS in close collaboration with Kaiser Family Foundation and California Health Care Foundation researchers. The California Health Care Foundation paid for the costs of the survey fieldwork, and Kaiser Family Foundation contributed the time of its research staff. Both partners worked together to design the survey and analyze the results.
The sampling and screening procedures were designed to increase the number of Black and Asian-American respondents and low-income respondents, including those who have health insurance through Medi-Cal or who are uninsured. This oversample allowed for sufficient numbers of respondents in these subgroups to report their results separately; weighting adjustments were made to adjust their proportions to represent their actual shares of the population in overall results (see weighting description below). The sample included 463 respondents who were reached by calling back respondents in California who had previously completed an interview on either the SSRS Omnibus poll or the Kaiser Health Tracking Polls and indicated they fit one of the oversample criteria (Black, Asian, or low-income respondents, including low-income respondents with Medi-Cal or who are uninsured, and are living in California). It also included 46 respondents with prepaid (or pay-as-you-go) cell phone numbers in California, a group that is disproportionately lower-income.
The dual frame cellular and landline phone sample was generated by Marketing Systems Group (MSG) using random digit dial (RDD) procedures. The RDD frames were stratified by income-level in order to reach more low-income respondents. To address the fact that some qualifying respondents could be reached only by their cell-phone but had an out-of-state phone number, the sample was augmented with a sample of phone numbers outside of California associated with a billing address that indicated in-state residence (n=89). Survey Sampling International (SSI) generated these numbers randomly using Smart Cell sample. All respondents were screened to verify that they resided in California. For the landline sample, respondents were selected by asking for the youngest adult male or female currently at home based on a random rotation. If no one of that gender was available, interviewers asked to speak with the youngest adult of the opposite gender. For the cell phone sample, interviews were conducted with the qualifying adult who answered the phone.
A multi-stage weighting design was applied to ensure an accurate representation of the California adult population. The first stage of weighting involved corrections for sample design, including accounting for the components, the likelihood of non-response for the re-contacted sample, and an adjustment to account for the fact that respondents with both a landline and cell phone have a higher probability of selection. In the second weighting stage, demographic adjustments were applied, at first, to the RDD and Smart Cell sample to account for systematic non-response along known population parameters. Population parameters included gender, age, race, Hispanic ethnicity (broken down by nativity), educational attainment, phone status (cell phone only or reachable by landline), and state region. Demographic parameters were based on estimates from the U.S. Census Bureau’s March 2017 American Community Survey (ACS), and telephone use was based on data for California from the 2016 National Health Interview Survey. Based on this second stage of weighting, estimates were derived for self-reported income as a percentage of the federal poverty level (less than 200%, 200% or higher) by insurance status (Medi-Cal, uninsured, all else) in the California population. The last stage of weighting included all respondents and used poverty level by insurance status, based on the previous stage’s outcomes, as an additional weighting parameter.
The margin of sampling error including the design effect for the full sample is plus or minus 3 percentage points. For results based on subgroups, the margin of sampling error may be higher. Sample sizes and margins of sampling error for subgroups are available by request. Note that sampling error is only one of many potential sources of error in this or any other public opinion poll. Kaiser Family Foundation public opinion and survey research is a charter member of the Transparency Initiative of the American Association for Public Opinion Research.
California regions analyzed in this report are defined as follows:
Los Angeles County
South Coast: San Diego and Orange Counties
Inland Empire: Riverside and San Bernadino Counties
San Joaquin Valley: San Joaquin, Stanislaus, Merced, Madera, Fresno, Kings, Tulare, and Kern Counties
Sacramento/North Valley: Shasta, Tehama, Glenn, Butte, Colusa, Yuba, Placer, Sutter, Yolo, El Dorado, and Sacramento Counties
San Francisco Bay Area: Alameda, Contra Costa, Marin, Napa, San Francisco, San Mateo, Santa Clara, Sonoma, and Solano Counties
Appendices: Appendix B: Demographic Tables
B.1: Tables By Race And Income
Table B.1.1: Availability Of Health Care Providers In The Community
Do you think your community has enough _____ to serve the needs of local residents, or not?
Total
Race/Ethnicity
Self-reported Income (% of FPL)
Total
Among Employed
White
Hisp.
Asian
Black
<200%
200%+
<200%
200%+
Hospitals
Enough
70%
74%
63%
77%
54%
63%
74%
64%
75%
Not enough
27
21
35
21
45
34
22
33
22
Don’t know
3
5
3
2
1
3
4
3
3
Primary care doctors
Enough
57%
61%
50%
64%
47%
52%
61%
49%
64%
Not enough
35
29
44
30
46
41
31
42
29
Don’t know
7
10
5
7
7
7
8
9
7
Specialists
Enough
54%
60%
45%
61%
45%
46%
61%
45%
62%
Not enough
33
23
45
27
45
42
24
42
23
Don’t know
13
17
10
12
10
12
14
13
14
Mental health care providers
Enough
27%
26%
26%
30%
19%
30%
25%
27%
26%
Not enough
52
49
57
42
75
56
51
57
49
Don’t know
21
24
17
28
6
15
24
16
24
Table B.1.2: Importance Of Medi-Cal To State And Family
How important is Medi-Cal for _____?
Total
Race/Ethnicity
Self-reported Income (% of FPL)
Total
Among Employed
White
Hisp.
Asian
Black
<200%
200%+
<200%
200%+
The state of California
Very important
76%
69%
88%
67%
87%
84%
70%
84%
70%
Somewhat important
15
18
7
25
6
10
20
11
19
Not too important
3
4
2
4
2
2
3
2
4
Not at all important
3
3
2
2
4
2
3
2
3
You and your family
Very important
46%
33%
66%
33%
63%
69%
25%
63%
23%
Somewhat important
12
12
10
20
12
11
14
14
15
Not too important
12
15
7
18
9
7
17
10
18
Not at all important
26
37
12
29
16
11
41
11
41
Table B.1.3: Worries About Affording Health Care
How worried, if at all, are you about being able to afford _____ for you and your family?
% who said “very worried”:
Total
Race/Ethnicity
Self-reported Income (% of FPL)
Total
Among Employed
White
Hisp.
Asian
Black
<200%
200%+
<200%
200%+
Your monthly health insurance premium*
17%
10%
27%
16%
20%
26%
10%
22%
10%
Out-of-pocket costs when using health care services
30
20
47
22
27
44
17
40
19
Prescription drug costs
22
13
37
10
16
33
11
32
10
Rent or mortgage
31
19
47
25
31
48
16
48
17
Gasoline or other transportation costs
27
20
40
11
35
41
13
38
14
Monthly utilities like electricity or heat
22
14
35
15
29
36
9
31
9
Unexpected medical bills
38
26
53
39
29
51
26
52
27
NOTE: *Item was asked among those who have insurance.
Table B.1.4: Problems Affording Care Because Of Cost
In the past 12 months, have you or another family member living in your household _____ because of the cost, or not?
% who said yes:
Total
Race/Ethnicity
Self-reported Income (% of FPL)
Total
Among Employed
White
Hisp.
Asian
Black
<200%
200%+
<200%
200%+
Skipped a recommended medical test or treatment
19%
17%
20%
15%
21%
24%
15%
26%
16%
Not filled a prescription for a medicine
18
14
22
13
17
24
13
21
14
Cut pills in half or skipped doses of medicine
12
10
15
6
18
18
7
17
7
Put off or postponed getting mental health care
10
11
12
3
9
16
7
19
7
Put off or postponed getting health care
20
19
21
19
16
28
16
29
19
Skipped dental care or checkups
30
30
32
22
28
40
23
42
24
Experienced any of the above
44
43
46
41
39
55
36
56
38
Table B.1.5: Problems Paying Medical Bills
In the past 12 months, did you or anyone in your household have problems paying or an inability to pay any medical bills, such as bills for doctors, dentists, medication, or home care?
Total
Race/Ethnicity
Self-reported Income (% of FPL)
Total
Among Employed
White
Hisp.
Asian
Black
<200%
200%+
<200%
200%+
% who said yes:
20%
16%
28%
8%
30%
29%
15%
30%
15%
B.2: Tables By Region
Table B.2.1: Availability Of Health Care Providers In The Community
Do you think your community has enough _____ to serve the needs of local residents, or not?
Total
California Region
South Coast
Bay Area
LA County
Sacramento/North Valley
Inland Empire
San Joaquin Valley
Hospitals
Enough
70%
81%
73%
72%
76%
54%
51%
Not enough
27
17
24
24
23
38
47
Don’t know
3
2
3
3
1
7
2
Primary care doctors
Enough
57%
71%
60%
61%
46%
53%
46%
Not enough
35
23
28
32
44
40
49
Don’t know
7
6
11
6
10
7
5
Specialists
Enough
54%
64%
59%
53%
60%
50%
36%
Not enough
33
25
23
33
29
37
54
Don’t know
13
11
18
13
12
13
10
Mental health care providers
Enough
27%
37%
22%
28%
20%
29%
25%
Not enough
52
40
46
58
54
53
56
Don’t know
21
22
32
14
25
18
18
Table B.2.2: Importance Of Medi-Cal To State And Family
How important is Medi-Cal for _____?
Total
California Region
South Coast
Bay Area
LA County
Sacramento/North Valley
Inland Empire
San Joaquin Valley
The state of California
Very important
76%
67%
78%
77%
78%
71%
84%
Somewhat important
15
19
16
14
15
19
9
Not too important
3
5
3
3
2
2
4
Not at all important
3
5
2
2
3
5
1
You and your family
Very important
46%
36%
43%
47%
48%
44%
69%
Somewhat important
12
14
12
10
12
18
12
Not too important
12
13
15
15
13
8
6
Not at all important
26
37
28
25
24
23
12
Table B.2.3: Worries About Affording Health Care
How worried, if at all, are you about being able to afford _____ for you and your family?
% who said “very worried”:
Total
California Region
South Coast
Bay Area
LA County
Sacramento/North Valley
Inland Empire
San Joaquin Valley
Your monthly health insurance premium*
17%
12%
14%
17%
16%
20%
31%
Out-of-pocket costs when using health care services
30
26
22
34
22
31
48
Prescription drug costs
22
16
20
23
17
23
32
Rent or mortgage
31
24
25
37
26
30
42
Gasoline or other transportation costs
27
24
15
29
24
32
41
Monthly utilities like electricity or heat
22
18
17
19
23
26
40
Unexpected medical bills
38
32
31
38
33
44
49
NOTE: *Item was asked among those who have insurance.
Table B.2.4: Problems Affording Care Because Of Cost
In the past 12 months, have you or another family member living in your household _____ because of the cost, or not?
% who said yes:
Total
California Region
South Coast
Bay Area
LA County
Sacramento/North Valley
Inland Empire
San Joaquin Valley
Skipped a recommended medical test or treatment
19%
15%
14%
21%
21%
24%
21%
Not filled a prescription for a medicine
18
17
14
20
23
16
19
Cut pills in half or skipped doses of medicine
12
9
6
14
11
15
19
Put off or postponed getting mental health care
10
7
8
12
8
11
10
Put off or postponed getting health care
20
19
17
22
19
19
21
Skipped dental care or checkups
30
28
23
31
30
33
39
Experienced any of the above
44
41
39
46
42
47
49
Table B.2.5: Problems Paying Medical Bills
In the past 12 months, did you or anyone in your household have problems paying or an inability to pay any medical bills, such as bills for doctors, dentists, medication, or home care?
Total
California Region
South Coast
Bay Area
LA County
Sacramento/North Valley
Inland Empire
San Joaquin Valley
% who said yes:
20%
15%
12%
24%
26%
22%
27%
B.3. Tables By Insurance Status Ages 18-64
Table B.3.1: Availability Of Health Care Providers In The Community
Do you think your community has enough _____ to serve the needs of local residents, or not?
Total
Insurance Status (Ages 18-64)
Insurance Type (Ages 18-64)
Insured
Uninsured
Employer-Sponsored
Medi-Cal
Hospitals
Enough
70%
70%
63%
75%
57%
Not enough
27
26
35
21
40
Don’t know
3
4
3
4
3
Primary care doctors
Enough
57%
60%
46%
65%
47%
Not enough
35
33
43
27
46
Don’t know
7
7
10
7
7
Specialists
Enough
54%
56%
43%
61%
47%
Not enough
33
31
39
25
42
Don’t know
13
12
16
14
11
Mental health care providers
Enough
27%
28%
31%
26%
27%
Not enough
52
51
52
49
58
Don’t know
21
21
16
25
15
Table B.3.2: Importance Of Medi-Cal To State And Family
How important is Medi-Cal for _____?
Total
Insurance Status (Ages 18-64)
Insurance Type (Ages 18-64)
Insured
Uninsured
Employer-Sponsored
Medi-Cal
The state of California
Very important
76%
77%
80%
72%
91%
Somewhat important
15
15
10
18
7
Not too important
3
2
3
4
1
Not at all important
3
3
5
3
1
You and your family
Very important
46%
46%
63%
29%
91
Somewhat important
12
13
14
15
5
Not too important
12
14
8
20
1
Not at all important
26
25
10
33
2
Table B.3.3: Worries About Affording Health Care
How worried, if at all, are you about being able to afford _____ for you and your family?
% who said “very worried”:
Total
Insurance Status(Ages 18-64)
Insurance Type (Ages 18-64)
Insured
Uninsured
Employer-Sponsored
Medi-Cal
Your monthly health insurance premium*
17%
18%
N/A
15%
21%
Out-of-pocket costs when using health care services
30
30
56
23
44
Prescription drug costs
22
19
45
14
32
Rent or mortgage
31
31
48
25
46
Gasoline or other transportation costs
27
24
39
18
39
Monthly utilities like electricity or heat
22
20
36
12
37
Unexpected medical bills
38
37
63
32
48
NOTE: *Item was asked among those who have insurance.
Table B.3.4: Problems Affording Care Because Of Cost
In the past 12 months, have you or another family member living in your household _____ because of the cost, or not?
% who said yes:
Total
Insurance Status(Ages 18-64)
Insurance Type (Ages 18-64)
Insured
Uninsured
Employer-Sponsored
Medi-Cal
Skipped a recommended medical test or treatment
19%
19%
30%
16%
26%
Not filled a prescription for a medicine
18
17
28
13
30
Cut pills in half or skipped doses of medicine
12
12
17
8
21
Put off or postponed getting mental health care
10
10
18
8
14
Put off or postponed getting health care
20
20
32
17
27
Skipped dental care or checkups
30
30
41
23
43
Experienced any of the above
44
45
54
38
57
Table B.3.5: Problems Paying Medical Bills
In the past 12 months, did you or anyone in your household have problems paying or an inability to pay any medical bills, such as bills for doctors, dentists, medication, or home care?