KFF designs, conducts and analyzes original public opinion and survey research on Americans’ attitudes, knowledge, and experiences with the health care system to help amplify the public’s voice in major national debates.
Healthcare.gov marketplace insurers denied nearly one out of every five claims (19%) submitted for in-network services in 2017, and enrollees only appeal a tiny share (0.5%) of those denied claims, a KFF analysis of recently released claims data finds.
The analysis finds a huge variation across insurers, with average denial rates as low as 1 percent and as high as 45 percent. Denial rates also vary across states, though individual insurers in the same state also show wide variation. For instance, Florida’s six insurers denied 11 percent of claims, though the denial rates among the six insurers reporting data in the state range from 2 percent to 32 percent.
The Affordable Care Act requires insurers to report data about claims denials and appeals and other metrics to encourage transparency about how insurance coverage works in practice for enrollees. The analysis relies on data files released by the Centers for Medicare and Medicaid Services and compiled by KFF. It examines nearly 230 million claims submitted to 130 insurers selling individual market major medical health plans through healthcare.gov in 2017.
The CMS data do not provide information about why a claim was denied, making it difficult to assess why denial rates vary so much across insurers. Reasons can include both administrative issues such as improperly submitted or duplicative claims and coverage issues such as denials for services that the insurer determines are not medically necessary. Transparency data may well reflect other inconsistencies in how insurers report data, such as for duplicate claims or partially denied claims.
Consumers rarely appeal denied claims. In 2017, for example, the data show consumers filed appeals on about 200,000 of more than 42 million denied claims. On average, appeals resulted in a reversal of the initial denial in 14 percent of cases, though with wide variations among individual insurers, which had reversal rates ranging from 1 percent to 88 percent.
The analysis also reviews planned changes to the ACA transparency data reporting, as well as data reporting under other programs, that could address some of the current data limitations.
Global health donors, such as the U.S., provide funding and other support primarily through two types of channels: bilateral (i.e., country-to-country) and/or multilateral (i.e., multi-country, pooled support often directed through an international organization). Donors make different choices about the distribution of their global health support between these two mechanisms, and these choices may change over time due to political, technical, or other considerations.1 While the U.S. has decidedly been a bilateral donor to global health (channeling 81% of current global health assistance bilaterally), it has helped to found, and serves as a key donor to, several major multilateral health organizations. These include some of the first international health organizations, such as the Pan American Health Organization (PAHO) in 1902 and the World Health Organization (WHO) in 1948, and newer partnerships, such as Gavi, the Vaccine Alliance (Gavi) in 2000 and the Global Fund to Fight AIDS, Tuberculosis and Malaria (Global Fund) in 2002. These multilateral organizations have contributed significantly to improvements in global health2 and, in some cases, serve as key components of the U.S. global health response. This response includes financing, governance, oversight, and technical assistance.
Multilateral global health organizations are those jointly supported by multiple governments and, often, other partners (versus bilateral efforts, which are carried out on a country-to-country basis). Examples include:
health-focused or health-emphasizing specialty agencies of the United Nations (U.N.), such as PAHO, WHO, the Joint United Nations Programme on HIV/AIDS (UNAIDS), the U.N. Population Fund (UNFPA), and the U.N. Children’s Fund (UNICEF); and
international financing mechanisms for global health, such as Gavi, the Global Fund, and the TB Drug Facility (at the Stop TB Partnership), which pool and direct resources from multiple public and private donors for specific health causes.
Still, U.S. support for multilateral institutions has fluctuated over time, reflecting, in part, changing U.S. leadership views on the relative value of bilateralism versus multilateralism. Following a period of increasing U.S. support for multilaterals, particularly during the Obama Administration, the Trump Administration has signaled skepticism about such engagement, requesting less funding for international organizations (including multilateral health organizations) and withdrawing from several multilateral agreements.3 Even so, our polling shows that most Americans – in fact, an increasing percentage – believe the U.S. should be working in coordination with others on international health efforts (see Americans’ Views on the U.S. Role in Global Health).
New @KaiserFamFound brief examines how the U.S. government engages with multilateral organizations to address key #globalhealth challenges
With ongoing questions about future U.S. support for multilateral health efforts as well as important markers on the near horizon, including donor replenishment conferences for both the Global Fund and Gavi within the next two years, this brief highlights five key facts about U.S. engagement with multilateral global health organizations. It focuses on those organizations to which Congress specifically directs funding (there are eight, including five U.N. entities; see Box 1) but is not meant to be an exhaustive review of all multilateral health initiatives in which the U.S. may participate.
Box 1: Multilateral Health Organizations Supported by the U.S.*
U.N. Agencies
Pan-American Health Organization (PAHO)
Joint United Nations Programme on HIV/AIDS (UNAIDS)
United Nations Children’s Fund (UNICEF)
United Nations Family Planning Agency (UNFPA)
World Health Organization (WHO)
Non-U.N. Financing Mechanisms
Gavi, the Vaccine Alliance
Global Fund to Fight AIDS, Tuberculosis and Malaria
TB Global Drug Facility (at Stop TB Partnership)
NOTE: * indicates includes those organizations to which Congress specifically directs funding.4 Multilateral global health initiatives the U.S. supports without direct congressional appropriations are not covered in this brief, including the Global Polio Eradication Initiative (GPEI); the Global Health Security Agenda (GHSA); and the Global Financing Facility (GFF), among others. Such organizations may receive funding determined at the agency level.
1. U.S. multilateral funding for health has grown over time but, mirroring overall trends, flattened more recently.
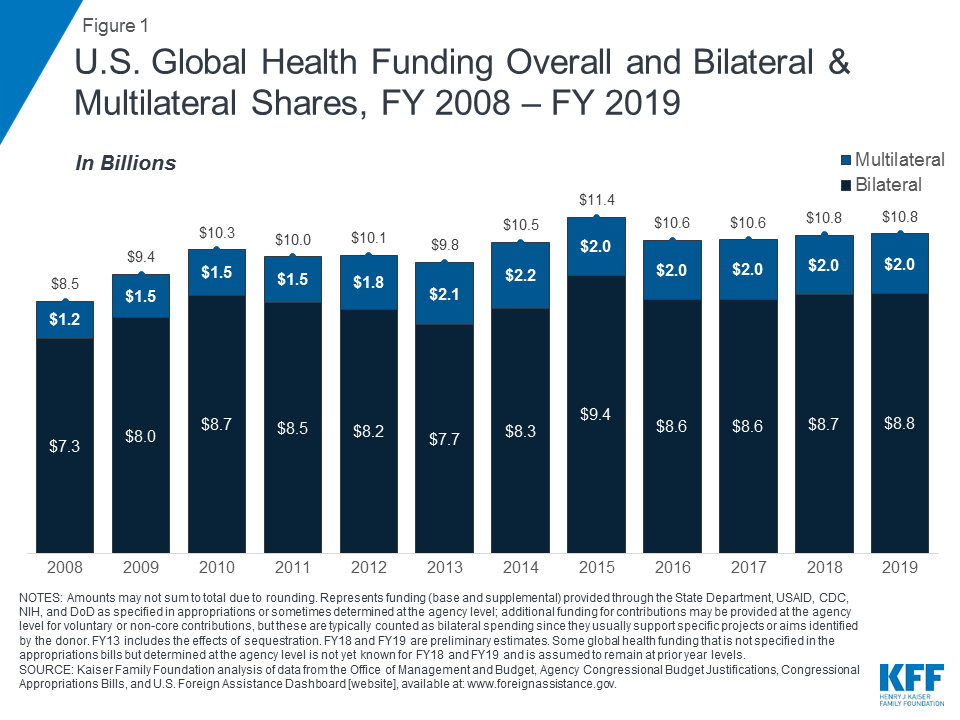
The amount of U.S. global health funding directed multilaterally varies each year but has generally grown over time, both in amount and as a share of the U.S. global health budget. The U.S provided initial support for Gavi (launched in 2000) and the Global Fund (launched in 2002), while continuing its support for U.N. health agencies, and U.S. funding to multilateral global health organizations has generally increased over time since then. From FY 2008 through FY 2018, U.S. multilateral health funding5 increased from $1.2 billion to $2.0 billion, with a peak of $2.2 billion in FY 2014 (see Figure 1). This represents funding specified by Congress in appropriations for contributions to the five U.N. entities identified in Box 1 – provided as “regular,” “core,” or “assessed” contributions6 (generally used to support essential functions and operations) and contributions to Gavi, the Global Fund, and the TB Global Drug Facility. More recently, general budget pressures led to a flattening of U.S. global health funding, including for multilateral efforts.
Figure 1: U.S. Global Health Funding Overall and Bilateral & Multilateral Shares, FY 2008 – FY 2019
In addition, U.S. agencies at times provide other funding that is not specified by Congress to U.N. entities; these additional contributions are often referred to as “voluntary” or “non-core” contributions and used for specific projects or initiatives the U.S. seeks to support. In some cases these voluntary contributions are quite sizable (see Appendix). For example, in FY 2017, about three-quarters of U.S. contributions to WHO were voluntary, and nearly half of U.S. contributions to UNAIDS were non-core contributions.
As a share of the U.S. global health budget, multilateral funding has also increased over time, rising from 15% in FY 2008 to 19% in FY 2018 (its high point was 21% in 2013 and 2014); see Table 1. This growth in part reflected an increased emphasis placed on multilateral cooperation by the Obama Administration, as well as growing support in Congress.
Table 1: Bilateral and Multilateral Shares of U.S. Global Health Funding, FY 2008 – FY 2019
Channel
FY08
FY09
FY10
FY11
FY12
FY13
FY14
FY15
FY16
FY17
FY18
FY19
Total($ in Billions)
$8.5
$9.4
$10.3
$10.0
$10.1
$9.8
$10.5
$11.3
$10.6
$10.6
$10.8
$10.8
Bilateral
85%
84%
85%
85%
82%
79%
79%
83%
81%
81%
81%
81%
Multilateral
15%
16%
15%
15%
18%
21%
21%
17%
19%
19%
19%
19%
NOTES: Represents funding (base and supplemental) provided through the State Department, USAID, CDC, NIH, and DoD as specified in appropriations or sometimes determined at the agency level; additional funding for contributions may be provided at the agency level for voluntary or non-core contributions, but these are typically counted as bilateral spending since they usually support specific projects or aims identified by the donor. FY13 includes the effects of sequestration. FY18 and FY19 are preliminary estimates. Some global health funding that is not specified in the appropriations bills but determined at the agency level is not yet known for FY18 and FY19 and is assumed to remain at prior year levels.
The Trump Administration, however, has called for significant budget cuts to foreign assistance, including for multilateral health programs.7 For FY 2018, the Administration proposed a 24% (or $481 million) cut to multilateral global health funding. This was rejected by Congress, which instead provided a $16 million increase over FY 2017 levels.8 For FY 2019, the Administration requested a 37% cut ($735 million) to multilateral health funding, which, if enacted, would have returned funding to pre-FY 2009 levels and was a steeper proposed cut to multilateral programs than bilateral programs (19%).9 Congress rejected this proposed cut as well.
2. U.S. contributions to multilateral health organizations are significant.
The U.S. provides significant support to a number of multilateral global health organizations (see Appendix). In many cases, the U.S. is the largest, or one of the largest, donors to these organizations. For example, the U.S. is the top contributor to five of the eight organizations: the Global Fund, PAHO, UNAIDS, UNICEF, and WHO.10
However, this is not always the case, and U.S. contributions to multilaterals can change over time. For example, while the U.S. helped to found the United Nations Populations Fund (UNFPA) in 1969 and was a leading supporter for many years, its support has fluctuated significantly over the years, due to ongoing political debates about abortion. Most recently, the Trump Administration determined it would withhold U.S. support to the agency, invoking the Kemp-Kasten Amendment of U.S. law to do so (see KFF’s explainer).11
3. U.S. support for multilateral health organizations often complements its bilateral programs in support of global health goals.
Multilateral initiatives complement U.S. bilateral global health efforts, helping make progress toward U.S. goals in various program areas. In some cases, multilateral support allows the U.S. to reach a larger number of countries; it also may help to leverage additional funding and provide opportunities for improved coordination and technical consultations. For example:
HIV. While primarily bilateral, U.S. global efforts to fight HIV under the umbrella of the President’s Emergency Plan for AIDS Relief (PEPFAR) include multilateral support, primarily through contributions to the Global Fund but also to the Joint United Nations Programme on HIV/AIDS (UNAIDS). U.S. investments in the Global Fund, in particular, are recognized as the “multilateral arm”12 of PEPFAR. PEPFAR coordinates its bilateral spending and activities in PEPFAR countries with the grants provided to and activities supported in countries by the Global Fund. Furthermore, U.S. contributions to the Global Fund extend the reach of PEPFAR by reaching an additional 78 countries where the PEPFAR bilateral program does not operate (see Figure 2). In addition, since U.S. law requires that the U.S. contribution cannot exceed 33% of total contributions from all donors, the U.S. contribution to the Global Fund leverages other donor contributions. See KFF fact sheet on PEPFAR and the fact sheet on the Global Fund.
Figure 2: Geographic Reach of PEPFAR and the Global Fund to Fight AIDS, TB and Malaria
Maternal and child health (MCH). In addition to U.S. bilateral efforts to improve MCH, the U.S. also provides multilateral support for MCH through contributions to the United Nations Children’s Fund (UNICEF) and Gavi. For example, in the area of immunization, UNICEF and Gavi are key U.S. partners in working toward ending preventable child deaths, which is a U.S. priority, and they play a critical role in expanding vaccine access by addressing affordability and vaccine development issues. UNICEF (a U.N. agency aiming to improve the lives of children, particularly the most disadvantaged children, to which the U.S. is the largest donor) is one of the largest purchasers of vaccines and distributes childhood vaccines worldwide, while Gavi (a multilateral financing mechanism aiming to increase access to immunization in poor countries to which the U.S. is one of the largest donors) provides funding to eligible countries to accelerate introduction of new and underused vaccines and strengthen vaccine delivery systems. These global efforts complement U.S. bilateral efforts, where in a subset of countries the U.S. provides technical assistance to immunization programs to strengthen routine immunization systems and identify areas where more equitable vaccine access may be improved. See the KFF fact sheet on global MCH and the KFF fact sheet on Gavi.13
4. U.S. multilateral engagement influences international priorities and contributes to global standard-setting.
The U.S. government shapes multilateral global health efforts not only through funding but also through its participation in governance structures and the development and execution of technical and standard-setting guidance, agreements, plans, and programs:
Funding. As mentioned above, the U.S. is often the largest or one of the largest donors to multilateral health efforts. Without U.S. core funding, many U.S.-supported multilateral organizations’ essential operations and functions would be jeopardized. Additionally, U.S. funding for “voluntary” or “non-core” contributions is also a key budget component driving global efforts. Further, U.S. policies related to funding can also greatly influence financial support for multilaterals. As mentioned above, the U.S. contribution to the Global Fund leverages other donor contributions, since U.S. law requires that the U.S. contribution cannot exceed 33% of total contributions from all donors.
Governance. The U.S. government is active in the governance structures that oversee multilateral global health organizations and initiatives, including holding permanent or rotating seats on many of their boards. It currently participates in key governance mechanisms for all of the eight key multilateral health organizations identified (see Table 2). For example, the U.S. government has a permanent Board seat on the Global Fund’s Board and is currently an alternate member of the Gavi Board, and this year, the U.S. again assumed a seat on the WHO Executive Board.
Table 2: Selected Multilateral Organizations and Initiatives Related to Global Health and Current U.S. Participation in Governance
Organization
Current U.S. Participation in Governance
Gavi
alternate member for one of the Donor Countries Governments constituency seats of the Board (rotating seat among U.S./Australia/Japan/South Korea);14,15 current seat on Board committees for Audit and Finance; Market Sensitive Decisions; and Programme and Policy16
Global Fund
permanent member of the Board;17 current seat on Board committees for Audit and Finance, Ethics and Governance (as Chair), and Strategy18
PAHO
member of the Executive Committee19 (rotating seat among member states)
TB Global Drug Facility(at Stop TB Partnership)
member of the Stop TB Partnership Board (CDC has current seat, 1 of 2 that rotates among technical agencies; USAID has current seat, 1 of 3 for financial donors)
UNAIDS
member of the Programme Coordinating Board (rotating seat among Western European and Others Group) 20
UNICEF
permanent member of the Executive Board (since 1948)21
UNFPA
member of the Executive Board (rotating seat among Western European and Other States)22
WHO
member of the Executive Board (rotating seat among the Americas region)23
NOTES: As of Jan. 25, 2019.
Technical assistance and standard-setting. The U.S. supports the role of multilaterals in technical guidance and standard-setting plans and programs in several ways. For one, the U.S. government seconds a number of employees to or designates staff to serve as liaisons to these organizations, including to WHO and PAHO.24 The U.S. Centers for Disease Control and Prevention (CDC) and the National Institutes of Health (NIH) run several WHO collaborating centres for various global health issue areas (such as global cancer control, influenza, malaria, reproductive health, and viral hemorrhagic fevers25 ). U.S. multilateral engagement also influences WHO and other international organizations that set standards related to health, such as essential medicines and recommendations on specific treatment protocols. Lastly, the U.S., as a member-state of WHO, weighs in on global plans to respond to a range of health issues, such as NCDs or various infectious diseases, as they are developed and considered for approval by the larger body.
5. The next two years will reveal much about U.S. commitment to multilateral health engagement.
With several key international meetings and replenishment conferences on the horizon, the next two years will provide a number of opportunities for assessing the level of U.S. commitment to multilateral global health efforts. For example:
In September, U.N. member states will come together at the High-Level Meeting (HLM) on Universal Health Coverage (UHC) to discuss improving access to and the quality of health care worldwide. However, this has been an area where the U.S. has shown only lukewarm involvement in the past, even as the UHC agenda has been adopted by most countries around the world and is a key component of the U.N.’s Sustainable Development Goals. U.S. participation in the HLM could either be a moment of change or one in which the U.S. maintains the status quo.
In October, the Global Fund will hold its replenishment conference for the 2020-2022 period, and in 2020, Gavi will hold its replenishment conference for the 2021-2025 period. In the past, these conferences have provided an opportunity for the U.S. government, including the Administration and Congress, to demonstrate their commitment to these multilateral financing institutions. These upcoming conferences will present a similar opportunity, though in light of recent proposed cuts to the Global Fund and Gavi by the current Administration – cuts that Congress ultimately rejected, there will likely be significant discussion between the Administration and Congress about the levels of funding the U.S. should pledge during the conferences. U.S. actions will be closely observed particularly in the case of the Global Fund replenishment, as the U.S. has always been the leading donor to the Global Fund and has used its contribution to leverage other donor investments in the Global Fund.
It will be important to keep these key facts in mind over the next two years, as discussion and debate over U.S. contributions to these and other multilateral health institutions continue.
Appendix: U.S. Contributions Related to Global Health to Selected Multilateral Organizations, FY 2008 – FY 2019
Table A: U.S. Contributions Related to Global Health to Selected Multilateral Organizations, FY 2008 – FY 2019
FY08
FY09
FY10
FY11
FY12
FY13
FY14
FY15
FY16
FY17
FY18
FY19
U.S. Contributions*
Gavi
71.9
75.0
78.0
89.8
130.0
138.0
175.0
200.0
235.0
275.0
290.0
290.0
Global Fund
840.3
1000.0
1050.0
1045.8
1300.0
1569.0
1650.0
1350.0
1350.0
1350.0
1350.0
1350.0
PAHO (assessed)
57.9
59.1
59.8
60.5
63.1
65.7
65.7
65.7
64.5
64.3
65.3
65.3
TB Global Drug Facility (at Stop TB Partnership)
14.9
15.0
15.0
15.0
15.0
14.3
15.0
15.0
15.0
15.0
13.5
15.0
UNAIDS (core)
34.7
40.0
43.0
42.9
45.0
42.8
45.0
45.0
45.0
45.0
45.0
45.0
UNFPA (core)
0.0
46.1
51.4
37.0
30.2
28.9
30.7
30.8
30.7
0.0
0.0
—
UNICEF (regular)b
128.0
130.0
132.3
132.3
131.8
125.2
132.0
132.0
132.5
137.5a
137.5
137.5
WHO (assessed)
101.4
106.6
106.6
109.4
109.4
109.9
109.9
113.9
112.8
111.4
112.9
112.9
TOTAL**
1249.1
1471.8
1536.0
1532.7
1824.5
2093.7
2223.3
1952.5
1985.5
1998.2
2014.2
2015.7
Additional U.S. Contributionsb
PAHO (voluntary)
6.1
6.1
2.1
6.6
23.7
12.5
3.0
22.5
13.1
—
—
—
UNAIDS (non-core)
5.2
6.0
5.8
2.0
6.5
21.2
14.4
6.6
22.6
37.4
—
—
UNFPA (non-core)
0.0
0.0
5.9
1.4
3.6
6.9
17.8
45.0
32.6
5.8c
—
—
WHO (voluntary)
112.0
110.0
304.4
112.4
222.4
221.1
101.7
324.3
228.0
401.1
—
—
NOTES: FY13 includes the effects of sequestration. FY18 and FY19 are preliminary estimates. Some global health funding that is not specified in the appropriations bills but determined at the agency level is not yet known for FY18 and FY19 and is assumed to remain at prior year levels.– indicates amount is not yet known or set.* indicates represents funding (base and supplemental) provided through the State Department, USAID, CDC, NIH, and DoD as specified in appropriations or sometimes determined at the agency level including for U.S. contributions that are considered “regular,” “core,” or “assessed” contributions, which are usually identified in congressional budget justifications and/or appropriations legislation and related material and specifically directed by Congress. UNFPA amounts reflect funding provided after funding level adjustments due to congressional requirements, including presidential determinations under the Kemp-Kasten amendment, have been applied to appropriated funding levels; the FY19 UNFPA contribution amount is still to be determined.** indicates the total does not include additional (other resources, non-core, or voluntary) contributions provided at the agency level; these are typically counted as bilateral spending since they usually support specific projects or aims identified by the donor.a includes $5 million in funding designated for female genital mutilation.b indicates that the U.S. also provides additional contributions to UNICEF but that since within this amount it is difficult to identify the portion that is directed to health versus non-health activities, they are not reflected in this table.c indicates funding is due to multi-year agreements.
Endnotes
For development assistance more broadly, this is discussed in Ikenberry, “Is American Multilateralism in Decline?,” APSA, 2003; Biscaye, et al, “Relative Effectiveness of Bilateral and Multilateral Aid on Development Outcomes,” Review of Development Economics, 2016; ODI, “Bilateral versus multilateral aid channels Strategic choices for donors,” 2016; CGD, Realizing the Power of Multilateralism in US Development Policy, 2016. ↩︎
Represents organizations receiving funding (base and supplemental) provided through the State Department, USAID, CDC, NIH, and DoD as specified in appropriations or sometimes determined at the agency level, including for U.S. contributions that are considered “regular,” “core,” or “assessed” contributions, which are usually identified in congressional budget justifications and/or appropriations legislation and related material and specifically directed by Congress. ↩︎
Organizations included in the analysis include Gavi, the Vaccine Alliance; the Global Fund; PAHO; the TB Global Drug Facility; UNAIDS; UNFPA; UNICEF; and WHO. ↩︎
U.S. contributions that are considered “regular,” “core,” or “assessed” contributions are usually identified in congressional budget justifications and/or appropriations legislation and related material and specifically directed by Congress. ↩︎
When calculating the proposed cut for FY 2018, the FY 2017 level did not include UNFPA funding; Congress provided $32.5 million for a U.S. contribution to UNFPA, which was withheld due to a presidential determination under the Kemp-Kasten amendment. See KFF, UNFPA Funding & Kemp Kasten: An Explainer. ↩︎
When calculating the proposed cut for FY 2019, the FY 2018 level did not include UNFPA funding; Congress provided $32.5 million for a U.S. contribution to UNFPA, which was withheld due to a presidential determination under the Kemp-Kasten amendment. See KFF, UNFPA Funding & Kemp Kasten: An Explainer. ↩︎
KFF analysis of documents from Gavi, Global Fund, PAHO, TB Global Drug Facility, UNFPA, UNICEF, UNAIDS, and WHO. ↩︎
A new interactive tool from KFF estimates total household health spending for individuals and families in the U.S., including costs that are often less visible to consumers.
Users can generate scenarios based on family size, income level, insurance source, and health status. In addition to estimating direct costs like deductibles and copayments, the tool highlights indirect spending on health care, such as state and federal taxes paid to fund public programs like Medicare and Medicaid, as well as employer contributions toward health insurance premiums and Medicare payroll taxes.
The typical non-elderly family in the U.S. spends $8,200 per year, or 11% of their income, on health care – not including employer contributions – but this can vary substantially by income, type of insurance, and health status.
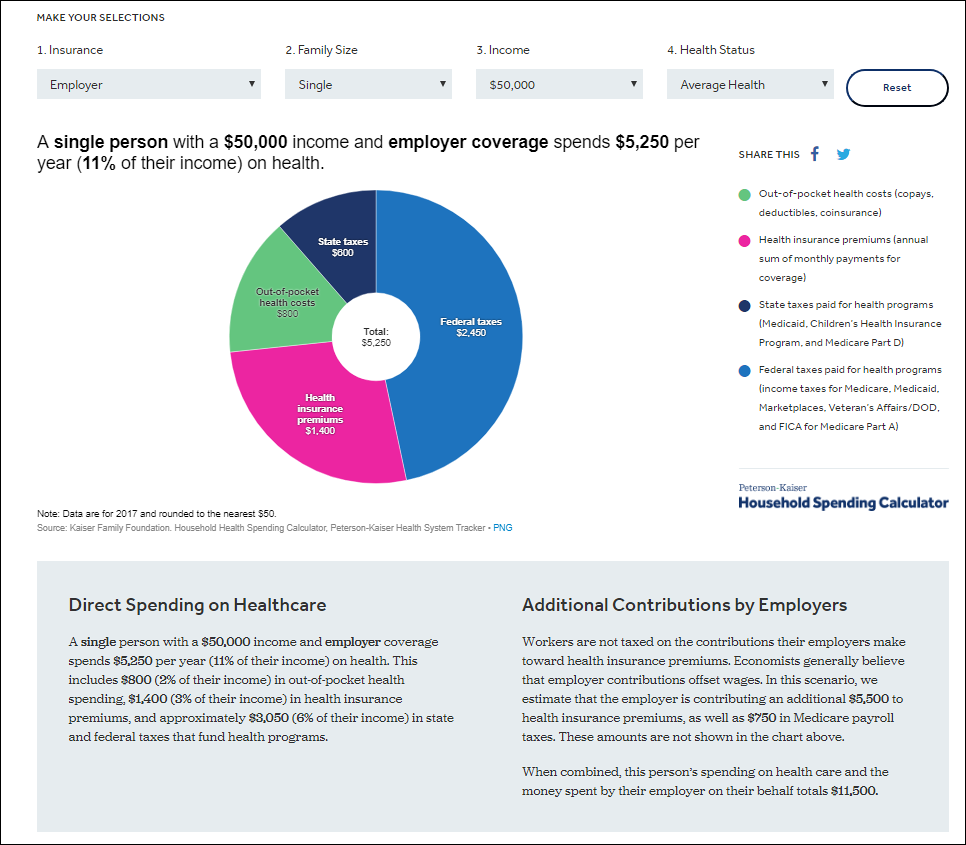
For example, a person with employer coverage earning $50,000 annually spends on average $5,250, or roughly 11% of her income, on health care. This includes $800 per year in out-of-pocket costs, a $1,400 premium contribution, and $3,050 in state and federal taxes to fund health programs.
Her employer contributes even more, including an additional $5,500 toward her annual premium and $750 in Medicare payroll tax. Economists generally believe that employer spending on health benefits and payroll taxes depresses wages, but workers do not directly observe that cost.
The calculator also demonstrates the variability of health spending by insurance source. If the aforementioned single person earning $50,000 annually obtains coverage on the individual market instead of through her employer, she can expect to spend 20% of her income on health care.
Household health spending also increases significantly when health status worsens, largely due to the additional out-of-pocket costs associated with greater use of health care services. A family of four in good health with employer-sponsored coverage and earning $100,000 per year spends about 12% of their income on health care. If at least one member of the family reports worse health, household health spending increases to 15% of their income.
The Household Spending Calculator is available on the Peterson-Kaiser Health System Tracker, a partnership between the Peterson Center on Healthcare and KFF that monitors the U.S. health system’s performance on key quality and cost measures.
If states were able to receive enhanced Affordable Care Act matching funds for “partial” expansions of Medicaid, fewer people would get health coverage and the federal government would spend more, compared to a traditional expansion under the law, KFF explains in a new brief.
The explainer describes how a partial expansion would differ from a traditional ACA Medicaid expansion and summarizes some of the expected effects. It also documents which states have sought federal approval for a partial expansion, and the result.
Under a traditional ACA Medicaid expansion, states extend Medicaid coverage to individuals with incomes up to 138 percent of the federal poverty level. The federal government then covers the vast majority of the cost (93% in 2019, and 90% in 2020 and beyond), with the state paying the rest.
Some states are seeking to implement their Medicaid expansion with enhanced federal matching funds, but limit coverage to adults with incomes below the poverty line, leaving adults between 100 percent and 138 percent of poverty in the federal ACA marketplace. Covering those individuals in the ACA marketplace, which is subsidized wholly by the federal government, would limit Medicaid enrollment and save state dollars, but could result in limited coverage and increased federal costs relative to full expansion.
CMS has not approved previous waiver requests seeking enhanced matching funds for partial expansions in Arkansas and Massachusetts. Both states had already implemented full expansions but wanted to roll eligibility back to 100 percent of poverty. Utah, where full expansion was adopted via ballot initiative in November, has a waiver request pending with the Centers for Medicare and Medicaid Services (CMS) for a partial Medicaid expansion with enhanced ACA matching funds.
Also available is a new KFF brief providing an overview of the different approaches states have taken in adopting Medicaid expansion.
The Affordable Care Act (ACA) provides enhanced federal matching funds to states that expand Medicaid to nonelderly adults up to 138% of the federal poverty level (FPL, $17,236/year for an individual in 2019). The ACA enhanced match (93% in 2019, and 90% in 2020 and thereafter) is substantially higher than states’ traditional Medicaid matching rate.1 A few states have sought Section 1115 demonstration waiver authority from the Centers for Medicare and Medicaid Services (CMS) to receive the substantially higher ACA enhanced match while limiting coverage to individuals at 100% FPL, instead of covering the full 138% FPL ACA group. To date, CMS has allowed states to receive the ACA enhanced Medicaid matching funds only if the entire expansion group is covered. CMS has not approved waiver requests seeking enhanced ACA matching funds for a partial coverage expansion in Arkansas or Massachusetts, while a request is pending in Utah. This brief explores the current rules for partial expansion and explains some of the potential implications for financing and coverage if CMS approves waivers to allow for partial expansion with enhanced matching funds.
“Partial” Medicaid expansions with ACA enhanced matching funds could limit states’ spending but cover fewer people at a higher federal cost compared to traditional ACA full expansions.
Coverage. Partial expansion could result in less coverage overall, and less coverage in Medicaid, compared to a full ACA Medicaid expansion. Individuals from 100-138% FPL in Marketplace coverage could face higher out-of-pocket costs and fewer covered benefits compared to their coverage under a full Medicaid expansion.
Costs. Partial expansion with the ACA enhanced match could result in lower state and federal spending for Medicaid and higher federal spending in the Marketplace that could result in higher federal costs overall compared to a full ACA Medicaid expansion since the federal government pays full costs of subsidies in the Marketplace and Medicaid costs are shared between states and the federal government. There is some uncertainty around net federal cost implications as changes in enrollment are uncertain and there is variation between Medicaid and subsidy costs across states. In addition, states could experience differential cost and coverage implications from a partial expansion with ACA enhanced funds relative to where they are today, depending on their current Medicaid expansion status.
Looking ahead. New legislation in Utah calls for the state to submit an additional waiver request that adds per capita capped financing to its current proposal. States will be watching for developments in Utah as well as additional guidance from CMS, particularly related to how partial expansion may be tied to broader aggregate financing caps in Medicaid.
When can states receive enhanced federal matching funds for expanding Medicaid coverage under the ACA?
To date, CMS has allowed states to receive the ACA enhanced Medicaid matching funds only if the entire expansion group is covered. The ACA describes the Medicaid expansion coverage group as including all nonelderly adults up to 138% FPL.2 The Supreme Court’s decision about the ACA’s constitutionality effectively made Medicaid expansion optional for states. However, the authority for the ACA expansion group remains in the mandatory part of the statute, and states that adopt the expansion must provide coverage for “all individuals” described in the ACA expansion group.3 CMS guidance issued in 2012 concludes that “Congress directed that the enhanced matching rate be used to expand coverage to [138%] of FPL. The law does not provide for a phased-in or partial expansion.”
States that want to extend coverage to a level less than the 138% FPL required by the ACA may do so, but can only receive their regular Medicaid match, and not the enhanced match, for that coverage. CMS’s 2012 guidance provides that these partial expansions would be considered at the state’s regular federal matching rate, which is substantially lower than the ACA enhanced match available for a full expansion. States currently have flexibility within current law to expand coverage for parents above minimum thresholds without a waiver. To date, Wisconsin is the only state to extend coverage to all non-elderly adults (parents and childless adults) up to 100% FPL without implementing the full ACA Medicaid expansion. Wisconsin uses a combination of state plan4 and Section 1115 waiver5 authority to implement this coverage, and the state receives federal funds at its traditional Medicaid matching rate for this coverage (59% in FY 2020), not the enhanced ACA Medicaid matching rate, because it does not cover individuals from 101-138% FPL who would be eligible under a full ACA expansion.6
CMS has not approved waiver requests seeking enhanced ACA matching funds for a partial coverage expansion in Arkansas and Massachusetts. Both of these states have implemented the full ACA expansion and sought to roll back coverage from 138% FPL to 100% FPL while continuing to receive the ACA enhanced federal matching funds. In March 2018, CMS did not make a decision on Arkansas’ request for partial expansion with enhanced ACA funds when it approved other terms of the state’s waiver amendment request.7 In June 2018, CMS stated that it was “not approving at this time” Massachusetts’ similar request for partial expansion with enhanced ACA funds. Section 1115 authority permits the HHS Secretary to allow states to use federal Medicaid funds in ways that are not otherwise allowed under federal law, as long as the Secretary determines that the initiative is an “experimental, pilot, or demonstration project” that “is likely to assist in promoting the objectives of the program.” So, states and CMS would need to indicate, and plan to evaluate, how a partial expansion waiver with enhanced matching funds would promote the objectives of the Medicaid program.
Utah currently has a waiver request for partial expansion with enhanced ACA funds pending with CMS. In addition, the state passed legislation in February calling for the state to submit additional waiver requests, described in Box 1.
Box 1: Utah’s Proposal for Partial Expansion with Enhanced ACA Funds
In February 2019, Utah enacted S.B. 96, which substantially changes the state law established by a November 2018 ballot initiative that had adopted the full ACA Medicaid expansion.8 According to the new Utah legislation, the state must seek a Section 1115 waiver to implement a partial expansion under various scenarios that build on the state’s pending June 2018 Section 1115 waiver amendment request.9 The legislation directs the state to seek authority from CMS to:
Implement a partial coverage expansion at the state’s regular matching rate to a capped number of nonelderly adults up to 100% FPL;10 and
Implement a partial coverage expansion with ACA enhanced matching funds to a capped number of nonelderly adults up to 100% FPL, with federal funding for the expansion administered “according to a per capita cap.”11
If CMS does not approve the state’s request under the latter scenario by January 1, 2020,12 the legislation directs the state to request, by March 15, 2020, a full Medicaid expansion up to 138% FPL with an enrollment cap, which would include the ACA enhanced federal matching funds. The state’s waiver request to CMS also must include “additional flexibilities and cost controls, including cost sharing tools” and an employment and training program for expansion adults (modeled on the SNAP work requirement program). If this waiver authority is not approved by CMS, a full Medicaid expansion, without an enrollment cap, and with ACA enhanced matching funds, will be effective on July 1, 2020.
What are some of the potential effects of allowing states to adopt a partial Medicaid expansion with enhanced federal matching funds?
Partial expansion could result in less coverage overall, and less coverage in Medicaid, compared to a full ACA Medicaid expansion. Without a full Medicaid expansion, most individuals from 100-138% FPL would be eligible for Marketplace subsidies but could face higher premiums and cost sharing compared to Medicaid.13 These higher premiums would likely result in fewer individuals enrolling in coverage compared to full Medicaid expansion. Research shows that increases in premiums and cost sharing for low-income populations result in decreased enrollment, higher numbers of uninsured, decreased utilization of needed services and increased administrative costs for states. Studies examining the 100-138% FPL population in expansion and non-expansion states found that Medicaid expansion coverage produced far greater reductions than subsidized Marketplace coverage in average total out-of-pocket spending, average out-of-pocket premium spending, and average cost-sharing spending.
Partial expansion with the ACA enhanced match could result in higher federal costs compared to a full ACA Medicaid expansion. Shifting more enrollees from a full Medicaid expansion to Marketplace coverage could increase federal costs because the federal government pays 100 percent of the costs for subsidies in the Marketplace, while Medicaid costs are shared by the states and the federal government. In addition, costs of coverage in the Marketplace could outweigh federal Medicaid costs because Medicaid is low-cost compared to private insurance, largely due to lower Medicaid payment rates for providers. However, there would be a scenario where federal costs would decline if coverage losses outweigh the increased federal costs of coverage in the Marketplace.
In addition, studies show that the full ACA Medicaid expansion supports and strengthens the Marketplaces. Providing Medicaid coverage for the 100-138% FPL group improves the Marketplace risk pool, resulting in lower Marketplace premiums. For example, one study found that Marketplace premiums are about 7% lower in expansion states, compared to non-expansion states.14
States could experience differential cost and coverage implications from a partial expansion with ACA enhanced funds relative to where they are today, depending on their current Medicaid expansion status. Implications for national changes in coverage and cost could depend on which states might adopt a partial expansion with enhanced ACA funds, if available.
Current non-expansion states that would adopt a partial expansion with enhanced ACA financing could have coverage gains that fall short of what would be expected under full Medicaid expansion, although these states would have coverage gains relative to no expansion. Lower coverage in partial expansion compared to full expansion could mitigate the fiscal benefits for state budgets and economies as well as reductions in uncompensated care.
Current expansion states that choose to roll back coverage under a partial expansion could see an increase in uninsured if some enrollees in the 100-138% FPL group do not enroll in Marketplace coverage due to higher out-of-pocket costs. Federal costs would be higher for enrollees who do enroll in the Marketplace compared to Medicaid.
What is next for states’ requests for partial Medicaid expansion with enhanced ACA matching funds?
States will be watching for developments in Utah as well as additional guidance from CMS. In the near-term, it appears that Utah will pursue an additional amendment to its existing waiver, requesting a partial expansion up to 100% FPL, with an enrollment cap, at the state’s regular Medicaid matching rate.15 The state also will continue to pursue its pending amendment seeking a work requirement, among other provisions, for the partial expansion.16 The second phase of Utah’s waiver calls for partial expansion with an enrollment cap at the ACA enhanced match but with aggregate limits on federal funding administered through a per capita cap financing model.17
These broader financing changes included in the Utah proposal might relate to January 2019 media reports that CMS may be working to release new Section 1115 waiver guidance to states on Medicaid “block grants” or aggregate spending caps in exchange for unspecified additional state “flexibility.” Broader financing changes including Medicaid per capita cap and block grant proposals were debated as part of ACA repeal and replace legislation that was defeated in Congress in 2017. Debate over these legislative proposals showed that reduced funding and new “flexibility” under a capped financing approach could result in less coverage, fewer benefits, and/or higher out-of-pocket costs for enrollees relative to traditional Medicaid as states would have to limit program spending to fit within a pre-set aggregate cap.
The statute specifies 133% FPL but also includes a 5 percentage point FPL income disregard, bringing the eligibility limit up to 138% FPL. The ACA expansion group excludes individuals who are age 65 or older, pregnant, dually eligible for Medicare, or otherwise described in another mandatory coverage group. ↩︎
A state plan for medical assistance must. . . provide for making medical assistance available. . . to all individuals. . . beginning January 1, 2014, who are under 65 years of age, not pregnant, not entitled to, or enrolled for, benefits under part A of [Medicare], or enrolled for benefits under part B of [Medicare], and are not described in a previous subclause of this clause, and whose income. . . does not exceed 133 percent of the poverty line. . . .“ 42 U.S.C. § 1396a (a)(10)(A)(VIII) (emphasis added). ↩︎
Wisconsin had a Section 1115 waiver that expanded Medicaid coverage before the ACA allowed states to receive federal matching funds for coverage expansions without a waiver. Instead of adopting the full ACA expansion and receiving the accompanying enhanced federal matching funds in 2014, Wisconsin chose to modify its existing waiver and provide coverage for childless adults up to the poverty level at its traditional Medicaid matching rate. CMS Special Terms and Conditions, #11-W-00293/5, Wisconsin Badger Care Reform (current approval period Oct. 31, 2018-Dec. 31, 2023), https://www.medicaid.gov/Medicaid-CHIP-Program-Information/By-Topics/Waivers/1115/downloads/wi/wi-badgercare-reform-ca.pdf. ↩︎
Arkansas has indicated that it is continuing to discuss approval for a partial expansion with enhanced ACA matching funds with CMS. ↩︎
Utah voters passed a ballot measure in November 2018 that requires the state to expand Medicaid coverage under the ACA to 138% FPL beginning April 1, 2019, and increases the state sales tax to finance the expansion. ↩︎
Utah Code § § 26-18-3.9, (2)(b), 26-18-415 (as amended by S.B. 96, Feb. 11, 2018), https://le.utah.gov/~2019/bills/static/SB0096.html. Utah’s June 2018 pending waiver amendment would cover adults ages 19 to 64 up to 95% FPL (effectively 100% FPL with the 5 percentage point FPL disregard). The pending waiver amendment also seeks CMS approval for a work requirement and an enrollment cap on the expansion group. The state estimates that 70,000 to 90,000 individuals would gain coverage under this waiver amendment. The pending waiver amendment also seeks to waive EPSDT for 19 and 20 year olds and authority for mandatory Medicaid premium assistance for individuals with access to ESI. Utah’s existing Section 1115 waiver covers two groups that would be subsumed into the new partial expansion group if the June 2018 waiver amendment is approved: (1) the Primary Care Network (PCN) group and (2) the Targeted Adult group. The PCN group was first implemented in 2002, and currently provides a limited benefit package of primary and preventive care services to a capped number (to be closed to new enrollment at the state’s election or upon reaching 25,000 average annual enrollment) of nonelderly parents with incomes above state plan amounts up to 100% FPL and childless adults from 0-100% of poverty. The Targeted Adult group, added in November 2017, provides full state plan benefits to a capped number (to be closed to new enrollment at the state’s election) of childless adults up to 5% FPL who are chronically homeless or involved in the criminal justice system and in need of behavioral health treatment. ↩︎
Utah Code § 26-18-3.9, (4) (as amended by S.B. 96, Feb. 11, 2018), https://le.utah.gov/~2019/bills/static/SB0096.html. The state legislation does not explain how such a per capita cap would operate other than to say that it would include an annual inflationary adjustment, account for “differences in cost among categories of Medicaid expansion enrollees,” and provide “greater flexibility to the state than the current Medicaid payment model. This waiver request also would seek to limit presumptive eligibility for the expansion group and impose a lock-out period if an expansion enrollee violated “certain program requirements as defined by the department,” 12-month continuous eligibility, and housing supports. ↩︎
This section is only contingent on CMS approval of the partial expansion with an enrollment cap and enhanced ACA matching funds; it does not require CMS approval of the financing “per capita cap.” ↩︎
The vast majority of individuals with incomes 100-138% FPL would be eligible for tax credits to subsidize the cost of coverage in the Marketplace, though some (e.g., people with an offer of employer coverage) may not qualify for tax credits. ↩︎
These studies pre-date policy changes that eliminated the cost sharing reduction (CSR) payments. Without CSR, adding individuals with incomes 100-138% FPL to the Marketplace could have different implications. ↩︎
This section is only contingent on CMS approval of the partial expansion with an enrollment cap and enhanced ACA matching funds; it does not require CMS approval of the financing “per capita cap.” The state legislation also requires this waiver request to include limits on presumptive eligibility, a lock-out period for enrollees who violate certain program requirements to be specified by the state, 12-month continuous eligibility, and housing supports. Utah Code § 26-18-3.9, (4) (as amended by S.B. 96, Feb. 11, 2018), https://le.utah.gov/~2019/bills/static/SB0096.html. If partial expansion with an enrollment cap and enhanced matching funds is not approved by January 1, 2020, the state law directs Utah to seek authority for a full Medicaid expansion up to 138% FPL, with an enrollment cap and “additional flexibilities and cost controls” including cost-sharing and a work requirement. The state legislation also requires this waiver request to include mandatory Medicaid premium assistance for enrollees with access to employer sponsored insurance, delivery of benefits through accountable care organizations with physical and behavioral health services integration, limits on presumptive eligibility, and a lock-out period for enrollees who violation certain program requirements to be specified by the state. If expansion to 138% FPL with a work requirement and mandatory ESI premium assistance is not approved by July 1, 2020, full Medicaid expansion shall take effect. Utah Code § 26-18-3.9, (5) (as amended by S.B. 96, Feb. 11, 2018), https://le.utah.gov/~2019/bills/static/SB0096.html. ↩︎
Analysis Finds that Medications for Hepatitis C and HIV/AIDS Are the Costliest Group of Outpatient Prescription Drugs for Medicaid, While Diabetes Drugs Have Posted the Sharpest Rise in Costs
Antiviral medications, including those that treat hepatitis C and HIV/AIDS, cost the Medicaid program more money (before rebates) than any other group of outpatient prescription drugs for each year from 2014 to 2017, according to a new KFF analysis.
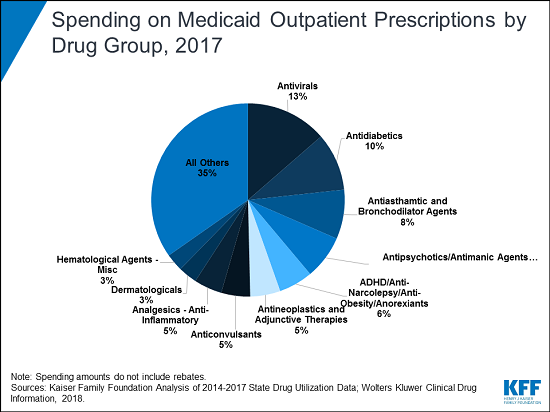
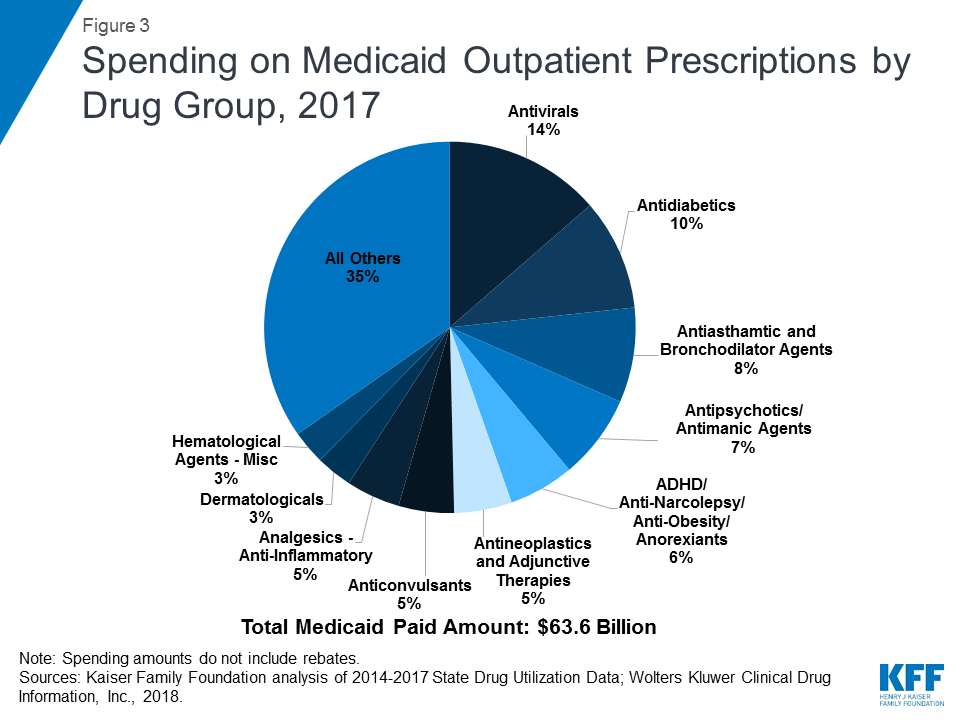
The analysis of utilization and spending trends finds that antivirals accounted for more than 13 percent of the $63.6 billion in Medicaid outpatient drug spending pre-rebates in 2017 — a level disproportionate to their utilization and a reflection of the high cost of these drugs. Drugs for diabetes were the second most costly group that year, accounting for 10 percent of Medicaid outpatient drug spending before rebates. Spending for diabetes drugs rose faster than for any other group, nearly doubling from 2014 to 2017 — largely due to the rising price of insulin.
Although outpatient drugs account for a small share of all Medicaid spending (6%, net of rebates), spending on this service is expected to grow faster than most other Medicaid services in the next decade, prompting policymakers at the national and state levels to explore new ways to curb such costs.
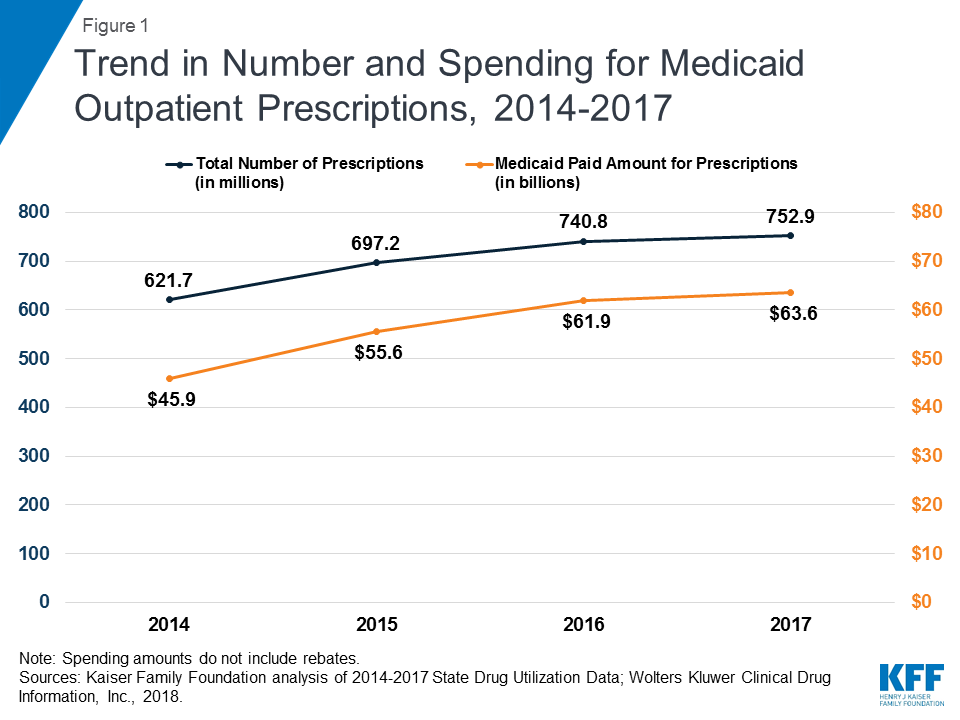
Over the recent four-year period, and with implementation of Medicaid expansion in many states, outpatient drug utilization in Medicaid increased 21 percent, from 621.7 million prescriptions in 2014 to 752.9 million prescriptions in 2017. The ten most frequently prescribed drug groups were the same every year, although the order changed. Antidepressants, asthma drugs and opioids (including medications used to treat addiction) nearly always ranked in the top three.
Amid an ongoing national fight against the opioid epidemic, the number of opioid prescriptions was lower in 2017 than in 2014. A greater share in 2017 were for buprenorphine, a medication used to treat opioid addiction as well as pain, the analysis finds.
Generic drugs accounted for the vast majority of Medicaid outpatient drug prescriptions each year, while brand drugs accounted for the vast majority of spending. Biologics, a type of drug or vaccine derived from living organisms, accounted for less than one percent of prescriptions but more than 10 percent of spending before rebates each year from 2014 to 2017.
In return for Medicaid coverage of their products, manufacturers must enter into a rebate agreement with the Secretary of the Department of Health and Human Services. Manufacturers pay these statutory rebates quarterly to states, who share the savings with the federal government. States also may negotiate supplemental rebates with manufacturers.
The Medicaid prescription drug benefit is an optional benefit that all states provide. Outpatient prescription drugs are an important component in the management of acute and long-term health issues. Without Medicaid, many prescription drugs would be prohibitively expensive to beneficiaries the program serves.
This analysis examines Medicaid outpatient prescription drug utilization in terms of prescriptions and spending before rebates over the 2014 to 2017 period. Key takeaways include:
Although outpatient drugs account for a small share of Medicaid spending, spending on this service before rebates increased by 21% in 2015 and grew an additional 11% in 2016. Though it grew more slowly in 2017, it is expected to grow faster than most other Medicaid services in the next 10 years. Because states must balance their budgets, ongoing increased spending on Medicaid prescription drugs is a policy concern, prompting states to consider ways to reduce drug spending.
Utilization, measured in terms of the number of prescriptions, increased 21% from 2014 to 2017, with faster growth from 2014-15 as the ACA was implemented and slower growth in later years. The ten most frequently prescribed drug groups are the same every year, although the order changes.
Opioid analgesics were the most prescribed drug group in 2014, but opioids as a share of total number of Medicaid prescriptions declined over time. In addition, buprenorphine composes a growing share of opioid analgesic prescriptions during the period.
By 2017, antidepressants were the most prescribed drug group, in part reflecting significant behavioral health needs among the Medicaid expansion population.
Medicaid spending before rebates increased 39% from 2014 to 2017; similar to use, growth was with faster from 2014-15 and slower growth in later years. Eight of the ten most costly drug groups are the same every year, although the order changes.
Antivirals were the most costly drug group before rebates every year from 2014 to 2017, accounting for more than 13% of Medicaid outpatient drug spending in 2017. Spending on antivirals, and especially hepatitis C drugs, is disproportionate to their utilization.
Antidiabetics grew as a share of spending becoming the second largest share by 2017. This increase is largely due to the price increases of insulins over this time period.
Generic drugs accounted for the vast majority of prescriptions over the 2014 to 2017 period, while brand drugs accounted for the vast majority of spending. Though the volume of generic drugs has increased faster than brand, brand drugs account for a growing share of spending over time. This pattern reflects national trends caused by the launch of expensive new drugs during the period.
Although biologics accounted for less than one percent of prescriptions, they accounted for more than ten percent of spending before rebates each year from 2014 to 2017.
Introduction
Although outpatient prescription drugs net of rebates account for only 6% of Medicaid spending, spending on this service net of rebates increased by 25% in 2014, grew an additional 13% in 20151 , and is expected to grow faster than other Medicaid services in the next 10 years.2 This growth in spending in recent years is due in part to the launch of high cost drugs, such as the hepatitis C drugs Sovaldi and Harvoni, as well as the overall growth in Medicaid spending related to the ACA expansion. Because states must balance their budgets, ongoing increased spending on Medicaid prescription drugs is a policy concern, prompting states to consider ways to reduce drug spending.3 Understanding patterns and trends in drug spending is crucial to effectively managing the benefit and developing strategies to address high drug costs.
This issue brief examines Medicaid drug spending and utilization from 2014 through 2017, the most recent complete data available. As described in more detail in Appendix B, it is based on Medicaid State Drug Utilization Data merged with Wolters Kluwer Clinical Drug Information, Inc. data to analyze trends by drug group and by brand or generic status. It also incorporates data from the Food and Drug Administration (FDA) to analyze trends among biologics. Because of data restrictions, spending does not reflect rebates. This analysis updates previous analysis of Medicaid outpatient prescription drugs.4
Background: Structure of the Medicaid Prescription Drug Benefit
Under federal law establishing the Medicaid Drug Rebate Program, in order for a drug to qualify for federal statutory Medicaid matching funds, manufacturers must sign an agreement with the Secretary of Health and Human Services stating that they will rebate a specified portion of the Medicaid payment for the drug to the states, who in turn share the rebates with the federal government. In return, Medicaid must cover almost all FDA-approved drugs that those manufacturers produce.5 Because most manufacturers participate in the Medicaid Drug Rebate Program,6 Medicaid essentially maintains an open formulary in which all drugs are covered. However, state Medicaid programs can and do implement drug utilization management techniques, such as preferred drug lists and prior authorizations, to manage utilization and spending.
In addition to federal statutory rebates, most states negotiate supplemental rebates. Both statutory and supplemental rebates account for a sizeable share of prescription drug spending, lowering aggregate drug spending by about 55% in 2017.7 The specific rebate on a given drug is proprietary for both statutory and supplemental rebates. Because of this, it is not possible to include them in this analysis of trends by drug or drug group.
The Medicaid prescription drug benefit is an optional benefit that all states provide. The state may provide the benefit in a fee-for-service environment, or through managed care. Medicaid beneficiaries8 typically fill an outpatient prescription at a pharmacy, with minimal or no copay, although sometimes a medical professional administers the outpatient drug. States that provide the benefit in a fee-for-service environment reimburse the pharmacy or outpatient setting for the prescription. States that provide the benefit through managed care pay a capitated payment to the managed care company, which reimburses the pharmacy or outpatient setting either directly or through a pharmacy benefit manager.
Trends in Prescription Drug Utilization and Spending
Medicaid outpatient drug utilization increased from 621.7 million prescriptions in 2014 to 752.9 million in 2017. Similarly, Medicaid spending before rebates also increased from $45.9 billion in 2014 to $63.6 billion in 2017. During this period, both utilization and spending increased more quickly between 2014 and 2015 as Medicaid expansion was implemented and the number of beneficiaries grew. Growth then slowed between 2015 and 2016 and again between 2016 and 2017. (Figure 1)
Figure 1: Trend in Number and Spending for Medicaid Outpatient Prescriptions, 2014-2017
Trends by Drug Group
Though there are over 90 distinct drug groups represented in the Medicaid pharmacy benefit from 2014 through 2017, the ten most frequently prescribed and ten most costly drug groups consistently account for a disproportionate share of Medicaid outpatient drug utilization and spending. The ten most frequently prescribed groups accounted for nearly half of all prescriptions in all years. The ten most costly drug groups accounted for about two thirds of Medicaid spending before rebates from 2014 through 2017 (See Appendix Tables A1 and A2). Thus, to examine trends in drugs driving utilization and spending, the figures and tables focus on the ten most prescribed and ten most costly groups.
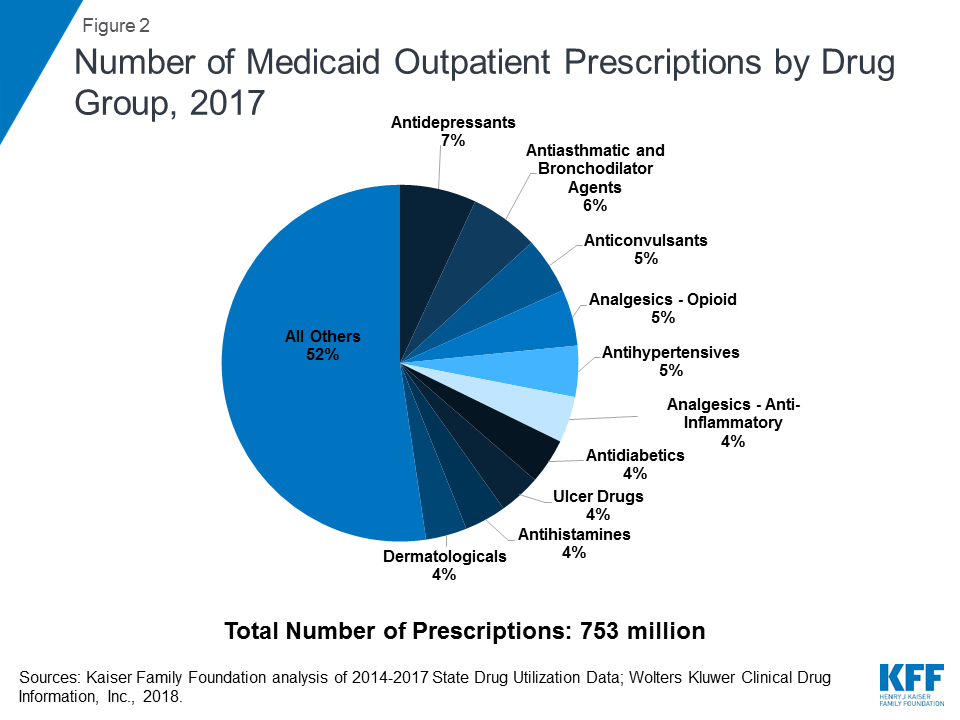
As shown in Table 1, the ranking of drug groups by number of prescriptions is relatively stable during the period, with the same groups composing the ten most prescribed drug groups each year from 2014 through 2017. Additionally, the same groups (Antiasthmatic & Bronchodilator Agents, Opioid Analgesics, Antidepressants, and Anticonvulsants) make up the top four drug groups by utilization every year. However, in recent years, antidepressant use accounted for the largest number of prescriptions, holding the top most frequently prescribed spot from 2015 through 2017. By 2017, antidepressants account for nearly 7% of total Medicaid prescriptions. (Figure 2) Medicaid expansion at least in part explains the increased use of antidepressants, as behavioral health needs, with depression and anxiety in particular, were common amongst the expansion population, and the ACA requires that Medicaid provide behavioral health treatment.9
Table 1: Rankings of Top Drug Groups by Number of Medicaid Prescriptions
Drug Group
Typical Usage
Ranking by Year
2014
2015
2016
2017
Analgesics – Opioid
Narcotic pain killers
1
3
3
4
Antiasthmatic & Bronchodilator Agents
Treats asthma & COPD
2
2
2
2
Antidepressants
Treats depression
3
1
1
1
Anticonvulsants
Treats epileptic seizures
4
4
4
3
Antihypertensives
Treats high blood pressure
5
5
5
5
Dermatologicals
Treats skin disorders
6
7
10
10
Analgesics – Anti-Inflammatory
Non-narcotic pain killers
7
6
6
6
Antihistamines
Allergy treatment and nausea suppressants
8
10
9
9
Ulcer Drugs
Treats ulcers
9
9
8
8
Antidiabetics
Treats diabetes
10
8
7
7
Source: Kaiser Family Foundation analysis of Medicaid State Drug Utilization Data, 2014-2017; Wolters Kluwer Clinical Drug Information, Inc., January 2018.
Figure 2: Number of Medicaid Outpatient Prescriptions by Drug Group, 2017
Similar to utilization, the composition of the ten most costly drug groups is relatively stable over the period, with eight of the ten groups being the same every year. (Table 2) During the period of study, antivirals accounted for the largest share of drug spending in all years, and antidiabetics grew as a share of spending to account for the second largest share of spending by 2017. (Figure 3) Although order changed, the other three groups in the top five most costly drug groups remained the same over the study period: Antipsychotic/Antimanic Agents, Antiasthmatic & Bronchodilator Agents, and ADHD/Anti-Narcolepsy/Anti-Obesity/Anorexiants. Additionally, four of the most prescribed drug groups are also four of the most costly drug groups each year: Antiasthmatic & Bronchodilator Agents, Antidiabetics, Anticonvulsants, and Dermatologicals.
Figure 3: Spending on Medicaid Outpatient Prescriptions by Drug Group, 2017
Table 2: Rankings of Top Drug Groups by Medicaid Spending
Drug Group
Typical Usage
Ranking by Year
2014
2015
2016
2017
Antivirals
Treats viral infections
1
1
1
1
Antipsychotics/Antimanic Agents
Treats psychosis and bipolar disorder
2
2
3
4
Antiasthmatic & Bronchodilator Agents
Treats asthma and COPD
3
4
4
3
ADHD/ Anti-Narcolepsy/Anti-Obesity/ Anorexiants
Treats ADHD, Sleep, and Eating Disorders
4
5
5
5
Antidiabetics
Treats diabetes
5
3
2
2
Anticonvulsants
Treats epileptic seizures
6
6
6
7
Antineoplastics & Adjunctive Therapies
Chemotherapy
7
7
7
6
Analgesics – Opioid
Narcotic pain killers
8
8
10
12
Dermatologicals
Treats skin disorders
9
9
9
9
Hematological Agents – Misc.
Treats blood diseases
10
11
11
10
Analgesics –Anti-Inflammatory
Non-narcotic, anti-inflammatory pain killers
11
10
8
8
Note: Medicaid spending used to determine rankings does not include rebates.Source: Kaiser Family Foundation analysis of Medicaid State Drug Utilization Data, 2014-2017; Wolters Kluwer Clinical Drug Information, Inc., January 2018.
Antivirals
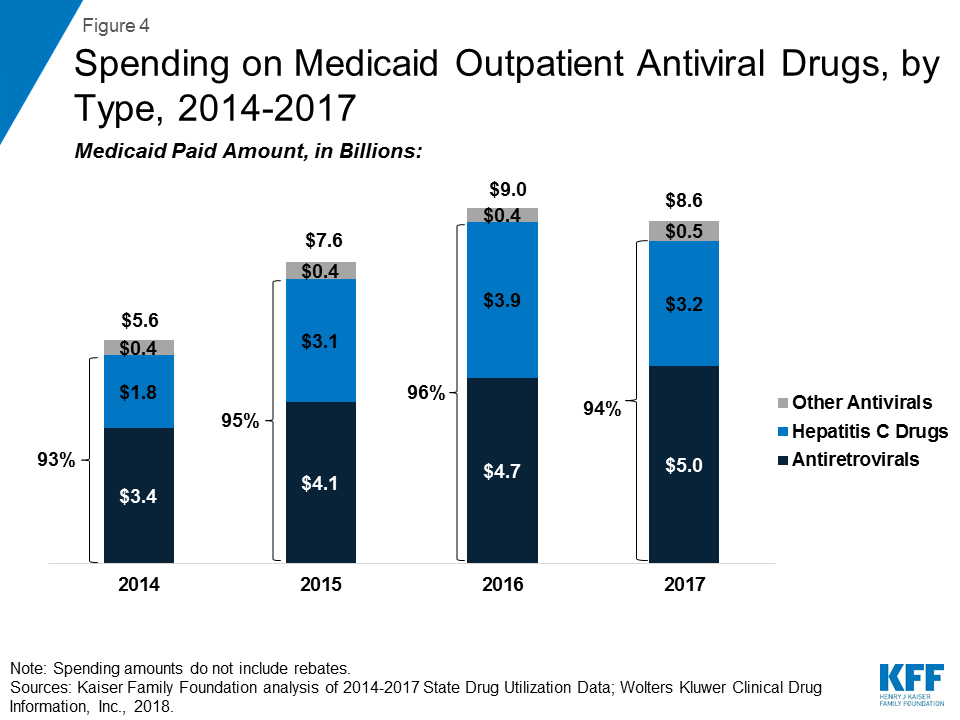
Over the entire period, antivirals are consistently the most costly drug group, accounting for 14% of Medicaid outpatient drug spending in 2017. (Figure 3) Drugs used to treat HIV, also called antiretrovirals, and hepatitis C drugs drive Medicaid spending on antivirals. Together these subclasses account for more than 90% of Medicaid antiviral spending before rebates. (Figure 4) Spending on antivirals is disproportionate to their utilization (they are not among the top ten most frequently prescribed drug groups) and reflects the high cost of these drugs as well as Medicaid’s important role in providing treatment for HIV and hepatitis C. Medicaid is the largest source of coverage for people with HIV, covering over 280,000 people, or an estimate of more than 40% of people with HIV.10,11 Of the up to 5 million people in the U.S. with hepatitis C, a disproportionate number are enrolled in Medicaid.12
Figure 4: Spending on Medicaid Outpatient Antiviral Drugs, by Type, 2014-2017
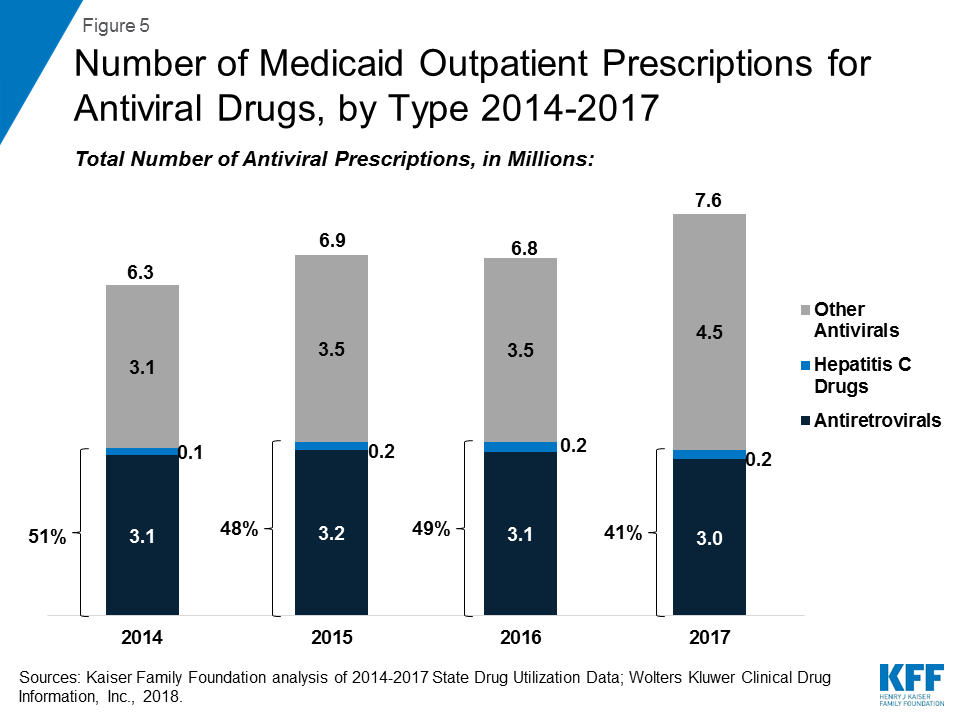
Within the drug group of antivirals, spending on hepatitis C drugs is disproportionately high relative to their utilization. Antiretrovirals are more commonly prescribed than hepatitis C drugs in part due to antiretrovirals being a maintainence drug, but also due to utilization controls state Medicaid programs placed on hepatitis C drugs over the period. (Figure 5) However, hepatitis C drugs, such as Sovaldi and Harvoni, account for a relatively large share of spending due to their high per-treatment cost. (Figure 4)13
Figure 5: Number of Medicaid Outpatient Prescriptions for Antiviral Drugs, by Type 2014-2017
Opioids
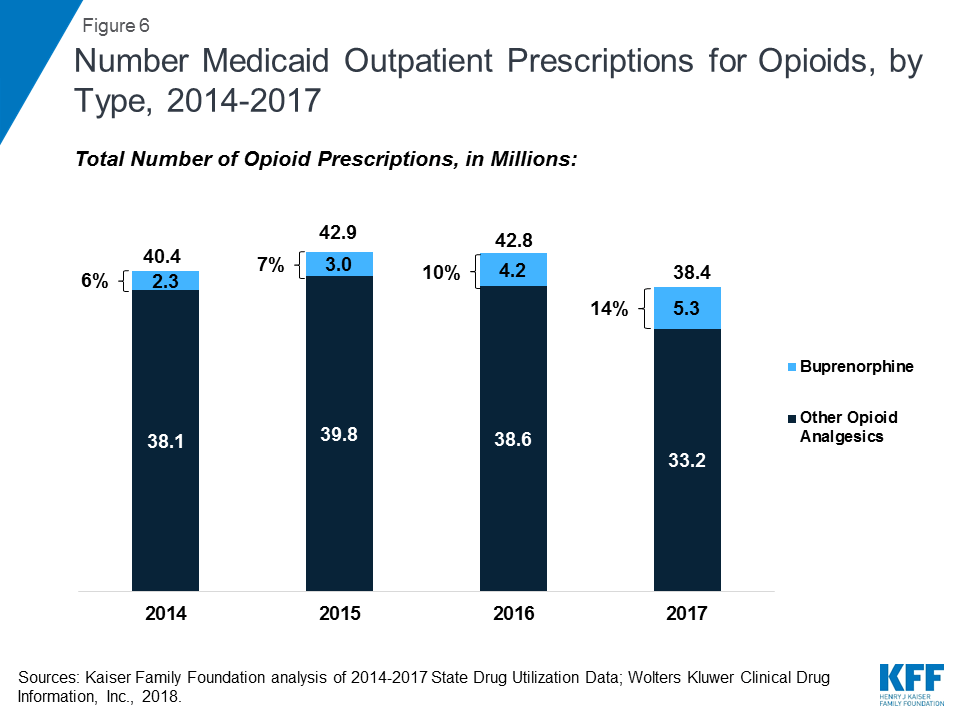
Opioid analgesics were widely prescribed during the period of study, being among the top four drug groups every year. In part, this reflects the widespread use of opioid painkillers across all payers during the period.14 However, opioids as a share of total number of Medicaid prescriptions declined over time. Further, in addition to drugs used to treat pain, this drug class includes buprenorphine, which is used to treat both pain and drug addiction.15 Buprenorphine composes a growing share of opioid analgesic prescriptions during the period at 6% in 2014 and 14% in 2017. If we examine the opioid analgesics aside from buprenorphine, the number of opioid analgesics prescriptions falls from a high of 39.8 million in 2015 to 33.2 million in 2017, a 17% decline. (Figure 6) Despite their relatively high share of prescription volume, opioids analgesics account for a smaller share (but still a top ten drug group) of Medicaid spending, due to their relatively low per prescription cost. In addition, consistent with trends in utilization, opioids dropped as a share of Medicaid outpatient drug spending over time. (Table 2)
Figure 6: Number Medicaid Outpatient Prescriptions for Opioids, by Type, 2014-2017
Antidiabetics
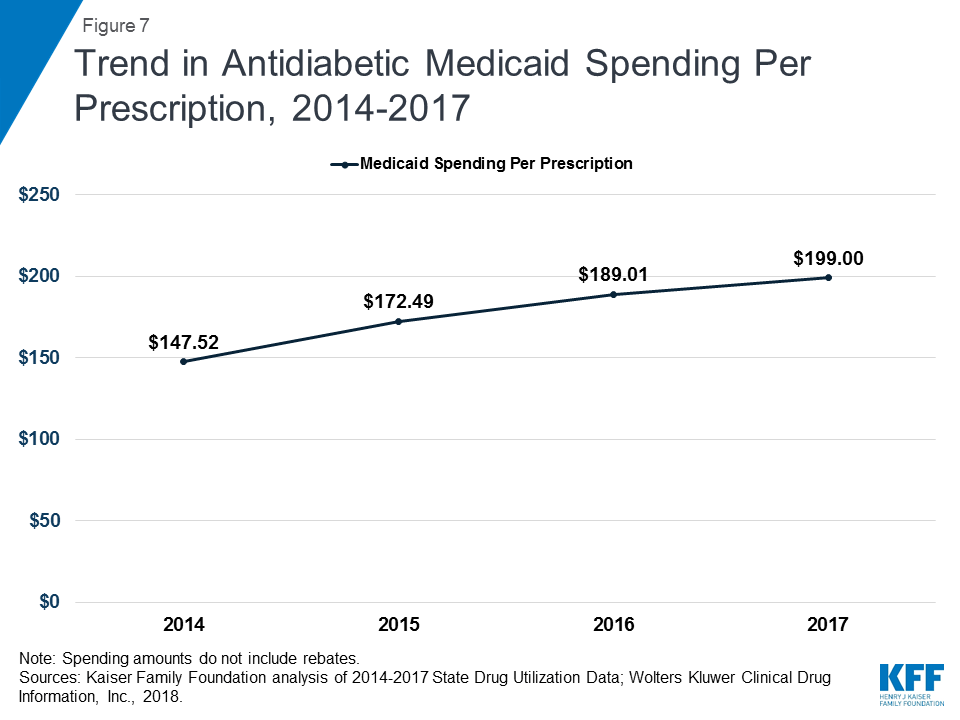
While antidiabetic use grew by 42% over the period of study, spending for the group nearly doubled, resulting in spending per prescription increasing from $148 in 2014 to $199 in 2017. (Appendix Tables A1 and A2 and Figure 7) By 2017, antidiabetic drugs were the second most costly drug group. (Figure 3) The increase in antidiabetic spending in Medicaid is largely due to the price increases of insulins over this time period. Although there have been advances in insulin since the discovery of the drug in 1921, the base form has remained largely the same since then.16 However, because of the way the drug is manufactured and regulated, there are no generic versions of insulin.17 In addition, three manufacturers, Eli Lilly, Novo Nordisk, and Sanofi Aventis, produce over 90% of the market and have increased the price of insulin over time since 2002, sometimes simultaneously.18,19,20
Figure 7: Trend in Antidiabetic Medicaid Spending Per Prescription, 2014-2017
Trends by Brand and Generic Status
Since the 1984 Hatch-Waxman Act, drug manufacturers have been able to obtain FDA approval for generic equivalents of brand-name drugs through an expedited process, as long as the generic drug is therapeutically equivalent to a drug on the market that had received FDA approval through the more rigorous application for a new product. To balance out increased competition from generic manufacturers, the FDA has power to grant exclusivity periods for brand name drugs approved through the more rigorous pathway. Regulatory exclusivity provides manufacturers with a degree of market exclusivity, enabling them to price the drug with no market competition.
Because generic drugs are lower cost, but still therapeutically equivalent to their corresponding brand drugs, state Medicaid programs implement policies to encourage use of generic drugs where possible. From 2014 through 2017, most state Medicaid programs required generic substitution in their FFS programs when the equivalent brand name drug was prescribed, unless the prescriber had written “Brand Medically Necessary” on the prescription or the state included a more restrictive requirement.21,22
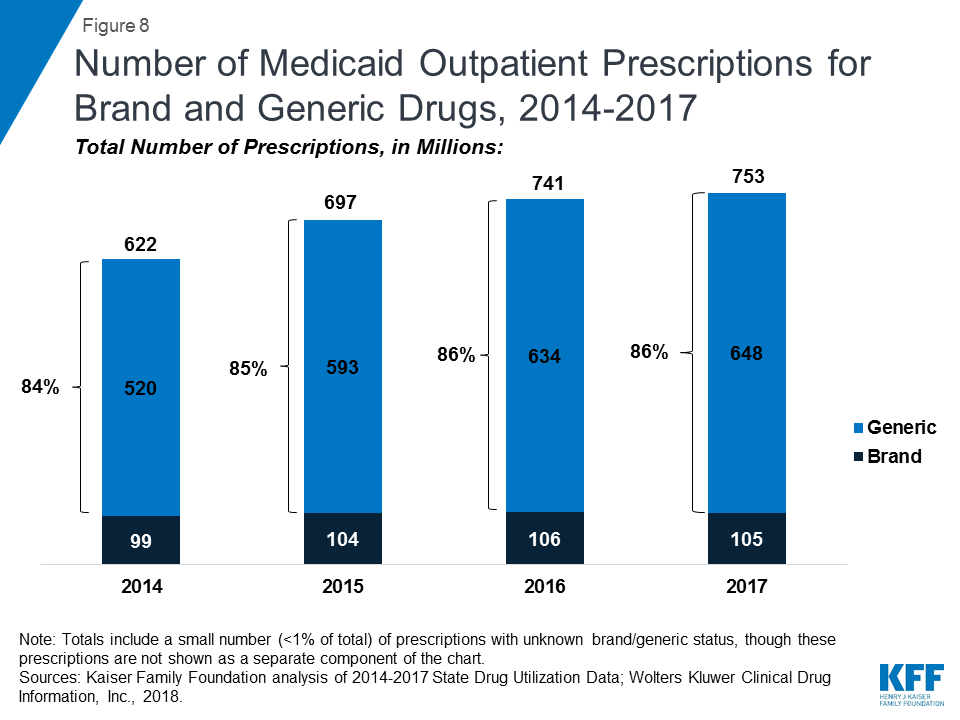
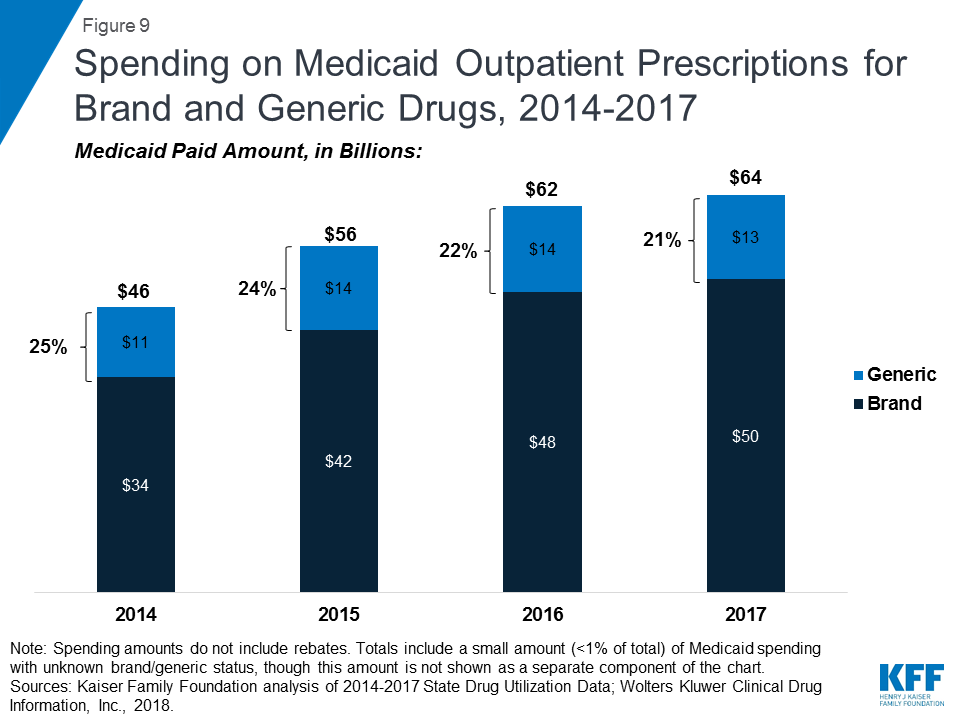
As seen in Figure 8, generic drugs accounted for the vast majority of prescription drug volume in Medicaid from 2014 through 2017. In addition, the average annual increase in number generic prescription drugs covered through Medicaid outpaced the increase in the number of brand name drugs leading to a small increase in generic drugs’ share of total prescription volume (from 84% to 86%). However, as seen in Figure 9, generic drugs accounted for a relatively small share of Medicaid spending on drugs before rebates from 2014 through 2017, and this share declined slightly over time (from 25% to 21%). This growth in brand spending despite larger increases in generic volume reflects national trends caused by the launch of expensive new drugs during the period. While other drugs have lost exclusivity over this period, the savings due to introduction of competition for those drugs are not keeping pace with the increased spending from the new drugs launching.23
Figure 8: Number of Medicaid Outpatient Prescriptions for Brand and Generic Drugs, 2014-2017Figure 9: Spending on Medicaid Outpatient Prescriptions for Brand and Generic Drugs, 2014-2017
Trends by Biologic Status
Biologics are products, such as drugs or vaccines, derived from living organisms with chemical structures more complicated than traditional small molecule drugs. As a result, the FDA licenses biologics through a different process than it uses to approve small molecule drugs.24 As part of the ACA, Congress created a pathway for the FDA to license biosimilars, products that are deemed “highly similar” or “interchangeable” with a referenced biologic.25
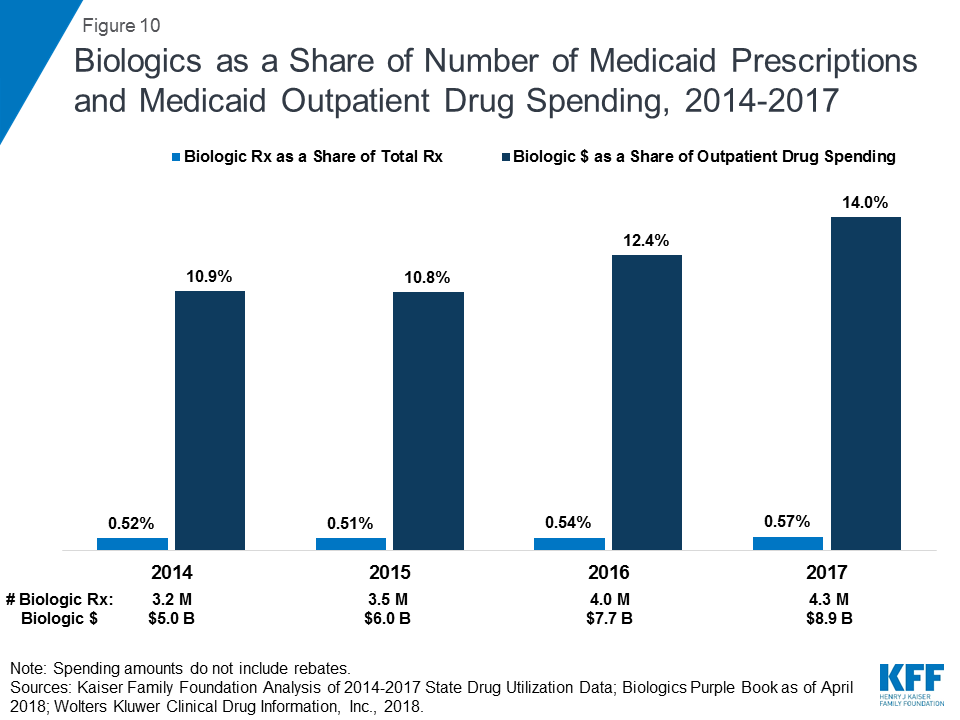
Biologics tend to be priced expensively and face less competition from biosimilars than small molecule brand drugs face from generics. Additionally, although biosimilar competition does lower the price of biologics, it does so to a lesser degree compared with the effect of generic entry on small-molecule drug market.26 As a result, across the entire period, the amount Medicaid spends before rebates on biologics is outsized compared to the number of prescriptions that Medicaid fills. While biologics consistently account for less than 1 percent of Medicaid outpatient prescriptions every year, they account for between 11% and 14% of Medicaid spending on prescriptions before rebates over the period. (Figure 10)
Figure 10: Biologics as a Share of Number of Medicaid Prescriptions and Medicaid Outpatient Drug Spending, 2014-2017
Looking Ahead
As Medicaid drug spending is expected to grow faster than most other components of the program, policy makers are looking into ways to generate savings in the pharmacy benefit. Medicaid directors are concerned about the launch of expensive new prescription drugs.27 States have been able to negotiate higher rebates for hepatitis C drugs due to competition within the class, but they remain concerned about other high cost drugs such as hemophilia factor, oncology, mental health and HIV/AIDS drugs.28 Policymakers are also expressing concern about insulin, common antibiotic prescriptions that have been rising in price. About 30 million Americans have either type 1 or type 2 diabetes, and the prevalence of the disease is expected to grow.29 Because of both the cost and the rising prevalence of diabetes, the cost of insulin has become a touchstone, and state and federal lawmakers, attorneys general, and other parties have been examining the topic, writing legislation, and filing lawsuits.30 In reaction to the growing concern about Medicaid drug costs, there has been a fair amount of action at the state level, such as the implementation of New York’s drug spending cap in April 2017,31 Oklahoma’s value-based contracts for specific drugs,32 and Louisiana’s steps towards a subscription payment model for hepatitis C drugs.33
At the federal level, Congress is considering how the Medicaid Drug Rebate Program interacts with alternative payment structures, such as value-based payments.34 In addition, the FDA has taken steps and announced plans to increase competition among generics35 and biosimilars.36 In 2016, 2017, and 2018, the FDA approved record numbers of generic drugs.37 However, while biologics remain expensive, and many biosimilars have been approved in the past several years, as of yet, only four biosimilars have come to market. In general, the effects of actions at the federal level, both in terms of new bills and FDA activity, remain yet to be seen.
Although an optional benefit within Medicaid, outpatient prescription drugs are an important component in the management of acute and long-term health issues. Without Medicaid, many prescription drugs would be prohibitively expensive to beneficiaries. Because prescription drugs are an integral component of medical care and treatment, it is important to understand how drugs are used, and the factors driving drug costs in Medicaid.
Source: Kaiser Family Foundation analysis of Medicaid State Drug Utilization Data, 2014-2017; Wolters Kluwer Clinical Drug Information, Inc., January 2018.
Table A2: Top 10 Drug Groups by Medicaid Paid Amount
Note: Medicaid spending does not include rebates.Source: Kaiser Family Foundation analysis of Medicaid State Drug Utilization Data, 2014-2017; Wolters Kluwer Clinical Drug Information, Inc., January 2018.
Appendix B: Methodology
This analysis of Medicaid prescription drug utilization and spending trends, we used 2014 through 2017 State Drug Utilization Data (SDUD), downloaded in early January 2019, merged with data from Wolters Kluwer Clinical Information, Inc (“WKCDI”).38 The SDUD is publicly available data provided as part of the Medicaid Drug Rebate Program. It provides data on the number of prescriptions, Medicaid spending before rebates, and cost-sharing for rebate-eligible Medicaid outpatient drugs. At the time of download, 2017 data were the most recent full year of data available. The WKCDI data is from January 2018. The use of WKCDI data does not represent and should not be characterized as a WKCDI endorsement of any data, findings, or other content presented in this report.
The SDUD and the WKCDI data were merged at the NDC-level to consistently identify the drug name, as well as to incorporate brand versus generic status and the WKCDI Therapeutic Classifications System’s drug group. Single-source and multi-source, originator drugs were classified as brand drugs. If a drug was available as both a brand and a generic, it was categorized as a brand when summarizing how many of the most costly drugs were brands and how many were generics. Using the Center for Drug Evaluation and Research List of Licensed Biological Products and the Center for Biologics Evaluation and Research List of Licensed Biological Products39 as of March 2018, biologics in the SDUD were identified based on drug name.
Limitations
The SDUD provides spending and utilization data by NDC, quarter, managed care or fee-for-service, and state. It also provides this data summarized for the whole country. Starting in 2016, CMS has suppressed data cells with fewer than 11 prescriptions, citing the Federal Privacy Act and the HIPAA Privacy Rule.40 Because less data is suppressed at the national versus state level, this analysis used the national data. Comparing 2015 data available prior to the methodology change to 2015 data after the methodology change, this data suppression at the national level does not dramatically alter findings at the macro level as shown in this brief. It does alter analyses examining the most costly drug per prescription, but this type of analysis is beyond the scope of this brief.
This analysis does not include rebates because this data is unavailable to the public at the NDC level. Rebates have a considerable effect on Medicaid drug spending overall, lowering net spending, but this effect varies at the drug level as different drugs receive different rebates. Additionally, although Medicaid beneficiaries largely self-administer drugs that are prescribed in an outpatient setting, medical practitioners must administer some drugs. Although states are instructed to collect drug rebates on physician-administered outpatient drugs that are not billed as a bundled service, research has shown that not all states do so.41 Because biologics and other specialty drugs are often physician-administered, it is possible that the data reflects lower Medicaid spending and utilization of certain drugs of this kind.
Since January 1, 2006, Medicare has provided outpatient drugs to its beneficiaries, including Medicare and Medicaid dual enrollees through Medicare Part D. ↩︎
In December 2013, the FDA approved Gilead Sciences’ breakthrough drug Sovaldi, which essentially cures certain genotypes of hepatitis C with few side effects. Since then, the FDA has approved additional hepatitis C drugs from Gilead and three other companies, and all genotypes of hepatitis C are now essentially curable. Although some states are now reporting that they are able to secure meaningful supplemental rebates due to competition, the price of the hepatitis C drugs were initially prohibitively expensive, even with the statutory rebate. Kathleen Gifford, Eileen Ellis, Barbara Coulter Edwards, Aimee Lashbrook, Elizabeth Hinton, Larisa Antonisse, Robin Rudowitz, States Focus on Quality and Outcomes Amid Waiver Changes: Results from a 50-State Medicaid Budget Survey for State Fiscal Years 2018 and 2019, (Washington, DC: Kaiser Family Foundation, October 2018), https://modern.kff.org/medicaid/report/states-focus-on-quality-and-outcomes-amid-waiver-changes-results-from-a-50-state-medicaid-budget-survey-for-state-fiscal-years-2018-and-2019/. ↩︎
Buprenorphine, Naltrexone, and Methadone are drugs used in Medication Assisted Treatment for opioid addiction. Buprenorphine and Methadone are both classified as Opioid Analgesics, as they both also treat pain. However, Methadone is only prescribed when used to treat pain, and is administered when used to treat addiction. As a result, the methadone prescriptions in the SDUD are presumed to be for the treatment of pain. Naltrexone is classified as an Antidote and Specific Antagonist. See Lisa Clemans-Cope, Marni Epstein, and Genevieve M. Kenney, “Rapid Growth in Medicaid Spending on Medications to Treat Opioid Use Disorder and Overdose,” (Washington, DC, Urban Institute, June 2017), https://www.urban.org/sites/default/files/publication/91521/2001386-rapid-growth-in-medicaid-spending-on-medications-to-treat-opioid-use-disorder-and-overdose_3.pdf. ↩︎
Of the states that required more the restrictive requirements, a majority required preauthorization to enable a pharmacist to provide a brand drug when a generic was available. States included other requirements, such as requiring the submission of a MedWatch Form and requiring a medical reason to override the use of a generic, and some implement more than one restrictive requirement. Ibid. ↩︎
A manufacturer obtains FDA licensing for a biologic through a Biologics License Application (BLA) as opposed to an NDA or an ANDA. See Judith Johnson, “Biologics and Biosimilars: Background and Key Issues,” Congressional Research Services, Updated October 27, 2017, https://crsreports.congress.gov/product/pdf/R/R44620. ↩︎
Beginning in June 2017, the FDA has maintained a list of off-patent, off-exclusivity drugs lacking generic competition. Also in June 2017, the FDA announced it would expedite ANDA reviews until there were three generics on the market for a given brand. The agency is also intending on issuing guidance in the future addressing other activities that diminish generic competition. “FDA Tackles Drug Competition to Improve Patient Access,” FDA News Release, June 27, 2017, https://www.fda.gov/newsevents/newsroom/pressannouncements/ucm564725.htm and Henry Waxman, Bill Corr, Kristi Martin, Sophia Duong, “What Commissioner Gottlieb’s FDA is Doing to Lower Prescription Drug Prices and Steps Congress Can Take to Help,” April 2018, https://www.commonwealthfund.org/sites/default/files/documents/___media_files_publications_issue_brief_2018_apr_waxman_gottlieb_plan_fda_ib.pdf. ↩︎
Aware of the importance of biologics when considering drug costs, the FDA released the “Biologics Action Plan” in July 2018, which includes items such as providing guidance to improve biosimilar labeling and to provide clarity for manufacturers to demonstrate interchangeability, as well as providing education to health care professionals to explain concepts such as biosimilars and interchangeability “Biosimilars Action Plan: Balancing Innovation and Competition,” FDA, July 2018. See also “FDA Releases Biosimilar Action Plan,” http://www.centerforbiosimilras.com/news/fda-releases-biosimilar-action-plan. ↩︎
“States Collection of Medicaid Rebates for Physician Administered Drugs,” (Washington, DC, U.S. Department of Health and Human Services- Office of Inspector General, June 2011), http://oig.hhs.gov/oei/reports/oei-03-09-00410.pdf. ↩︎