KFF designs, conducts and analyzes original public opinion and survey research on Americans’ attitudes, knowledge, and experiences with the health care system to help amplify the public’s voice in major national debates.
In this article for The Lancet, KFF’s Jennifer Kates and 19 co-authors examine trends in the provision and receipt of development assistance for health (DAH), particularly for the G20 countries meeting this month in Japan. The article looks at key questions facing leaders of the G20 countries, including how to best focus DAH for equitable health gains, how to deliver DAH to strengthen health systems, and how to support domestic resource mobilization and tranformative partnerships for sustainable impact.
The article was published online on June 27, 2019. To access it at no charge, register for an online account at The Lancet.
In addition to KFF’s Jennifer Kates, the article’s other coauthors are: Joseph L Dieleman, Krycia Cowling, Catherine S Chen, Anton C Harle, Angela E Micah, Golsum Tsakalos, Junjie Wu, Yingxi Zhao, Bianca S Zlavog and Christopher J L Murray of the Institute for Health Metrics and Evaluation at the University of Washington; Irene A Agyepong of the Ghana Health Service; Sarah Alkenbrack and Ajay Tandon of the Health Nutrition and Population Global Practice at the World Bank Group; Thomas J Bollyky of the Council on Foreign Relations Global Health Program; Jesse B Bump and Annie Haakenstad of the Harvard T. H. Chan School of Public Health; , Karen A Grépin of Wilfrid Laurier University; Rouselle F Lavado of the Asian Development Bank; and Trygve Ottersen of the Norwegian Institute of Public Health.
Since 2006, states have had to determine “medical frailty” for Medicaid enrollees if states choose to design an “alternative benefit plan” (ABP, previously called a benchmark benefit package) that differs from the traditional state plan benefit package. To date, there are 12 states that must determine medical frailty because they offer an ABP for Medicaid expansion adults. The medical frailty determination is intended to protect coverage for enrollees who have physical and/or mental health needs but do not qualify for Medicaid based on a disability. Medical frailty determinations are assuming greater importance in recent years as more states adopt restrictive Section 1115 waiver policies, such as premiums or work requirements. CMS has required many, but not all, of these states to identify and exempt enrollees who are medically frail from restrictions on coverage and benefits under these waivers. This issue brief answers three key questions about medical frailty determinations and presents new data on the rules and processes used by the 12 states making these determinations for Medicaid expansion adults. The findings are based on a 50-state survey conducted by the Kaiser Family Foundation’s Program on Medicaid and the Uninsured in fall 2018. Tables contain state-level data for the 12 states.
Key findings include the following:
A dozen states, or about one-third of Medicaid expansion states, must identify enrollees who are medically frail because these states provide a benefit package to expansion adults that differs from the traditional state plan benefit package. The medical frailty process is intended to ensure that these enrollees receive the benefit package that best meets their needs. Key areas that may differ include home and community-based services, behavioral health, and preventive services.
Medical frailty determinations are assuming even greater importance for enrollees’ ability to retain the coverage and scope of benefits for which they are eligible, as some states implement Section 1115 waivers that impose restrictions on eligibility and benefits. Currently, six states must determine medical frailty to exempt these enrollees from restrictive waiver policies such as work requirements and premiums.
The complexity of the administrative process for determining medical frailty can affect enrollees’ ability to retain access to the benefit package and coverage for which they are eligible. Policy developments in this area will be important to watch, as Medicaid expansion and implementation of restrictive policies in Section 1115 waivers continues.
Issue Brief
Introduction
Since 2006, states have had to determine “medical frailty” for Medicaid enrollees if states choose to design an “alternative benefit plan” (ABP) that differs from the traditional state plan benefit package. To date, there are 12 states that must determine medical frailty because they offer an ABP for Medicaid expansion adults. The medical frailty determination is intended to protect coverage for enrollees who have physical and/or mental health needs but do not qualify for Medicaid based on a disability. Federal law provides that Medicaid enrollees who are medically frail or otherwise have special medical needs must have access to the traditional state plan benefit package. Federal regulations set out the general criteria that define medical frailty (Box 1). States have flexibility to further define the specific criteria and establish the process by which medical frailty is determined, with resulting variation among states.
Medical frailty determinations are assuming greater importance in recent years as more states adopt restrictive Section 1115 waiver policies, such as premiums or work requirements. Many of these waivers apply restrictive policies to – and require medical frailty determinations for – Medicaid expansion adults, although Indiana’s waiver includes traditional low-income parents as well as expansion adults. CMS has required many, but not all, states with waivers imposing restrictions on coverage and benefits to identify and exempt enrollees who are medically frail. For example, unlike the other states discussed in this brief, Utah and Wisconsin’s waiver approvals require those states to exempt enrollees with disabilities but do not require medical frailty determinations.
This issue brief answers three key questions about medical frailty determinations and presents new data on the rules and processes used by the 12 states making these determinations for Medicaid expansion adults. All 12 states offer a benefit package to expansion adults that differs from the state plan benefit package. Additionally, six of these states have waivers that impose other restrictions on non-medically frail expansion adults. The findings are excerpted from a survey of the 50 states and the District of Columbia about Medicaid eligibility for seniors and people with disabilities conducted by the Kaiser Family Foundation’s Program on Medicaid and the Uninsured in fall 2018.1 Tables contain data for the 12 states.
Box 1: Federal Medical Frailty Criteria for Adults2
Federal rules require that medically frail adults include at least individuals with:
Disabling mental disorders, including serious mental illness;
Chronic substance use disorders;
Serious and complex medical conditions;
Physical, intellectual or developmental disabilities that significantly impair the ability to perform one or more activities of daily living; or
A disability determination based on Social Security Administration criteria.
Key Questions
1. What is Medical Frailty and What are the Federal Rules?Since 2006, states have had the option to design an “alternative benefit plan” (ABP) for certain Medicaid populations that differs from the traditional state plan benefit package.3 An ABP is a set of covered services that is either (1) based on one of three types of commercial insurance plans or their actuarial equivalent (known as the ABP benchmark) or (2) determined appropriate by the Health and Human Services Secretary. States can design ABPs targeted to different subpopulations, such as beneficiaries in different geographic areas or beneficiaries with particular medical needs.
Few states elected the ABP option prior to the Affordable Care Act (ACA), but ABPs became more widespread after the ACA required states to provide an ABP to Medicaid expansion adults. Expansion adult ABPs must include certain services (Box 2).4 However, an expansion adult ABP may not include all of the services in the traditional state plan benefit package,5 unless the state intentionally designs the ABP to align with the state plan benefit package.6 States can choose to design an expansion adult ABP that contains the same benefits as the state plan benefit package by using “Secretary-approved coverage” as the ABP benchmark. “Secretary-approved coverage” encompasses any Medicaid state plan benefit, including home and community-based services (HCBS).7 To fully align the benefits in an ABP with those in the Medicaid state plan benefit package, states must determine which state plan benefits must be added to the ABP and which ABP benefits must be added to the state plan benefit package.
Box 2: Benefits That the Medicaid Expansion Adult ABP Must Include:
The ACA’s 10 categories of essential health benefits;8
Any other benefits in the ABP benchmark plan;
Early Periodic Screening Diagnostic & Treatment services for enrollees up to age 21;9
Parity in physical and behavioral health services.13
If states do not choose to align their expansion adult ABP with the state plan benefit package, there are certain key areas that may differ, and these differences may be important to enrollees with physical or mental health needs (Box 3). The ABP may be less likely to include home and community-based services (HCBS), such as personal care services, because ABPs usually are based on commercial insurance plans, which typically provide less coverage of HCBS than what is available through the Medicaid state plan benefit package.14 On the other hand, the state plan benefit package may not include behavioral health and/or preventive services to the same extent as the expansion adult ABP because those benefits are optional in the state plan benefit package, while ABPs are subject to mental health parity and essential health benefit requirements to cover such services.15
Box 3: Key Benefits That May Differ If State Does Not Align the Expansion Adult ABP with the State Plan Benefit Package:
Home and community-based services, such as personal care
Behavioral health services, including mental health and substance use disorder treatment
Preventive services
The medical frailty process is intended to ensure that enrollees receive the benefit package that best meets their needs if the state does not align the expansion adult ABP with the state plan benefit package. Certain people, including those who are “medically frail,” cannot be required to enroll in an ABP and instead must have access to the state plan benefit package, even if they are eligible for Medicaid through the ACA expansion group.16 If states choose to align their expansion adult ABP with their state plan benefit package, they do not need to identify medically frail enrollees. States that have opted to align their expansion adult ABP with their state plan benefit package have noted that doing so minimizes disruptions in coverage for enrollees who move between Medicaid eligibility groups.17 In addition, administering a single set of covered services for all populations may be administratively simpler.
States also must identify enrollees who are medically frail if the state has a Section 1115 waiver that imposes eligibility or benefit restrictions on enrollees. The increase in these restrictive waiver policies has meant that medical frailty determinations are assuming even greater importance for enrollees’ ability to retain the coverage and scope of benefits for which they are eligible. The types of restrictions imposed under waivers from which medically frail enrollees are exempt include premiums, work and reporting requirements, limits on or elimination of non-emergency medical transportation (NEMT), mandatory enrollment in Marketplace premium assistance, required completion of a health risk assessment and healthy behavior activity, and a three-month coverage lock-out for failure to timely renew eligibility.
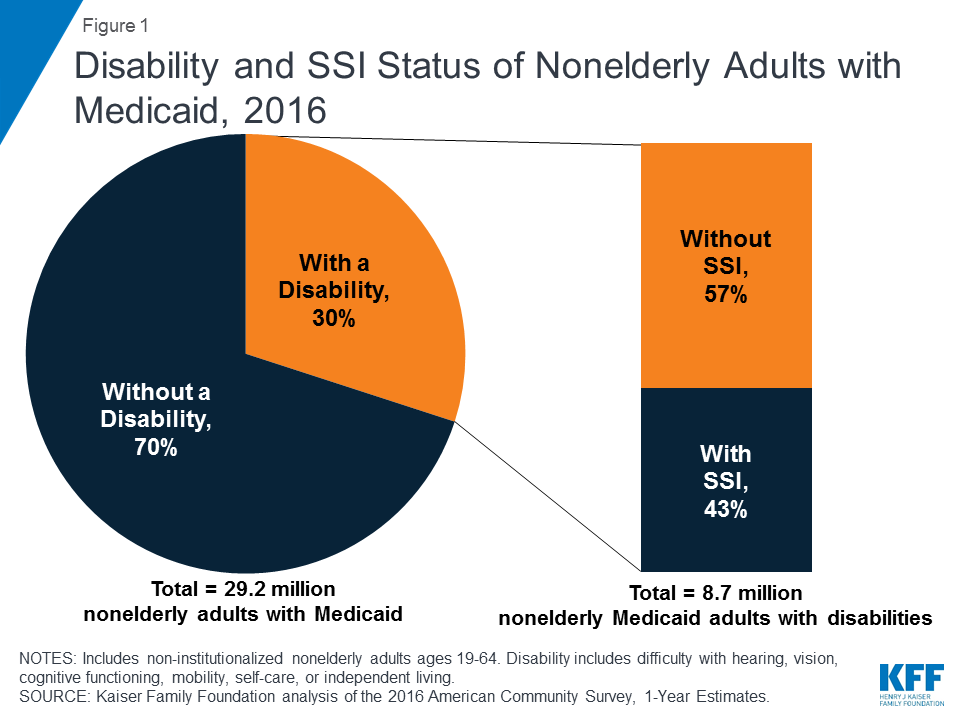
The medical frailty process accounts for the fact that the ACA expansion group includes some people with disabilities. Non-elderly adults with disabilities can qualify for Medicaid in the ACA expansion group, based solely on their low income, in states that have adopted the expansion.18Three in 10 nonelderly adults with Medicaid report having a disability, according to data from the American Community Survey (ACS) (Figure 1). The ACS and other federal survey data classify a person as having a disability if they have a functional limitation that results in a participation limitation. This includes people who report serious difficulty with hearing, vision, cognitive functioning (concentrating, remembering, or making decisions), mobility (walking or climbing stairs), self-care (dressing or bathing), or independent living (doing errands, such as visiting a doctor’s office or shopping, alone).19
Figure 1: Disability and SSI Status of Nonelderly Adults with Medicaid, 2016
Notably, over half of nonelderly Medicaid adults with disabilities do not receive federal Supplemental Security Income (SSI) benefits, despite reporting serious difficulty in at least one ACS functional area (Figure 1). While receiving SSI benefits is a pathway to Medicaid eligibility for some people with disabilities, the SSI disability standard is more stringent than the ACS definition.20 In addition, SSI financial eligibility criteria are more restrictive than those for Medicaid expansion adults and other disability-related Medicaid coverage pathways.21 As a result, people with disabilities who do not receive SSI can be eligible for Medicaid as expansion adults or low-income parents22 or through an optional disability-related pathway.23 People who are eligible for Medicaid based on their status as an SSI beneficiary are excluded from coverage in the ACA expansion group.
2. Which States Must Identify Medically Frail Enrollees and What are the Implications?
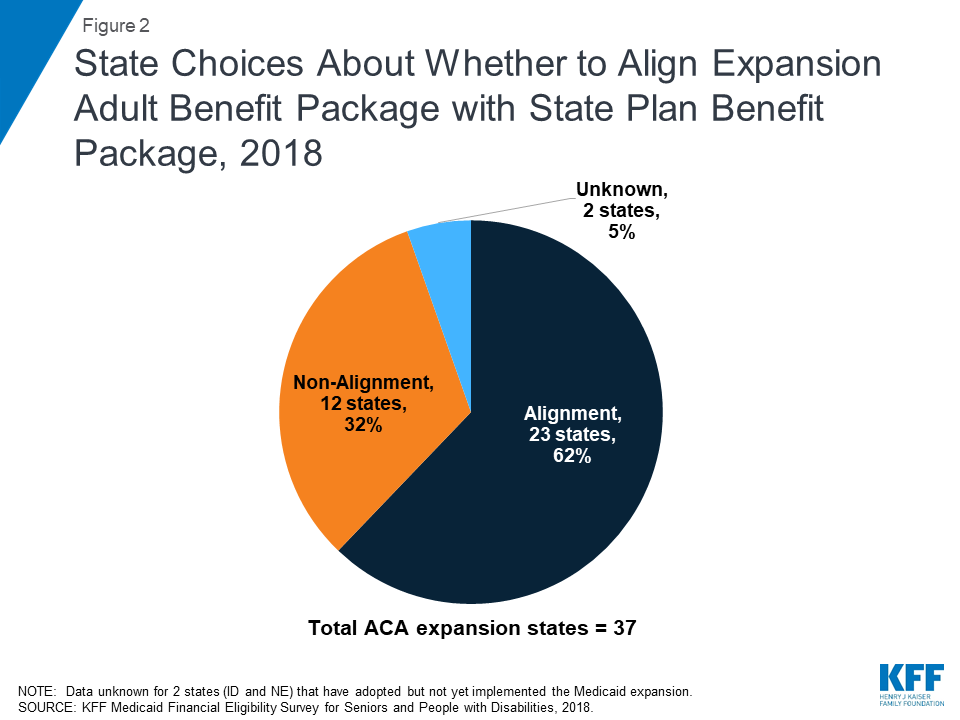
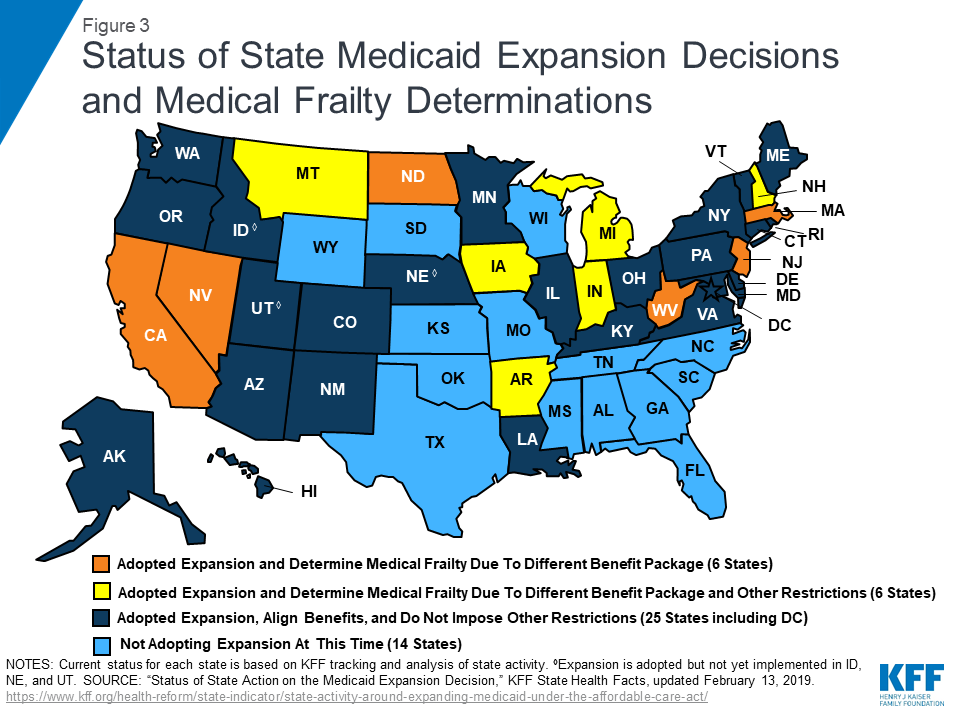
A dozen states, or about one-third of Medicaid expansion states, must identify enrollees who are medically frail because these states provide a benefit package to expansion adults that differs from the traditional state plan benefit package (Figure 2).24 As noted above, enrollees who are medically frail cannot be required to receive the expansion adult ABP and instead must have access to the state plan benefit package if they choose. The 12 states that report making medical frailty determinations because their expansion adult ABP is not aligned with their state plan benefit package include Arkansas, California, Indiana, Iowa, Massachusetts, Michigan, Montana, Nevada, New Hampshire, New Jersey, North Dakota, and West Virginia (Figure 3).
Figure 2: State Choices About Whether to Align Expansion Adult Benefit Package with State Plan Benefit Package, 2018Figure 3: Status of State Medicaid Expansion Decisions and Medical Frailty Determinations
In addition to providing a different benefit package to expansion adults, six states impose other eligibility or benefit restrictions on Section 1115 waiver enrollees that require these states to identify and exempt medically frail individuals. These states include Arkansas, Indiana, Iowa, Michigan, Montana, and New Hampshire (Figure 3).25 Medically frail enrollees are exempt from Section 1115 waiver provisions that impose premiums in four states (IN, IA, MI, MT) and work and reporting requirements in three states (IN, MI, and NH). They also are exempt from restrictions on NEMT in two states (AR26 and IN27 ), mandatory enrollment in Marketplace premium assistance in Arkansas, required completion of a health risk assessment and healthy behavior activity in Michigan, and a three-month coverage lockout for failure to timely renew eligibility in Indiana.28
States with restrictive waivers, where medical frailty determines exemptions from conditions on coverage such as work requirements and premiums, report higher shares of medically frail enrollees than states where medical frailty only determines benefit package contents. Indiana reported the highest share of expansion adults (24%) identified as medically frail in 2018, among the 7 of 12 states able to report this data (Table 1).29 In Indiana, health plans identify individuals as potentially medically frail and then make a determination using a standardized assessment tool. Eight percent of expansion adults were identified as medically frail in Arkansas and Montana. Other data show that an increasing share of Arkansas enrollees who were subject to work and reporting requirements were identified as medically frail, and therefore exempt from complying, as the requirements were implemented in 2018. In these states, medical frailty determines exemptions from coverage restrictions, including work requirements and NEMT restrictions in Indiana and Arkansas, premiums in Indiana and Montana, and mandatory Marketplace premium assistance in Arkansas (Table 1).
Other states reported much smaller shares of medically frail expansion adults, ranging from 3% in Iowa to less than 1% in New Jersey and North Dakota (Table 1). In most states reporting very low shares of medically frail enrollees, medical frailty is limited to determining benefit package contents (MA, NJ, and ND). Various factors may account for differing shares of medically frail adults among states, including enrollee knowledge and ease of navigating the process, whether multiple or few entities can identify medically frail enrollees, the type of verification required, and whether states apply relatively broad or restrictive criteria in the context of the general federal rules.
Table 1: Share of Expansion Adults Identified as Medically Frail and Implications, 2018
State
Share of Expansion Adults Identified as Medically Frail
Implications of Medical Frailty Determination
Expansion States with Section 1115 Waivers Restricting Eligibility and/or Benefits
Arkansas
8%
Determines benefit package contents, as well as exemptions from work requirements, NEMT restrictions, and mandatory Marketplace premium assistance.
Indiana
24%
Determines benefit package contents, as well as exemptions from work requirements, NEMT restrictions, and premiums.
Iowa
3%
Determines benefit package contents as well as exemption from premiums.
Michigan
NR
Determines benefit package contents, as well as exemptions from work requirements, premiums, and mandatory health risk assessment and healthy behavior activities.
Montana
8%
Determines benefit package contents, as well as exemption from premiums.
New Hampshire
NR
Determines benefit package contents, as well as exemptions from work requirements.
Expansion States without Section 1115 Waivers Restricting Eligibility and/or Benefits
California
NR
Determines benefit package contents.
Massachusetts
1.40%
Determines benefit package contents.
Nevada
NR
Determines benefit package contents.
New Jersey
0.30% 1
Determines benefit package contents.
North Dakota
0.02%
Determines benefit package contents.
West Virginia
NR
Determines benefit package contents.
NOTES: NR = No response. NEMT = non-emergency medical transportation. 1 New Jersey reported 1,698 people identified as medically frail. KFF analysis of Medicaid Budget and Expenditure System (MBES) data determined expansion adult population in FY2017 as 580,200 adults.SOURCE: Kaiser Family Foundation, Medicaid Financial Eligibility Survey for Seniors and People with Disabilities, 2018.
3. How Do States Administer the Medical Frailty Process?
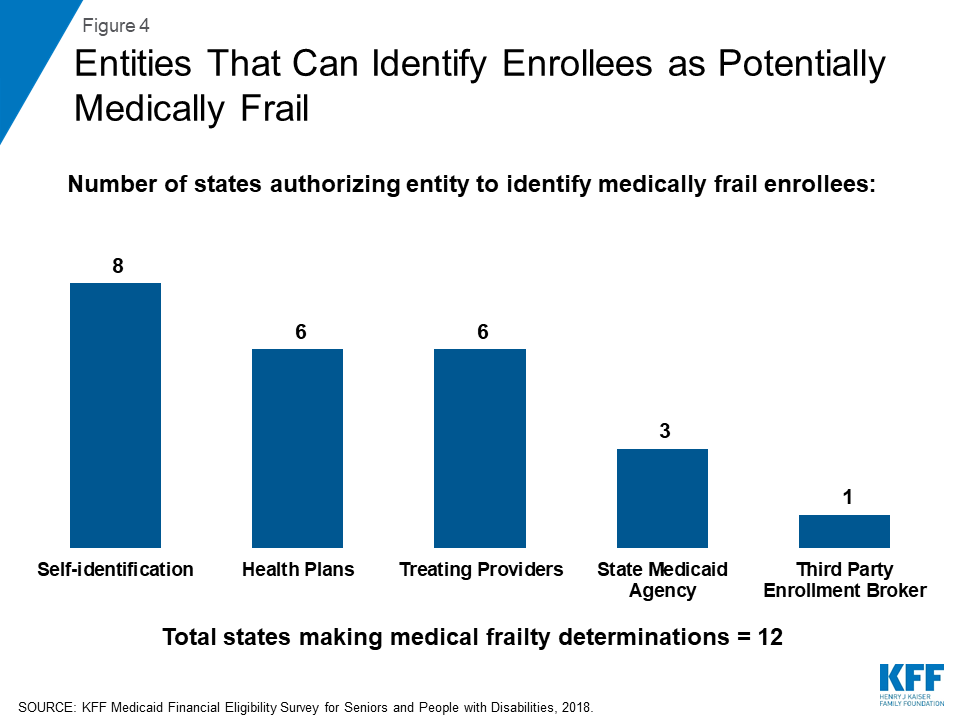
In a minority of states with medical frailty determinations, the Medicaid enrollee cannot initiate the medical frailty process (Appendix Table). These states include California, Indiana, Nevada, and New Jersey. Most states do allow the enrollee to self-identify as potentially medically frail (Figure 4). Other entities that states allow to identify enrollees as potentially medically frail include health plans, treating providers, the state Medicaid agency, and a third party enrollment broker.
Figure 4: Entities That Can Identify Enrollees as Potentially Medically Frail
Half of the states that determine medical frailty authorize just one entity to identify enrollees as potentially medically frail, which could lead to gaps in identifying eligible enrollees (Appendix Table). Four states (AR, MA, NH, and WV) allow self-identification as the only way to initiate the medical frailty determination. Self-identification is a person-centered approach but also requires that individuals know what the medical frailty designation means and how to navigate the process in order for self-identification to be a successful means of identifying eligible individuals. Navigating the process may be particularly challenging for certain enrollees. In an early look at implementation of Arkansas’ work and reporting requirements, some interviewees expressed concern about enrollees’ ability to understand that they potentially might qualify for a medical frailty exemption and to successfully navigate that process, especially for those with mental health needs. Indiana and New Jersey authorize health plans as the sole entity to initiate a medical frailty determination. Basing determinations exclusively on claims data could result in delayed identification of people who are newly enrolling in coverage or for whom there is no claims history, such as mental health or substance uses disorder services. By contrast, three states (MI, MT, and ND) allow multiple entities to initiate the medical frailty determination. Allowing multiple entities to identify enrollees as potentially medically frail may help ensure that eligible enrollees are identified.
Most states allow medically frail enrollees to be identified at multiple points, including at the time of application, at renewal, and during the eligibility period (Appendix Table). Allowing the medical frailty determination to occur at more than one time is another policy that may help ensure that all eligible individuals are identified.
Half of the states determine medical frailty based on a specific diagnosis as well as functional need criteria.30 These states include California, Indiana, Iowa, Michigan, Nevada, and North Dakota. By contrast, Arkansas and New Jersey only use functional need criteria. Montana and West Virginia do not require a specific diagnosis but instead base medical frailty determinations on the existence of any physical, mental, or emotional health condition that limits activities (MI) or that results in the need for assistance (WV). West Virginia also considers chronic substance abuse or developmental conditions when determining medical frailty. Massachusetts adopts the federal medical frailty criteria described in Box 1 above.31 Four states (AR, IN, NJ, and ND) use a standardized assessment tool to determine medical frailty. Standardized tools can help ensure that individuals with similar conditions are treated similarly but must be broad enough to include all enrollees who should qualify without arbitrary exclusions.
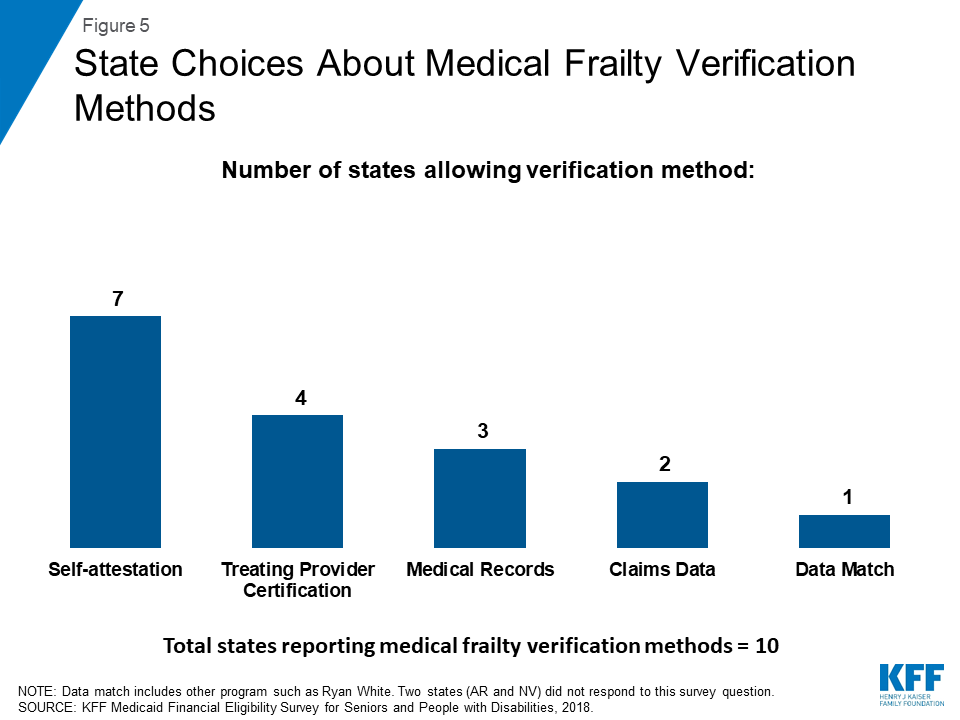
Over half of the states32 allow individuals to self-attest that they meet medical frailty criteria, instead of requiring documentation or other verification (Figure 5 and Appendix Table). Other sources of verification include treating provider certification, medical records, claims data, and data match with another program such as Ryan White. An existing body of research shows that additional reporting or administrative burdens can create barriers to eligible people retaining coverage. Half of the states provide for just one verification method, while the other six states allow more than one method.
Figure 5: State Choices About Medical Frailty Verification Methods
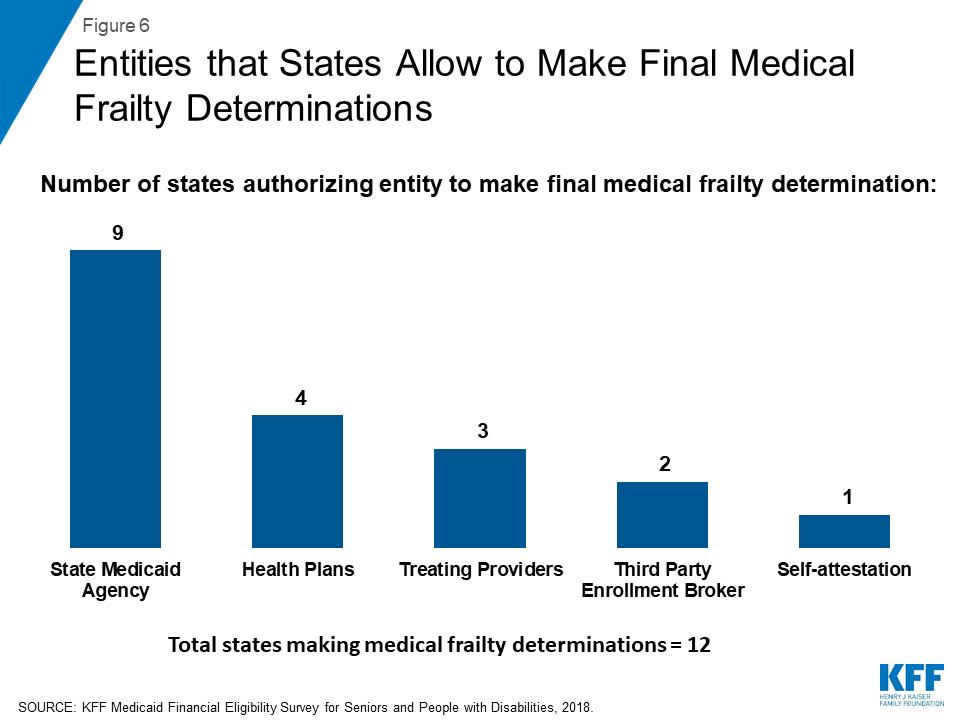
The state Medicaid agency makes the final medical frailty determination in most states (Figure 6 and Appendix Table). Other entities that states allow to make final medical frailty determinations are health plans, treating providers, and third party enrollment brokers. Individuals whose medical frailty status is denied or terminated can appeal that decision by requesting a state fair hearing in most states. In Indiana, an enrollee’s initial appeal of a medical frailty determination goes through the health plan appeals process before proceeding to a state fair hearing. Two states (NH and WV) report that a formal appeals process is not applicable because they accept enrollee self-attestation to establish medical frailty.33
Figure 6: Entities that States Allow to Make Final Medical Frailty Determinations
Half of the states require medical frailty status to be renewed annually. These states include Arkansas, Indiana, Michigan, Montana, Nevada, and New Jersey. It is important that enrollees know about and are able to successfully navigate the medical frailty renewal process so that eligible individuals remain connected to coverage and the appropriate benefit package. The other six states review medical frailty status based on service need or a change in circumstances.
Looking Ahead
State rules and processes vary among states, and the complexity of the process can affect the extent to which Medicaid enrollees are appropriately identified as medically frail and therefore retain access to the benefit package and coverage for which they are eligible. The medical frailty process recognizes that not all people with physical and mental health needs are eligible for Medicaid based on a disability and is intended to ensure that these enrollees can access the benefit package that best meets their needs. However, if enrollees do not understand and have difficulty navigating the process, medical frailty determinations will not protect enrollees as intended. Medical frailty determinations are assuming even greater importance with the increase in Section 1115 waivers that place additional restrictions on eligibility and benefits but exempt medically frail enrollees. Policy developments in this area and assessments of whether state medical frailty criteria and procedures are appropriately identifying all eligible individuals will be important areas to continue to watch as Medicaid expansion and state implementation of restrictive waiver policies continues.
Appendix
Appendix Table 1: State Policy Choices About Medical Frailty Determinations for ACA Expansion Adults, 2018
State
Who can identify someone as Medically Frail?
Who makes the final Medically Frail Determination?
Self
State
Health Plan
Provider
Enrollment Broker
State
Health Plan
Provider
Enrollment Broker
TOTAL
8
3
6
6
1
9
4
2
2
Arkansas
✓
✓
✓
California
✓
✓
✓
✓
Indiana*
✓
✓
Iowa
✓
✓
✓
✓
Massachusetts
✓
✓
Michigan
✓
✓
✓
✓
✓
✓
Montana
✓
✓
✓
✓
✓
Nevada
✓
✓
✓
✓
New Hampshire
✓
New Jersey
✓
✓
✓
North Dakota
✓
✓
✓
✓
✓
West Virginia
✓
✓
NOTES: NR = No response. *Indiana’s Section 1115 waiver also requires it to determine medical frailty for traditional low-income parents in addition to ACA expansion adults.
SOURCE: Kaiser Family Foundation, Medicaid Financial Eligibility Survey for Seniors and People with Disabilities, 2018.
(continued below)
Appendix Table 1 (continued): State Policy Choices About Medical Frailty Determinations for ACA Expansion Adults, 2018
State
When is Medical Frailty Determined?
How is Medically Frail Status Verified?
Application
Renewal
During Eligibility Period
Claims data
Data Match
Self-Attestation
Provider Certification
Medical Records
TOTAL
11
11
11
2
1
7
4
3
Arkansas
✓
✓
✓
NR
NR
NR
NR
NR
California
✓
✓
✓
✓
Indiana*
✓
✓
✓
✓
✓
✓
Iowa
✓
✓
✓
✓
✓
Massachusetts
✓
✓
✓
✓
Michigan
✓
✓
✓
✓
✓
✓
Montana
✓
✓
✓
✓
Nevada
✓
✓
✓
NR
New Hampshire
✓
✓
✓
✓
New Jersey
✓
✓
North Dakota
✓
✓
✓
✓
✓
West Virginia
✓
✓
✓
✓
NOTES: NR = No response. *Indiana’s Section 1115 waiver also requires it to determine medical frailty for traditional low-income parents in addition to ACA expansion adults.
SOURCE: Kaiser Family Foundation, Medicaid Financial Eligibility Survey for Seniors and People with Disabilities, 2018.
Endnotes
For other survey findings, including state-level data on Medicaid financial eligibility criteria and adoption of key age and disability-related pathways, options to expand financial eligibility for Medicaid long-term services and supports, Medicaid assistance with out-of-pocket costs for low-income Medicare beneficiaries, state choices about whether to adopt optional age and disability-related pathways in light of states’ ACA expansion status, and state adoption of optional streamlined eligibility renewal procedures, see Kaiser Family Foundation, Medicaid Financial Eligibility for Seniors and People with Disabilities: Findings from a 50-State Survey (June 2019), https://modern.kff.org/medicaid/issue-brief/medicaid-financial-eligibility-for-seniors-and-people-with-disabilities-findings-from-a-50-state-survey/. ↩︎
Medically frail children must include those under 19 who are eligible for SSI, eligible under the Katie Becket option, in foster care or another out-of-home placement, receiving foster care or adoption assistance, or receiving services through a family-centered, community-based, coordinated care system receiving maternal and child health funds and those with serious emotional disturbances. 42 C.F.R. § 440.315 (f). ↩︎
42 U.S.C. § 1396a (k)(1); 42 C.F.R. § § 440.370, 440.380 (noting that states have the option to provide benchmark coverage to beneficiaries without regard to comparability or statewideness). The statute uses the former terminology, “benchmark benefits.” In its July 2013 final rule, CMS began using the term “ABP.” 78 Fed. Reg. 42160 (July 15, 2013). ↩︎
Most adult Medicaid enrollees receive the state plan benefit package, which includes certain services that all states participating in Medicaid must cover and any optional services that the state chooses to cover. 42 U.S.C. § § 1396a (a)(10); 1396d (a)(1)-(29); 1396n (g), (i), (j), (k); 1396w-4. ↩︎
The process for doing so is summarized at 78 Fed. Reg. 42238. ↩︎
State plan HCBS include those available under the § 1915 (i) state plan option, § 1915 (j) self-directed personal assistance services, and § 1915 (k) Community First Choice attendant services and supports. 42 C.F.R. § 440.330 (d). ↩︎
42 C.F.R. § 440.345(d). The specific services in each EHB category are determined by those that are included in the commercial insurance plan that the state selects as its EHB benchmark. An EHB benchmark is one of several commercial insurance plans that the state selects and may differ from the state’s ABP benchmark. If the state’s EHB benchmark plan does not include any services within an entire EHB category, the state supplements the ABP by including all of the services in that category from another of the EHB benchmark plan choices. However, if the state’s EHB benchmark plan does not include any habilitative services, the state instead may choose to define the scope of that coverage for the expansion ABP. After the state determines the contents of the 10 EHB categories for its expansion adult ABP, the state then may substitute actuarially equivalent benefits within a single EHB category. ↩︎
42 C.F.R. § 440.345 (f). Other populations that cannot be required to enroll in an ABP and instead must have access to the full state plan benefit package include people who are blind or have disabilities (regardless of whether they are eligible for SSI); children with disabilities eligible under the Katie Beckett state plan option; people dually eligible for Medicare and Medicaid; people who are terminally ill and receiving hospice care; people who live in institutions and receive only a personal needs allowance; people with developmental disabilities and seniors who qualify for nursing facility or equivalent institutional services or home and community-based waiver services; women receiving treatment for breast or cervical cancer; people who qualify for Medicaid based on TB infection; and people who qualify for Medicaid as medically needy based on a spend down. 42 U.S.C. § 1396a (k)(1). Technically, beneficiaries in the adult expansion group who meet an ABP exemption “must be given the option of an Alternative Benefit Plan that includes all benefits available under the approved State plan” instead of being required to receive the ABP that the state has selected for the expansion group. 42 C.F.R. § 440.315. Exempt beneficiaries must have access to the full Medicaid state plan benefit package unless they instead choose to receive the expansion adult ABP. States must inform exempt beneficiaries about how benefits and cost-sharing in the expansion adult ABP compares to the benefits and cost-sharing in the Medicaid state plan and how to enroll in and disenroll from the expansion adult ABP. 42 C.F.R. § 440.320. ↩︎
See, e.g., AZ SPA #14-006 (April 1, 2014) (noting that providing newly eligible adults with full state plan benefits “will help minimize disruptions for individuals who move among different eligibility categories”); CO SPA #13-0055 (Feb. 10, 2014) (noting that the ABP benchmark plan is the same as the Marketplace benchmark plan and that offering state plan services in the expansion ABP will “ease transitions as clients churn”); OR SPA #13-0019 (Jan. 9, 2014) (noting that the EHB benchmark plans in the ABP and Marketplace are the same and that aligning the ABP with state plan benefits will help minimize disruptions for people who move among benefit packages). ↩︎
ACA expansion adults are a mandatory coverage group in the statute, although the Supreme Court’s 2012 ruling on the ACA’s constitutionality effectively made adoption of the expansion optional for states. Kaiser Family Foundation, A Guide to the Supreme Court’s Decision on the ACA’s Medicaid Expansion (Aug. 2012), https://modern.kff.org/health-reform/issue-brief/a-guide-to-the-supreme-courts-decision/. ↩︎
SSI beneficiaries have an impaired ability to work at a substantial gainful level as a result of old age or significant disability. ↩︎
The maximum SSI benefit is 74% of the federal poverty level (FPL, $9,252/year for an individual in 2019), and the asset limit for an individual is $2,000. The ACA Medicaid expansion covers individuals up to 138% FPL ($17,236/year for an individual in 2019) without an asset test in states that opt to adopt it. States also have the option to extend financial eligibility for disability-related Medicaid coverage pathways up to 300% of SSI ($27,756/year for an individual in 2019). ↩︎
People with disabilities may qualify for Medicaid in traditional poverty-related pathways (such as low-income parents or children), although financial eligibility limits for adults in non-expansion states remain low. Under the ACA, all children in families with income up to 138% FPL are eligible for Medicaid regardless of whether they have a disability. However, the median financial eligibility limit for parents in non-expansion states is 40% FPL ($693 per month for a family of 3 in 2018; $711/month for a family of 3 in 2019), and only one non-expansion state (WI) offers any pathway to coverage based solely on low income for childless adults as of January 2019. Kaiser Family Foundation, Medicaid and CHIP Eligibility, Enrollment, and Cost Sharing Policies as of January 2019: Findings from a 50-State Survey (March 2019), https://modern.kff.org/medicaid/report/medicaid-and-chip-eligibility-enrollment-and-cost-sharing-policies-as-of-january-2019-findings-from-a-50-state-survey/. ↩︎
Two other states (AZ and OH) have approved Section 1115 waivers that will require a medical frailty determination when implemented. In addition, KY’s waiver has restrictions that would require a medical frailty determination, but that waiver has been set aside by a court and has not yet been implemented. AR also has additional waiver provisions that exempt medically frail enrollees but have been set aside by a court. See generally Kaiser Family Foundation, Medicaid Waiver Tracker: Approved and Pending Section 1115 Waivers by State (April 18, 2019), https://modern.kff.org/medicaid/issue-brief/medicaid-waiver-tracker-approved-and-pending-section-1115-waivers-by-state/. ↩︎
Medically frail enrollees are exempt from prior authorization requirements. ↩︎
Medically frail enrollees retain access to NEMT, which is waived for other enrollees. ↩︎
However, medically frail enrollees are still disenrolled from coverage for failure to timely renew eligibility. ↩︎
Five states (CA, MI, NV, NH, and WV) were unable to report this data. ↩︎
NH did not respond to this question as it accepts enrollee self-attestation for medical frailty. ↩︎
The Medicare Part D prescription drug benefit has helped improve the affordability of medications for people with Medicare. Yet Part D enrollees can face relatively high out-of-pocket costs because the Part D benefit does not have a hard cap on out-of-pocket spending. For drug costs above the catastrophic threshold, enrollees are required to pay up to 5 percent of their total drug costs, unless they receive low-income subsidies (LIS) that help pay Part D premiums and cost sharing.
1 million Medicare beneficiaries had out-of-pocket prescription drug spending above the Part D catastrophic threshold in 2017, with such spending on drugs averaging more than $3,200 per person.
As policymakers continue to discuss ways to reduce Medicare prescription drug spending, proposals to place a hard cap on out-of-pocket spending in Part D have gained bipartisan support in the 116th Congress. This analysis presents the latest data on out-of-pocket drug spending among Medicare Part D enrollees without the LIS who have costs above the catastrophic threshold, referred to here as enrollees with high out-of-pocket drug costs.
Key Findings
In 2017, 1 million Medicare Part D enrollees had out-of-pocket spending above the catastrophic threshold, with average annual out-of-pocket costs exceeding $3,200—over six times the average for all non-LIS enrollees.
Treatments for autoimmune diseases, hepatitis C, and certain types of cancer were among the 10 highest-cost medications for these 1 million enrollees in 2017, with annual out-of-pocket spending per drug for each of the 10 medications averaging over $5,000.
Part D enrollees without low-income subsidies who had high out-of-pocket drug costs in 2017 would have collectively saved $1.4 billion if Part D had a hard cap on out-of-pocket spending that year, rather than requiring enrollees to pay up to 5% coinsurance in the catastrophic phase.
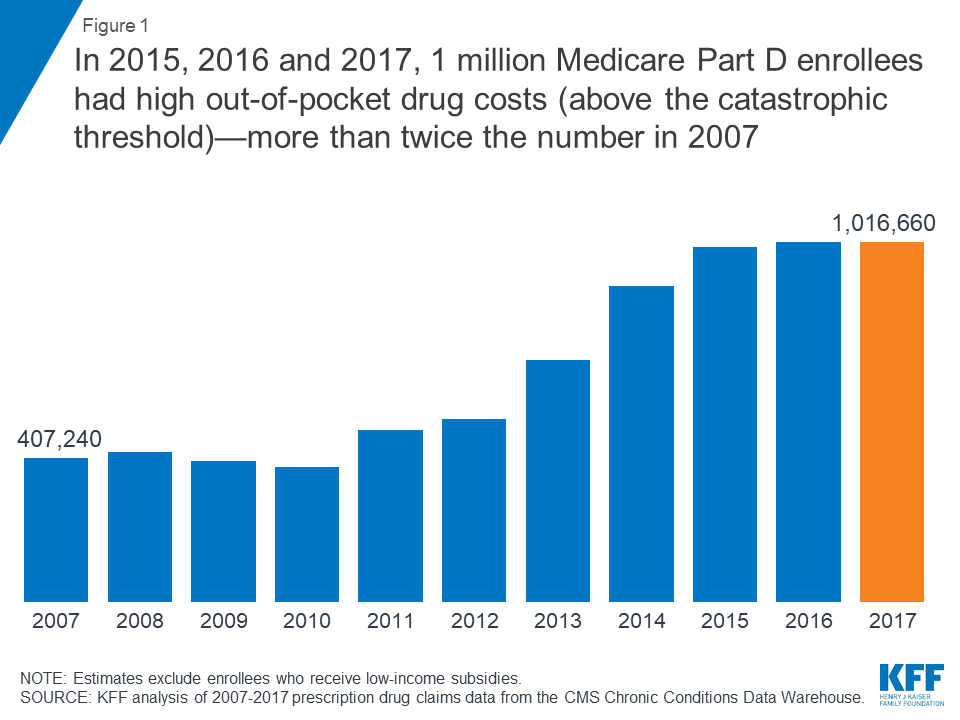
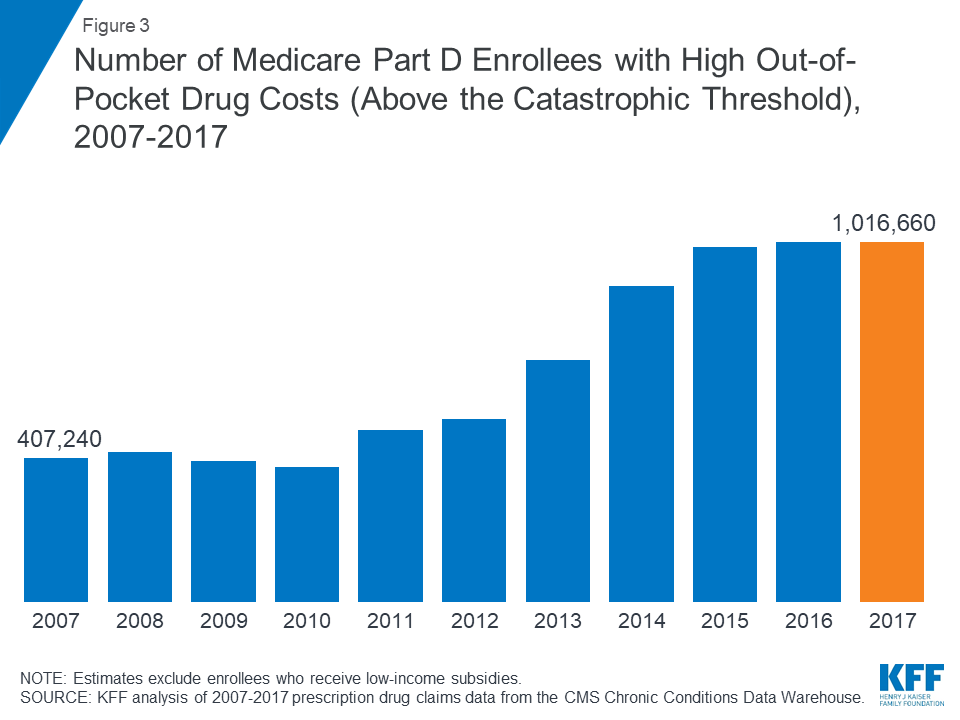
Figure 1: In 2015, 2016 and 2017, 1 million Medicare Part D enrollees had high out-of-pocket drug costs (above the catastrophic threshold)—more than twice the number in 2007
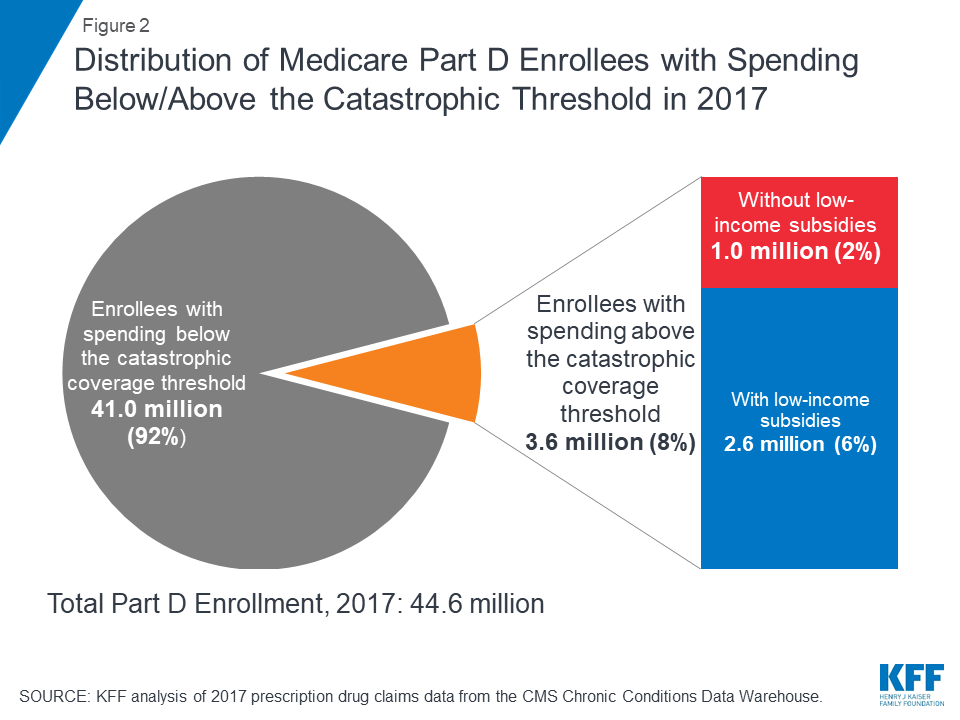
Nearly 1 in 10 Medicare Part D enrollees had drug spending above the catastrophic coverage threshold in 2017, most of whom received low-income subsidies—but 1 million did not
Figure 2: Distribution of Medicare Part D Enrollees with Spending Below/Above the Catastrophic Threshold in 2017
In 2017, 3.6 million Medicare Part D enrollees had total drug spending above the catastrophic coverage threshold, which equaled $8,071 in total drug costs that year. This equals 8% of the 44.6 million Medicare beneficiaries enrolled in Part D plans in 2017. Of this total, 2.6 million enrollees (72%) received low-income subsidies (LIS) to help pay their Part D plan premiums and cost sharing, but 1 million enrollees (28%) did not receive these additional subsidies and were therefore not protected against having high out-of-pocket drug costs.
In 2015, 2016 and 2017, 1 million Medicare Part D enrollees without low-income subsidies had high out-of-pocket drug costs (above the catastrophic threshold)—more than twice the number in 2007
Figure 3: Number of Medicare Part D Enrollees with High Out-of-Pocket Drug Costs (Above the Catastrophic Threshold), 2007-2017
Between 2007 and 2015, the number of Part D enrollees without low-income subsidies who had spending above the catastrophic coverage threshold more than doubled. In each year between 2015 and 2017, 1 million Part D enrollees had high out-of-pocket drug costs.
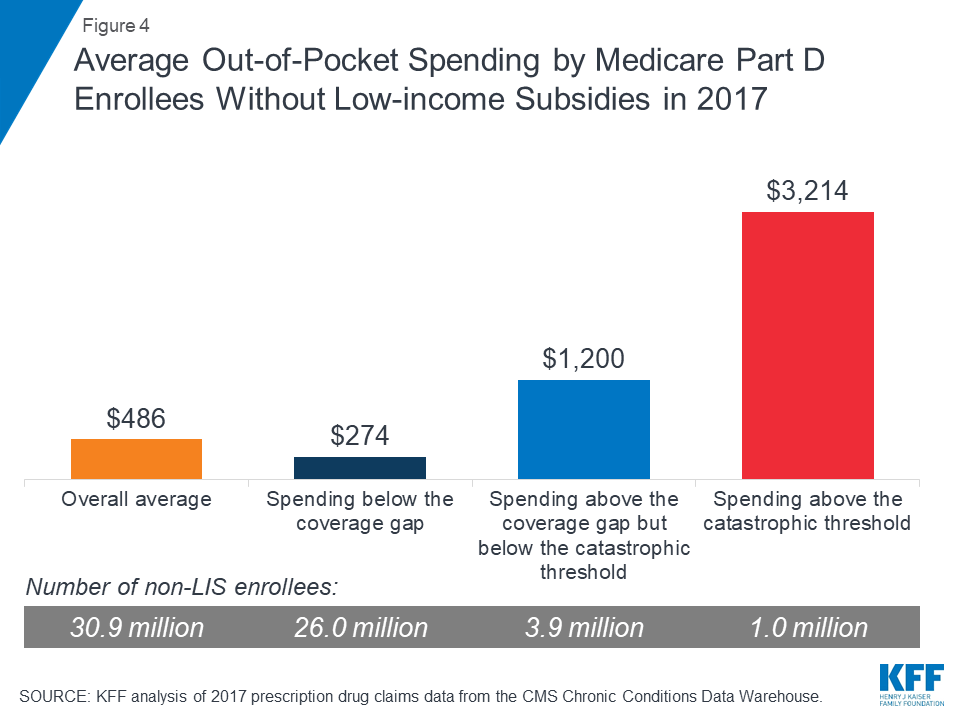
Part D enrollees with high out-of-pocket drug costs spent over $3,200 out-of-pocket in 2017, more than 6 times overall average out-of-pocket costs among non-LIS enrollees
Figure 4: Average Out-of-Pocket Spending by Medicare Part D Enrollees Without Low-income Subsidies in 2017
On average, Part D enrollees with high out-of-pocket drug costs spent $3,214 for prescriptions in 2017. This is more than six times average out-of-pocket spending by enrollees without the LIS overall ($486), and more than 2.5 times average out-of-pocket spending by enrollees without the LIS who had spending in the coverage gap but not above the catastrophic threshold ($1,200). Enrollees without the LIS who did not have spending high enough to reach the coverage gap spent $274 out of pocket in 2017.
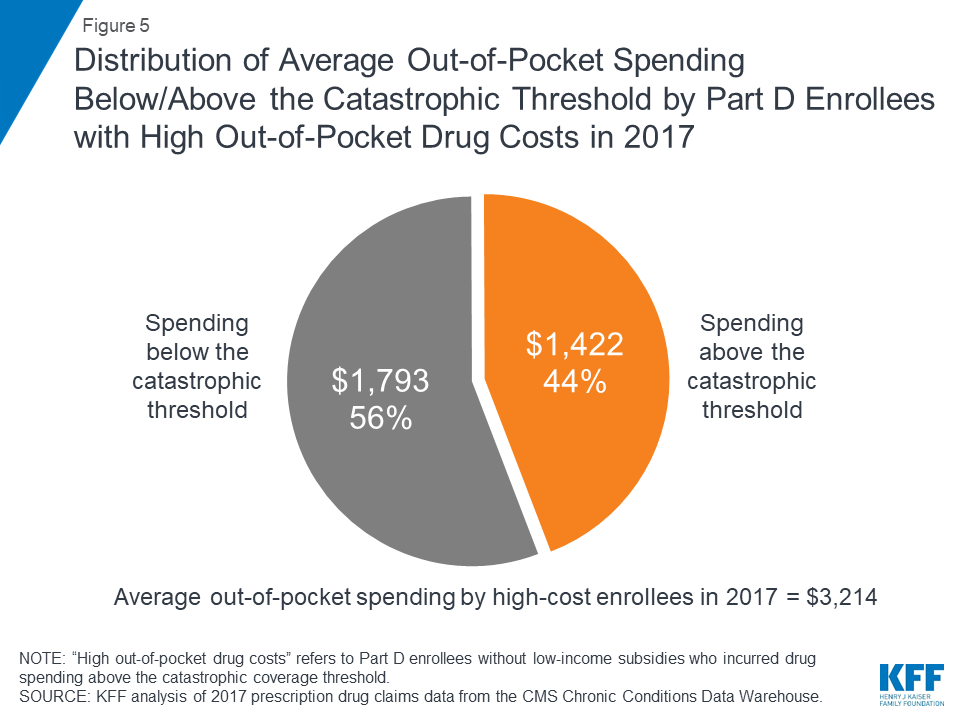
Medicare Part D enrollees with high out-of-pocket drug costs incurred 44% of their total out-of-pocket costs above the catastrophic coverage threshold in 2017
Figure 5: Distribution of Average Out-of-Pocket Spending Below/Above the Catastrophic Threshold by Part D Enrollees with High Out-of-Pocket Drug Costs in 2017
Of their total out-of-pocket costs, non-LIS Part D enrollees with high out-of-pocket costs spent an average of $1,793 (56%) below the catastrophic threshold and $1,422 (44%) above the threshold in 2017. In the aggregate, these Part D enrollees with high out-of-pocket costs spent $1.4 billion on their prescription drug costs above the catastrophic coverage threshold in 2017.
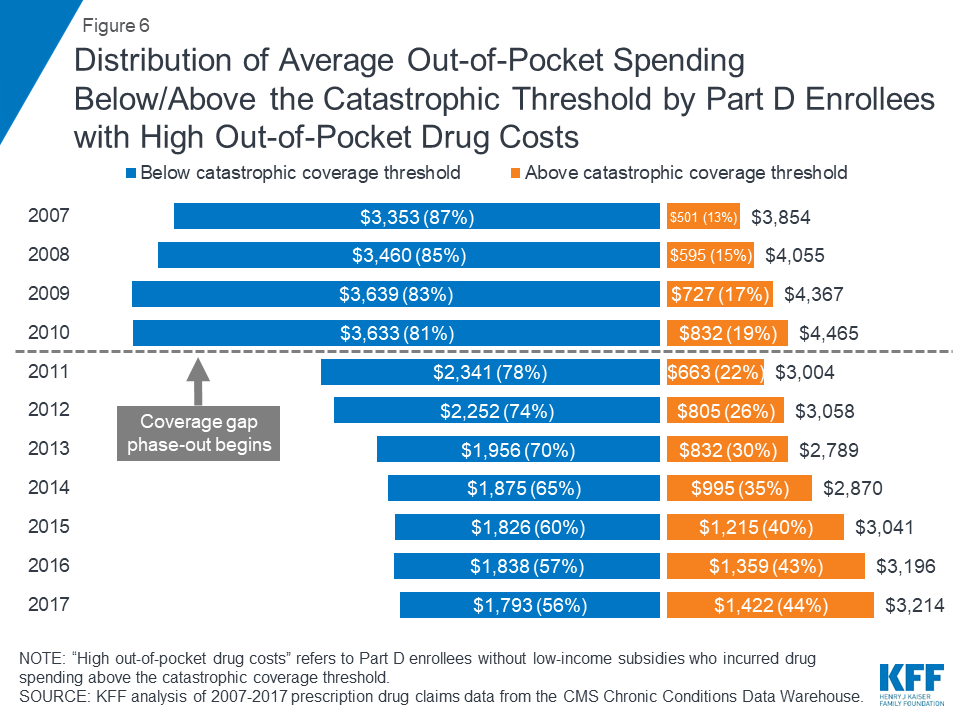
Over time, Part D enrollees with high out-of-pocket drug costs have spent more out of pocket in the catastrophic coverage phase, from 13% in 2007 to 44% in 2017
Figure 6: Distribution of Average Out-of-Pocket Spending Below/Above the Catastrophic Threshold by Part D Enrollees with High Out-of-Pocket Drug Costs
Although total out-of-pocket spending among Part D enrollees with high out-of-pocket drug costs is lower in 2017 than it was in 2007, the share of out-of-pocket spending in the catastrophic coverage phase among these enrollees has increased over time: from 13% in 2007 to 44% in 2017. This increase is related to changes in the Part D benefit design made by the Affordable Care Act (ACA) that have accelerated the pace of beneficiaries moving through the coverage gap and into the catastrophic phase—namely, the phase-out of the coverage gap, with increasing plan liability for total costs over time and a manufacturer discount on brand-name drugs in the coverage gap.
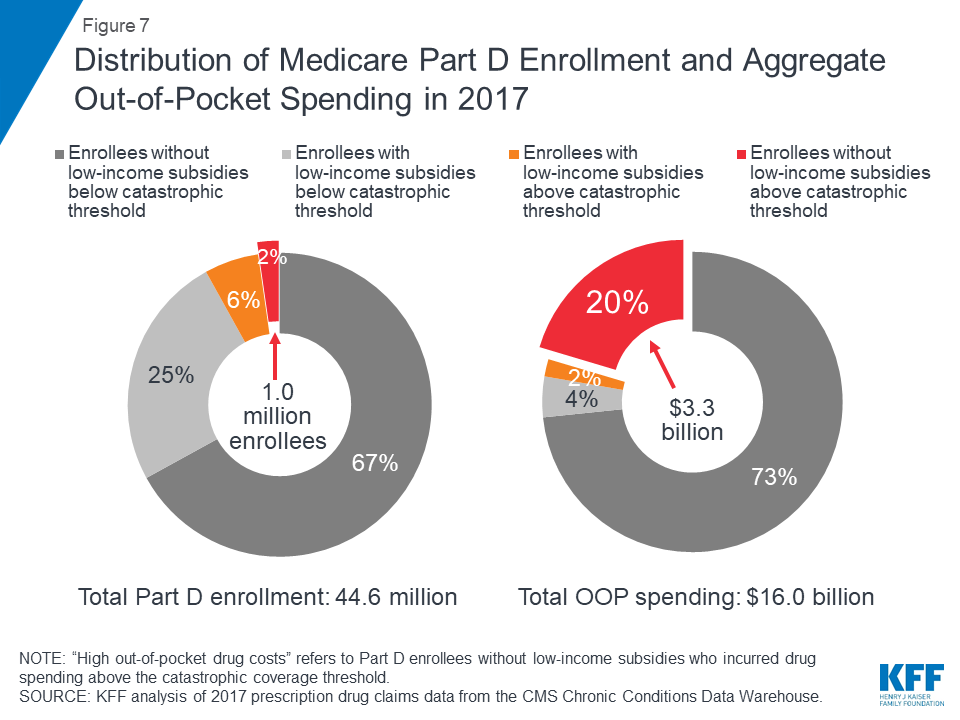
Part D enrollees with high out-of-pocket costs accounted for only 2% of all Part D enrollees in 2017, but their out-of-pocket costs represented 20% of the total
Figure 7: Distribution of Medicare Part D Enrollment and Aggregate Out-of-Pocket Spending in 2017
A disproportionate share of aggregate out-of-pocket drug spending by all Medicare beneficiaries enrolled in Part D is accounted for by enrollees without low-income subsidies who face high out-of-pocket costs (above the catastrophic coverage threshold). In 2017, beneficiaries in Part D plans spent a total of $16 billion out of pocket on prescription drugs. Part D enrollees with high out-of-pocket drug costs accounted for 20% of aggregate out-of-pocket drug spending by all enrollees ($3.3 billion), even though they comprised just 2% of all Part D enrollees.
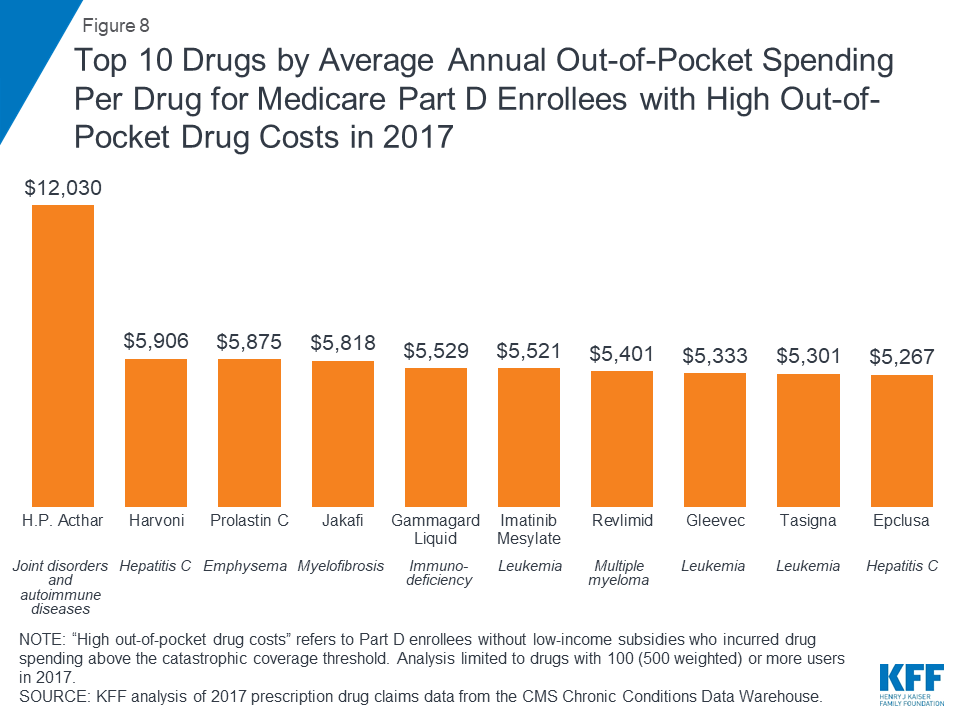
Drugs to treat hepatitis C and cancer were among the 10 drugs with the highest annual out-of-pocket costs per drug for Medicare Part D enrollees with high out-of-pocket drug costs in 2017
Figure 8: Top 10 Drugs by Average Annual Out-of-Pocket Spending Per Drug for Medicare Part D Enrollees with High Out-of-Pocket Drug Costs in 2017
In 2017, H.P. Acthar, a treatment for joint disorders and autoimmune diseases, and Harvoni, a treatment for hepatitis C, were the two most expensive drugs, in terms of average per capita out-of-pocket spending per drug for Part D enrollees without low-income subsidies who had high out-of-pocket drug costs. On average, enrollees who faced high out-of-pocket drug costs in 2017 spent $12,030 for H.P. Acthar alone and $5,906 for Harvoni alone. Several cancer drugs were also among the top 10 drugs with the highest out-of-pocket costs per drug among non-LIS Part D enrollees with spending above the catastrophic threshold in 2017, including Jakafi ($5,818), Gleevec ($5,333), and its generic equivalent, imatinib mesylate ($5,521). Part D enrollees using any of these medications who incurred these high out-of-pocket costs per drug would have spent even more out of pocket in 2017 if were also taking other medications.
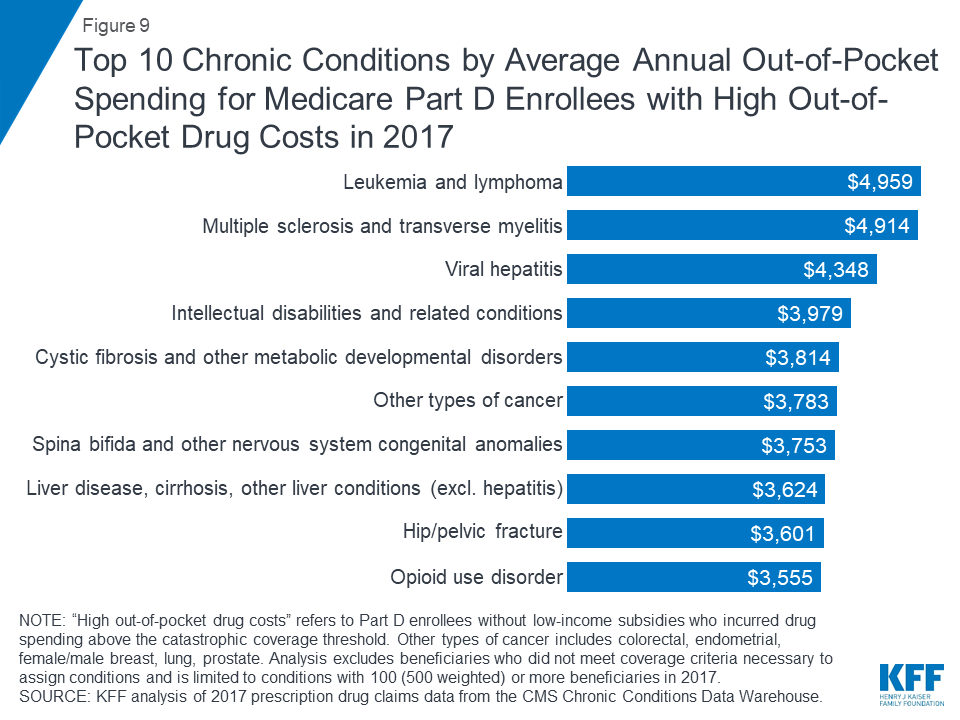
In 2017, Part D enrollees in stand-alone drug plans with leukemia and lymphoma who had high out-of-pocket drug costs spent more on their drugs than those with other conditions—nearly $5,000, on average
Figure 9: Top 10 Chronic Conditions by Average Annual Out-of-Pocket Spending for Medicare Part D Enrollees with High Out-of-Pocket Drug Costs in 2017
Among stand-alone prescription drug plan (PDP) enrollees without low-income subsidies who had high out-of-pocket drug costs, those with leukemia and lymphoma incurred the highest average out-of-pocket drug spending in 2017 ($4,959), followed by those with multiple sclerosis ($4,914), and those with viral hepatitis ($4,348).
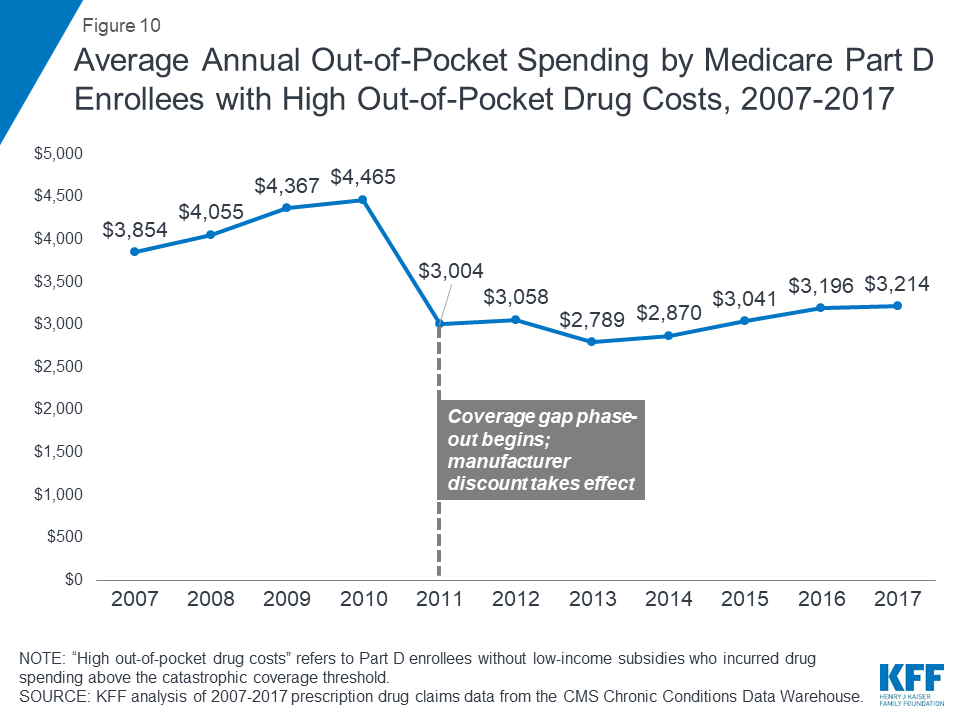
Average out-of-pocket spending by non-LIS Part D enrollees with high out-of-pocket drug costs decreased when the coverage gap phase-out started in 2011—but is on the rise
Figure 10 : Average Annual Out-of-Pocket Spending by Medicare Part D Enrollees with High Out-of-Pocket Drug Costs, 2007-2017
With the ACA provisions to phase out the coverage gap taking effect in 2011, average out-of-pocket spending by Part D enrollees who incur high out-of-pocket costs was lower in 2017 than it was in 2010, before the gap coverage phase-out began. The first-year effect of the ACA changes was a substantial reduction in spending by Part D enrollees who incurred high out-of-pocket drug costs, after increasing every year between 2007 and 2010. But this trend has reversed in recent years.
Between 2010 and 2011, average out-of-pocket spending by Part D enrollees with high out-of-pocket drug costs declined 33%, from $4,465 to $3,004, as the ACA coverage gap phase-out began. But between 2011 and 2017, the average increased by 7%, to $3,214, as new high-cost drugs came to market and prices for existing drugs increased.
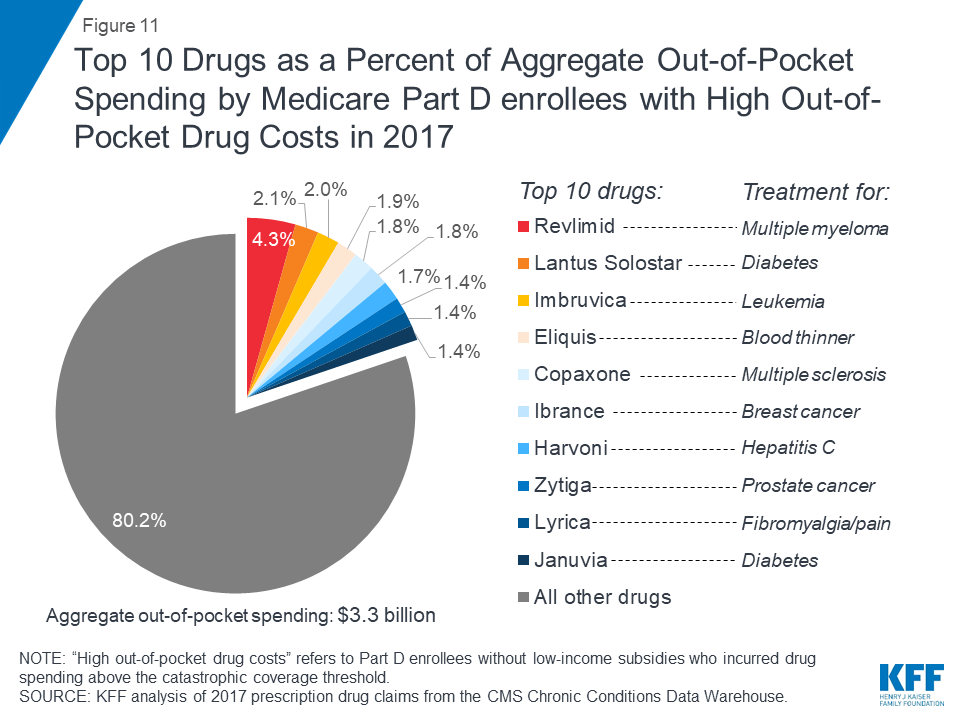
Ten brand-name drugs accounted for 20% of aggregate out-of-pocket spending by Medicare Part D enrollees with high out-of-pocket drug costs in 2017
Figure 11: Top 10 Drugs as a Percent of Aggregate Out-of-Pocket Spending by Medicare Part D enrollees with High Out-of-Pocket Drug Costs in 2017
Ten brand-name drugs accounted for 20% of the $3.3 billion in aggregate out-of-pocket spending by Part D enrollees without low-income subsidies who had high out-of-pocket drug costs in 2017. One drug alone—Revlimid, a treatment for multiple myeloma—accounted for 4% of total out-of-pocket costs among the high-spending population without the LIS in 2017, while the top three drugs—Revlimid, Lantus Solostar, a diabetes drug, and Imbruvica, a treatment for leukemia and lymphoma—accounted for 8.5%.
Juliette Cubanski and Tricia Neuman are with the Kaiser Family Foundation.Anthony Damico is an independent consultant.
Methods
Data and Methods
This analysis uses Medicare Part D prescription drug event (PDE) claims data from the Centers for Medicare & Medicaid Services (CMS) Chronic Conditions Data Warehouse (CCW) for Part D enrollees between 2007 and 2017. The PDE claims data includes all prescription drug events reported by Part D plans for their enrollees in a given calendar year, and includes detailed data on spending for each event, corresponding to a single prescription drug fill, including how much was paid by plans, low-income subsidy amounts, and beneficiary out-of-pocket payments. The claims data includes spending for Part D covered drugs, but does not include spending on Part D plan premiums, Part B covered drugs (which are typically administered in providers’ offices or hospital outpatient settings), or the cost of drugs purchased outside the Part D plan. The CCW data also includes flags for several chronic conditions (27 common chronic conditions and 35 other chronic or potentially disabling conditions).
We calculated average out-of-pocket spending for enrollees overall and by benefit phases. Our analysis focuses on beneficiaries enrolled in both stand-alone prescription drug plans (PDPs) and Medicare Advantage prescription drug plans (MA-PDs) who have high out-of-pocket drug costs, which we define as enrollees who have drug spending that exceeds the catastrophic coverage threshold in a given year who do not receive low-income subsidies (LIS). The catastrophic threshold is updated annually by the annual percentage increase in average expenditures for Part D drugs per eligible beneficiary; in 2017, the threshold amount was $8,071. The 2017 20% PDE sample includes 8.9 million Part D enrollees (44.6 million weighted), of whom 718,276 (3.6 million weighted) had spending above the catastrophic coverage threshold, including 203,332 (1.0 million weighted) who had high out-of-pocket drug costs and did not receive the LIS. Our analysis of spending by chronic condition excludes beneficiaries who did not meet coverage criteria necessary to assign conditions, including those with multiple months of Medicare Advantage enrollment. This is because the CCW variables that identify chronic conditions are defined algorithmically based on information in medical claims, which are not available for Medicare Advantage enrollees.
Our analysis of chronic conditions and specific drugs associated with high out-of-pocket spending was limited to conditions and drugs with 100 (500 weighted) or more non-LIS beneficiaries with high out-of-pocket drug costs in 2017 to avoid reporting estimates based on small sample size. For specific drugs, there are two drugs that had higher average out-of-pocket costs among Part D enrollees with high out-of-pocket spending than the top drug we report (H.P. Acthar), but the number of non-LIS users of each of those drugs in the CCW PDE for 2017 was less than 20. Therefore, our analysis of the 10 most expensive drugs among those with high out-of-pocket costs is conservative to the extent that it does not include some drugs with higher out-of-pocket costs but smaller sample sizes.
Appendix
Medicare Part D Enrollees Without Low-income Subsidies (LIS) With Drug SpendingAbove the Catastrophic Threshold in 2017, by State
Total non-LIS enrollees
Number reaching catastrophic coverage
Share reaching catastrophic coverage
U.S. Total
30,890,515
1,016,660
3.3%
Alabama
480,465
16,340
3.4%
Alaska
18,840
780
4.1%
Arizona
686,495
19,480
2.8%
Arkansas
285,040
8,105
2.8%
California
3,202,915
86,010
2.7%
Colorado
489,630
12,030
2.5%
Connecticut
338,195
11,380
3.4%
Delaware
114,540
4,630
4.0%
D.C.
20,835
670
3.2%
Florida
2,391,780
71,060
3.0%
Georgia
814,405
31,455
3.9%
Hawaii
142,185
3,745
2.6%
Idaho
166,270
4,120
2.5%
Illinois
1,178,110
38,915
3.3%
Indiana
699,780
25,415
3.6%
Iowa
380,250
11,905
3.1%
Kansas
294,230
10,065
3.4%
Kentucky
458,755
16,835
3.7%
Louisiana
396,365
12,455
3.1%
Maine
147,390
3,730
2.5%
Maryland
439,465
16,015
3.6%
Massachusetts
665,075
18,595
2.8%
Michigan
1,227,025
36,550
3.0%
Minnesota
602,620
15,810
2.6%
Mississippi
244,450
8,005
3.3%
Missouri
684,475
21,260
3.1%
Montana
116,325
3,120
2.7%
Nebraska
197,985
6,910
3.5%
Nevada
265,050
7,695
2.9%
New Hampshire
149,445
4,095
2.7%
New Jersey
905,225
46,540
5.1%
New Mexico
182,375
4,295
2.4%
New York
1,780,670
78,015
4.4%
North Carolina
1,016,425
33,930
3.3%
North Dakota
74,090
2,765
3.7%
Ohio
1,363,430
42,175
3.1%
Oklahoma
342,205
13,530
4.0%
Oregon
464,680
11,910
2.6%
Pennsylvania
1,556,205
60,275
3.9%
Rhode Island
118,785
3,010
2.5%
South Carolina
534,015
19,520
3.7%
South Dakota
93,865
3,145
3.4%
Tennessee
681,910
22,275
3.3%
Texas
1,985,885
71,555
3.6%
Utah
219,350
6,230
2.8%
Vermont
73,305
2,245
3.1%
Virginia
687,875
22,950
3.3%
Washington
621,620
17,665
2.8%
West Virginia
199,860
6,770
3.4%
Wisconsin
635,630
18,955
3.0%
Wyoming
54,720
1,725
3.2%
SOURCE: KFF analysis of 2017 prescription drug claims data from the CMS Chronic Conditions Data Warehouse.
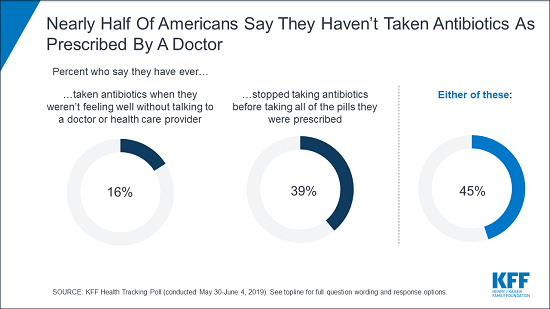
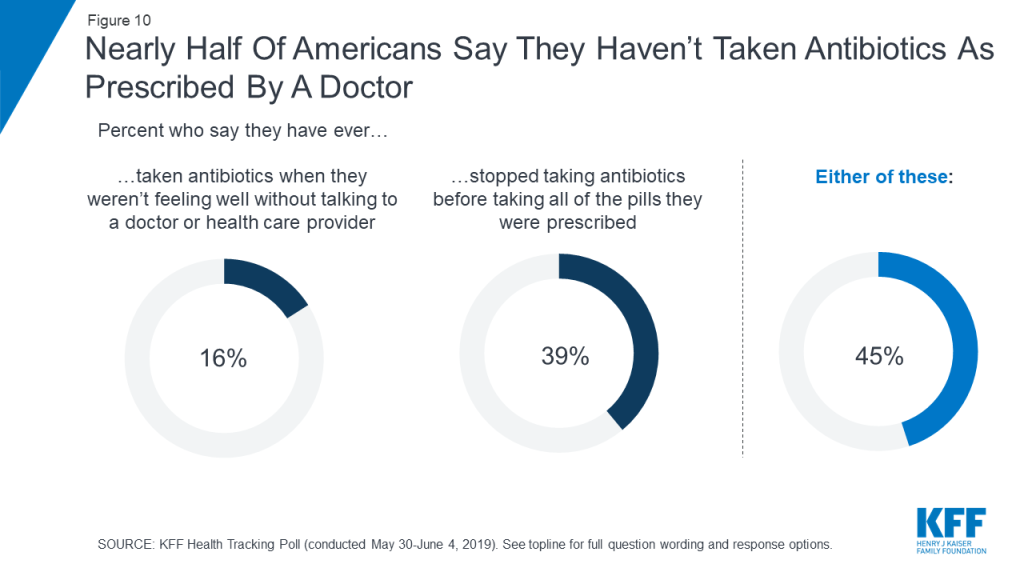
While most Americans believe that antibiotic resistance poses a public health problem, new KFF polling finds nearly half (45%) say they personally have not taken antibiotics as prescribed – one factor contributing to the rise of “superbugs” that are resistant to existing treatment.
Those misusing antibiotics includes people who say they took antibiotics without talking to a doctor or other provider (16%) and, more commonly, those who say that they did not finish a course of antibiotics (39%).
The new polling examines the public’s experiences and knowledge about antibiotic resistance, which occurs when bacteria and other germs change so that the antibiotic medicines designed to kill them no longer work.
Most Americans say that they have heard the various terms used to talk about the issue of the overuse of antibiotics including antibiotic resistance and superbugs, and they know what these terms mean.
Other findings include:
Most correctly say that antibiotics can usually cure bacterial infections (75%), though fewer correctly say that they can’t cure viral infections (45%). Knowledge about which illnesses can usually be cured by taking antibiotics varies based on gender, age, income, and education.
The public are similarly worried about antibiotic resistance and outbreaks of preventable diseases like measles and whooping cough affecting the country and their own families, but larger shares say they are “very worried” about the opioid epidemic’s impact on the country.
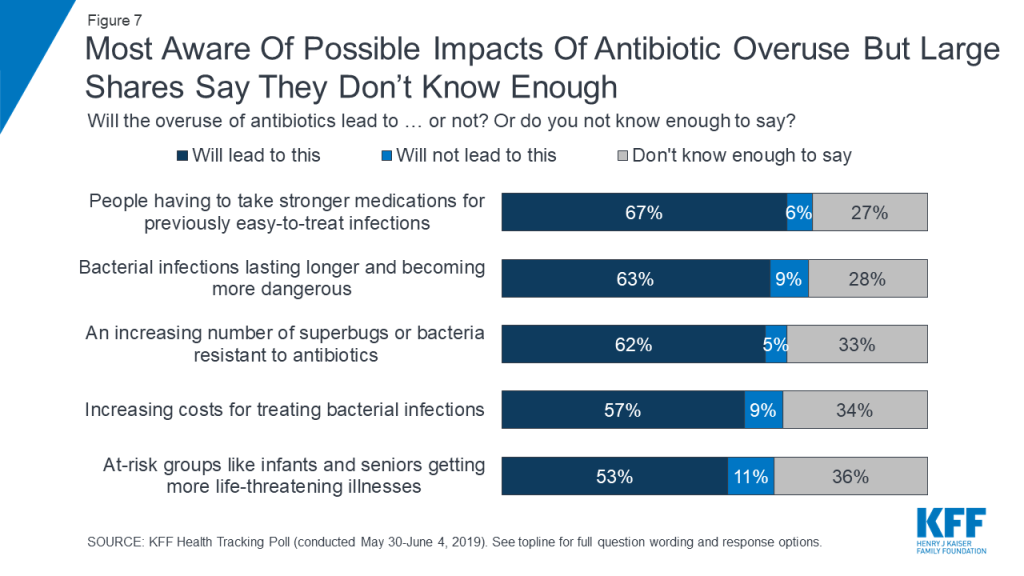
Most know about potential consequences from the overuse of antibiotics, including longer-lasting and more dangerous bacterial infections (63%), higher costs to treat such infections (57%), and more life-threatening illnesses affecting infants and seniors (53%). For each consequence, however, at least a third answer incorrectly or don’t know enough to say.
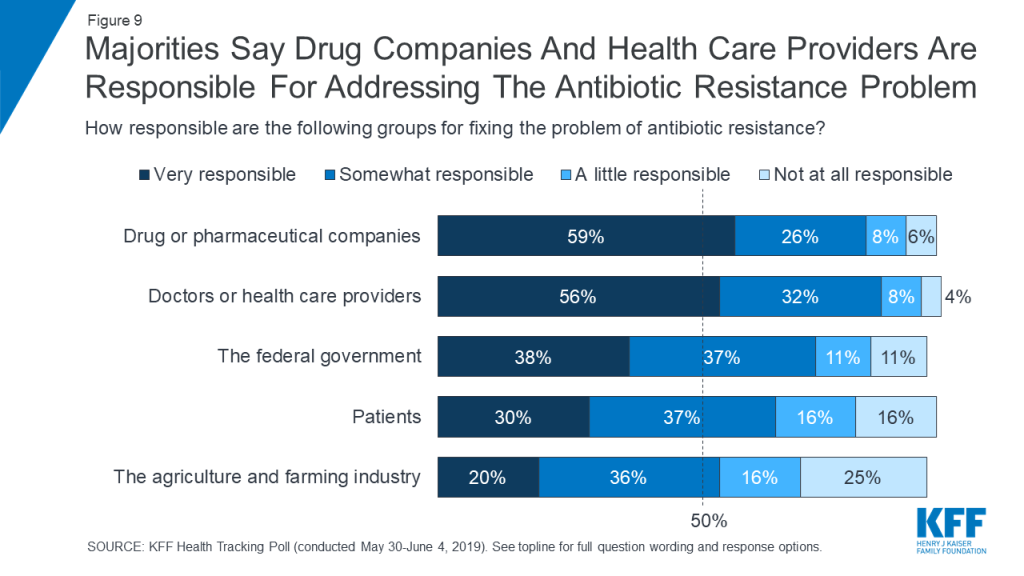
Most of the public says pharmaceutical companies (59%) and health care providers (56%) are “very responsible” for addressing the problem of antibiotic resistance. Fewer (30%) say patients are.
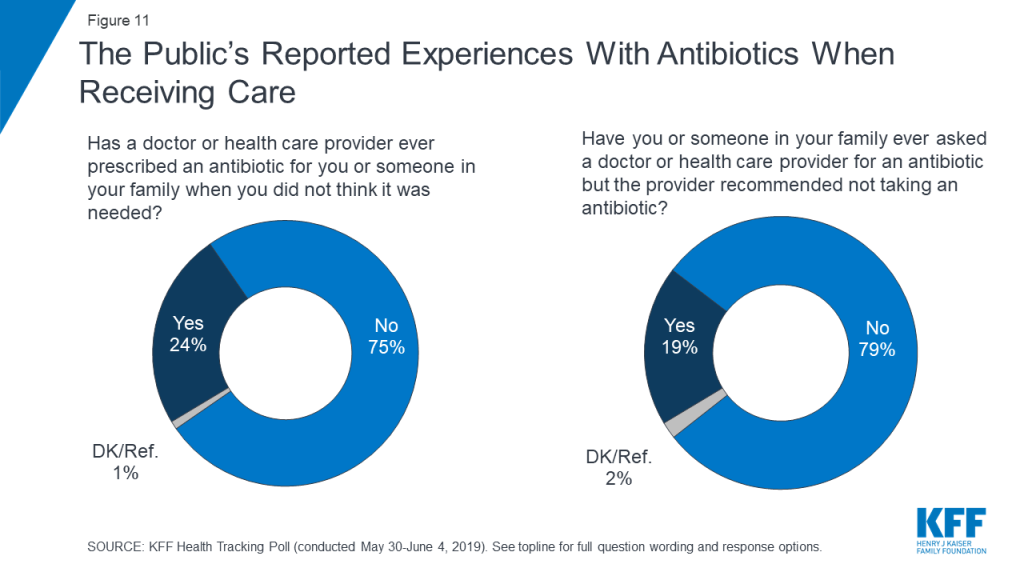
About a fourth (24%) say that a doctor or other provider prescribed an antibiotic for someone in their family that they didn’t think was necessary. About one in five (19%) say someone in their family asked a provider for an antibiotic but the provider recommended against it.
Designed and analyzed by public opinion researchers at KFF, the poll was conducted May 30-June 4, 2019 among a nationally representative random digit dial telephone sample of 1,206 adults. Interviews were conducted in English and Spanish by landline (298) and cell phone (908). The margin of sampling error is plus or minus 3 percentage points for the full sample. For results based on subgroups, the margin of sampling error may be higher.
This data note examines the public’s knowledge and concerns about antibiotic resistance, a topic of increasing importance to both the United States and the wider global health community. The World Health Organization ranked antibiotic resistance as one of the top ten threats to global health for the year 2019, and the U.S. Centers for Disease Control and Prevention estimates that antibiotic resistance causes over 2 million infections and 23,000 deaths in the U.S. each year.1,2
While a majority of the public say they have heard of antibiotic resistance and know what it means (71 percent) and most think the overuse of antibiotics is a major problem (53 percent), public knowledge of the issue is mixed. For example, while three-quarters are aware that bacterial infections can usually be cured with antibiotics, over half either incorrectly say that viral infections can be cured using antibiotics (27 percent) or that they do not know enough to say (28 percent).
Although the opioid epidemic ranks as the top public health concern among Americans, about one-third of the public says they are “very worried” about the impacts of antibiotic resistance in this country, and about a quarter says they are “very worried” about the impacts of it on them and their family.
Most of the public are aware of the possible negative implications of the overuse of antibiotics with two-thirds (67 percent) saying they are aware that the overuse of antibiotics will lead to people having to take stronger medications and about six in ten saying it will lead to longer lasting and more dangerous bacterial infections (63 percent) and an increasing number of bacteria resistant to antibiotics (62 percent). Yet, less than half of the public (39 percent) are aware that antibiotic resistance is unrelated to the outbreak of viruses such as measles.
45% of the public say they personally have not taken antibiotics as prescribed – a factor contributing to the rise of “superbugs” resistant to treatment. Learn more about the public’s views and knowledge about antibiotic resistance.
Nearly half of adults (45 percent) say they have personally not taken their antibiotics as prescribed by a doctor – one of the leading causes of antibiotic resistance. However, when it comes to who has responsibility for fixing the problem of antibiotic resistance, larger shares place responsibility on drug companies and health care providers than on patients.
Public Awareness of Antibiotic Resistance
This data note examines the public’s knowledge and concerns about antibiotic resistance and also gauges the public’s experiences using antibiotics and their interactions with doctor and health care providers. The data for this analysis comes from the June 2019 KFF Health Tracking Poll.
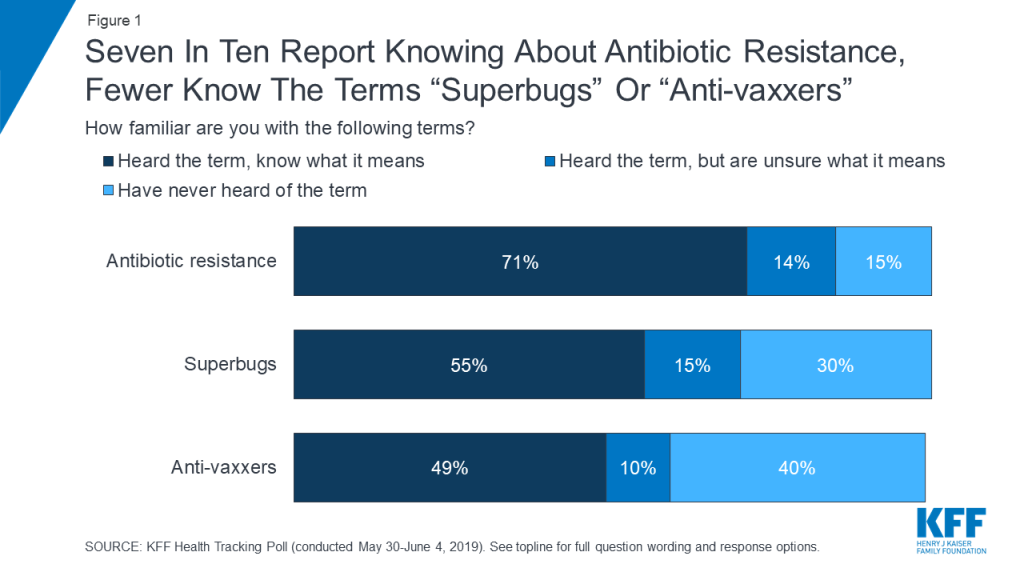
Most Americans say that they have heard various terms used to talk about the issue of the overuse of antibiotics including antibiotic resistance and superbugs. Seven in ten (71 percent) say they have heard of the term “antibiotic resistance” and know what it means, while an additional one in seven say that they have heard of the term but are unsure what it means (14 percent). A similar share (15 percent) say they have never heard of antibiotic resistance. A smaller share, but still a majority (55 percent), say that they have heard the term “superbugs” and know what it means. By comparison, fewer (49 percent) say they know the meaning of the term “anti-vaxxers” (individuals who are opposed to vaccinations), another public health concern that has been in the news recently.
Figure 1: Seven In Ten Report Knowing About Antibiotic Resistance, Fewer Know The Terms “Superbugs” Or “Anti-vaxxers”
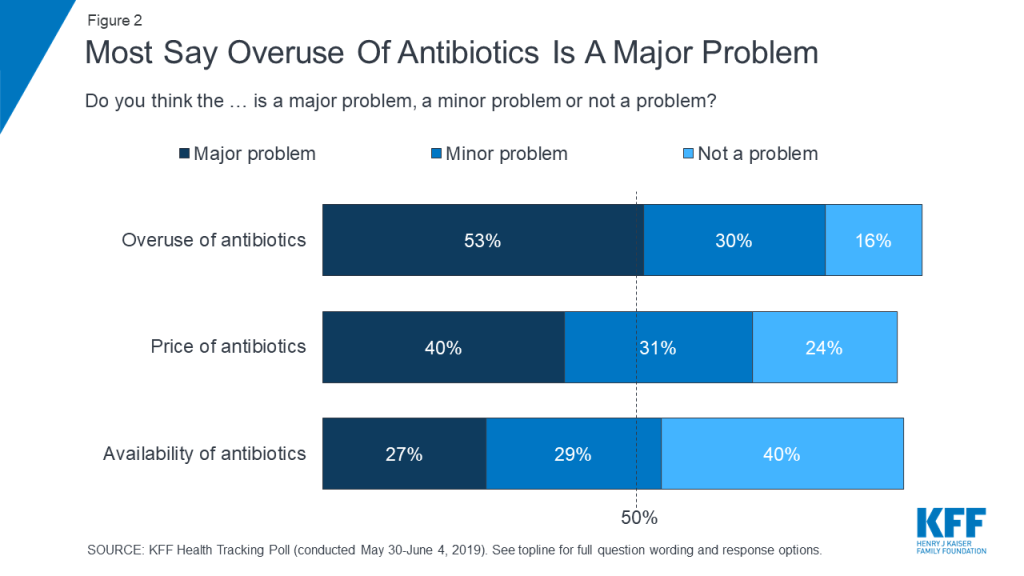
In addition to knowing the term, a majority of the public also believe the overuse of antibiotics is a problem. Half of the public (53 percent) says the overuse of antibiotics is a “major problem” while an additional three in ten say it is a “minor problem.” Smaller shares of the public say the same about the price of antibiotics (40 percent say it is a “major problem” while 31 percent say it is a “minor problem”) or the availability of antibiotics (27 percent and 29 percent, respectively).
Figure 2: Most Say Overuse Of Antibiotics Is A Major Problem
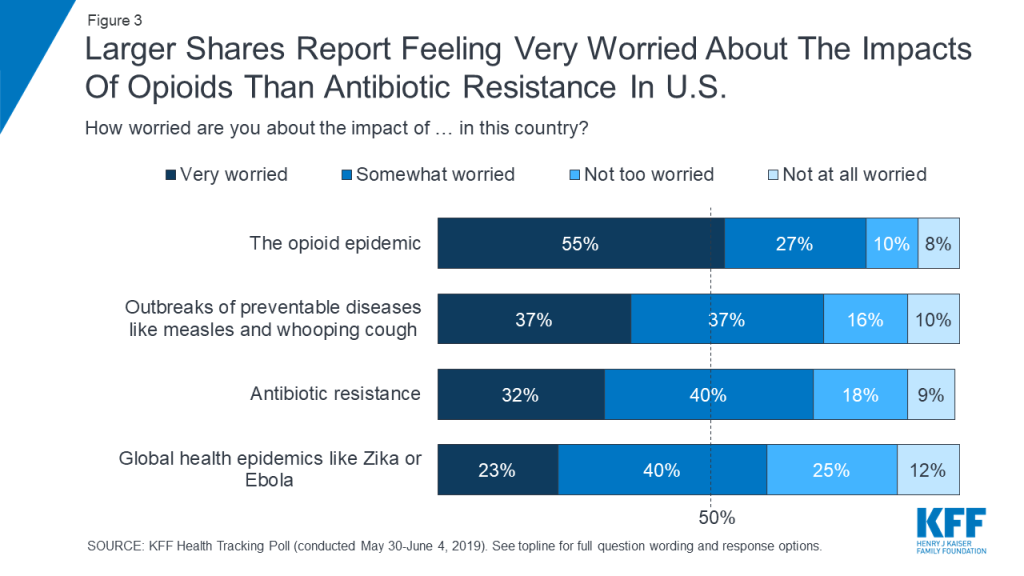
While large shares of the public say the overuse of antibiotics is a problem, concerns about the opioid epidemic outrank antibiotic resistance on a list of several public health problems facing the nation at large. Eight in ten (82 percent) report feeling worried about the opioid epidemic, compared to nearly three-fourths who feel worried about outbreaks of preventable diseases like measles and whooping cough (73 percent) or about antibiotic resistance (72 percent). Fewer, about six in ten (63 percent), are worried about global health epidemics like Zika or Ebola.
Figure 3: Larger Shares Report Feeling Very Worried About The Impacts Of Opioids Than Antibiotic Resistance In U.S.
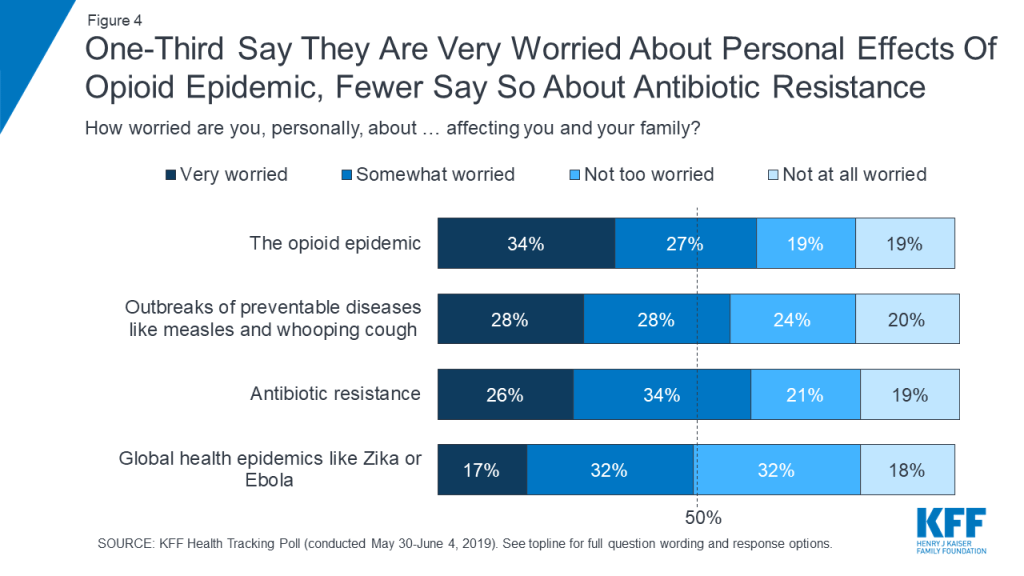
When asked about the same problems affecting them and their family, the opioid epidemic ranks among the top worries, but at least half of the public says they are “very worried” or “somewhat worried” about each of these problems affecting them and their family, including six in ten (59 percent) who say they are worried about personally being affected by antibiotic resistance.
Figure 4: One-Third Say They Are Very Worried About Personal Effects Of Opioid Epidemic, Fewer Say So About Antibiotic Resistance
Public Knowledge On Appropriate Use Of Antibiotics and the Effects Of Antibiotic Overuse
Most Americans know antibiotics can usually cure bacterial infections (75%), but fewer correctly say they can’t cure viral infections (45%). Knowledge varies based on gender, age, income, and education.
While a majority of the public say they have heard of antibiotic resistance and know what it means (71 percent) and most think the overuse of antibiotics is a major problem (53 percent), public knowledge of the issue is mixed. While the public is mostly aware that antibiotics can help cure bacterial infections (75 percent), this month’s poll indicates there are common misconceptions about what illnesses warrant the use of antibiotic medications. For example, over half (55 percent) say that viral infections can either be cured using antibiotics (27 percent) or that “they do not know enough to say” (28 percent), and nearly half (47 percent) either say the flu can be cured by taking antibiotics (26 percent), or that “they do not know enough to say” (21 percent). When asked about pneumonia, 53 percent say this can be cured by taking antibiotics, but one in ten say it cannot be cured by taking antibiotics and about a third (36 percent) say that “they do not know enough to say.” While some forms of pneumonia are viral and cannot be treated with antibiotics, the most common form of pneumonia is bacterial and can be treated with these medications.
Figure 5: Most Are Aware Bacterial Infections Can Be Treated Using Antibiotics But Lack Of Awareness Remains
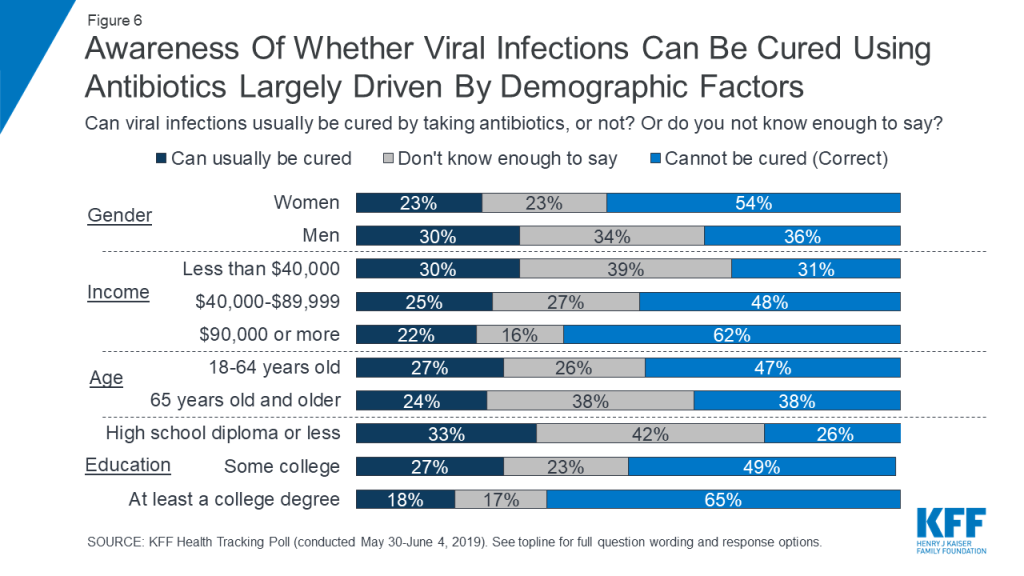
Knowledge about which illnesses can usually be cured by taking antibiotics varies based on certain demographic characteristics. For example, while over half of women (54 percent) are aware that viral infections cannot be cured with antibiotics, two-thirds of men either incorrectly think antibiotics can cure these infections (30 percent) or say they don’t know enough to say (34 percent). Adults ages 18-64 are also somewhat more likely to answer this question correctly than those ages 65 and older (47 percent vs 38 percent, respectively). Adults with higher income and higher levels of education are also more likely to be aware that antibiotics are not effective at treating viral infections, with majorities of adults with at least a college education (65 percent) and adults with incomes of at least $90,000 (62 percent) knowing this. By contrast, about three-fourths of adults with a high school diploma or less and seven in ten (69 percent) of those with household incomes less than $40,000 either believe antibiotics can cure viral infections or say they don’t know enough to say.
Figure 6: Awareness Of Whether Viral Infections Can Be Cured Using Antibiotics Largely Driven By Demographic Factors
Most of the public are aware of the possible negative implications of the overuse of antibiotics. Two-thirds (67 percent) say they are aware that the overuse of antibiotics will lead to people having to take stronger medications for previously easy-to-treat infections. Similarly, majorities are aware that the overuse of antibiotics will lead to bacterial infections lasting longer and becoming more dangerous (63 percent), an increasing number of superbugs or bacteria resistant to antibiotics (62 percent), as well as increasing costs for treating bacterial infections (57 percent). Roughly half (53 percent) say they know that at-risk groups like infants and seniors getting more life-threatening illnesses may result from the overuse of antibiotics. However, across the board, between a third and nearly half of Americans say overuse of antibiotics will not lead to these consequences, or that that they do not know enough to say.
Figure 7: Most Aware Of Possible Impacts Of Antibiotic Overuse But Large Shares Say They Don’t Know Enough
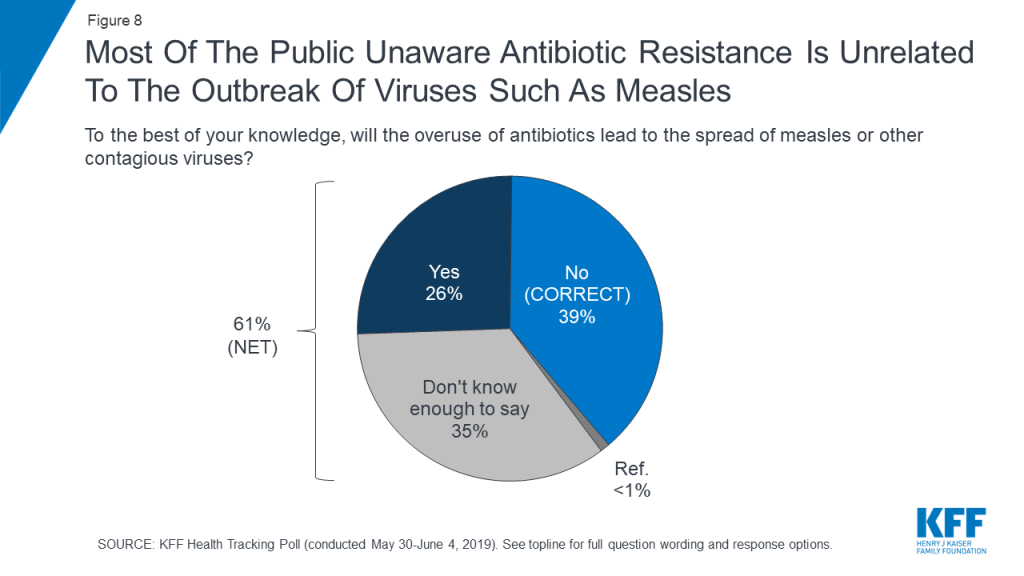
Although many in the public are aware of the possible consequences of antibiotic overuse, some confusion remains. About six in ten (61 percent) either incorrectly say that measles or other contagious viruses will spread due to the overuse of such medications (26 percent) or say that they do not know enough to say whether this will happen (35 percent).
Figure 8: Most Of The Public Unaware Antibiotic Resistance Is Unrelated To The Outbreak Of Viruses Such As Measles
When asked who bears responsibility for fixing the problem of antibiotic resistance, a larger share of the public place the responsibility on drug companies and health care providers than on any other entity, including patients. A majority of the public says that drug and pharmaceutical companies (59 percent) and doctors or health care providers (56 percent) are “very responsible.” Less than half say the same about the federal government (38 percent), patients (30 percent), or the agriculture and farming industry (20 percent).
Figure 9: Majorities Say Drug Companies And Health Care Providers Are Responsible For Addressing The Antibiotic Resistance Problem
The Public’s Experiences With Antibiotics
Nearly half of the public (45 percent) report they have ever either taken antibiotics when they weren’t feeling well without talking to a doctor or health care provider (16 percent), or stopped their course of antibiotics before it was finished (39 percent). This experience differs based on certain demographic characteristics. Adults ages 18-64 are more likely than adults ages 65 and older to report having made decisions about their antibiotic medication without consulting a doctor (48 percent vs 32 percent, respectively). Additionally, adults without a college education are more likely than adults with a college education to say they have done either of these things (48 percent vs 39 percent, respectively).
Table 1: Experiences Making Antibiotic Decisions Without Consulting A Doctor By Age And Education
Percent who say:
Total
Age
Education
Ages 18–64
Ages 65+
Less than College
College education or more
They have ever taken antibiotics when they weren’t feeling well without talking to a doctor or health care provider
16%
17%
9%
16%
14%
They have ever stopped taking antibiotics before taking all of the pills they were prescribed
39
42
28
42
33
Yes to any of the above
45
48
32
48
39
Figure 10: Nearly Half Of Americans Say They Haven’t Taken Antibiotics As Prescribed By A Doctor
The data also indicates that it is not uncommon for patients to receive antibiotics that they don’t believe are necessary, and on the other hand, to have their requests for an antibiotic denied by a health professional. About a quarter of Americans (24 percent) say that there was a time when a health care provider prescribed an antibiotic for them or someone in their family when they did not think it was needed. Additionally, about one in five (19 percent) say that they or someone in their family has ever asked a provider for an antibiotic but the provider recommended not taking one.
Figure 11: The Public’s Reported Experiences With Antibiotics When Receiving Care
Methodology
This KFF Health Tracking Poll was designed and analyzed by public opinion researchers at the Kaiser Family Foundation (KFF). The survey was conducted May 30th–June 4th 2019, among a nationally representative random digit dial telephone sample of 1,206 adults ages 18 and older, living in the United States, including Alaska and Hawaii (note: persons without a telephone could not be included in the random selection process). The sample included 265 respondents reached by calling back respondents that had previously completed an interview on the KFF Tracking poll at least nine months ago. Computer-assisted telephone interviews conducted by landline (298) and cell phone (908, including 615 who had no landline telephone) were carried out in English and Spanish by SSRS of Glen Mills, PA. To efficiently obtain a sample of lower-income and non-White respondents, the sample also included an oversample of prepaid (pay-as-you-go) telephone numbers (25% of the cell phone sample consisted of prepaid numbers) as well as a subsample of respondents who had previously completed Spanish language interviews on the SSRS Omnibus poll (n=10). Both the random digit dial landline and cell phone samples were provided by Marketing Systems Group (MSG). For the landline sample, respondents were selected by asking for the youngest adult male or female currently at home based on a random rotation. If no one of that gender was available, interviewers asked to speak with the youngest adult of the opposite gender. For the cell phone sample, interviews were conducted with the adult who answered the phone. KFF paid for all costs associated with the survey.
The combined landline and cell phone sample was weighted to balance the sample demographics to match estimates for the national population using data from the Census Bureau’s 2017 American Community Survey (ACS) on sex, age, education, race, Hispanic origin, and region along with data from the 2010 Census on population density. The sample was also weighted to match current patterns of telephone use using data from the January-June 2018 National Health Interview Survey. The weight takes into account the fact that respondents with both a landline and cell phone have a higher probability of selection in the combined sample and also adjusts for the household size for the landline sample, and design modifications, namely, the oversampling of prepaid cell phones and likelihood of non-response for the re-contacted sample. All statistical tests of significance account for the effect of weighting.
The margin of sampling error including the design effect for the full sample is plus or minus 3 percentage points. Numbers of respondents and margins of sampling error for key subgroups are shown in the table below. For results based on other subgroups, the margin of sampling error may be higher. Sample sizes and margins of sampling error for other subgroups are available by request. Note that sampling error is only one of many potential sources of error in this or any other public opinion poll. Kaiser Family Foundation public opinion and survey research is a charter member of the Transparency Initiative of the American Association for Public Opinion Research.
Group
N (unweighted)
M.O.S.E.
Total
1,206
±3 percentage points
Registered voters
1,020
±4 percentage points
Party Identification
Democrats
346
±6 percentage points
Republicans
322
±6 percentage points
Independents
404
±6 percentage points
Democrats/Democratic-leaning independents/Independents with no leaning
House Passes Minibus That Includes Global Health Funding In FY 2020 State & Foreign Operations (SFOPs) and Health & Human Services (HHS) Appropriations Bills
On June 19, 2019, the House passed a package of FY 2020 appropriations bills (minibus), which included global health funding for the U.S. Department of State, U.S. Agency for International Development (USAID), and U.S. Department of Health and Human Services (HHS). Global health funding amounts in the minibus bill matched those provided in FY 2020 appropriations bills previously passed by the House Appropriations Committee. Please see the KFF summaries on the House Appropriations Committee approval of the FY 2020 State & Foreign Operations (SFOPs) and Health & Human Services (HHS) appropriations bills for more details.
In roughly 1 of every 6 emergency room visits and inpatient hospital stays in 2017, patients came home with at least one out-of-network medical bill, a new KFF analysis finds.
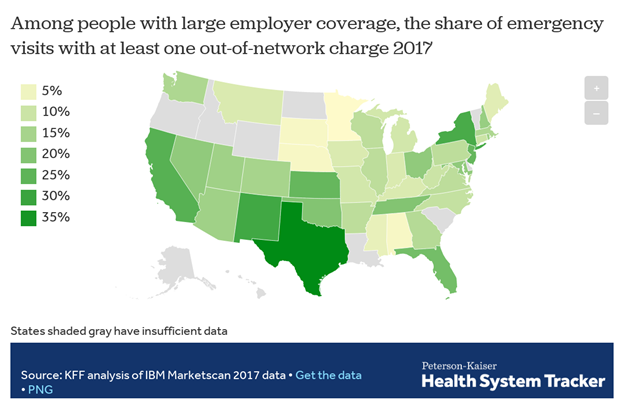
More specifically, 18 percent of all emergency visits and 16 percent of in-network hospital stays had at least one out-of-network charge, leaving patients at risk for surprise medical bills, according to the analysis of claims data from large employer plans. The analysis also finds the incidence of such charges varied greatly by state, for both emergency visits and hospital stays. For instance, emergency care visits were more likely to result in at least one out-of-network charge in Texas, New Mexico, New York, California and Kansas, and less likely in Minnesota, South Dakota, Nebraska, Alabama and Mississippi.
The findings come at a time when policymakers of both major political parties in Washington have vowed to pass legislation to protect consumers against surprise medical bills. At the same time, more than a dozen states have enacted or implemented comprehensive laws to combat the problem for people enrolled in state-regulated plans. Due to limits imposed by federal law, it remains the case that people with large employer coverage generally are not protected by state surprise billing laws if their plan is self-insured. The analysis summarizes key provisions in states’ laws and describes the major features of bipartisan federal legislation under consideration in the House and Senate.
Surprise medical bills generally arise in two forms. In one, the patient is required to pay a greater share of costs under her health plan because the medical services performed were out-of-network. In the other, an out-of-network physician or other provider “balance bills” the patient in an attempt to collect the difference between the amount the provider charged for services and the amount the health plan was willing to pay. Surprise bills are the result of situations beyond a patient’s control, such as emergency care or treatment by an out-of-network provider at an in-network facility. Most of the potential surprise out-of-network emergency charges observed in this study were from doctors and other out-of-network professionals, rather than from the hospital or emergency facility. Due to limitations in the available data, KFF researchers were not able to estimate the dollar amounts of surprise bills.
KFF polling has shown that two-thirds of Americans says they are either “very worried” (38%) or “somewhat worried” (29%) about being able to afford their own or a family member’s unexpected medical bills. More than three quarters of Americans want the federal government to take action to address surprise bills, though opinion is divided over who should shoulder the cost – providers, insurers or both.
This analysis examines how often patients get hit with surprise medical bills, what circumstances tend to give rise to them and what proposals are being considered to protect consumers from this problem. The study of claims data from large employer health plans finds that in roughly 1 of every 6 emergency room visits and inpatient hospital stays in 2017, patients came home with at least one out-of-network medical bill. More specifically, 18 percent of all emergency visits and 16 percent of in-network hospital stays had at least one out-of-network charge, leaving patients at risk for surprise medical bills. The risk of getting a surprise bill is much greater in some states. For instance, emergency care visits were more likely to result in at least one out-of-network charge in Texas, New Mexico, New York, California and Kansas, and less likely in Minnesota, South Dakota, Nebraska, Alabama and Mississippi. The analysis is part of the Peterson-Kaiser Health System Tracker, an online information hub dedicated to monitoring and assessing the performance of the U.S. health system.
Health care is leading the list of possible topics Democrats and Democratic-leaning independents want to hear the 2020 Democratic presidential candidates talk about during their upcoming debates, with nearly nine in ten (87 percent) saying it is very important for candidates to talk about health care. This is closely followed by eight in ten who say it is very important for candidates to discuss issues affecting women, perhaps reflecting recent news attention on these issues. Health care and women’s issues rank ahead of other top issues for Democrats and Democratic-leaning independents such as climate change (73 percent), gun policy (72 percent), income inequality (70 percent), the economy (69 percent), and immigration (66 percent).
When asked to say in their own words which health care issues they want to hear candidates discuss, affordability emerges as a top issue with nearly three in ten Democrats and Democratic-leaning independents mentioning lowering the amount people pay for health care (28 percent). A further eight percent mention lowering the cost of prescription drugs. Access to health care also emerges as a key topic with one in five mentioning increasing access to health care (18 percent) while an additional 15 percent explicitly mention implementing a single-payer or Medicare-for-all system.
Poll: Most Americans don’t realize how dramatically the leading Medicare-for-all proposals would restructure the nation’s health care system
The most recent KFF Health Tracking Poll finds majorities across partisans think taxes for most people would increase under a national health plan, sometimes called Medicare-for-all (78 percent), and about half (53 percent) think private health insurance companies would no longer be the primary way Americans would get health coverage under such a plan. However, when it comes to other key changes that the leading Medicare-for-all bills introduced by Sen. Bernie Sanders and Rep. Pramila Jayapal would bring, large shares are unaware of how the current health care system may be affected. For example, majorities say people would continue to pay deductibles and co-pays (69 percent) and continue to pay premiums (54 percent) under a Medicare-for-all plan. Likewise, majorities say people with employer-sponsored or self-purchased insurance would be able to keep their plans (55 percent each) under a Medicare-for-all plan.
Overall, nearly half of the public (46 percent) hold favorable views of the 2010 Affordable Care Act while four in ten hold unfavorable views. Majorities of Democrats continue to hold favorable views towards the law while majorities of Republicans hold unfavorable views. Independents are more divided with similar shares holding favorable and unfavorable views. To see the shifts in public attitudes towards the law over time, check out the KFF interactive.
Health Care in The Democratic Primary
What do Democrats want their 2020 presidential candidates to talk about heading into the primary debates? Health care and issues affecting women top their priority list in this @KaiserFamFound poll
Less than one month before the first 2020 Democratic presidential primary debate, KFF polling finds health care is among the top issues that Democrats and Democratic-leaning independents want to hear the candidates talk about during the upcoming debates. Nearly nine in ten Democrats and Democratic-leaning independents (87 percent) say it is “very important” for the candidates to talk about health care during the upcoming Democratic presidential debates. This is followed by eight in ten who say it is “very important” for the candidates to discuss issues that affect women, an issue that garnered recent media attention.
Figure 1: Health Care One Of Top Issues Democrats And Democratic-Leaning Independents Want To Hear About In Upcoming Debates
About seven in ten say it is “very important” for the candidates to discuss climate change (73 percent), gun policy (72 percent), income inequality (70 percent), the economy (69 percent), and immigration (66 percent). These are followed by criminal justice reform (59 percent), foreign policy or national security (58 percent), and about half say it is “very important” for the candidates to talk about taxes (52 percent) and international trade and tariffs (49 percent) in the upcoming Democratic debates.
When those who say health care is at least somewhat important for 2020 Democratic presidential candidates to discuss in upcoming debates are asked to offer in their own words what specifically about health care they want to hear about, nearly three in ten Democrats and Democratic-leaning independents overall offer responses related to lowering the amount people pay for health care (28 percent) and another eight percent explicitly mention lowering prescription drug costs. To learn more about Americans’ experiences with health care costs, check out this data note.
Access to health care also emerges as a key issue with one in five (18 percent) offering responses related to increasing access to health care and an additional 15 percent explicitly mentioning implementing a single-payer or Medicare-for-all system. The 2010 Affordable Care Act is also still on the minds of Democrats and Democratic-leaning independents with one in six mentioning protecting the Affordable Care Act and protections for people with pre-existing conditions (16 percent) as the top health care issue they want to hear about during the upcoming presidential debates. An additional one in ten (8 percent) offer access to reproductive health care services.
Figure 2: Lowering Costs Is A Top Health Care Issue In Upcoming 2020 Democratic Presidential Debates
Though lowering costs and increasing access emerge as the top issues that Democrats and Democratic-leaning independents want to hear presidential candidates talk about, there are some notable differences between liberals and moderates. One-fourth of liberal Democrats and Democratic-leaning independents (23 percent) offer implementing a single-payer or Medicare-for-all system when asked what health care issue they want to hear the candidates discuss, making it among the top health care issues offered by this group along with increasing access (27 percent) and lowering the amount people pay for health care (24 percent). Among moderate Democrats and Democratic-leaning independents, more than three times as many offer lowering the amount people pay for health care (34 percent) than implementing a Medicare-for-all system (9 percent).
Figure 3: Medicare-for-all Ranks Higher Among Liberal Democrats And Democratic-Leaning Independents
Kaiser Family Foundation Focus GroupsDuring the spring of 2019, Kaiser Family Foundation conducted a series of 6 focus groups with a total of 56 participants in Texas, Florida, and Pennsylvania, examining voters’ top health care issues and their views of various national health care proposals. The groups included Republicans, Democrats, independents, seniors, and young adults, and found a disconnect between what the public is talking about when it comes to health care compared to the political discussions happening in Washington, D.C. and on the 2020 campaign trail. Read Drew Altman’s takeaways from the KFF focus groups here.
A National Health Plan or Medicare-for-all
Implementing a national health plan, sometimes called Medicare-for-all, has been a dominant issue during the 2020 Democratic primary. Previous KFF polling has found that a slight majority supports the idea of a national health plan, but attitudes towards such a proposal are fairly malleable with significant shares, on either side of the debate, shifting their opinion once they hear counter-arguments. With several bills being introduced in the 116th Congress that would expand the role of public programs in health, this month’s Kaiser Health Tracking Poll examines the public’s awareness on key aspects of Medicare-for-all plans including Sen. Sanders’ Medicare for All Act of 2019 and Rep. Japayal’s bill of the same name.1
Eight in ten (78 percent) think that under a national health plan, sometimes called Medicare-for-all, taxes for most people would increase. Majorities of Democrats (71 percent), independents (80 percent), and Republicans (85 percent) say that taxes for most Americans would increase under a national health plan.
Figure 4: Majorities Across Partisans Are Aware Taxes For Most Americans Would Increase Under A National Health Plan
In addition, about half of Americans (53 percent) – including half of Democrats and independents (52 percent each) and most Republicans (57 percent) – think that under a national health plan, private health insurances would no longer be the primary way Americans would get health coverage. Still, a substantial four in ten of the public believe that under such a plan, private health insurance companies would still be the primary source of coverage for most Americans and an additional seven percent say they do not know what would happen under a national health plan.
Figure 5: At Least Half Expect Decreasing Role Of Private Health Insurance Companies Under A National Health Plan
In focus groups, many participants expressed skepticism about the idea that private insurance companies would cease to exist under a Medicare-for-all plan. Some thought these companies were just too powerful, and others thought they would continue to exist for people who want to buy extra coverage beyond what a national plan would offer.
In their own words: Focus group participants on private insurance
[Moderator: Do you think Medicare-for-all means that private health insurance companies will go away?]
“No, because they’d be running Medicare-for-all.” (Houston, independent)
“Or even those individuals who can afford to have the type of coverage they want, they wouldn’t want a basic burger. No, they want to add all of the extra fixings because they can afford it.” (Houston, independent)
“They’re going to take a hit obviously but I don’t think that they’re really going to go away. They’re too powerful.” (Harrisburg, Democrat)
“I don’t think for a second that private insurance would go away, even if you implemented this. There will always be the Cadillac plan that is available, because as long as somebody—the market will react.” (Orlando, Democrat)
When it comes to other potential impacts of a national health plan, many Americans say most aspects of the current health care system would remain unchanged. Majorities of Democrats, independents, and Republicans say people would continue to pay deductibles and co-pays when they use health care services (71 percent, 68 percent, and 68 percent, respectively). In addition, majorities of both Democrats and independents also believe people with employer-sponsored insurance would be able to keep their current coverage (68 percent and 53 percent), people who purchase their own plans would be able to keep their current coverage (65 percent and 55 percent), and individuals and employers would continue to pay health insurance premiums (61 percent and 53 percent). At least four in ten Republicans also say each of these things would happen under a national health plan. Small shares of the public overall say they don’t know whether each of these things would happen under such a plan (4 percent say they don’t know if people would continue to pay deductibles and co-pays, 7 percent say they don’t know for the other changes included).
Figure 6: Significant Shares Of Partisans Think Most Aspects Of Health Care System Would Be Unchanged Under A National Health Plan
Focus group findings also indicate that many people don’t believe a Medicare-for-all plan would result in the elimination of health insurance premiums or cost-sharing.
In their own words: Focus group participants on premiums and cost-sharing
[Moderator: Do you think Medicare-for-all means that there would be no more co-pays or deductibles when people use care?]
“No, I think there’d probably still be co-pays and deductibles, but just be affordable.” (Houston, independent)
“It wouldn’t make sense to you that you wouldn’t have to pay [co-pays and deductibles] because it wouldn’t feel sustainable.” (Houston, independent)
“My mom is on Medicare and she has to pay co-pays.” (Houston, independent)
There is a partisan divide on some aspects of how a national health plan would affect people and health care providers. Three-fourths of Democrats (76 percent) say that all U.S. residents would have health insurance coverage under a national health plan while about half of Republicans say this would not happen (49 percent). On the other hand, most Republicans say a national health plan would lead to doctors and hospitals being paid less (64 percent) while about half of Democrats say this would not happen (48 percent). Large shares of independents believe both of these things would happen, with six in ten (61 percent) saying all U.S. residents would get health coverage and half saying doctors and hospitals would be paid less.
Figure 7: Partisan Divide On Some Potential Effects Of A National Health Plan
Table 1: Partisans Disagree On Some Basic Implications of a National Health Plan
Percent who think each of the following would happen under a national plan, sometimes called Medicare-for-all:
Total
Democrats
Independents
Republicans
Taxes for most people would increase
78%
71%
80%
85%
All U.S. residents would have health insurance coverage
62
76
61
45
Private health insurance companies would NOT be the primary way Americans get health coverage
53
52
52
57
Doctors and hospitals would be paid less
52
42
50
64
People who buy their own insurance would NOT be able to keep their current plans
39
24
40
53
Individuals and employers would NOT continue to pay health insurance premiums
39
31
42
45
People with employer-sponsored insurance would NOT be able to keep their current plans
38
25
42
47
People would NOT continue to pay deductibles and co-pays when they use health care services
27
25
29
28
Public Views of The ACA
While the public still holds largely partisan views over the Affordable Care Act and opinions have remained relatively unchanged for the past two years since the Republican efforts to repeal the law, views are down slightly this month. Nearly half of the public (46 percent) hold favorable opinions of the ACA while four in ten hold a negative opinion of the law. Across partisans, nearly eight in ten Democrats (79 percent) have a favorable view of the ACA compared to nearly half of independents (47 percent), and about one-sixth of Republicans (16 percent).
Figure 8: The Public Is Somewhat Divided On The Affordable Care Act
Methodology
This KFF Health Tracking Poll was designed and analyzed by public opinion researchers at the Kaiser Family Foundation (KFF). The survey was conducted May 30th–June 4th 2019, among a nationally representative random digit dial telephone sample of 1,206 adults ages 18 and older, living in the United States, including Alaska and Hawaii (note: persons without a telephone could not be included in the random selection process). The sample included 265 respondents reached by calling back respondents that had previously completed an interview on the KFF Tracking poll at least nine months ago. Computer-assisted telephone interviews conducted by landline (298) and cell phone (908, including 615 who had no landline telephone) were carried out in English and Spanish by SSRS of Glen Mills, PA. To efficiently obtain a sample of lower-income and non-White respondents, the sample also included an oversample of prepaid (pay-as-you-go) telephone numbers (25% of the cell phone sample consisted of prepaid numbers) as well as a subsample of respondents who had previously completed Spanish language interviews on the SSRS Omnibus poll (n=10). Both the random digit dial landline and cell phone samples were provided by Marketing Systems Group (MSG). For the landline sample, respondents were selected by asking for the youngest adult male or female currently at home based on a random rotation. If no one of that gender was available, interviewers asked to speak with the youngest adult of the opposite gender. For the cell phone sample, interviews were conducted with the adult who answered the phone. KFF paid for all costs associated with the survey.
The combined landline and cell phone sample was weighted to balance the sample demographics to match estimates for the national population using data from the Census Bureau’s 2017 American Community Survey (ACS) on sex, age, education, race, Hispanic origin, and region along with data from the 2010 Census on population density. The sample was also weighted to match current patterns of telephone use using data from the January-June 2018 National Health Interview Survey. The weight takes into account the fact that respondents with both a landline and cell phone have a higher probability of selection in the combined sample and also adjusts for the household size for the landline sample, and design modifications, namely, the oversampling of prepaid cell phones and likelihood of non-response for the re-contacted sample. All statistical tests of significance account for the effect of weighting.
The margin of sampling error including the design effect for the full sample is plus or minus 3 percentage points. Numbers of respondents and margins of sampling error for key subgroups are shown in the table below. For results based on other subgroups, the margin of sampling error may be higher. Sample sizes and margins of sampling error for other subgroups are available by request. Note that sampling error is only one of many potential sources of error in this or any other public opinion poll. Kaiser Family Foundation public opinion and survey research is a charter member of the Transparency Initiative of the American Association for Public Opinion Research.
Group
N (unweighted)
M.O.S.E.
Total
1,206
±3 percentage points
Registered voters
1,020
±4 percentage points
Party Identification
Democrats
346
±6 percentage points
Republicans
322
±6 percentage points
Independents
404
±6 percentage points
Democrats/Democratic-leaning independents/Independents with no leaning