Kaiser Family Foundation/LA Times Survey Of Adults With Employer-Sponsored Insurance
Overview
The Survey Of Adults With Employer-Sponsored Health Insurance – the first partnership project conducted jointly by the Kaiser Family Foundation and the Los Angeles Times – explores the attitudes and experiences of adults with employer-sponsored health insurance (ESI), including views of their health plans and affordability challenges related to premiums, deductibles, and unexpected medical bills.
The survey takes a special look at those in high deductible plans (including those paired with a health savings account or HSA), those with chronic health conditions, and those with lower incomes. It also examines factors related to health plan decision-making and cost-conscious health care shopping behaviors, as well as overall views of the U.S. health care system.
Read The Los Angeles Times’ coverage:
Health insurance deductibles soar, leaving Americans with unaffordable bills
Three kids, a health plan and $15,000 in medical debt: A working family tries to make ends meet
Soaring insurance deductibles and high drug prices hit sick Americans with a ‘double whammy’
Rising health insurance deductibles fuel middle-class anger and resentment
Americans’ struggles with medical bills are a foreign concept in other countries
Trying to shop for medical care? Lots of luck with that
Not everyone has eye-popping deductibles: How one union kept medical bills in check
Executive Summary
Since the passage of the Affordable Care Act (ACA) in 2010, much attention has been paid to the parts of the U.S. health insurance landscape that were most directly impacted by the law, including the individual insurance market and expanded Medicaid programs in some states. Yet, the number of people covered by employer-sponsored health insurance in the U.S. far exceeds the number covered in the individual market or by any government program. In 2017, about 156 million people had employer-based coverage, representing almost half the total U.S. population and 60 percent of non-elderly adults.1 Surveys of employers point to the growing cost burden of health insurance for this population. Between 2008 and 2018, premiums for employer-sponsored insurance plans increased 55 percent, twice as fast as workers’ earnings (26 percent). In addition, workers are finding themselves on the hook for bigger deductibles before their insurance will kick in. Over the same time period (2008-2018), the average health insurance deductible for covered workers increased by 212 percent.2
Against this backdrop, the Kaiser Family Foundation partnered with the Los Angeles Times to conduct a representative survey of adults with employer-sponsored health insurance.3 Some key themes from the survey are summarized here, and a full report of the findings follows.
Overall, the survey finds that most people with employer-sponsored insurance (ESI) are generally satisfied with their health plans, and large shares say they feel “grateful” and “content” about their insurance while fewer say they are “angry” or “frustrated.” However, insurance does not offer iron-clad protection against health care affordability challenges. Four in ten report that their family has had either problems paying medical bills or difficulty affording premiums or out-of-pocket medical costs, and about half say someone in their household skipped or postponed some type of medical care or prescription drugs in the past year because of the cost. Seventeen percent say they’ve had to make what they feel are difficult sacrifices in order to pay health care or insurance costs; for some, the sacrifices they report making are extreme.
The experiences and attitudes of people with employer coverage differ vastly depending on whether they are in a higher or lower deductible plan. The higher the deductible, the more likely an individual is to have negative views of their health plan, and the more likely they are to experience problems affording care or to put off care due to cost. One reason people with higher deductibles are having trouble affording care is that many of them do not have enough savings to cover the full amount of their deductible. Among those in the plans with the highest deductibles (at least $3,000 for an individual or $5,000 for a family), over half say the amount of savings they could easily access in the short term is less than the amount of their deductible.
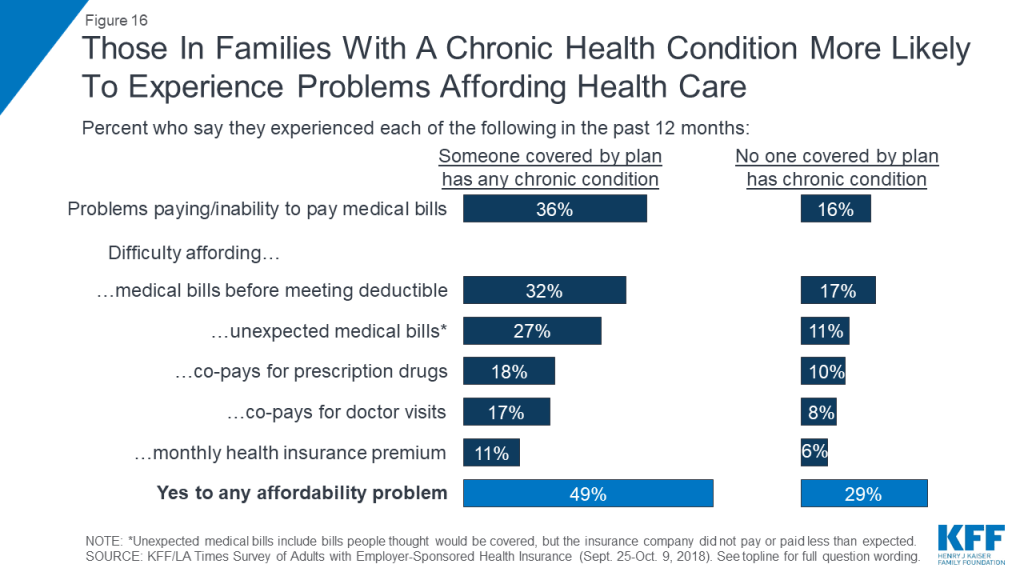
Another group that is particularly vulnerable to health care affordability issues are those with chronic conditions. Just over half (54 percent) of those with employer-sponsored coverage say that someone covered by their plan has a chronic condition such as hypertension, asthma, a serious mental health condition, or diabetes. About half of this group reports that their family has had problems paying medical bills or difficulty affording premiums or out-of-pocket costs, compared to about three in ten of those in families without a chronic condition. The combination of a chronic condition and a high deductible leads to even higher rates of problems and worries. For example, three-quarters of those in the highest deductible plans who say someone on in their family has a chronic condition say that a family member in their household has skipped or delayed some type of medical care or prescription drugs for cost reasons in the past year.
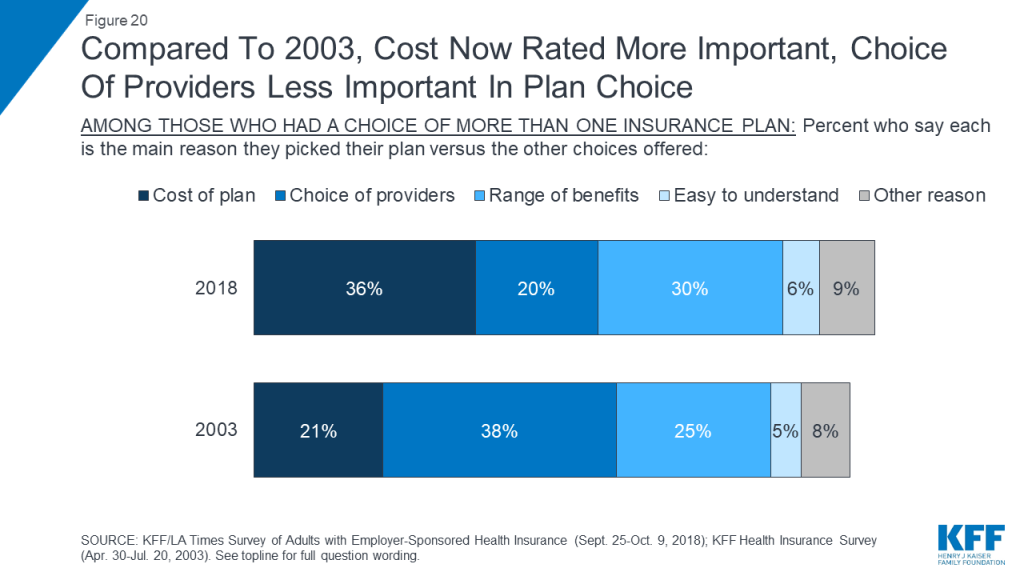
The survey also finds that cost has taken on greater importance in health insurance decision-making over the last decade and a half. When asked to choose the most important feature in a health plan, about six in ten people with employer coverage choose cost-related factors (low premiums, deductibles, or co-pays), while about a quarter choose coverage-related factors (choice of providers or range of covered benefits). These shares are essentially the opposite of what they were in 2003, when one-third chose cost-related factors and six in ten chose range of benefits or choice of providers. Similarly, among those whose employer offered a choice of plans, the share who say they picked their plan based on the cost increased from 21 percent in 2003 to 36 percent in the current survey.
Seven in ten people with employer coverage report engaging in some type of cost-conscious health care shopping behavior in the past 12 months, the most common of which is asking for a generic instead of a brand-name drug (47 percent). Less common behaviors are those that might actually lead to lower prices on services, including shopping around at different providers to find the best price for a medical service (17 percent) and trying to negotiate with a provider for a lower price (9 percent). One selling point of high deductible health plans is that they may incentivize enrollees to engage in more cost-conscious behaviors, including price-based shopping. The survey finds mixed evidence that this is the case; while the lowest rate of reporting these behaviors occurs among those in plans with no deductible, with a few exceptions, those in high deductible plans are not significantly more likely than those in lower deductible plans to report engaging in price-based shopping. In addition, those in high deductible plans paired with a health savings account (HSA plans) are not significantly more likely than those in plans with similar deductible levels to report shopping for lower-priced health care services. Overall, those enrolled in HSA plans – who make up 18 percent of adults with employer coverage – are more likely to view them as a way to pay for current medical bills than as a way to save money for the future.
Confusion and lack of access to cost information can also be a barrier for individuals to engaging in cost-conscious health care behaviors. Two-thirds say it is difficult to find out how much medical treatments and procedures provided by different doctors and hospitals would cost them, and over four in ten say they have had difficulty understanding how much they will have to pay out of their own pocket when they use care.
Finally, while most people with employer insurance feel that the cost of health care for people like them is too high, more say the current U.S. health insurance system works well for people with employer coverage than say it works well for people on Medicare or Medicaid or those who purchase their own insurance. Asked who is to blame for high costs, majorities point the finger at pharmaceutical and insurance companies, while fewer see hospitals, doctors, or employers as deserving of blame.
Key Findings: Section 1: Profile Of Adults With Employer-sponsored Health Insurance And Overall Views Of Coverage
Sixty percent of adults ages 18-64 in the United States have health insurance coverage through an employer or union. Census data show that, compared to the general population, these adults have higher incomes and education levels and are more likely to be White or Asian and less likely to be Black or Hispanic.4
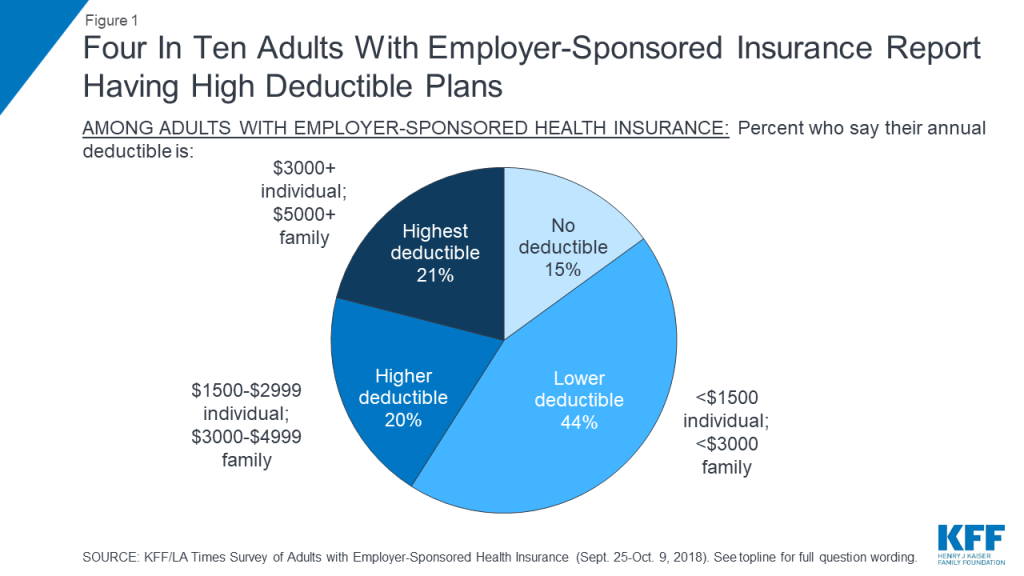
The survey finds that most people with employer-sponsored health coverage (73 percent) say they pay at least part of their premium for their insurance, while 16 percent say their employer pays the whole thing. When asked about their annual deductible for medical care, 15 percent say they have no deductible and 44 percent report a deductible of less than $1,500 for an individual or less than $3,000 for a family (defined for the purposes of this report as “lower deductible”). Four in ten (41 percent) report having plans with higher deductible amounts, including 20 percent with deductibles between $1,500 and $2,999 for an individual or between $3,000 and $4,999 for a family (“higher deductible”) and 21 percent with deductibles of at least $3,000 for an individual or $5,000 for a family (“highest deductible”). About one in six (18 percent) report having a higher or highest deductible plan paired with a health savings account (HSA).
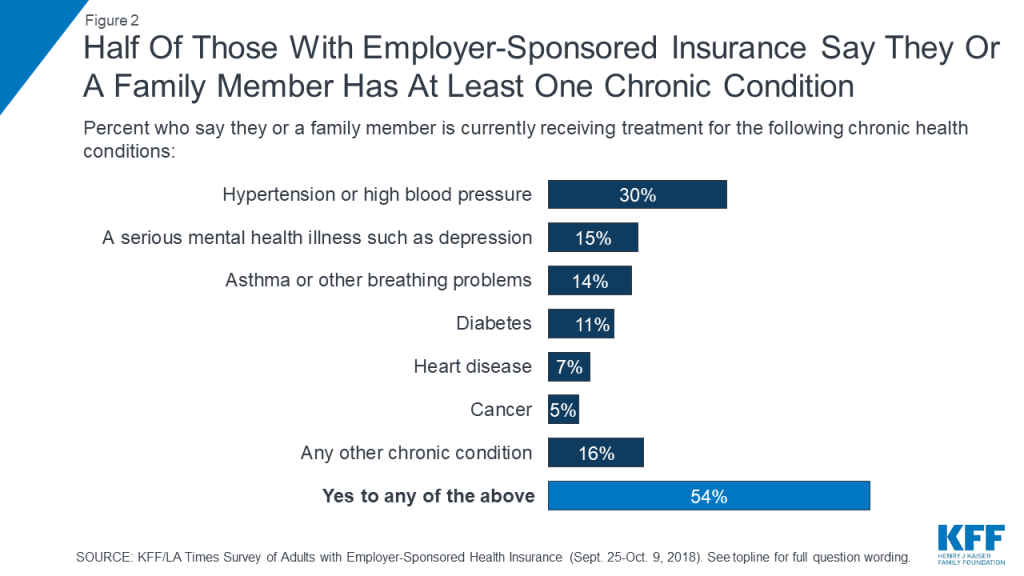
Nearly two-thirds (64 percent) of people with employer coverage say their insurance covers other family members in addition to themselves, while 36 percent report having single coverage. While nearly nine in ten (88 percent) describe their own health status as “excellent,” “very good,” or “good,” just over half (54 percent) say that they or another family member covered by their plan has a chronic condition, the most common being hypertension or high blood pressure (30 percent), a serious mental health condition (15 percent), asthma or other breathing problems (14 percent), and diabetes (11 percent).
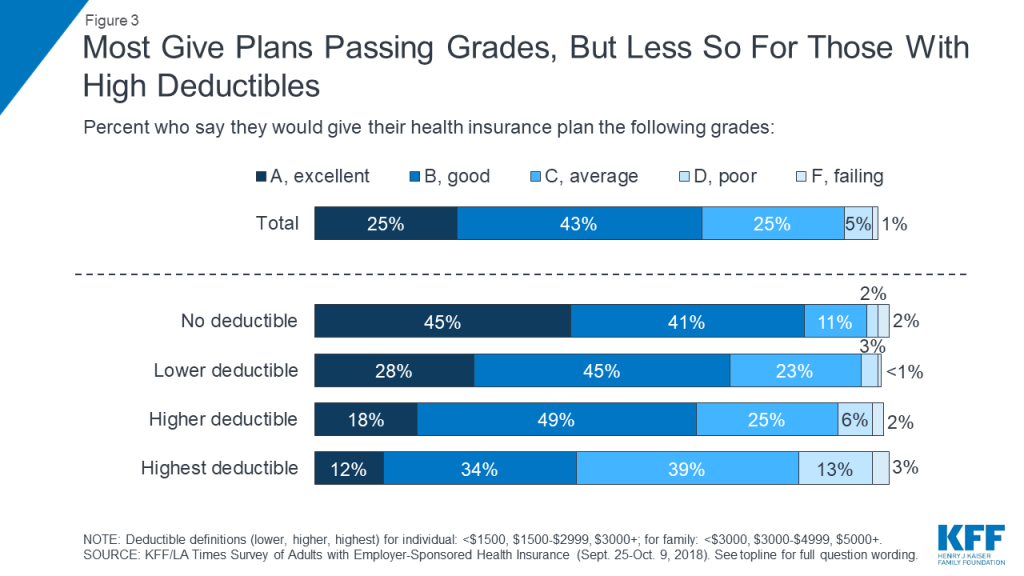
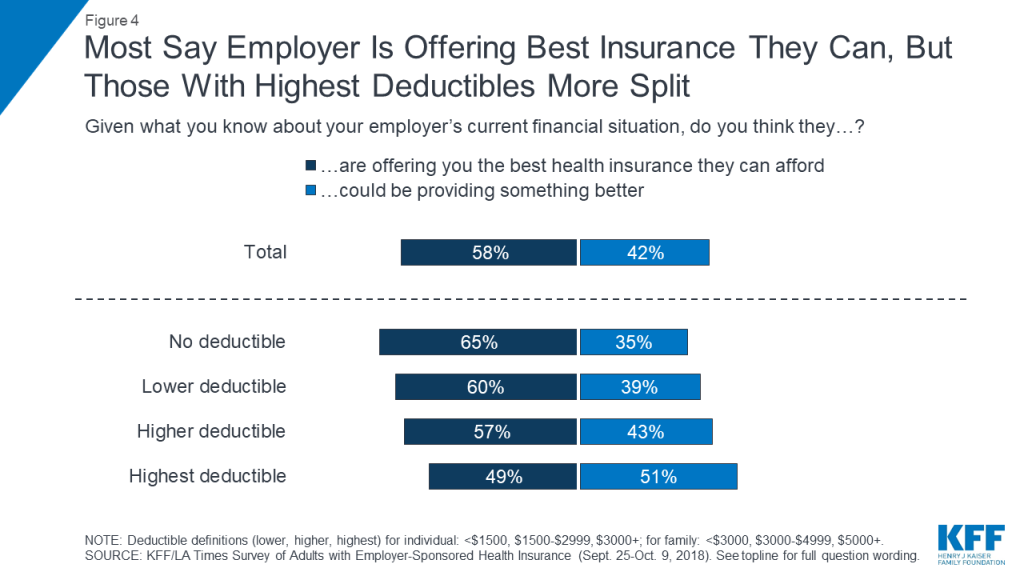
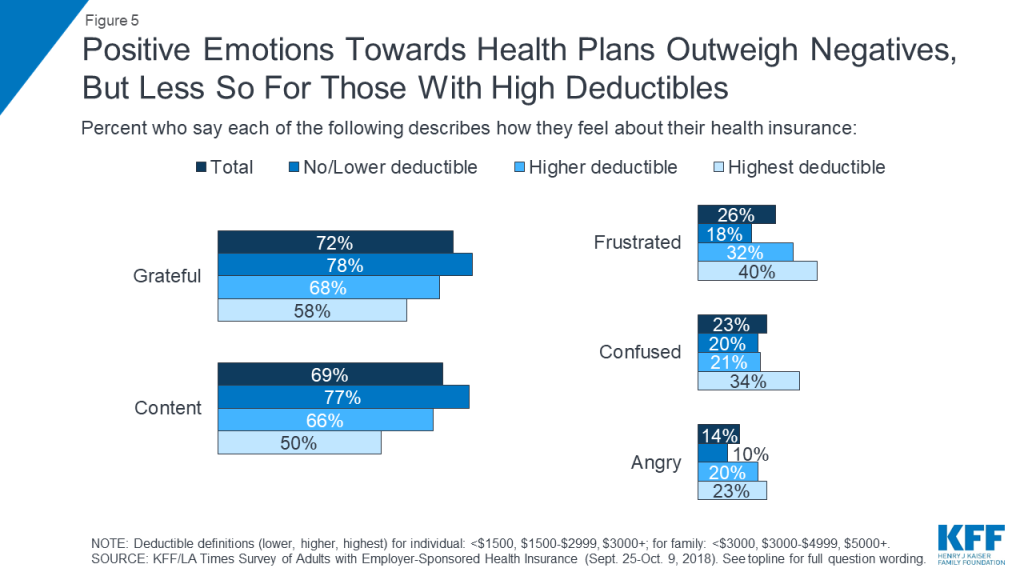
Overall, most people with employer coverage report being happy with their insurance. Nearly seven in ten (68 percent) give their health plan a grade of “A” or “B,” and large shares say the words “grateful” (72 percent) and “content” (69 percent) describe the way they feel about their insurance, while far fewer identify with words like “frustrated” (26 percent), “confused” (23 percent), or “angry” (14 percent). More than half (58 percent) say they think their employer is offering them the best health insurance they can afford. However, a substantial share – 42 percent – believe their employer could be providing something better.
It’s notable that these views differ greatly depending on the deductible level of an individual’s plan. For example, among those in the highest deductible plans, over half (55 percent) give their plan a grade of “C” or below, and half (51 percent) say their employer could be providing something better. While positive emotions still outweigh negative emotions for this group, the gap is much narrower, with 58 percent saying they feel “grateful,” and 50 percent “content,” while four in ten say they feel “frustrated,” 34 percent “confused,” and 23 percent “angry.”
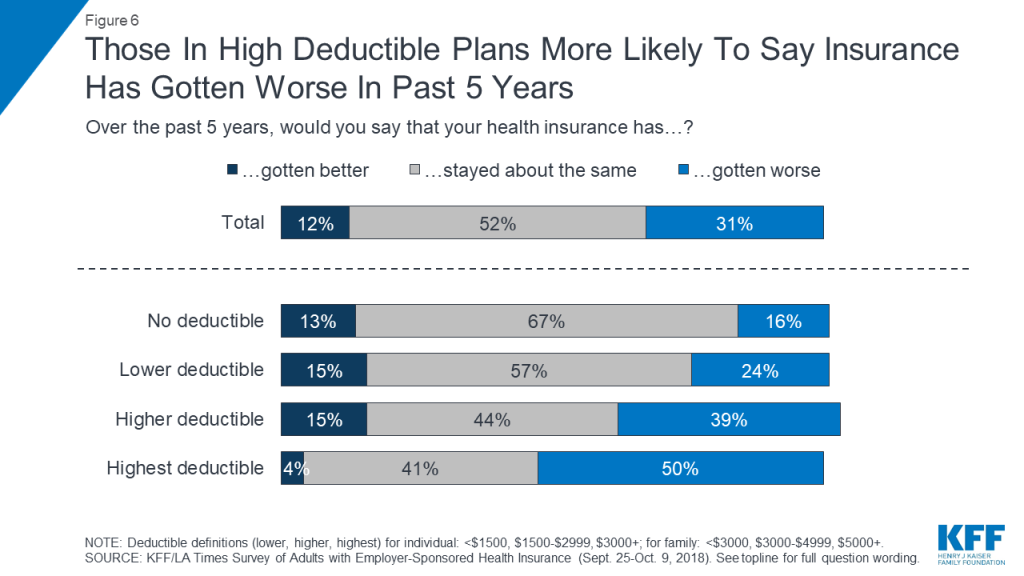
In addition, while most people in plans with no or lower deductibles say their health insurance has “stayed about the same” in the past 5 years, four in ten (39 percent) of those in higher deductible plans and half of those in the highest deductible plans say their insurance has “gotten worse.”
Key Findings: Section 2: Affordability Of Health Care And Insurance
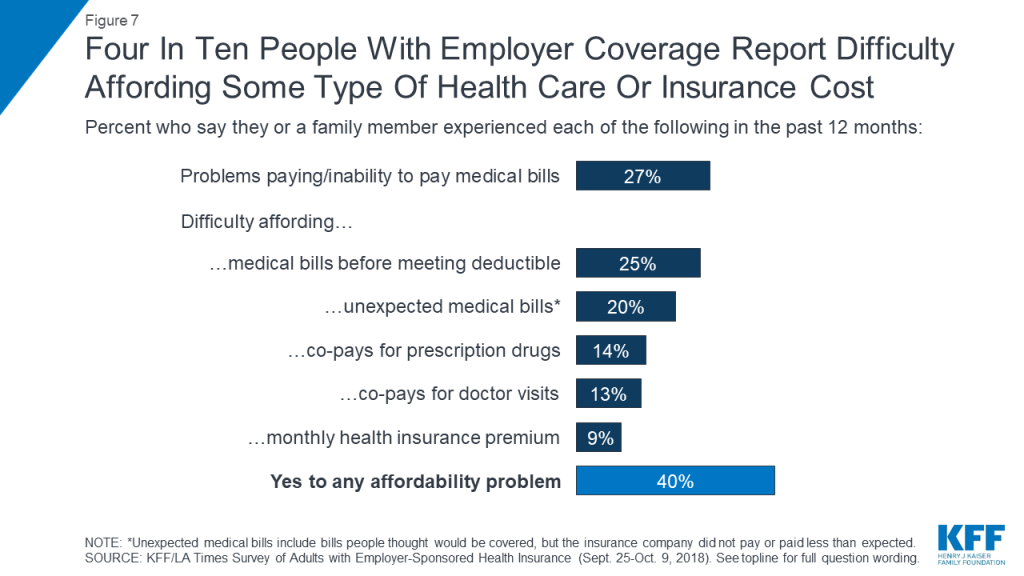
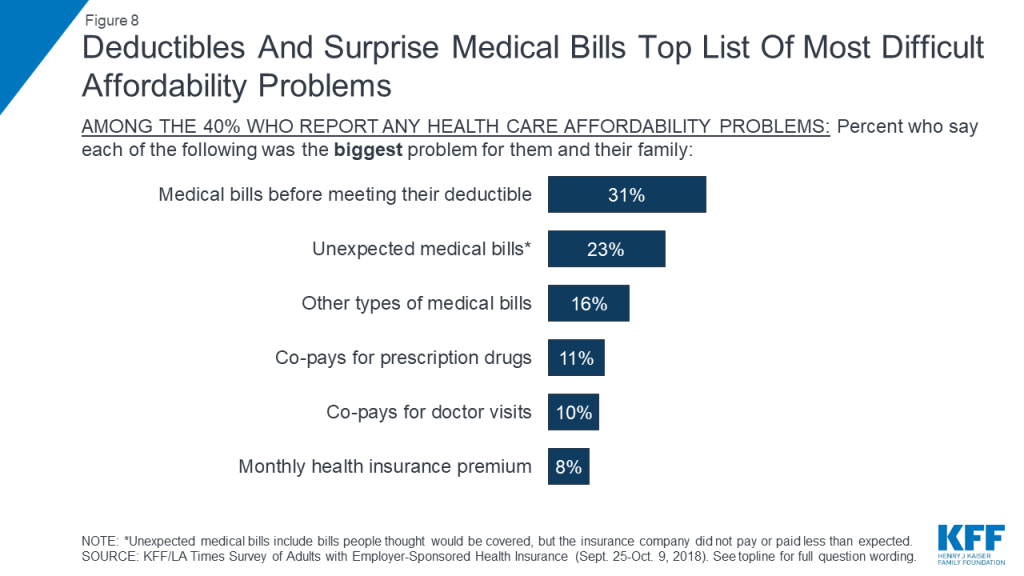
While many employers pay for a large share of covered workers’ health insurance premiums, the survey finds that employer-sponsored health insurance does not offer iron-clad protection against health care affordability challenges. Four in ten adults with employer coverage say that in the past year they had problems paying medical bills or difficulty affording their premium, deductible, co-pays, or an unexpected medical bill for themselves or a family member. When this group is asked to say which has been the biggest problem for their family, medical bills they had to pay before meeting their deductible (31 percent) and unexpected medical bills (23 percent) top the list, while fewer say the biggest burden is their prescription drug costs (11 percent), medical visit co-pays (10 percent), or health insurance premiums (8 percent).
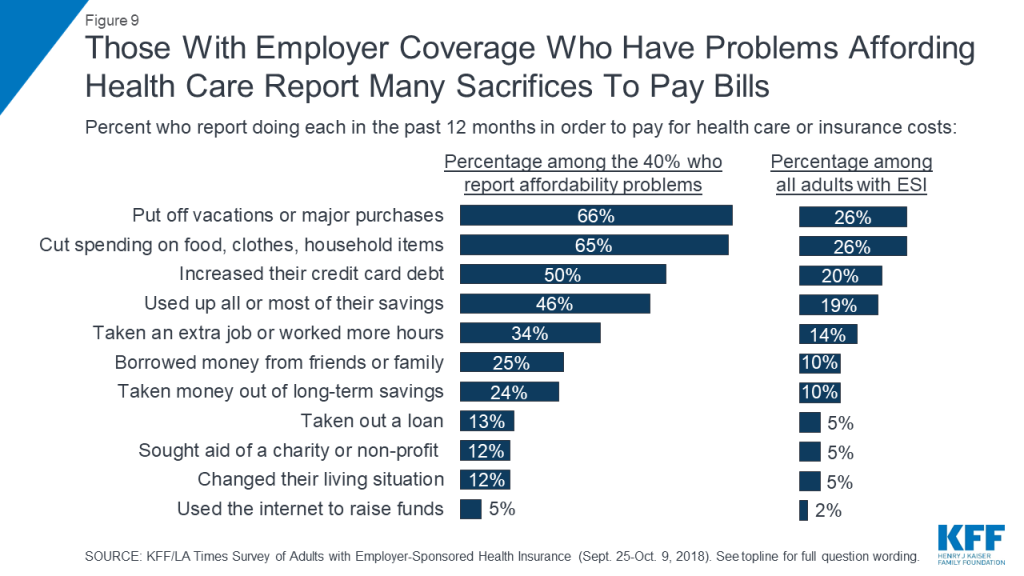
Among the 40 percent who report problems affording some type of health care cost in the past year, many report making various sacrifices in order to pay these costs. Two-thirds of this group (representing about a quarter of all adults with ESI) say they put off vacations or major household purchases or cut back spending on food, clothing, or basic household items. About half (one in five among the total) say they increased their credit card debt or used up all or most of their savings to pay for health care. One-third (14 percent of total) say they took on an extra job or worked more hours and a quarter (10 percent of total) reporting borrowing money from friends or family or taking money out of a long-term savings account. Smaller shares say they took out a loan, sought the aid of a charity or non-profit, changed their living situation, or used the internet to raise funds to pay for medical care.
In addition, 41 percent of those who had difficulty affording health care costs (17 percent of all adults with employer-sponsored insurance) say they feel they have had to make a difficult sacrifice in order to pay health care or insurance costs in the past 12 months. When asked to describe in their own words the most difficult sacrifice they have made, responses ranged from cancelled vacations, to skipped meals, to increased debt, to forgoing needed medical care.
| Table 1: In Their Own Words: Difficult Sacrifices To Afford Health Care | |||
| Question: What is the most difficult sacrifice you’ve made in order to pay health care or health insurance costs in the past 12 months? | |||
| Category | Percentage among those who made a difficult sacrifice | Percentage among all adults with ESI | Open-ended responses |
| Cut back on extras (vacation, eating out, entertainment) | 17% | 3% | “Not being able to have extra money to do leisure/recreational things I would like. Have to focus money on ‘needs’ not ‘wants.’” “Cancelled 25th wedding anniversary plans/vacation” |
| Cut back on food/eat less | 12 | 2 | “Having trouble affording food for my kid and myself” “Me not eating so my kids can” “Ate like a bird sometimes” |
| Skipping/being late on other bills | 10 | 2 | “I missed several car payments” “Picking which bill to pay and not to pay” |
| Taking money out of savings/not able to save | 10 | 2 | “Take money out of my 401k and personal savings account” “Not being able to save/put away money” |
| Cut back in general | 7 | 1 | “Cutting our budget everywhere” “Cut back on everything” |
| Increasing credit card/other debt | 7 | 1 | “Raising my credit card debt so much. Now with interest I only have to pay more.” “Taking out more debt to pay down a medical bill” |
| Increasing work hours/going back to work | 7 | 1 | “I had to work 3 jobs at once. 1 full time and 2 part time jobs. Working from 4:30AM until 11pm” |
| Skipping care/medication | 7 | 1 | “Allowing my health to deteriorate because it’s too expensive to keep up with the cost of care” “Not getting the medical treatment I need. I need two surgeries and cannot afford them at this time.” |
| Cut back on clothing, children’s items | 6 | 1 | “Not getting gifts for my grandchildren, birthdays and holidays” “Cut back on purchases for our children, such as clothes” |
Unpaid medical bills can also lead to longer-term financial effects for some people. About one in five (19 percent) say that someone in their household has been contacted by a collection agency in the past 12 months because of medical bills, and 9 percent say they have at some point declared personal bankruptcy because of medical bills (including 2 percent who say they did so in the past 12 months).
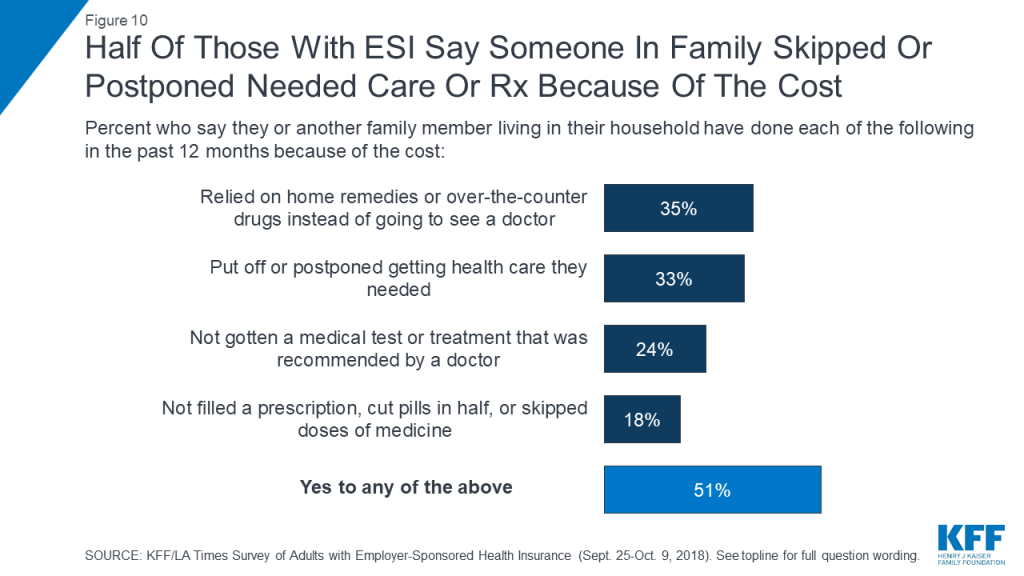
In addition to making sacrifices to afford care, about half (51 percent) of adults with employer health coverage report that they or someone in their household has skipped or delayed some type of medical care or prescription drugs in the past 12 months because of the cost. This includes about a third each who report relying on home remedies or over-the-counter drugs instead of going to see a doctor (35 percent) or putting off or postponing needed care (33 percent), about a quarter (24 percent) who report not getting a recommended medical test or treatment, and about one in five (18 percent) who report not filling a prescription, cutting pills in half, or skipping doses of medicine because of the cost.
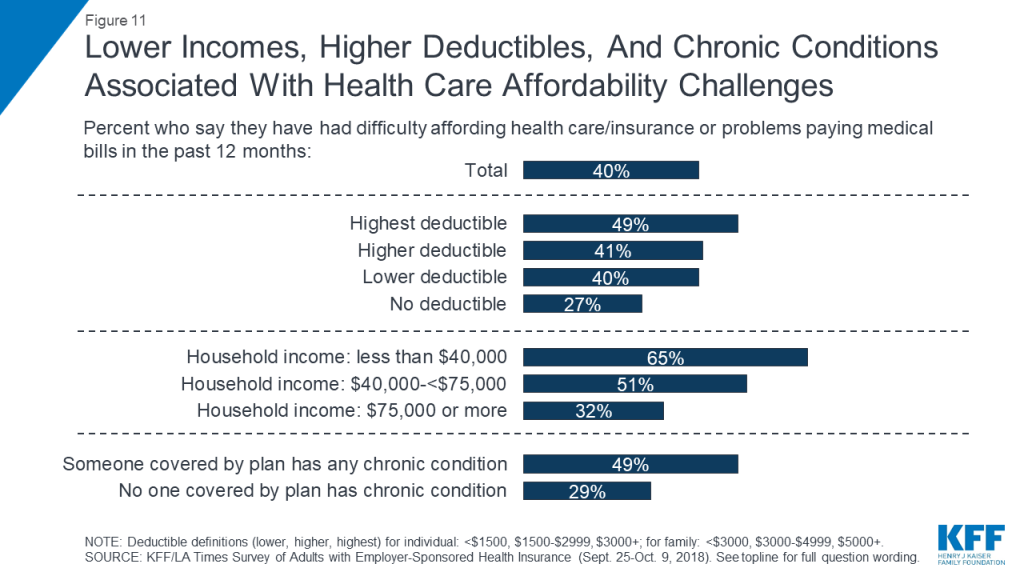
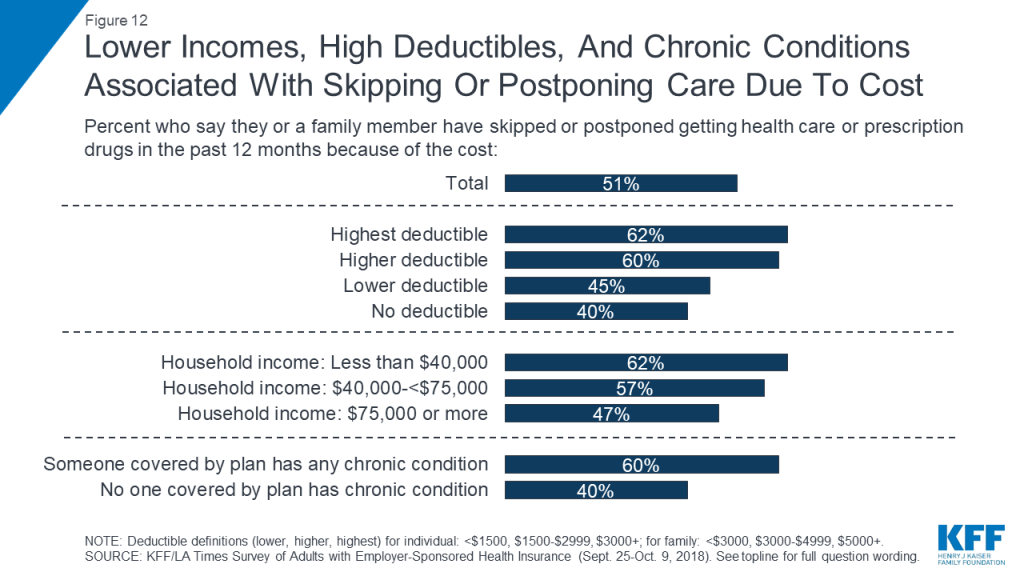
Both difficulty affording health care expenses and forgoing or delaying care due to cost are more commonly reported among certain groups, including those with lower incomes, those in higher deductible plans, and those who say someone covered by their plan has a chronic health condition. For example, while 40 percent of all adults with employer coverage say they’ve had problems paying medical bills or difficulty affording health care or insurance costs for themselves or their family in the past year, the shares are higher among those with annual household incomes below $40,000 (65 percent), those who say someone covered by their plan has a chronic condition (49 percent), and those in the highest deductible plans (49 percent). Similarly, while about half overall report that someone in their household skipped or postponed some type of health care in the past year because of the cost, the share rises to around six in ten among those with the lowest incomes, the highest deductibles, or a chronic condition.
Key Findings: Section 3: The Experiences Of Those With High Deductibles And Those With Chronic Conditions
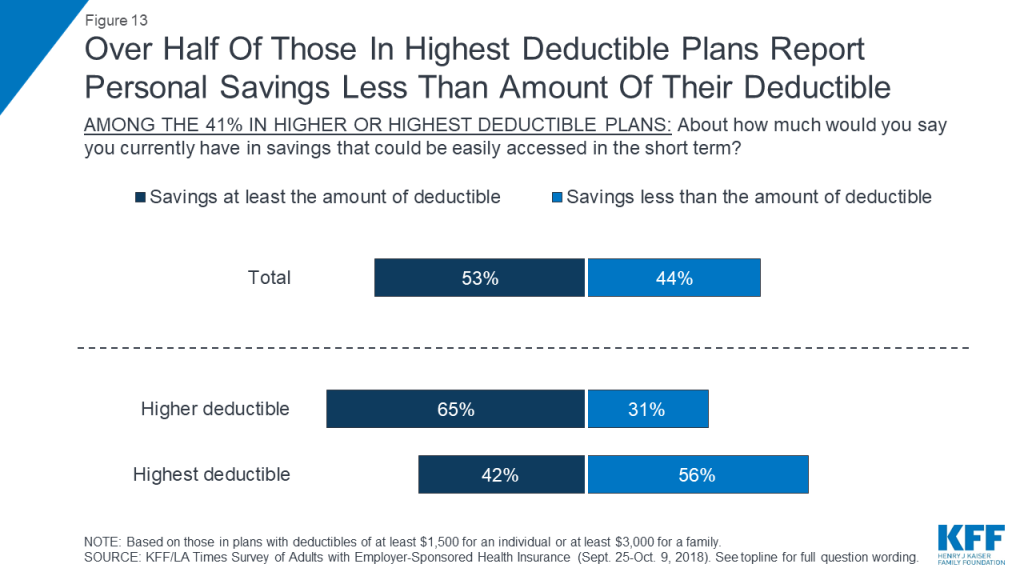
As noted above, people with employer sponsored health plans that have high deductibles are more likely to report problems affording health care, and more likely to postpone or forgo health care services for cost reasons. One contributing factor may be the fact that many people in higher deductible plans do not have enough savings to cover the full amount of their deductible. When asked how much they have in savings that could easily be accessed in the short term, three in ten (31 percent) of those in higher deductible plans and more than half (56 percent) of those in the highest deductible plans name an amount that is less than the amount of their deductible.
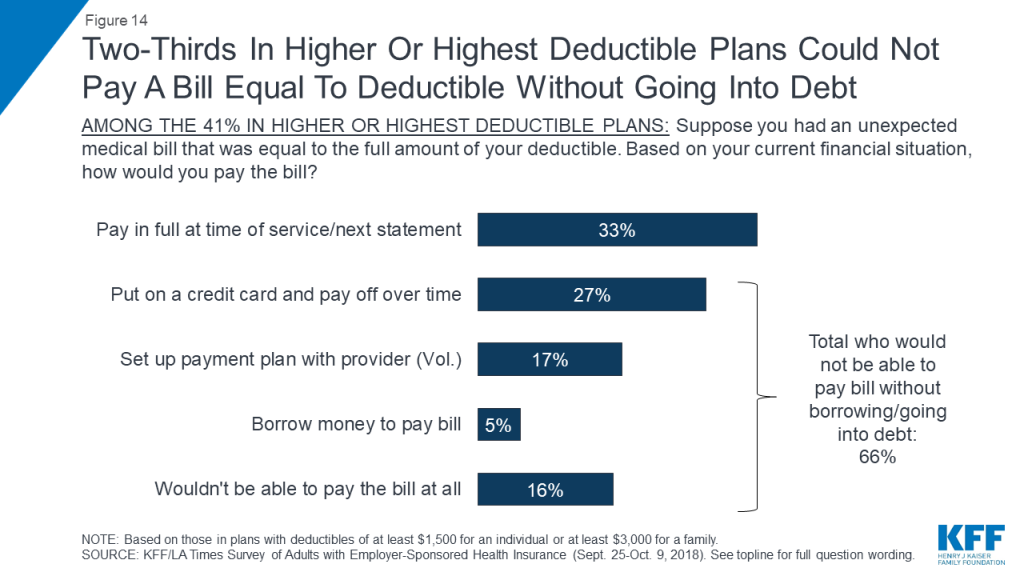
In addition, most people enrolled in plans with high deductibles say they would not be able to pay a bill equal to the full amount of their deductible without going into debt. When asked how they would pay an unexpected medical bill equal to the amount of their deductible, one-third of those in plans with high deductibles say they would either pay the bill at the time of service or put it on a credit card and pay it off at their next statement. About half say they would go into some type of debt to pay the bill, either by putting it on a credit card and paying it off over time (27 percent), setting up a payment plan with the provider (17 percent), or borrowing money from a bank, payday lender, or friends and family (5 percent). One in six (16 percent) say they would not be able to pay such a bill at all.
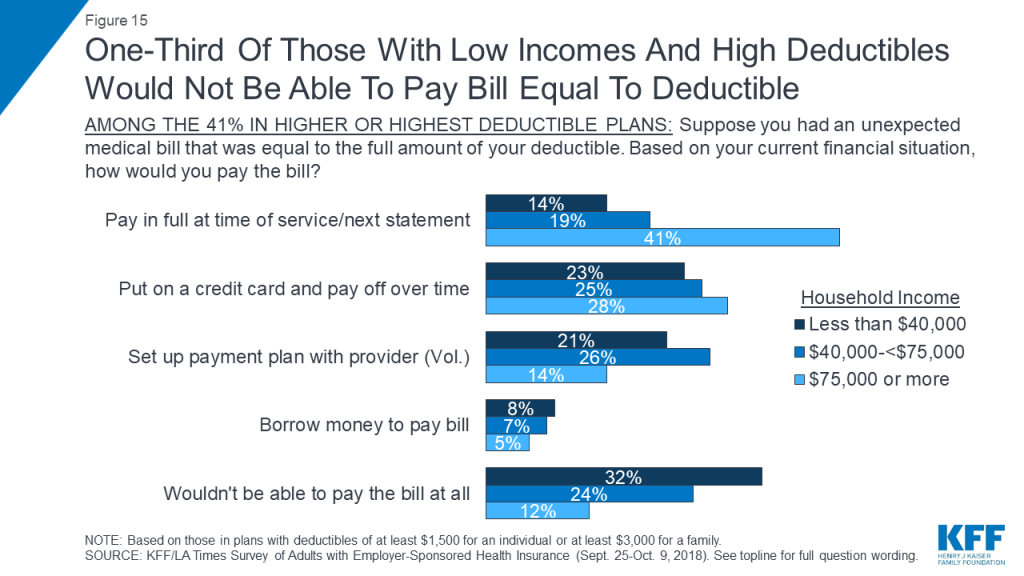
Those in high deductible plans who have lower incomes are even less likely to say they could afford such a bill. Among those in high deductible plans who have annual household incomes of $40,000 or less, one-third (32 percent) say they would not be able to pay a bill in the full amount of their deductible at all, while just 14 percent say they would pay it off right away or at the next credit card statement.
Another group that is particularly vulnerable to health care affordability issues are people with chronic conditions. Those who say someone covered by their plan has a chronic health condition (a group that makes up 54 percent of people with employer plans) are about twice as likely as others to report problems paying medical bills (36 percent versus 16 percent). They are also much more likely to say they’ve had difficulty affording medical bills before meeting their deductible, unexpected medical bills, co-pays, and monthly health insurance premiums.
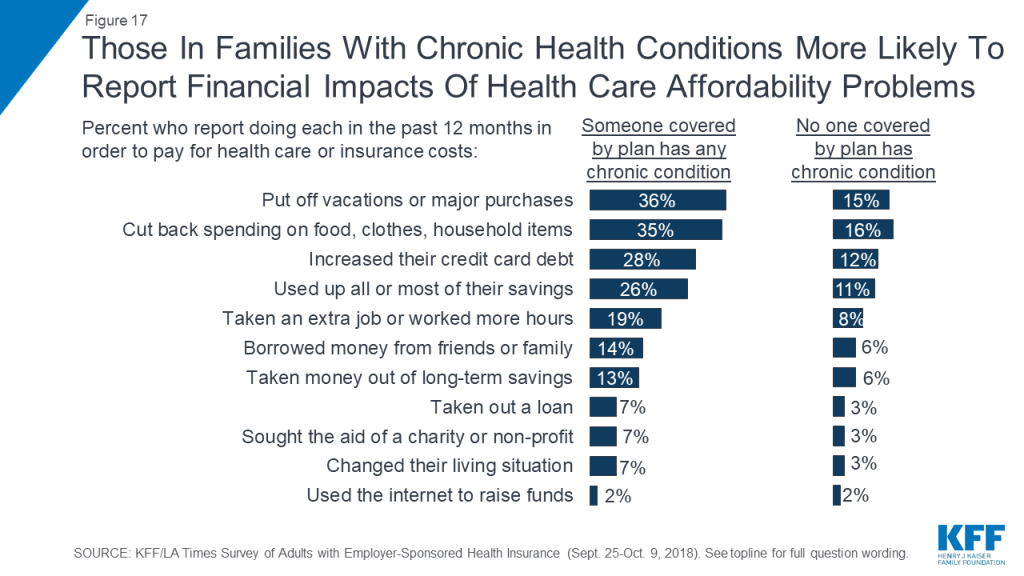
Drilling down into the consequences of these affordability problems reveals more about the financial burden of health care on families with chronic conditions. Overall, more than one-third of those with a chronic condition in the family say they put off vacations or major household purchases (36 percent) or cut back spending on food, clothing, or basic household items (35 percent) in order to pay for health care and insurance costs. Nearly three in ten (28 percent) say they increased their credit card debt, about a quarter (26 percent) say they used up all or most of their savings, and one in five (19 percent) say they took on an extra job or worked more hours in order to pay for health care. Other consequences, such as borrowing money, seeking charity aid, or changing living situation were less common, but still occurred at about twice the rate among people in families with a chronic condition compared to those without such a condition.
Those with chronic conditions are also more likely to report forgoing or delaying health care because of the cost, and this is particularly true for those in plans with high deductibles. For example, 42 percent of those who say someone covered by their plan has a chronic condition say there was a time in the past year when they or another family member put off or postponed getting health care they needed, compared with 23 percent of those without a chronic condition. Among those with chronic conditions who are in the highest deductible plans, the share rises to 60 percent. Similarly, three in ten (31 percent) of those in families with a chronic condition say they skipped a doctor-recommended test or medical treatment in the past year for cost reasons, twice the share as among those with no chronic condition, and rising to 44 percent among those with chronic conditions in the highest deductible plans. Overall, 60 percent of all those with a family chronic condition say someone in their household skipped or postponed some type of care or medicine for cost reasons, rising to 75 percent among those in the highest deductible plans.
| Table 2: Skipping And Postponing Needed Care Because Of Cost, By Family Chronic Condition And Health Plan Deductible Level | |||||
| Percent who say they or a family member did the following in the past 12 months… | No chronic condition in family | Any family member covered by plan has chronic condition | |||
| Total | No/Lower Deductible | Higher Deductible | Highest Deductible | ||
| Put off or postponed getting health care they needed | 23% | 42% | 34% | 49% | 60% |
| Relied on home remedies or OTC drugs instead of going to see a doctor | 28 | 41 | 33 | 46 | 58 |
| Have not gotten a medical test or treatment recommended by a doctor | 15 | 31 | 24 | 35 | 44 |
| Not filled a prescription, cut pills in half, or skipped doses of a medicine | 12 | 23 | 19 | 23 | 35 |
| Yes to any | 40 | 60 | 52 | 69 | 75 |
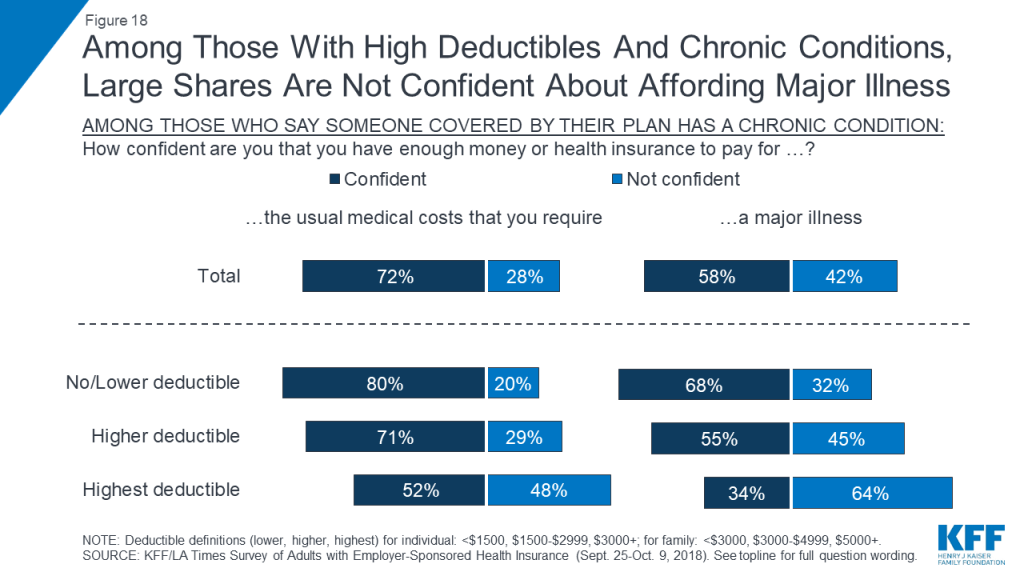
The combination of a chronic condition and a high deductible can also lead families to worry about affording health care in the future. For example, among those with a chronic condition in the family, about half of those in the highest deductible plans say they are not confident in their ability to pay for the usual medical costs they and their family require, and almost two-thirds are not confident they could pay for a major illness.
Key Findings: Section 4: Health Insurance Decision-making And Trade-offs
The survey finds that at the same time premiums and deductibles have been rising for people with employer-sponsored coverage, cost has taken on greater importance in health insurance decision-making compared to previous years. For example, when asked to choose the most important feature in a health plan, one quarter cite a low monthly premium, 18 percent choose a low deductible, and 16 percent cite low co-pays, amounting to six in ten (59 percent) choosing a cost-related factor. About a quarter (26 percent) choose coverage-related factors including having a wide range of benefits (17 percent) or a wide choice of doctors and hospitals (10 percent). These shares are essentially reversed from a KFF survey conducted in 2003, when one-third of people with employer coverage chose cost-related factors as the most important feature in a health plan and six in ten chose a wide range of benefits or choice of providers.
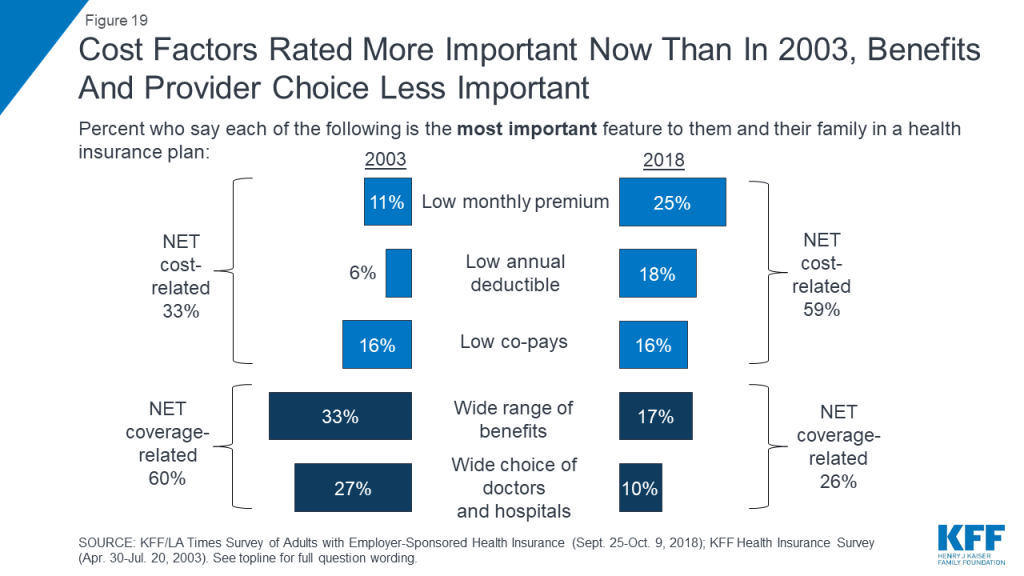
Another trend point shows a similar pattern. Among those whose employer offered a choice of plans, the share who say they picked their plan based on the cost increased 15 percentage points, from 21 percent in 2003 to 36 percent in the current survey.
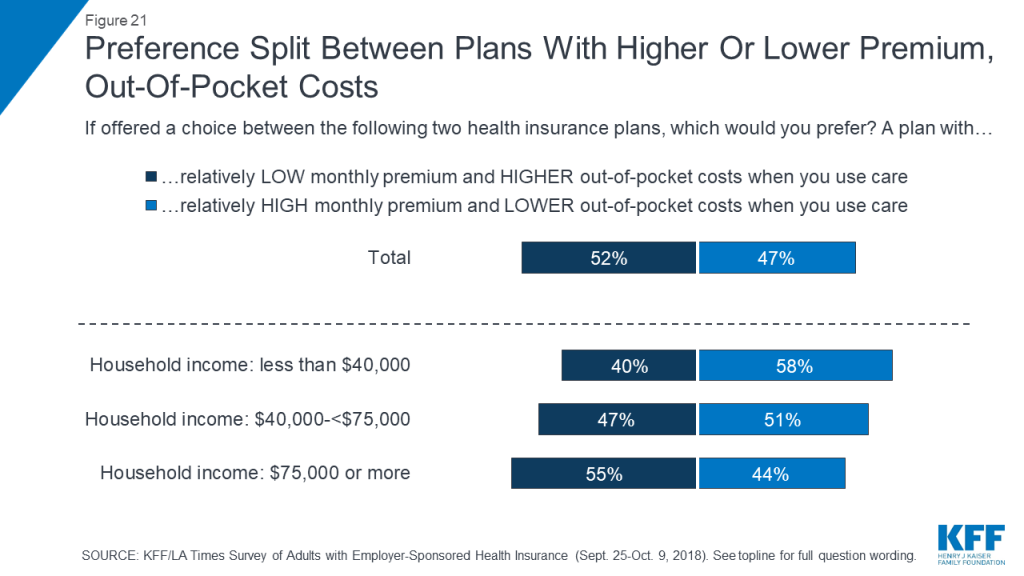
When asked about trade-offs between premiums and out-of-pocket costs, people with ESI are pretty evenly divided between saying they would prefer a plan with a relatively low monthly premium and higher out-of-pocket costs (52 percent) or one with a relatively high monthly premium and lower out-of-pocket costs (47 percent). However, those with higher household incomes lean towards lower premiums and higher out-of-pocket costs, while those with lower incomes lean in the opposite direction.
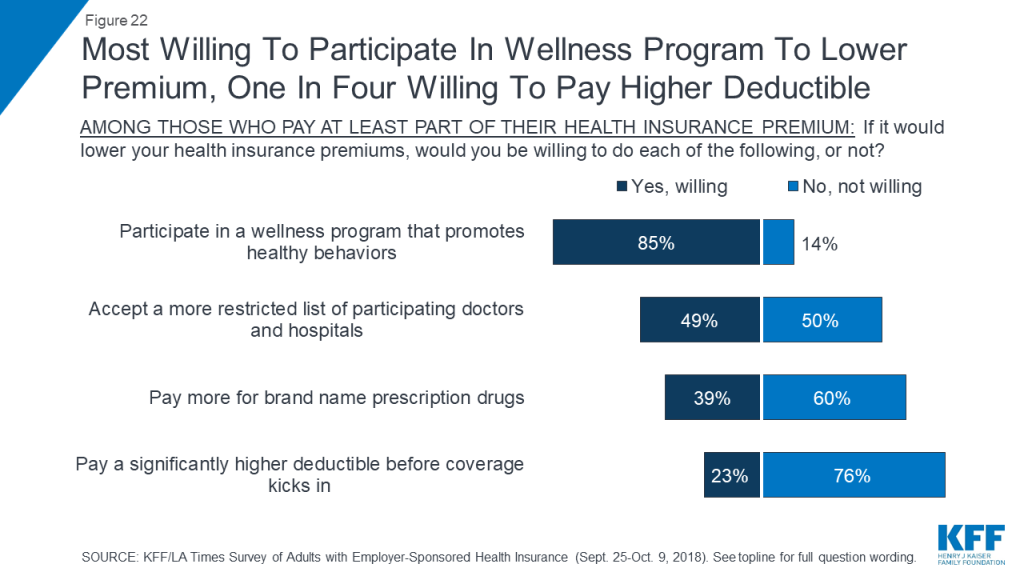
Despite this increased emphasis on cost, there is no great enthusiasm among people with employer plans for several trade-offs that might lower insurance premiums. About three-quarters say they would not be willing to pay a significantly higher deductible in exchange for a lower premium (perhaps because deductibles have risen so much already), and six in ten say they would not be willing to pay more for brand name prescription drugs. However, about half say they would be willing to accept a more restricted list of providers in exchange for lower premiums, and a large majority (85 percent) say they’d be willing to participate in a wellness program.
Key Findings: Section 5: Views And Experiences Related To Health Savings Accounts
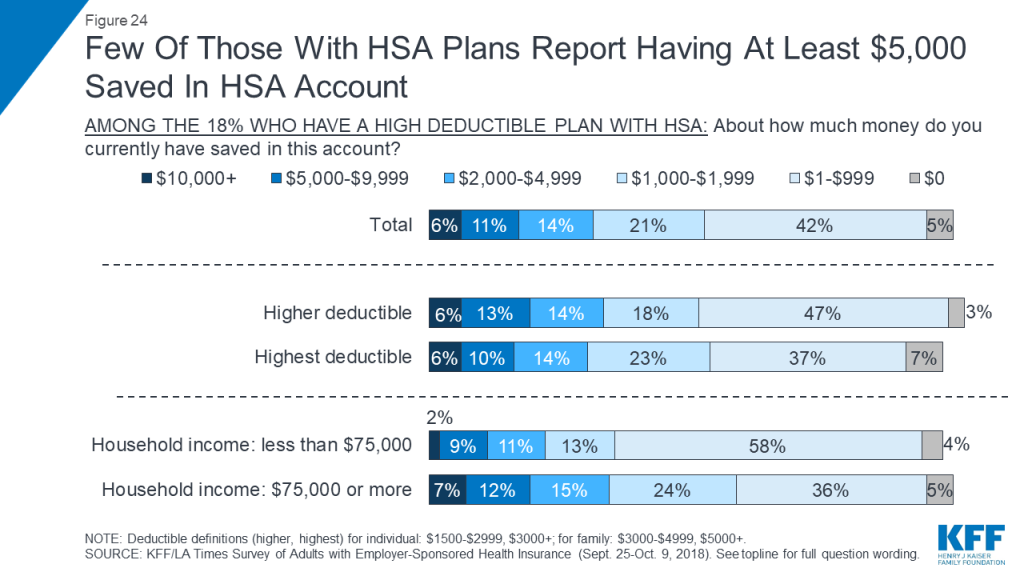
Just under one in five (18 percent) of all adults with employer coverage report being in a high deductible health plan paired with a Health Savings Account (HSA). Most of these people report making relatively modest contributions and having relatively modest savings in their HSA, particularly if they have lower incomes. For example, about half (47 percent) of people with an HSA plan say they have contributed less than $1,000 to their account in the past 12 months, and just 11 percent say they’ve contributed $5,000 or more. Among those with household incomes under $75,000 a year, 72 percent say they contributed less than $1,000 and just 3 percent put in at least $5,000.
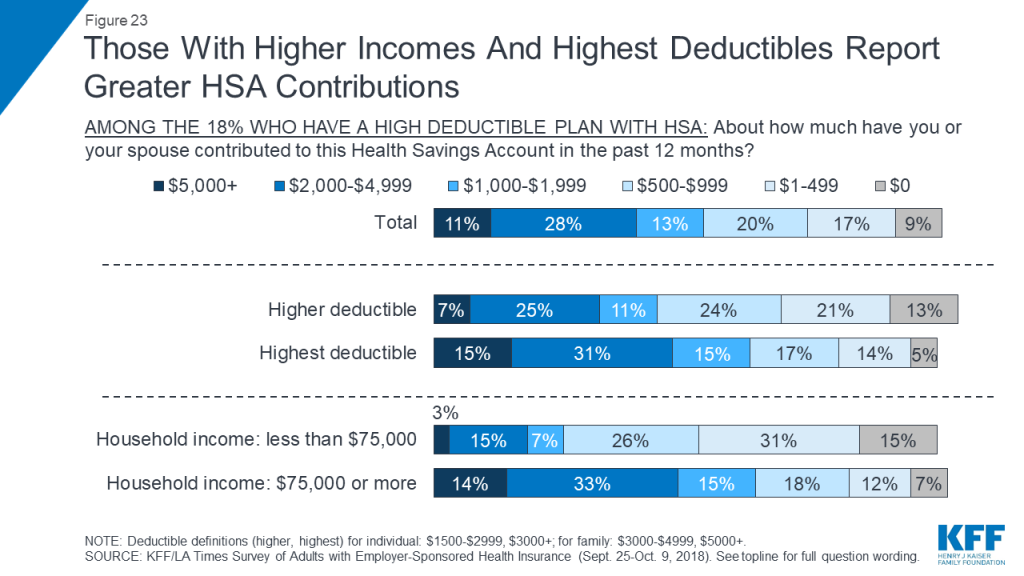
Few seem to be able to save much money in these accounts over time. Overall, about three in ten (31 percent) say they have at least $2,000 saved in their HSA account, including 17 percent who have at least $5,000. Among those with incomes under $75,000, fewer – 22 percent – report having at least $2,000 saved, including one in ten (11 percent) who have at least $5,000.
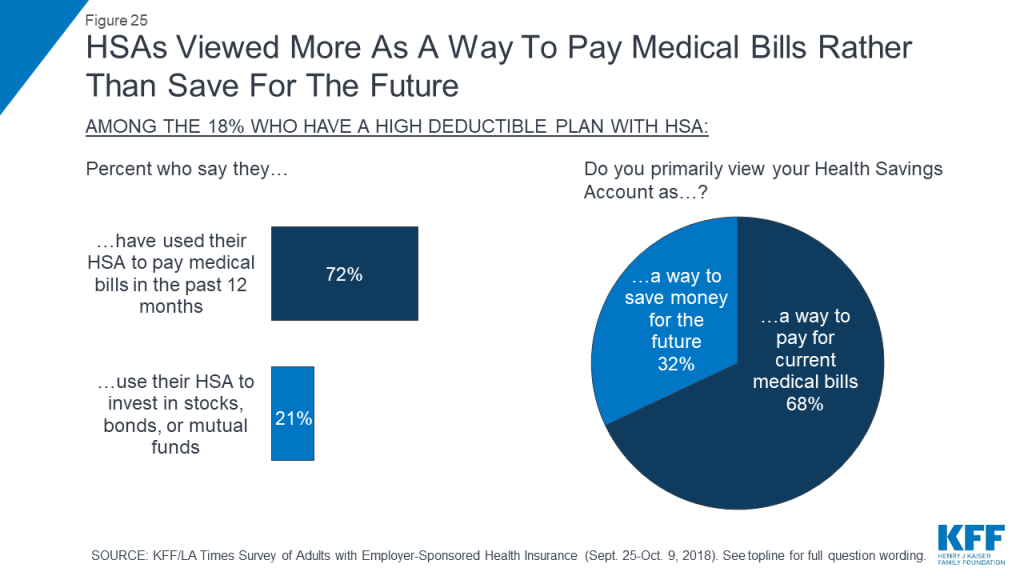
The survey finds that individuals with HSA plans are more likely to view them as a way to pay for current medical bills (68 percent) than as a way to save money for the future (32 percent). This also bears out in their self-reported behaviors: while seven in ten (72 percent) say they have used their HSA to pay medical bills in the past 12 months, far fewer – 21 percent – say they use their HSA to invest in stocks, bonds, or mutual funds.
Key Findings: Section 6: Cost-conscious Health Care Shopping Behaviors
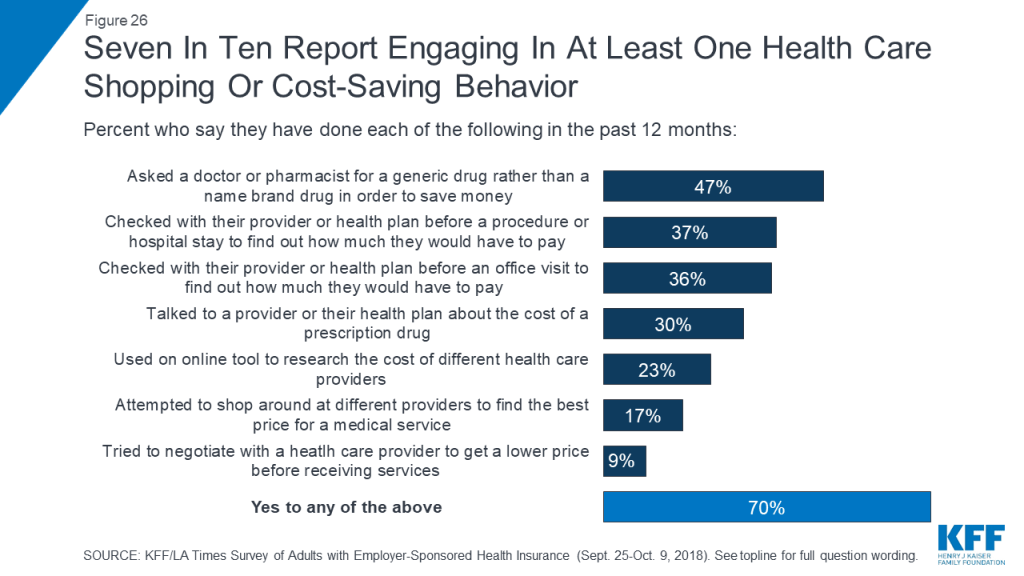
The survey asked about a list of seven different cost-conscious health care shopping behaviors, and finds that seven in ten people with ESI report engaging in at least one of these behaviors in the past 12 months. The most common of these are asking for a generic instead of a name brand drug (47 percent) and checking with a provider or health plan beforehand to find out the cost of a procedure (37 percent) or office visit (36 percent). Less commonly-reported behaviors are those that might actually lead to lower prices on health care services, including using an online tool to research the cost of different providers (23 percent), shopping around at different providers to find the best price for a medical service (17 percent), and trying to negotiate with a provider for a lower price (9 percent).
When consumers do try to negotiate prices, they report being successful less than half of the time; of the 9 percent who say they tried to negotiate with a provider, 43 percent say they were able to get a lower price while 57 percent say they were not.
One selling point of high deductible health plans is that they may incentivize enrollees to engage in more cost-conscious behaviors, including price-based shopping. The survey finds mixed evidence about whether this is occurring among people with employer-based coverage. While the lowest rates of reporting cost-conscious behaviors occur among those in plans with no deductible, those in high deductible plans are not significantly more likely than those in lower deductible plans to report engaging in most of the behaviors asked about in the survey. There are two exceptions: those in plans with high deductibles are more likely than those with lower deductibles to say they’ve asked for a generic rather than a name brand drug (55 percent versus 43 percent) and that they’ve used an online tool to compare the cost of different providers (30 percent versus 22 percent).
Similarly, HSA plans are viewed as a way to give consumers more control over their medical care and to encourage cost-conscious behaviors. To the extent that the survey finds people in HSA plans are engaging in more cost-conscious behaviors, it seems to be due to the deductibles associated with these plans rather than the savings account element, since those in high deductible plans without an HSA are not significantly more likely than those in HSA plans to report these behaviors.
| Table 3: Reports Of Cost-Conscious Health Care Shopping Behaviors, By Health Plan Deductible Level And Health Savings Account Participation | |||||
| Percent who say they did each of the following in the past 12 months… | No deductible | Lower deductible | Higher/Highest deductible | ||
| Total | No HSA | With HSA | |||
| Asked a doctor or pharmacist for a generic drug to save money | 33% | 43% | 55% | 58% | 53% |
| Checked with a provider or health plan before a procedure or hospital stay to find out how much they have to pay | 29 | 38 | 39 | 36 | 44 |
| Checked with their provider or health plan before an office visit to find out how much they have to pay | 29 | 36 | 40 | 38 | 43 |
| Talked to a provider or health plan about the cost of a prescription drug | 18 | 30 | 33 | 32 | 35 |
| Used an online tool to research the cost of different health care providers | 9 | 22 | 30 | 29 | 31 |
| Attempted to shop around at different providers to find the best price | 4 | 17 | 21 | 19 | 25 |
| Tried to negotiate with a doctor, hospital, or other provider to get a lower price | 5 | 9 | 11 | 8 | 15 |
| Yes to any | 52 | 68 | 79 | 77 | 82 |
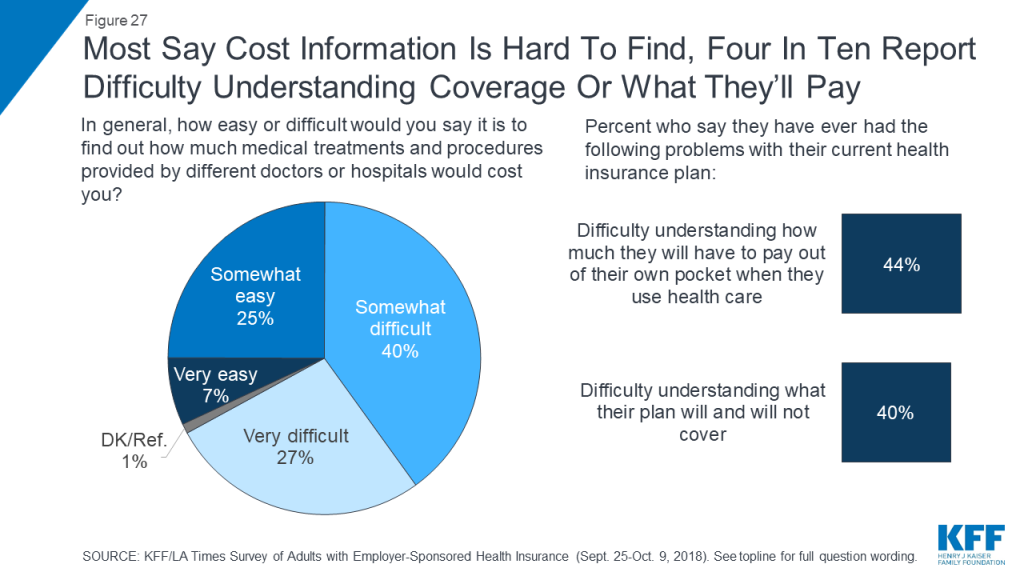
Confusion and lack of access to cost information can also be a barrier for individuals to engaging in cost-conscious health care behaviors. Two-thirds of people with employer coverage say it is difficult to find out how much medical treatments and procedures provided by different doctors and hospitals would cost them. In addition, four in ten say they have had difficulty understanding what their health plan will cover (40 percent) and a similar share report difficulty understanding how much they will have to pay out of their own pocket when they use care (44 percent).
Key Findings: Section 7: Perceptions Of Health System Winners, Losers, And Who’s To Blame
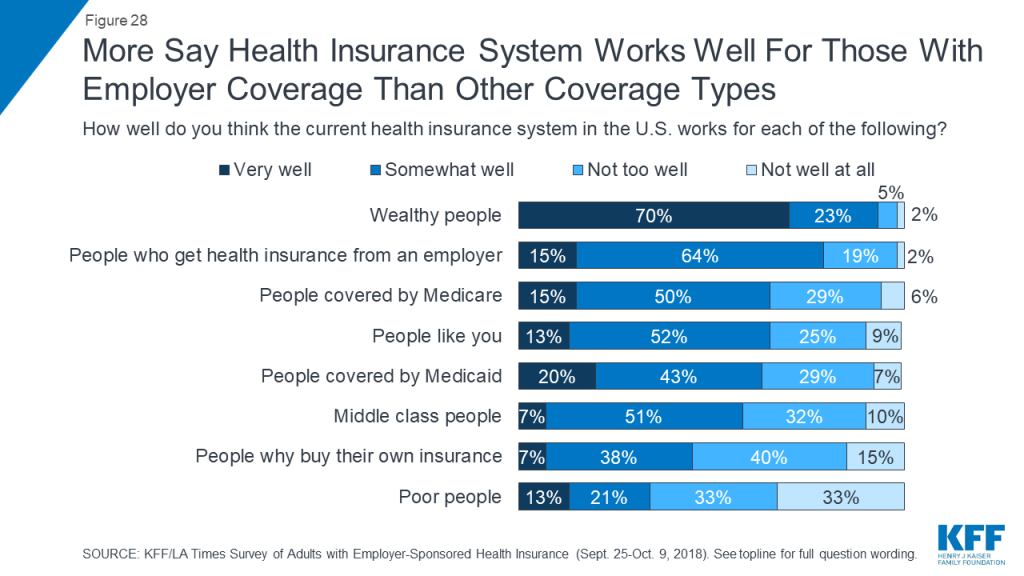
When asked how well the current health insurance system in the United States works for various groups, fewer than a quarter of people with employer coverage say it works “very well” for any group, with the exception of wealthy people (70 percent). Still, a large majority believes the system works at least “somewhat well” for people with employer health coverage (79 percent), somewhat higher than the share who say the same about people covered by Medicare (65 percent) or Medicaid (63 percent), and substantially higher than the share saying the system works well for those who buy their own insurance (45 percent).
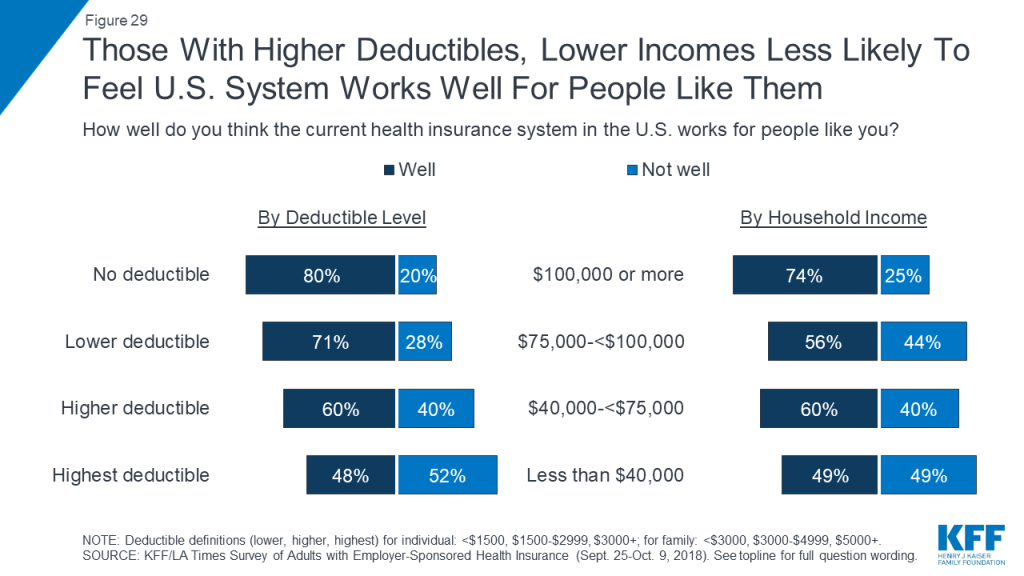
While almost two-thirds (65 percent) of people with employer coverage feel the current health insurance system in the U.S. works at least “somewhat well” for people like them, the percentage varies by income and deductible level. For example, 80 percent of those in a plan without a deductible say the system works well for people like them, compared to about half (48 percent) of those in the plans with the highest deductibles. Similarly, about three-quarters of those with annual household incomes of at least $100,000 feel the system works well for them, compared with half (49 percent) of those with incomes under $40,000.
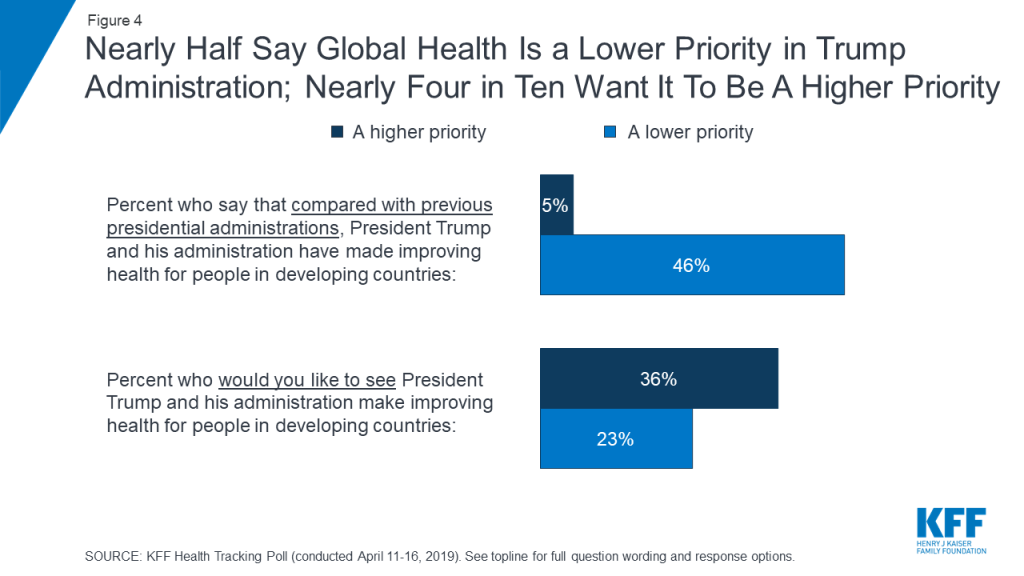
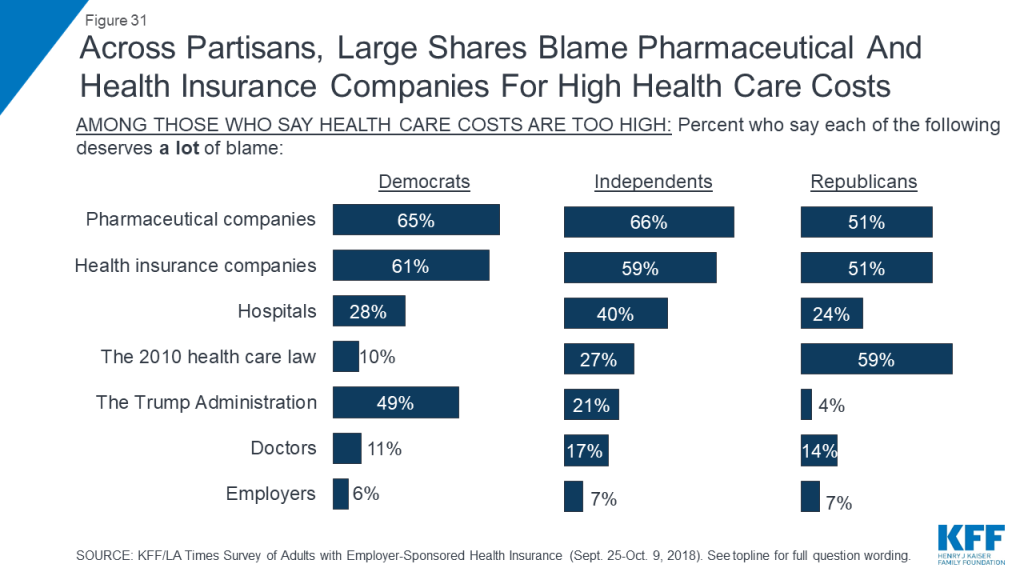
While most feel the system is working well for them, about eight in ten (78 percent) people with employer coverage say the cost of health care for people like them is too high, with near-universal agreement across demographic groups. Asked who they blame for the high cost of health care, people mainly point to two groups that have long been named by the public as culprits of high costs: pharmaceutical and insurance companies, with about six in ten saying each deserves “a lot of blame.” About three in ten also place a lot of blame on hospitals (32 percent), the Affordable Care Act (29 percent) and the Trump Administration’s recent actions on health care (28 percent), while fewer place a lot of blame on doctors (15 percent). Echoing the finding that a large majority says they feel “grateful” for their employer-provided health insurance, just 7 percent say employers deserve a lot of blame for the high cost of health care, while two-thirds say employers deserve “just a little” or “no blame at all.”

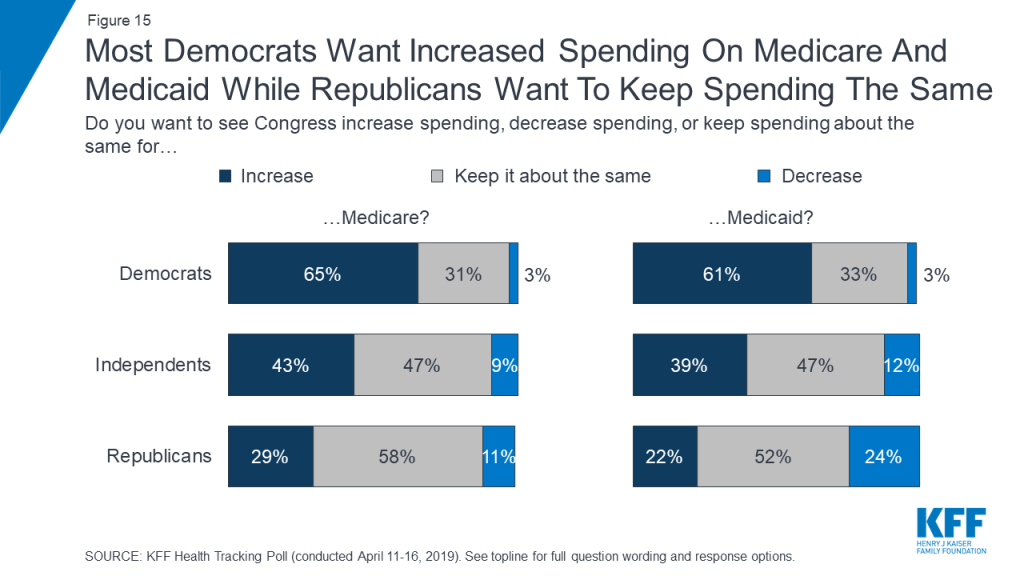
Not surprisingly, there are partisan differences in the share who blame the Affordable Care Act (ACA) and the Trump Administration for the high cost of health care. Among those who feel costs for people like them are too high, about half (49 percent) of Democrats and just 4 percent of Republicans say the Trump Administration’s actions on health care deserve a lot of blame, while six in ten Republicans (59 percent) and just 10 percent of Democrats place a lot of blame on the ACA. Among independents, 27 percent say the ACA deserves a lot of blame and 21 percent say the same about the Trump Administration’s recent actions.
Methods
The Kaiser Family Foundation/Los Angeles Times Survey of Adults with Employer-Sponsored Health Insurance is based on interviews with a probability-based sample of 1,407 respondents between the ages of 18 and 64 who reported having health insurance from an employer or union (excluding those covered by a parent’s employer). Interviews were administered online and by telephone from September 25 through October 9, 2018 in English and Spanish.
Teams from the Kaiser Family Foundation and The Los Angeles Times worked together to develop the questionnaire and analyze the data, and both organizations contributed financing for the survey. Each organization is solely responsible for its content.
NORC at the University of Chicago conducted sampling, interviewing, and tabulation for the survey using the AmeriSpeak Panel, a representative panel of adults age 18 and over living in the United States. AmeriSpeak Panel members are recruited through probability sampling methods using the NORC National Sample Frame, an address-based sampling frame. Panel members who do not have internet access complete surveys via telephone, and internet users complete surveys via the web (for this survey, 60 respondents completed via phone and 1,347 via web).5 For this study, panelists with lower incomes were selected at disproportionately higher rates than those with higher incomes in order to allow for separate analysis of low-income people with employer-sponsored insurance.
The combined results have been weighted to adjust for the fact that not all survey respondents were selected with the same probability, to address the implications of sample design, and to account for systematic nonresponse along known population parameters. The first weighting stage addressed differences in probability of selection for the AmeriSpeak Panel and accounted for differential nonresponse to the AmeriSpeak screening interview. At this stage, an adjustment was also made to account for the oversampling of lower-income panelists and to account for differential nonresponse to the survey screening interview.
In the second weighting stage, the sample was adjusted to match known demographic distributions of the U.S. population ages 18-64 with employer-sponsored health insurance using the following parameters: age, age by sex, age by education, gender by education, education within non-Hispanic whites, race/ethnicity, Census Division, and household income. Demographic weighting parameters were based on the U.S. Census Bureau’s March 2018 Annual Social and Economic Supplement of the Current Population Survey.
The margin of sampling error including the design effect for the full sample is plus or minus 3 percentage points. All statistical tests of significance account for the effect of weighting. Numbers of respondents and margins of sampling error for key subgroups are shown in the table below. For results based on other subgroups, the margin of sampling error may be higher. Sample sizes and margins of sampling error for other subgroups are available by request. Note that sampling error is only one of many potential sources of error in this or any other public opinion poll.
| Group | N (unweighted) | M.O.S.E. |
| Total adults ages 18-64 with employer-sponsored insurance | 1,407 | ±3 percentage points |
| Deductible level | ||
| Zero Deductible | 189 | ±9 percentage points |
| Lower deductible | 647 | ±5 percentage points |
| Higher deductible | 280 | ±7 percentage points |
| Highest deductible | 284 | ±7 percentage points |
Kaiser Family Foundation public opinion and survey research and NORC at the University of Chicago are both charter members of the Transparency Initiative of the American Association for Public Opinion Research.
Endnotes
- State Health Facts. (n.d.). Retrieved April 2019, from https://modern.kff.org/state-category/health-coverage-uninsured/ ↩︎
- Claxton, G., Rae, M., Long, M., Damico, A., Whitmore, H. (2018, October 3). Kaiser Family Foundation 2018 Employer Health Benefits Survey. Retrieved from https://modern.kff.org/health-costs/report/2018-employer-health-benefits-survey/ ↩︎
- The survey includes adults ages 18-64 who say they get their health insurance from their own or a spouse’s employer or union. Those ages 65 and older are excluded since they are generally eligible for coverage through Medicare. ↩︎
- State Health Facts. (n.d.). Retrieved April 2019, from https://modern.kff.org/state-category/health-coverage-uninsured/nonelderly-with-employer-coverage/ ↩︎
- More details on NORC’s AmeriSpeak panel, including sample frame and recruitment methods, can be found at http://www.norc.org/Research/Capabilities/Pages/amerispeak.aspx. ↩︎