KFF designs, conducts and analyzes original public opinion and survey research on Americans’ attitudes, knowledge, and experiences with the health care system to help amplify the public’s voice in major national debates.
Note: The latest information and analysis about this case can be found here.
On March 28, 2019, the D.C. federal district court set aside the Health and Human Services (HHS) Secretary’s approval of Medicaid waivers with work and reporting requirements and other eligibility and enrollment restrictions in Kentucky and Arkansas. This was the second time the court ruled on Kentucky’s waiver, after finding that the Secretary’s initial approval was similarly flawed, and the first time the court considered Arkansas’s waiver. Kentucky’s waiver was the first of its kind to be approved, and Arkansas was the first to implement a waiver with work and reporting requirements.
The court’s decisions not only affect the Kentucky and Arkansas Medicaid programs and enrollees but also are being watched by other states. While these cases play out in the courts, HHS has approved similar work requirement waivers in seven other states, while six states’ requests are pending as of April 1. The Trump Administration also proposed a legislative change to condition Medicaid on work and reporting requirements in all states in its budget for fiscal year 2020. For context as this all develops, we asked MaryBeth Musumeci, Associate Director at the Program on Medicaid and the Uninsured, three questions about the implications of the decisions.
1. What was the rationale behind the court’s decisions?
Musumeci: The court decided that the HHS Secretary’s Kentucky and Arkansas waiver approvals were outside the scope of his Section 1115 demonstration authority, and it set both waivers aside because the Secretary failed to adequately analyze their impact on Medicaid’s primary objective: providing affordable health insurance coverage to low income people. The court acknowledged that Congress granted the Secretary discretion to approve waivers for experimental purposes that he determines will advance Medicaid program objectives. But, the court underscored that this “discretion is not boundless.” The Administrative Procedures Act – which governs agency decision-making — requires a reasoned basis for the Secretary’s decision, grounded in evidence in the administrative record. The administrative record includes the evidence before the Secretary when deciding whether to approve the waiver, such as the state’s waiver application and public comments.
In its waiver application, Kentucky projected that the equivalent of 95,000 people would lose coverage. Public commenters supplied estimates that coverage loss would likely be even greater. There was disagreement about the exact number, but the court concluded that this evidence showed that expected coverage loss was “undoubtedly substantial.” The Secretary argued that some people might move from Medicaid to private insurance, but the court’s decision notes he did not cite supporting evidence.
HHS also argued that coverage loss under the waiver should be weighed against the potential coverage loss if Kentucky were to discontinue the entire Medicaid expansion. Notably, the court rejected that argument, instead saying that the “relevant baseline” is whether or not the waiver would promote coverage compared to the state’s implementation of Medicaid expansion as set out by Congress in the Affordable Care Act. The court also found that, while it was not unreasonable for HHS to take fiscal sustainability into account as a program objective when evaluating the waiver, the Secretary cited no evidence that the waiver would save Kentucky money.
Similar to its Kentucky decision, the court found that the Secretary’s Arkansas waiver approval could not stand because he neither offered his own coverage loss estimate nor grappled with comments in the administrative record that projected substantial disenrollment. The court questioned whether HHS would remedy the errors identified by the court if HHS were to now re-consider and re-approve Arkansas’s waiver, given that the court also found that HHS did not remedy similar errors when re-approving Kentucky’s wavier after the court’s initial decision last year. The court also recounted some of the Arkansas plaintiffs’ stories, including one man who thought he complied with the work reporting requirement but lost coverage and consequently was unable to afford his prescriptions, missed work due to health problems after skipping medication, and then lost his job.
2. What happens next in Kentucky and Arkansas?
Musumeci: The court vacated both waivers. This means that none of the Kentucky waiver provisions can go forward unless — or until — HHS issues a re-approval that passes legal muster or prevails on appeal. In addition to the work and reporting requirements, the Kentucky waiver included other provisions, such as premiums, lock-out periods, elimination of retroactive coverage, and virtual rewards dollars to access vision and dental benefits. Kentucky had planned to implement some provisions in April and the work and reporting requirement as soon as July.
Unlike Kentucky, Arkansas’s waiver implementation began last summer, with over 18,000 people losing coverage in 2018. Arkansas enrollees lose coverage for the rest of the calendar year after failing to meet work and reporting requirements in any three months. The count of non-compliance months reset in January, with the first 2019 coverage losses scheduled for April 1st. The court’s decision means that those disenrollments will not take effect, and waiver implementation, including work and reporting requirements and restriction of retroactive coverage, will be stopped unless or until HHS issues an approval that passes legal muster or prevails on appeal.
3. What do the decisions mean for HHS, Kentucky, Arkansas, and other states that want to condition Medicaid coverage on work and reporting requirements?
Musumeci: HHS, Kentucky, and Arkansas can appeal, so the recent developments are likely not the last word on the scope of the Secretary’s waiver authority. The court evaluated the Secretary’s approval of each state’s waiver individually. This means that, technically, other states can move forward with approved waivers, despite Kentucky and Arkansas implementation being stopped.
However, recently, a lawsuit raising similar challenges to New Hampshire’s work and reporting requirement waiver was filed in the same court that decided the Kentucky and Arkansas cases. New Hampshire’s implementation began in March, with initial coverage losses expected in August. Similar lawsuits could follow challenging the Secretary’s waiver approvals elsewhere. Additionally, states pursuing similar requirements may reconsider given the recent decisions. Last week, a state legislative committee in Iowa decided not to proceed with a Medicaid work requirement bill, and an Idaho proposal was paused after the court decisions were issued but may be modified. However, there is nothing to stop states from adopting programs to support Medicaid enrollees’ ability to work without the threat of coverage loss. Montana has a voluntary work supports program, Maine rejected a work requirement waiver in favor of a similar program, and Kansas has pending Medicaid expansion legislation that includes a voluntary work referral.
Medicare Part D spending on insulin increased 840 percent between 2007 and 2017, far outpacing growth in the number of beneficiaries using insulin therapy, according to a new KFF analysis.
The findings come at a time when the cost of prescription drugs is a major focus for policymakers in Washington, with rising prices for insulin drawing particular scrutiny, including from members of Congress.
Part D spending on insulin rose from $1.4 billion in 2007 to $13.3 billion in 2017, an increase of 840 percent, the analysis finds—not accounting for rebates to Medicare–while the number of enrollees using any insulin therapies increased from 1.6 million in 2007 to 3.1 million in 2016—a rise of 86 percent.
Beneficiaries felt the financial hit, too. Overall out-of-pocket spending among Part D enrollees on insulin quadrupled between 2007 and 2016, from $236 million to $968 million, reflecting both rising prices and more insulin users.
The number of people Medicare covers for insulin therapy has increased as the number of Medicare beneficiaries with diabetes has risen. In 2016, one-third (33%) of all people with Medicare had diabetes, with higher rates among black and Hispanic beneficiaries. From 2007 to 2016, average Medicare total Part D spending per insulin user increased from $862 to $3,949.
The new data note, How Much Does Medicare Spend on Insulin?, examines the cost of insulin for Medicare and beneficiaries enrolled in Medicare Part D plans. It also looks at Part D spending on the top five insulin therapies covered under Part D as well as Part D spending by insulin manufacturer.
Although drug-specific rebate data are proprietary, the analysis uses the average Part D rebate to illustrate the potential effect of rebates on total Part D insulin spending. Manufacturer rebates reduce Medicare spending, but do not lower Part D enrollees’ out-of-pocket costs, which are based on the list price.
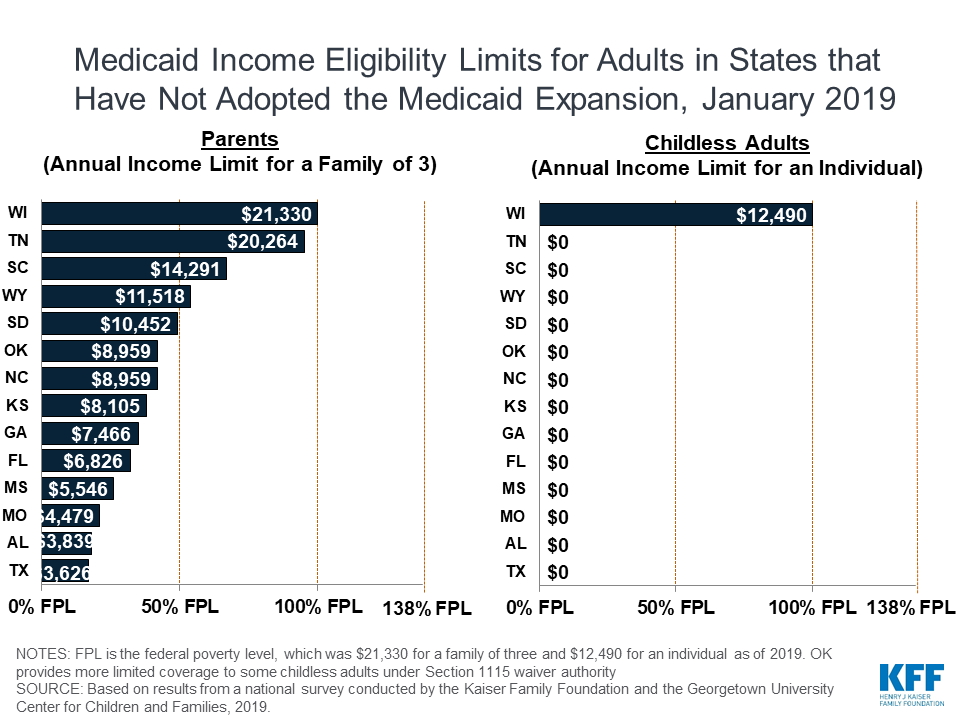
NOTE: Annual eligibility limits for a parent in a family of three. FPL is the federal poverty level. In 2019, the FPL was $21,330 for a family of three. Thresholds include the standard five percentage point of FPL disregard. Based on results from a national survey conducted by KFF with Georgetown University Center for Children and Families, 2019.
PETERSBURG, Fla. & SAN FRANCISCO, Calif. (April 2, 2019) – The Poynter Institute, a global nonprofit dedicated to excellence in journalism, announces an exclusive new partnership between its fact-checking news organization, PolitiFact, and KFF (Kaiser Family Foundation) – the trusted source of health policy information – through Kaiser Health News (KHN), KFF’s editorially independent national health and health policy newsroom.
Through this first topic-based fact-checking partnership, PolitiFact staffers will train and work with the KHN editorial team to report, write and edit content using PolitiFact’s fact-checking methodology and will be on-hand throughout the course of the partnership to ensure the quality and execution within its code of ethics and editorial standards. All fact-checks are reviewed and rated on the Truth-O-Meter by three PolitiFact editors before publication.
Under this initial two-year partnership, both organizations will produce and publish health-related fact-checks on a new co-branded digital channel that will be accessible from either politifact.com or kffhealthnews.org. PolitiFact and KHN anticipate publishing health-related fact-checks beginning later this spring.
“Politicians debate health care and invoke research and stats with an authority that may not always be accurate or in context,” said Neil Brown, president of the Poynter Institute. “This collaboration between two of the most credible and respected brands in journalism — PolitiFact and Kaiser Health News — aims to help consumers untangle the half-truths often found in the political discourse relating to health care.”
PolitiFact is the largest political fact-checking news organization in the United States and won the Pulitzer Prize in 2009. National PolitiFact reporters are based in St. Petersburg and Washington, D.C., while news partnerships expand PolitiFact reporting into 13 states and in Spanish-speaking news markets.
“KFF has a long history of providing trusted information on national health issues. This collaboration brings the knowledge and experience of KHN’s team of journalists together with the established and trusted PolitiFact approach to help the general public, policymakers, and other news organizations sort through the misinformation and disinformation that often permeates political and industry discussions of health policy issues,” said Drew Altman, KFF’s CEO and KHN’s founding publisher. “We are thrilled to be working with Poynter and PolitiFact on this joint effort.”
About The Poynter Institute:
The Poynter Institute for Media Studies is a global leader in journalism education and a strategy center that stands for uncompromising excellence in journalism, media and 21st-century public discourse. Poynter faculty teach seminars and workshops at the Institute in St. Petersburg, Florida, and at conferences and organizations around the world. Its e-learning division, News University, offers the world’s largest online journalism curriculum, with hundreds of interactive courses and tens of thousands of registered international users. The Institute’s website, poynter.org, produces 24-hour coverage about media, ethics, technology and the business of news. Poynter is the home of the Craig Newmark Center for Ethics and Leadership, the Pulitzer Prize-winning PolitiFact, the International Fact-Checking Network and MediaWise, a teen digital information literacy project. Collectively, this work builds public awareness about journalism, media, the First Amendment and discourse that serves democracy and the public good.
About The Henry J. Kaiser Family Foundation and Kaiser Health News:
Filling the need for trusted information on national health issues, KFF (the Kaiser Family Foundation) is a nonprofit organization based in San Francisco, California. KHN is an editorially independent program of KFF, which is not affiliated with Kaiser Permanente. KHN is the nation’s leading and largest health and health policy newsroom, with more than 50 journalists and dozens of freelancers producing stories that run on kffhealthnews.org and that are published by hundreds of news organizations across the country.
The rising cost of prescription drugs is currently a major focus for policymakers. One medication that has come under increasing scrutiny over its price increases is insulin, used by people with both Type 1 and Type 2 diabetes to control blood glucose levels. Among people with Medicare, one third (33%) had diabetes in 2016, up from 18% in 2000. The rate of diabetes is higher among certain groups, including more than 40% of black and Hispanic beneficiaries. Although not all people with diabetes take insulin, for many it is a life-saving medication and essential to maintaining good health. Three companies—Eli Lilly, Novo Nordisk, and Sanofi—manufacture most insulin products, and there are no generic insulin products currently available, despite the fact that insulin was discovered in the 1920s. Committees in both the House and the Senate recently convened hearings on prescription drug costs that focused on rising insulin prices and affordability concerns for patients, and congressionalinvestigationsare underway.
This data note examines spending on insulin by Medicare and beneficiaries enrolled in private Part D drug plans, based on data from the Centers for Medicare & Medicaid Services (see Data and Methods). Because drug-specific rebate data for Medicare are proprietary, the analysis examines Medicare spending without rebates, but also uses average Part D rebates reported by Medicare’s actuaries to illustrate the potential effects on total Part D insulin spending. While rebates may help to lower Part D premiums, they do not lower enrollees’ out-of-pocket drug costs, which are based on list prices.
Key Findings
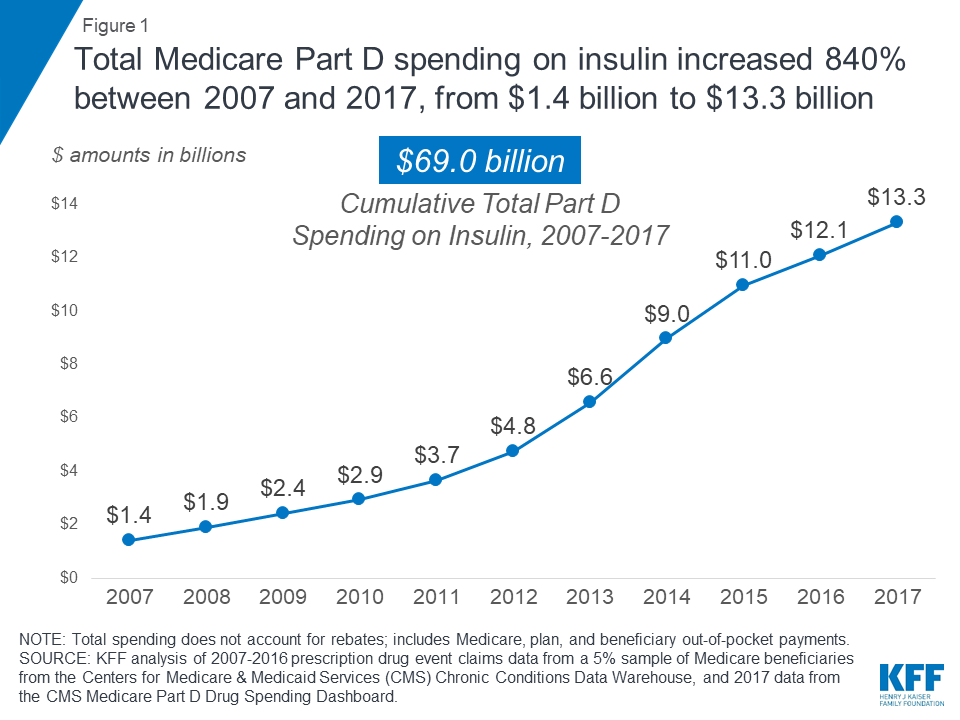
Total Medicare Part D spending on insulin increased by 840% between 2007 and 2017, from $1.4 billion to $13.3 billion (Figure 1)—including what Medicare, plans, and beneficiaries paid.
Figure 1: Total Medicare Part D spending on insulin increased 840% between 2007 and 2017, from $1.4 billion to $13.3 billion
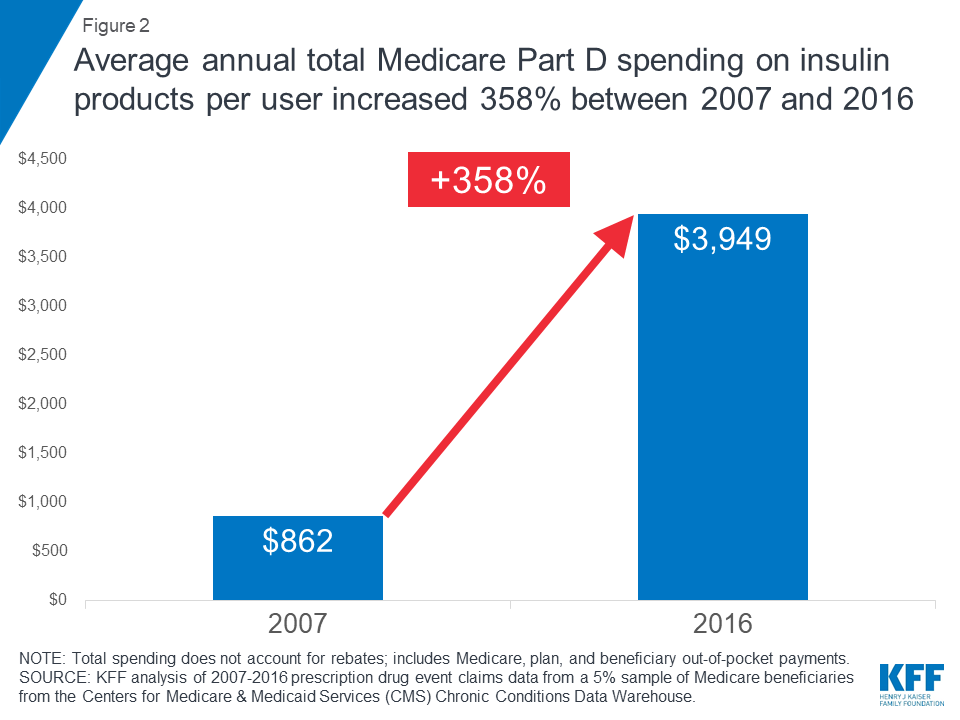
With rising prices and the introduction of more costly insulin products over time, average total Medicare Part D spending per user on insulin products increased by 358% between 2007 and 2016, from $862 to $3,949.
Aggregate out-of-pocket spending by Part D enrollees on insulin quadrupled between 2007 and 2016, from $236 million to $968 million, reflecting both an increase in the number of users and price increases for insulin. Among enrollees without low-income subsidies, average per capita out-of-pocket spending on insulin nearly doubled between 2007 and 2016 (from $324 to $588; an increase of 81%).
Among all insulin products, Lantus Solostar, a long-acting insulin manufactured by Sanofi, accounted for the largest share of both total Part D spending and out-of-pocket spending by enrollees who used insulin. Spending on Lantus Solostar, which was used by 1.1 million Part D enrollees in 2017, accounted for 20% of total Part D spending on insulin therapies in 2017 and 25% of out-of-pocket spending on insulin by non-low income subsidy enrollees in 2016.
Total Medicare Part D Spending on Insulin
Including what Medicare, plans, and beneficiaries paid, Medicare Part D spending on insulin increased by 840% from $1.4 billion in 2007 to $13.3 billion in 2017. Learn more in this @KaiserFamFound analysis
According to our analysis, total Medicare Part D spending on insulin increased by 840% between 2007 and 2017, from $1.4 billion to $13.3 billion—including what Medicare, plans, and beneficiaries paid. In light of rising prices for existing insulin products and the introduction of more costly insulin therapies over time, average annual total Part D spending on insulin products per user increased by 358% between 2007 and 2016—from $862 to $3,949—while average total Medicare Part D spending per insulin prescription increased by 280% over these years—from $96 to $363 (Figure 2).
Figure 2: Average annual total Medicare Part D spending on insulin products per user increased 358% between 2007 and 2016
The total number of Part D enrollees using any insulin therapy nearly doubled between 2007 and 2016, from 1.6 million enrollees to 3.1 million—a much smaller increase in percentage terms (86%) than the percent increase in total Part D spending on insulin over the 2007-2016 period (753%) (Table 1). The total number of insulin prescriptions covered by Part D also increased over these years (from 14.8 million in 2007 to 33.3 million in 2016), but the percentage increase (125%) was also substantially lower than the percent increase in total insulin spending.
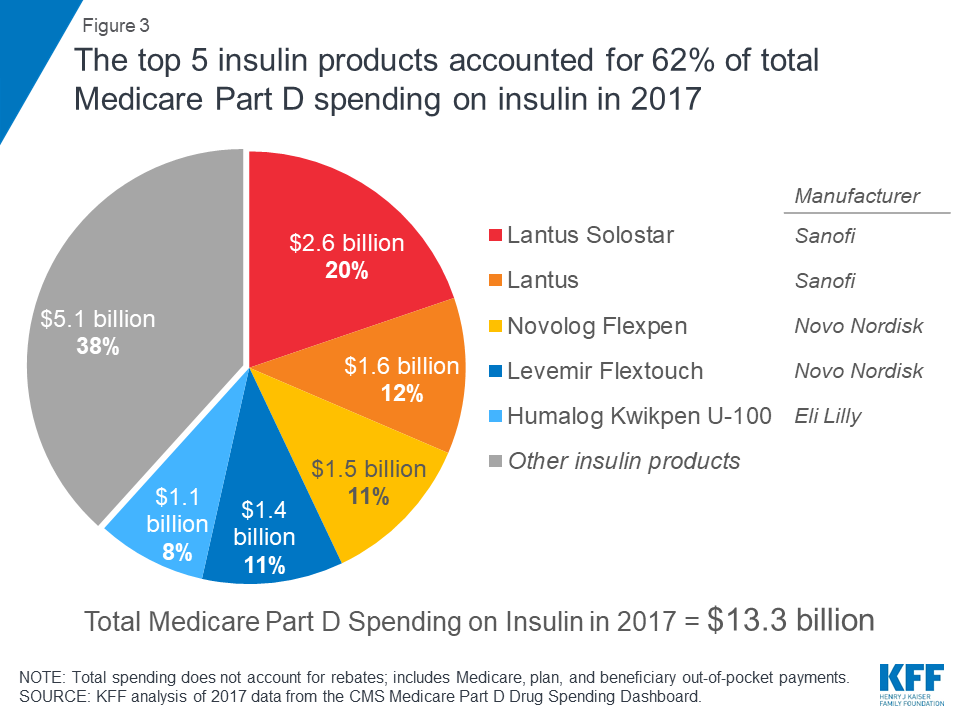
Total Part D spending on top insulin therapies. In 2017, the top five insulin therapies covered under Part D accounted for 62% of total Part D spending on insulin, or $8.2 billion out of the $13.3 billion total spending on insulin (Figure 3). Among all insulin products, Part D spending was highest for Lantus Solostar, a long-acting insulin manufactured by Sanofi, with $2.6 billion in Part D spending in 2017. This one drug alone, used by 1.1 million Part D enrollees in 2017, accounted for 20% of total Part D spending on insulin that year. Lantus Solostar was also among the top five drugs overall in terms of total Part D spending in 2017.
Figure 3: The top 5 insulin products accounted for 62% of total Medicare Part D spending on insulin in 2017
Average total Part D per capita costs for insulin therapy in 2017 ranged from $693 for Humulin R, a short-acting regular insulin manufactured by Eli Lilly—used by 102,000 Part D enrollees in 2017—to $10,014 for Humulin R U-500, a concentrated regular insulin for people who need large doses of insulin, also manufactured by Eli Lilly—used by 14,500 beneficiaries in 2017.
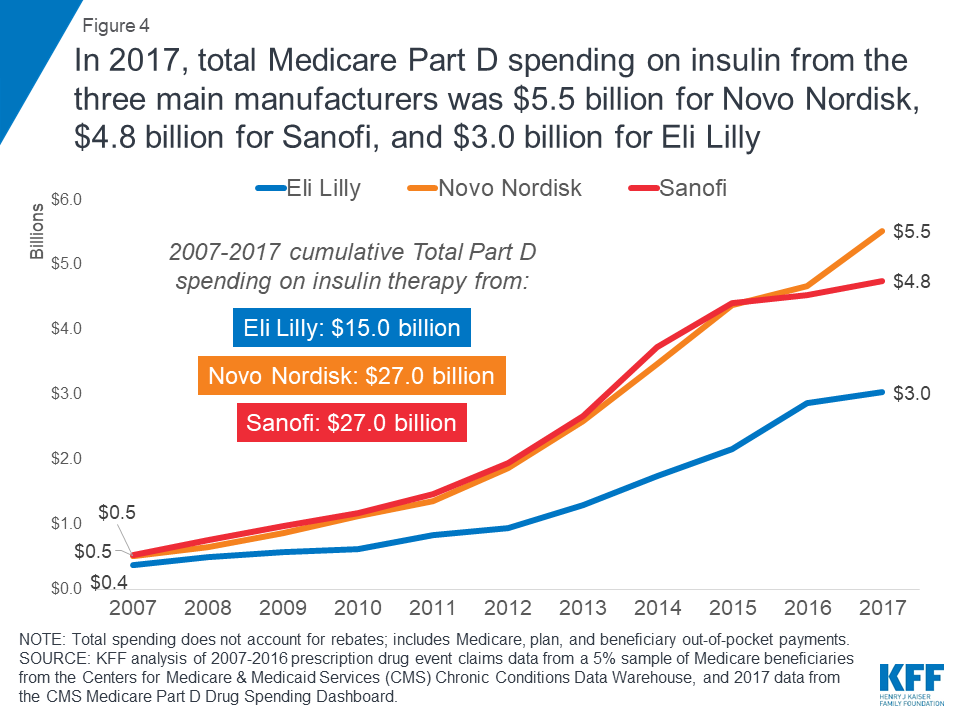
Total Part D spending by insulin manufacturer. In 2017, total Part D spending on all of the different insulin products from the three main manufacturers was $5.5 billion for Novo Nordisk, $4.8 billion for Sanofi, and $3.0 billion for Eli Lilly (Figure 4). Between 2007 and 2017, spending on insulin therapies from all three manufacturers increased dramatically. Over this time period, cumulative total Part D spending was $27.0 billion for insulin products from Novo Nordisk, another $27.0 billion for Sanofi, and $15.0 billion for Eli Lilly.
Figure 4: In 2017, total Medicare Part D spending on insulin from the three main manufacturers was $5.5 billion for Novo Nordisk, $4.8 billion for Sanofi, and $3.0 billion for Eli Lilly
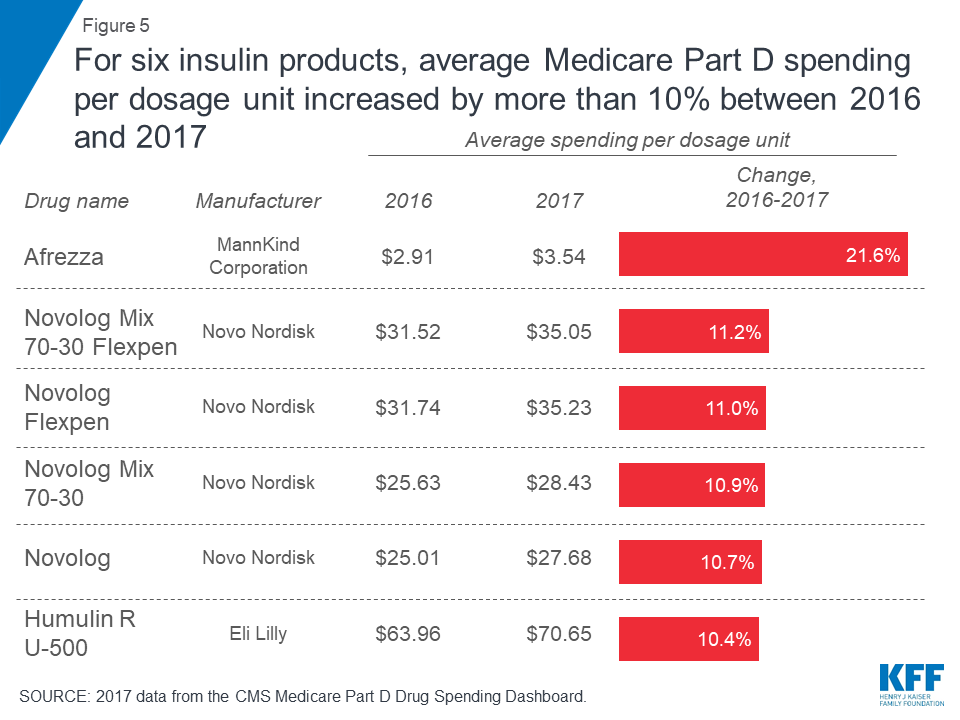
Trends in insulin spending per dosage unit. Of the 22 insulin therapies listed in the CMS Part D drug spending dashboard in both 2013 (the first year of dashboard data) and 2017 (the most recent year), 19 products had increases of more than 10% in annual Part D spending per dosage unit between 2013 and 2017, according to CMS estimates (Table 2). Six insulin products had increases of more than 10% in average spending per dosage unit between 2016 and 2017 alone (Figure 5).
Figure 5: For six insulin products, average Medicare Part D spending per dosage unit increased by more than 10% between 2016 and 2017
These percentage increases in average spending per dosage unit for insulin products represent price increases that can translate to large increases in total spending per claim over time—even if the change in average spending per dosage unit measured in dollars may be relatively low—since there are typically multiple dosage units associated with each claim. For example, while Afrezza has the lowest average spending per dosage unit in 2017 of all the insulin products in the CMS dashboard data ($3.54), the 2016-2017 change of 21.6% was the largest in percent terms—and it translates into a large difference in spending per claim for Afrezza between 2016 and 2017—from $566 per claim in 2016 to $690 per claim in 2017, a $124 increase (Table 2).
Out-of-Pocket Spending on Insulin by Medicare Part D Enrollees
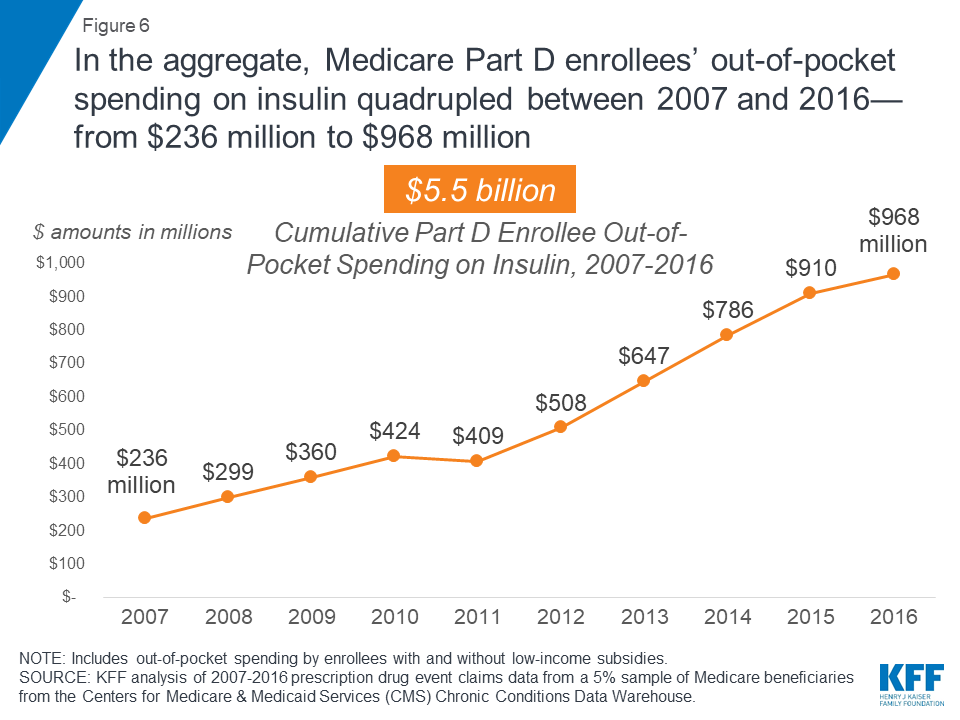
Part D enrollees’ total annual out-of-pocket costs for insulin. Since Medicare Part D plans cover a portion of enrollees’ total drug costs, enrollees pay less than the retail price of drugs covered by their plan, and those who receive Part D low-income subsidies (LIS) face relatively low out-of-pocket costs. Still, in the aggregate, out-of-pocket spending among all Part D enrollees on insulin quadrupled between 2007 and 2016, from $236 million to $968 million, reflecting both an increase in the number of users and price increases for insulin (Figure 6). Between 2007 and 2016, Part D enrollees spent a combined $5.5 billion out of pocket on insulin therapy.
Figure 6: In the aggregate, Medicare Part D enrollees’ out-of-pocket spending on insulin quadrupled between 2007 and 2016—from $236 million to $968 million
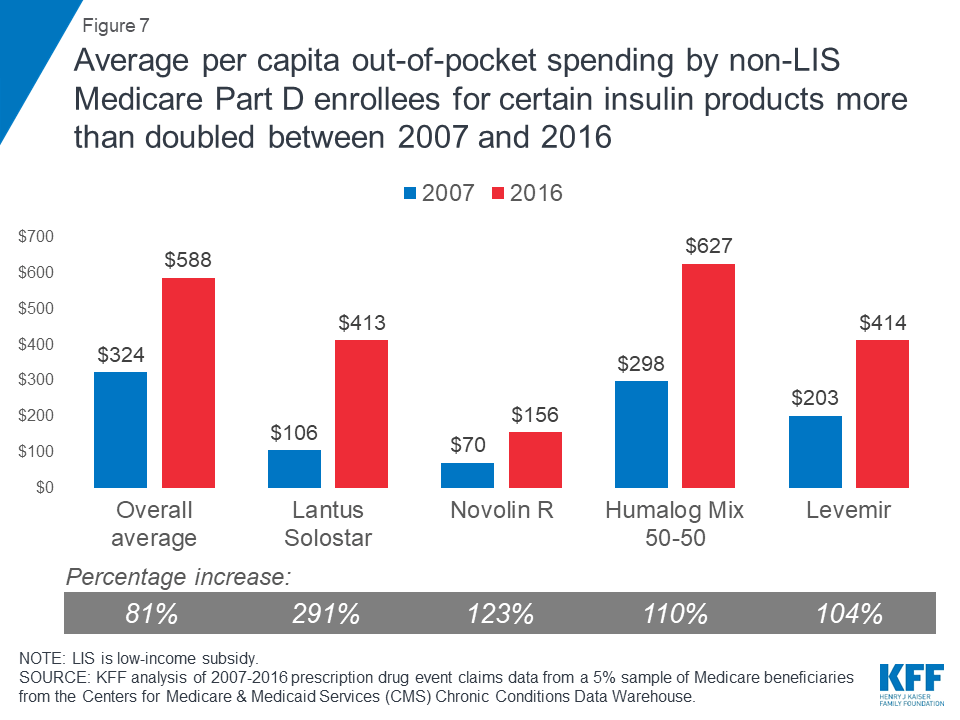
Part D enrollees’ average per capita out-of-pocket costs for insulin. Among Part D enrollees who did not receive LIS, average per capita out-of-pocket spending for insulin alone was $588 in 2016, but including costs for all other prescriptions, total per capita out-of-pocket spending among those who used insulin was $1,334. Non-LIS enrollees’ average per capita out-of-pocket spending on insulin in 2016 was nearly double the amount in 2007 ($324; an increase of 81%).
For several insulin products, average per capita out-of-pocket spending by non-LIS enrollees increased by more than 100% between 2007 and 2016; for example, average per capita out-of-pocket spending on Lantus Solostar increased by 291% from $106 to $413 (Figure 7).
Figure 7: Average per capita out-of-pocket spending by non-LIS Medicare Part D enrollees for certain insulin products more than doubled between 2007 and 2016
In 2016, average annual per capita out-of-pocket spending by non-LIS enrollees who used insulin therapies ranged from $110 for Levemir Flexpen, a long-acting insulin manufactured by Novo Nordisk, to $822 for Humulin R U-500 (Table 3).
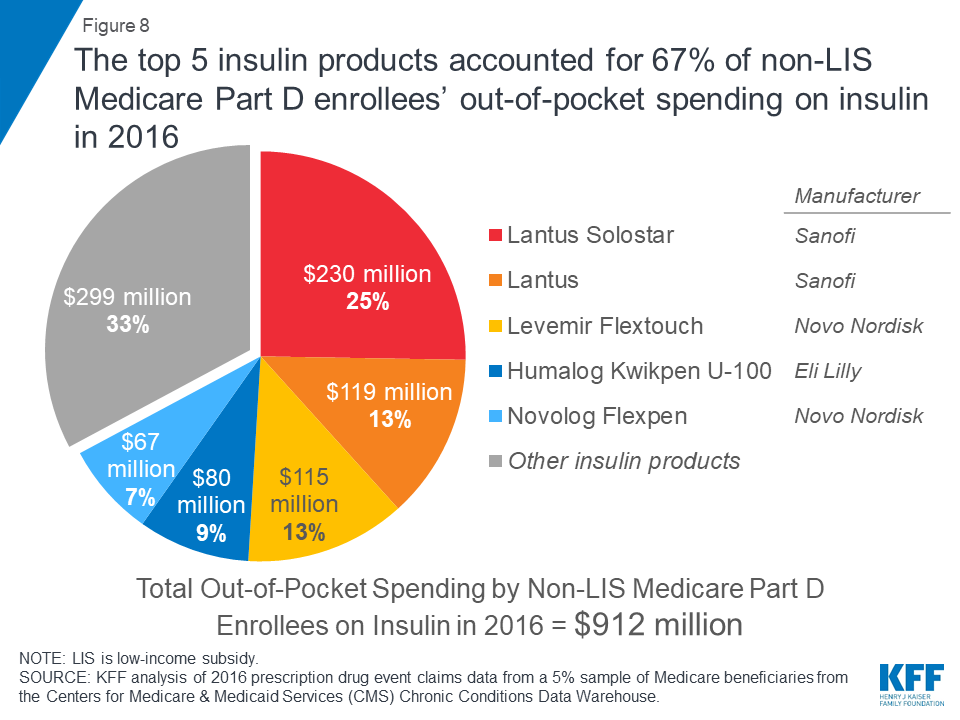
Part D enrollees’ out-of-pocket spending on top insulin therapies. In 2016, the top five insulin therapies accounted for 67% of aggregate out-of-pocket spending on insulin by non-LIS enrollees that year, or $0.6 billion out of the $0.9 billion in out-of-pocket spending on insulin by non-LIS enrollees (Figure 8). Aggregate out-of-pocket spending was highest for Lantus Solostar, accounting for 25% ($230 million) of non-LIS enrollees’ total out-of-pocket spending on insulin therapy in 2016.
Figure 8: The top 5 insulin products accounted for 67% of non-LIS Medicare Part D enrollees’ out-of-pocket spending on insulin in 2016
Illustrating the Potential Effect of Rebates on Total Insulin Spending
Our analysis is based on retail claims data and aggregated spending data that do not take into account manufacturer rebates and discounts to plans, which are considered proprietary and therefore not publicly available. There is data suggesting that insulin manufacturers have provided large rebates and discounts to payers that have produced net prices that are significantly lower than the high list prices that have attracted public scrutiny. Regardless of the magnitude of rebates for insulin products, however, rebates do not help to lower enrollees’ out-of-pocket costs for insulin. This is because the amount that enrollees pay out of pocket is either a flat dollar copayment (depending on their plan’s cost-sharing design) or, if they are paying full cost in the deductible phase or a coinsurance amount, their cost is based on pre-rebate list prices rather than post-rebate net prices.
Because CMS does not disclose drug-specific rebates, we are unable to know exactly the degree to which our estimates of total Part D spending on insulin therapy might overstate actual costs to Medicare and plans. We can approximate the potential effect of rebates on total Part D spending by assuming that all Part D plans had received for all insulin products the average rebate reported by Medicare’s actuaries each year between 2007 and 2017. Based on this assumption, insulin spending would have increased from $1.3 billion in 2007 (applying the 9.6% average rebate in 2007) to $10.3 billion in 2017 (applying the 22.8% estimated average rebate in 2017). This amounts to a 702% increase in total Part D spending on insulin between 2007 and 2017, compared to an 840% increase based on the pre-rebate total spending amounts ($1.4 billion and $13.3 billion, respectively). If actual rebates for insulin products were larger than these averages, total spending would be lower than these estimates.
Implications
Rising prices for insulin have attracted increasing scrutiny from policymakers in recent months. Our analysis demonstrates that rising insulin prices since 2007 have translated into significantly higher out-of-pocket spending for beneficiaries in Medicare Part D plans and higher spending for the program overall (not taking into account rebates). The number of people Medicare covers for insulin therapy has increased as the number of Medicare beneficiaries with diabetes has risen. Average annual total Part D spending per insulin user increased by 358% between 2007 and 2016, while average out-of-pocket costs for insulin by non-low income subsidy Part D enrollees nearly doubled.
Members of Congress and the Trump Administration have introduced several proposals that could help to address concerns about rising prices for insulin products and affordability concerns for patients, including banning rebates from drug manufacturers unless they are shared directly with patients at the point of sale, taking steps to increase the availability of generic products, allowing Medicare to negotiate drug prices, and allowing patients to import drugs from other countries. Rising prices for insulin therapy in recent years and the resulting increases in Medicare Part D and beneficiary out-of-pocket spending illustrate why the cost of prescription drugs is an ongoing concern for patients and public and private payers, and a pressing issue for policymakers.
Juliette Cubanski, Tricia Neuman, and Sarah True are with the Kaiser Family Foundation. Anthony Damico is an independent consultant.
Supported in part by Arnold Ventures.KFF retains complete control over all of its policy analysis content.
Data and Methods
We analyze total and out-of-pocket spending on insulin therapies covered by Medicare Part D, in the aggregate and average per insulin user and by manufacturer, based on 2007-2016 prescription drug event claims data from a 5% sample of Medicare beneficiaries from the Centers for Medicare & Medicaid Services (CMS) Chronic Conditions Data Warehouse, and 2013-2017 data from the CMS Medicare Part D Drug Spending Dashboard (March 2019 update). The ‘Manufacturer Summary’ tab in the Drug Spending Dashboard was used to identify the manufacturers of the insulin products in this analysis.
Estimates of total Part D spending on insulin include costs paid by Medicare, plans, and beneficiary out-of-pocket payments. These estimates are based on retail claims data that do not take into account drug-specific manufacturer rebates and discounts to plans, which are considered proprietary and therefore not publicly available. To illustrate the effect of rebates, we used average Part D rebates for 2007 to 2017 as reported in 2017 and 2018 Annual Reports of the Boards of Trustees of the Federal Hospital Insurance and Federal Supplementary Medical Insurance Trust Funds. The Part D drug spending dashboard does not include out-of-pocket spending data or aggregated data across all insulin therapies, so for those measures we focus on 2007-2016 data.
Estimates of the share of Medicare beneficiaries with diabetes is based on our analysis of 2000 and 2016 data from the CMS Medicare Current Beneficiary Survey.
Tables
Table 1: Measures of Spending and Use of Insulin Products in Medicare Part D, 2007-2017
Number of Part D enrollees using insulin(in millions)
Total number of insulin prescriptions (in millions)
Total Part D spending on insulin (in billions)
Average per capita total Part D spending on insulin1
Total out-of-pocket spending on insulin by non-LIS enrollees2(in millions)
Average out-of-pocket spending on insulin by non-LIS enrollees2
2007
1.6
14.8
$1.4
$862
$210.1
$324
2008
1.8
16.9
$1.9
$1,059
$269.9
$368
2009
1.9
18.6
$2.4
$1,246
$324.7
$404
2010
2.1
20.1
$2.9
$1,424
$384.9
$447
2011
2.2
22.2
$3.7
$1,651
$367.3
$386
2012
2.4
24.5
$4.8
$1,972
$466.1
$429
2013
2.7
28.1
$6.6
$2,411
$599.5
$447
2014
2.9
30.1
$9.0
$3,116
$735.9
$513
2015
3.0
31.8
$11.0
$3,681
$857.4
$572
2016
3.1
33.3
$12.1
$3,949
$911.5
$588
2017
n/a
n/a
$13.3
n/a
n/a
n/a
NOTE: n/a indicates data not available. Total spending does not account for rebates; includes Medicare, plan, and beneficiary out-of-pocket payments. Number of prescriptions is standardized to a 30-day supply. 1Among all enrollees using insulin. 2Among non-LIS enrollees using insulin.SOURCE: KFF analysis of 2007-2016 prescription drug event claims data from a 5% sample of Medicare beneficiaries from the Centers for Medicare & Medicaid Services (CMS) Chronic Conditions Data Warehouse, and 2017 data from the CMS Medicare Part D Drug Spending Dashboard.
Table 2: Medicare Part D Spending on Insulin Products, 2013-2017
Average Spending Per Dosage Unit (Weighted)
Average Spending Per Claim
Drug name
Number of users in 2017
First year of data1
First year
2016
2017
Change, 2016-2017
CAGR, first year-2017
2016
2017
Change, 2016-2017
Afrezza
639
2016
$2.91
$2.91
$3.54
21.6%
21.6%
$566
$690
$124
Apidra
3,489
2013
$12.35
$23.94
$25.02
4.5%
19.3%
$636
$713
$77
Apidra Solostar
7,740
2013
$16.06
$30.81
$32.16
4.4%
18.9%
$726
$759
$32
Humalog
283,221
2013
$14.43
$23.74
$25.73
8.4%
15.5%
$452
$488
$36
Humalog KwikpenU-100
414,797
2013
$18.71
$30.77
$33.54
9.0%
15.7%
$661
$720
$59
Humalog KwikpenU-200
23,598
2015
$57.96
$62.64
$67.97
8.5%
8.3%
$1,036
$1,134
$98
Humalog Mix 50-50
3,089
2013
$15.08
$25.51
$27.93
9.5%
16.7%
$825
$898
$73
Humalog Mix 50-50 Kwikpen
5,730
2013
$18.93
$31.06
$33.85
9.0%
15.6%
$1,020
$1,122
$103
Humalog Mix 75-25
33,042
2013
$14.91
$25.22
$27.57
9.3%
16.6%
$671
$744
$73
Humalog Mix 75-25 Kwikpen
67,462
2013
$18.74
$30.87
$33.74
9.3%
15.8%
$851
$957
$106
Humulin 70-30
89,109
2013
$7.56
$11.98
$12.82
7.0%
14.1%
$342
$374
$31
Humulin 70/30 Kwikpen
25,412
2014
$20.50
$26.22
$27.04
3.2%
9.7%
$691
$739
$48
Humulin N
131,313
2013
$5.69
$7.79
$7.95
2.1%
8.7%
$237
$255
$18
Humulin N Kwikpen
27,261
2014
$18.84
$22.11
$20.46
-7.5%
2.8%
$529
$509
-$20
Humulin R
102,072
2013
$6.54
$9.47
$9.74
2.9%
10.5%
$180
$193
$13
Humulin R U-500
14,547
2013
$39.90
$63.96
$70.65
10.4%
15.4%
$1,838
$1,990
$153
Humulin R U-500 Kwikpen
13,153
2016
$86.90
$86.90
$91.14
4.9%
4.9%
$1,461
$1,533
$72
Lantus
614,743
2013
$15.31
$24.88
$24.95
0.3%
13.0%
$469
$477
$8
Lantus Solostar
1,112,315
2013
$17.09
$24.60
$24.82
0.9%
9.8%
$502
$503
$0
Levemir
188,078
2013
$15.56
$27.23
$27.29
0.2%
15.1%
$491
$499
$7
Levemir Flextouch
509,282
2014
$23.55
$26.79
$26.85
0.2%
4.5%
$557
$564
$6
Novolin 70-30
113,491
2013
$7.12
$10.25
$10.46
2.0%
10.1%
$276
$298
$22
Novolin N
78,553
2013
$7.00
$9.86
$10.15
3.0%
9.7%
$224
$244
$20
Novolin R
90,692
2013
$7.92
$11.69
$11.77
0.7%
10.4%
$173
$188
$16
Novolog
285,494
2013
$15.21
$25.01
$27.68
10.7%
16.2%
$471
$548
$77
Novolog Flexpen
546,717
2013
$19.18
$31.74
$35.23
11.0%
16.4%
$617
$701
$84
Novolog Mix 70-30
42,341
2013
$15.55
$25.63
$28.43
10.9%
16.3%
$653
$758
$106
Novolog Mix 70-30 Flexpen
96,569
2013
$19.08
$31.52
$35.05
11.2%
16.4%
$853
$971
$118
Toujeo Solostar
190,489
2015
$74.20
$73.94
$75.17
1.7%
0.6%
$556
$580
$24
Tresiba FlextouchU-100
63,235
2015
$28.63
$29.57
$29.79
0.8%
2.0%
$499
$512
$12
Tresiba FlextouchU-200
89,703
2015
$58.36
$59.03
$59.22
0.3%
0.7%
$847
$880
$33
NOTE: CAGR is compound annual growth rate. 1For insulin products that were not yet available in 2013, the first year that they appear in the Part D dashboard is used as the first year for purposes of measuring change in spending per dosage unit.SOURCE: Centers for Medicare & Medicaid Services, Medicare Part D Drug Spending Dashboard, March 2019 update 2013-2017 data).
Table 3: Out-of-Pocket Spending by Non-Low Income Subsidy (LIS) Medicare Part D Enrollees on Insulin Products, 2007-2016
Average out-of-pocket spending by non-LIS insulin users
Percent change in out-of-pocket spending bynon-LIS insulin users
Drug name
First year of Part D data1
First year
2015
2016
First year-2016
2015-2016
Annual growth rate, first year-2016
All non-LIS insulin users
2007
$324
$572
$588
81%
3%
7%
Afrezza
2015
$153
$153
$226
48%
48%
48%
Apidra
2007
$213
$381
$373
75%
-2%
6%
Apidra Solostar
2009
$131
$345
$354
170%
3%
15%
Humalog
2007
$226
$318
$354
56%
11%
5%
Humalog Kwikpen U-100
2015
$328
$328
$358
9%
9%
9%
Humalog Kwikpen U-200
2015
$105
$105
$339
222%
222%
222%
Humalog Mix 50-50
2007
$298
$556
$627
110%
13%
9%
Humalog Mix 50-50 Kwikpen
2015
$456
$456
$455
0%
0%
0%
Humalog Mix 75-25
2007
$394
$462
$545
38%
18%
4%
Humalog Mix 75-25 Kwikpen
2015
$508
$508
$546
7%
7%
7%
Humulin 70/30 Kwikpen
2014
$343
$431
$481
40%
12%
18%
Humulin 70-30
2007
$228
$301
$326
43%
9%
4%
Humulin N
2007
$204
$156
$183
-10%
17%
-1%
Humulin N Kwikpen
2014
$234
$336
$337
44%
0%
20%
Humulin R
2007
$109
$115
$140
29%
22%
3%
Humulin R U-500
2015
$798
$798
$822
3%
3%
3%
Humulin R U-500 Kwikpen
2016
$344
n/a
$344
n/a
n/a
n/a
Lantus
2007
$245
$450
$434
77%
-4%
7%
Lantus Solostar
2007
$106
$420
$413
291%
-2%
16%
Levemir
2007
$203
$405
$414
104%
2%
8%
Levemir Flexpen
2012
$305
$132
$110
-64%
-17%
-22%
Levemir Flextouch
2014
$145
$429
$448
209%
5%
76%
Novolin 70-30
2007
$176
$285
$272
55%
-5%
5%
Novolin N
2007
$121
$234
$223
85%
-4%
7%
Novolin R
2007
$70
$161
$156
123%
-3%
9%
Novolog
2007
$192
$325
$342
78%
5%
7%
Novolog Flexpen
2012
$245
$316
$346
42%
10%
9%
Novolog Mix 70-30
2007
$322
$412
$431
34%
5%
3%
Novolog Mix 70-30 Flexpen
2012
$397
$509
$555
40%
9%
9%
Toujeo Solostar
2015
$177
$177
$359
103%
103%
103%
Tresiba Flextouch U-100
2016
$220
n/a
$220
n/a
n/a
n/a
Tresiba Flextouch U-200
2016
$313
n/a
$313
n/a
n/a
n/a
NOTE: LIS is low-income subsidy. n/a indicates data not available. 1For insulin products that were not yet available in 2007, the first year that they appear in the Part D claims data is used as the first year for purposes of measuring change in out-of-pocket spending.SOURCE: KFF analysis of 2007-2016 prescription drug event claims data from a 5% sample of Medicare beneficiaries from the Centers for Medicare & Medicaid Services (CMS) Chronic Conditions Data Warehouse.
This 17th annual survey of the 50 states and the District of Columbia (DC) provides data on Medicaid and the Children’s Health Insurance Program (CHIP) eligibility, enrollment, renewal, and cost sharing policies as of January 2019. See Appendix Tables 1-20 for state data. Over time, Medicaid has evolved from a program with limited eligibility and burdensome enrollment rules that excluded many low-income adults and created barriers to enrollment for eligible individuals to a modernized program that, along with CHIP, provides a broad base of health coverage for the low-income population and more effectively and efficiently connects eligible individuals to coverage. The survey data show:
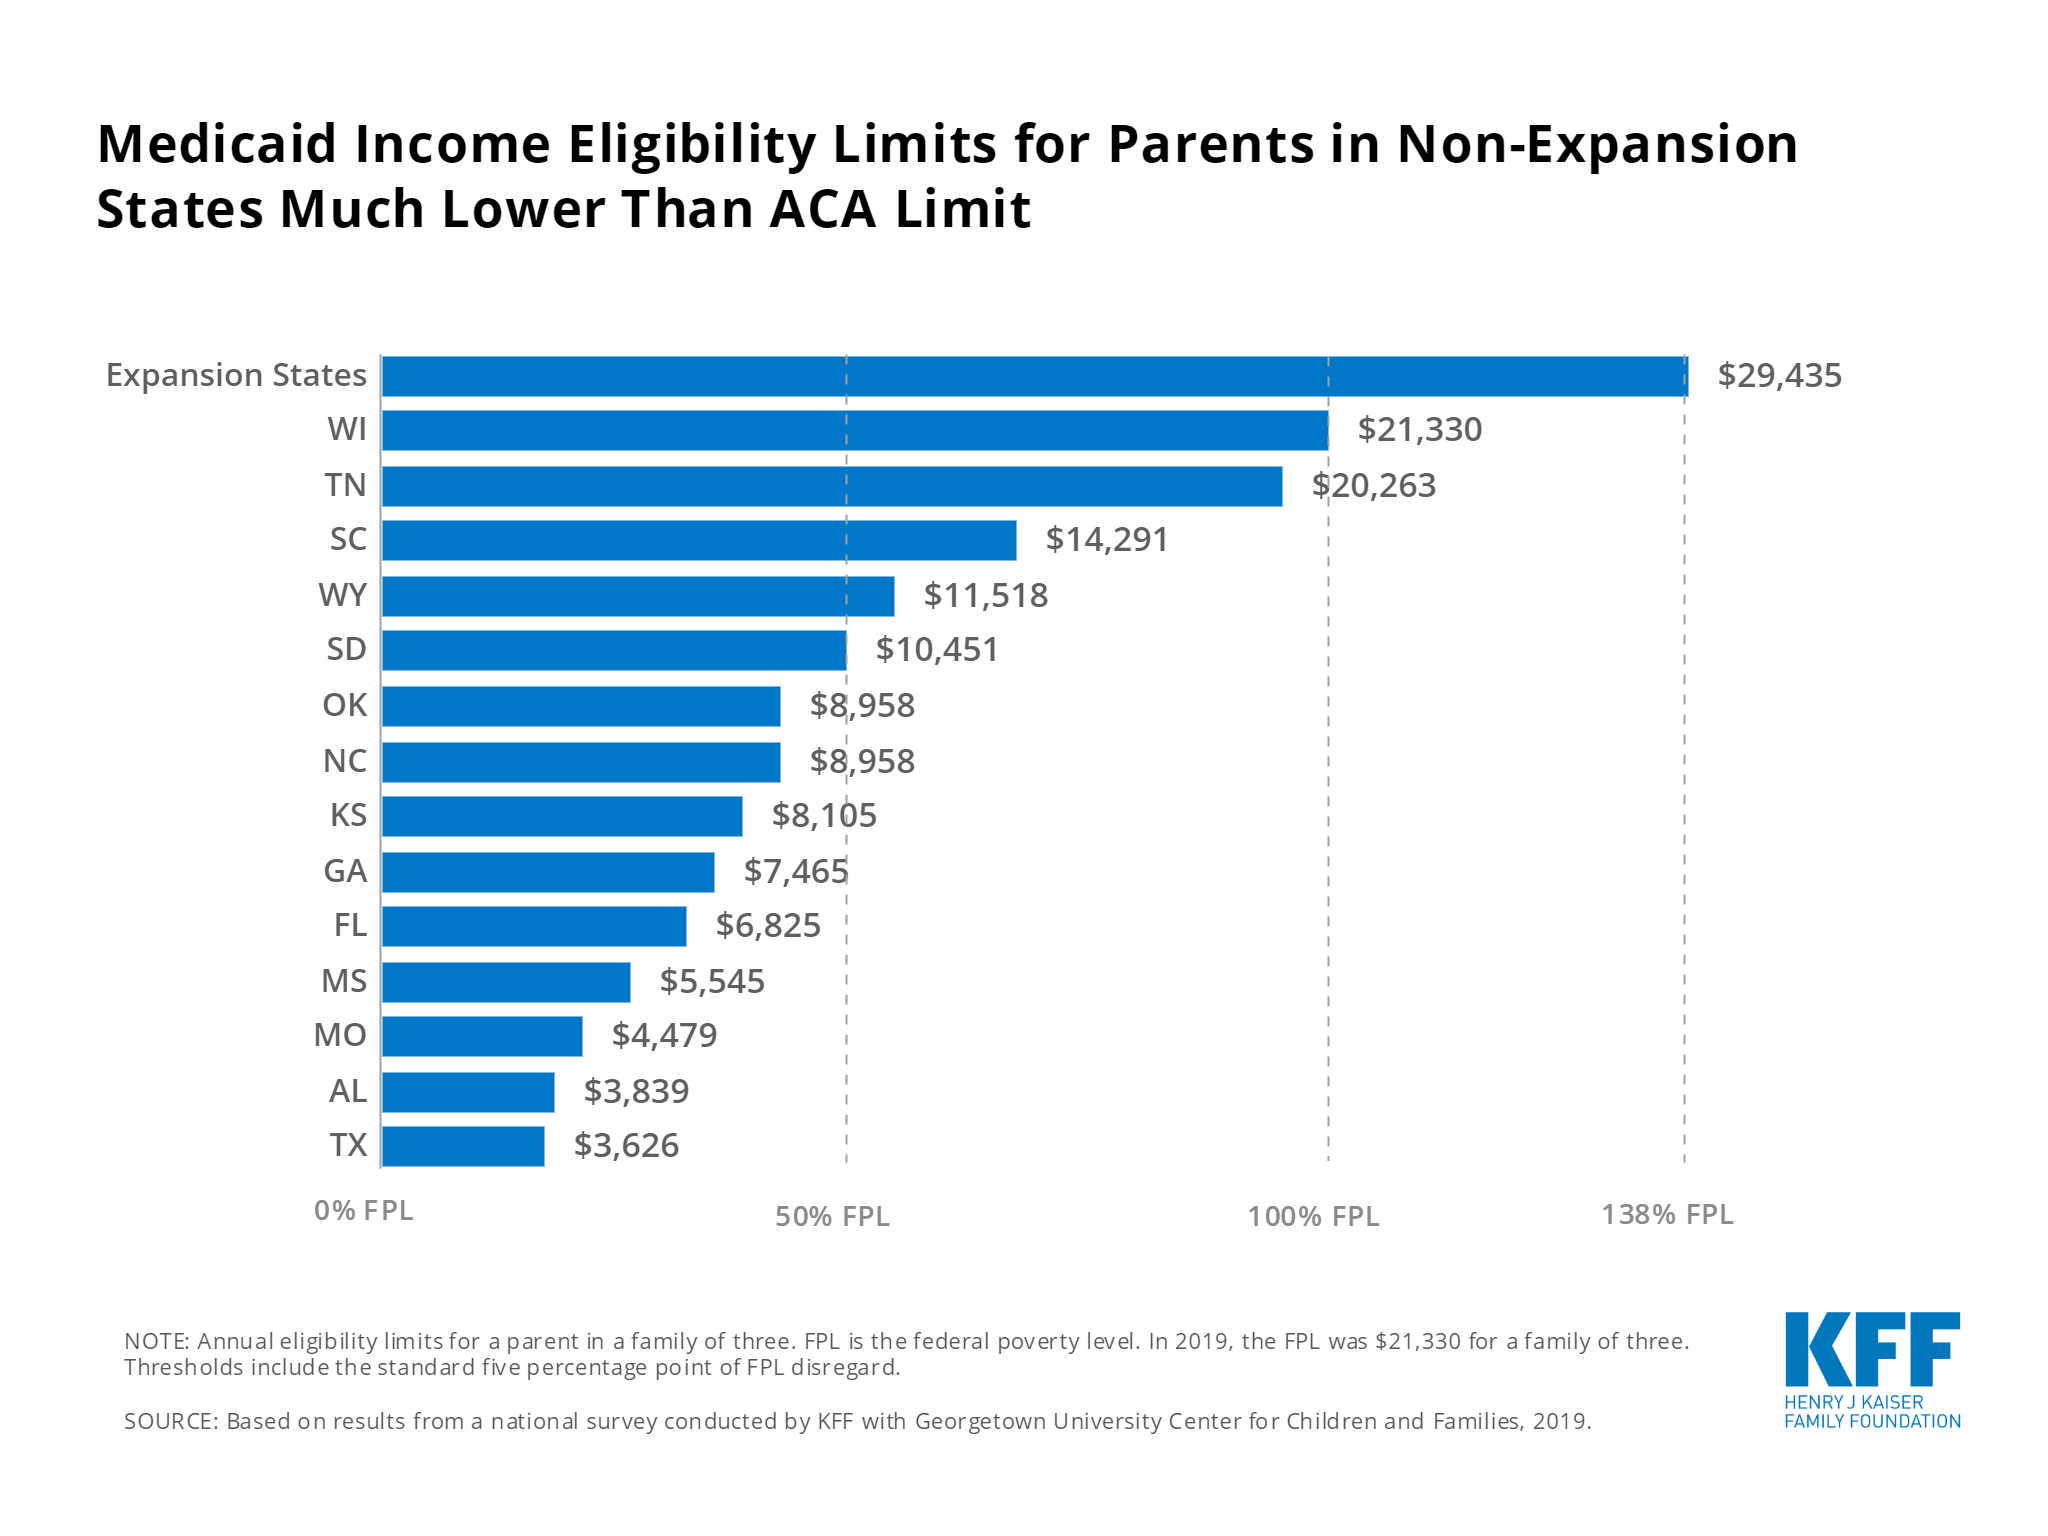
Under the Affordable Care Act (ACA), most states have expanded Medicaid to low-income adults, helping to fill longstanding gaps in coverage. In the past year, there was an uptick in state activity to expand Medicaid, with five additional states taking steps forward. With this state action, 37 states, including DC, had adopted the ACA Medicaid expansion as of January 2019. Eligibility remains very restricted for adults in the 14 states that have not yet adopted the expansion, with the median eligibility level for parents at 40% FPL ($8,532 per year for a family of three as of 2019) and other adults remaining ineligible regardless of their income in all of these states, except Wisconsin.
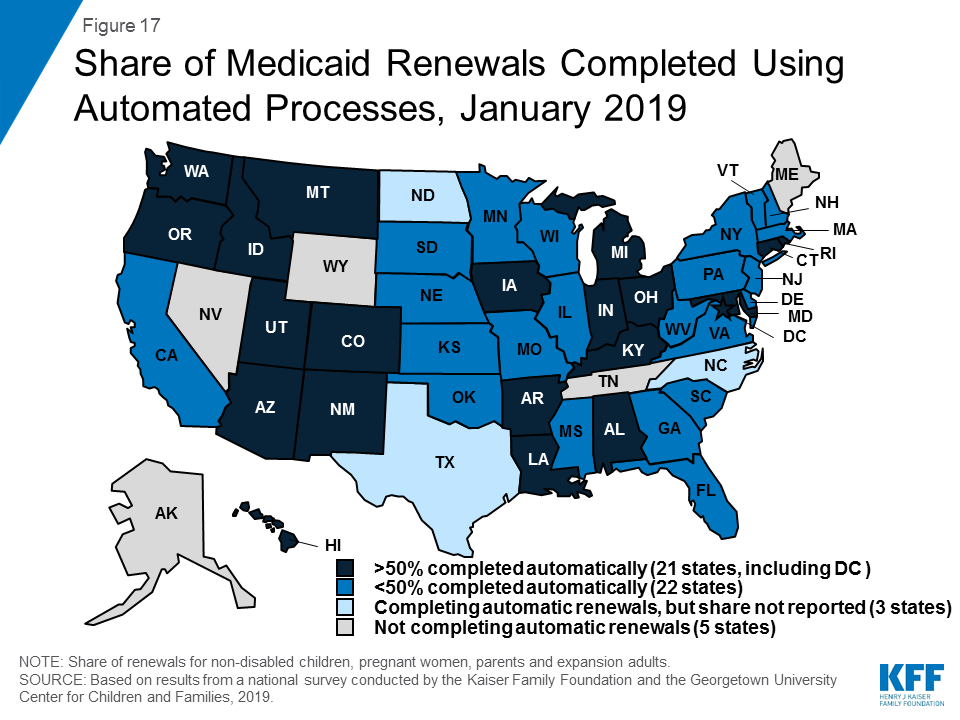
Reflecting ACA policies, all states have implemented more streamlined enrollment and renewal processes, regardless of whether they have adopted the ACA Medicaid expansion. As of January 2019, individuals can apply online for Medicaid in all states for the first time and most states can complete real-time determinations (within 24 hours) (46 states) and automated renewals (46 states). These modernized, streamlined processes can facilitate individuals’ ability to enroll in and maintain coverage and reduce state administrative burdens.
Looking ahead, one key question is whether there will be continued advances to expand coverage and streamline enrollment or whether emerging policies will erode coverage gains and enrollment simplifications realized under the ACA. The Trump Administration is promoting new Medicaid eligibility requirements through waivers and its proposed budget and has approved a growing number of waiver requests from states, including work requirements, which have never previously been approved for the program. These provisions require complex and costly documentation and administrative efforts that would likely increase barriers to coverage and lead to coverage losses among eligible individuals. Other factors outside of Medicaid may also be contributing to enrollment declines among eligible individuals, including shifting immigration policy.
This 17th annual survey of the 50 states and the District of Columbia (DC) provides data on Medicaid and the Children’s Health Insurance Program (CHIP) eligibility, enrollment, renewal, and cost sharing policies as of January 2019. It is based on a telephone survey of state Medicaid and CHIP officials conducted by the Kaiser Family Foundation and the Georgetown University Center for Children and Families. Appendix Tables 1-20 include state data. The survey data over the past 17 years document how Medicaid has evolved from a program with limited eligibility and burdensome enrollment rules that excluded many low-income adults and created barriers to enrollment for eligible individuals to a modernized program that, with CHIP, provides a broad base of health coverage for the low-income population and more effectively and efficiently connects eligible individuals to coverage. Emerging policies to add Medicaid eligibility requirements could lead to coverage losses and increase the complexity of enrollment processes, eroding coverage gains and enrollment simplifications realized under the ACA.
Eligibility
Prior to the Affordable Care Act (ACA), many poor parents and other adults remained ineligible for Medicaid. Under previous rules, Medicaid eligibility was limited to certain groups of individuals with limited incomes. Eligibility for parents was very restricted and states could not receive federal Medicaid matching funds to cover other non-disabled adults. The ACA helped fill longstanding gaps in coverage by expanding Medicaid to adults with incomes up to 138% of the Federal Poverty Level (FPL) ($29,435 for a family of three or $17,236 for an individual as of 2019) and provided enhanced federal funding to states for expansion coverage.
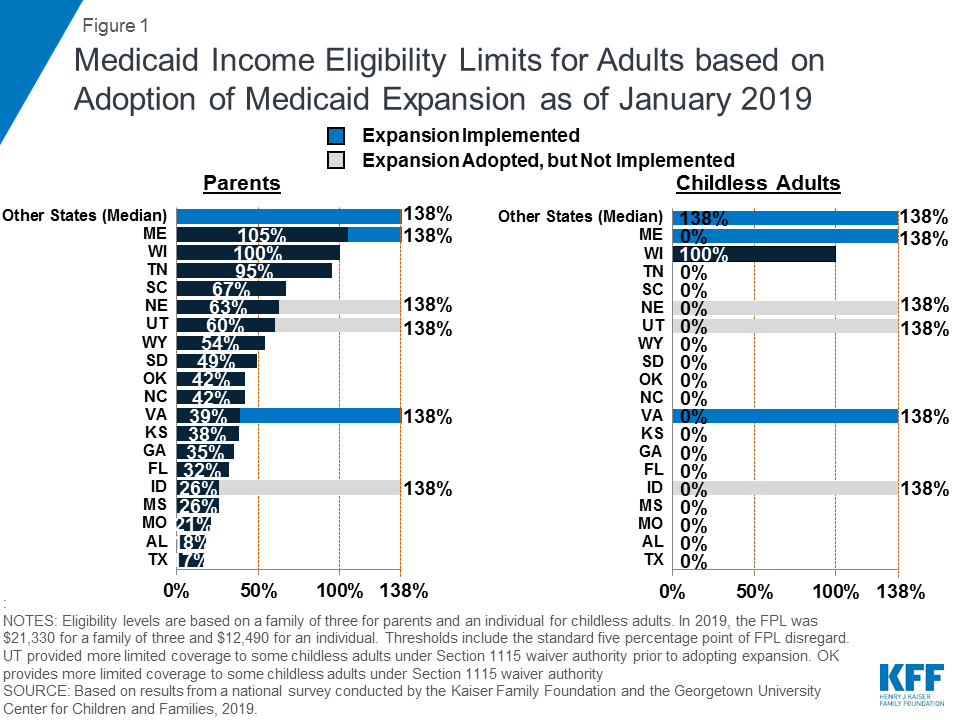
Most states have expanded Medicaid to low-income adults under the ACA, and five additional states took steps forward with expansion in the past year. Virginia and Maine became the latest states to implement the Medicaid expansion as of January 2019, significantly increasing eligibility for parents and other adults (Figure 1). Voters in Idaho, Nebraska, and Utah passed ballot initiatives in 2018 to adopt the expansion, although it had not been implemented as of January 2019, and Utah and Idaho are seeking to add restrictions to the expansion. With this action, 37 states, including DC, had adopted the Medicaid expansion as of January 2019.
Figure 1: Medicaid Income Eligibility Limits for Adults based on Adoption of Medicaid Expansion as of January 2019
In the 14 states that had not yet adopted the Medicaid expansion as of January 2019, eligibility for parents and other adults remains very restrictive. The median eligibility level for parents in these states is 40% FPL ($8,532 per year for a family of three as of 2019) and other adults remain ineligible regardless of their income in all of these states, except Wisconsin. In these states, 2.5 million poor uninsured adults fall into a coverage gap, earning too much to qualify for Medicaid but not enough to qualify for subsidies to purchase insurance through the Marketplace, which become available at 100% FPL.1
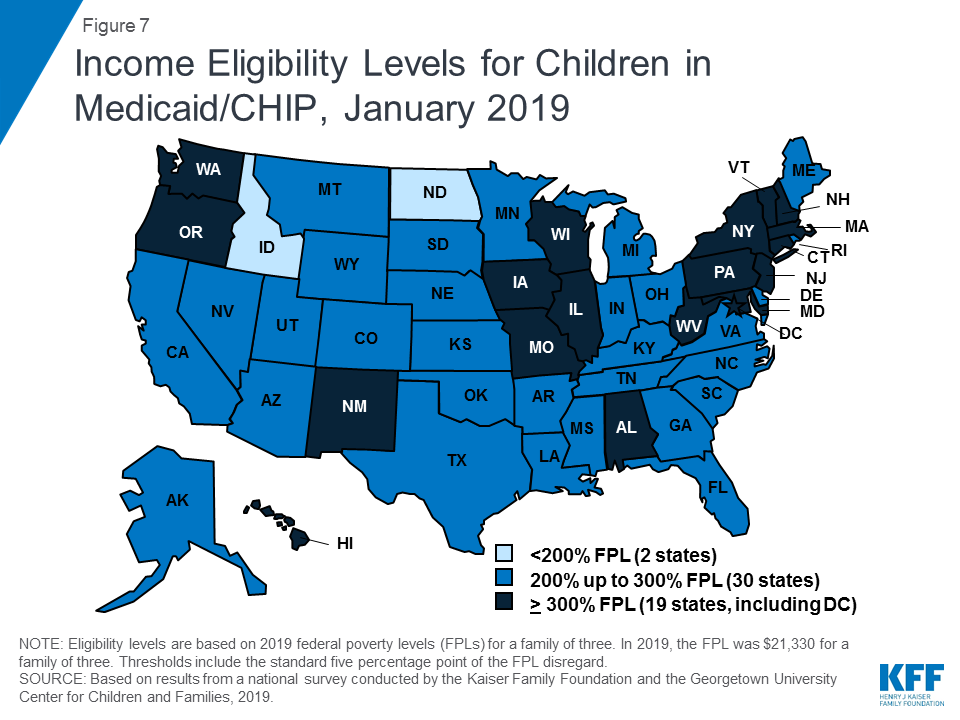
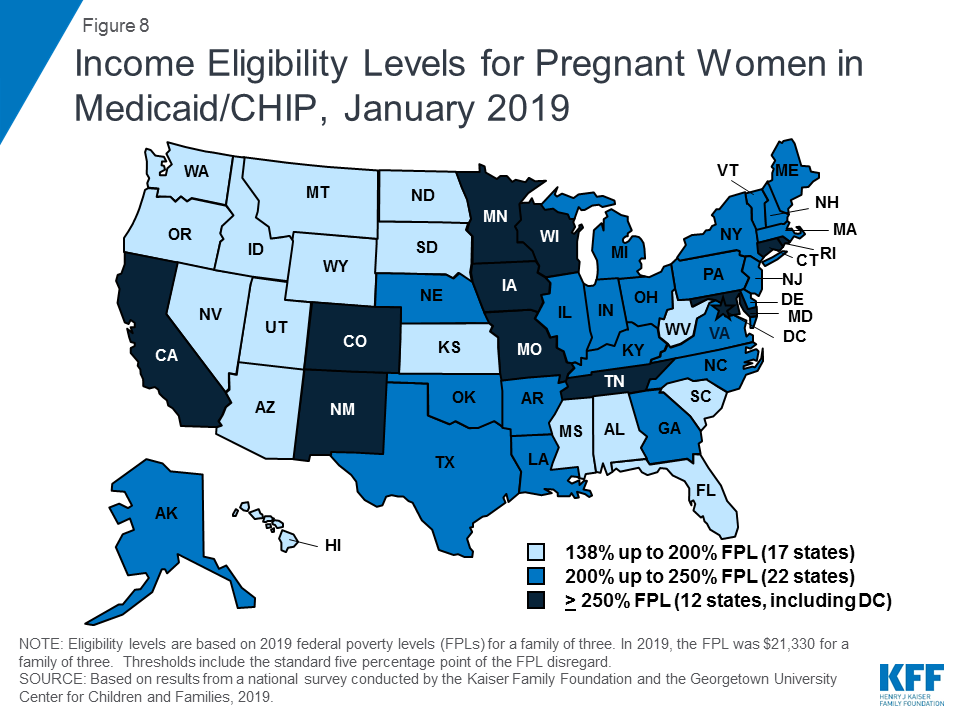
Medicaid and CHIP eligibility for children and pregnant women remains stable and robust. Eligibility levels for children and pregnant women are well above those for parents and other adults in almost all states. As of January 2019, 19 states, including DC, extend eligibility levels for children to 300% FPL or above (Figure 2), and nearly half of states provide eligibility to pregnant women above 200% FPL. The median income eligibility limit is 255% FPL ($54,392 per year for a family of three as of 2019) for children and 200% FPL ($42,660 for a family of three as of 2019) for pregnant women as of January 2019. The stability of children’s coverage reflected Congressional action in 2018 to continue CHIP funding through 2027 and retain the maintenance of effort (MOE) provision that preserves eligibility levels and enrollment procedures for children.
Figure 2: Income Eligibility Levels for Children in Medicaid/CHIP, January 2019
In 2018, additional states obtained Section 1115 waivers to add new eligibility requirements to their Medicaid programs. As of January 2019, 13 states had approved waivers allowing one or more eligibility requirements including conditioning eligibility on meeting a work requirement, adding completion of a health risk assessment as an eligibility requirement, charging premiums or monthly contributions, eliminating retroactive eligibility, delaying coverage until the first premium payment, and/or locking enrollees out of coverage for a period of time if they have unpaid premiums or do not complete timely renewals or report changes in circumstances.2 Many of these provisions require complex and costly administrative efforts that run counter to the streamlined enrollment processes under the ACA and lead to increased barriers to coverage and coverage losses among eligible individuals.
Enrollment and Renewal
Prior to the ACA, many states relied on paper-based, manual enrollment processes with burdensome requirements that could take days and weeks in some states. In addition to expanding Medicaid to adults, the ACA accelerated the adoption of new data-driven enrollment and renewal processes to connect individuals to coverage more quickly and conveniently and reduce the paperwork burden on states and individuals. These changes applied to all states regardless of whether they adopted the Medicaid expansion. The ACA also provided states enhanced federal funding for system upgrades to facilitate these improvements.
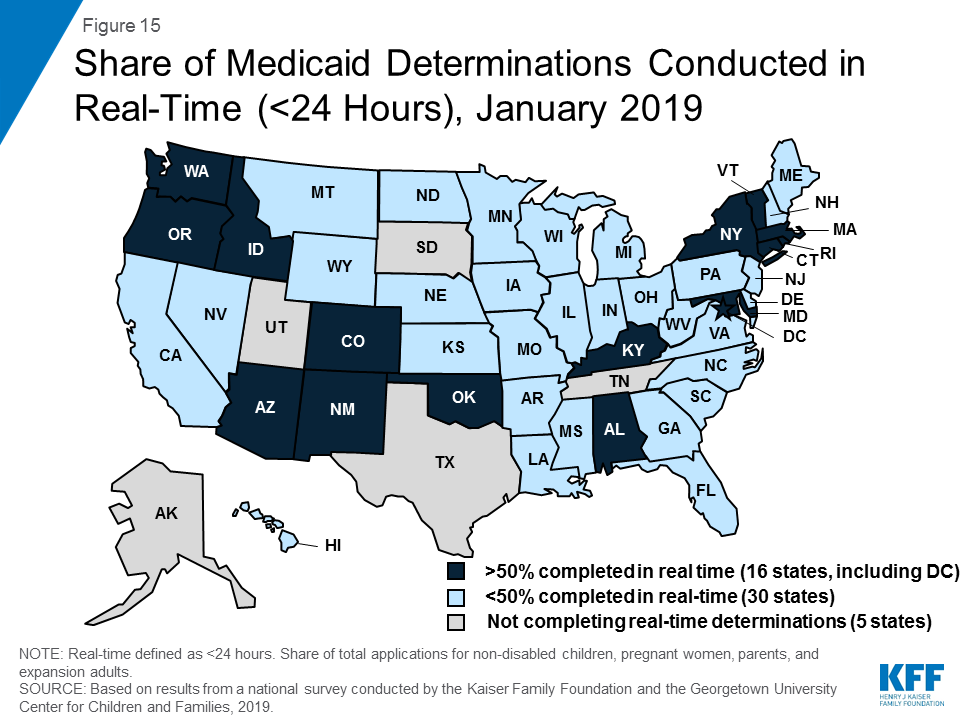
As of January 2019, many states provide a modernized, streamlined enrollment and renewal experience for individuals, reflecting the policies established by the ACA. With Tennessee rolling out a new eligibility system, individuals can apply online for Medicaid in all states for the first time as of January 2019 (Figure 3). Individuals can also apply by phone in the majority of states and, in many states, individuals can use a mobile device to apply or access an online account. Although online applications offer potential benefits to individuals and states, other application pathways, including in-person and mail, remain important, particularly for people with limited computer or internet access. Reflecting increased use of electronic data matches to verify eligibility criteria, the majority of states can complete real-time determinations (within 24 hours) (46 states) and automated renewals (46 states), with 16 states making at least half of determinations in real-time and 21 states completing at least half of renewals automatically. Reflecting these broad system and process changes, most states indicated improvements in one or more areas of eligibility operations compared to before the ACA.
Figure 3: Number of States with Selected Modernized Enrollment and Renewal Processes, January 2019
Premiums and Cost-Sharing
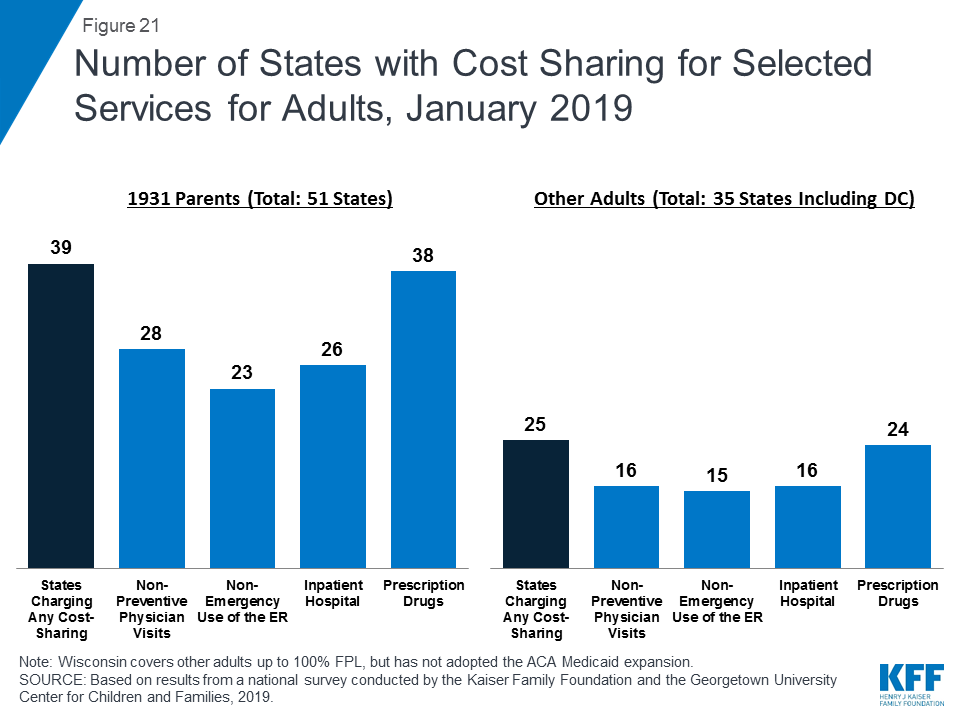
Federal regulations establish parameters for premiums and cost sharing for Medicaid and CHIP enrollees that reflect their limited ability to pay health care costs. Given their modest incomes, research shows that premiums serve as a barrier to enrollment for low-income families and copayments can limit utilization of needed health care.3
Kentucky and New Mexico eliminated cost sharing for children during 2018; otherwise, premiums and cost sharing for children remained largely stable. This stability, in part, reflects that states generally cannot increase premiums for children under the MOE provision included in the CHIP funding extension through 2027.
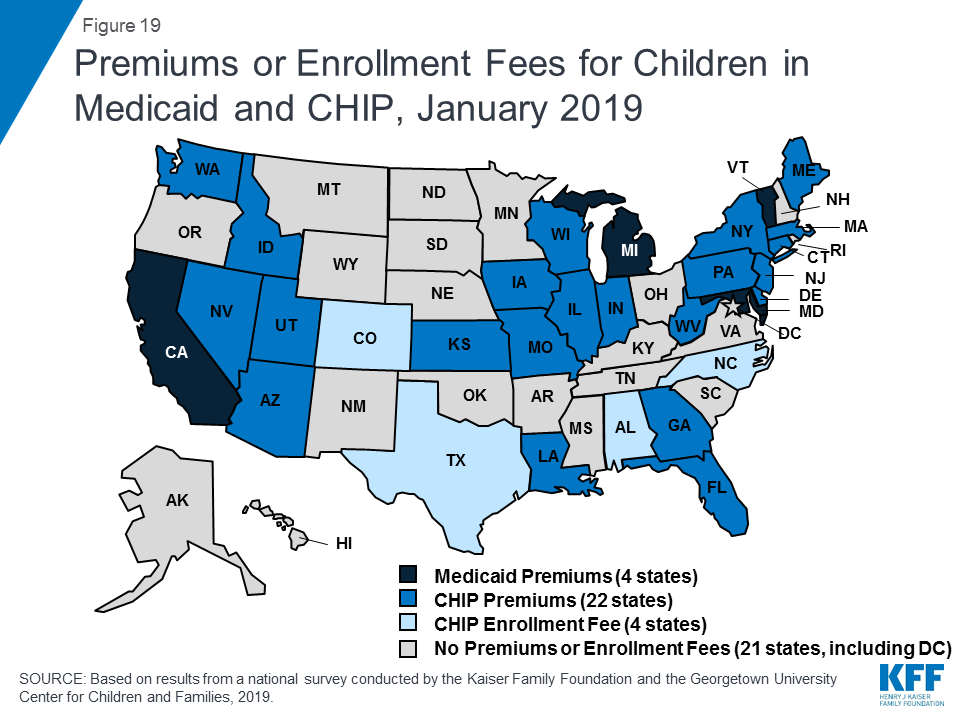
Premiums remain limited among parents and other adults, although additional states received waiver approval to impose premiums or monthly contributions on these groups during 2018. Some states have obtained waiver approval to charge premiums or monthly contributions not otherwise allowed under federal rules. As of January 2019, five states (Arkansas, Iowa, Indiana, Michigan, and Montana) were charging premiums or monthly contributions for parents or other adults. Several additional states have received waiver approval for premiums or monthly contributions for adults, but they were not implemented as of January 2019. Some of these waivers also allow individuals to be locked out of coverage for a period of time if they are disenrolled due to non-payment and to delay coverage until after the first premium is paid. States can charge nominal cost sharing for adults in Medicaid under federal rules, and most states charge cost sharing for parents who were eligible for Medicaid through traditional pathways prior to the ACA and other adults.
Looking Ahead
Looking ahead, one key question is whether there will be continued advances to expand coverage and streamline enrollment processes or whether emerging policy changes will erode coverage gains and enrollment simplifications realized under the ACA.
Additional states may expand Medicaid, which would increase access to coverage for low-income adults and have positive effects on access to and use of care and state budgets and economies.4 However, if states attach waiver provisions such as work requirements or other restrictions to expansion, the positive reach and impact would be limited. Recently, some states have indicated interest in a partial expansion to an income level below 138% FPL with the ACA enhanced federal match rate.5 Relative to full expansion, partial expansions could limit coverage and potentially increase federal costs. While states can pursue waivers to extend coverage to a lower income level without access to the enhanced federal match, no waivers to allow an enhanced match for a partial expansion have been approved to date, and guidance from the previous administration prohibited use of the enhanced match for “partial expansions.”
Renewed CHIP funding protects children’s eligibility levels through 2027, but states that extend eligibility above 300% FPL will have the option to reduce eligibility starting in October 2019. When Congress continued funding for CHIP in 2018, it retained the MOE provision that requires states to preserve Medicaid and CHIP eligibility and enrollment policies for children. However, starting in October 2019, the MOE only applies to children’s coverage up to 300% FPL, meaning that states with eligibility limits above this level could reduce eligibility in the future. This change coincides with the beginning of the phase-out of the temporary 23-percentage point boost in federal CHIP matching rates, leaving states to resume paying a larger share of CHIP costs.
Emerging state and federal policies to add Medicaid eligibility requirements could erode the coverage gains and enrollment simplifications realized under the ACA. The Trump Administration is promoting new Medicaid eligibility requirements through waivers and its proposed budget and has approved a growing number of waiver requests from states, including work requirements, which have never previously been approved for the program. Some states are no longer moving forward with implementing waiver provisions following a change in leadership in the 2018 elections,6,7 while other states are considering adding waiver provisions.8,9,10,11 These types of requirements create barriers to coverage and increase administrative burdens and costs for states.12,13 As such, they will likely dampen potential coverage gains and lead to coverage losses.
Other policy changes may lead to coverage losses among eligible low-income families and growing administrative burdens on states. In 2017, coverage gains stalled and began to reverse for the first time since implementation of the ACA, and Medicaid enrollment of adults and children declined in 2018.14,15,16 Some of the decline in Medicaid enrollment could reflect the improving economy. However, some factors may be leading to a drop in enrollment among eligible individuals. While states’ growing use of technology and automation has led to improvements for individuals and states, there are concerns emerging in some states that eligible individuals may be losing coverage due to process-related issues.17,18,19 Further, other policy changes outside of Medicaid could be dampening enrollment. For example, the Trump administration substantially decreased funding for outreach and enrollment assistance, which is pivotal for helping eligible individuals get and stay enrolled in coverage. In addition, shifting immigration policies, including a proposed rule to make changes to public charge policy, will likely lead to broad decreases in participation in Medicaid among legal immigrant families and their primarily U.S.-born children and increase administrative burdens on states.20 Twenty states reported that they would need to change applications, forms, or other guidance, conduct additional staff training, and/or increase outreach and education to immigrant families if the public charge rule is finalized, while most of the remaining states indicated they could not yet determine how the rule would impact their operations.
Report: Introduction
This 17th annual survey of the 50 states and DC provides data on Medicaid and CHIP eligibility, enrollment, renewal, and cost sharing policies as of January 2019 and changes implemented in 2018. The report is based on a telephone survey of state Medicaid and CHIP program officials conducted by the Kaiser Family Foundation and the Georgetown University Center for Children and Families during January 2019. It includes findings in three key areas: Medicaid and CHIP Eligibility, Enrollment and Renewal Processes, and Premiums and Cost Sharing. State-specific information is available in Appendix Tables 1-20. The report includes policies for children, pregnant women, parents, and other adults under age 65 (who are determined eligible based on Modified Adjusted Gross Income (MAGI) financial eligibility rules); it does not include policies for groups eligible through Medicaid eligibility pathways for seniors and individuals eligible based on a disability (non-MAGI groups).
Evolution of Medicaid Eligibility and Enrollment
Medicaid has expanded over time to fill gaps in coverage and provide a broad base of coverage for the low-income population. Historically, Medicaid eligibility was tied to cash assistance and limited to low-income individuals in certain categories, including children, pregnant women, parents, seniors, and individuals with a disability. Over time, Congress gradually expanded Medicaid eligibility for children, and it was formally delinked from cash assistance in 1996. Following this delinking and the enactment of CHIP in 1997, many states continued to expand eligibility for children and pregnant women. Moreover, many states pursued innovative outreach and enrollment efforts to help mitigate coverage losses associated with delinking Medicaid from cash assistance and facilitate enrollment of eligible but uninsured children and pregnant women under the broader eligibility rules. However, eligibility for parents remained limited and other nondisabled adults were excluded from the program regardless of income. The ACA filled these coverage gaps by expanding Medicaid to low-income adults with incomes up to 138% FPL and providing enhanced federal funding to states for expansion coverage.
In addition, the Medicaid and CHIP enrollment and renewal experience has evolved from a paper-based, cumbersome process to a modernized, streamlined approach. Prior to the ACA, Medicaid enrollment processes in many states reflected the program’s historic ties to cash assistance. As of January 2013, over half of states imposed an asset test on parents, and some still required parents to complete a face-to-face interview at enrollment or renewal. Applications could only be completed by mail or in-person in a number of states and eligibility determinations could sometimes take days or weeks. The ACA accelerated the adoption of new data-driven enrollment and renewal processes that align and coordinate with the Marketplaces. These processes allow individuals to connect to coverage more quickly and conveniently and reduce the paperwork burden on states and individuals. The streamlined enrollment and renewal policies apply to all states regardless of whether they expanded Medicaid under the ACA. Many of the ACA policies built on innovations states implemented to facilitate enrollment when they expanded coverage for children following the enactment of CHIP. This previous state experience and research showed that complex enrollment processes with burdensome requirements create barriers for eligible individuals to obtain and maintain coverage and increase administrative burdens and costs for states.21,22
Report: Medicaid And Chip Eligibility
Eligibility as of January 2019
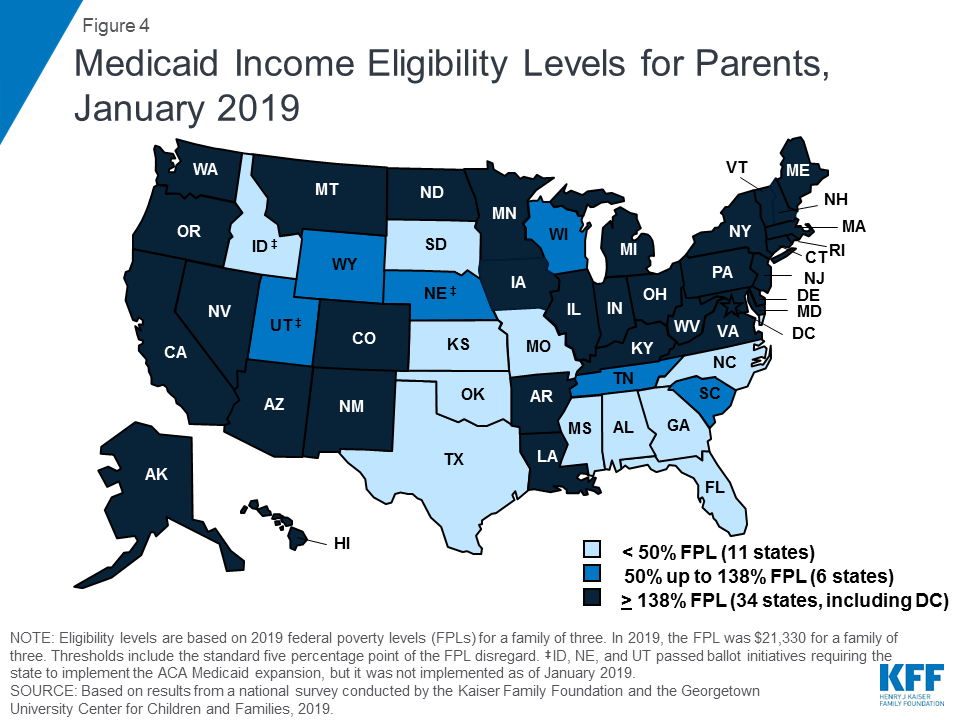
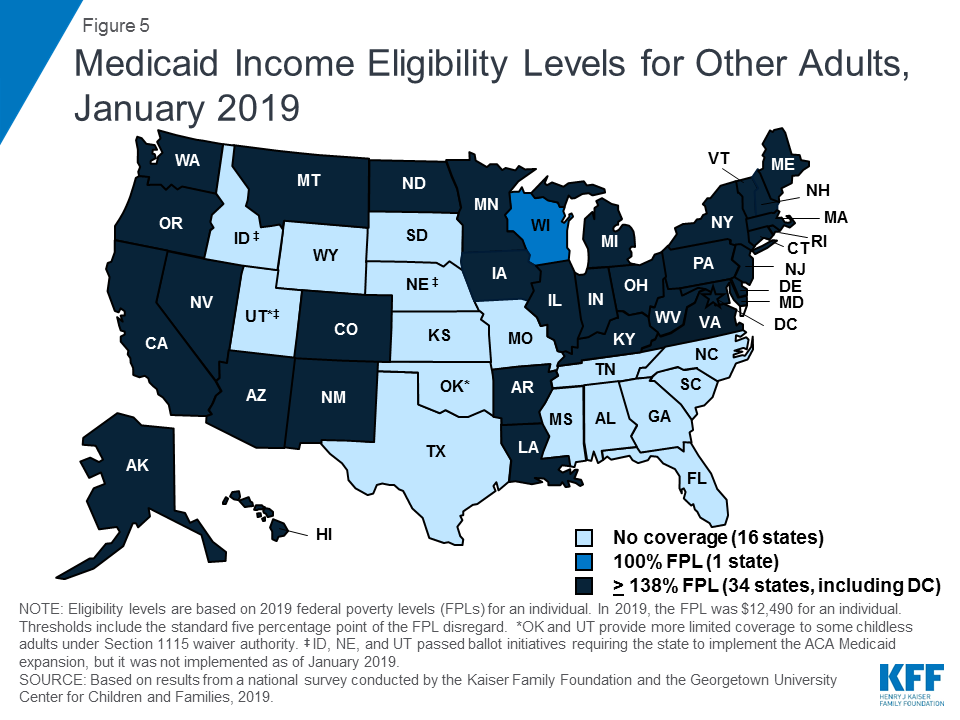
Under the ACA, most states have expanded Medicaid to low-income adults. As of January 2019, 34 states, including DC, had implemented the Medicaid expansion, extending eligibility to parents and other adults with incomes up to 138% FPL ($29,435 for a family of three or $17,236 for an individual as of 2019) (Figures 4 and 5). Connecticut and DC provide eligibility to higher levels. DC covers parents to 221% FPL and other adults to 215% FPL, and Connecticut restored parent eligibility to 155% FPL in 2018, after it had been reduced to 138% FPL in 2017.
Figure 4: Medicaid Income Eligibility Levels for Parents, January 2019Figure 5: Medicaid Income Eligibility Levels for Other Adults, January 2019
There was an uptick in state action to expand in the past year, withfive additional states taking steps forward. In January 2019, Maine and Virginia implemented the Medicaid expansion, significantly increasing eligibility for parents and other adults (Figure 6). Through ballot initiatives in November 2018, Idaho, Nebraska, and Utah voters adopted the expansion, although it had not yet been implemented as of January 2019, and Utah and Idaho are seeking to add restrictions to their expansions. With this state action, 37 states, including DC, had adopted the expansion as of January 2019.
Figure 6: Medicaid Income Eligibility Limits for Adults based on Adoption of Medicaid Expansion as of January 2019
In the 14 states that have not yet adopted or implemented the Medicaid expansion, eligibility levels remain limited to very low-income parents, and other adults are largely ineligible. In these states, the median eligibility level for parents was 40% FPL, or $8,532 for a family of three, with ten states limiting parent eligibility to less than half of the poverty level. Other adults remain ineligible for Medicaid regardless of their income in all of these states, except Wisconsin. Moreover, in 10 of these 14 states, the parent eligibility level has been eroding over time as a percent of the FPL (from 42% FPL to 39% FPL between January 2014 and January 2019), because it is tied to a static dollar threshold, while the FPL generally increases each year. This erosion further widens the disparity in coverage available for adults in expansion states versus those that have not yet adopted the expansion.
As of January 2019, eligibility levels for children were robust, with 49 states covering children with incomes above 200% FPL (Figure 7). Eligibility levels for children ranged from 175% FPL to 405% FPL across states, with a median level of 255% FPL. All states use CHIP funding to extend children’s coverage through a Medicaid expansion, a separate CHIP program, or a combination of both approaches. As of January 2019, 36 states had a separate CHIP program, which provides states additional flexibility with regard to benefits, premiums, and cost sharing. However, 16 of these states provide children in their separate CHIP program the full Early, Periodic, Screening, Diagnosis and Treatment Services (EPSDT) benefit that is the Medicaid benefit standard for children.
Figure 7: Income Eligibility Levels for Children in Medicaid/CHIP, January 2019
In 2018, Congress extended CHIP funding through 2027, which supports stable coverage for children. This action followed the longest funding lapse since the CHIP program was enacted in 1997, which had put continued coverage in jeopardy. The legislation retained the MOE provision requiring states to preserve children’s eligibility levels and enrollment policies. Starting in October 2019, however, the MOE will not apply to eligibility levels above 300% FPL.23 At that time, states may continue covering children at these higher income levels and receive federal funding, but they would newly have the option to reduce eligibility to 300% FPL. This change in the MOE coincides with the beginning of a phase-out of the 23-percentage point temporary boost in federal CHIP matching rates. Also in 2018, Congress passed legislation requiring states to cover all former foster youth up to age 26 in Medicaid, regardless of where the youth was in foster care.24 Previously, states were only required to cover those who had been in foster care within the state. This provision will become effective in 2023. In the interim, as of January 2019, 11 states have a waiver to cover former foster children regardless of whether they had been in care within the state, with Michigan discontinuing this coverage in 2018.
Almost half of states (22) report using CHIP funds to support a Health Services Initiative (HSI). Since the enactment of CHIP in 1997, states have had an option to utilize CHIP funds to support a state-designed HSI to improve the health of low-income children, as long as CHIP administrative costs combined with HSI services do not exceed 10% of total CHIP expenditures. HSIs must directly improve the health of low-income children who are eligible for CHIP and/or Medicaid but may serve children regardless of income. States reported a variety of purposes for their HSIs with the most common including supporting poison control systems, enhancing access to health services in schools, providing immunization services, and funding lead abatement efforts. Several states have enacted multiple initiatives through HSI funding with unique purposes ranging from supporting early reading programs in Oklahoma to providing respite care for children with developmental disabilities in New Jersey.
The median eligibility level for pregnant women remained steady at 200% FPL, with the upper eligibility limit ranging from 138% FPL to 380% FPL across states. The majority of states (47) provide Medicaid eligibility to pregnant women beyond the federal minimum of 138% FPL, and nearly half of states (22) extend eligibility to above 200% FPL (Figure 8). Five states use CHIP funds to cover pregnant women above Medicaid levels. In 46 states, pregnant women receive full Medicaid benefits (versus pregnancy-related services only), and all five states covering pregnant women with CHIP funds provide full CHIP benefits. All states are required to provide family planning services to individuals in Medicaid, while 28 states offer family planning services to individuals not otherwise eligible for Medicaid through a state option or waiver.25 In 2018, Maryland expanded family planning eligibility to 264% FPL to match its eligibility level for pregnant women and extended eligibility to men while New Mexico added age restrictions to its coverage.
Figure 8: Income Eligibility Levels for Pregnant Women in Medicaid/CHIP, January 2019
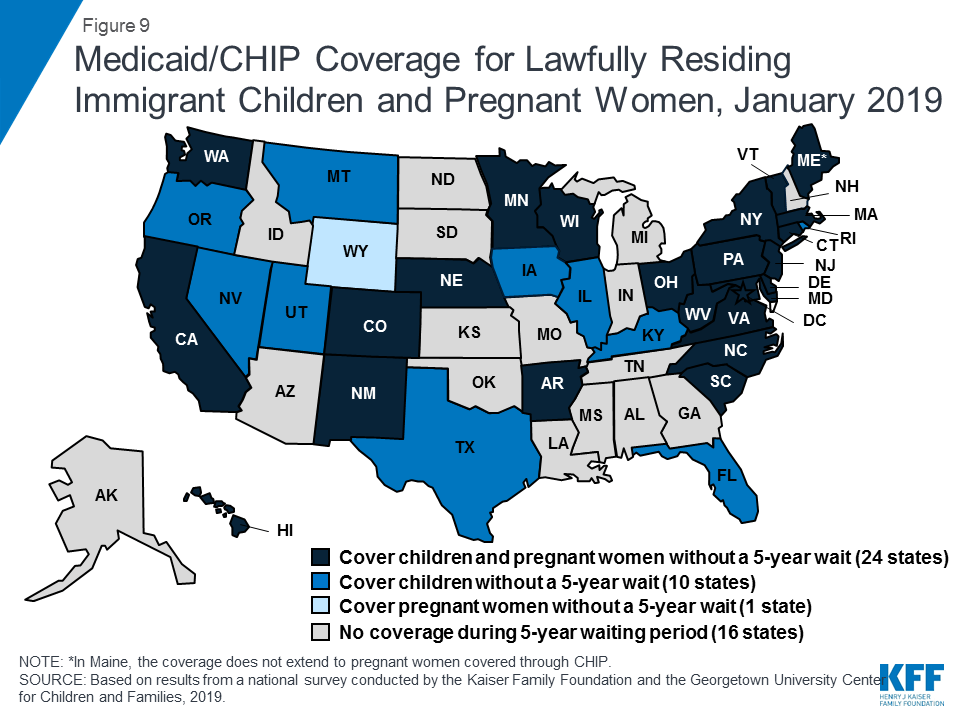
A total of 35 states have taken up the option to eliminate the five-year waiting period for Medicaid/CHIP coverage for lawfully-residing immigrant children and/or pregnant women (Figure 9). Lawfully residing immigrants may qualify for Medicaid and CHIP but are subject to eligibility restrictions. In general, they must have a “qualified” immigration status and many, including most lawful permanent residents or “green card” holders, must wait five years after obtaining qualified status before they may enroll.26 States have an option to eliminate the five-year wait for lawfully residing immigrant children and pregnant women.27 Half of states (24) apply the option to both children and pregnant women, while ten states use it for children only, and one state (Wyoming) uses it only for pregnant women. This count includes Nevada, which implemented the option for children in January 2019. Since 2002, states also have had the option to provide prenatal care to women regardless of immigration status by extending CHIP coverage to the unborn child, which 16 states provided as of January 2019. Undocumented immigrants are not eligible to enroll in Medicaid or CHIP, but some states have fully state-funded programs that cover certain groups of immigrants regardless of immigration status, including seven states that cover all income-eligible children.28
Figure 9: Medicaid/CHIP Coverage for Lawfully Residing Immigrant Children and Pregnant Women, January 2019
Emerging Eligibility Restrictions in Section 1115 Waivers
In 2018, some states obtained Section 1115 waivers to add eligibility requirements to their Medicaid programs not otherwise allowed under federal rules. Many of these provisions are targeted to low-income adults made eligible by the ACA Medicaid expansion, although, in some states, they also affect poor parents and other traditional groups that existed prior to the ACA.29,30 As of January 2019, 13 states had approved waivers that allow one or more eligibility requirements, including conditioning eligibility on meeting a work requirement, adding completion of a health risk assessment as an eligibility requirement, charging premiums or monthly contributions, eliminating retroactive eligibility, delaying coverage until the first premium payment, and/or locking enrollees out of coverage for a period of time if they have unpaid premiums or do not complete timely renewals or report changes in circumstances.31 However, many of these provisions had not yet been implemented as of January 2019.
These new eligibility requirements will increase barriers to coverage and contribute to coverage losses.32,33 Under these new requirements, eligible people may lose coverage due to their inability to navigate more complicated enrollment processes and requirements, such as documenting work or a qualifying exemption.34 Moreover, a large and longstanding body of research shows that premiums serve as an enrollment barrier among the low-income population.35 As such, implementation of the eligibility restrictions will likely lead to reductions in Medicaid enrollment and erode coverage gains achieved under the ACA. For example, in Arkansas, the first state to implement a work requirement under a waiver, over 18,000 individuals lost coverage between September and December 2018 due to not meeting the work reporting requirements.36 Additional research is needed to understand more about enrollees who lost coverage, but an early study found that many enrollees in Arkansas were unaware of or confused by the new requirements (despite outreach efforts) and faced multiple barriers complying with the work and reporting requirements that initially could only be reported online.37
Recent waiver provisions also would make enrollment processes more complex andincrease administrative burdens on states.38 Implementing these types of eligibility provisions increases documentation requirements on individuals and states and can be administratively complex and costly. A number of states reported that implementing or preparing to implement these waivers increased administrative costs, staff time, the length of time to process renewals, and/or required changes to systems. For example, states implementing work requirements likely have to make system changes to reflect new eligibility rules; document compliance with new requirements; interface with other programs; implement coverage lockout periods; and exchange information among the state, enrollment broker, health plans, and providers. Additional staff may be required to educate enrollees, develop notices, evaluate and process exemptions, and review applications as churn increases and enrollees reapply or appeal coverage lockout periods.
Report: Medicaid And Chip Enrollment And Renewal Processes
Enrollment and Renewal Processes as of January 2019
The ACA accelerated the adoption of data-driven enrollment and renewal processes that align and coordinate with the Marketplaces. Prior years of the survey documented that states have made significant progress upgrading or building new systems and re-engineering their business processes to provide a more modernized and streamlined enrollment and renewal experience that increasingly relies on electronic data matches to verify eligibility criteria. As noted in last year’s report, continued advancement leveled off as these systems and processes matured, although states continued to implement targeted improvements and some states are still engaged in system upgrades. This year’s data shows continued progress in some areas, plans for continued improvements, and insight into how states’ current eligibility operations compare to prior to the ACA.
Eligibility Systems and Operations
Implementation of the ACA required states to change eligibility systems to implement new MAGI-based financial eligibility methodology for pregnant women, children, parents, and expansion adults and to apply streamlined eligibility and enrollment processes for MAGI groups that coordinate with the Marketplaces. To assist states with ACA implementation and accelerate the use of technology, the federal government increased the federal match available for states to implement new or upgraded systems to 90%.
States took varied approaches to implement system changes to reflect MAGI-based Medicaid and CHIP eligibility and enrollment processes. As of January 2019, most states had launched a new eligibility system or made a significant system upgrade, while others made only necessary adjustments to existing systems. Some states implemented new systems or major upgrades when the ACA was first implemented in 2014, while others have done so more recently. Some states are still implementing new systems or upgrades, either to replace older legacy systems or to build upon and continue to improve newer systems. Tennessee, which had relied solely on the Federally-facilitated Marketplace (FFM) to implement ACA policies, launched its new combined Medicaid and CHIP eligibility system on a pilot basis in select counties in 2018, with statewide expansion planned for early 2019.
In many states, these system upgrades and re-engineered processes have contributed to improvements in eligibility and enrollment operations compared to before the ACA. Most states (34 of 46 reporting states) reported improvement in at least one area of eligibility operations compared to prior to the ACA (Figure 10). Officials in some states described how new systems provided increased efficiency and accuracy and freed up eligibility workers to work on more complex cases. Some states reported no change in their operations compared to prior to the ACA. Only six states reported that one or more of these aspects of operations were worse, but a number of those states were in the process of implementing a new system, which is often associated with short-term challenges.
Figure 10: Eligibility Operations as of January 2019 Compared to Prior to the ACA
Applications, Online Accounts, and Mobile Access
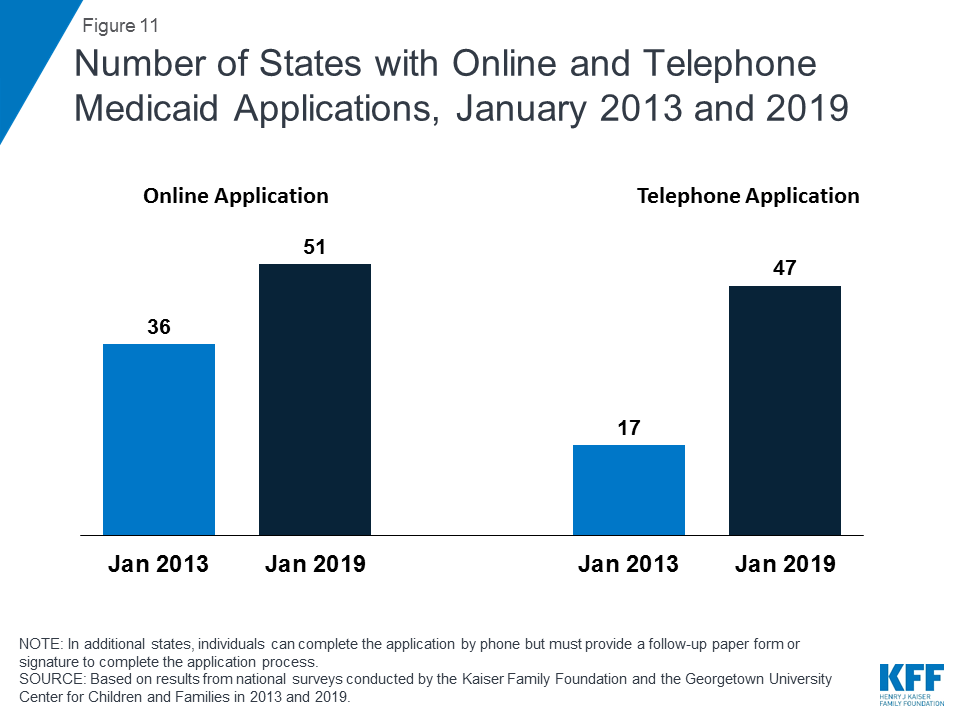
With Tennessee’s launch of a new eligibility system and accompanying web-based application in 2018, individuals can apply online for Medicaid in every state as of January 2019.39 In contrast, online applications were only available in 36 states in January 2013, the year prior to the implementation of the ACA coverage provisions (Figure 11). In 38 states, individuals can complete the online application using a mobile device, and 20 states have made the online application mobile-friendly and/or developed a mobile “app” for the application. In 2018, Indiana and Tennessee developed the capacity for individuals to apply using a mobile device, New Hampshire and Nevada added a mobile-friendly design to their application, and Wisconsin launched a mobile “app” for its online application. Additional states plan to enhance mobile functionality in 2019 or later. All states also offer the ability for individuals to apply via telephone, but four states have not enabled telephonic signatures and require a follow-up paper form or electronic signature to complete the application. The broad availability of telephone applications also represents a significant increase compared to prior to the ACA, when telephone applications were accepted in only 17 states.
Figure 11: Number of States with Online and Telephone Medicaid Applications, January 2013 and 2019
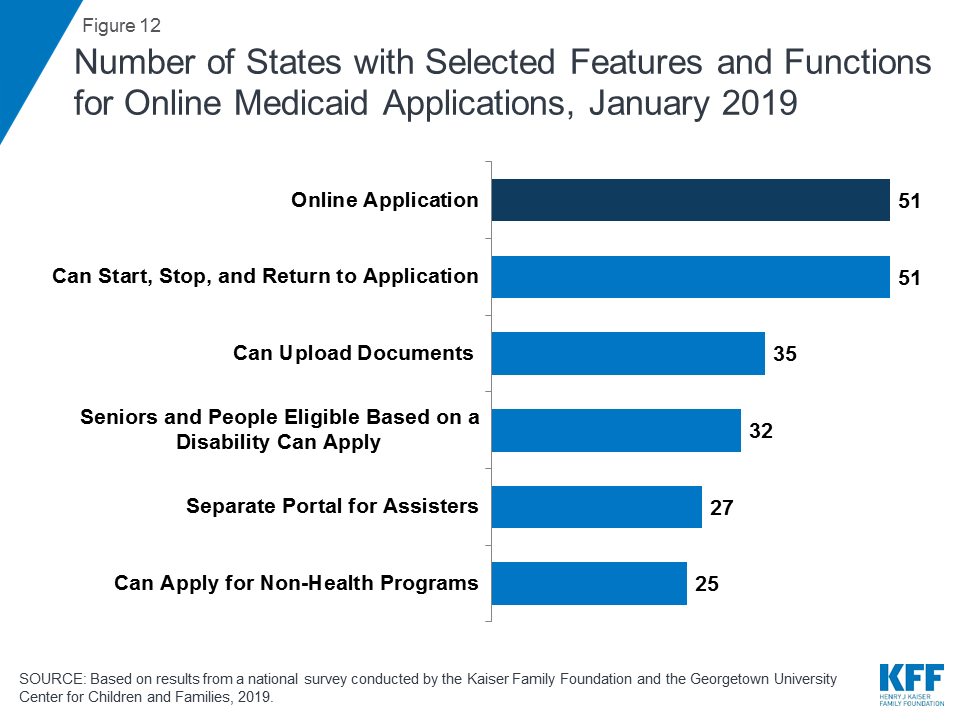
All states have designed their online applications so that individuals may start, stop, and return to the application (Figure 12). In addition, two-thirds of states (35) provide the option for individuals to scan and upload documents that may be needed to verify eligibility, and 27 states have separate portals for application assisters to submit facilitated applications. In 32 states, all Medicaid eligibility groups (children, pregnant women, adults, seniors, and individuals eligible based on a disability) can apply through a combined online application. Half of the states (25) offer a multi-benefit online application that also allows individuals to apply for at least one non-health program such as the Supplemental Nutrition Assistance Program (SNAP), Temporary Assistance for Needy Families (TANF), or child care assistance. These combined applications can facilitate individuals’ access to a broader array of services, but also may increase the length and complexity of the application.
Figure 12: Number of States with Selected Features and Functions for Online Medicaid Applications, January 2019
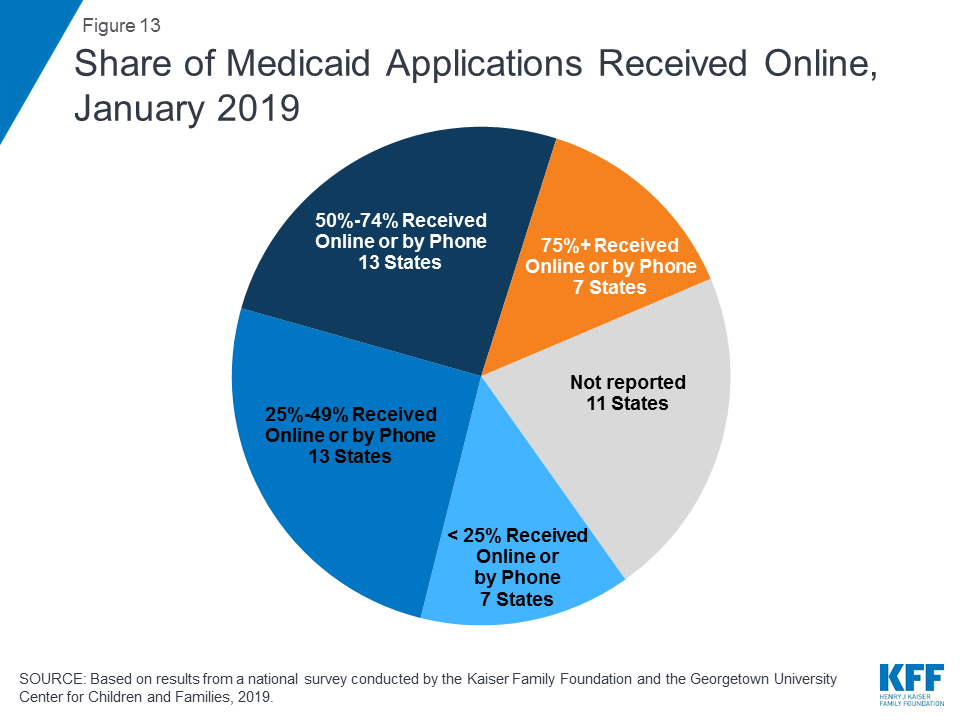
Although online applications offer potential benefits to individuals and states, other application pathways remain important. Online applications can make applying for coverage more convenient and accessible for some individuals, and can facilitate faster processing of determinations, limit data entry errors, and reduce state administrative burdens. However, other application pathways remain important for individuals who may not have easy access to a computer or the internet or who feel more comfortable applying in-person or through a paper form. Among the 40 states able to report data on modes of application, the median share of applications received online was 50%. The remaining half came via phone, in-person, or mail, although the share of telephone applications was very small in many states. Of these 40 states, 20 reported receiving half or more of applications online, including 7 states that reported receiving at least 75% of applications online (Figure 13). However, the share varied widely across states, ranging from 4% in Mississippi to 90% or higher in Florida, New York and Texas.
Figure 13: Share of Medicaid Applications Received Online, January 2019
States continued to advance the use of electronic accounts for enrollees to review or submit information. Online accounts add convenience for enrollees to access and update their information and efficiencies for states by eliminating the need for caseworkers to manually enter information like address changes. With New Jersey and Tennessee implementing electronic accounts, 42 states provided electronic accounts as of January 2019. During 2018, states also continued to expand the functions and features of existing accounts. As of January 2019, most states offer a broad array of functions through their accounts (Figure 14). In 33 of the 42 states with an electronic account, enrollees can access the account through a mobile device. Additionally, 21 states indicate that the online account has been designed with mobile-friendly formatting and six report that they have created a mobile “app” through which individuals can access their account. Several states reported plans to enhance mobile access to online accounts during or after 2019.
Figure 14: Number of States with Selected Features for Online Accounts, January 2019
Eligibility Determinations
With new or upgraded eligibility systems, states are increasingly able to make real-time eligibility determinations (within 24 hours) by using electronic data matches to verify eligibility criteria. As of January 2019, 46 states are able to make real-time eligibility determinations. However, the share of determinations completed in real-time varies widely across states. A total of 16 states report conducting at least half of MAGI-based determinations in real-time, including 9 states which make three-quarters or more of determinations in under 24 hours (Figure 15). States processing the majority of their applications in real-time are more likely to report that most are made by the eligibility system automatically without caseworker action, while those processing a lower share in real-time are more likely to require caseworker interaction to complete the determination. Automated determinations are more efficient and can reduce data entry errors and administrative burden, but systems and links to trusted data sources must be well-tested and subject to ongoing quality assurance to ensure accuracy.
Figure 15: Share of Medicaid Determinations Conducted in Real-Time (<24 Hours), January 2019
The majority of states do not report any problems or delays in their eligibility determinations. However, ten states indicated problems or delays as of January 2019. About half of these states are continuing to make changes to systems and processes, which may be contributing to these challenges. Other reasons for backlogs include gaps in staffing and resources or increased volume of applications resulting from recent implementation of the Medicaid expansion.
All states verify citizenship or qualified immigration status, as well as income, when determining eligibility for Medicaid and CHIP. States are able to electronically verify citizenship or immigration status either directly with the Social Security Administration or Department of Homeland Security or through the federal data services hub that consolidates access to these sources. These verifications must be conducted prior to determining eligibility, however, individuals who attest to a qualified status must be given a reasonable amount of time to provide documentation if eligibility cannot be confirmed electronically. While states must also verify income, they have the option to do so prior to enrollment, which 45 states do, or to enroll based on the applicant’s reported income and verify post-enrollment. Verification policies for other eligibility criteria, including age/date of birth, state residency, and household size, vary across states, reflecting state options to verify this information before or after enrollment or to accept the individual’s self-attestation.
Just over half of states (28) report that they conduct data matches on a periodic basis to identify changes in circumstances between annual redetermination periods. States may disenroll individuals if these data checks reveal changes in income or other information that affect eligibility and the individual is unable to resolve the discrepancy within specified timeframes (often within ten days from the date of the notice). These data checks can lead to coverage losses among eligible individuals if they do not receive the notice or are not able to provide documentation within the required timeframe. States vary in the frequency of these checks. For example, some conduct them quarterly, while others conduct only one check between annual renewals. In 2018, Minnesota and Tennessee implemented routine data checks to verify eligibility. Several additional states have recently passed legislation or are considering legislation to require stricter and more frequent data checks.40,41
The need for presumptive eligibility has decreased as states are increasingly able to process determinations quickly, but it remains an avenue in some states for people to access temporary coverage when they are unable to receive a real-time determination. Presumptive eligibility is a long-standing policy option that allows states to train and authorize qualified entities such as federally qualified health centers or prenatal clinics to make a temporary eligibility determination so that individuals can quickly access temporary coverage while their final eligibility determination is processed. The ACA expanded the use of presumptive eligibility to allow hospitals in all states to presumptively enroll MAGI-based groups including parents and expansion adults, although Arkansas obtained an exemption from this requirement through a Section 1115 waiver. As of January 2019, 30 states use presumptive eligibility for pregnant women and 20 states have adopted the policy for children. Fifteen states also have extended the policy to parents, adults, family planning services, and/or former foster youth.
System Integration
States continue to reintegrate Medicaid eligibility determinations for seniors, individuals eligible based on a disability, and non-health programs into their upgraded Medicaid systems. Prior to the ACA, state systems generally determined eligibility for all Medicaid groups and most included non-health programs, such as TANF and SNAP.42 The ACA required states to use new financial eligibility rules and streamlined enrollment policies for MAGI-based groups. However, states continue to apply their pre-ACA financial eligibility rules to non-MAGI groups (seniors and individuals eligible based on a disability). As a result, some states separated MAGI eligibility determinations from non-MAGI groups and non-health programs when they implemented the ACA. As their new systems have matured, states have increasingly reintegrated non-MAGI groups and non-health programs into the upgraded systems. This trend continued in 2018, with Iowa and Tennessee integrating non-MAGI groups into their systems. As of January 2019, 32 states determine eligibility for all Medicaid groups through a single system, and, in 24 states, the MAGI-based Medicaid eligibility system determines eligibility for at least one non-health program. This integration can facilitate access to services for individuals and offer efficiencies to states but requires more complex system implementation. States also have realized progress integrating Medicaid and CHIP eligibility determinations. Prior to the ACA, less than half of states with separate CHIP programs (16 of 38) used a single system for Medicaid and CHIP, but, as of January 2019, all but 1 of the 36 states with separate CHIP programs determine eligibility through a single system. Looking ahead, states remain focused on reintegration with nearly half indicating plans to integrate non-MAGI groups and/or additional non-health programs into their MAGI-based system in 2019 or beyond.
All states coordinate Medicaid and Marketplace coverage, as required under the ACA. However, how states coordinate this coverage depends on the structure of its Marketplace. Most states (39) rely on the Federally Facilitated Marketplace (FFM) system, known as Healthcare.gov, for Marketplace eligibility determinations and enrollment. These states must electronically transfer data back and forth with the FFM to coordinate Medicaid and Marketplace coverage. States report that these transfers generally are going smoothly without any significant delays or problems. Of the 39 states relying on the FFM platform, 30 states use the FFM only to assess Medicaid eligibility, and then make a final determination after the case is transferred to the state. In 2018, Arkansas shifted to receiving assessments from the FFM. Nine states allow the FFM to make final Medicaid or CHIP determinations, including Virginia, which switched from an assessment to a determination state in 2018 to facilitate its implementation of the Medicaid adult expansion. In the remaining 12 states that use their own State-based Marketplace system, Medicaid, CHIP, and Marketplace determinations are conducted through a single integrated system (Figure 16).
Figure 16: Relationship of Marketplace and Medicaid Eligibility Systems, January 2019
Renewals
Streamlined renewal policies can facilitate continuous coverage among eligible individuals, which helps prevent gaps in care and protects individuals from medical costs that might occur if they experience breaks in coverage. Under ACA policies, states are required to use available data to determine ongoing eligibility before requesting the enrollee to complete a renewal form or provide documentation. If a state is unable to determine ongoing eligibility based on available data, it may then request additional information from the individual and must provide the individual multiple avenues to renew, including online, by phone, in-person, or via mail. The move to automatic renewals can help reduce “churn” or short gaps in coverage, contribute to efficiencies and cost savings, and reduce data entry errors and administrative burden. However, eligible individuals may remain at risk for losing coverage at renewal if the state is unable to determine ongoing eligibility based on available data and they do not receive or understand notices or forms requesting additional information and respond to requests within required timeframes, which are often limited to 10 days.
As of January 2019, 46 states were completing automatic or “ex parte” renewals, through which the state renews coverage based on available eligibility-related data. Among the 43 states able to report the share of renewals completed through automated processes, 21 states reported at least half of MAGI renewals are conducted automatically, including 10 states that complete three-quarters or more of renewals automatically (Figure 17). States with a high share of automatic renewals are more likely to have a system that can complete the renewals without requiring caseworker action. Conversely, states that rely on manual action by a caseworker—for example, to look up data to verify ongoing eligibility—generally report a smaller share of renewals completed automatically.
Figure 17: Share of Medicaid Renewals Completed Using Automated Processes, January 2019
When unable to renew coverage based on available data, 46 states send pre-populated forms to enrollees to facilitate the renewal process (Figure 18). This count includes Tennessee and Vermont which began sending pre-populated forms in 2018. Idaho stopped mailing pre-populated forms in 2018, and like Florida and Oklahoma, sends a notice to the individual requesting that they log into their online account or call to confirm their information and/or report any changes. Most states (41), allow individuals to renew by phone; and four additional states allow individuals to complete most of the renewal process by phone, but still require a paper form or electronic signature to complete the process.
Figure 18: Medicaid Renewal Processes and Status of Renewals, January 2019
As of January 2019, the majority of states were up-to-date in processing Medicaid and CHIP renewals. However, ten states reported delays with most of these states overlapping with the ten states that reported delays in application processing. Causes of renewal delays were similar to those contributing to backlogs in eligibility determinations, including issues related to system upgrades or challenges related to staffing and volume of renewals.
Nearly two-thirds of the states (32) minimize gaps in coverage for children by providing 12-month continuous eligibility in either Medicaid and/or CHIP. All states are required to renew coverage every 12 months for children, pregnant women, parents and expansion adults. However, during that 12-month period, individuals may lose coverage if they experience a change in circumstance that makes them ineligible, such as an increase in income. For children, states can opt to provide 12-month continuous eligibility, which allows a child to remain enrolled for a full year unless the child ages out of coverage, moves out of state, voluntarily withdraws, or does not make required premium payments. Continuous eligibility promotes stable access to care by reducing “churn” or individuals moving on and off coverage due to modest, and often temporary, changes in circumstances such as overtime or extra seasonal work. Continuous eligibility also facilitates a more accurate assessment of the quality of health care children receive in Medicaid and CHIP because most quality measures require minimum periods of enrollment. As of January 2019, 24 states have adopted continuous eligibility for children in Medicaid and CHIP, and eight additional states have implemented the policy only in their separate CHIP programs. Montana and New York also provide 12-month continuous coverage for adults through a Section 1115 waiver.
Report: Premiums And Cost Sharing
Research shows that premiums serve as a barrier to enrollment for low-income families and copayments can limit utilization of needed health care.43 Federal regulations establish parameters for premiums and cost sharing for Medicaid and CHIP enrollees that reflect their limited ability to pay out-of-pocket health care costs due to their modest incomes. Under these rules, states may not charge premiums in Medicaid for enrollees with incomes less than 150% FPL. However, some states have obtained waivers to impose charges in Medicaid that are not otherwise allowed. Maximum allowable cost sharing varies by type of service and income in Medicaid (Table 1). CHIP programs have more flexibility in regard to premiums and cost sharing, but both Medicaid and CHIP limit total family out-of-pocket costs to no more than 5% of family income.
Box 1: Medicaid and CHIP Premium and Cost Sharing Rules
Premiums in Medicaid. States may charge premiums for children and adults with incomes above 150% FPL. Medicaid enrollees with incomes below 150% FPL may not be charged premiums.
Cost Sharing in Medicaid. States may charge cost sharing for adults in Medicaid, but allowable charges vary by income (Table 1). Cost sharing cannot be charged for emergency, family planning, pregnancy-related services in Medicaid, preventive services for children, or for preventive services in Alternative Benefit Plans in Medicaid, which have been defined as essential health benefits. In addition, children with incomes below 133% FPL generally cannot be charged cost sharing.
Limit on Out-of-Pocket Costs. Overall, premium and cost sharing amounts for family members enrolled in Medicaid may not exceed 5% of household income.
Premiums and Cost Sharing in CHIP. States have somewhat greater flexibility to charge premiums and cost sharing for children covered by CHIP, although there remain limits on the amounts that can be charged, including an overall cap of 5% of household income.
Table 1: Allowable Cost Sharing Amounts for Adults in Medicaid by Income
<100% FPL
100% – 150% FPL
>150% FPL
Outpatient Services
up to $4
up to 10% of state cost
up to 20% of state cost
Non-Emergency use of ER
up to $8
up to $8
No limit
Prescription Drugs
Preferred: up to $4Non-Preferred: up to $8
Preferred: up to $4Non-Preferred: up to $8
Preferred: up to $4Non-Preferred: up to 20% of state cost
Inpatient Services
up to $75 per stay
up to 10% of state cost
up to 20% of state cost
Premiums and Cost Sharing for Children
The number of states (30) charging premiums or enrollment fees to children in Medicaid/CHIP held steady in 2018 (Figure 19). The stability of premiums, in part, reflects that the extension of CHIP funding also extended the MOE provision for children’s eligibility and enrollment policies. Under the MOE, states may not implement new premiums or increase premiums outside of routine increases that were approved in the state’s plan as of 2010. Premiums and cost sharing are much more prevalent in CHIP than Medicaid, reflecting that the program covers families with more moderate income levels. Only four states charge premiums for children in Medicaid. These premiums are limited to children in CHIP-funded Medicaid expansions and the lowest income level at which they are charged is 160% FPL. Among the 36 separate CHIP programs, four charge annual enrollment fees and 22 impose monthly or quarterly premiums for children; the lowest income at which these charges begin is 133% FPL.
Figure 19: Premiums or Enrollment Fees for Children in Medicaid and CHIP, January 2019
States vary in disenrollment policies related to non-payment of premiums within federal rules designed to minimize gaps in coverage for children. The minimum grace period before canceling coverage for non-payment of premiums is 60 days in Medicaid and 30 days in CHIP. However, 16 of the 22 states charging monthly or quarterly premiums in CHIP provide at least a 60 day grace period. Children who are disenrolled from Medicaid for non-payment of premiums cannot be locked-out of coverage for a period of time as a penalty for non-payment, while separate CHIP programs may establish a lockout period of up to 90 days. Among the 22 states charging monthly or quarterly premiums in CHIP, eight states do not impose lockout periods, including Georgia, which eliminated the practice in 2018. As of January 2019, 14 states maintain lockout periods in CHIP ranging from 1 month to 90 days.
As of January 2019, less than half of the states (23) charge copayments to children in Medicaid and CHIP after Kentucky and New Mexico eliminated children’s copayments. In 2018, New Mexico eliminated its copayments for children, leaving only two states (Tennessee and Wisconsin) that require copayments for children in Medicaid. Kentucky also eliminated copayments for children in its separate CHIP program in 2018, reducing the number of states that impose copayments on children to 23 of 36 states with separate CHIP programs (Figure 20). Only one state (Tennessee) imposes cost sharing below 133% FPL due to long-standing waiver authority. Cost sharing varies by state and service. At 151% FPL, 18 states charge cost sharing for non-preventive physician visits, 14 states charge for an inpatient hospital visit, and 14 charge for generic drugs.
Figure 20: Income at Which Cost Sharing for Children in Medicaid and/or CHIP Begins, January 2019
Premiums and Cost Sharing for Parents and Other Adults
Some states have obtained waivers to charge premiums or monthly contributions for adults in Medicaid that would not otherwise be allowed under federal rules. As of January 2019, five states (Arkansas, Indiana, Iowa, Michigan, and Montana) have implemented premiums or monthly contributions for expansion adults, and, in Indiana, the charges also apply to parents. In 2018, Indiana used waiver authority to add a tobacco surcharge of 50% of the normal monthly contribution if the enrollee has been a tobacco user for the past year. Some of these waivers also allow individuals to be locked out of coverage for a period of time if they are disenrolled due to non-payment and to delay coverage until after the first premium is paid. An additional four states (Arizona, Kentucky, New Mexico, and Wisconsin) have obtained waiver approval to charge premiums or monthly contributions to adults and, in some cases, impose lockout periods or delay coverage, but they were not yet implemented as of January 2019. New Mexico is no longer planning to implement the premiums following a change in state leadership and implementation was on hold in Arizona and Wisconsin, while Kentucky is in the process of preparing for implementation.
As of January 2019, most states charge cost sharing for parents and other adults. A total of 39 states charge copayments for parents eligible for Medicaid under traditional pathways that existed before the ACA (Figure 21). In addition, of the 35 states that cover other adults (including the 34 states that have implemented the ACA Medicaid expansion and Wisconsin, which covers other adults but has not adopted the expansion), 25 charge copayments. The number of states charging copayments to traditional parents has remained generally consistent for several years. Although many states impose the charges on all adult beneficiaries, regardless of income, cost sharing amounts in Medicaid are limited by federal law. Two states made minor adjustments to copayments in 2018, including New Hampshire, which lowered cost sharing amounts for expansion adults to match levels charged for 1931 parents, and Indiana which dropped its copayment of subsequent non-emergency use of the emergency room from $25 to $8.
Figure 21: Number of States with Cost Sharing for Selected Services for Adults, January 2019
Report: Looking Ahead
Looking ahead, one key question is whether there will be continued advances to expand coverage and streamline enrollment processes or whether emerging policy changes will erode coverage gains and enrollment simplifications realized under the ACA.
Additional states may expand Medicaid, which would increase access to coverage for low-income adults and have positive effects on care and state budgets and economies.44 Several new governors who were elected in 2018 ran on platforms to expand Medicaid. Further, the success of recent ballot initiatives to expand could spark similar action in other states. However, voter-approved ballot measures may face barriers to implementation based on state law requirements, efforts to block or amend the policies by legislators or governors, or legal challenges.45 Ongoing litigation related to the constitutionality of the ACA also could influence state decisions to expand. However, if states attach waiver provisions such as work requirements or other restrictions to expansion, the positive reach and impact would be limited. Recently, some states have indicated interest in a partial expansion to an income level below 138% FPL with the ACA enhanced federal match rate.46 Relative to full expansion, partial expansions could limit coverage and potentially increase federal costs. While states can pursue waivers to extend coverage to a lower income level without access to the enhanced federal match, no waivers to allow an enhanced match for a partial expansion have been approved to date, and guidance from the previous administration prohibited the use of the enhanced match for “partial expansions.”
Renewed CHIP funding protects children’s eligibility levels through 2027, but states that extend eligibility above 300% FPL will have the option to reduce eligibility starting in October 2019. When Congress continued funding for CHIP in 2018, it retained the MOE provision that requires states to preserve Medicaid and CHIP eligibility and enrollment policies for children. However, starting in October 2019, the MOE only applies to children’s coverage up to 300% FPL. At that time, states can maintain coverage for children above this income level and still receive federal matching funds, but will newly have the option to reduce eligibility to 300% FPL. This change in the scope of the MOE coincides with the beginning of the phase-out of the 23-percentage point temporary boost in federal CHIP matching rates available between 2016 and 2019. This boost will be reduced by half (11.5 percentage points) in 2020 and then rates revert to the traditional enhanced CHIP match rate in 2021, leaving states to resume paying a larger share of CHIP costs.
Emerging state and federal policies to add Medicaid eligibility requirements could erode the coverage gains and enrollment simplifications realized under the ACA. The Trump Administration is promoting new Medicaid eligibility requirements through waivers and its proposed budget and has approved a growing number of waiver requests from states, including work requirements, which have never previously been approved for the program. Some states are no longer moving forward with implementing waiver provisions following a change in leadership in the 2018 elections,47,48 while other states are considering adding waiver provisions.49,50,51,52 Research shows that these types of requirements create barriers for eligible individuals to obtain and maintain coverage and increase administrative burdens and costs for states.53,54 As such, they will likely dampen potential coverage gains and lead to coverage losses that would erode the coverage increases realized under the ACA. States’ implementation of waiver provisions could be affected by ongoing legal challenges to the Administration’s authority to approve work requirements and other restrictive measures in Arkansas and Kentucky.
Other policy changes may lead to coverage losses among eligible low-income families and growing burdens on states. In 2017, coverage gains stalled and began to reverse for the first time since the implementation of the ACA and Medicaid enrollment of adults and children declined in 2018.55,56,57 Some of the decline in Medicaid enrollment could reflect the improving economy. However, some factors may be leading to enrollment declines among eligible individuals. While states’ growing use of technology and automation has led to improvements for individuals and states, there are concerns emerging in some states that eligible individuals may be losing coverage due to process-related issues.58,59,60 Further, other policy changes outside of Medicaid could be dampening enrollment. For example, the Trump administration substantially decreased funding for outreach and enrollment assistance, which is pivotal for helping eligible individuals get and stay enrolled in coverage. In addition, shifting immigration policies, including the proposed rule to make changes to public charge policy, will likely lead to broad decreases in participation in Medicaid among legal immigrant families and their primarily U.S.-born children and increase administrative burdens on states.61 Twenty states reported they would need to change applications, forms, or other guidance, conduct additional staff training, and/or increase outreach and education to immigrant families if the public charge rule is finalized, while most of the remaining states indicated they could not yet determine how the rule would impact their operations.
305% FPL with the five percentage point income disregard that is applied to MAGI-based groups. ↩︎
U.S. Congress. House. Substance Use-Disorder Prevention that Promotes Opioid Recovery and Treatment (SUPPORT) for Patients and Communities Act of 2018. HR 6, 115th Congress. Introduced in House June 13, 2018. https://www.congress.gov/bill/115th-congress/house-bill/6↩︎
Some states also have state-funded family planning programs. ↩︎
Some immigrants with qualified status, such as refugees and asylees, do not have to wait five years before enrolling. Some immigrants, such as those with temporary protected status, are lawfully present but do not have a qualified status and are not eligible to enroll in Medicaid or CHIP regardless of their length of time in the country ↩︎
This option also extends coverage to lawfully present immigrants without a qualified status. ↩︎
The District of Columbia, Illinois, Massachusetts, New York, Oregon and Washington use state funds to cover income-eligible children regardless of immigration status. In addition, some states use state funds to cover adult immigrants, but the coverage is often limited to targeted groups. ↩︎
This count excludes Maine, which rejected previously approved waiver terms and conditions in January 2019. Six states (DE, MA, MD, RI, TN, and UT) have retroactive coverage waivers that are not included in this count because they pre-date the ACA and may have been associated with achieving the budgetary savings necessary to expand coverage before federal law authorized the use of Medicaid funds for childless adults. ↩︎
As All States Streamline Medicaid Enrollment and Renewal Processes, New Eligibility Requirements Pursued By Some States Could Increase Administrative Complexity and Reduce Coverage
Annual 50-state Survey Also Finds Eligibility Levels Remain Very Low in Non-expansion States
All states continue to implement new Medicaid enrollment and renewal processes that can connect individuals to coverage more quickly and reduce administrative paperwork, finds KFF’s annual 50-state survey of Medicaid eligibility and enrollment policies. At the same time, some states are pursuing new eligibility requirements, such as work requirements and monthly premiums, that would push in the opposite direction, increasing the complexity of enrollment processes and potentially reducing coverage.
The ongoing technological and enrollment process upgrades required of all states under the Affordable Care Act mean that this year, for the first time, individuals can apply online for Medicaid in all states, the survey finds. Moreover, 46 states can complete Medicaid eligibility determinations within 24 hours, and 46 can perform automated renewals.
While all states have streamlined enrollment and renewal processes, not all states have expanded coverage to adults under the ACA. In the 14 states that had not adopted the Medicaid expansion, eligibility for parents and other adults remained very limited. The median eligibility level for parents in these states was 40 percent of poverty ($8,532 per year for a family of three). In Texas, eligibility is limited to 17 percent of the federal poverty level or less than $4,000 per year for a parent in a family of three. Other adults were ineligible regardless of income in all these states except Wisconsin.
medeparately, some states are seeking and implementing new eligibility rules, often through waivers. Such measures include imposing work requirements, mandatory health risk assessments, charging monthly premiums, eliminating retroactive eligibility, delaying coverage until the first premium payment and locking enrollees out of coverage if they fail to pay premiums or renew their eligibility on time. Many of these measures require complex and costly documentation and administrative efforts, which can raise barriers to coverage and contribute to coverage losses, in contrast to the push for increased coverage and streamlined enrollment processes under the ACA.
The 17th annual survey provides a comprehensive look at Medicaid and CHIP eligibility, enrollment, renewal, premium and cost sharing policies for each state as of January 2019. These annual surveys will continue to track future policy changes.
Community health centers play a vital role in ensuring access to comprehensive primary care services for medically underserved communities. In 2017, 1,373 federally-funded health centers served 27.2 million patients. Health centers receive funding from multiple sources, but are primarily reliant on revenue from Medicaid and Section 330 grants.
What are the sources of health center revenue? Revenue from Medicaid and Section 330 funding account for nearly two-thirds of health center funding. Medicaid is the largest source of health center funding accounting for 44% of total revenue. Section 330 funding accounts for 18% of total revenue.
How do Medicaid’s special payment rules support health centers? Medicaid reimburses health centers under the Prospective Payment System (PPS), which ties payments to the costs of delivering care. Under PPS, each health center receives a per visit rate based on the cost of services to Medicaid patients that is updated annually to reflect medical inflation and costs of new Medicaid-covered services. While PPS payments align generally with the costs of providing care, shortfalls have emerged. In 2010, Medicaid paid 81% of health centers’ cost-linked charges; by 2017, payments covered 79%. Despite this shortfall, from 2010 to 2017, health center Medicaid revenue increased 97% when adjusted for inflation, reflecting the increase in Medicaid patients served by health centers following implementation of the Medicaid expansion. On a per patient basis, health center Medicaid revenue grew by only 11% suggesting the increase in Medicaid spending is the result of enrollment increases and not per-patient cost escalation.
What is the role of Section 330 grant funding? Section 330 of the Public Health Service Act created and authorized the health center program and permits the Health Resources and Services Administration (HRSA) to make grants to health centers. Section 330 grant funding supports health centers through two funding streams, an annual appropriation and the Community Health Center Fund (CHCF). Since the establishment of the CHCF in 2010 to supplement health centers’ regular, annual appropriation, total Section 330 health center grant funding has more than doubled, from $2.2 billion in FY 2010 to $5.6 billion in FY 2019. Funds from the CHCF now account for 72% of total Section 330 funding. Annual Section 330 grants support ongoing care to the uninsured and underinsured, while the expanded funding available through the CHCF has enabled health centers to establish new sites, expand the services they provide, reach more patients, and respond to emerging public health issues and priorities such as the President’s HIV/AIDS initiative.
In 2017, 1,373 federally-funded community health centers served 27.2M patients and played a key role in ensuring access to comprehensive primary care for medically underserved communities. Centers rely heavily on money from Medicaid and Section 330 grants
How have funding changes affected health centers? Increases in the key sources of health center funding, Medicaid and Section 330 grants, have enabled health centers to expand their capacity and services. From 2010 to 2017, the number of health center sites increased 59%to 11,056, the number of patients served increased 40% to 27.2 million, and total staff increased 70% to 223,840 FTEs.
Stable financing from Medicaid and expanded Section 330 grant funding have enabled health centers to play an increasingly important role in providing care to vulnerable populations and communities and in advancing health policy priorities. The CHCF is due to expire in September 2019. An important policy question Congress will consider this year is whether to extend the life of the CHCF and if so, for how long and for how much.
Issue Brief
Introduction
Since their 1965 beginning as a small War on Poverty experiment, community health centers have matured into a principal part of the health system for thousands of medically underserved urban and rural communities that experience elevated poverty and health risks. In 2017, 1,373 federally-funded health centers operating in over 11,000 community locations nationwide cared for 27.2 million patients.1 Health centers serve patients of all ages and provide an entry point into specialized care, and frequently, a bridge to services aimed at addressing underlying social determinants of health.2 To provide this care, health centers rely on multiple funding sources. The two major funding sources are Medicaid payments for covered services furnished to enrollees who are health center patients, along with federal grants made pursuant to Section 330 of the Public Health Service Act, which establishes and authorizes the health centers program. This issue brief describes health centers’ role in health care and these two primary sources of health center revenue—Medicaid and Section 330 funding. The evolution of these funding streams has contributed to significant growth in the health center program, enabling expanded services to millions of additional residents of the nation’s most medically underserved rural and urban communities.
Background
Health centers play an especially important role for certain patient populations. Health centers serve communities facing many challenges, including elevated poverty, increased health risks, and shortages of primary care and other providers. Reflecting the characteristics of these communities, in 2017, nearly all health center patients (91%) were low-income, and 69% were poor (Figure 1).3 Compared to other low-income populations, health center patients tend to be in poorer health.4 In 2017, nearly half (49%) of all health center patients were covered by Medicaid and over one in five (23%) were uninsured. To ensure access to affordable care, health centers adjust their charges in accordance with patient income. Charges cannot exceed the cost of care, and payment discounts must apply to both uninsured patients and those who are underinsured and face the cost of uncovered services (such as adult vision and dental care) and high cost sharing.
Health centers have increasingly adopted a comprehensive approach to patient care by providing a broad array of physical health, behavioral health, and supportive services. Health centers’ focus on addressing the needs of vulnerable, underserved communities is reflected in approaches to care not typical of standard medical practices, such as the integration of physical and mental health care services, location in community settings, such as schools and homeless shelters, and the provision of on-site services for addiction treatment and recovery and oral health. This co-location and integration of services enables health centers to participate in Medicaid delivery and payment reform strategies aimed at improving health care quality and efficiency and to serve as an entry point into a broader array of services.
What are the sources of health center revenue?
Revenue from Medicaid and Section 330 grant funding account for nearly two-thirds of health center funding. Like all health care providers, health centers derive their operating revenue from multiple sources. In the case of health centers, these sources are public and private insurance payments, grants from public and private funders, and patient out-of-pocket payments. Reflecting the federal law under which they operate as well as the poverty of their patients, health centers rely most heavily on Medicaid revenue and their ongoing operating grants under Section 330 of the Public Health Service Act, which authorizes the health centers program. Medicaid accounts for 44% of operating revenue nationally; Section 330 grants account for 18%; together, these two funding sources represent nearly two thirds of health center funding (Figure 1). Other revenue sources, while notable, play a less significant role. Private insurance accounts for 10% of health center revenue, while Medicare represents 7% of revenue. Direct patient payments account for only 4% of all revenue, a reflection of the poverty of health center patients.
Figure 1: Sources of health center revenue, 2017
Health centers also receive funding from other sources, to be used to provide specific services or to serve specific populations. Examples of these dedicated funding streams include grants for preventive reproductive health care under the Title X family planning program, Veterans Administration service contracts covering veterans who are patients, and contracts with state or local corrections authorities for services furnished inside a correctional institution or care for former inmates transitioning to the community. Health centers also receive state and local public health grants for preventive services such as funds to help support the cost of vision screening or services to screen and treat for communicable diseases. In total, these other federal, state, local, and private grants and contracts account for 12% of all health center operating revenue.
How do Medicaid’s special payment rules support health centers?
Medicaid pays health centers under the Prospective Payment System (PPS), which ties payments to the costs of delivering care. Health centers are a federally recognized type of Medicaid provider. Like all health care providers, to participate in their state Medicaid program, health centers must meet any reasonable conditions that states may apply to health care providers generally, such as basic licensure rules. However, unique to health centers and rural health clinics is a requirement that state Medicaid programs pay them according to a special cost-related payment formula. The purpose of these cost-related payment rules in Medicaid is to ensure that federal grant funds are used to pay for uninsured or under-insured patients and important but uncovered services and do not have to absorb uncovered costs associated with providing covered services to Medicaid patients. The earliest health center payment rules were added to Medicaid in 1990, while the current PPS was established in 2000 by the Medicare, Medicaid and SCHIP Benefits Improvement and Protection Act. PPS applies to both health centers and rural health clinics, and it is designed to ensure that, in keeping with early policy assumptions regarding Medicaid’s role in sustaining health centers as a principal source of primary care in underserved communities,5 Medicaid payments reasonably approximate the cost of care. The PPS payment system also applies to Medicare and CHIP, as well as payments made by Qualified Health Plans certified under the Affordable Care Act.Under PPS, each health center receives a predetermined per visit rate based on the cost of services to Medicaid patients. This rate is updated annually to reflect medical inflation. PPS rates are also updated to reflect costs associated with the addition of new Medicaid-covered services such as on-site substance use disorder treatment and recovery services, expanded physical and speech therapy services for children with developmental disabilities, or dental services.Under Medicaid PPS rules, state Medicaid agencies and their health centers may jointly develop alternative payment methodologies (APMs) to test innovative payment approaches. Such payment methodologies include all-inclusive payment rates for certain types of ongoing care or certain populations (e.g., a global annual payment for patients receiving health home services, or an all-inclusive per-member-per-month payment rate for all patients of the health center).6 States and health centers have begun to test such alternative payment models in order to experiment with approaches that better tie payment to performance rather than the volume of care furnished;7 models must maintain basic protections against steep revenue shortfalls of the type that led to the establishment of the PPS system in the first place.The Medicaid PPS model has ensured that payments to health centers remain somewhat related to the cost of care; however, while PPS maintains a degree of alignment between cost and revenue, costs continue to rise faster than the payment rate. In 2010, Medicaid paid 81% of health centers’ cost-linked charges; by 2017, payments only covered 79% (Table 1). But even with this gap, Medicaid is a far stronger payer than Medicare or private insurance. Although Medicare also uses the PPS formula, Medicare covers a more limited scope of primary care and mental health services and requires higher patient cost-sharing. For example, Medicare excludes vision and dental care, meaning that in serving low-income Medicare beneficiaries who are not also qualified for full Medicaid coverage, health centers must absorb the cost of subsidizing these uncovered services through their grants. As a result, on a per-patient basis, Medicare payment rates are lower than those received through Medicaid; in 2017, Medicare covered only 58% of charges. Private health insurance is typically the lowest payer, and may pay less for the covered services while also using higher cost sharing and excluding many forms of necessary care. In 2017, private insurance payments covered 56% of the private insurance charges.
Table 1: Percent of Charges Paid, by Revenue Source, 2010 and 2017
Payer
2010
2017
Medicaid
81%
79%
Medicare
66%
58%
Private
57%
56%
Self-Pay
21%
24%
Total Patient Charges
59%
63%
Source: 2010 and 2017 national UDS reports, Table 9D
Despite a surge in the number of patients served, per-patient Medicaid spending at health centers has grown only modestly. The number of Medicaid patients served by health centers has increased over time, with a significant surge following implementation of the ACA’s Medicaid expansion in 2014. From 2010 to 2017, the number of health center Medicaid patients increased 78% from 7.5 million to 13.3 million (Table 2). During this period, health center Medicaid revenue also nearly doubled, increasing 97% when adjusted for inflation. However, on a per patient basis, health center Medicaid revenue increased a much more modest 11%. This suggests that the growth in health center Medicaid revenue is the result of the increase in the number of patients served8 rather than per-patient cost escalation. Although the FQHC payment methodology calls for annual medical inflation adjustments, the growth in health center per patient Medicaid revenue is half the cumulative medical inflation rate of 22% over the same period. This slow per-patient spending growth rate at health centers is consistent with other research showing low per capita spending growth changes over time, which attributes overall Medicaid spending growth primarily to increased enrollment.9
Table 2: Medicaid Revenue per Patient, 2010 and 2017
2010*
2017
Percent Change
Total Medicaid patients
7,505,047
13,340,999
78%
Total Medicaid revenue
$5,823,933,581
$11,477,870,314
97%
Medicaid revenue per Medicaid patient
$776
$860
11%
*Nominal revenue amounts for 2010 were inflated to 2017 using the Consumer Price Index, Medical, US Bureau of Labor Statistics, Consumer Price Index for All Urban Consumers: Medical Care, retrieved from FRED, Federal Reserve Bank of St. Louis. Notes: Medicaid revenue per patient calculated by dividing the Medicaid revenue by the number of Medicaid patients. Source: GW analysis of 2010 and 2017 UDS data.
What is the role of Section 330 grant funding?
Section 330 funding supports health centers through two funding streams, an annual appropriation and the Community Health Center Fund (CHCF), established by the Affordable Care Act (Table 3). Originally, Section 330 grant funding flowed exclusively through the annual discretionary appropriations process, as part of the overall appropriation made to the Departments of Labor and Health and Human Services. However, in 2010, as part of the Affordable Care Act, Congress created the Community Health Center Fund (CHCF), supported through a special mandatory spending account rather than the normal discretionary process. Both the CHCF and the annual appropriation are subject to all Section 330 requirements. Creating the CHCF effectively split annual health center funding into two pots – one subject to the annual appropriations process, and the other governed by the length of the CHCF authorization, but flowing automatically and without an annual appropriation. The original CHCF was authorized for five years. Because the CHCF is time-limited, Congress has twice extended it for two years, first in 2015 and then again in 2018.10 The current extension will sunset on September 30, 2019.
Table 3: Section 330 Grant Funding
Annual Section 330 Grant Appropriation
Community Health Center Fund
Authority
Discretionary funding; funding amounts determined through the federal appropriations process
Mandatory funding; funding amounts established through authorizing legislation
Duration
Annual
Funding period specified in authorizing legislation; usually longer than one year. Current authorization is for two years.
Allocation
Competitive grants, with specified percentages of total funding allocated to health centers serving certain populations:
8.6% for serving migrant/seasonal farmworkers
8.7% for serving people who are homeless
1.2% for serving residents of public housing
Competitive grants
FY 2019 Funding Amount
$1.6 Billion
$4.0 Billion
In the nine years since the creation of the CHCF, Section 330 health center funding more than doubled. When the CHCF was first established, it accounted for less than half (40%) of Section 330 funding;11 however, between FY2011 and FY2019, lawmakers increased funding through the CHCF while holding the annually appropriated amount relatively constant. By fiscal year 2018, the CHCF accounted for 72% of Section 330 grant funding; only 28% came through annual discretionary appropriations.12 At the same time, the creation of the CHCF, and its subsequent funding increases, contributed to total Section 330 health center funding more than doubling, from $2.2 billion in FY 2010 to $5.6 billion in FY 2019 (Figure 2).
Figure 2: Section 330 funding through the Community Health Center Fund and annual appropriation, FY2010-FY2019 (in billions)
In addition to annual grants that support ongoing operations, Section 330 funding also provides health centers with supplemental grants to expand capacity, improve care, and respond to emerging priorities. Over the years, Section 330 funds have supported the opening of new access points in previously unserved communities, expanded access to addiction treatment and recovery or mental health services programs13 , and enhanced health information technology capability14 to affiliate with managed care plans or integrated delivery systems such as accountable care organizations. Federal appropriations also have been invested to increase the number of behavioral health care staff15 and enable health centers to respond to public health crises such as the hurricanes in Puerto Rico and Houston,16 and the Zika virus.17 In this way, grants are critical not only because they fund ongoing care for uninsured populations and services, but also because they supply health centers with the working capital needed to expand capacity and services that providers that do not serve poor communities typically would find from private investors and lenders.
Section 330 funding can also be used to advance policy priorities. As part of the recently announced goal to end the HIV/AIDS epidemic by 2030, one strategy will be to grow health center capacity to find and treat patients in the nation’s most vulnerable communities, who are at risk for or living with HIV/AIDS. Health centers serve an estimated one in five people living with HIV who are receiving care for their condition.18 The administration has explicitly identified health centers as key to its response19 and has proposed dedicating $50 million in health center grant funding to expand access to prophylactic HIV treatment (PrEP) along with expanded HIV/AIDS services, outreach and care coordination as part of the President’s FY 2020 budget.20
How have funding changes affected health centers?
Funding increases have spurred health center growth, expanding access to needed services for vulnerable populations. The revenue increases flowing from the combination of broader Medicaid and private insurance coverage and increased grant funding under the CHCF have enabled health centers to increase their reach, staffing, and the scope of the services they offer. In 2010, a total of 1,124 health center grantees operated in 6,949 sites; by 2017, total grantees had grown to 1,373 and total operating sites reached 11,056 (Figure 3). Total health center staffing stood at 131,660 full-time equivalents (FTEs) in 2010; by 2017, this figure had grown to 223,840.This growth translated into greater service capacity, not simply more patients. From 2010 to 2017, the share of health centers providing mental health services increased by 22%, while the share offering substance use disorder services grew by 75%. The share of health centers offering dental health services also increased over this same period, but by a more modest 7%. In 2010, health centers served 19.5 million patients on a total operating revenue base of $12.7 billion; by 2017, this figure had grown to 27.2 million patients on a total revenue base of $26.3 billion.
Figure 3: Growth in health center capacity and services, 2010-2017
Looking Ahead
Health centers have become a significant part of the health care landscape in medically underserved communities across the nation, both as a major source of primary care health and increasingly, as entry points into care for patients with more complex health needs. Consistent with the original vision of how health centers could be sustained over time, today’s health centers receive their principal support through Medicaid payments and grant funding. Together these two funding sources cover the cost of care to Medicaid-insured patients, enable health centers to make needed care available to uninsured patients, and help underinsured patients meet out-of-pocket costs for uncovered services and high cost-sharing they otherwise could not afford. Other sources of grant and insurance funding enable health centers to target key populations and services, but Medicaid and Section 330 grants are the mainstay.
The success and durability of the health centers model can be seen in the many roles health centers play in the health care system. They are on the front lines of the opioid epidemic. They are an important source of care during natural disasters, such as hurricanes, and public health threats, such as the Zika virus. They are a key element in the national effort to halt the spread of HIV. And, they serve as a model for the design of health homes that integrate behavioral health and physical health care. Sustainable financing through Medicaid and Section 330 grants is essential to ensuring that health centers will be able to continue to fill these important roles.
Because the stable financing of health centers is key to their long-term performance, an important policy question Congress will consider this year is whether to extend the life of the CHCF and if so, for how long. The original fund was authorized for five years, but since 2015, the CHCF has been extended in two-year cycles, with the current authorization set to expire on September 30, 2019. Since the CHCF now represents over 70% of Section 330 health center grant funding, establishing a longer funding period has emerged as a significant factor enabling health centers to continue as a key resource and flexible tool for responding to emerging population health needs.
Additional funding support for this brief was provided to the George Washington University by the RCHN Community Health Foundation.
Endnotes
Sharac, J., Shin, P., Gunsalus, R., & Rosenbaum, S. (2018). Community Health Centers Continued to Expand Patient and Service Capacity in 2017. Geiger Gibson/RCHN Community Health Foundation Research Collaborative, George Washington University. Policy Research Brief No. 54. https://www.rchnfoundation.org/?p=7172↩︎
Bruna, S., Stone, L. C., Wilger, S., Cantor, J., & Guzman, C. (2014). The role of community health centers in assessing the social determinants of health for planning and policy: The example of Frontier New Mexico. The Journal of Ambulatory Care Management, 37(3), 258-268.; Institute for Alternative Futures. (2012). Community Health Centers Leveraging the Social Determinants of Health.http://www.altfutures.org/leveragingsdh/ ; National Association of Community Health Centers. (2012). Powering Healthier Communities: Community Health Centers Address the Social Determinants of Health. ↩︎
Shin, P., Alvarez, C., Sharac, J., Rosenbaum, S., Van Vleet, A., Paradise, J., Garfield, R. (2013) A Profile of Community Health Center Patients: Implications for Policy. Kaiser Commission on Medicaid and the Uninsured, Kaiser Family Foundation and the RCHN Community Health Foundation. https://modern.kff.org/wp-content/uploads/2013/12/8536-profile-of-chc-patients.pdf↩︎
Davis, K. & Schoen, C. (1978). Health and the War on Poverty. Brookings Institution. ↩︎
Sharac, J., Shin, P., Gunsalus, R., & Rosenbaum, S. (2018). Community Health Centers Continued to Expand Patient and Service Capacity in 2017. Geiger Gibson/RCHN Community Health Foundation Research Collaborative, George Washington University. Policy Research Brief No. 54. https://www.rchnfoundation.org/?p=7172↩︎
Rosenbaum, S., Sharac, J., Shin, P., & Gunsalus, R. (2019). Community Health Centers and the President’s HIV Initiative: Issues and Challenges Facing Health Centers in High-Burden States and Communities. Geiger Gibson/RCHN Community Health Foundation Research Collaborative, George Washington University. Policy Research Brief No. 56. https://www.rchnfoundation.org/?p=7834↩︎
Kaiser Family Foundation has been tracking the public’s attitudes towards the domestic HIV/AIDS epidemic for more than two decades and this month’s survey explores the public’s attitudes towards and experiences with HIV/AIDS in the U.S., in light of President Trump’s announcement of his plan to eliminate the HIV epidemic in the U.S. within ten years.1 Few say they have heard about the Trump administration’s goal but, while not knowledgeable about the initiative, majorities across partisanship are confident that the goal of reducing the number of new HIV infections in the U.S. to near zero by 2030 can be achieved.
Most Americans (80 percent) say the impact of HIV/AIDS in the country is a “serious issue” and large shares of the public – especially black Americans and Hispanic Americans – say HIV/AIDS is a “serious concern” for people they know. Nearly four in ten black adults (41 percent) and half (51 percent) of Hispanic adults say they are concerned about getting HIV – including more than three in ten who say they are “very concerned.”
POLL: Most Americans do not know about PrEP, a prescription medication that dramatically lowers the risk of getting HIV when taken as a preventive measure.
The survey also assessed public awareness of newer HIV prevention strategies. Knowledge of a prescription medication that helps lower the risk of getting HIV has increased over time, from 14 percent in 2014 to 42 percent in the most recent tracking survey, including a significant increase among black adults (18 percent to 55 percent). But a majority are still unaware of this medication. The survey also finds there are still gaps in the understanding of the effectiveness of antiretrovirals (ARVs), the medications used to treat HIV.
This month’s KFF Health Tracking Poll also probes the public on why they may support or oppose a national health plan and find that people’s responses tend to echo the messages emphasized by both sides of the debate. The most common reason given by supporters when asked why they favor such a plan is because they support universal coverage or in the words of one respondent, “I think we should have affordable decent health care for everybody.” On the other side, opponents of a national health plan offer reasons such as they don’t want the government involved in health care (23 percent), it will be too expensive to implement (14 percent), or that it will limit choice and competition (14 percent).
The survey continues to find Democrats evenly divided on whether they want their lawmakers to focus on improving and protecting the ACA (44 percent) or passing a national Medicare-for-all plan (46 percent).
Public’s Attitudes towards the Domestic HIV/AIDS Epidemic
President Trump announced in his State of the Union speech on February 5th his administration’s plan to eliminate the HIV epidemic in the U.S. within ten years. This month’s survey explores the public’s confidence in this plan as well as more general attitudes and experiences with HIV/AIDS in the U.S.. KFF has been tracking the public’s attitudes towards the domestic HIV/AIDS epidemic for more than two decades.
The March 2019 KFF Health Tracking Poll finds half of the public (52 percent) saying “the U.S. is making progress” when it comes to the impact of HIV in the country today, compared to fewer who either say “the problem is about the same as it has been” (33 percent) or “the U.S. is losing ground” (8 percent). This is consistent across party identification, race/ethnicity, and whether individuals know someone currently living with HIV.
Figure 1: Half Of Americans Say U.S. Is Making Progress On The Impact Of HIV/AIDS
The share of the public who say “the U.S. is making progress” has increased 12 percentage points since 2014, when four in ten said the U.S. was making progress. In 2014, a larger share of the public said “the problem was the same as it has been” (45 percent compared to 33 percent today).
Views on whether President Trump and his administration are “doing enough” to help solve the problem of HIV/AIDS in this country vary by party. Most Republicans (57 percent) say President Trump and his administration are “doing enough,” while a majority of Democrats say they are “not doing enough” (83 percent); a larger share of independents say the Administration is “not doing enough” (51 percent) than say they are “doing enough” (25 percent).
Figure 2: Partisans Divided On Whether The Trump Administration Is Doing Enough To Address HIV/AIDS In The U.S.
While there are partisan differences in perceptions of whether President Trump and his administration are doing enough to help solve the problem of HIV/AIDS in this country, majorities across partisanship are confident that the goal of reducing the number of new HIV infections in the U.S. to near zero by 2030 can be achieved. Six in ten Republicans and Democrats (59 percent) say they are either “very confident” or “somewhat confident” that the U.S. can achieve this goal. Independents are divided, with half saying they are confident (49 percent) that the U.S. can achieve this goal, while the other half say they are either “not too confident” (31 percent) or “not at all confident” (17 percent).
Figure 3: Majorities Are Confident U.S. Can Reduce New HIV Infections To Near Zero By 2030
Most Americans See HIV/AIDS As A Serious Problem Facing the U.S.
As the Administration pursues its new HIV initiative, 1 in 3 Americans say the epidemic is “very serious” for the country and 1 in 4 say it’s “very serious” for people they know
Eight in ten overall say the issue of HIV/AIDS is a serious issue in the U.S. today and nearly half (46 percent) say it is a serious concern for people they know. This is similar to the share who reported the same in 2011 (41 percent).
Figure 4: Majority Say HIV/AIDS Is A Serious Problem In The U.S. Today, Half Say It Is A Serious Concern For People They Know
How Americans Experience HIV/AIDS Differs By Race and Ethnicity
Two-thirds of black adults and nearly half of Hispanic adults (45 percent), populations that have been disproportionately affected by HIV, say HIV/AIDS is a “very serious” issue for the U.S. today. At least four in ten of both black adults (49 percent) and Hispanic adults (43 percent) also say HIV/AIDS is a “very serious” concern for people they know. These shares are larger than the share of white adults who say the same (26 percent and 16 percent, respectively).
Figure 5: Large Majorities Of Black And Hispanic Adults Say HIV/AIDS Is A Serious Issue For The U.S. And For People They Know
These differences by race also extend to people’s own personal concerns with nearly four in ten black adults (41 percent) and half (51 percent) of Hispanic adults saying they are concerned about getting HIV compared to one in ten white adults (12 percent).
Figure 6: Larger Shares Of Black And Hispanic Adults Report Being Concerned About Getting HIV Than White Adults
This month’s tracking survey finds most of the public saying they are comfortable working with someone who is living with HIV (79 percent), having a close friendship with someone who is living with HIV (77 percent), and sharing a living space with someone who is living with HIV (62 percent). This is also true among black, Hispanic, and white adults.
Figure 7: Majorities Say They Are Comfortable Working With, Being Friends With, And Sharing A Living Space With Someone Living With HIV
This continues the long-term trend found in KFF polling of increasing comfort levels around people with HIV/AIDS. For example, in 1997, 32 percent of Americans said they would be “very comfortable” working with someone who is living with HIV while the most recent survey finds half (52 percent) now say they are “very comfortable” working with someone living with HIV. In addition, in 2006, one-fourth said they would be “very comfortable” having a roommate who is living with HIV and now one-third (35 percent) say they would be “very comfortable” sharing a living space with someone who is living with HIV.
Figure 8: Reported Comfort Around People Living With HIV/AIDS Continues Slow And Steady Increase
Increase in Awareness of PrEP, But Still Below 50% Overall
In 2012, the FDA approved Truvada as a pre-exposure prophylaxis (PrEP) against HIV. This prescription medication is for people who do not have HIV, to lower their risk of getting HIV. The share of the public who are aware there is a prescription medication to lower the risk of getting HIV has increased significantly since 2014, but is still less than 50 percent of the public, overall. Currently, four in ten (42 percent) Americans are aware there is a prescription medication that helps lower the risk of getting HIV, including majorities of black adults (55 percent) and nearly half of Hispanic adults (47 percent).
Figure 9: Four In Ten Are Aware Of PrEP, The Prescription Medication That Lowers Risk of HIV
Five years ago, 14 percent of the public knew about a prescription medication that people who are HIV-negative could take to lower their risk of becoming infected. The increase in awareness is consistent across most demographic groups but some populations’ awareness has increased at a more striking rate. For example, the share of black adults who know about this prescription medication has increased from 18 percent in 2014 to 55 percent in 2019.
Figure 10: A Larger Share Of The Public Are Now Aware That Prescription Medication That Reduces Risk Of HIV Exists
Yet, few (13 percent) say they have heard either “a lot” or “a fair amount” about PrEP, or the brand name Truvada; including less than one-fifth of black adults (17 percent), Hispanic adults (16 percent), and white adults (11 percent). A 2018 CDC analysis that found only a small percentage of Americans who could benefit from PrEP have been prescribed it.
Public Knowledge around Treatment and Prevention of HIV/AIDS Remains an Issue
There are gaps in understanding when it comes to how antiretrovirals (ARVs), the medications used to treat HIV, work. ARVs are recommended for all people with HIV as soon as they are diagnosed and have resulted in dramatic reductions in mortality and morbidity and significant improvements in health for people living with HIV.2 Despite this scientific evidence, small shares are aware the medications used to treat people living with HIV are “very effective” at both improving the health of people living with HIV (27 percent) and preventing the spread of the virus (15 percent).
Figure 11: Small Shares Know That ARVs Are Very Effective In Improving The Health Of People With HIV, Preventing The Spread Of HIV
About one-fourth (27 percent) of white, black, and Hispanic adults say these medications are “very effective” at improving the health of people with HIV while a slightly larger share of black adults (28 percent) and Hispanic adults (23 percent) than white adults (11 percent) say these medications are “very effective” at preventing the spread of HIV to sexual partners.
Research has found consistent use of antiretroviral therapy can reduce the amount of virus in the body to levels that are undetectable by standard lab test. When someone with HIV is undetectable, according to the CDC, there is effectively no risk of sexual transmission. Overall, about four in ten (39 percent) say they have heard the term “undetectable” before and know what it means, but the majority of people either say they haven’t heard the term before (52 percent) or they have heard it but they do not know what it means (8 percent).
Figure 12: Six In Ten Are Unaware Of The Term “Undetectable” Or Are Unsure What The Term Means
In addition, less than half are aware the domestic HIV epidemic has had a greater impact on black Americans (41 percent) and Hispanic Americans (18 percent) than it has on white Americans.
Figure 13: Some Gaps In Public’s Knowledge About Whether HIV Epidemic Has Had Greater Impact On African-Americans And Hispanics
On March 4, 2019, scientists publicly announced a second case of long-term remission in a patient with HIV. While technically not a “cure,” it has been described as such by some experts and in the mainstream media.3 When asked, two-thirds (67 percent) say there is currently no cure for HIV, while about one-fourth of the public (26 percent) say there is a cure for HIV.
Public Views of ACA and Medicare-for-all
Nine years since the passing of the Affordable Care Act (ACA), the public still holds largely partisan views over the health reform law and opinions have remained relatively unchanged for the past two years since the Republican efforts to repeal the law. Half of the public hold favorable opinions of the ACA, including eight in ten Democrats, nearly half of independents (45 percent), and about one-fifth of Republicans (17 percent). About four in ten (39 percent) of the public overall hold a negative opinion of the law including three-fourths of Republicans, four in ten independents (41 percent), and one in ten Democrats.
This partisan divide is also evident in the public’s support for a national health plan, or Medicare-for-all, in which all Americans would get their insurance from a single government plan. Majorities of Democrats and independents support a Medicare-for-all plan (78 percent and 54 percent, respectively), while most Republicans (71 percent) oppose such a proposal.
Figure 14: Partisans Hold Starkly Different Opinions Of Both The 2010 Affordable Care Act And National Medicare-for-all Plan
While Democrats are more likely than Republicans and independents to hold a favorable view of the ACA, Democrats are evenly divided in their views of whether they think Congress should focus on the ACA or on passing a national Medicare-for-all plan. When asked to choose, similar shares of Democrats say they would rather Democrats in Congress focus their efforts on “improving and protecting the ACA” (44 percent) as say they would rather Congress focus on “passing a national Medicare-for-all plan” (46 percent). The share who say they want Democrats in Congress to focus on “improving and protecting the ACA” has varied slightly in recent months.
Figure 15: Democrats Are Divided On Whether They Want Congress To Focus On ACA Or Medicare-for-all
Why People Favor or Oppose Medicare-for-all?
When the mostly Democratic supporters are asked to say in their own words the main reason why they favor a Medicare-for-all plan, a plurality (40 percent) provide responses related to universal coverage, including nearly one in ten (7 percent) who explicitly say it is because they believe health care is a right. One in five (17 percent) say making health care more affordable and addressing high costs is the main reason they support a national health plan. The reasons offered echo the same themes emphasized by the plan’s proponents so far in the debate.
“Because everyone needs to have a good health plan and people are not lucky enough to have that”
“Because everyone should have health care in this country”
“If it ensures everyone has health care, I’m for that”
“I think we should have affordable decent health care for everybody.”
“Because health care is a right and not a privilege”
“Health care for everyone is a human right”
Makes health care more affordable/Costs are too high
“Because a lot of people can’t afford doctor bills and visits, like myself”
“There are too many people who cannot afford any other health care”
“I feel like it would make health care more affordable”
On the other side of the argument, nearly one in four opponents of a national Medicare-for-all plan (23 percent) cite concerns about government involvement in health care as the main reason for their opposition. Nearly one in eight (14 percent) offer that it is too expensive to implement as the main reason they oppose a national Medicare-for-all plan, which is the same as the share who say that they oppose it because it limits consumer choice (14 percent).
“Because the government has no business in health care and when they do have a hand in it look at what happens”
“Government always messes things up”
“I don’t think government should be involved in our health care any more than they are”
Too expensive to implement
“It is not affordable, it will bankrupt the nation”
“The cost. We can’t afford it.”
“The cost would break us and the taxes would go sky high”
Limits consumer choice/competition
“I think people need more choice than one”
“I think people should be able to choose and not told what to have.”
“People deserve the right to pick what they want”
Figure 16: Reasons For Opinions On National Health Plan Echo Partisan Messages
Similarly, when supporters of a national health plan are asked about the importance of some possible features of such a plan, nine in ten (89 percent) say it is “very important” that it covers all Americans while eight in ten (79 percent) say it is “very important” that it simplifies the health care system. Smaller majorities say it is “very important” that a national health plan eliminates health care costs like monthly premiums (56 percent) or out-of-pocket costs like copays and deductibles (56 percent). Fewer supporters of a national health plan say it is “very important” that such a plan shifts what people pay for health care from premiums and out-of-pocket expenses to taxes (45 percent) or that it eliminates private health insurance companies (38 percent).
Figure 17: Universal Coverage Is Most Important Feature Of A National Health Plan Among Supporters
Methodology
This KFF Health Tracking Poll was designed and analyzed by public opinion researchers at the Kaiser Family Foundation (KFF). The survey was conducted March 13th-18th 2019, among a nationally representative random digit dial telephone sample of 1,211 adults ages 18 and older, living in the United States, including Alaska and Hawaii (note: persons without a telephone could not be included in the random selection process). The sample included 292 respondents reached by calling back respondents that had previously completed an interview on the KFF Tracking poll more than nine months ago. Computer-assisted telephone interviews conducted by landline (302) and cell phone (909, including 602 who had no landline telephone) were carried out in English and Spanish by SSRS of Glen Mills, PA. To efficiently obtain a sample of lower-income and non-White respondents, the sample also included an oversample of prepaid (pay-as-you-go) telephone numbers (25% of the cell phone sample consisted of prepaid numbers) as well as a subsample of respondents who had previously completed Spanish language interviews on the SSRS Omnibus poll (n=9). Both the random digit dial landline and cell phone samples were provided by Marketing Systems Group (MSG). For the landline sample, respondents were selected by asking for the youngest adult male or female currently at home based on a random rotation. If no one of that gender was available, interviewers asked to speak with the youngest adult of the opposite gender. For the cell phone sample, interviews were conducted with the adult who answered the phone. KFF paid for all costs associated with the survey.
The combined landline and cell phone sample was weighted to balance the sample demographics to match estimates for the national population using data from the Census Bureau’s 2017 American Community Survey (ACS) on sex, age, education, race, Hispanic origin, and region along with data from the 2010 Census on population density. The sample was also weighted to match current patterns of telephone use using data from the January-June 2018 National Health Interview Survey. The weight takes into account the fact that respondents with both a landline and cell phone have a higher probability of selection in the combined sample and also adjusts for the household size for the landline sample, and design modifications, namely, the oversampling of prepaid cell phones and likelihood of non-response for the re-contacted sample. All statistical tests of significance account for the effect of weighting.
The margin of sampling error including the design effect for the full sample is plus or minus 3 percentage points. Numbers of respondents and margins of sampling error for key subgroups are shown in the table below. For results based on other subgroups, the margin of sampling error may be higher. Sample sizes and margins of sampling error for other subgroups are available by request. Note that sampling error is only one of many potential sources of error in this or any other public opinion poll. Kaiser Family Foundation public opinion and survey research is a charter member of the Transparency Initiative of the American Association for Public Opinion Research.
Poll: Most Americans Say HIV Is Serious Issue for the Country as Trump Administration Rolls Out New Plan to End HIV by 2030; Black and Hispanic Adults Report More Personal Concern than White Adults
Awareness of PrEP Has Increased, though a Significant Knowledge Gap Remains about the Prevention Option; Many Also Understate Effectiveness of Antiretroviral Medications
With the Trump administration launching a new domestic HIV effort, the latest KFF Health Tracking Poll finds a large majority of Americans (80%) view the HIV epidemic as a serious national issue, including a third (34%) who view it as “very serious.” Nearly half (46%) view it as a serious concern for people they know, including a quarter (24%) who view it as “very serious.”
The poll is the first to probe in depth about the public’s views and knowledge of the nation’s HIV epidemic since President Trump used his Feb. 5 State of the Union address to announce the new initiative to significantly reduce the HIV epidemic in the U.S. within ten years.
Black and Hispanic adults – populations that are disproportionately affected by HIV – are more likely than white adults to view the epidemic as very serious for the nation overall and for people they know.
These differences by race also extend to people’s own personal concerns with nearly four in ten black adults (41%) and half (51%) of Hispanic adults saying they are concerned about getting HIV compared to one in ten white adults (12%).
The survey also assessed public awareness of newer HIV prevention and treatment strategies. Less than half (42%) of the public overall is aware of PrEP, a prescription medication that dramatically lowers the risk of getting HIV when taken as a preventive measure. Awareness of PrEP is highest among black Americans (55%), though a significant minority (45%) don’t know such a drug exists. PrEP awareness has increased since 2014, when 14 percent of the public knew about the drug.
There are also gaps in understanding about how antiretrovirals (ARVs), the medications used to treat HIV, work. Small shares are aware the medications used to treat people living with HIV are “very effective” at both improving the health of people living with HIV (27%) and preventing the spread of the virus (15%). Awareness about antiretrovirals’ ability to stop the spread of the virus is somewhat higher among black and Hispanic Americans than white Americans, but the vast majority across all groups underestimate its effectiveness.
About half (52%) have not heard the term “undetectable,” which refers to the use of ARVs to reduce the viral load to levels not detected by standard lab tests. Another 8 percent say they have heard the term but do not know what it means. This prevention strategy is commonly known as treatment as prevention. According to the CDC, when someone maintains an undetectable viral load there is effectively no risk of sexual transmission. Both PrEP and treatment as prevention are key elements of the new plan.
Other findings include:
Half (52%) say the U.S. is making progress in addressing the impact of HIV in the country, an increase of 12 percentage points since 2014. Few (8%) say the U.S. is losing ground.
Few Americans (8%) say they have heard or read about the Trump administration’s initiative, though most (56%) say they are confident that the U.S. can achieve the goal of eliminating most new HIV infections by 2030.
Most of the public say they are comfortable working with (79%), having a close friendship with (77%), and sharing a living space with (62%) someone who is living with HIV. This is true across racial and ethnic lines.
Support for Medicare-for-all Holds Steady, But Current Debate May Be Shaping Partisan Opinions
This month’s poll also probes the public on why they may support or oppose a national health plan and finds people’s responses tend to echo the messages emphasized by both sides of the debate.
The poll finds a majority (56%) of the public continues to favor a national health plan called Medicare-for-all through which all Americans would get their insurance through a single government plan, while about four in 10 (39%) oppose. These shares are unchanged from KFF polls earlier this year.